salinomycin induces activation of autophagy ... - diva...
TRANSCRIPT

Salinomycin induces activation of autophagy,
mitophagy and affects mitochondrial polarity:
Differences between primary and cancer cells
Jaganmohan Jangamreddy, Saeid Ghavami, Jerzy Grabarek, Gunnar Kratz, Emilia Wiechec,
Bengt-Arne Fredriksson, Rama K. Rao, Artur Cieślar-Pobuda, Soumya Panigrahi and Marek
Łos
Linköping University Post Print
N.B.: When citing this work, cite the original article.
Original Publication:
Jaganmohan Jangamreddy, Saeid Ghavami, Jerzy Grabarek, Gunnar Kratz, Emilia Wiechec,
Bengt-Arne Fredriksson, Rama K. Rao, Artur Cieślar-Pobuda, Soumya Panigrahi and Marek
Łos, Salinomycin induces activation of autophagy, mitophagy and affects mitochondrial
polarity: Differences between primary and cancer cells, 2013, Biochimica et Biophysica Acta.
Molecular Cell Research, (1833), 9, 2057-2069.
http://dx.doi.org/10.1016/j.bbamcr.2013.04.011
Copyright: Elsevier
http://www.elsevier.com/
Postprint available at: Linköping University Electronic Press
http://urn.kb.se/resolve?urn=urn:nbn:se:liu:diva-91756

Biochimica et Biophysica Acta 1833 (2013) 2057–2069
Contents lists available at SciVerse ScienceDirect
Biochimica et Biophysica Acta
j ourna l homepage: www.e lsev ie r .com/ locate /bbamcr
Salinomycin induces activation of autophagy, mitophagy and affectsmitochondrial polarity: Differences between primary and cancer cells☆
Jaganmohan Reddy Jangamreddy a,b, Saeid Ghavami c,d, Jerzy Grabarek e, Gunnar Kratz b,f,g,Emilia Wiechec a,b, Bengt-Arne Fredriksson h, Rama Krishna Rao Pariti a,b, Artur Cieślar-Pobuda a,b,i,Soumya Panigrahi j, Marek J. Łos a,b,e,⁎a Depart. Clinical and Experimental Medicine (IKE), Division of Cell Biology, Linköping Univ., Swedenb Integrative Regenerative Medicine Center (IGEN), Linköping University, Swedenc Department of Physiology, Univ. Manitoba, Winnipeg, Canadad Manitoba Institute of Child Health, Univ. Manitoba, Winnipeg, Canadae Department of Pathology, Pomeranian Medical University, Szczecin, Polandf Experimental Plastic Surgery, IKE, Linköping University, Swedeng Department of Plastic Surgery, County of Östergötland, Linköping, Swedenh Microscopy Unit, Core Facility, Faculty of Health Sciences, Linköping University, Swedeni Biosystems Group, Institute of Automatic Control, Silesian University of Technology, Gliwice, Polandj Department of Molecular Cardiology, Lerner Research Institute/NB-50, 9500 Euclid Avenue, Cleveland, OH 44195, USA
Abbreviations: ATG, Autophagy Related Gene; BCLN1ity group binding protein 1; LC3, microtubule-associatemitofusin; MMP, mitochondrial membrane potential;rapamycin; PGC1α, peroxisome proliferator-activated1α; PTP, mitochondrial membrane permeability transit☆ This is an open-access article distributed under the tAttribution License, which permits unrestricted use, disany medium, provided the original author and source a⁎ Corresponding author at: Dept. Clinical and Experime
Regenerative Medicine Center (IGEN), Linköping Univers10, 581 85 Linköping, Sweden. Tel.: +46 10 10 32787.
E-mail address: [email protected] (M.J. Łos).
0167-4889/$ – see front matter © 2013 The Authors. Puhttp://dx.doi.org/10.1016/j.bbamcr.2013.04.011
a b s t r a c t
a r t i c l e i n f oArticle history:Received 22 March 2013Received in revised form 16 April 2013Accepted 21 April 2013Available online 29 April 2013
Keywords:Cancer stem cellsMitofusinMitophagymTORPGC1αSalinomycin
The molecular mechanism of Salinomycin's toxicity is not fully understood. Various studies reported thatCa2+, cytochrome c, and caspase activation play a role in Salinomycin-induced cytotoxicity. Furthermore,Salinomycin may target Wnt/β-catenin signaling pathway to promote differentiation and thus eliminationof cancer stem cells. In this study, we show a massive autophagic response to Salinomycin (substantiallystronger than to commonly used autophagic inducer Rapamycin) in prostrate-, breast cancer cells, and tolesser degree in human normal dermal fibroblasts. Interestingly, autophagy induced by Salinomycin is acell protective mechanism in all tested cancer cell lines. Furthermore, Salinomycin induces mitophagy,mitoptosis and increased mitochondrial membrane potential (ΔΨ) in a subpopulation of cells. Salinomycinstrongly, and in time-dependent manner decreases cellular ATP level. Contrastingly, human normal dermalfibroblasts treated with Salinomycin show some initial decrease in mitochondrial mass, however they arelargely resistant to Salinomycin-triggered ATP-depletion. Our data provide new insight into the molecularmechanism of preferential toxicity of Salinomycin towards cancer cells, and suggest possible clinical applica-tion of Salinomycin in combination with autophagy inhibitors (i.e. clinically-used Chloroquine). Furthermore,we discuss preferential Salinomycins toxicity in the context of Warburg effect.
© 2013 The Authors. Published by Elsevier B.V. All rights reserved.
1. Introduction
Salinomycin was originally used as an anticoccidial drug in poultry,and for efficient nutrient absorption in piggery. Its preferential toxicity
, Beclin1; HMGB1, high mobil-d protein 1 light chain 3; Mfn,mTOR, mammalian target ofreceptor gamma coactivator
ion poreerms of the Creative Commonstribution, and reproduction inre credited.ntalMedicine (IKE), Integrativeity, Cell Biology Building, Level
blished by Elsevier B.V. All rights re
towards cancer-stem cells was described by Gupta and colleagues inthe end of the last decade [1]. Salinomycin's toxicity towards cancerstem cells was further supported by recent studies in gastrointestinalsarcoma, osteosarcoma, and colorectal and breast cancers [2–4]. Eventhough the cell death mechanisms induced by Salinomycin still remainelusive, a recent study by Lu et al. shows that Salinomycin targets cancerstem cells by blocking Wnt/β-catenin pathway, which is critical forstem cell self renewal [5]. While Salinomycin is relatively non-toxic toprimary cells, Boehmerle et al., show that Salinomycin induced celldeath is through conventional caspase mediated apoptotic pathways[6]. Our own experiments (please see below) show that Salinomycinpreferentially kills cancer cells.
Cellular house-keeping, homeostatic mechanism autophagy includesmacroautophagy (bulk degradation including cellular organelles),microautophagy (uptake of cytoplasm for degradation) and chaperonemediated autophagy (CMA) (protein specific degradation) [7–9]. In the
served.

2058 J.R. Jangamreddy et al. / Biochimica et Biophysica Acta 1833 (2013) 2057–2069
presence of growth factors autophagy is inhibited by the activation ofPI3K/Akt pathway through activation of mTOR (mammalian target ofrapamycin) [10,11]. However, under nutrient deprivation or stress,inhibition of mTOR initiates phagophore formation through nucleationcomplex of autophagy involving ULK1/2, Beclin1 and other molecules.Several Autophagy Related Gene (ATG) family members ATG3, ATG5,ATG7, ATG12 etc., carry on further elongation of phagophore to formautophagosome [10,12]. Autophagosomes carry dysfunctional cellularorganelles (mitochondria, peroxisomes, ribosomes etc.) for degradationby fusing with lysosomes. More recent studies show alternativeautophagic pathway independent of ULK, ATG5 and ATG7 mediatedmechanism-requiring Beclin1 [10,13,14]. Organelle specific autophagyhas been reported for mitochondria (mitophagy), endoplasmic reticu-lum (ER-phagy), ribosomes (Ribophagy) etc., as amechanism to removethe dysfunctional organelles, or as a response to stress triggered bycytoplasmic overload with damaged organelles[15].
Mitochondria, commonly called the powerhouses of the cell, form adynamic interconnected network of tubular structures that are engagedin fission and fusion processes [16]. Mitochondrialfission ismediated bylocalization of Drp1 on themitochondrial site of divisionwhereas fusionis mediated bymitofusin proteins (mitofusins 1 and 2) alongwith OPA1[17]. Lack of both mitofusin 1 (Mfn1) and mitofusin 2 (Mfn2) leads toimpaired mitochondrial fusion but both of them can compensate eachothers loss [18–21]. Under the event of stress or any event leading todysfunction of normal mitochondria, the organelle undergoes an asym-metric, protective fission, that aims to spare at least part of stressedmitochondria, by splitting the organelle into a normally-functioningpart, and a dysfunctional one. The process allows for subsequent degra-dation of dysfunctional mitochondria created in such a way, whilesparing the functional ones.
Rehman and colleagues have recently described that cancer cellsoften havemuch smaller, fragmentedmitochondria as compared to nor-mal cells [22]. In the same study they show that cancer cells express anincreased level of Drp1 and decreased level of Mfn protein, promotinga constant mitochondrial fission with impaired fusion, resulting in asmaller fragmented mitochondria in cancer cells [22]. Modification ofthe level of expression of Drp1 orMfn in cancer cells decreased their pro-liferation, thus indicating that targeting of molecules regulating mito-chondrial dynamics and function is a potentially novel target for cancertherapy [22].
The maintenance of mitochondrial inner membrane potential iscrucial for both ATP production and functions related to the inductionof apoptosis. Opening of the outer mitochondrial membrane perme-ability transition pore (PTP) leads to cytochrome c release from theinter-membrane space of the mitochondria along with depolarizationof the inner membrane and thus subsequently inhibiting the ATP pro-duction [23,24]. However it is argued that the mitochondrial mem-brane potential has to be maintained for the release of cytochrome cand further apoptotic signaling cascade to occur [25,26]. Others pro-pose the mitochondrial hyperpolarization and thus mitochondrialcondensation during apoptosis induction [27,28]. Irrespective of themechanism, mitochondrial release of cytochrome c into the cytosolis the trigger and component for the formation of apoptosome thatleads to the activation of caspase cascade. Along with apoptosis, au-tophagy may under certain circumstances act as an alternative celldeath mechanism [29].
In this study, we have been investigating the mechanism ofSalinomycin anticancer toxicity. Here we show that Salinomycin in-duces autophagy, andmitophagy. The autophagic response is a cell pro-tective mechanism in prostate and breast cancer cells. We also reportthe critical role of Salinomycin in increasing the mitochondrial mem-brane potential (hyperpolarization) and activation of a programmedcell death through the differential activation of caspases among cancercells. Our experimental data indicate that Salinomycin-triggered deple-tion of cellular ATP, in cancer cells but not in primary cells, contributestowards Salinomycin's preferential anticancer toxicity.
2. Materials and methods
2.1. Cells and cell culture
Prostrate cancer cell line (PC3), breast cancer cell lines (SKBR3 andMDAMB468) and murine embryonic fibroblast (MEF) cells, all availableat our lab's cell bank, were cultured in RPMI media with 10% FBS and1% penicillin–streptomycin antibiotics. MEF-ATG5−/− described previ-ously [30], and human normal dermal fibroblasts, provided by Dr. Kratz[31], were cultured in DMEM media with 10% FBS and 1% penicillin. Allthe cell lines were maintained at a confluence of ~70%.
2.2. Materials and reagents
Salinomycin, Rapamycin, Bafilomycin, Chloroquine, Pepstatin andED-64were obtained from Sigma-Aldrich and dissolved in their respec-tive buffers as per required concentrations. Rabbit-anti-LC3b, rabbit-anti-HMGB1, and murine anti-actin were also from Sigma-Aldrichwhereas rabbit-anti-ATG5 was obtained from Cellular Signaling Inc.The secondary antibodies anti-rabbit HRP-conjugate and anti-murineHRP-conjugates were obtained from Sigma-Aldrich and anti-rabbit-Alexafluor488 and -594 were purchased from Life Technologies Ltd.MitoTracker Red CMXRos, LysoTracker Red DND-99, and MitoTrackerGreen FM were also purchased from Life Technologies Ltd.
2.3. Transmission electron microscopy (TEM)
Cells were initially fixed with 2% Glutaraldehyde in 0.1 M Sodium –
cacodylate-HCl buffer with 0.1 M sucrose, (pH 7.4) for 2 h at 4 °C andpost fixed with 1% OsO4 in 0.15 M Sodium – cacodylate-HCl buffer for1 h. Cells were dehydrated in ethanol gradually and embedded in Epon812. Ultrathin sectionswere cut on a Reichert Ultracut SUltramicrotome,mounted on copper grids, air-dried, and further stained with uranylacetate and lead citrate. Sections were examined and photographedwith JEOL JEM 1230 electron microscope at 100 kV [29].
2.4. MTT assay
100 μl of cells diluted at a concentration of 105 cells/ml were platedto eachwell of a 96well plate and incubated in a humidified CO2 cham-ber for 24 h. The next day, cells were treated as per respective experi-mental conditions (please see Results section and figure legends fordetails). After indicated time periods of treatments, 10 μl of 5 mg/ml3-(4,5-dimethyl-2-thiazolyl) 2,5-diphenyl-2H tetrazolium bromide(MTT) solution (Sigma-Aldrich) was added to each well, incubated for3 h and centrifuged at 90 g for 10 min. The supernatant was re-moved and the formed farmazan-crystals were dissolved in a solu-tion containing equal volumes of DMSO:ethanol. The readings weretaken at both 570 and 630 nm.
2.5. Po-Pro and 7-AAD cell death assay
Cells treatedwith orwithout Salinomycin atmentioned concentra-tions for the respective time periodswere trypsinized and collected bycentrifugation at 400 g for 5 min. The pelleted cells were resuspendedin PBS and treated with Po-Pro and 7-AAD dyes (Life TechnologiesLtd.) for 30 min as per manufacturer's instructions and analyzedusing flow cytometer (Gallios, Beckman Coulter Inc.). Flow cytometryresults were analyzed using Kaluza analysis software (Beckman Coul-ter Inc.).
2.6. Western blotting
Cells were lysed using RIPA buffer with Protease inhibitors (cOm-plete Roche) and centrifuged to remove the debris. Cell lysates wereloaded into a 12% polyacrylamide gel and ran at 100 V for 3 h and then

2059J.R. Jangamreddy et al. / Biochimica et Biophysica Acta 1833 (2013) 2057–2069
transferred on to a PVDFmembrane for 1 h at 100 V. Themembranewasblocked with 5%milk protein and treated with primary antibodies over-night. The membrane is washed with 3× TBST and treated with respec-tive secondary antibody for 1 h. The membrane is further washed with3× TBST before developing using Amersham ECL plus Western blottingdeveloping kit (GE Technologies). To analyzeHMGB1 release the cellularsupernatant was collected and an equal amount of the supernatant was
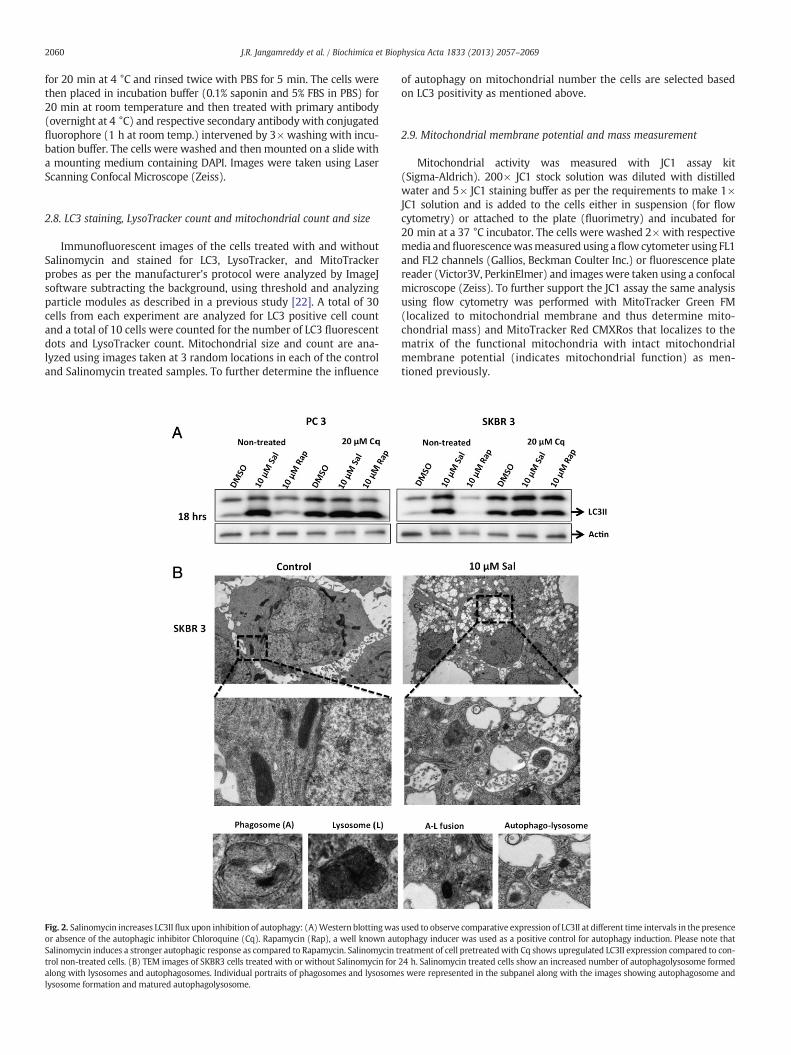
Fig. 1. Salinomycin treatment triggers autophagic response: (A) phase-contrast images show iblots show increased expression of LC3II upon treatment with mentioned concentrations of Sasignal and LysoTracker representing autophagosome and lysosomes respectivelywas observedof experiment depicted on “C”: (D) 10 μM Salinomycin treatment increased number of cells shotrols, (E) number of LysoTracker Red counts per cell, and (F) number of LC3 signals per cell re
loaded into a 15% gel and Western blotting was conducted as describedabove [32].
2.7. Immunocytochemistry
Cells plated on cover-slips in a 12-well plate were washed with PBSafter their respective treatment and fixed using 4% paraformaldehyde
ncreased vacuolization in cancer cells treated with 10 μM Salinomycin (Sal). (B) Westernlinomycin for 24 and 48 h in PC3, SKBR3 and MDAMB468 cells. (C) Colocalization of LC3using immuno-cytochemistry in primary and cancer cells. (D, E, F) Quantitative evaluationwing higher than the threshold level of LC3 fluorescence compared to the respective con-lative to their controls. *Represents statistically significant difference (P b 0.05).
2060 J.R. Jangamreddy et al. / Biochimica et Biophysica Acta 1833 (2013) 2057–2069
for 20 min at 4 °C and rinsed twice with PBS for 5 min. The cells werethen placed in incubation buffer (0.1% saponin and 5% FBS in PBS) for20 min at room temperature and then treated with primary antibody(overnight at 4 °C) and respective secondary antibody with conjugatedfluorophore (1 h at room temp.) intervened by 3× washing with incu-bation buffer. The cells were washed and then mounted on a slide witha mounting medium containing DAPI. Images were taken using LaserScanning Confocal Microscope (Zeiss).
2.8. LC3 staining, LysoTracker count and mitochondrial count and size
Immunofluorescent images of the cells treated with and withoutSalinomycin and stained for LC3, LysoTracker, and MitoTrackerprobes as per the manufacturer's protocol were analyzed by ImageJsoftware subtracting the background, using threshold and analyzingparticle modules as described in a previous study [22]. A total of 30cells from each experiment are analyzed for LC3 positive cell countand a total of 10 cells were counted for the number of LC3 fluorescentdots and LysoTracker count. Mitochondrial size and count are ana-lyzed using images taken at 3 random locations in each of the controland Salinomycin treated samples. To further determine the influence
Fig. 2. Salinomycin increases LC3II flux upon inhibition of autophagy: (A)Western blottingwasor absence of the autophagic inhibitor Chloroquine (Cq). Rapamycin (Rap), a well known autSalinomycin induces a stronger autophagic response as compared to Rapamycin. Salinomycin ttrol non-treated cells. (B) TEM images of SKBR3 cells treated with or without Salinomycin foralong with lysosomes and autophagosomes. Individual portraits of phagosomes and lysosomelysosome formation and matured autophagolysosome.
of autophagy on mitochondrial number the cells are selected basedon LC3 positivity as mentioned above.
2.9. Mitochondrial membrane potential and mass measurement
Mitochondrial activity was measured with JC1 assay kit(Sigma-Aldrich). 200× JC1 stock solution was diluted with distilledwater and 5× JC1 staining buffer as per the requirements to make 1×JC1 solution and is added to the cells either in suspension (for flowcytometry) or attached to the plate (fluorimetry) and incubated for20 min at a 37 °C incubator. The cells were washed 2× with respectivemedia andfluorescencewasmeasured using a flow cytometer using FL1and FL2 channels (Gallios, Beckman Coulter Inc.) or fluorescence platereader (Victor3V, PerkinElmer) and images were taken using a confocalmicroscope (Zeiss). To further support the JC1 assay the same analysisusing flow cytometry was performed with MitoTracker Green FM(localized to mitochondrial membrane and thus determine mito-chondrial mass) and MitoTracker Red CMXRos that localizes to thematrix of the functional mitochondria with intact mitochondrialmembrane potential (indicates mitochondrial function) as men-tioned previously.
used to observe comparative expression of LC3II at different time intervals in the presenceophagy inducer was used as a positive control for autophagy induction. Please note thatreatment of cell pretreatedwith Cq shows upregulated LC3II expression compared to con-24 h. Salinomycin treated cells show an increased number of autophagolysosome formeds were represented in the subpanel along with the images showing autophagosome and

N=3P<0.05
N=3P<0.05
Rel
ativ
e C
ell S
urvi
val
Rel
ativ
e C
ell S
urvi
val
0.0
0.2
0.4
0.6
0.8
1.0
0.00
0.25
0.50
0.75
FibroblastsPC3
MDAMB468SKBR3
24 hrs48 hrs
complexActin
A
B
Fig. 3. Salinomycin induced autophagy promotes cancer cell survival: (A) inhibition ofautophagy by Chloroquine increased cancer cell death triggered by Salinomycin. Theeffects on human normal dermal fibroblasts were inconclusive due to a marked toxicityof Chloroquine alone. (B) MEF cells lacking ATG5 showed significant increase in celldeath compared to the respective controls at 24 h and 48 h. The Western blot showsATG5 level in the respective cells lines (cell line quality controls). *Represents statisticallysignificant difference (P b 0.05).
2061J.R. Jangamreddy et al. / Biochimica et Biophysica Acta 1833 (2013) 2057–2069
2.10. ATP assay
Cells treated with Salinomycin for the respective time periods werewashed with ice-cold PBS and treated with 100 μl of ATP releasingagent (Sigma-Aldrich) for 5 min and 50 μl of the extract was addedinto a light protected 96-well plate that was preloaded with 100 μl ofATP assay mix solution (Sigma-Aldrich) and incubated for 3 min atroom temp. Immediately the luminescence was measured using lumi-nescence plate reader (Victor3V, PerkinElmer).
2.11. Caspase activity assays
Caspase-3 activity and mitochondrial function were assessed usingNucView 488 and MitoView 633 (Biotium). Samples were preparedsimilarly as Po-Pro assay as described above and treated with NucView488 and MitoView 633 and kept on ice for 1 h before analyzing withflow cytometer (Gallios). Caspase-8 and -9 were analyzed using GreenFLICA andRed FLICA caspase assay kits respectively from ImmunoChem-istry Technologies. The cells were incubated at 37 °C for 1 h before tak-ing the fluorescence, which was measured in FL1 and FL4 using Galliosflow cytometer (Beckman Coulter Inc.).
2.12. Statistics
All the statistics (one way ANOVA) were conducted using Prism(version 6.0b) software and SPSS (IBM version 20) software. A P valueof less than 0.05 is considered statistically significant unless mentionedotherwise.
3. Results
3.1. Salinomycin induces autophagy
Initial observations of 10 μM Salinomycin treated cells indicate aprofound increase in vacuolization in breast cancer SKBR3 andMDAMB468 cell lines, and to lesser degree in prostate cancer PC3cells, upon 24 h treatment (Fig. 1A). The vacuolization is much lesspronounced in human normal dermal fibroblasts. To investigate possi-ble autophagosome formation levels of autophagic marker LC3II weremonitored in SKBR3, MDAMB468 and PC3 cells. As shown in Fig. 1B,Salinomycin treated cells have an increased level of LC3I lipidationand LC3II formation with different concentrations of Salinomycin(1 μM, 2.5 μM and 10 μM) at 24 and 48 h. Autophagy was also con-firmed using immuno-cytochemistry (Fig. 1C, D and SupplementaryFig. 1) where 10 μM Salinomycin treated cells show an increase in thenumber of LC3 positive cells, number of LC3fluorescent signals (fluores-cent dots) per cell and the number of active lysosomes (usingLysoTracker) per cell (Fig. 1D). Fig. 1C also shows a localization of activelysosomes (LysoTracker Red) and LC3 signal (green fluorescent dots) inthe near vicinity (or colocalization) thus providing a strong evidence foran active autophagic mechanism. The relative number of lysosome in-crease (LysoTracker Red counts) per cell, is shown in Fig. 1E, whereasthe relative number increase of LC3 signals per cell (increase inautophagosome formation relative to their controls), is shown in Fig. 1F.
To further support the increase in active autophagy in Salinomycin-treated cells, LC3II-fluxwasmonitored at different time periods in pros-tate and breast cancer cell lines along with autophagy inhibitor. As pre-dicted, an increase in LC3II accumulation was observed in Salinomycintreated cells that are pretreated for 1 h with autophagy inhibitor20 μMChloroquine (Fig. 2A, and Supplementary Fig. 2A). Similar obser-vations were made using other autophagic inhibitors (Bafilomycin andpepstatin-ED64 mix) (Supplementary data Fig. 2B). Further validationof Salinomycin induced autophagic process was done by transmissionelectronmicroscopy (Fig. 2B and Supplementary Fig. 3). Salinomycin in-duces strong vacuolization and autophagosome formation. In the inset
(bottom row) the representative images of lysosomes, autophagosomesand complete autophagolysosomes are indicated.
3.2. Salinomycin triggered autophagy counteracts cell death in cancer cells
Since autophagymay promote either cell survival or cell death, wetested by an MTT assay if autophagy inhibition by Chloroquine poten-tiates, or inhibits Salinomycin's toxicity. Surprisingly, inhibition ofautophagy with Chloroquine (20 μM, Cq) in Salinomycin (10 μM,Sal) treated cancer cells increased cell death in tested breast- andprostate cancer cell lines, however, in human normal dermal fibro-blasts autophagy inhibition actually increased survival (Fig. 3A). Asshown in Fig. 3B, immortalized murine embryonic fibroblasts defi-cient in ATG5 (ATG5-KO), a crucial gene involved in autophagosomeelongation, also show an increased cell death upon treatment withSalinomycin, as compared to the respective control wild-type fibro-blasts (Fig. 3B).
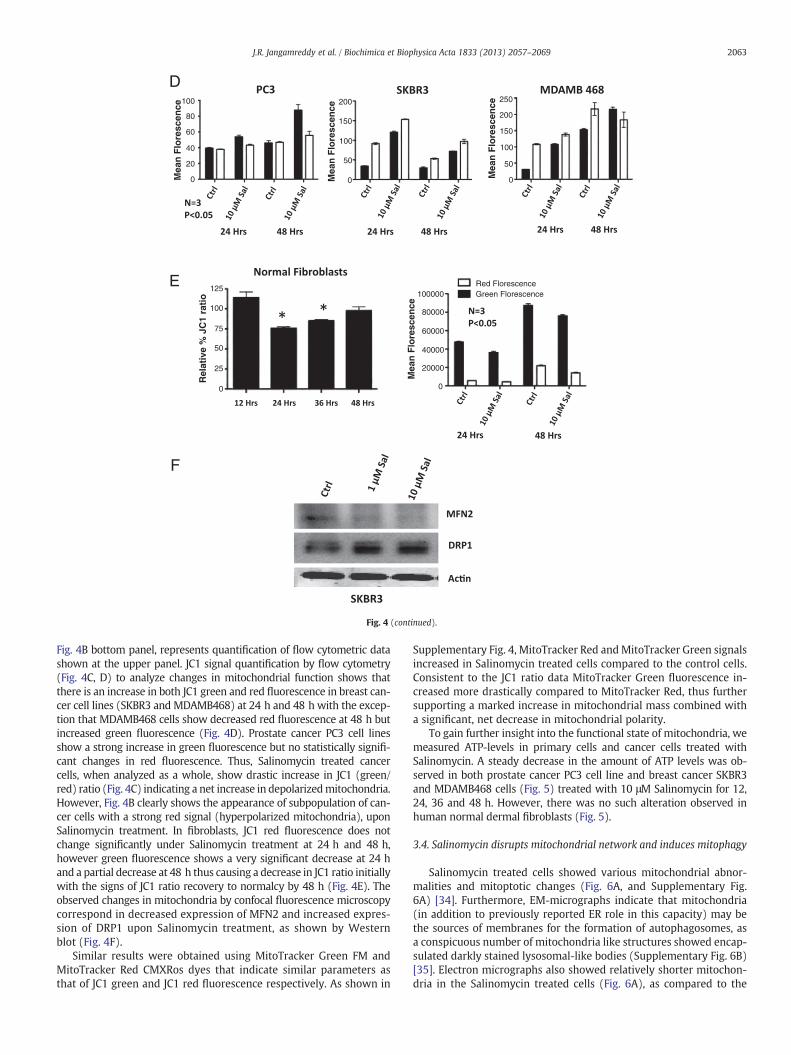
3.3. Salinomycin treatment increases mitochondrial mass, and netmitochondrial membrane depolarization in cancer cells but not inprimary cells, implications for cellular ATP-level
Our transmission electronmicroscopy data shown in Fig. 2B indicatesthat some Salinomycin triggered autophagosomes contained damaged

2062 J.R. Jangamreddy et al. / Biochimica et Biophysica Acta 1833 (2013) 2057–2069
mitochondria. Thus, in order to assess the function of mitochondria andits role in Salinomycin induced cell death JC1 assay was used to analyzemitochondrialmembrane potential andmitochondrialmass as describedpreviously [33]. Using JC1 assay we can assess the net mitochondrial
A
B
C
Fig. 4. Net mitochondrial depolarization observed among cells treated with Salinomycin issubset of cells: (A) Confocal images show increase of green fluorescent signal upon Salinoprimary fibroblasts. (B) Change in JC1 green and red fluorescence in cells treated with SalMDAMB468) show a major increase in the number of cells with increased green fluorescencwere used to display both parameters. Compensation was done using Kaluza software (Beckfrom flow cytometry. Cancer cells treated with Salinomycin show increased JC1 ratio compmitochondrial mass) and JC1 red fluorescence (indicating mitochondrial membrane potenMDAMB468 cells show an increase in both green and red fluorescence at 24 h and 48 h exgreen fluorescence. (E) Human normal dermal fibroblasts showing a decrease in JC1 ratio atsion of MFN2 and increases the expression of DRP1, in SKBR3 cells. *Represents statistically
mass, represented by green signal, and intact mitochondrial potentialrepresented by the red signal. As shown in Fig. 4AB, unlike human nor-mal dermal fibroblasts, cancer cells treated with Salinomycin respondwith the increase of mitochondrial mass (increased green fluorescence).
due to the increased mitochondrial mass; Salinomycin induces hyperpolarization in amycin treatment compared to controls, in cancer cell lines but in lesser extent amonginomycin for 24 h was detected by flow cytometer. Cancer cell lines (PC3, SKBR3 ande, while only a minor increase in red fluorescence could be detected. Logarithmic scalesman Coulter Inc.). (C) Quantitative representation of JC1 (green to red) ratios obtainedared to their respective controls. (D) Changes in the JC1 green fluorescence (indicatestial) were monitored upon Salinomycin treatment for 24 h and 48 h. PC3, SKBR3 andcept MDAMB468 cells at 48 h that show a decrease in red fluorescence but increased24 h but JC1 ratio is regained to normal by 48 h. (F) Salinomycin decreases the expres-significant difference (P b 0.05). NS = nonsignificant.
80
100
60
40
20
0
200
150
100
0
50
250
200
150
100
50
0
100000
80000
60000
40000
20000
0
100
125
75
50
25
0
Rel
ativ
e %
JC
1 ra
tio
Red FlorescenceGreen Florescence
D
E
FM
ean
Flo
resc
ence
Mea
n F
lore
scen
ce
Mea
n F
lore
scen
ce
Mea
n F
lore
scen
ce
Fig. 4 (continued).
2063J.R. Jangamreddy et al. / Biochimica et Biophysica Acta 1833 (2013) 2057–2069
Fig. 4B bottom panel, represents quantification of flow cytometric datashown at the upper panel. JC1 signal quantification by flow cytometry(Fig. 4C, D) to analyze changes in mitochondrial function shows thatthere is an increase in both JC1 green and red fluorescence in breast can-cer cell lines (SKBR3 and MDAMB468) at 24 h and 48 h with the excep-tion that MDAMB468 cells show decreased red fluorescence at 48 h butincreased green fluorescence (Fig. 4D). Prostate cancer PC3 cell linesshow a strong increase in green fluorescence but no statistically signifi-cant changes in red fluorescence. Thus, Salinomycin treated cancercells, when analyzed as a whole, show drastic increase in JC1 (green/red) ratio (Fig. 4C) indicating a net increase in depolarizedmitochondria.However, Fig. 4B clearly shows the appearance of subpopulation of can-cer cells with a strong red signal (hyperpolarized mitochondria), uponSalinomycin treatment. In fibroblasts, JC1 red fluorescence does notchange significantly under Salinomycin treatment at 24 h and 48 h,however green fluorescence shows a very significant decrease at 24 hand a partial decrease at 48 h thus causing a decrease in JC1 ratio initiallywith the signs of JC1 ratio recovery to normalcy by 48 h (Fig. 4E). Theobserved changes in mitochondria by confocal fluorescence microscopycorrespond in decreased expression of MFN2 and increased expres-sion of DRP1 upon Salinomycin treatment, as shown by Westernblot (Fig. 4F).
Similar results were obtained using MitoTracker Green FM andMitoTracker Red CMXRos dyes that indicate similar parameters asthat of JC1 green and JC1 red fluorescence respectively. As shown in
Supplementary Fig. 4, MitoTracker Red andMitoTracker Green signalsincreased in Salinomycin treated cells compared to the control cells.Consistent to the JC1 ratio data MitoTracker Green fluorescence in-creased more drastically compared to MitoTracker Red, thus furthersupporting a marked increase in mitochondrial mass combined witha significant, net decrease in mitochondrial polarity.
To gain further insight into the functional state of mitochondria, wemeasured ATP-levels in primary cells and cancer cells treated withSalinomycin. A steady decrease in the amount of ATP levels was ob-served in both prostate cancer PC3 cell line and breast cancer SKBR3and MDAMB468 cells (Fig. 5) treated with 10 μM Salinomycin for 12,24, 36 and 48 h. However, there was no such alteration observed inhuman normal dermal fibroblasts (Fig. 5).
3.4. Salinomycin disrupts mitochondrial network and induces mitophagy
Salinomycin treated cells showed various mitochondrial abnor-malities and mitoptotic changes (Fig. 6A, and Supplementary Fig.6A) [34]. Furthermore, EM-micrographs indicate that mitochondria(in addition to previously reported ER role in this capacity) may bethe sources of membranes for the formation of autophagosomes, asa conspicuous number of mitochondria like structures showed encap-sulated darkly stained lysosomal-like bodies (Supplementary Fig. 6B)[35]. Electron micrographs also showed relatively shorter mitochon-dria in the Salinomycin treated cells (Fig. 6A), as compared to the

150
125
100
75
50
25
0
150
125
100
75
50
25
0
150
125
100
75
50
25
0
150
125
100
75
50
25
0
Fig. 5. Salinomycin treatment of cancer cells triggers decrease in ATP content: total ATP levels were measured in human normal dermal fibroblasts and cancer cells, upon treatmentwith 10 μM Salinomycin. ATP-level was not changed in human normal dermal fibroblasts upon Salinomycin treatment, however the same Salinomycin treatment causes a strong,time-dependent ATP-depletion in cancer cell lines. *Represents statistically significant difference (P b 0.05).
2064 J.R. Jangamreddy et al. / Biochimica et Biophysica Acta 1833 (2013) 2057–2069
more elongated mitochondria in respective control non-treated cells.A manual count of total mitochondria per cell using electron micro-graphs also showed a decrease in the number of mitochondria withintact morphological features (Fig. 5B). In accordance with the elec-tron microscopy data, a careful analysis of confocal images obtainedfor treated and non-treated cancer cells stained with MitoTrackerRed CMXRos indicates mitochondria with intact mitochondrial poten-tial. Furthermore, we observe a lower number of mitochondria withincreased size (Fig. 5C, D, and Supplementary Fig. 7) that may be in-dicative for mitochondrial swelling.
Mitochondrial autophagy was further confirmed by LC3 signalcolocalization with the mitochondria (MitoTracker Red) in both primaryand cancer cells treatedwith 10 μMSalinomycin (Fig. 6E). In the samefig-ure, Salinomycin treated cells show disruption in the mitochondrial net-work and relatively shorter mitochondria in fibroblasts and swollen orclumped mitochondria in cancer cell lines (Fig. 6E, and SupplementaryFig. 8).
3.5. Salinomycin-induced cell death form, depends on drug's concentration
As indicated by MTT assay results (Fig. 7A), Salinomycin induced ahigher level of cell death in cancer cells as compared to human normaldermal fibroblasts (control). Since MTT assay does not distinguish be-tween forms of cell death (it is a cell survival assay) we have nextprobed cell death induced by Salinomycin, using flow-cytometric7AAD/Po-Pro assay that allows distinguishing between necrosis andapoptosis. As shown in Fig. 7B, cancer cells treated with lower concen-tration of Salinomycin (1 μM) show an increased number of early apo-ptotic cells (increase in only Po-Pro staining) and dead cells/necroticcells (positive for Po-Pro and 7AAD stains). However, at higher concen-tration of Salinomycin (10 μM), along with apoptotic population, a sig-nificant number of cells show increased 7AAD staining withoutPo-Pro staining indicating a direct induction of necrotic cell death(Fig. 7B). Salinomycin-induced necrosis was further confirmed bydetecting HMGB1 in cell medium (HMGB1 normally resides in cellnucleus, if found in cell medium, it is considered a necrotic marker).Treatment of cancer cells with Salinomycin, increased medium content
of HMGB1 in a dose-dependentmanner (Fig. 7C). Unlike in cancer cells,nomarked increase in cell deathwas observed in humannormal dermalfibroblasts treated with 10 μM Salinomycin (Fig. 7D).
3.6. Salinomycin triggers caspase mediated apoptosis among the cellsshowing hyperpolarized mitochondria
Wehave previously shown (Fig. 4B) that a subset of cancer cells treat-ed with Salinomycin responds with mitochondrial hyperpolarization,rather than depolarization. Thus, we next checked the effects ofSalinomycin on caspase-3 activity in our cell linemodels,while costainingthem with MitoView 633 (indicator for polarized mitochondria).Flow-cytometric data indicate a significant increase in number of cellswith increased mitochondrial polarization upon treatment with 1 μMSalinomycin for 24 h in SKBR3 and MDAMB468 cells (Fig. 8AB).Surprisingly, we have observed a significant increase in caspase-3 activitypredominantly in cells showing hyperpolarizedmitochondria (MitoView633-high) in Salinomycin treated cells compared to their controls(Fig. 8B). Similarly, Salinomycin treated cells showed an increase incaspase-9 and caspase-8 activities compared to the controls (Fig. 8B).Furthermore inhibition of caspase activity using a pan-caspase inhibitorquinoline-Val-Asp(Ome)-CH2-O-phenoxy (Q-VD-OPh, 10 μM) showedpartial rescue from cell death by Salinomycin among SKBR3 cells(Fig. 8C).
4. Discussion
Improving understanding of the biology of cancer, aswell as new ex-perimental drugs, like Salinomycin, that preferentially target cancerstem cells brings us closer to finding cure against this devastatinggroup of diseases. Cancer biology is complicated and each type of cancerharbors its individual changes that may further evolve, once clinicaltherapy progresses. Still, some core aspects of cancer biology are preva-lent in different forms of cancer. Among them are: (i) the presence ofcancer stem cells (CSC) (tumor initiating cells) in (almost) every cancer,and (ii), set of metabolic changes, and anomalies in mitochondrial biol-ogy (Warburg effect), that make cancer metabolism largely dependent
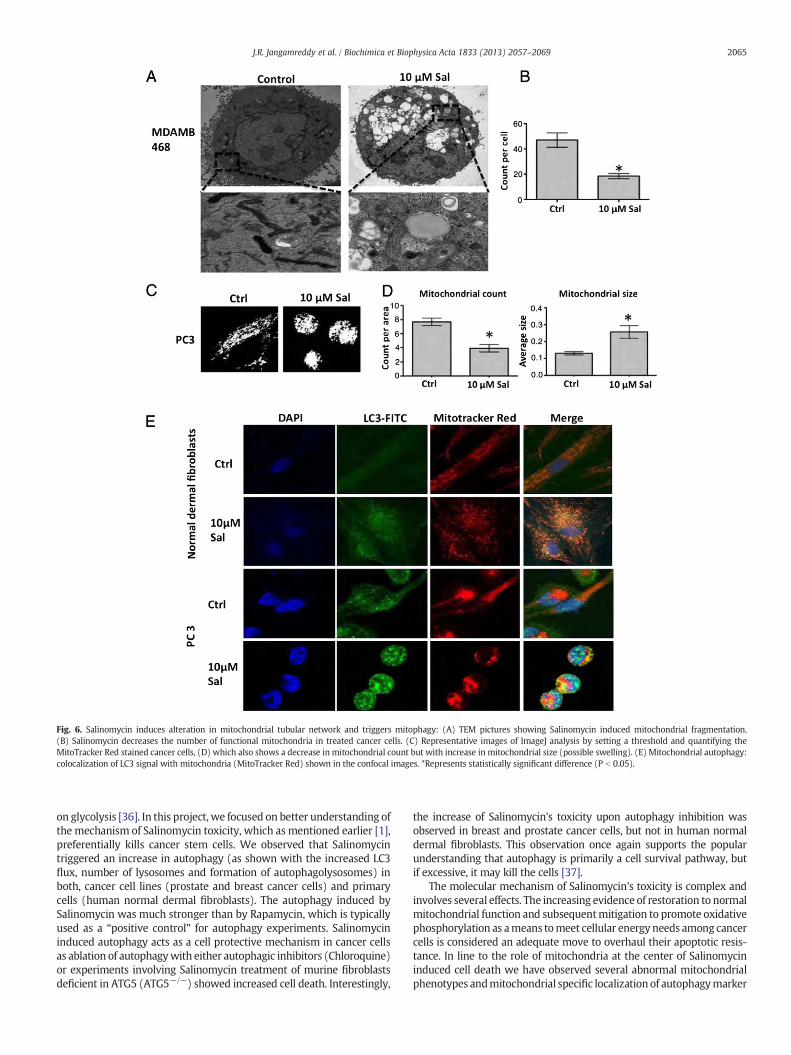
Fig. 6. Salinomycin induces alteration in mitochondrial tubular network and triggers mitophagy: (A) TEM pictures showing Salinomycin induced mitochondrial fragmentation.(B) Salinomycin decreases the number of functional mitochondria in treated cancer cells. (C) Representative images of ImageJ analysis by setting a threshold and quantifying theMitoTracker Red stained cancer cells, (D) which also shows a decrease in mitochondrial count but with increase in mitochondrial size (possible swelling). (E) Mitochondrial autophagy:colocalization of LC3 signal with mitochondria (MitoTracker Red) shown in the confocal images. *Represents statistically significant difference (P b 0.05).
2065J.R. Jangamreddy et al. / Biochimica et Biophysica Acta 1833 (2013) 2057–2069
on glycolysis [36]. In this project, we focused on better understanding ofthe mechanism of Salinomycin toxicity, which as mentioned earlier [1],preferentially kills cancer stem cells. We observed that Salinomycintriggered an increase in autophagy (as shown with the increased LC3flux, number of lysosomes and formation of autophagolysosomes) inboth, cancer cell lines (prostate and breast cancer cells) and primarycells (human normal dermal fibroblasts). The autophagy induced bySalinomycin was much stronger than by Rapamycin, which is typicallyused as a “positive control” for autophagy experiments. Salinomycininduced autophagy acts as a cell protective mechanism in cancer cellsas ablation of autophagywith either autophagic inhibitors (Chloroquine)or experiments involving Salinomycin treatment of murine fibroblastsdeficient in ATG5 (ATG5−/−) showed increased cell death. Interestingly,
the increase of Salinomycin's toxicity upon autophagy inhibition wasobserved in breast and prostate cancer cells, but not in human normaldermal fibroblasts. This observation once again supports the popularunderstanding that autophagy is primarily a cell survival pathway, butif excessive, it may kill the cells [37].
The molecular mechanism of Salinomycin's toxicity is complex andinvolves several effects. The increasing evidence of restoration to normalmitochondrial function and subsequentmitigation to promote oxidativephosphorylation as ameans tomeet cellular energy needs among cancercells is considered an adequate move to overhaul their apoptotic resis-tance. In line to the role of mitochondria at the center of Salinomycininduced cell death we have observed several abnormal mitochondrialphenotypes andmitochondrial specific localization of autophagymarker

Fig. 7. Salinomycin induces both apoptosis and necrotic-like cell death: (A) MTT assay shows an increase in cell death in cells treated Salinomycin for 24 h and 48 h (please noterelative resistance of human normal dermal fibroblasts to Salinomycin). (B) At low concentrations (1 μM) Salinomycin induces apoptosis (cells showing increase in Po-Pro staining)and dead cells. (B) At a high concentration, Salinomycin triggers 2 different forms of cell death: for Po-Pro positive (apoptotic), and necrotic with increased staining for 7-AAD only;a third population of cells (positive for both Po-Pro and 7-AAD) represent dead cells that are either late necrotic, or may have entered secondary necrosis. (C) Western blotting ofsupernatants of the SKBR3 cells treated with 1 μM and 10 μM Salinomycin shows increased release of necrotic marker HMGB1 among cells treated with 10 μM Salinomycin com-pared to both control and 1 μM Salinomycin treated cells. (D) Human normal dermal fibroblasts treated with 10 μM Salinomycin for 48 h show no marked increase in staining forapoptotic or necrotic markers. Logarithmic scales were used to display both parameters. Compensation was not applied (no emission spectra overlap).
2066 J.R. Jangamreddy et al. / Biochimica et Biophysica Acta 1833 (2013) 2057–2069
LC3 indicating mitophagy. Mitochondrial tubular network showeddisintegration alongwith fragmentation, the result of mitochondrial dy-namics of fission and fusion, upon Salinomycin treatment. Both fissionand fusion assist cellular stress rescue with mitochondrial fusion restor-ing the minimally damaged mitochondria and fission resulting in thecleavage of mitochondria followed by degradation of the damagedmitochondrial portion [16]. Similarly, Salinomycin treatment to cancercells showed decreased number ofmitochondriawith intact innermem-brane potential, increased staining for MitoTracker Red, a marker for
intact inner mitochondrial membrane potential (ΔΨ) along withincreased mitochondrial mass (marked by increased JC1 green fluores-cence and MitoTracker Green FM). Moreover, there is no change inPGC1α protein expression, a major regulator for nuclear initiated mito-chondrial biogenesis, upon treatment with Salinomycin in cancer celllines (Supplementary Fig. 9); thus, inferring thatmitochondrial dynamicfusion andfissionmechanisms contribute to the alterations inmitochon-drial mass and maintenance of mitochondrial function in Salinomycintreated cells. While we interpret the increase of JC1 green fluorescence
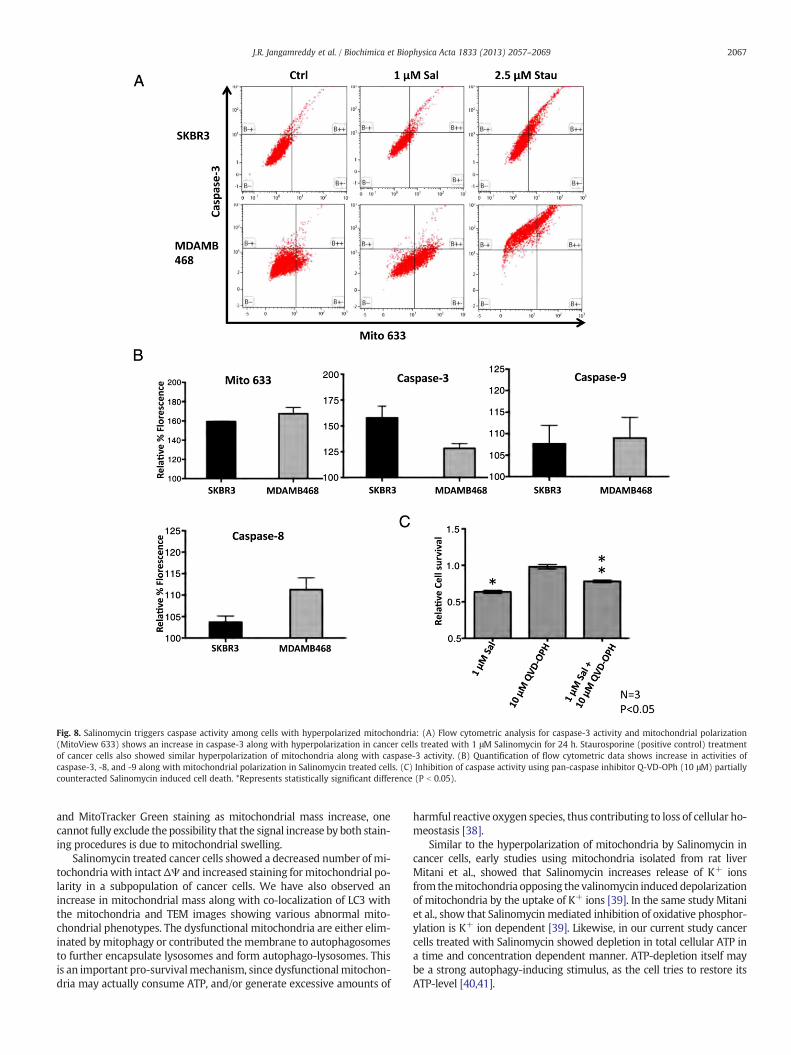
Fig. 8. Salinomycin triggers caspase activity among cells with hyperpolarized mitochondria: (A) Flow cytometric analysis for caspase-3 activity and mitochondrial polarization(MitoView 633) shows an increase in caspase-3 along with hyperpolarization in cancer cells treated with 1 μM Salinomycin for 24 h. Staurosporine (positive control) treatmentof cancer cells also showed similar hyperpolarization of mitochondria along with caspase-3 activity. (B) Quantification of flow cytometric data shows increase in activities ofcaspase-3, -8, and -9 along with mitochondrial polarization in Salinomycin treated cells. (C) Inhibition of caspase activity using pan-caspase inhibitor Q-VD-OPh (10 μM) partiallycounteracted Salinomycin induced cell death. *Represents statistically significant difference (P b 0.05).
2067J.R. Jangamreddy et al. / Biochimica et Biophysica Acta 1833 (2013) 2057–2069
and MitoTracker Green staining as mitochondrial mass increase, onecannot fully exclude the possibility that the signal increase by both stain-ing procedures is due to mitochondrial swelling.
Salinomycin treated cancer cells showed a decreased number of mi-tochondriawith intact ΔΨ and increased staining for mitochondrial po-larity in a subpopulation of cancer cells. We have also observed anincrease in mitochondrial mass along with co-localization of LC3 withthe mitochondria and TEM images showing various abnormal mito-chondrial phenotypes. The dysfunctional mitochondria are either elim-inated bymitophagy or contributed the membrane to autophagosomesto further encapsulate lysosomes and form autophago-lysosomes. Thisis an important pro-survivalmechanism, since dysfunctional mitochon-dria may actually consume ATP, and/or generate excessive amounts of
harmful reactive oxygen species, thus contributing to loss of cellular ho-meostasis [38].
Similar to the hyperpolarization of mitochondria by Salinomycin incancer cells, early studies using mitochondria isolated from rat liverMitani et al., showed that Salinomycin increases release of K+ ionsfrom themitochondria opposing the valinomycin induced depolarizationof mitochondria by the uptake of K+ ions [39]. In the same study Mitaniet al., show that Salinomycinmediated inhibition of oxidative phosphor-ylation is K+ ion dependent [39]. Likewise, in our current study cancercells treated with Salinomycin showed depletion in total cellular ATP ina time and concentration dependent manner. ATP-depletion itself maybe a strong autophagy-inducing stimulus, as the cell tries to restore itsATP-level [40,41].
2068 J.R. Jangamreddy et al. / Biochimica et Biophysica Acta 1833 (2013) 2057–2069
Mitochondrial hyperpolarizationwas also reported in staurosporine-,Fas- and p53-triggered apoptosis [25,27,28,42,43]. However, humannormal dermal fibroblasts did not show such depletion in ATP upontreatment with Salinomycin. The observed cancer cell specific deleteri-ous effect of Salinomycin is explained by the fact that cancer cells harborvarious abnormalities within mitochondria, such as hyperpolarized mi-tochondria along with defective mitochondrial fission and fusion mech-anismsdue to the lack of functionally intactmitofusin proteins, DRP1 andother proteins involved in the mitochondrial dynamics [22,44]. Thiscompromised mitochondrial function among cancer cells could be themajor contributor for the susceptibility of cancer cells to the ionic fluctu-ations induced by Salinomycin. Moreover, Dichloroacetate (DCA), whichis also a K+ ion channel modulator, and a molecule that preferentiallytargets cancer cells, contrasting to Salinomycin induces depolarizationof mitochondria [44,45]. Thus, ionic manipulation within mitochondriaoffers a unique target for the development of novel cancer therapies.
Similar to staurosporine, Salinomycin also triggered activation of ex-ecutioner caspase-3 along with initiator caspase-9, but only among thecells with hyperpolarized mitochondria. Inhibition of caspases usingpan-caspase inhibitor Q-VD-OPh partially protected from cell death in-duced by Salinomycin but it was unable to fully reverse Salinomycin'stoxic effect. Besides the activation of apoptotic signaling pathways, wealso observed necrotic/necroptotic cell death, especially among cancercells treated with higher concentrations (10 μM) of Salinomycin. A sub-population of cells showed increased staining with 7-AAD, which in theused method preferentially stains necrotic cells, without any stainingwith an apoptotic marker (Po-Pro). Necrosis/necroptosis induction wasalso confirmed by the detection of HMGB1 protein (necrotic marker)[46,47] in the extracellular supernatant of cells treated with higher con-centrations of Salinomycin.
Numerous manuscripts published within the recent decade, clearlyshow that a number of cell death stimuli simultaneously activate apo-ptosis, necrosis (or necroptosis) and autophagy [8]. Apoptosis however,as the most specialized form of cell death usually prevails, not only dueto its speed, but also because caspases actively cleave and eliminateelements of necrotic or autophagic machinery [15]. For example,caspases cleave and inactivate key elements of autophagic machin-ery, Beclin1, ATG4 and ATG5 [10,29,48]. Generated in the processfragments, i.e. the C-terminal Beclin1 fragment gains the ability to am-plify mitochondrion-dependent apoptosis despite a lack of a BH3domain [49]. Furthermore, Bcl2 anti-apoptotic proteins (Bcl2/Bcl-XL)can attach to Beclin1 and inhibit autophagy. Concomitantly, caspase-8may block necrosis or necroptosis by the cleavage of RIPK1 and RIPK3,and thus, prevent the formation of a necrosome [50].
In conclusion, this study shows that: (i) Salinomycin induces autoph-agy that initially has a protective effect in cancer cells, (ii) Salinomycintriggers mitochondrial swelling, mitophagy and disrupts mitochondrialarchitecture, (iii) cancer cell specific toxicity of Salinomycin is throughmi-tochondrial hyperpolarization observed preferentially in cancer cells, (iv)Salinomycin induces both, caspase mediated apoptosis and necrosis/necroptosis as evident by the release of HMGB1, and (v) Salinomycincaused strong and time-dependent ATP-depletion in cancer cells, butnot in human normal dermal fibroblasts. Thus, specific and more robusttoxicity of Salinomycin towards cancer and cancer stem cells withoutmuch adversity towards normal cells warrants the use of Salinomycinas an effective chemotherapeutic agent, in combination with autophagyinhibitors.
Acknowledgements
SG was supported by Parker B Francis fellowship in Respiratory Dis-ease. MJL and JRJ kindly acknowledge the core/startup support fromLinköping University, from Integrative Regenerative Medicine Center(IGEN), from Cancerfonden (CAN 2011/521), and from VR-NanoVision(K2012-99X-22325-01-5).
Appendix A. Supplementary data
Supplementary data to this article can be found online at http://dx.doi.org/10.1016/j.bbamcr.2013.04.011.
References
[1] P.B. Gupta, T.T. Onder, G. Jiang, K. Tao, C. Kuperwasser, R.A. Weinberg, E.S. Lander,Identification of selective inhibitors of cancer stem cells by high-throughputscreening, Cell 138 (2009) 645–659.
[2] P.S. Oak, F. Kopp, C. Thakur, J.W. Ellwart, U.R. Rapp, A. Ullrich, E. Wagner, P.Knyazev, A. Roidl, Combinatorial treatment of mammospheres with trastuzumaband salinomycin efficiently targets HER2-positive cancer cells and cancer stemcells, Int. J. Cancer 131 (2012) 2808–2819.
[3] Y. Wang, Effects of salinomycin on cancer stem cell in human lung adenocarcinomaA549 cells, Med. Chem. 7 (2011) 106–111.
[4] Q.M. Zhi, X.H. Chen, J. Ji, J.N. Zhang, J.F. Li, Q. Cai, B.Y. Liu, Q.L. Gu, Z.G. Zhu, Y.Y. Yu,Salinomycin can effectively kill ALDH(high) stem-like cells on gastric cancer,Biomed. Pharmacother. 65 (2011) 509–515.
[5] D. Lu, M.Y. Choi, J. Yu, J.E. Castro, T.J. Kipps, D.A. Carson, Salinomycin inhibits Wntsignaling and selectively induces apoptosis in chronic lymphocytic leukemia cells,Proc. Natl. Acad. Sci. U. S. A. 108 (2011) 13253–13257.
[6] A. Huczynski, Salinomycin: a new cancer drug candidate, Chem. Biol. Drug Des. 79(2012) 235–238.
[7] S.M. Alavian, S.R. Ande, K.M. Coombs, B. Yeganeh, P. Davoodpour, M. Hashemi, M.Los, S. Ghavami, Virus-triggered autophagy in viral hepatitis — possible novelstrategies for drug development, J. Viral Hepat. 18 (2011) 821–830.
[8] W. Chaabane, S.D. User, M. El-Gazzah, R. Jaksik, E. Sajjadi, J. Rzeszowska-Wolny, M.J.Los, Autophagy, apoptosis, mitoptosis and necrosis: interdependence betweenthose pathways and effects on cancer, Arch. Immunol. Ther. Exp. 61 (2013) 43–58.
[9] B. Yeganeh, S. Mukherjee, L.M. Moir, K. Kumawat, H.H. Kashani, R.A. Bagchi, H.A.Baarsma, R. Gosens, S. Ghavami, Novel non-canonical TGF-beta signaling networks:emerging roles in airway smooth muscle phenotype and function, Pulm. Pharmacol.Ther. 26 (2012) 50–63.
[10] B. Levine, Cell biology: autophagy and cancer, Nature 446 (2007) 745–747.[11] S. Ghavami, B. Yeganeh, G.L. Stelmack, H.H. Kashani, P. Sharma, R. Cunnington, S.
Rattan, K. Bathe, T. Klonisch, I.M. Dixon, D.H. Freed, A.J. Halayko, Apoptosis,autophagy and ER stress in mevalonate cascade inhibition-induced cell death ofhuman atrial fibroblasts, Cell Death Dis. 3 (2012) e330.
[12] S. Ghavami, R.H. Cunnington, B. Yeganeh, J.J. Davies, S.G. Rattan, K. Bathe, M.Kavosh, M.J. Los, D.H. Freed, T. Klonisch, G.N. Pierce, A.J. Halayko, I.M. Dixon,Autophagy regulates trans fatty acid-mediated apoptosis in primary cardiacmyofibroblasts, Biochim. Biophys. Acta 1823 (2012) 2274–2286.
[13] Y. Nishida, S. Arakawa, K. Fujitani, H. Yamaguchi, T. Mizuta, T. Kanaseki, M.Komatsu, K. Otsu, Y. Tsujimoto, S. Shimizu, Discovery of Atg5/Atg7-independentalternative macroautophagy, Nature 461 (2009) 654–658.
[14] H. Cheong, T. Lindsten, J. Wu, C. Lu, C.B. Thompson, Ammonia-induced autophagyis independent of ULK1/ULK2 kinases, Proc. Natl. Acad. Sci. U. S. A. 108 (2011)11121–11126.
[15] M.V. Jain, A.M. Paczulla, T. Klonisch, F.N. Dimgba, S.B. Rao, K. Roberg, F. Schweizer,C. Lengerke, P. Davoodpour, V.R. Palicharla, S. Maddika, M. Los, Interconnectionsbetween apoptotic, autophagic and necrotic pathways: implications for cancertherapy development, J. Cell. Mol. Med. 17 (2013) 12–29.
[16] R.J. Youle, A.M. van der Bliek, Mitochondrial fission, fusion, and stress, Science337 (2012) 1062–1065.
[17] G. Benard, M. Karbowski, Mitochondrial fusion and division: regulation and rolein cell viability, Semin. Cell Dev. Biol. 20 (2009) 365–374.
[18] T. Koshiba, S.A. Detmer, J.T. Kaiser, H. Chen, J.M. McCaffery, D.C. Chan, Structuralbasis of mitochondrial tethering by mitofusin complexes, Science 305 (2004)858–862.
[19] S. Frank, B. Gaume, E.S. Bergmann-Leitner, W.W. Leitner, E.G. Robert, F. Catez, C.L.Smith, R.J. Youle, The role of dynamin-related protein 1, amediator ofmitochondrialfission, in apoptosis, Dev. Cell 1 (2001) 515–525.
[20] N. Taguchi, N. Ishihara, A. Jofuku, T. Oka, K. Mihara, Mitotic phosphorylation ofdynamin-related GTPase Drp1 participates in mitochondrial fission, J. Biol. Chem.282 (2007) 11521–11529.
[21] H. Chen, S.A. Detmer, A.J. Ewald, E.E. Griffin, S.E. Fraser, D.C. Chan, MitofusinsMfn1 and Mfn2 coordinately regulate mitochondrial fusion and are essential forembryonic development, J. Cell Biol. 160 (2003) 189–200.
[22] J. Rehman, H.J. Zhang, P.T. Toth, Y. Zhang, G. Marsboom, Z. Hong, R. Salgia, A.N.Husain, C. Wietholt, S.L. Archer, Inhibition of mitochondrial fission prevents cellcycle progression in lung cancer, FASEB J. 26 (2012) 2175–2186.
[23] M. Los, S. Wesselborg, K. Schulze-Osthoff, The role of caspases in development,immunity, and apoptotic signal transduction: lessons from knockout mice, Immunity10 (1999) 629–639.
[24] D.D. Newmeyer, S. Ferguson-Miller, Mitochondria: releasing power for life andunleashing the machineries of death, Cell 112 (2003) 481–490.
[25] J.L. Scarlett, P.W. Sheard, G. Hughes, E.C. Ledgerwood, H.H. Ku, M.P. Murphy,Changes in mitochondrial membrane potential during staurosporine-inducedapoptosis in Jurkat cells, FEBS Lett. 475 (2000) 267–272.
[26] N.J. Waterhouse, J.C. Goldstein, O. von Ahsen, M. Schuler, D.D. Newmeyer, D.R.Green, Cytochrome c maintains mitochondrial transmembrane potential andATP generation after outer mitochondrial membrane permeabilization duringthe apoptotic process, J. Cell Biol. 153 (2001) 319–328.
2069J.R. Jangamreddy et al. / Biochimica et Biophysica Acta 1833 (2013) 2057–2069
[27] M. Poppe, C. Reimertz, H. Dussmann, A.J. Krohn, C.M. Luetjens, D. Bockelmann,A.L. Nieminen, D. Kogel, J.H. Prehn, Dissipation of potassium and proton gradientsinhibits mitochondrial hyperpolarization and cytochrome c release during neuralapoptosis, J. Neurosci. 21 (2001) 4551–4563.
[28] R.M. Kluck, M.D. Esposti, G. Perkins, C. Renken, T. Kuwana, E. Bossy-Wetzel, M.Goldberg, T. Allen, M.J. Barber, D.R. Green, D.D. Newmeyer, The pro-apoptoticproteins, Bid and Bax, cause a limited permeabilization of the mitochondrialouter membrane that is enhanced by cytosol, J. Cell Biol. 147 (1999) 809–822.
[29] S. Ghavami, M.M. Mutawe, P. Sharma, B. Yeganeh, K.D. McNeill, T. Klonisch, H.Unruh, H.H. Kashani, D. Schaafsma, M. Los, A.J. Halayko, Mevalonate cascaderegulation of airway mesenchymal cell autophagy and apoptosis: a dual role forp53, PLoS One 6 (2011) e16523.
[30] A. Kuma,M. Hatano, M. Matsui, A. Yamamoto, H. Nakaya, T. Yoshimori, Y. Ohsumi, T.Tokuhisa, N. Mizushima, The role of autophagy during the early neonatal starvationperiod, Nature 432 (2004) 1032–1036.
[31] J. Rakar, S. Lonnqvist, P. Sommar, J. Junker, G. Kratz, Interpreted gene expressionof human dermal fibroblasts after adipo-, chondro- and osteogenic phenotypeshifts, Differentiation 84 (2012) 305–313.
[32] S. Liu, D.B. Stolz, P.L. Sappington, C.A. Macias, M.E. Killeen, J.J. Tenhunen, R.L.Delude, M.P. Fink, HMGB1 is secreted by immunostimulated enterocytes and con-tributes to cytomix-induced hyperpermeability of Caco-2 monolayers, Americanjournal of physiology, Cell Physiol. 290 (2006) C990–C999.
[33] M. Mancini, M. Sedghinasab, K. Knowlton, A. Tam, D. Hockenbery, B.O. Anderson,Flow cytometric measurement of mitochondrial mass and function: a novelmethod for assessing chemoresistance, Ann. Surg. Oncol. 5 (1998) 287–295.
[34] J.R. Jangamreddy, M.J. Los, Mitoptosis, a novel mitochondrial death mechanismleading predominantly to activation of autophagy, Hepat. Mon. 12 (2012) e6159.
[35] D.W. Hailey, A.S. Rambold, P. Satpute-Krishnan, K. Mitra, R. Sougrat, P.K. Kim, J.Lippincott-Schwartz, Mitochondria supply membranes for autophagosomebiogenesis during starvation, Cell 141 (2010) 656–667.
[36] P. Icard, H. Lincet, A global view of the biochemical pathways involved in the regula-tion of themetabolism of cancer cells, Biochim. Biophys. Acta 1826 (2012) 423–433.
[37] E.Wirawan, T. Vanden Berghe, S. Lippens, P. Agostinis, P. Vandenabeele, Autophagy:for better or for worse, Cell Res. 22 (2012) 43–61.
[38] L.C. Gomes, L. Scorrano, Mitochondrial morphology in mitophagy andmacroautophagy, Biochim. Biophys. Acta 1833 (2013) 205–212.
[39] M.Mitani, T. Yamanishi, Y. Miyazaki, N. Otake, Salinomycin effects onmitochondrialion translocation and respiration, Antimicrob. Agents Chemother. 9 (1976) 655–660.
[40] J.M. Rodriguez-Vargas, M.J. Ruiz-Magana, C. Ruiz-Ruiz, J. Majuelos-Melguizo, A.Peralta-Leal, M.I. Rodriguez, J.A. Munoz-Gamez, M.R. de Almodovar, E. Siles, A.L.Rivas, M. Jaattela, F.J. Oliver, ROS-induced DNA damage and PARP-1 are required foroptimal induction of starvation-induced autophagy, Cell Res. 22 (2012) 1181–1198.
[41] S.W. Tait, D.R. Green, Mitochondria and cell signalling, J. Cell Sci. 125 (2012)807–815.
[42] E. Bossy-Wetzel, D.D. Newmeyer, D.R. Green, Mitochondrial cytochrome c release inapoptosis occurs upstream of DEVD-specific caspase activation and independentlyof mitochondrial transmembrane depolarization, EMBO J. 17 (1998) 37–49.
[43] P.F. Li, R. Dietz, R. von Harsdorf, p53 regulates mitochondrial membrane potentialthrough reactive oxygen species and induces cytochrome c-independent apopto-sis blocked by Bcl-2, EMBO J. 18 (1999) 6027–6036.
[44] E.D. Michelakis, G. Sutendra, P. Dromparis, L. Webster, A. Haromy, E. Niven, C.Maguire, T.L. Gammer, J.R. Mackey, D. Fulton, B. Abdulkarim, M.S. McMurtry, K.C.Petruk, Metabolic modulation of glioblastoma with dichloroacetate, Sci. Transl.Med. 2 (2010) 31ra34.
[45] S. Bonnet, S.L. Archer, J. Allalunis-Turner, A. Haromy, C. Beaulieu, R. Thompson,C.T. Lee, G.D. Lopaschuk, L. Puttagunta, S. Bonnet, G. Harry, K. Hashimoto, C.J.Porter, M.A. Andrade, B. Thebaud, E.D. Michelakis, A mitochondria–K+ channelaxis is suppressed in cancer and its normalization promotes apoptosis and in-hibits cancer growth, Cancer Cell 11 (2007) 37–51.
[46] D. Brusa, E. Migliore, S. Garetto, M. Simone, L. Matera, Immunogenicity of 56 degreesC and UVC-treated prostate cancer is associated with release of HSP70 and HMGB1from necrotic cells, Prostate 69 (2009) 1343–1352.
[47] D.G. Craig, P. Lee, E.A. Pryde, G.S. Masterton, P.C. Hayes, K.J. Simpson, Circulating ap-optotic and necrotic cell death markers in patients with acute liver injury, Liver Int.31 (2011) 1127–1136.
[48] V.M. Betin, J.D. Lane, Caspase cleavage of Atg4D stimulates GABARAP-L1 process-ing and triggers mitochondrial targeting and apoptosis, J. Cell Sci. 122 (2009)2554–2566.
[49] M. Djavaheri-Mergny,M.C. Maiuri, G. Kroemer, Cross talk between apoptosis and au-tophagy by caspase-mediated cleavage of Beclin 1, Oncogene 29 (2010) 1717–1719.
[50] P. Vandenabeele, W. Declercq, F. Van Herreweghe, T. Vanden Berghe, The role ofthe kinases RIP1 and RIP3 in TNF-induced necrosis, Sci. Signal. 3 (2010) re4.