sagicor life jamaica limited - jamaica stock exchange statements for sagicor life jamaica limited...
TRANSCRIPT
Sagicor Life Jamaica Limited
Interim report to Stockholdersfor the three-month period ended31 March 2010
Directors' Statement
Sagicor Life Jamaica LimitedInterim Report to our Stockholders
for the three-month period ended 31 March 2010
On behalf of the Board of Directors, we are pleased to present the un-audited consolidated Financial Statements for Sagicor Life Jamaica Limited (SLJ) for the three-month period ended 31 March 2010. Overview: The Sagicor Jamaica Group produced net profits attributable to Stockholders of $1,035 million for Q1, 2010. This was 28% below the amount recorded for the corresponding period in 2009 which included certain significant items that were not repeated in 2010. There would be a 20% improvement in the Q1 2010 results with the effect of these items excluded. These items were: A reduction in Actuarial Liabilities due to high interest rates and foreign currency translation gains from depreciation of the Jamaican dollar, offset by restructuring costs. The profit for 2010 was generated from Revenues of $6,620 million and represents basic earnings per share of 28 cents. The annualized return on opening Stockholders Equity was 21%. Operations: Consolidated Total Revenue of $6,620 million was 3.3% better than that for the same period last year, 13% better when total revenue from discontinued operations is excluded. Revenues from all major lines of business showed improvement. New sales were strong and contributed to the increase in net premium revenues. Investment income was boosted by significant capital gains realized during the quarter despite the negative impact of the Jamaica Debt Exchange programme (JDX). Benefits paid to policyholders (net of reinsurance) were $2,292 million or 8% lower than that for the corresponding period in 2009, 4% higher when benefits from discontinued operations are excluded. Death claims and cash surrender expenses were noticeably higher than in the prior year, while health claims showed a more favorable experience. The large increase in Actuarial Liabilities for Q1 2010 of $862.3 million negatively impacted earnings. This level of increase was partly a consequence of the mix of policies sold during the period. As pointed out earlier, the Q1 2009 Actuarial Liabilities were reduced due to high interest rates at that time. It should also be noted that lower interest rates from the JDX, were reflected in the 2009 year-end Actuarial Liabilities. Administrative expenses, of $1,313 million were 6% lower than the Q1 2009 amount of $1,399 million (excluding the amount for discontinued operations). The 2009 amount included restructuring cost. After adjusting for the foregoing the normalised ratio of administrative expenses to total revenue was 20% compared to 23% for the previous year.
Sagicor Life Jamaica LimitedInterim Report to our Stockholders
for the three-month period ended 31 March 2010
Directors' Statement
The Pan Caribbean Financial Services (PCFS) Banking Group, in which Sagicor has an 86% interest, performed well for the first quarter and generated after tax profits of $396.9 million, up 14% on the prior year. Balance Sheet: Total assets of the SLJ Group were $145.6 billion compared to $135.5 billion at December 2009, representing a 7.5% growth for the quarter. Total assets under management including pension fund assets managed on behalf of clients and unit trusts, amounted to $224.0 billion (December 2009: $210.4 billion). Stockholders’ Equity as at March 2010 was $21.8 billion, compared to $19.9 billion as at December 2009. This 9.6% increase was in part due to the growth in retained earnings and the improved fair values of securities held as Available-For-Sale. During the quarter, The SLJ Board of Directors declared dividends of $789.8 million to Stockholders, or a dividend per share of 21 cents. This interim dividend was paid on April 9, 2010. Social Responsibility: During the period under review, SLJ continued to demonstrate its commitment to the Jamaican community through numerous activities. In January, Sagicor was a leading sponsor of the Shaggy Make A Difference Foundation. This sponsorship helped the Foundation in its support of the Bustamante Hospital for Children. We also partnered with Pan Caribbean’s Sigma Corporate Run to raise over $11 million for the Sir John Golding Rehabilitation Centre, the Jamaica Society for the Blind and the Jamaica Association for the Deaf. In the area of Education, Sagicor continued its Adopt-a-School program which was launched in 2009, by providing support to educational institutions, including fourteen Early Childhood Institutions (ECI) across the island. Discontinued Operations: This refers to the sale of Sagicor General Insurance (Cayman) Ltd. effective January 1, 2010. From that date all operating activity inured to the purchaser, Bahamas First Holdings. Conditional regulatory approval was granted in April and full completion is expected to occur during May.
Sagicor Life Jamaica LimitedInterim Report to our Stockholders
for the three-month period ended 31 March 2010
Directors' Statement
RICHARD O. BYLESPresident & CEO
DR. THE HON. R.D. WILLIAMSChairman5 May 2010
Outlook: Against the background of challenges presented by the changing economic environment, the Sagicor Group remains confident in its strategies to sustain growth. These include:
Continuous improvement in operational efficiencies.
Maximizing sales to our customer base.
Higher emphasis on conserving business on the books.
Maintaining a strong balance sheet through active management.
Fulfilling our corporate and social responsibility as a leading business entity in Jamaica.
Continuous engagement of our team members through unique and enriching programs.
Providing exemplary service to our customers at all times. We sincerely thank our customers, shareholders, team members and business partners for their continued and valued support. On behalf of the Board of Directors:
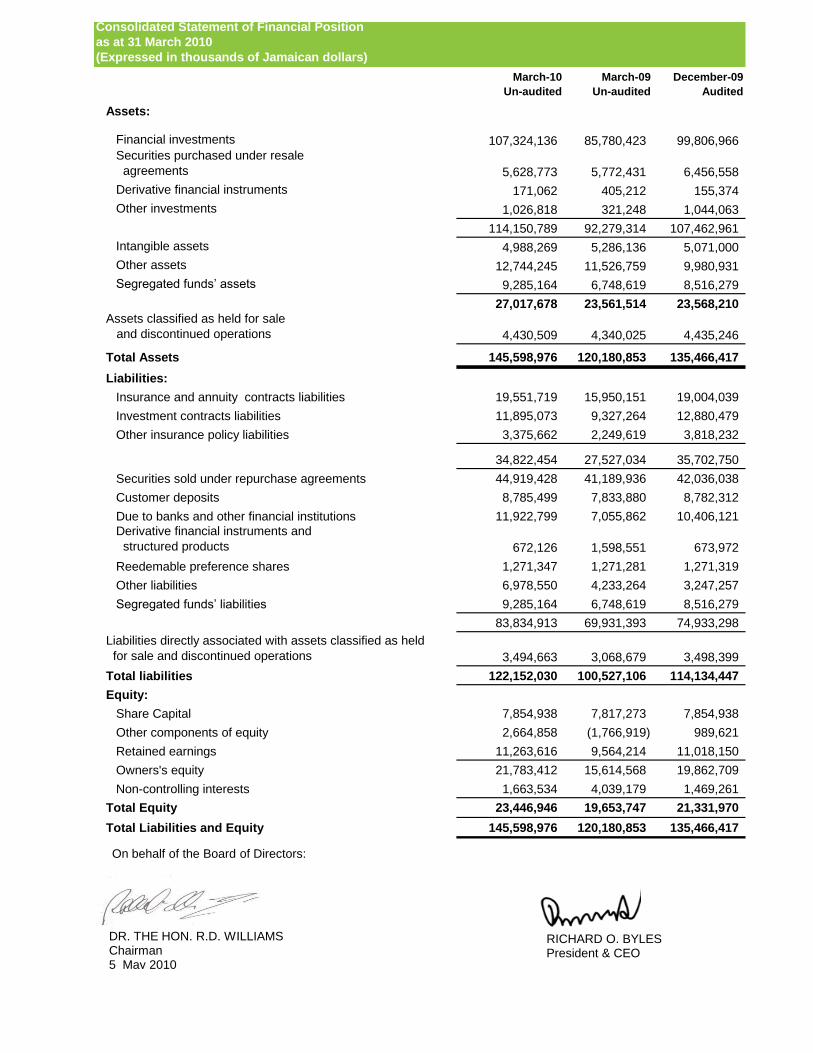
Consolidated Statement of Financial Position
as at 31 March 2010
(Expressed in thousands of Jamaican dollars)
March-10
Un-audited
March-09
Un-audited
December-09
Audited
Assets:
Financial investments 107,324,136 85,780,423 99,806,966
Securities purchased under resale
agreements 5,628,773 5,772,431 6,456,558
Derivative financial instruments 171,062 405,212 155,374
Other investments 1,026,818 321,248 1,044,063
114,150,789 92,279,314 107,462,961
Intangible assets 4,988,269 5,286,136 5,071,000
Other assets 12,744,245 11,526,759 9,980,931
Segregated funds’ assets 9,285,164 6,748,619 8,516,279
27,017,678 23,561,514 23,568,210
Assets classified as held for sale
and discontinued operations 4,430,509 4,340,025 4,435,246
Total Assets 145,598,976 120,180,853 135,466,417
Liabilities:
Insurance and annuity contracts liabilities 19,551,719 15,950,151 19,004,039
Investment contracts liabilities 11,895,073 9,327,264 12,880,479
Other insurance policy liabilities 3,375,662 2,249,619 3,818,232
34,822,454 27,527,034 35,702,750
Securities sold under repurchase agreements 44,919,428 41,189,936 42,036,038
Customer deposits 8,785,499 7,833,880 8,782,312
Due to banks and other financial institutions 11,922,799 7,055,862 10,406,121
Derivative financial instruments and
structured products 672,126 1,598,551 673,972
Reedemable preference shares 1,271,347 1,271,281 1,271,319
Other liabilities 6,978,550 4,233,264 3,247,257
Segregated funds’ liabilities 9,285,164 6,748,619 8,516,279
83,834,913 69,931,393 74,933,298
Liabilities directly associated with assets classified as held
for sale and discontinued operations 3,494,663 3,068,679 3,498,399
Total liabilities 122,152,030 100,527,106 114,134,447
Equity:
Share Capital 7,854,938 7,817,273 7,854,938
Other components of equity 2,664,858 (1,766,919) 989,621
Retained earnings 11,263,616 9,564,214 11,018,150
Owners's equity 21,783,412 15,614,568 19,862,709
Non-controlling interests 1,663,534 4,039,179 1,469,261
Total Equity 23,446,946 19,653,747 21,331,970
Total Liabilities and Equity 145,598,976 120,180,853 135,466,417
(0.00) (0.00) 0 On behalf of the Board of Directors:
DR. THE HON. R.D. WILLIAMSChairman5 May 2010
RICHARD O. BYLESPresident & CEO
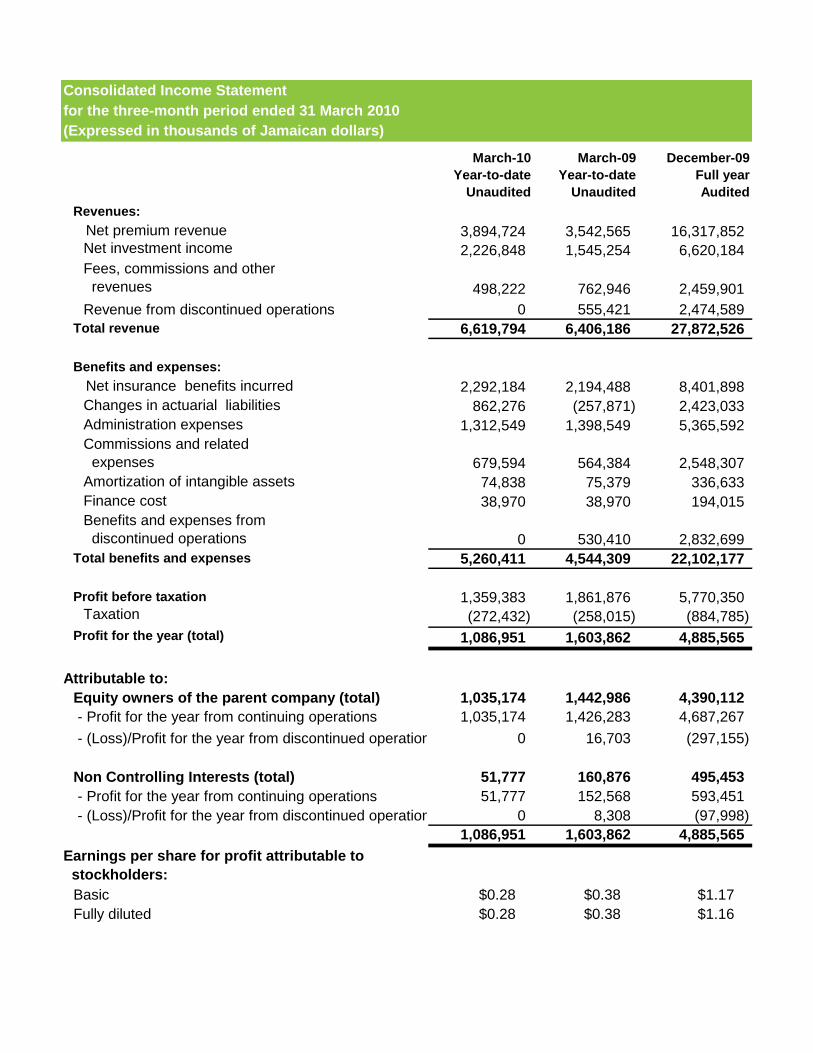
Consolidated Income Statement
for the three-month period ended 31 March 2010
(Expressed in thousands of Jamaican dollars)
March-10
Year-to-date
Unaudited
March-09
Year-to-date
Unaudited
December-09
Full year
Audited
Revenues:
Net premium revenue 3,894,724 3,542,565 16,317,852 Net investment income 2,226,848 1,545,254 6,620,184
Fees, commissions and other
revenues 498,222 762,946 2,459,901
Revenue from discontinued operations 0 555,421 2,474,589
Total revenue 6,619,794 6,406,186 27,872,526
Benefits and expenses:
Net insurance benefits incurred 2,292,184 2,194,488 8,401,898
Changes in actuarial liabilities 862,276 (257,871) 2,423,033
Administration expenses 1,312,549 1,398,549 5,365,592
Commissions and related
expenses 679,594 564,384 2,548,307
Amortization of intangible assets 74,838 75,379 336,633
Finance cost 38,970 38,970 194,015
Benefits and expenses from
discontinued operations 0 530,410 2,832,699
Total benefits and expenses 5,260,411 4,544,309 22,102,177
Profit before taxation 1,359,383 1,861,876 5,770,350 Taxation (272,432) (258,015) (884,785)
Profit for the year (total) 1,086,951 1,603,862 4,885,565
Attributable to:
Equity owners of the parent company (total) 1,035,174 1,442,986 4,390,112
- Profit for the year from continuing operations 1,035,174 1,426,283 4,687,267
- (Loss)/Profit for the year from discontinued operations 0 16,703 (297,155)
Non Controlling Interests (total) 51,777 160,876 495,453
- Profit for the year from continuing operations 51,777 152,568 593,451
- (Loss)/Profit for the year from discontinued operations 0 8,308 (97,998)
1,086,951 1,603,862 4,885,565
Earnings per share for profit attributable to
stockholders:
Basic $0.28 $0.38 $1.17
Fully diluted $0.28 $0.38 $1.16
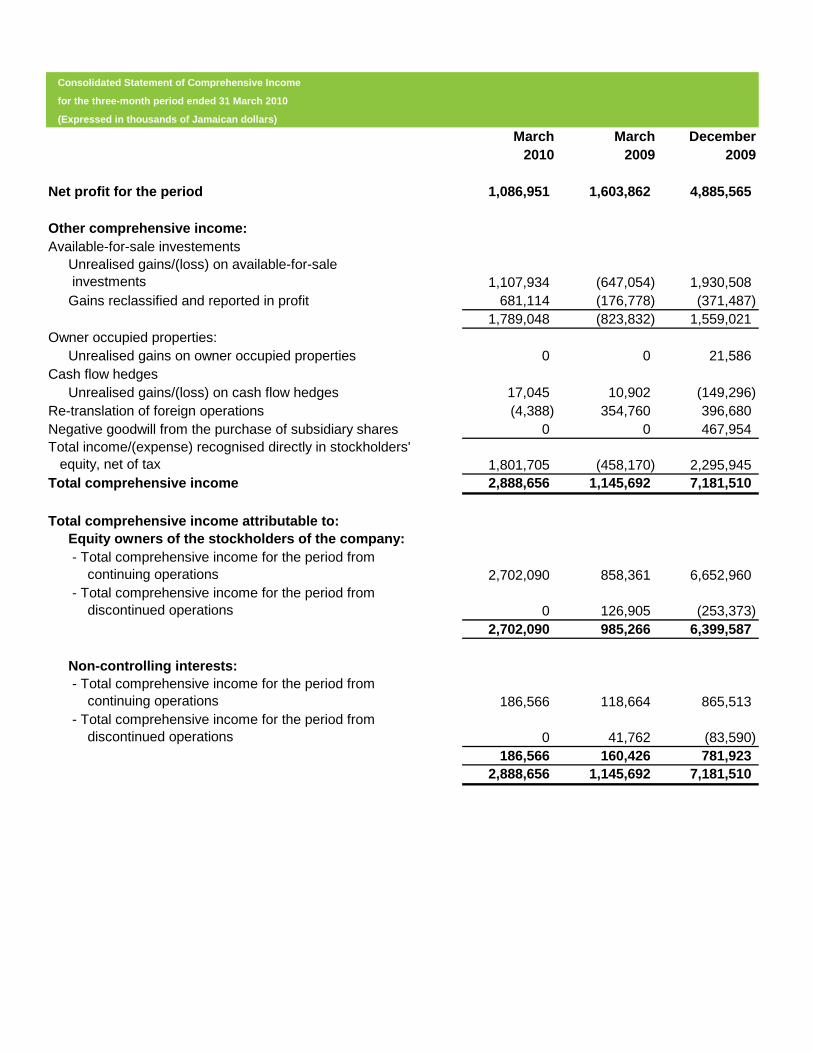
Consolidated Statement of Comprehensive Income
for the three-month period ended 31 March 2010
(Expressed in thousands of Jamaican dollars)
March March December
2010 2009 2009
Net profit for the period 1,086,951 1,603,862 4,885,565
Other comprehensive income:
Available-for-sale investements
Unrealised gains/(loss) on available-for-sale
investments 1,107,934 (647,054) 1,930,508
Gains reclassified and reported in profit 681,114 (176,778) (371,487)
1,789,048 (823,832) 1,559,021
Owner occupied properties:
Unrealised gains on owner occupied properties 0 0 21,586
Cash flow hedges
Unrealised gains/(loss) on cash flow hedges 17,045 10,902 (149,296)
Re-translation of foreign operations (4,388) 354,760 396,680
Negative goodwill from the purchase of subsidiary shares 0 0 467,954
Total income/(expense) recognised directly in stockholders'
equity, net of tax 1,801,705 (458,170) 2,295,945
Total comprehensive income 2,888,656 1,145,692 7,181,510
0
Total comprehensive income attributable to:
Equity owners of the stockholders of the company:
- Total comprehensive income for the period from
continuing operations 2,702,090 858,361 6,652,960
- Total comprehensive income for the period from
discontinued operations 0 126,905 (253,373)
2,702,090 985,266 6,399,587
Non-controlling interests:
- Total comprehensive income for the period from
continuing operations 186,566 118,664 865,513
- Total comprehensive income for the period from
discontinued operations 0 41,762 (83,590)
186,566 160,426 781,923
2,888,656 1,145,692 7,181,510
0 0.13 0.179819
0 0.133972 0.179819
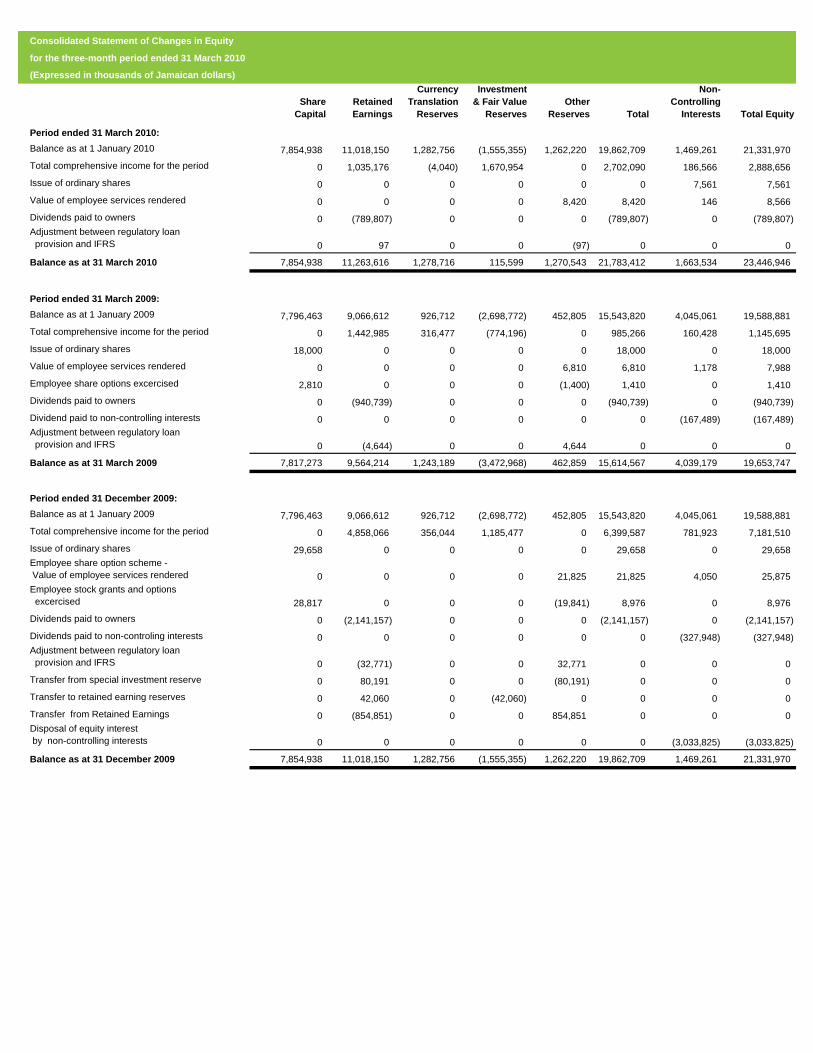
Consolidated Statement of Changes in Equity
for the three-month period ended 31 March 2010
(Expressed in thousands of Jamaican dollars)
Share
Capital
Retained
Earnings
Currency
Translation
Reserves
Investment
& Fair Value
Reserves
Other
Reserves Total
Non-
Controlling
Interests Total Equity
Period ended 31 March 2010:
Balance as at 1 January 2010 7,854,938 11,018,150 1,282,756 (1,555,355) 1,262,220 19,862,709 1,469,261 21,331,970
Total comprehensive income for the period 0 1,035,176 (4,040) 1,670,954 0 2,702,090 186,566 2,888,656
Issue of ordinary shares 0 0 0 0 0 0 7,561 7,561
Value of employee services rendered 0 0 0 0 8,420 8,420 146 8,566
Dividends paid to owners 0 (789,807) 0 0 0 (789,807) 0 (789,807)
Adjustment between regulatory loan
provision and IFRS 0 97 0 0 (97) 0 0 0
Balance as at 31 March 2010 7,854,938 11,263,616 1,278,716 115,599 1,270,543 21,783,412 1,663,534 23,446,946
Period ended 31 March 2009:
Balance as at 1 January 2009 7,796,463 9,066,612 926,712 (2,698,772) 452,805 15,543,820 4,045,061 19,588,881
Total comprehensive income for the period 0 1,442,985 316,477 (774,196) 0 985,266 160,428 1,145,695
Issue of ordinary shares 18,000 0 0 0 0 18,000 0 18,000
Value of employee services rendered 0 0 0 0 6,810 6,810 1,178 7,988
Employee share options excercised 2,810 0 0 0 (1,400) 1,410 0 1,410
Dividends paid to owners 0 (940,739) 0 0 0 (940,739) 0 (940,739)
Dividend paid to non-controlling interests 0 0 0 0 0 0 (167,489) (167,489)
Adjustment between regulatory loan
provision and IFRS 0 (4,644) 0 0 4,644 0 0 0
Balance as at 31 March 2009 7,817,273 9,564,214 1,243,189 (3,472,968) 462,859 15,614,567 4,039,179 19,653,747
Period ended 31 December 2009:
Balance as at 1 January 2009 7,796,463 9,066,612 926,712 (2,698,772) 452,805 15,543,820 4,045,061 19,588,881
Total comprehensive income for the period 0 4,858,066 356,044 1,185,477 0 6,399,587 781,923 7,181,510
Issue of ordinary shares 29,658 0 0 0 0 29,658 0 29,658
Employee share option scheme -
Value of employee services rendered 0 0 0 0 21,825 21,825 4,050 25,875
Employee stock grants and options
excercised 28,817 0 0 0 (19,841) 8,976 0 8,976
Dividends paid to owners 0 (2,141,157) 0 0 0 (2,141,157) 0 (2,141,157)
Dividends paid to non-controling interests 0 0 0 0 0 0 (327,948) (327,948)
Adjustment between regulatory loan
provision and IFRS 0 (32,771) 0 0 32,771 0 0 0
Transfer from special investment reserve 0 80,191 0 0 (80,191) 0 0 0
Transfer to retained earning reserves 0 42,060 0 (42,060) 0 0 0 0
Transfer from Retained Earnings 0 (854,851) 0 0 854,851 0 0 0
Disposal of equity interest
by non-controlling interests 0 0 0 0 0 0 (3,033,825) (3,033,825)
Balance as at 31 December 2009 7,854,938 11,018,150 1,282,756 (1,555,355) 1,262,220 19,862,709 1,469,261 21,331,970
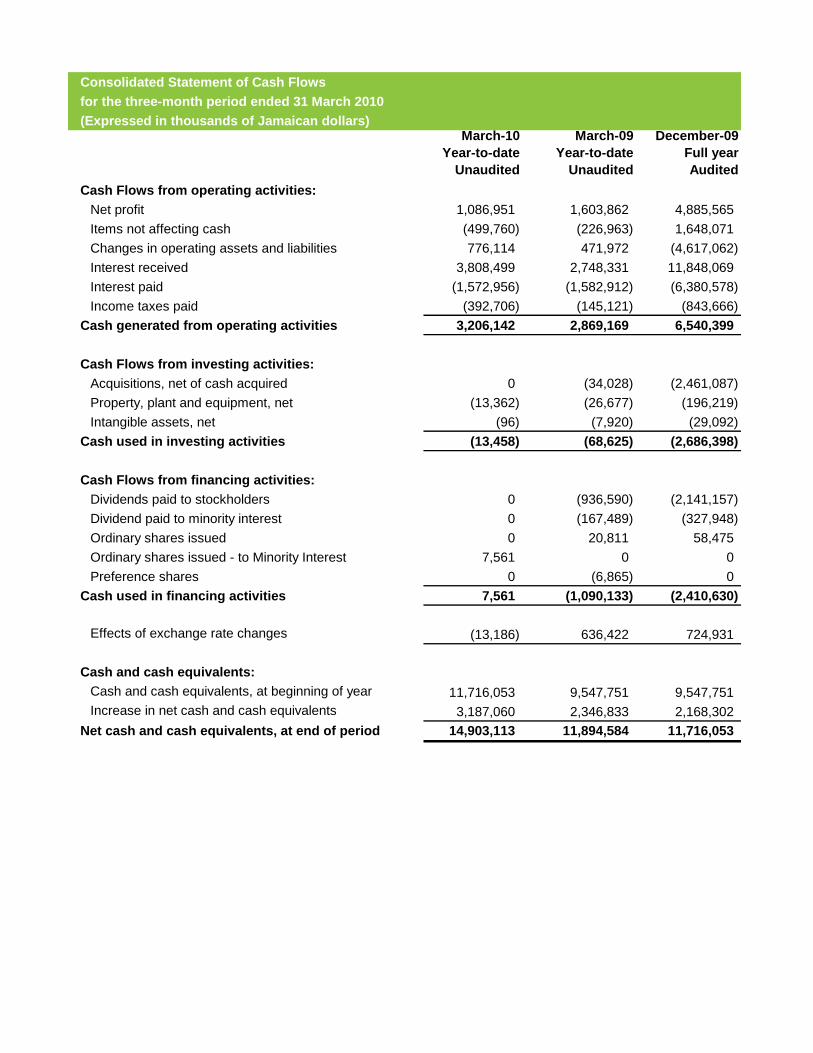
Consolidated Statement of Cash Flows
for the three-month period ended 31 March 2010
(Expressed in thousands of Jamaican dollars)March-10
Year-to-date
Unaudited
March-09
Year-to-date
Unaudited
December-09
Full year
Audited
Cash Flows from operating activities: 0.00 0.13 0.18
Net profit 1,086,951 1,603,862 4,885,565
Items not affecting cash (499,760) (226,963) 1,648,071
Changes in operating assets and liabilities 776,114 471,972 (4,617,062)
Interest received 3,808,499 2,748,331 11,848,069
Interest paid (1,572,956) (1,582,912) (6,380,578)
Income taxes paid (392,706) (145,121) (843,666)
Cash generated from operating activities 3,206,142 2,869,169 6,540,399
Cash Flows from investing activities:
Acquisitions, net of cash acquired 0 (34,028) (2,461,087)
Property, plant and equipment, net (13,362) (26,677) (196,219)
Intangible assets, net (96) (7,920) (29,092)
Cash used in investing activities (13,458) (68,625) (2,686,398)
Cash Flows from financing activities:
Dividends paid to stockholders 0 (936,590) (2,141,157)
Dividend paid to minority interest 0 (167,489) (327,948)
Ordinary shares issued 0 20,811 58,475
Ordinary shares issued - to Minority Interest 7,561 0 0
Preference shares 0 (6,865) 0
Cash used in financing activities 7,561 (1,090,133) (2,410,630)
Effects of exchange rate changes (13,186) 636,422 724,931
Cash and cash equivalents:
Cash and cash equivalents, at beginning of year 11,716,053 9,547,751 9,547,751
Increase in net cash and cash equivalents 3,187,060 2,346,833 2,168,302
Net cash and cash equivalents, at end of period 14,903,113 11,894,584 11,716,053
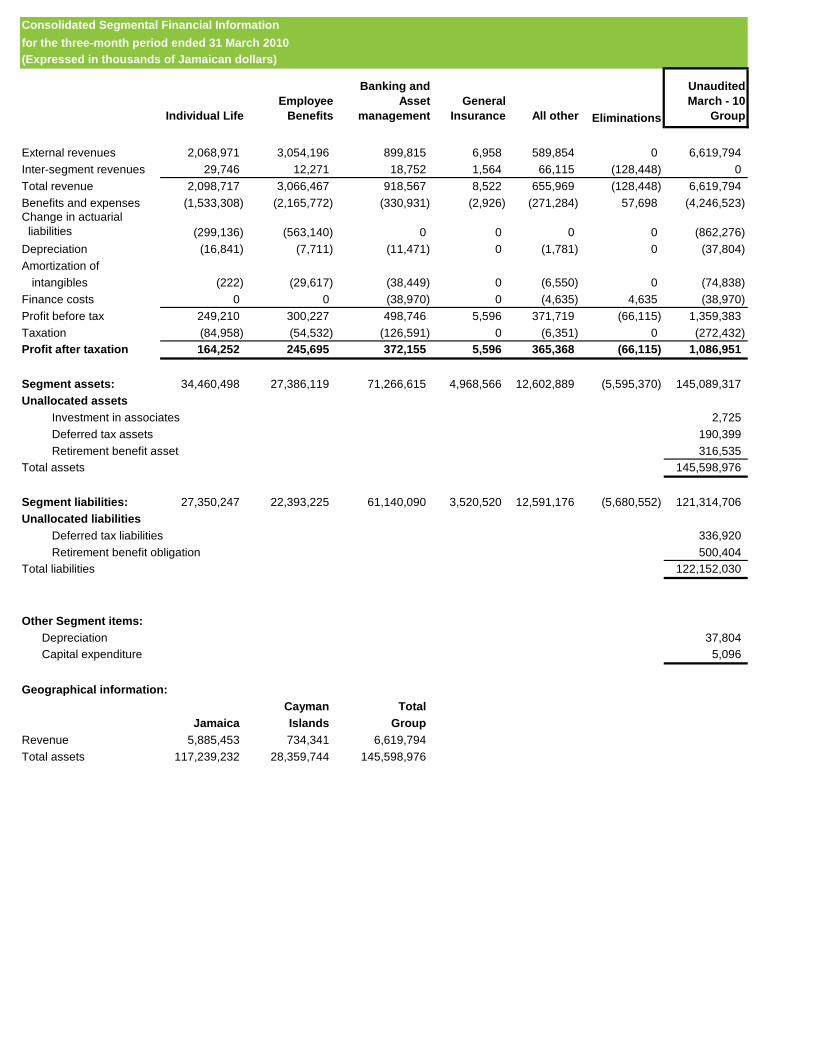
Consolidated Segmental Financial Information
for the three-month period ended 31 March 2010
(Expressed in thousands of Jamaican dollars)
Individual Life
Employee
Benefits
Banking and
Asset
management
General
Insurance All other Eliminations
Unaudited
March - 10
Group
External revenues 2,068,971 3,054,196 899,815 6,958 589,854 0 6,619,794
Inter-segment revenues 29,746 12,271 18,752 1,564 66,115 (128,448) 0
Total revenue 2,098,717 3,066,467 918,567 8,522 655,969 (128,448) 6,619,794 0
Benefits and expenses (1,533,308) (2,165,772) (330,931) (2,926) (271,284) 57,698 (4,246,523)
Change in actuarial
liabilities (299,136) (563,140) 0 0 0 0 (862,276) 0
Depreciation (16,841) (7,711) (11,471) 0 (1,781) 0 (37,804)
Amortization of
intangibles (222) (29,617) (38,449) 0 (6,550) 0 (74,838) 0
Finance costs 0 0 (38,970) 0 (4,635) 4,635 (38,970) 0
Profit before tax 249,210 300,227 498,746 5,596 371,719 (66,115) 1,359,383 0
Taxation (84,958) (54,532) (126,591) 0 (6,351) 0 (272,432) 0
Profit after taxation 164,252 245,695 372,155 5,596 365,368 (66,115) 1,086,951
Segment assets: 34,460,498 27,386,119 71,266,615 4,968,566 12,602,889 (5,595,370) 145,089,317
Unallocated assets
Investment in associates 2,725
Deferred tax assets 190,399
Retirement benefit asset 316,535
Total assets 145,598,976 (0.06)
Segment liabilities: 27,350,247 22,393,225 61,140,090 3,520,520 12,591,176 (5,680,552) 121,314,706
Unallocated liabilities
Deferred tax liabilities 336,920
Retirement benefit obligation 500,404
Total liabilities 122,152,030 (0.05)
Other Segment items:
Depreciation 37,804 0
Capital expenditure 5,096
Geographical information:
Cayman Total
Jamaica Islands Group
Revenue 5,885,453 734,341 6,619,794 0
Total assets 117,239,232 28,359,744 145,598,976 0
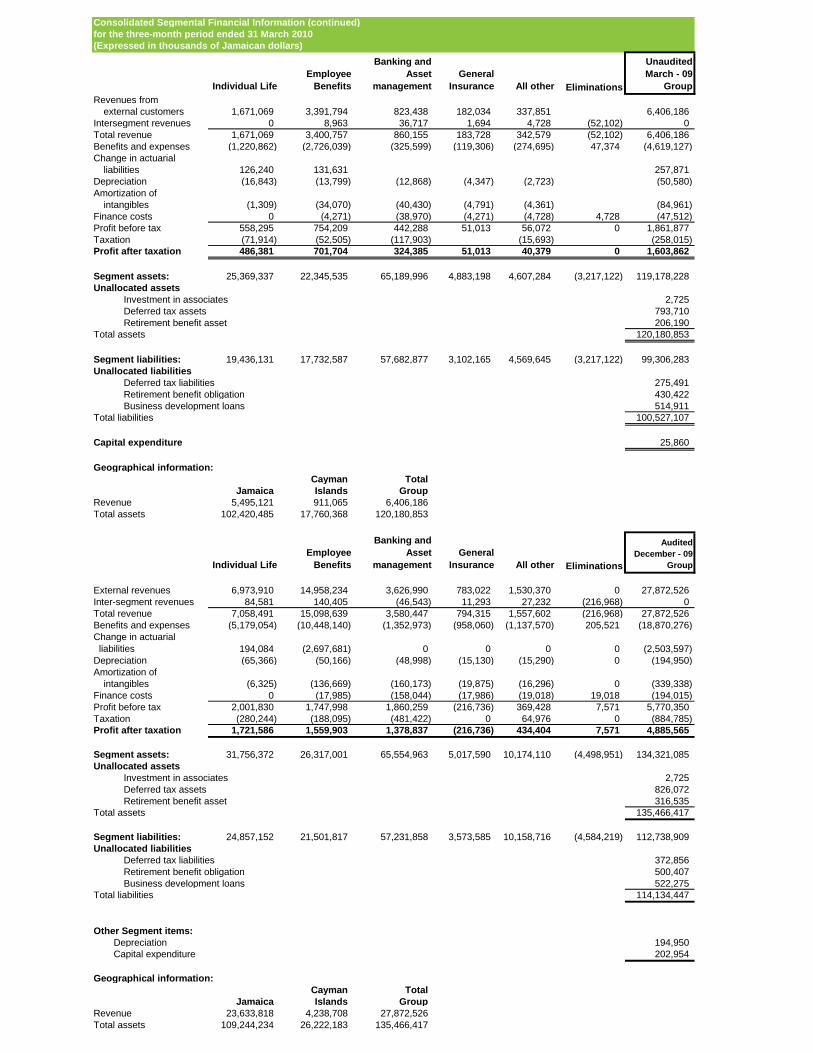
Consolidated Segmental Financial Information (continued)
for the three-month period ended 31 March 2010
(Expressed in thousands of Jamaican dollars)
Individual Life
Employee
Benefits
Banking and
Asset
management
General
Insurance All other Eliminations
Unaudited
March - 09
Group
Revenues from
external customers 1,671,069 3,391,794 823,438 182,034 337,851 6,406,186
Intersegment revenues 0 8,963 36,717 1,694 4,728 (52,102) 0
Total revenue 1,671,069 3,400,757 860,155 183,728 342,579 (52,102) 6,406,186
Benefits and expenses (1,220,862) (2,726,039) (325,599) (119,306) (274,695) 47,374 (4,619,127)
Change in actuarial
liabilities 126,240 131,631 257,871
Depreciation (16,843) (13,799) (12,868) (4,347) (2,723) (50,580)
Amortization of
intangibles (1,309) (34,070) (40,430) (4,791) (4,361) (84,961)
Finance costs 0 (4,271) (38,970) (4,271) (4,728) 4,728 (47,512)
Profit before tax 558,295 754,209 442,288 51,013 56,072 0 1,861,877
Taxation (71,914) (52,505) (117,903) (15,693) (258,015)
Profit after taxation 486,381 701,704 324,385 51,013 40,379 0 1,603,862
Segment assets: 25,369,337 22,345,535 65,189,996 4,883,198 4,607,284 (3,217,122) 119,178,228
Unallocated assets
Investment in associates 2,725
Deferred tax assets 793,710
Retirement benefit asset 206,190
Total assets 120,180,853
Segment liabilities: 19,436,131 17,732,587 57,682,877 3,102,165 4,569,645 (3,217,122) 99,306,283
Unallocated liabilities
Deferred tax liabilities 275,491
Retirement benefit obligation 430,422
Business development loans 514,911
Total liabilities 100,527,107
Capital expenditure 25,860
Geographical information:
Cayman Total
Jamaica Islands Group
Revenue 5,495,121 911,065 6,406,186
Total assets 102,420,485 17,760,368 120,180,853
Individual Life
Employee
Benefits
Banking and
Asset
management
General
Insurance All other Eliminations
Audited
December - 09
Group
External revenues 6,973,910 14,958,234 3,626,990 783,022 1,530,370 0 27,872,526
Inter-segment revenues 84,581 140,405 (46,543) 11,293 27,232 (216,968) 0
Total revenue 7,058,491 15,098,639 3,580,447 794,315 1,557,602 (216,968) 27,872,526
Benefits and expenses (5,179,054) (10,448,140) (1,352,973) (958,060) (1,137,570) 205,521 (18,870,276)
Change in actuarial
liabilities 194,084 (2,697,681) 0 0 0 0 (2,503,597)
Depreciation (65,366) (50,166) (48,998) (15,130) (15,290) 0 (194,950)
Amortization of
intangibles (6,325) (136,669) (160,173) (19,875) (16,296) 0 (339,338)
Finance costs 0 (17,985) (158,044) (17,986) (19,018) 19,018 (194,015)
Profit before tax 2,001,830 1,747,998 1,860,259 (216,736) 369,428 7,571 5,770,350
Taxation (280,244) (188,095) (481,422) 0 64,976 0 (884,785)
Profit after taxation 1,721,586 1,559,903 1,378,837 (216,736) 434,404 7,571 4,885,565
Segment assets: 31,756,372 26,317,001 65,554,963 5,017,590 10,174,110 (4,498,951) 134,321,085
Unallocated assets
Investment in associates 2,725
Deferred tax assets 826,072
Retirement benefit asset 316,535
Total assets 135,466,417
Segment liabilities: 24,857,152 21,501,817 57,231,858 3,573,585 10,158,716 (4,584,219) 112,738,909
Unallocated liabilities
Deferred tax liabilities 372,856
Retirement benefit obligation 500,407
Business development loans 522,275
Total liabilities 114,134,447
Other Segment items:
Depreciation 194,950
Capital expenditure 202,954
Geographical information:
Cayman Total
Jamaica Islands Group
Revenue 23,633,818 4,238,708 27,872,526
Total assets 109,244,234 26,222,183 135,466,417
Explanatory Notes
1. Basis of preparation
These condensed consolidated financial statements have been prepared in accordance with the accounting policies as set out in note 2 of the December 31, 2009 audited financial statements.
2. Assets classified as held for sale and discontinued operations
The assets and liabilities (and operating activity for the comparative periods) relating to Sagicor General Insurance (Cayman) Ltd. have been presented as held-for-sale, following approval of the Board of Directors to sell Sagicor’s controlling interest. On 23 February 2010, Sagicor Life of the Cayman Islands Ltd. entered into a Share Purchase Agreement with Bahamas First Holdings Limited to divest its 75.24% holding, effective 1 January 2010. Conditional regulatory approval was granted in April and full completion is expected to occur during May.