safeguarding derby’s - centre for cities
TRANSCRIPT

Derby: October 2010 1
Shifting Gears: Safeguarding Derby’s economic growth
Derby is part of the Centre for Cities’ Partner City research programme. The programme works closely with a small group of cities to inform economic development strategies and improve economic performance.
This report focuses on the broad question: How can Derby lock in its economic success, and widen access to the high-value economy? The report is divided into four sections:
• The extent and nature of Derby’s economic performance;
• The relationship between Derby’s sectoral strengths;
• The risks to Derby’s success and how this can be mitigated;
• Expanding on Derby’s success.
Executive summary
Over the last decade, Derby’s economy has performed solidly. It saw a 3.7 percent (3,200 jobs) increase in private sector employment from 1998 to 2008. Strikingly, average earnings for people working in Derby are the highest of any city outside London and the south east. Derby is a hub for highly skilled and highly specialised jobs for people living in surrounding areas and for Derby residents.
Much of Derby’s success is based on its strong manufacturing base, particularly the aerospace sector and, to a lesser extent, rail engineering. Rolls-Royce and Bombardier are vital employers in these sectors and their longstanding presence in the city suggests they are unlikely to move in the short to medium term. Derby’s success is less attributable to business start-ups, which are at a low level. This can be partly explained by the importance of large firms to the city’s economy.
The current economic climate poses a challenge to Derby’s economic performance. Cuts in public spending will affect jobs and businesses in Derby, for example in the rail sector. There is a need for the Council to understand and seek to mitigate the impact these changes are likely to have on the local economy.
An independent report by Centre for Cities October 2010 - Jonathan Seager & Andrew Carter
Percent employed in advanced manufacturing (2008)
Source: NOMIS 2010, Annual Business Inquiry, employee analysis, 2008 data
Derby9.5%
Derby9.5%Great Britain
1.2%

Derby: October 2010 2
Recommendations
Build on success and grow new opportunities
• Pursue an economic strategy that capitalises on existing strengths and is outward-looking and open to new opportunities, rather than focusing all attention on ‘doubling down’ on existing assets and strengths. The local enterprise partnership will be important to developing this approach.
• Focus on improving the wider business environment. Derby should focus on interventions to support business in general – skills, planning, transport and housing – working closely with the private sector to identify priorities.
• Target specific business support. Where they can be identified, support should go to high growth firms across different sectors.
• Encourage cross-sectoral exchanges: the local enterprise partnership should take a lead in facilitating contact between businesses and universities and supporting networks that promote cross-sectoral exchanges.
• Ensure that future residential developments are of a good quality and offer appropriate inside and outside space. This will help to attract and retain high-income residents and may require relaxing constraints on greenfield development.
• Use the council’s regeneration fund to help kick-start strategically important developments. This could be through direct investment or through providing enabling infrastructure to support development.
• Improve Derby’s cultural and leisure facilities and city centre in general to help the city to become a more attractive place to high-value, high-skilled workers.
Deal with risks
• Focus on the policy areas which it can realistically influence. Wider economic trends associated with globalisation, technological changes, and government cuts to public spending are all beyond Derby’s immediate ability to influence – although the Council can play a role in understanding and communicating their impact on Derby.
• Develop a strategy for dealing with the potential risks to the rail sector. Derby should plan for a number of scenarios, deciding what intervention is required, what resources are needed and what organisations should be involved.
Derby should
focus on
interventions to
support business
in general –
skills, planning,
transport and
housing
Derby: October 2010 3
1. Taken from Cities Outlook 2010, 2009 data.2. East Midlands Development Agency (2009) ‘Spatial Economy’, Chapter 10 in The East Midlands in 2009 report.3. Atherton A & Price L (2009) Secondary Centres of Economic Activity in the East Midlands, University of Lincoln: Enterprise Research and Development Unit
Defining Derby & its economy
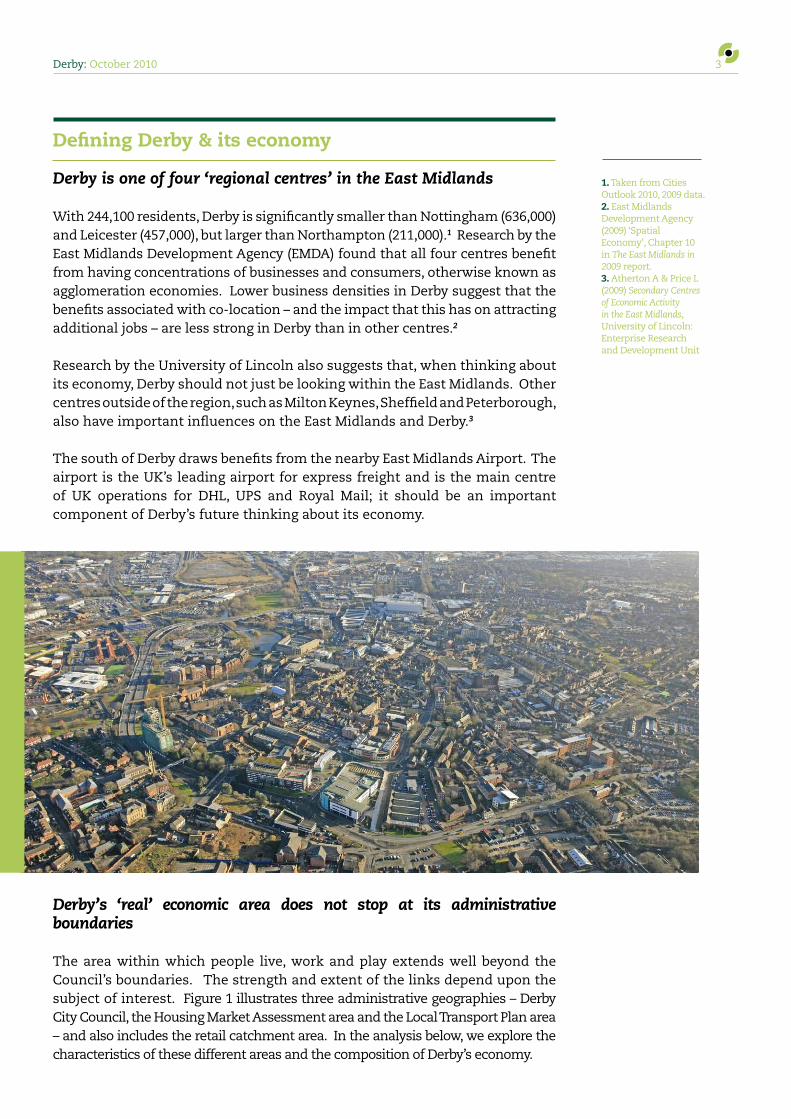
Derby is one of four ‘regional centres’ in the East Midlands
With 244,100 residents, Derby is significantly smaller than Nottingham (636,000) and Leicester (457,000), but larger than Northampton (211,000).1 Research by the East Midlands Development Agency (EMDA) found that all four centres benefit from having concentrations of businesses and consumers, otherwise known as agglomeration economies. Lower business densities in Derby suggest that the benefits associated with co-location – and the impact that this has on attracting additional jobs – are less strong in Derby than in other centres.2
Research by the University of Lincoln also suggests that, when thinking about its economy, Derby should not just be looking within the East Midlands. Other centres outside of the region, such as Milton Keynes, Sheffield and Peterborough, also have important influences on the East Midlands and Derby.3
The south of Derby draws benefits from the nearby East Midlands Airport. The airport is the UK’s leading airport for express freight and is the main centre of UK operations for DHL, UPS and Royal Mail; it should be an important component of Derby’s future thinking about its economy.
Derby’s ‘real’ economic area does not stop at its administrative boundaries
The area within which people live, work and play extends well beyond the Council’s boundaries. The strength and extent of the links depend upon the subject of interest. Figure 1 illustrates three administrative geographies – Derby City Council, the Housing Market Assessment area and the Local Transport Plan area – and also includes the retail catchment area. In the analysis below, we explore the characteristics of these different areas and the composition of Derby’s economy.

Derby: October 2010 4
Derby has strong commuter links with its immediate neighbouring authorities. Table 1 shows that in 2008 64 percent of Derby’s workforce lived in Derby, with a further 19 percent coming from the surrounding hinterland of South Derbyshire, Amber Valley and Erewash.
Table 1: In-commuters (>5.0%) to Derby 2008
Source: Neighbourhood Statistics 2010, Annual Population Survey, 2008 data
% of Derby workforce
Derby 63.6%
South Derbyshire 8.6%
Amber Valley 5.3%
Erewash 5.3%
Figure 1: Variable extent of Derby’s real economic area
Source: Derby City Council 2010.
Proposed extent of Functional Economic Area for Derby’s Economic Assessment
Derby
Housing Market Assessment AreaRetail CatchmentArea
Local Transport Plan Area
However, reflecting Derby’s size and its relatively limited ‘economic pull’, the level of in-commuting to Derby is significantly below the East Midlands’ other regional centres. In 2004,4 there were 51,560 in-commuters into Derby (41.2 percent of the workforce), compared with 92,100 into Leicester (49.1 percent) and 120,120 into Nottingham (58.1 percent).5
Recently there has been interest in the economic benefits of capitalising on the skills and businesses located in the three largest economic centres in the East Midlands – Nottingham, Leicester and Derby – by making the most of commuting between them. However, commuting links between the East Midland cities are relatively weak. In 2008 1.4 percent of Derby’s workforce commuted from Nottingham, and 1.5 percent of Nottingham’s workforce commuted from Derby. In fact, Nottingham seems to have become even less reliant on Derby residents over time – in 2001 two percent of Nottingham’s workforce commuted from Derby.6
4. No absolute values available for 2008.5. Annual Population Survey, 2004 data6. Neighbourhood Statistics 2010, Annual Population Survey 2008

Derby: October 2010 5
Figure 2: Geographies of Derby used
Amber Valley
Erewash
Derby UA
South Derbyshire
Derby
Derby & itshinterland
For the purposes of this report, the following geographies are used:
• Derby, constituting the Derby City Council area over which the Council has responsibility and most powers; and
• Derby plus its hinterland, including the areas with which labour market links are strongest – South Derbyshire, Amber Valley and Erewash.

Derby: October 2010 6
1. What is the extent and nature of Derby’s economic performance?
Cities Outlook 2010 showed Derby to be a mid-ranking city on most economic indicators
Derby performs strongly in terms of workplace earnings
In 2009 resident earnings (£466) ranked the city 16th out of the UK’s 64 cities. This performance gets even stronger when we look at the earnings of people working in Derby, rather than those living there. At £644, Derby had the fifth highest average workplace based earnings of English cities.
Relative performance of Derby as a local authority also appears to be improving. In 1998, Derby was ranked as the 57th highest earning local authority in England compared to 44th in 2009. There was also a slight improvement with regards to Derby’s performance compared to the GB average; in 1998 workplace based wages in Derby were eight percent above the GB average, in 2009 they had risen to nine percent above the GB average.7
Derby experienced net employment growth from 1998 to 2008
During the period 1998 to 2008, Derby’s net additional job creation was 6,100. In line with national trends, employment growth was spread over a number of sectors, with real estate & business activities adding 5,200 jobs (see Figure 3). Manufacturing was the largest source of job loss, shedding 4,200 jobs, (3.5 percent of Derby’s 2008 workforce). However, this decline was less than half the national rate, suggesting that there were local factor conditions that made Derby’s manufacturing firms more resilient.
Table 2: How Derby fared in Cities Outlook 2010
Source: Cities Outlook 2010Note: Earnings are for full and part-time residents, as in Cities Outlook. Other sources use just full-time earnings.
Derby Great Britain Ranking
% of working age population 72.8% 73.9% 31/64
in employment (2009)
Rate at which the number of -0.6% 1.2% 39/64
jobs increased (2006-08)
Private sector employment growth 3.7% 4.9% 31/63
as % of 2008 jobs (1998-2008)
Business births per 32.6 44.4 41/64
10,000 population (2008)
Business churn per 1.1 2.2 47/64
10,000 population (2008)
Average weekly £466 £484 16/64
earnings - resident (2009)
% of working age population 14.4% 12.4% 39/63
with no qualifications (2008)
% of working age population 26.7% 29.0% 28/64
with NVQ4+ (2008)
Increase in JSA claimants 2.3% 1.9% 41/64
(Feb 2008-Nov 2009)
7. NOMIS 2010, Annual Survey of Hours and Earnings, workplace analysis, 1998 and 2009 data

Derby: October 2010 7
Figure 3: Employment change in Derby (1998-2008)
Source: NOMIS (2010), Annual Business Inquiry, workplace analysis, 1998, 2005, 2006 and 2008 data. Employment change calculated as sum of changes between 1998-2005 and 2006-2008, due to methodological changes.Note: This chart shows only those sectors where net job change was above 200 people.
-6,000 -4,000 -2,000 0 2,000 4,000 6,000
Manufacturing
Transport, storage & communication
Construction
Hotels & restaurants
Public administration & defence
Financial intermediation
Wholesale & retail
Health & social work
Real estate & business activities
Employment change (1998-2008)
Continuing importance of manufacturing
Compared to the national average (see Table 3), Derby has higher levels of employment in manufacturing, energy and water and the public sector. Derby has a relatively low concentration in banking, finance and other services, lower than Leicester or Nottingham and roughly equal to Sheffield. Compared to Derby, the concentration of manufacturing is even stronger in the wider Derby hinterland – at more than twice the national level. In fact, all three of Derby’s neighbouring authorities are in the top decile of districts in terms of manufacturing employment.
Table 3: Location Quotients (>1 means above GB average) (2008)
Source: NOMIS (2010), Annual Business Inquiry, workplace analysis, 2008 data
Derby & Derby hinterland
Agriculture 0.18 0.50
Energy & water 1.11 0.73
Manufacturing 1.82 2.18
Construction 0.86 1.11
Distribution, hotels & restaurants 0.86 0.89
Transport & communications 0.71 0.80
Banking, finance & insurance 0.86 0.71
Public admin, education & health 1.06 0.96
Other services 0.77 0.77
8. This research uses the Eurostat definition of advanced and ‘non-advanced’ manufacturing.
Within the manufacturing sector, Derby has a particularly high concentration of ‘advanced manufacturing’ employment (Figure 4).8 9.5 percent of the Derby’s total workforce is employed in the advanced manufacturing sector.

Derby: October 2010 8
Figure 4: Percent employed in advanced and non-advanced manufacturing in Derby (2008)
Source: NOMIS 2010, Annual Business Inquiry, employee analysis, 2008 data
GB Derby
0% 2% 4% 6% 8% 10%
Advanced manufacturing
Non
-adv
ance
d m
anu
fact
uri
ng
0%
5%
10%
15%
20%
Figure 5: Levels of manufacturing employment across Derby and its hinterland (2008)
Source: NOMIS 2010, Annual Business Inquiry (2008 data), employee analysis, numbers per MSOA. Distribution of area statistics slightly adjusted based on further spatial analysis. Note: For data protection reasons we are unable to provide the corresponding number of employees to the concentration of colour.
Amber Valley
ErewashDerby UA
South Derbyshire
Low
High
Levels of manufacturing employment
Low
High
Across the wider Derby area, there is evidence of more diverse manufacturing strength. Figure 5 below maps the number of employees working in manufacturing across Derby and its hinterland. The darker areas have large numbers of manufacturing employees and so are the centres of manufacturing employment, while the lighter areas have less manufacturing employment.
Derby: October 2010 9
Given the long-term employment trends of the sector, the concentration of manufacturing, particularly non-advanced, may present challenges in the future. Particularly when this concentration is coupled with lower levels of employment in the ‘higher value’ sectors such as banking, finance and other services which can generate productivity as well as employment.9
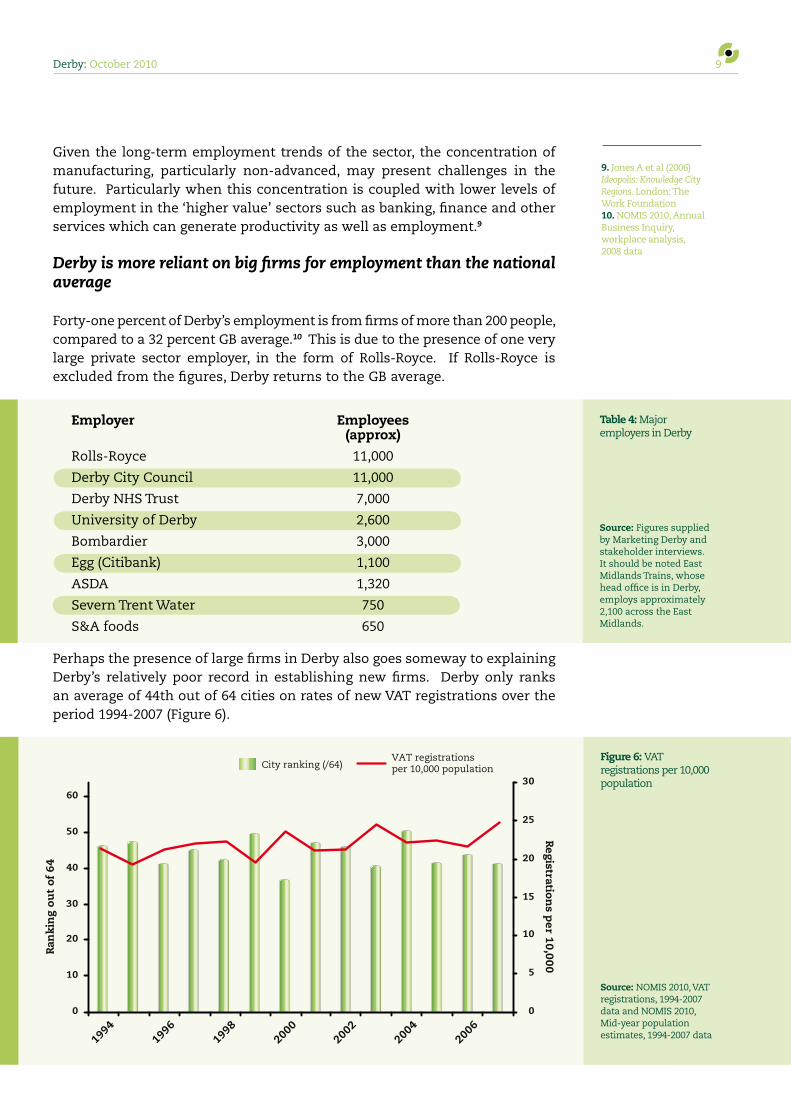
Derby is more reliant on big firms for employment than the national average
Forty-one percent of Derby’s employment is from firms of more than 200 people, compared to a 32 percent GB average.10 This is due to the presence of one very large private sector employer, in the form of Rolls-Royce. If Rolls-Royce is excluded from the figures, Derby returns to the GB average.
9. Jones A et al (2006) Ideopolis: Knowledge City Regions. London: The Work Foundation10. NOMIS 2010, Annual Business Inquiry, workplace analysis, 2008 data
Table 4: Major employers in Derby
Source: Figures supplied by Marketing Derby and stakeholder interviews. It should be noted East Midlands Trains, whose head office is in Derby, employs approximately 2,100 across the East Midlands.
Perhaps the presence of large firms in Derby also goes someway to explaining Derby’s relatively poor record in establishing new firms. Derby only ranks an average of 44th out of 64 cities on rates of new VAT registrations over the period 1994-2007 (Figure 6).
Figure 6: VAT registrations per 10,000 population
Source: NOMIS 2010, VAT registrations, 1994-2007 data and NOMIS 2010, Mid-year population estimates, 1994-2007 data
0
10
20
30
40
50
60
1994
1996
1998
2000
2002
2004
2006
Ran
kin
g ou
t of
64
0
5
10
15
20
25
30
Registration
s per 10,000
City ranking (/64)VAT registrations per 10,000 population
Employer Employees (approx)
Rolls-Royce 11,000
Derby City Council 11,000
Derby NHS Trust 7,000
University of Derby 2,600
Bombardier 3,000
Egg (Citibank) 1,100
ASDA 1,320
Severn Trent Water 750
S&A foods 650

Derby: October 2010 10
Given that most new enterprises are likely to be in the ‘knowledge economy’ sectors – creative, digital, ICT, etc – Derby’s low rates of enterprise activity could be holding back the restructuring of the city’s economy. Enterprise and entrepreneurship is important for urban success and economic growth. One of the reasons for this is that new enterprises out-compete existing firms, reallocating resources from old, less productive uses to new, more productive uses.11
Income earned in Derby ‘leaks’ out to its hinterland
Cities offer strong advantages for production, with city centres tending to be more productive places for firms to locate. Many people, however, would rather live in the less dense hinterland and commute in to the centre. This is reflected in the hinterlands around Derby. In places such as South Derbyshire, Rushcliffe and Derbyshire Dales residents earn more than local workers. In the Derbyshire Dales in particular residents earned an average 70 percent more than local workers in 2009.12
In general, those on higher earnings are willing and able to commute further. For instance, 51 percent of professional jobs in Derby are filled by non-Derby residents, compared to 16 percent in elementary occupations.13 Research by Experian estimates that 61 percent of the employment income generated in Derby is earned by Derby residents, with the balance being earned by employees who live elsewhere. This compares to 50 percent in Leicester and 40 percent in Nottingham.14
Derby has a two tier workforce
Despite the presence of Rolls-Royce and other leading edge companies in the city, the percentage of Derby’s residents qualified to degree level or higher is below the GB average. 26.3 percent of Derby’s residents are educated to degree level or higher while 18.3 percent have no qualifications. This ratio of 1.4 compares to a GB average of 2.4. As Table 5 shows, skill levels are slightly higher in Derby’s hinterland, particularly in South Derbyshire. This is likely to reflect the attractiveness of South Derbyshire as a place to live rather than it having a considerably better education system.
11. For a discussion see: Glaesar E, Rosenthal S & Strange W (2009) Urban economics and entrepreneurship, NBER Working Paper 1553612. NOMIS, 2010, Annual Survey of Hours and Earnings, resident and workplace analysis, 2009 data13. Experian (2007) Commuting flows in the East Midlands, Figure 7.1714. Experian (2007) Commuting flows in the East Midlands, Figure 7.17
Table 5: Working age qualifications (2009)
Source: NOMIS 2010, Annual Population Survey, residents analysis, 2009 (Jan-Dec) data
Degree level qualifications No (NVQ4+) qualifications Ratio
Derby 26.3% 18.3% 1.4
Amber Valley 27.8% 12.4% 2.2
Erewash 21.9% 12.2% 1.8
South Derbyshire 32.7% 7.5% 4.4
Derby wide 26.9% 14.0% 1.9
Great Britain 29.9% 12.3% 2.4

Derby: October 2010 11
In responding to the skills issue, it is often thought that matching skills training for those in education to the requirements of large employers in an area is a good thing to do.15 This approach, however, does not always prove successful. Orientating training to more generic skills, and therefore less specific, often provides those looking for employment with a wider skills base, which is often augmented by large employers through their own specific training schemes.
In the case of Rolls-Royce it has sufficient scale to undertake its own in-house training as part of its apprenticeship and graduate programmes. Most rail engineering firms, however, are smaller and less able to provide in-house training.
A recent Skills Audit by the UK Commission for Employment and Skills identified that transport equipment manufacture was the sector with the second largest skills deficit – at the national level – in the economy.16 The proposed National Skills Academy for Rail Engineering (see Box 1) will have an important role in addressing these skills deficits and helping Derby’s rail companies prepare for the future.
National Skills Academy for Rail Engineering
Prior to the general election, a group of leading railway organisations received provisional approval for the creation of a National Skills Academy for Rail Engineering (NSARE). One of the Centre’s regional offices is due to be located in Derby. The Academy is currently in the business planning stage and was due to submit its plans for approval in September, although it is also waiting for clarification from the new government about its funding. The Academy would have five tasks:
1. Forecasting skills
2. Giving accreditation to advisors / trainers
3. B2B – helping SMEs to link into local training opportunities
4. Standardisation of training course content
5. Promotion of the industry.17
University of Derby currently has a limited role in driving economic growth and innovation
Universities have an important role to play in driving economic growth and innovation. However, analysis of data from the Higher Education Business and Community Interaction Survey (HE-BCI) shows that the University of Derby has a comparatively small role in commercial research and development.18 This does not suggest under-performance rather it reflects that the university, compared to national standards, is not a leading research-based institution.
From 2004 to 2008, the total value of the University of Derby’s research contracts with businesses was £103,000. This figure is small compared to other universities. For example, during the same period the University of Reading generated almost £12.9 million from research contracts with business.
15. Webber C & Larkin K (2009) Growing by degrees? High Skilled Workers in Liverpool, London: Centre for Cities.16. UK Commission for Employment and Skills (2010) Skills for Jobs: Today and Tomorrow, Volume 1.17. See www.riagb.org.uk/nsare.htm and www.riagb.org.uk/docs/NSARE%20brochure.pdf18. HEFCE (2005, 2006, 2007, 2008) Higher Education Business Community Interaction survey, www.hefce.ac.uk/econsoc/buscom/hebci/
Box 1: National Skills Academy for Rail Engineering
Derby: October 2010 12
Similarly, in terms of developing new businesses and spin-offs, the University of Derby has had limited success. For example, from 2004 to 2008, the University of Derby generated five spin-offs from its research, whilst over the same period the University of Portsmouth generated 27 spin-offs.
In terms of consultancy, the University of Derby fares better. From 2004 to 2008 it delivered consultancy to businesses to the value of £1,630,000, which is respectable for a university of its size (placing Derby 29th out of 40 university cities). 54 percent of the consultancy contracts were based in the East Midlands region, which suggests that even though the university is not well-resourced for commercial research, it offers significant other support services to businesses in the region. Derby should work with the University to further develop and enhance its role in supporting businesses.

Derby: October 2010 13
2. The relationship between Derby’s sectoral strengths
Section One highlighted the extent and nature of Derby’s success. It is clear that much of this success can be attributed to aerospace and rail. In Section Two, we explore both of these sectors in more detail (and also touch on the automotive industry). We consider the extent to which the sectors are embedded in the economy and what this means for Derby.
Aerospace
Derby has an extraordinary concentration of ‘advanced manufacturing’. 9.5 percent of Derby’s total workforce is employed in the advanced manufacturing sector. However, if you exclude employment in aerospace manufacturing – which is predominantly comprised of Rolls-Royce – Derby’s manufacturing profile is almost identical to the national average (Figure 7).
Figure 7: Percent of total employment employed in advanced and non-advanced manufacturing in Derby with and without aerospace (2008)
Source: NOMIS 2010, Annual Business Inquiry, employee analysis, 2008 data
Derby without Rolls-Royce
GB Derby
0% 2% 4% 6% 8% 10%
Advanced manufacturing
0%
5%
10%
15%
20%
Non
-adv
ance
d m
anu
fact
uri
ng
Rolls-Royce is central to Derby’s economic prosperity. The Derby site is the firm’s largest in the UK, accounting for 11,000 employees, around half of its UK workforce. The company operates across four sectors: civil aerospace, defence aerospace, marine and nuclear. Rolls-Royce’s Derby site is predominantly focused on civil aerospace and also contains the majority of the company’s corporate staff. The total value of the company’s direct impact on the city is estimated at some £3.1 billion.19
The local impact of Rolls-Royce goes beyond its own activities. There are indirect impacts resulting from purchases of inputs from local suppliers and induced impacts, which arise from Rolls-Royce’s employees own purchases in the city.20 A report by URS estimates the indirect and induced impacts at an additional £1.5 billion and 5,200 jobs, based on multipliers from other studies.
19. URS (2009) Planes, Trains and Automobiles. Derby City Council: URS; Personal correspondence with Rolls-Royce and 2009 Rolls-Royce Annual Report20. URS (2009) Planes, Trains and Automobiles. Derby City Council: URS Table 8

Derby: October 2010 14
Rolls-Royce is also an important source of new employment for Derby school leavers, taking on 56 apprentices in 2010. The company also recruited around 38 graduates for its Derby businesses in 2010.21 However it is important to remember that global companies such as Rolls-Royce recruit from a global pool of talent and the percentage of local school leavers and graduates who join the firm will always be relatively small.
Table 6: Direct, indirect and induced impacts
Source: URS (2009)
Sector: Planes
Measure Output (£bn) Employment
Direct Impact 3,055 10,399
Indirect & induced impacts 1,528 5,200
Total Impact 4,583 15,599
Rail
Derby’s rail engineering cluster is the largest in the UK. A mapping report for Derby and Derbyshire Rail Forum highlighted three top-level segments of the industry: traction and rolling stock; infrastructure; and specialists.22 2,500 people are employed in either railway engineering or running the railway.23 Stakeholders interviewed during this research were of the view that this understates its true extent and the fact that Bombardier alone employs around 3,000 people seems to confirm that.24
Most important for Derby is the new-build sector which is centred on Bombardier. Train production has been taking place on its site, under varied ownership, since 1876.25 Bombardier estimates that on a typical project, approximately one-third of its suppliers are based in Derby, one-third are from elsewhere in the UK and one-third are from overseas. Whilst there has been some export work, the majority of its production is for the UK market.26
A report by URS estimates the indirect and induced impacts at an additional £1 billion and 3,500 jobs.
In addition to Bombardier there are many other rail-related firms in Derby. Among the largest are: the headquarters of one of the companies that own and lease rolling stock (ROSCOs); Network Rail; and Interfleet (a technical rail consultancy).
23. NOMIS 2010, Annual Business Inquiry, employee analysis, 2008 data. SIC codes 3520 and 6010. For disclosure reasons we cannot cite data for individual SIC codes for Derby.24. For the Planes, Trains & Automobiles research, the ABI data was supplemented with information from a supplier database. URS estimated that 5,010 people are employed either directly in the rail sector, or in the supply chain. The indirect and induced impact is estimated at an additionally 3,500 jobs.25. Bombardier in the UK (2009) The Climate is Right for Trains.26. Stakeholder interview with Bombardier
21. Personal correspondence with Rolls-Royce22. Waterman R (2009) Mapping of the elements of the rail sector supply chain in the East Midlands and identifying the main innovation drivers. Derby and Derbyshire Rail Forum.
Table 7: Direct, indirect and induced impacts
Source: URS (2009)
Sector: Trains
Measure Output (£bn) Employment
Direct Impact 1,542 5,010
Indirect & induced impacts 1,080 3,507
Total Impact 2,622 8,517

Derby: October 2010 15
Auto
The auto industry is also important to Derby – and not just in terms of manufacturing. Toyota has a major plant in Burnaston, South Derbyshire, just beyond the Derby boundary, which directly employs around 3,500 people.27 Toyota has recently announced that it will build the first mass-produced fully hybrid vehicle in Europe, the Auris Hybrid at Burnaston. This will safeguard at least 400 jobs at the plant.28
Whilst Toyota has a global supply chain, its reliance on just-in-time techniques gives an advantage to firms located nearby. A number of suppliers are located in Derby and Derbyshire.
However it is important to note that the bulk of the automotive sector in Derby is not focused on manufacturing: 93.4 percent is accounted for by services – new car sales, renting and repair.29
Do the strengths in these sectors reinforce each other?
Reviewing the evidence from the URS report there appears to be limited observable linkages between the three sectors. Derby and its hinterland have strengths in three transport technologies – trains, aerospace and automobile. Given this it is natural to ask whether they benefit from their proximity with each other. Economic theory would suggest that proximity would enable the three industries to share specialised inputs; to improve the matching of employees and employers; and to learn from each other, through knowledge spillovers.30
The sharing of specialised inputs does not appear to be particularly important. The URS report finds little evidence of networking or purchasing between the three sectors and only limited interaction between the supply chains of the three sectors.31 With regard to the matching of employees and employers, anecdotal evidence suggests that this does occasionally occur, with movement of workers between the three sectors, particularly in areas such as project management. It is also worth noting that Rolls-Royce and Bombardier share resources for their respective apprentice schemes.32 In relation to the existence of knowledge spillovers between the sectors again the URS report found little evidence.
27. URS (2009) Planes, Trains and Automobiles. Derby City Council: URS28. www.bbc.co.uk/news/1043331529. NOMIS 2010, Annual Business Inquiry, employee analysis, 2009 data30. Duranton G & Puga D (2004) ‘Microfoundations of urban agglomeration economies’ in Henderson JV & Thisse JF (eds.) Handbook of Regional and Urban Economics, Vol. 4. Amsterdam: NorthHolland31. URS (2009) Planes, Trains and Automobiles. Derby City Council: URS32. Stakeholder interviews with Bombardier and Rolls-Royce

Derby: October 2010 16
Figure 8: Manufacturing employment in aerospace and rail
Source: NOMIS 2010, Annual Business Inquiry, employee analysis, 2008 data. Aerospace manufacturing SIC code 3530 and rail manufacturing SIC code 3520.
Derby
0%
5%
10%
15%
20%
25%
0.0% 0.5% 1.0% 1.5% 2.0%
Rail (SIC 3520)
Aer
o (S
IC 3
530)
One further way to explore the linkages between the sectors is to look at the geographical location of aerospace and rail manufacturing employment in the UK. This shows (Figure 8) that Derby is an outlier – very few other locations have both a concentration of rail and aerospace manufacturing. There is a similar lack of geographic location relationship between the two sectors and vehicle manufacturing. This could suggest that whilst there may be some benefits derived from co-location they are likely to be weak and only have marginal benefits for the individual companies.
The co-location of the aerospace and rail industries in the city is for historical reasons mainly due to Derby’s geographical location in the middle of England, a place from which markets across the UK and overseas can be easily reached. This suggests that any policy driven attempts to encourage greater interaction and linkages between the two sectors are likely to have limited impact.

Derby: October 2010 17
33. Hartley K (2010) ‘UK Aerospace Industry’, Chapter 6 in: Department of Business, Innovation and Skills (BIS) (2010) Learning from some of Britain’s successful sectors, Economics Paper 6.34. Leunig T & Tennent KD (2010) ‘Decline and fall: a history of UK post-war textile production’, Chapter 4 in: BIS Economics Paper 6.35. Swinney P, Webber C & Larkin K (2010) Firm Intentions: Cities, Private Sector Jobs and the Coalition, London: Centre for Cities36. Table 6.4 in: Hartley, K. (2010) ‘UK Aerospace Industry’ Chapter 6 in: Department of Business, Innovation and Skills (BIS) (2010) Learning from some of Britain’s successful sectors, Economics Paper 6.
3. What are the risks to Derby’s future success?
Derby has enjoyed a relatively strong economic performance in the last decade, particularly for a city with a large manufacturing presence. To continue its strong performance, it will have to be able to adapt to changes in the economy. In this section, we identify a number of possible risks that could face Derby in the future. These are:
• Reliance on Rolls-Royce;• Decline in government rail investment;• Decline in public sector employment.
The recommendations in section four suggest actions which could be taken to mitigate and manage these risks.
Reliance on Rolls-Royce and the aerospace industry
The presence of Rolls-Royce is a major asset for Derby and an opportunity for its future. However, its central importance is in itself a risk. There are numerous examples – MG Rover car plant in Longbridge in 2005 and the part mothballing of production at the Corus steel plant in Teesside in February 2010 – of other single-industry or single-firm towns that have suffered in the wake of an economic shock to its major employer.
There are a number of possible risks for Rolls-Royce that if realised could have major negative impacts on the city. The first risk is changes in government policy. Historically, government policy has had a significant effect on the structure and success of the civil aviation industry.33 Government has been a major customer for and investor in the industry which in the current fiscal environment is likely to be severely constrained or stopped altogether.
The second risk is the relocation of jobs and activity to lower-wage economies. This threat poses greater danger to the non advanced parts of the manufacturing industry which has implications for Derby and in particular its hinterland where there is a greater concentration of non-advanced manufacturing activity. In reality given that much of Rolls-Royce’s activities in Derby are in advanced manufacturing and involve the use of cutting edge technology and management practices and are thus less susceptible to cost saving pressures this should protect Derby in the medium term.34
The third risk is a speeding up of the decline in employment due to technological changes. Manufacturing is much more amenable than services to the replacement of labour with capital equipment. As a result, the recent history of manufacturing in the UK has been one of increasing labour productivity and reduced employment.35 The aerospace industry is a good example of this trend. Employment has been steadily falling since World War Two, despite the UK’s continuing success in the industry. For example, there were 291,335 people employed in the aerospace industry in 1960 but by 2008 this reduced to 100,740.36

Derby: October 2010 18
If, as seems likely, this trend continues in the future even successful firms and industries will support fewer jobs (even if each job is more highly paid). In the round, this is a good thing - productivity is the fundamental driver of higher living standards – but there will clearly be costs to individual workers.
Despite these risks, the overall outlook for Derby’s aerospace sector is positive, for a number of reasons:
• The global market for civil aerospace looks fairly robust, with solid growth forecast in the medium-term;37
• Established players in the civil aerospace industry are protected by the large economies of scale that act as a formidable barrier to entry;38 and
• Rolls-Royce is a leading company in this industry and for historical and company structure reasons (Derby is Rolls-Royce’s largest UK site) is heavily embedded in the city.
Whilst the Council is unable to influence the global trends that affect the industry the city should continue to remain responsive to the needs of the industry and in particular Rolls-Royce.
Decline in government rail investment
Derby’s rail engineering sector is highly reliant on the UK new-build market and will be directly affected by government investment decisions. In June, the emergency Budget announced sharp reductions in government expenditure, including a commitment to adopt the previous government’s plans to cut capital expenditure by one-third over the parliament.39 Spending cuts will directly reduce final demand for new trains, as well as the scope for support to specific sectors, whether through research & development and technology policy or financial aid.
Whilst the industry has always experienced peaks and troughs in terms of investment, these have been magnified by the decision of the UK government to parcel up rolling stock orders into very large single orders. There are currently two major orders in the pipeline, Thameslink and Crossrail. Bombardier is one of two companies shortlisted for the Thameslink contract.40 Failure to win either of these would undoubtedly have serious consequences for Bombardier and for Derby’s rail industry.
Clearly the rail sector in Derby is not about to collapse but it would be prudent for Derby to consider how a decline in employment in this sector could be dealt with in the short and medium term. Lessons learned from the collapse of the MG Rover plant in Longbridge show the value of early preparation and intervention and concerted support around re-training (See Box 2).
37. Hartley K (2010) ‘UK Aerospace Industry’, Chapter 6 in: Department of Business, Innovation and Skills (BIS) (2010) Learning from some of Britain’s successful sectors, Economics Paper 6.38. Chapter 4 in: World Bank (2008) World Development Report 2009: Reshaping Economic Geography, Washington DC: The World Bank39. HM Treasury (2010) Budget 2010, London: HSO, table 2.340. See 8.2 in URS (2009) Planes, Trains and Automobiles

Derby: October 2010 19
Box 2: The five key lessons for dealing with supply side shocks
The five key lessons for dealing with supply side shocks are:
1. Bring together public sector agencies in a location to work together on dealing with the impact of a plant closure;
2. Advise workers on employment opportunities, legal rights, the take up of benefits and how to deal with debt;
3. Make specific health based interventions that build up the psychological resources of the underemployed and unemployed ex-workers to improve well being;
4. Extend and adapt mainstream training provision to help workers to find suitable courses, providing short flexible training that workers can access while they are still in work; and
5. Provide additional funding to allow new employers to send workers affected by a closure on training courses and to pay for affected workers’ travel to training courses and job interviews.
The public sector downturn
Whilst the Government’s actions to reduce public sector job numbers will affect Derby, it is less vulnerable than some other cities. The UK faces deep cuts in public expenditure, which will have different impacts on different cities.41 The reduction plans outlined in the Coalition Government’s Budget amount to £128bn of fiscal consolidation by 2015-16.42 £99 billion of this will come from spending reductions. Capital spending will be cut from its peak in 2009-10 of £49 billion to £20.9 billion in 2015-16. All areas of the country will experience reductions in public employment with the Office of Budget Responsibility forecasting that public sector employment will fall by 610,000 by 2015-16.43
Some of Derby’s largest employers are in the public sector, with Derby City Council, Derby NHS Trust and the University of Derby employing approximately 21,000 people between them. Many of these will be vulnerable as the public spending cuts and job losses take effect.
In Public Sector Cities,44 the Centre for Cities analysed which cities would be most vulnerable to public sector job cuts on two dimensions; the concentration of public sector jobs and the skill content of those jobs.
41. Larkin K (2010) Reaction to Emergency Budget, London: Centre for Cities 42. HM Treasury (2010) Budget 2010. London: HMT43. Office of Budget Responsibility (OBR) (2010) OBR Forecast: Employment, London: OBR44. Larkin, K (2009) Public Sector Cities: Trouble Ahead? London: Centre for Cities
Table 8: Public sector vulnerability
Source: Own analysis using ABI, APS and Mid Year Population Estimates – see Public Sector Cities appendix for more detail on methodology)
Professionalism Vulnerability >100 = more > 100= more professional vulnerable
Derby (wide) 103.7 93.3
Derby city 114.0 94.5
Great Britain 100.0 100.0
Nottingham 99.6 113.3
Leicester 100.7 128.7

Derby: October 2010 20
Figure 9: Public sector vulnerability
120
140
160
60
50 2302101901701501301109070
80
100
Ind
ex o
f p
ubl
ic s
ecto
r ex
per
tise
Index of vulnerability
Insulated from change (4)
Small but low value (3)
Highly vulnerable (1)
Professional public sector (2)
Oxford
Cambridge
Worthing
Edinburgh
Dundee
Swindon Stoke
London
CrawleyLuton
Warrington
Aldershot
Cardiff
Newcastle
Hastings
Barnsley
Blackpool
NewportPlymouth
Reading
Brighton
Gloucester
SwanseaGlasgow
Leicester
SunderlandMiltonKeynes IpswichLiverpool
Derby
The Centre’s analysis suggests that Derby is less vulnerable on both counts (Table 8 and Figure 9). This analysis suggests that whilst the city will be affected by the forthcoming public spending cuts this will have a smaller impact on Derby’s economy and its workforce than other cities. The Council will need to plan carefully to ensure that any reductions in expenditure and jobs are undertaken in a way that has the least effect on the city’s ability to create private sector jobs and economic growth in the future.

Derby: October 2010 21
4. How can Derby expand on its success?
The future of Derby will be shaped by its past and current state.45 This means new opportunities are most likely to take hold in areas related to Derby’s current strengths. Helping firms to diversify into new products and new markets is not easy, but there are some lessons from other areas.
In this section we consider what steps Derby can take to expand on its existing success through looking at the opportunities for diversifying and through being responsive to demand.
Address the weakness of strong ties: Build on existing success through diversification
Derby should pursue a strategy that is both outward-looking and open to new opportunities, rather than focusing all attention on ‘doubling down’ on existing assets and strengths. Derby is keen to ‘lock in’ the success of its existing high value economy, which is particularly driven by Rolls-Royce and the rail cluster. While there are opportunities to build upon its existing strengths, this strategy presents some risks. The more a city is specialised in one sector, the greater the impact of a common shock that affects that sector. This is referred to as the ‘weakness of strong ties’.46
Research by National Endowment for Science, Technology and the Arts (NESTA) highlights the importance of being outward looking – external orientation is crucial to innovation and strong local links can be a barrier to learning from outside.47 Some Derby stakeholders identified a tendency for the city to be overly insular (also highlighted in the State of the English Cities report)48, but many have reported recent improvements in this regard, led by the efforts of Marketing Derby.
In realising a more outward facing strategy the priorities for Derby should be:
• Focusing on the fundamentals of economic performance;
• Facilitating greater contact between SMEs and universities across the East Midlands and beyond;
• Building stronger relationships with UKTI and supporting firms to access export markets;
• Supporting and co-ordinating networks that promote cross-sectoral exchanges in the region;
• Prioritising the needs of high growth firms;
• Improving the attractiveness of Derby as a place to live, work and visit.
The following recommendations provide more details on each of these.
45. Simmie J, Carpenter J, Chadwick A & Martin R (2008) History Matters. Path dependence and innovation in British Cities, London: National Endowment for Science, Technology and the Arts (NESTA) 46. Martin, R (2005) Thinking about Regional Competitiveness: Critical Issues. East Midlands Development Agency47. Simmie et al (2008) History Matters. Path dependence and innovation in British Cities. London: NESTA48. See 4.4.17 in Simmie J, Carpenter J, Chadwick A, Martin R & Wood P (2006) State of the English Cities. The Competitive Economic Perfomance of English Cities. London: CLG
Derby: October 2010 22
Focus on the basics of economic performance
Derby should aim to improve the business environment in which all businesses operate. There has been a great deal of focus by local authorities, RDAs and local economic development agencies on specific niche policies in recent years. Recent research by the Centre for Cities found that, for example, 39 of 56 cities in England believe they have a creative industries sector worth supporting or developing.49
In an environment with limited funding, it is important to be realistic about what these types of interventions can achieve and focus on getting the basic conditions for growth right. Improving the business environment by ensuring a more efficient planning system, a more highly skilled workforce and a better integrated transport system are much more likely to support private sector growth and job creation. The Centre for Cities’ recent research50 sets out a number of practical suggestions on how cities and local enterprise partnerships could improve their business environment.
Encourage firms to innovate and diversify into new markets and new products
Innovation and innovation-diffusion are crucial to economic diversification and growth. Emerging evidence from Greater Manchester suggests three aspects are important to driving innovation in cities: a quality evidence base to guide decision making; cross-boundary and cross–sector working; and, matching businesses with creative innovators.51
Developing policies to promote exports and extend a city’s global reach is not easy, but lessons can be learned from other cities the most obvious being Cambridge. Other examples relevant to Derby include Bristol’s partnership with China, where ‘sister city agreements’ were established with countries to develop closer trade and investment relationships; York’s engagement with US-based ICT businesses orientated around the University’s strengths and the city’s links to Leeds.
49. Swinney P, Larkin K & Webber C (2010), Firm Intentions: Cities, Private Sector Jobs and the Coalition, London: Centre for Cities50. Swinney P, Larkin K & Webber C (2010) Firm Intentions: Cities, Private Sector Jobs and the Coalition, London: Centre for Cities 51. NESTA (2010) Driving innovation in cities: Learning from Greater Manchester, London: NESTA 52. For more examples see Brown, H (2008) UK Cities in the Global Economy, London: Centre for Cities
Derby: October 2010 23
Box 3: What are high growth firms?
Other ways that cities have supported businesses to expand into new markets have ranged from measures to increase awareness of new opportunities, to technical expertise on how to deal with different IP environments, and networking with other businesses which may have relevant global expertise.52 Derby and the local enterprise partnership needs to develop a stronger working relationship with UKTI, both to ensure that UKTI proactively represents Derby internationally and so that any specific support offered to local firms by Derby and the local enterprise partnership is complimentary and additional to the services available through UKTI.
University-industry links can play an important role in helping firms to innovate. As discussed in Section Three, The University of Derby is not particularly well-placed to drive innovation as it is not a research intensive university.53 However, there is a number of leading research universities in close proximity such as Sheffield, Warwick (Rolls-Royce have a relationship with both), Loughborough and Nottingham. Continuing to build relationships between these institutions and Derby’s businesses, particularly SMEs will be important. Whilst the size of big companies allows them to establish such relationships with universities relatively easily, for SMEs this is often harder to achieve.
Supply-chain links are a much more effective way of spreading innovation than relationships between direct competitors. This casts doubt on the usefulness of conventional sector-based networks. For the purposes of spreading innovation, cross-sectoral exchanges are likely to be more productive.54 This means that, even if business support and innovation programmes previously run by emda such as I-NET (a business network focused on innovation) continue, they need to change to become much more cross-sectoral and supply-chain orientated.
Prioritise the needs of high growth firms
Focusing business support efforts on high growth firms could help Derby maximise its impact on private sector jobs growth. Recent research from the Centre for Cities identified the important contribution that high growth firms make to job creation in a city.55 They tend to be responsible for a large share of a city’s employment growth. In Derby, high growth firms accounted for 5.2 percent of ‘survivor’56 firms employing ten or more people between 2005 and 2008. When considering all businesses that traded throughout the period, irrespective of size, high growth firms made up just 0.7 percent of the business base.57
What are high growth firms?
High growth firms are defined as those businesses larger than ten employees that achieve an average annual growth rate in their number of employees of 20 percent or above over a three year period. Work commissioned by NESTA58 in 2009 found that although these firms made up only six percent of all ‘survivor’59 firms over the period 2005-08 in the UK, they accounted for over half of the employment growth during this time. In aiming to strengthen Derby’s private sector economy, policy should attempt to get a better understanding of the needs of these firms.
53. The Guardian ranks The University of Derby 105th out of 117 and the Times University Guide ranks it as 104th out of 11354. Manchester Independent Economic Review (2009) Innovation, Trade and Connectivity55. Swinney P, Larkin K & Webber C (2010) Firm Intentions: Cities, Private Sector Jobs and the Coalition, London: Centre for Cities 56. Businesses which had non-zero employment for each of the years in the analysis and which were not ‘born’ (i.e. employed their first employee using the definition of a ‘1’ employer enterprise) in the first year of each period.57. The analysis of HGF data using the ONS Business Structure Database was undertaken by Karen Bonner and Mark Hart (Economics and Strategy Group, Aston Business School, Aston University).58. Anyadike-Danes M, Bonner K, Hart M & Mason C (2009) Measuring Business Growth, London: NESTA59. Businesses which had non-zero employment for each of the years in the analysis and which were not ‘born’ (i.e.employed their first employee using the definition of a ‘1’ employer enterprise) in the first year of each period.
Derby: October 2010 24
Focusing on high growth firms in part implies providing better quality support to fewer businesses. Rather than trying to ‘pick out’ high growth firms, Derby needs to try to channel support toward potential high growth firms. Some business support programmes do already try to target high growth firms, such as the North West Development Agency’s ‘High Growth Programme’. These types of programmes have not been around for long, and their future is uncertain, so judging their effectiveness at this point is difficult. Derby should adopt a watching brief on these programmes as they develop.
Derby should work through the local enterprise partnership to engage with high growth firms to understand and respond to their business needs.
Focus on the quality of life offer
Whilst the demand for labour is the most important factor in attracting highly-skilled workers,60 it is also necessary for the city to offer high quality and affordable leisure and cultural services and amenities, and a high quality urban and natural environment.61
Derby has the ability to help shape some of these factors. Below we consider three areas – housing, leisure and cultural facilities and city centre development – where the council can help to deliver change which would make the area more attractive to high-skilled, high-income workers.
Building a good housing offer
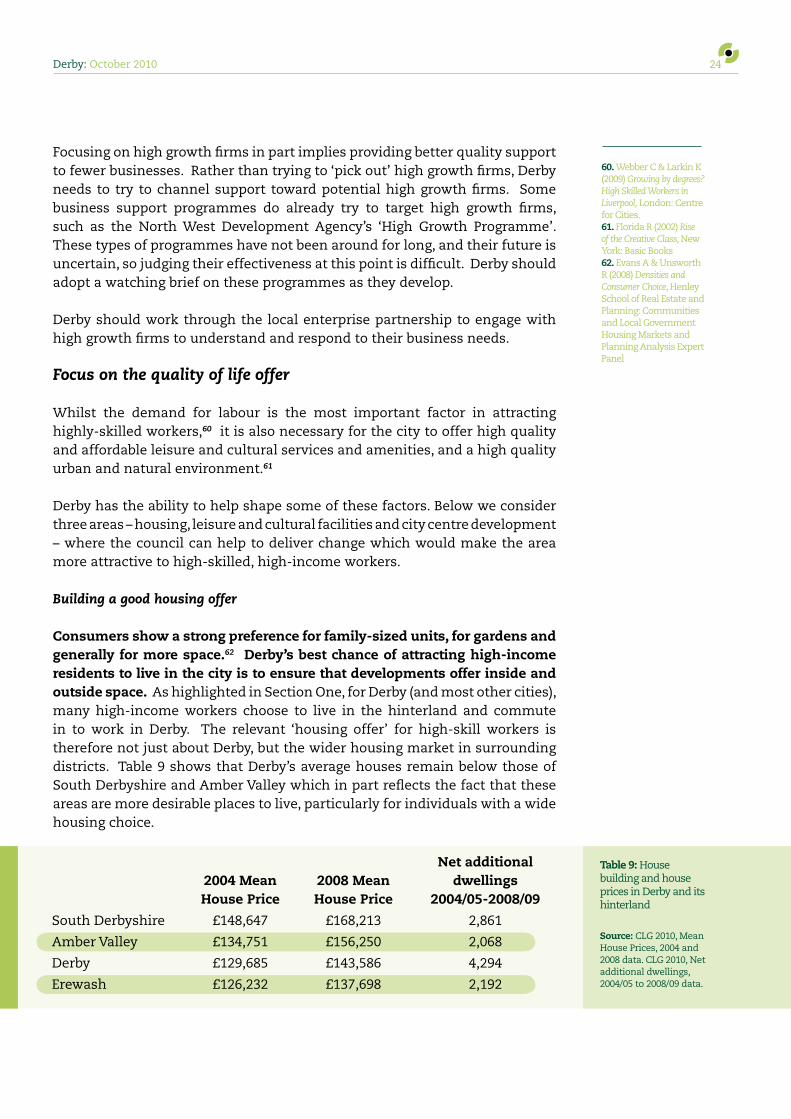
Consumers show a strong preference for family-sized units, for gardens and generally for more space.62 Derby’s best chance of attracting high-income residents to live in the city is to ensure that developments offer inside and outside space. As highlighted in Section One, for Derby (and most other cities), many high-income workers choose to live in the hinterland and commute in to work in Derby. The relevant ‘housing offer’ for high-skill workers is therefore not just about Derby, but the wider housing market in surrounding districts. Table 9 shows that Derby’s average houses remain below those of South Derbyshire and Amber Valley which in part reflects the fact that these areas are more desirable places to live, particularly for individuals with a wide housing choice.
60. Webber C & Larkin K (2009) Growing by degrees? High Skilled Workers in Liverpool, London: Centre for Cities.61. Florida R (2002) Rise of the Creative Class, New York: Basic Books 62. Evans A & Unsworth R (2008) Densities and Consumer Choice, Henley School of Real Estate and Planning: Communities and Local Government Housing Markets and Planning Analysis Expert Panel
Table 9: House building and house prices in Derby and its hinterland
Source: CLG 2010, Mean House Prices, 2004 and 2008 data. CLG 2010, Net additional dwellings, 2004/05 to 2008/09 data.
Net additional 2004 Mean 2008 Mean dwellings House Price House Price 2004/05-2008/09
South Derbyshire £148,647 £168,213 2,861
Amber Valley £134,751 £156,250 2,068
Derby £129,685 £143,586 4,294
Erewash £126,232 £137,698 2,192

Derby: October 2010 25
In-commuting is an inevitable by-product of people’s lifestyle choices and should not be regarded as a bad thing from a national perspective. However, for Derby there would be some benefits from persuading more high income individuals to live closer to the centre. These benefits would include less pressure on transport infrastructure and reduced impact on the environment. This would also provide an opportunity for a greater share of the income earned by Derby’s workers to be spent in the city’s core area.
Derby needs to maintain a detailed understanding of the housing and related needs of higher income individuals and families and ensure that future housing responds to these needs.
Improving quality of life offer
Existing and future quality of life facilities need to be designed, delivered and run in a way which maximises their potential regenerative impacts and which makes them accessible to the whole community. The 2008 Place Survey shows Derby residents have a poorer impression of the local quality of life of their city than the England average. It is clear that Derby residents feel that more sporting and leisure facilities are needed (Table 10).
The Council is already responding to this issue. In recent years, new cultural and leisure facilities have been delivered in the city centre. For example QUAD, a mixed use development, opened in 2008 containing a gallery, cinema, café and creative and digital workspace. The Westfield shopping centre has also helped to revitalise Derby’s retail offer, but given the recent nature of this investment and the potential weakness of consumer spending, it is likely that any new retail interest can be accommodated within the Westfield centre. The Council is also keen to invest in leisure facilities; there are plans for an Olympic size swimming pool and a Velodrome.
Improving the city centre
The council’s regeneration fund should be used strategically, to make investments in the city centre in which the council can either share in potential profits or where it can invest in infrastructure to support the development. Derby’s city centre has fallen behind other parts of the city in terms of new investment.
Table 10: Percent of population saying that are very or fairly satisfied, compared to England average
Source: CLG, 2008 Place Survey 2008, 2008 data
Issue Difference (% points)
Sport/leisure facilities -9.3
Libraries -7.7
Museums/galleries 4.8
Theatres/concert/halls -3.1
Parks and open spaces 1.4
63. CB Richard Ellis (2009) Derby City Council, Private Sector Offices End Users64. Personal correspondence with Derby City Council.

Derby: October 2010 26
In the 1990s Derby successfully applied for ‘City Challenge’ funding which kick-started the development of the Pride Park business park located outside the immediate town centre. The development successfully regenerated the area to the extent that in 2009 the consensus amongst local property agents was that the only grade A office space in Derby was located outside of the city centre.63 The superior quality of the office space outside of the city centre has caused some displacement of businesses from the city centre.
In recent years, however, there has been a significant amount of interest from commercial developers in Derby. In fact, there is approximately 82,000 square metres of commercial development with full planning permission which is currently stalled and a further 25,000 square metres granted permission subject to the signing of a Section 106 agreement.64 This calculation excludes other development sites which have not yet applied for planning permission, such as the former DRI site, owned by Derby Hospitals’ NHS Foundation Trust, and the Castleward scheme, which will be an urban village linking the railway station to the city centre. The recession has stalled most of the proposed development activity in Derby, as it has done to development across the UK. The council has recognised the problem caused by the stalled development and has announced plans for a £10 million regeneration fund to support development activity through this difficult period. The fund could help to kick start some development activity, although it should not be viewed as a solution in itself – it will not be big enough to change the market. It should only seek to support development where there is proven demand and there are small barriers which need to be overcome.
In addition to the fund, the council should also actively consider how other recently announced mechanisms such as Tax Increment Financing (TIF) and the Community Infrastructure Levy (CIL) can be used to support the provision of infrastructure and development within the city.

Derby: October 2010 27

October 2010
Enterprise House59 - 65 Upper Ground
London SE1 9PQ
www.centreforcities.org
© Centre for Cities 2010
Centre for Cities is a registered charity (No 1119841) and a
company limited by guarantee registered in England (No 6215397)
Acknowledgements
The Centre is grateful to Derby City Council for the financial support which made this report possible. The Centre would also like to acknowledge the considerable time that Council officers and a wide range of public and private stakeholders were prepared to devote to discussions with the research team.
Photographs are courtesy of Marketing Derby.