safe harbor statement -...
TRANSCRIPT

0
1
Safe Harbor Statement
Except for historical information contained herein, this presentation contains “forward-looking statements.” All statements other than statements of historical fact are “forward-looking statements” for purposes of federal and state securities laws, including any projections of earnings, revenue or other financial items; any statements of the plans, strategies and objectives of management for future operations; any statements concerning proposed new services or developments; any statements regarding future economic conditions or performance; any statements of belief; and any statements of assumptions underlying any of the foregoing. Forward-looking statements may include the words, “may,” “will,” “estimate,” “intend,” “continue,” “believe,” “expect,” or “anticipate” and any other similar words.
Although we believe that the expectations reflected in any of our forward-looking statements are reasonable, actual results could differ materially from those projected or assumed in any of our forward-looking statements. Our future financial condition and results of operations, as well as any forward-looking statements, are subject to change and to inherent risks and uncertainties, such as those disclosed or incorporated by reference in our filings with the Securities and Exchange Commission. Important factors that could cause our actual results, performance and achievements, or industry results to differ materially from estimates or projections contained in our forward-looking statements include, among others, the following:
our relationship with, and our ability to influence the actions of, our distributors;adverse publicity associated with our products or network marketing organization;uncertainties relating to interpretation and enforcement of recently enacted legislation in China governing direct selling;risk of our inability to obtain the necessary licenses to expand our direct selling business in China;adverse changes in the Chinese economy, Chinese legal system or Chinese governmental policies;risk of improper action by our employees or international distributors in violation of applicable law;changing consumer preferences and demands;loss or departure of any member of our senior management team which could negatively impact our distributor relations and operating results;the competitive nature of our business;regulatory matters governing our products, including potential governmental or regulatory actions concerning the safety or efficacy of our products, and
network marketing program, including the direct selling market in which we operate;risks associated with operating internationally, including foreign exchange risks;our dependence on increased penetration of existing markets;contractual limitations on our ability to expand our business;our reliance on our information technology infrastructure and outside manufacturers;the sufficiency of trademarks and other intellectual property rights;product concentration;our reliance on our management team;uncertainties relating to the application of transfer pricing, duties and similar tax regulations;taxation relating to our distributors,product liability claims; andthere can be no assurance that we will purchase any of our shares in the open market or otherwise.
Additional factors that could cause actual results to differ materially from our forward-looking statements are set forth in this presentation. We do not intend, and undertake no obligation, to update any forward-looking statement.

2
Michael O. JohnsonChairman and Chief Executive Officer

3
Investment Highlights
• Successful track record, driven by positive global mega trends
• Unique distribution channel for emerging markets and consultative products
• Geographic diversification throughout 65 markets and across four major product categories
• Financial strength – Strong cash flow– Margin expansion– Strong balance sheet– Economically resilient
• High degree of shareholder focus– Disciplined capital allocation– Free cash flow allocated to high ROI programs
• Share repurchase program - +$200MM completed since April 2007
• Proven management team

Industry Perspectives

5
1886
Industry History(2006 Net Sales of Selected Companies)
2000199019801970196019501940
$8.8B $6.3B
$2.3B
$1.1B
$0.4B
$1.7B
$1.2B
$1.3B
$0.4B
$1.9B
$1.1B*
Source: CapitalIQ, Company Reports; as of 9/20/2007*Only 2005 sales available
6
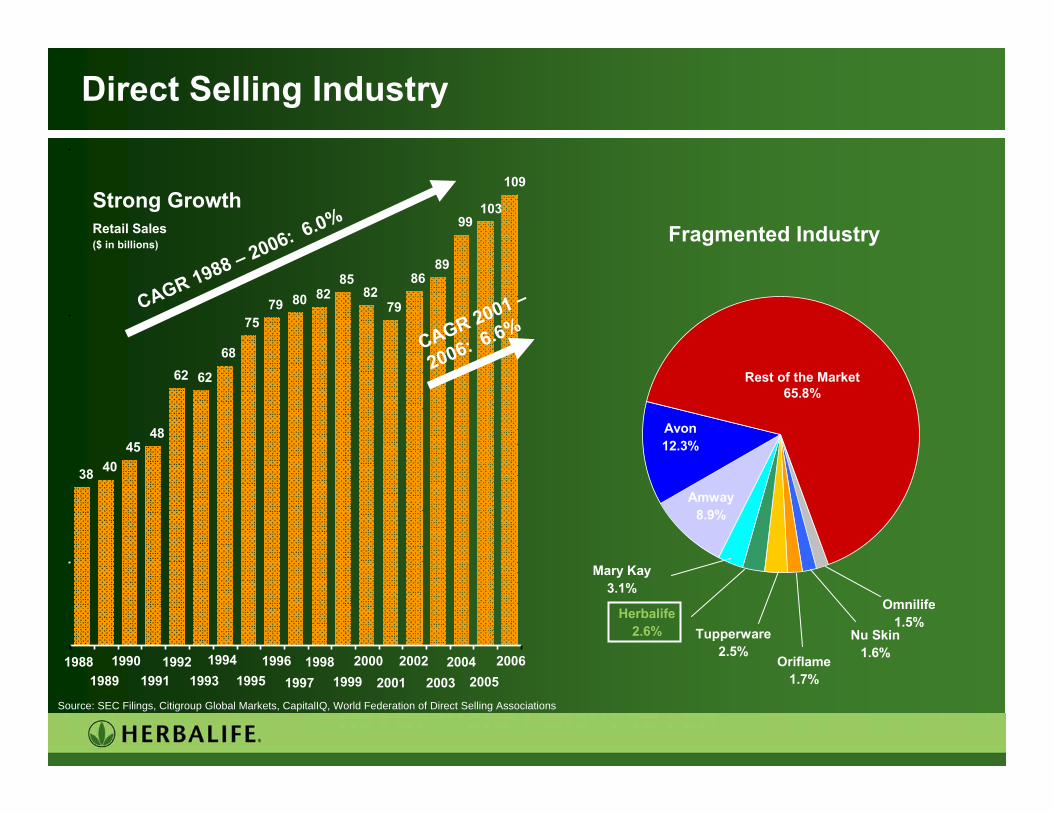
Direct Selling Industry
Fragmented Industry
Source: SEC Filings, Citigroup Global Markets, CapitalIQ, World Federation of Direct Selling Associations
Rest of the Market65.8%
Nu Skin1.6%Oriflame
1.7%
Tupperware2.5%
Mary Kay3.1%
Amway8.9%
Avon12.3%
Herbalife2.6%
Omnilife1.5%
4045
48
62 62
68
7579 80 82
8582
79
8689
99103
109
38
19881989
19901991
19921993
19941995
19961997
19981999
20002001
20022003
20042005
2006
CAGR 2001 –
2006: 6.6%CAGR 1988 – 2006: 6.0%
Strong GrowthRetail Sales($ in billions)

7
“Traditional” companies entering direct selling
BERKSHIRE HATHAWAY INC. Purchased
Source: Company Reports
Start up
Start up
Purchased
Start up
Start up
Start up
Start up
ConsideringIndia
Direct Selling DivisionParent Company
Brazil

Herbalife – Past, Present and Future

9
Herbalife History
2003: A company that had lost confidenceEmployeesDistributors
Restored confidence to HerbalifeManagement teamStrategyTop line revenueDistributor momentumStrategies to strengthen retailing, retention and recruitingExpanded geographic reachSharing of best practices

10
Herbalife Performance ($ in millions)
It took Herbalife - 16 years to reach $1B Retail Sales- 8 years to reach $2B Retail Sales- 2 years to reach $3B Retail Sales
Note: Normalized for non-recurring expenses *2007E based on sell-side analysts consensus for 2007 as published November 2007.
1999 - 2003 2003 - 2007E
CAGR CAGR1999 2003 '99-'03 2003 2007E* '03-'07E
Retail Sales 1,794 1,894 1% 1,894 3,300 15%
Net Sales 1,099 1,159 1% 1,159 2,106 16%
Operating Income 93 107 4% 107 314 31%% Margin 8% 10% 10% 15%
Net Income 57 43 -7% 43 190 45%

Confidence in our company
12
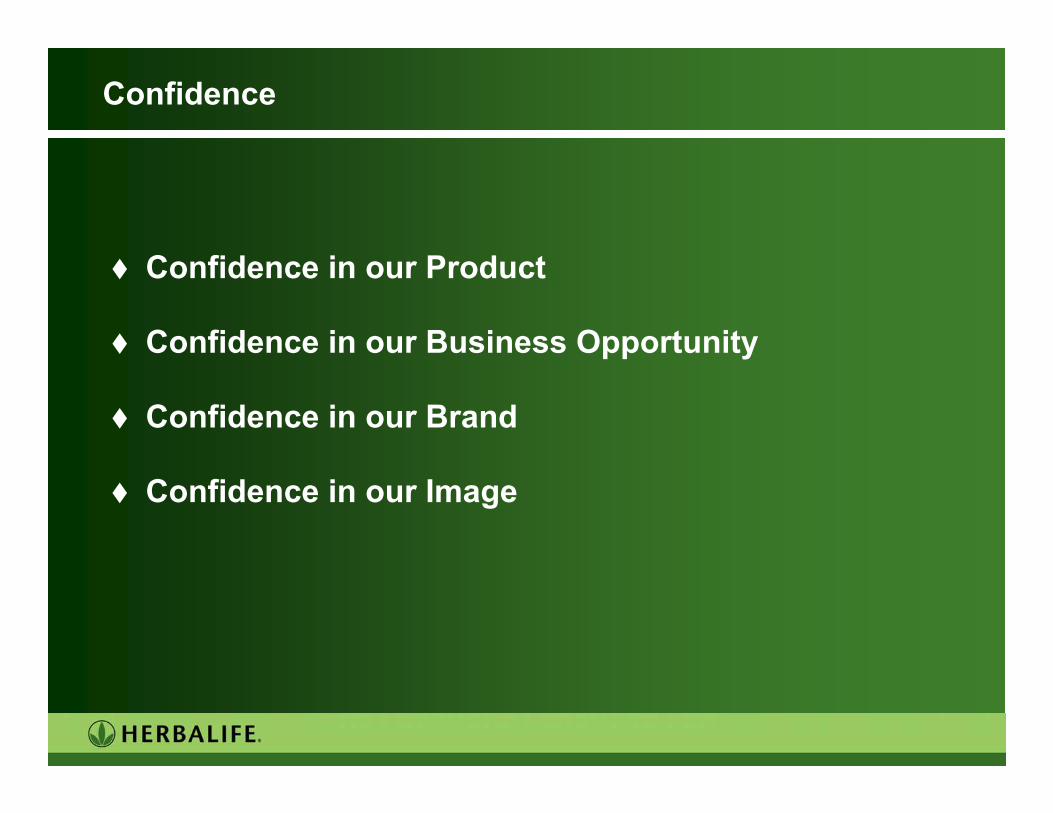
Confidence
Confidence in our Product
Confidence in our Business Opportunity
Confidence in our Brand
Confidence in our Image
13
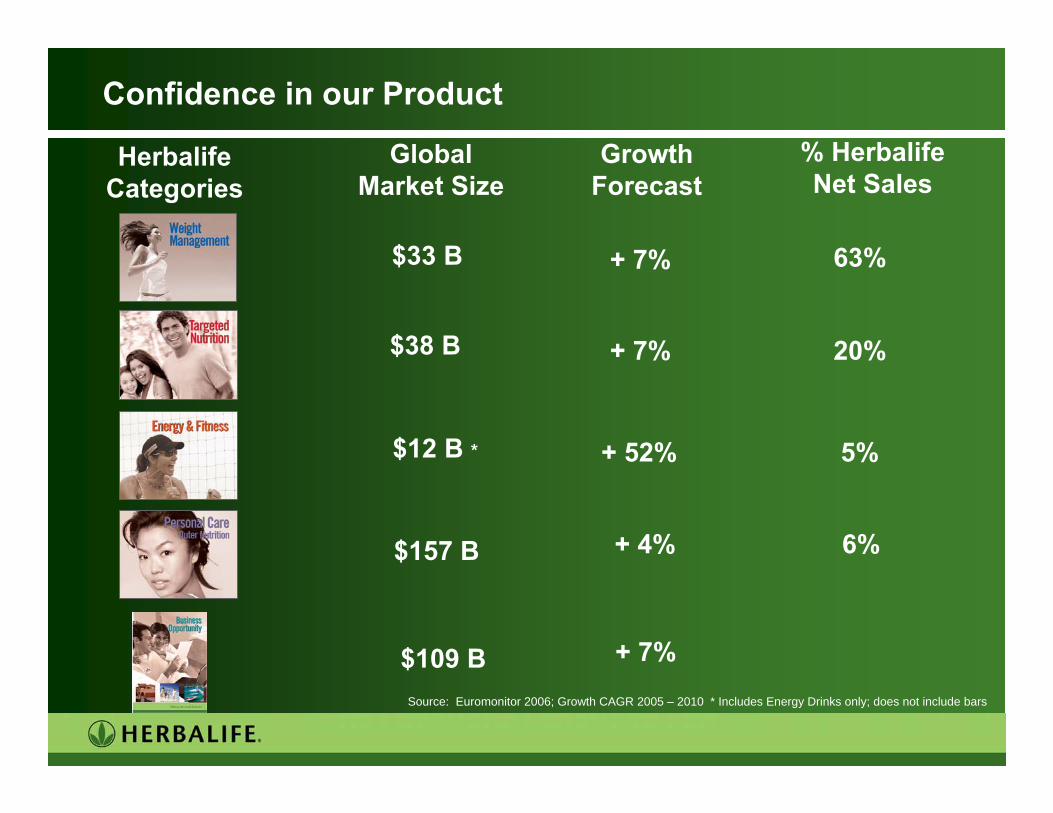
Confidence in our Product
Herbalife Categories
Global Market Size
Growth Forecast
Source: Euromonitor 2006; Growth CAGR 2005 – 2010 * Includes Energy Drinks only; does not include bars
$33 B
$38 B
+ 7%
+ 7%
$12 B * + 52%
$157 B + 4%
$109 B + 7%
% Herbalife Net Sales
63%
20%
5%
6%

14
Chasing the mega-trends of obesity and anti-aging
15
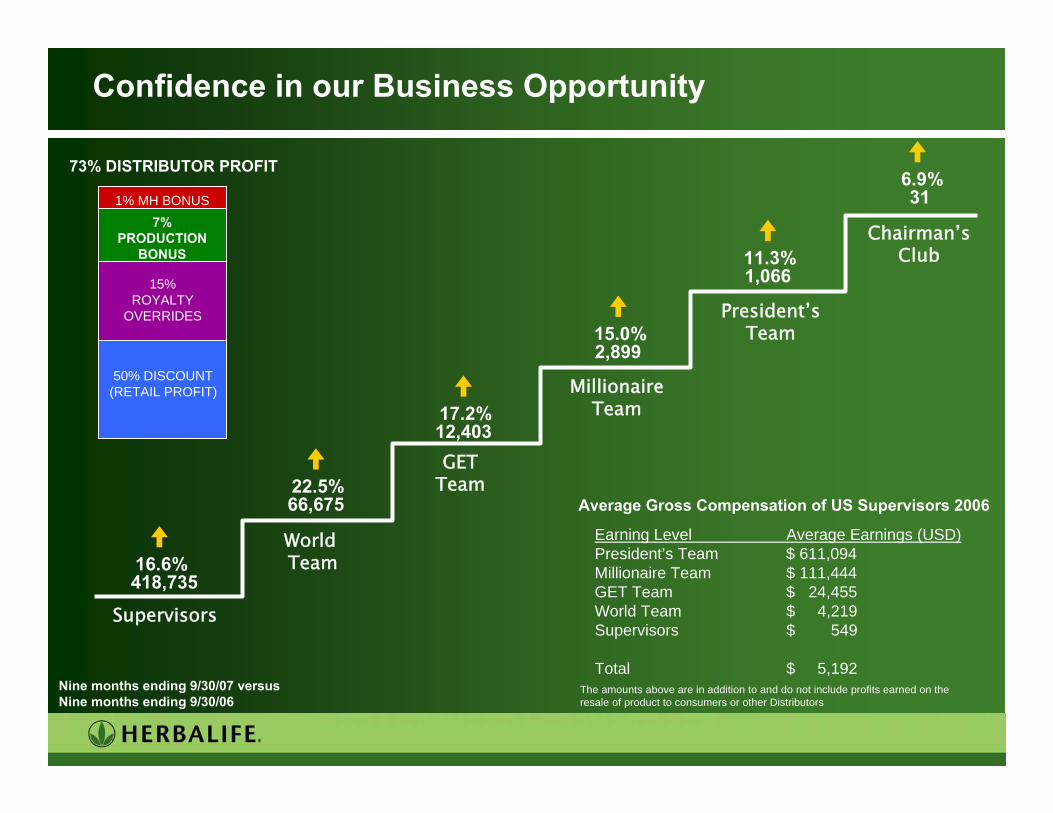
Supervisors
World Team
GETTeam
MillionaireTeam
President’sTeam
Chairman’s Club
Confidence in our Business Opportunity
6.9%31
11.3%1,066
15.0%2,899
17.2%12,403
22.5%66,675
16.6%418,735
Nine months ending 9/30/07 versusNine months ending 9/30/06
73% DISTRIBUTOR PROFIT
1% MH BONUS7%
PRODUCTION BONUS
15% ROYALTY
OVERRIDES
50% DISCOUNT(RETAIL PROFIT)
Earning Level Average Earnings (USD)President’s Team $ 611,094Millionaire Team $ 111,444GET Team $ 24,455World Team $ 4,219Supervisors $ 549
Total $ 5,192
Average Gross Compensation of US Supervisors 2006
The amounts above are in addition to and do not include profits earned on the resale of product to consumers or other Distributors

16
Confidence in our Brand
Distributor Activation

17
Confidence in our Image
Integrity“We do the right, honest and ethical thing. We take the high road.”
Oversight & Enforcement:Invested in staff to strengthen internal controls, policies and procedures
Distributor “whistle blower hotline”Distributor Rules – important safeguardsWorld-wide Ethical Business PracticesWorld-wide internal audit staffHerbalife Audit CommitteeSOX compliantSEC, NYSE, FDA, FTC

18
Dr. Steve HenigChief Scientific Officer

Product

20
Product Aspiration
Vision
• To be the premier nutrition company in the world.
• Lifetime commitment of our distributors and their customers – “Herbalife for Life!”
Mission
• To provide balanced nutrition, personalized for a healthy, active lifestyle.
Resources
• Process
• Science Program
• Equipment
• Talent

21
Obesity Rates Predicted to Double in 30 Years
5%
10%
15%
20%
25%
30%
35%
40%
1999
2000
2001
2002
2003
2004
2005
2006
2007
2008
2009
2010
USA
United Kingdom
Germany
Austria
Belgium
Russia
Portugal
Denmark
Netherlands
Sweden
Spain
BMI >30 as a % totalSource: International Obesity Task Force
22
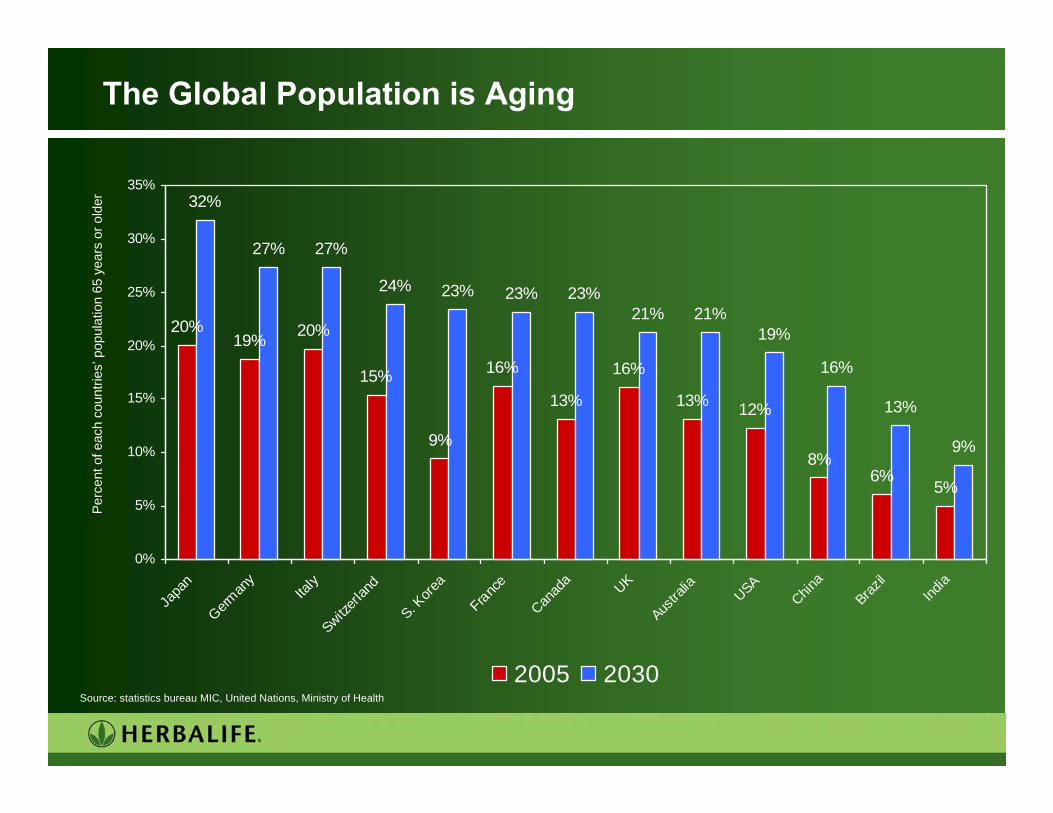
The Global Population is Aging
20%19% 20%
15%
9%
16%
13%
16%
13% 12%
8%6%
5%
32%
27% 27%
24% 23% 23% 23%21% 21%
19%
16%
13%
9%
0%
5%
10%
15%
20%
25%
30%
35%
Japa
n
German
y
Italy
Switzerl
and
S. Kore
a
France
Canad
a UK
Austra
lia
USA
China
Brazil
India
2005 2030
Perc
ent o
f eac
h co
untri
es’p
opul
atio
n 65
yea
rs o
r old
er
Source: statistics bureau MIC, United Nations, Ministry of Health

23
Science behind our products
Targeted Nutrition:
Kid’s Line
Heart Health
Digestive Health
Weight Management:
Core Products:
Formula 1 Shake
Formula 2 Multivitamin
Cell Activator
Energy & Fitness:
Liftoff
H³O
Outer Nutrition:
Skin Activator Line
Nourifusion Line

Science Program

25
Science Program
• Herbalife Product and Science Center
• Botanical Evaluation• Botanical Monograph Program
• Claim Substantiation• Developed scientific reviews in global
format
• Mark Hughes Cellular & Molecular Nutrition Laboratory- UCLA
• University of Mississippi
Herbalife Product and Science Center
University of Mississippi UCLA
The University of California as a matter of policy does not endorse specific products or services
26
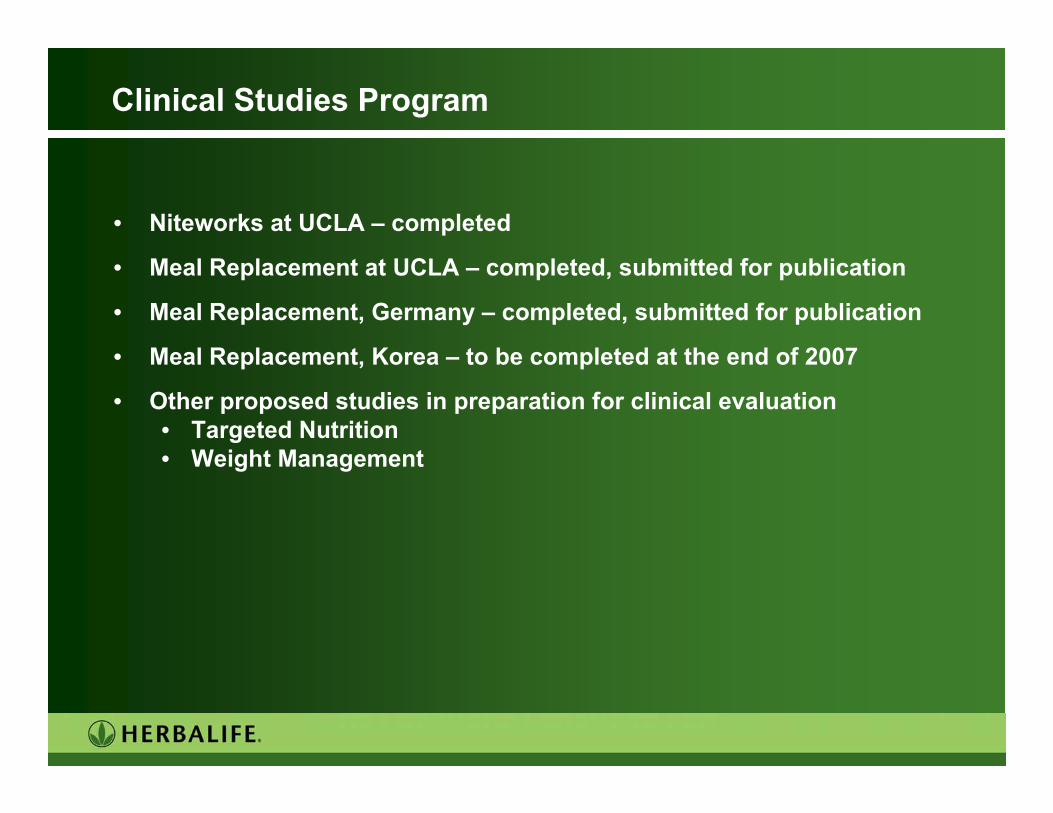
Clinical Studies Program
• Niteworks at UCLA – completed
• Meal Replacement at UCLA – completed, submitted for publication
• Meal Replacement, Germany – completed, submitted for publication
• Meal Replacement, Korea – to be completed at the end of 2007
• Other proposed studies in preparation for clinical evaluation• Targeted Nutrition• Weight Management

Quality and Regulatory

28
Corporate Quality
• Upgraded quality systems, policies and procedures
• Improved product testing plan
• Supplier “Quality Success Rating” program
• Global Quality Control lab in Los Angeles
• A new database for specifications

29
Global Licensing
• Global Licensing is structured to build strong relationships with regulatory agencies across 65 countries
• Diverse skill sets
• Leveraging technology (Agile)

Nutrition Advisory Board
31
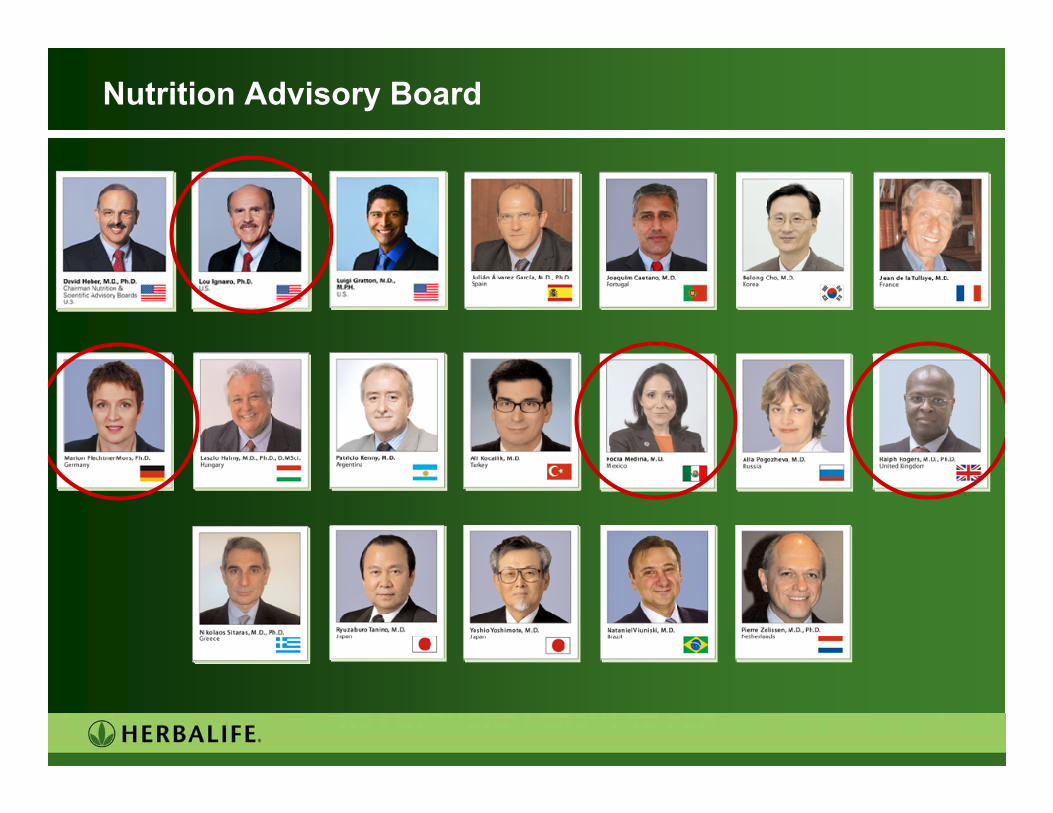
Nutrition Advisory Board
• Role of the Nutrition Advisory Board
• Strict requirements for membership
• The current NAB representation across many countries

32
Nutrition Advisory Board
33
Nutrition Advisory Board

34
Science behind Herbalife Products
Enhance blood flow to the heart*
Keep blood vessels toned, flexible and youthful for improved circulation*
Support healthy blood pressure levels already within a normal range*
* These statements have not been evaluated by the Food and Drug Administration. This product is not intended to diagnose, treat, cure or prevent any disease.

35
Science behind Herbalife Products
Support circulation and healthy blood vessels*
Maintain healthy homocysteine levels already within normal range*
Antioxidant protection
* These statements have not been evaluated by the Food and Drug Administration. This product is not intended to diagnose, treat, cure or prevent any disease.

36
Training Distributors
Product Training DVDs

37
Greg ProbertPresident and Chief Operating Officer

38
Major Market Strategy– China - expand Direct Selling license approval into additional cities & provinces– Develop Eastern European Strategy– Nurture Brazil DMO Transition– Identify untapped markets
Product Strategy– Product categories: obesity, anti-aging, fitness, children’s, immunity/defense– Accelerate local/regional product development to capitalize on target trends– Enhance science based focus: NAB, patents, clinical studies– Enhance existing product lines to better support distributor DMOs
Distributor Strategy– Targeted market segmentation: Latino, Stay-at-home moms, Fitness enthusiasts– Improve distributor productivity and utilize company infrastructure (BizWorks,
MyHerbalife.com)– Globalize distributor DMOs: Nutrition Clubs, Total Plan, Wellness Coach– Grow top line by increasing Retailing, Retention, and Recruiting (3R’s)
Infrastructure Strategy– Seven strategic business units/Realignment for Growth initiative– Distribution focus: technology and infrastructure to support sales growth (BizWorks,
MyHerbalife.com, Oracle 11i/Internet, Agile)– SOX compliance– Ethics Hotline, Adverse Events Hotline, Worldwide EBP
Focus on the Future –Key Strategic Initiatives

Regional Updates

40
North America – Region Update
Dist ribut or Order St rat if icat ion
20.0%21.0%59.0%
0.0%
20.0%
40.0%
60.0%
80.0%
discountcustomers
small retailers potent ialsupervisor
Supervisor Retention
43.1%41.7%39.2%37.5%
33.0%
36.0%
39.0%
42.0%
45.0%
Feb 04Actual
Feb 05Actual
Feb 06Actual
Feb 07Actual
Volume Points3 Year Growth Trend
13.4% 17.1% 24.6%
-
150,000300,000
450,000
600,000
2005 2006 2007 (YTD Sept)
New Supervisors3 Year Growth Trend
18.3% 21.2% 20.1%
-
10,000
20,000
30,000
40,000
2005 2006 2007 (YTD Sept)

41
North America – 2008 Initiatives
PromotionLatino Market Leadership EventsCollege Market Initiative
ProductLiftoff – new forms and flavorsDigestive HealthFlavored Aloe Powder
BrandGalaxy Jersey Sponsorship
Geographical ExpansionAddition of Quick Service Centers in key markets

42
Mexico & Central America – Region Update
Dist ribut or Order St rat if icat ion
50.0%38.5%11.5%
0 . 0 %
10 . 0 %
2 0 . 0 %
3 0 . 0 %
4 0 . 0 %
5 0 . 0 %
6 0 . 0 %
di scount customer s smal l r etai l er s potent i al super vi sor
Supervisor Retention
55.1%57.5%
51.0%51.0%
44.0%
48.0%
52.0%
56.0%
60.0%
Feb 04 Actual Feb 05 Actual Feb 06 Actual Feb 07 Actual
Volume Points3 Year Growth Trend
-1.8%69.5%
99.9%
-
200,000
400,000
600,000
800,000
2005 Actual 2006 Actual 2007 Actual (YTD Sept)
New Supervisors3 Year Growth Trend
-22.0% 72.9%
116.0%-
15,000
30,000
45,000
60,000
2005 2006 2007 (YTD Sept)
43
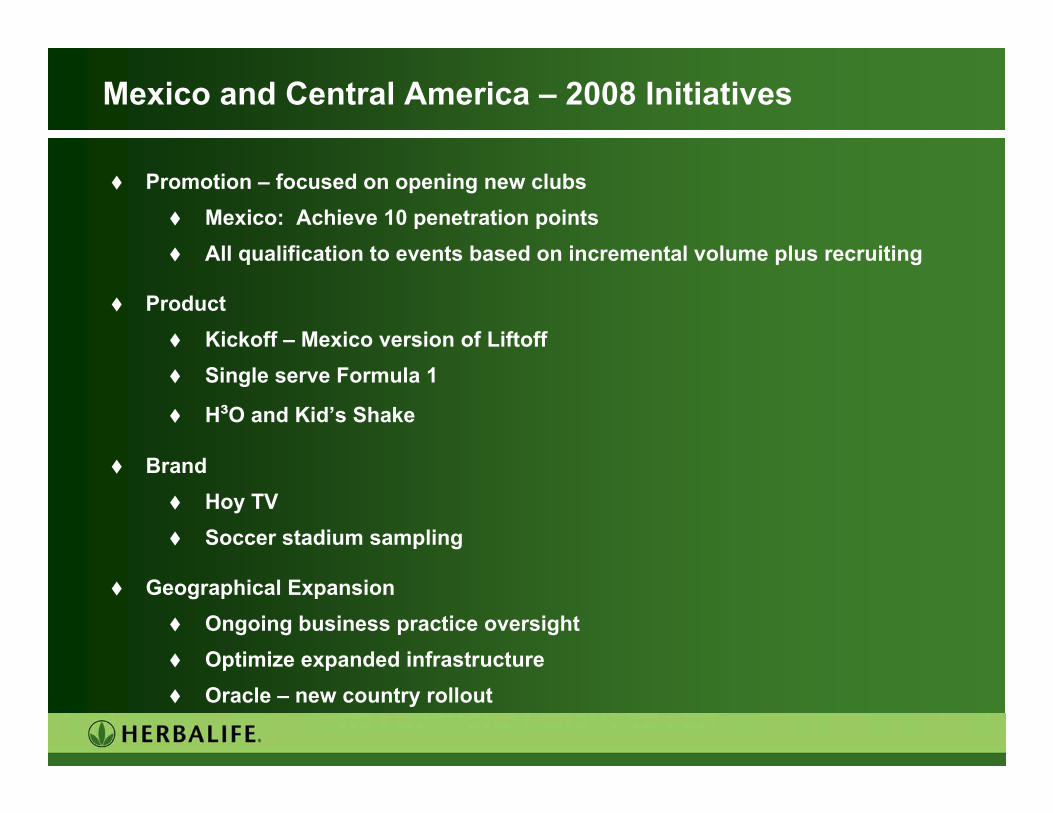
Promotion – focused on opening new clubsMexico: Achieve 10 penetration pointsAll qualification to events based on incremental volume plus recruiting
ProductKickoff – Mexico version of LiftoffSingle serve Formula 1
H³O and Kid’s Shake
BrandHoy TVSoccer stadium sampling
Geographical ExpansionOngoing business practice oversightOptimize expanded infrastructureOracle – new country rollout
Mexico and Central America – 2008 Initiatives

44
Brazil – Region Update
Distributor Order Stratification
9.2%
36.4%
54.4%
0.0%
10.0%
20.0%
30.0%
40.0%
50.0%
60.0%
discount customers small retailers potential supervisor
Volume Points3 Year Growth Trend
-12.0%7.7%30.3%
-
50,000
100,000
150,000
200,000
2005 2006 2007 (YTD Sept)
Supervisor Retention
28.8%29.0%31.2%30.3%
26.0%
28.0%
30.0%
32.0%
34.0%
Feb 04Actual
Feb 05Actual
Feb 06Actual
Feb 07Actual
New Supervisors3 Year Growth Trend
14.5% 12.8% -24.3%
-
6,000
12,000
18,000
24,000
2005 2006 2007 (YTD Sept)
45
Brazil – 2008 Initiatives
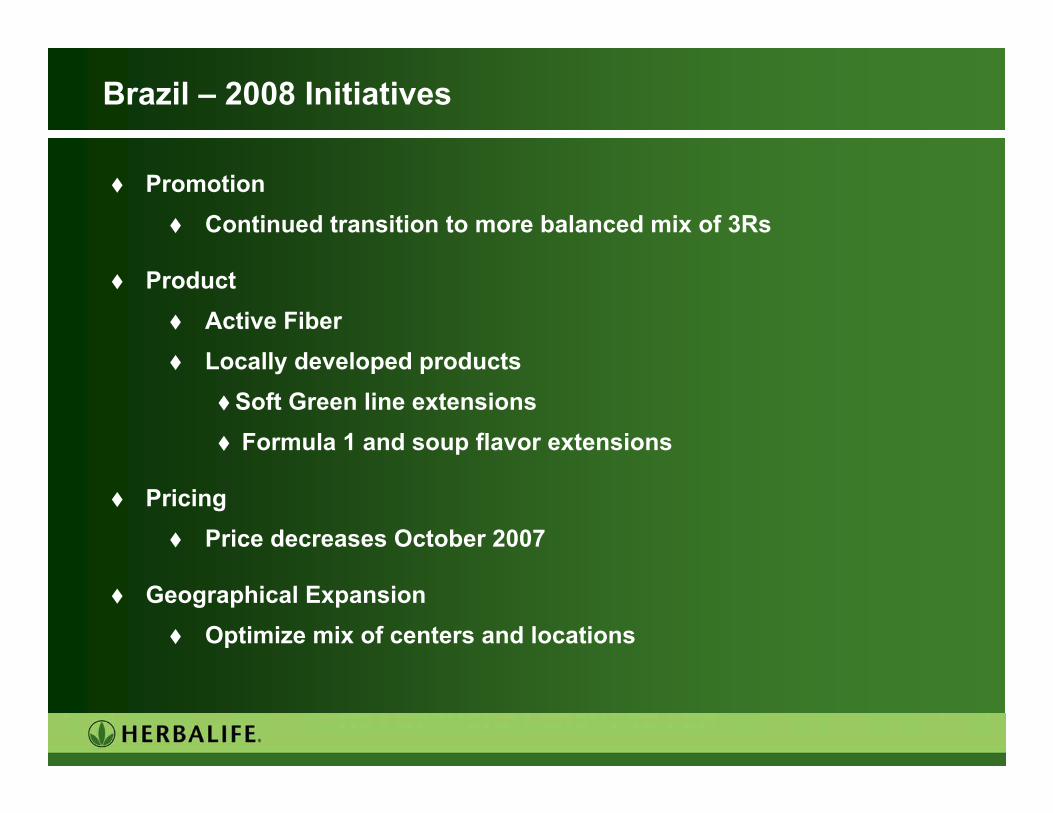
PromotionContinued transition to more balanced mix of 3Rs
ProductActive FiberLocally developed products
Soft Green line extensionsFormula 1 and soup flavor extensions
PricingPrice decreases October 2007
Geographical ExpansionOptimize mix of centers and locations
46
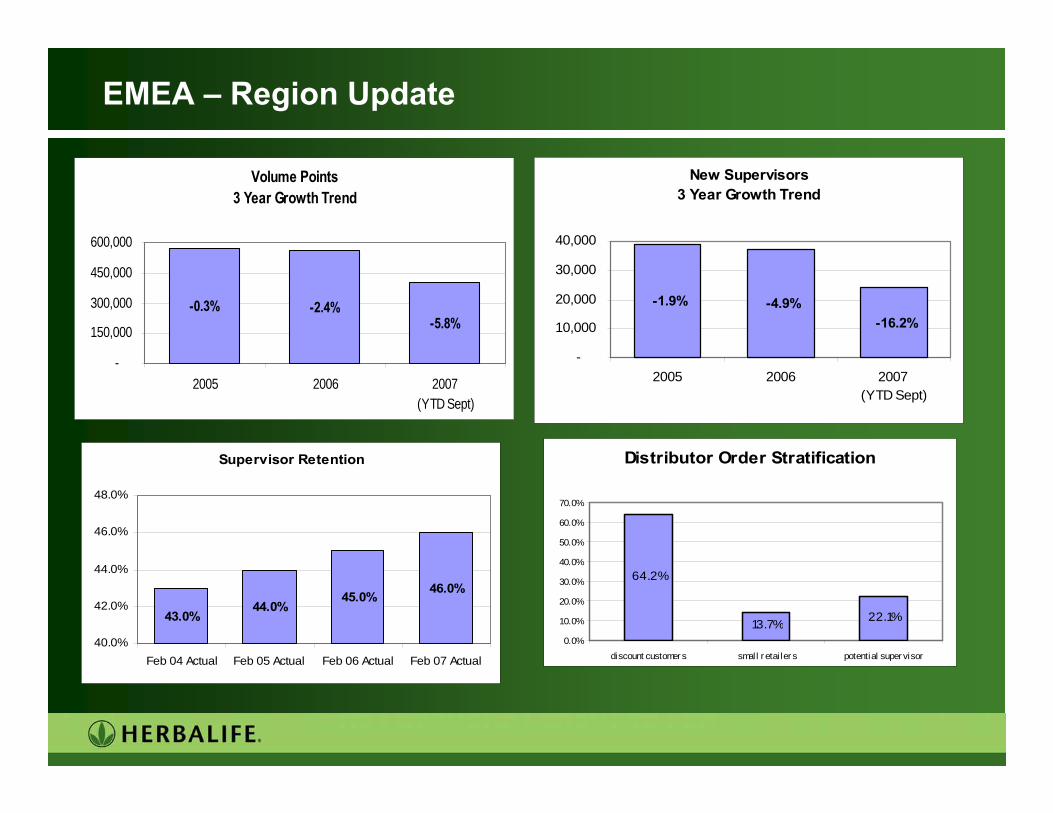
EMEA – Region Update
Distributor Order Stratification
64.2%
13.7% 22.1%
0.0%
10.0%
20.0%
30.0%
40.0%
50.0%
60.0%
70.0%
discount customer s small r etai ler s potential super visor
Supervisor Retention
43.0%44.0%
45.0% 46.0%
40.0%
42.0%
44.0%
46.0%
48.0%
Feb 04 Actual Feb 05 Actual Feb 06 Actual Feb 07 Actual
New Supervisors3 Year Growth Trend
-16.2% -4.9% -1.9%
-
10,000
20,000
30,000
40,000
2005 2006 2007 (YTD Sept)
Volume Points3 Year Growth Trend
-5.8%-2.4%-0.3%
-
150,000
300,000
450,000
600,000
2005 2006 2007 (YTD Sept)

47
EMEA – 2008 Initiatives
PromotionGrowth in Eastern EuropeRevise IBP configuration and price
ProductIsotonic Drink (H³O)Sample Packs
PricingPrice increases across several countries
Geographical ExpansionCountry model changes
48
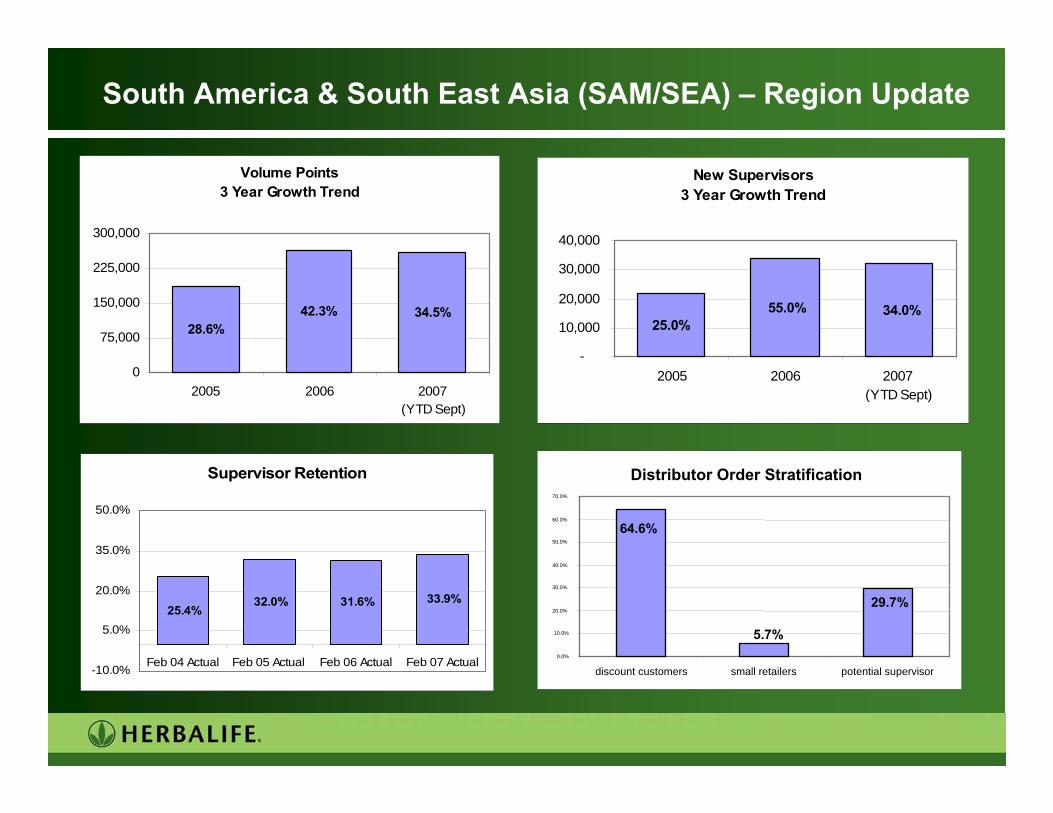
South America & South East Asia (SAM/SEA) – Region Update
Distributor Order Stratification
5.7%
29.7%
64.6%
0.0%
10.0%
20.0%
30.0%
40.0%
50.0%
60.0%
70.0%
discount customers small retailers potential supervisor
Supervisor Retention
33.9%31.6%32.0%25.4%
-10.0%
5.0%
20.0%
35.0%
50.0%
Feb 04 Actual Feb 05 Actual Feb 06 Actual Feb 07 Actual
Volume Points3 Year Growth Trend
28.6%42.3% 34.5%
0
75,000
150,000
225,000
300,000
2005 2006 2007 (YTD Sept)
New Supervisors3 Year Growth Trend
34.0% 55.0%25.0%
-
10,000
20,000
30,000
40,000
2005 2006 2007 (YTD Sept)
49
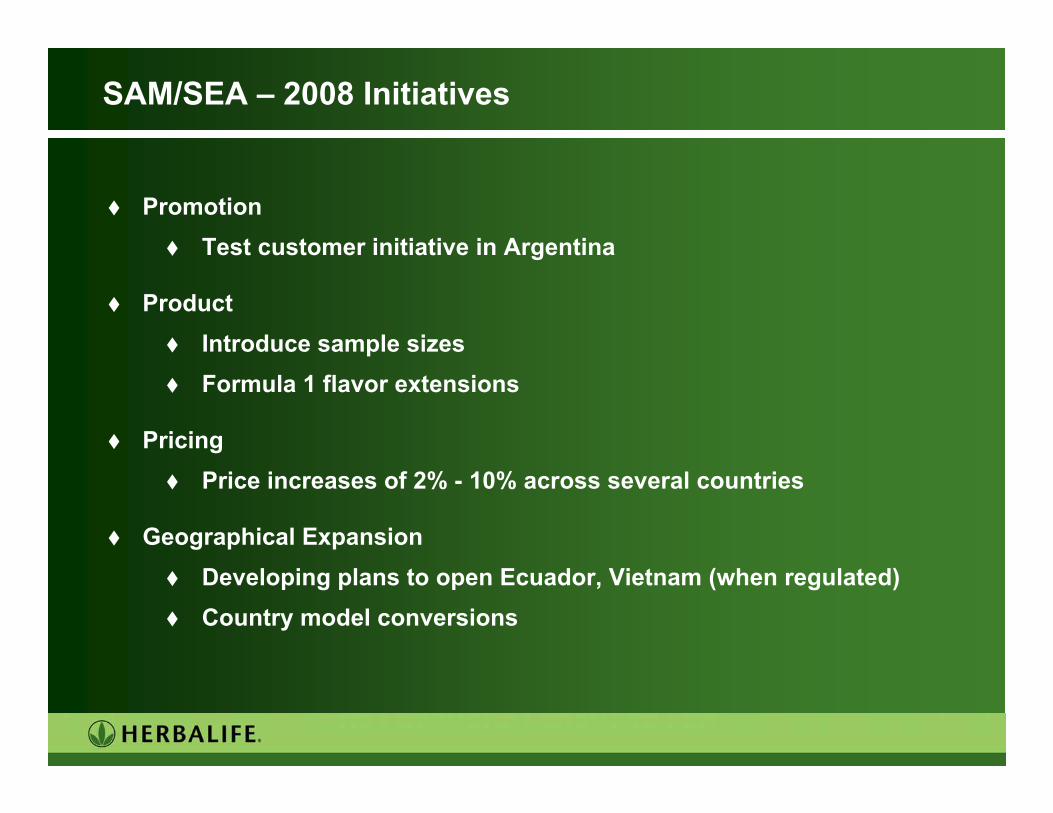
PromotionTest customer initiative in Argentina
ProductIntroduce sample sizesFormula 1 flavor extensions
PricingPrice increases of 2% - 10% across several countries
Geographical ExpansionDeveloping plans to open Ecuador, Vietnam (when regulated)Country model conversions
SAM/SEA – 2008 Initiatives

50
North Asia – Region Update
Dist ribut or Order St rat if icat ion
82.7%
2.3%15.0%0 . 0 %
2 0 . 0 %
4 0 . 0 %
6 0 . 0 %
8 0 . 0 %
10 0 . 0 %
discoun t cust omers small r et ailer s pot en t ial super visor
Supervisor Retention
28.2% 38.9% 48.6% 43.0%
0.0%
15.0%
30.0%
45.0%
60.0%
Feb 04Actual
Feb 05Actual
Feb 06Actual
Feb 07Actual
Volume Points3 Year Growth Trend
6.8% -4.9% 4.4%
-40,00080,000
120,000160,000
2005 2006 2007 (YTD Sept)
New Supervisors3 Year Growth Trend
21.1% 3.1% 2.6%-
4,0008,000
12,00016,000
2005 2006 2007 (YTD Sept)

51
North Asia – 2008 Initiatives
PromotionSupervisor Leadership Development in JapanFacilitate Nutrition Clubs in the region
ProductTri-Shield Fiber ComplexLarge size of Japan drinks
BrandTORAY Pan Pacific Open Tennis Tournament
Geographical ExpansionUpdate Korea offices

52
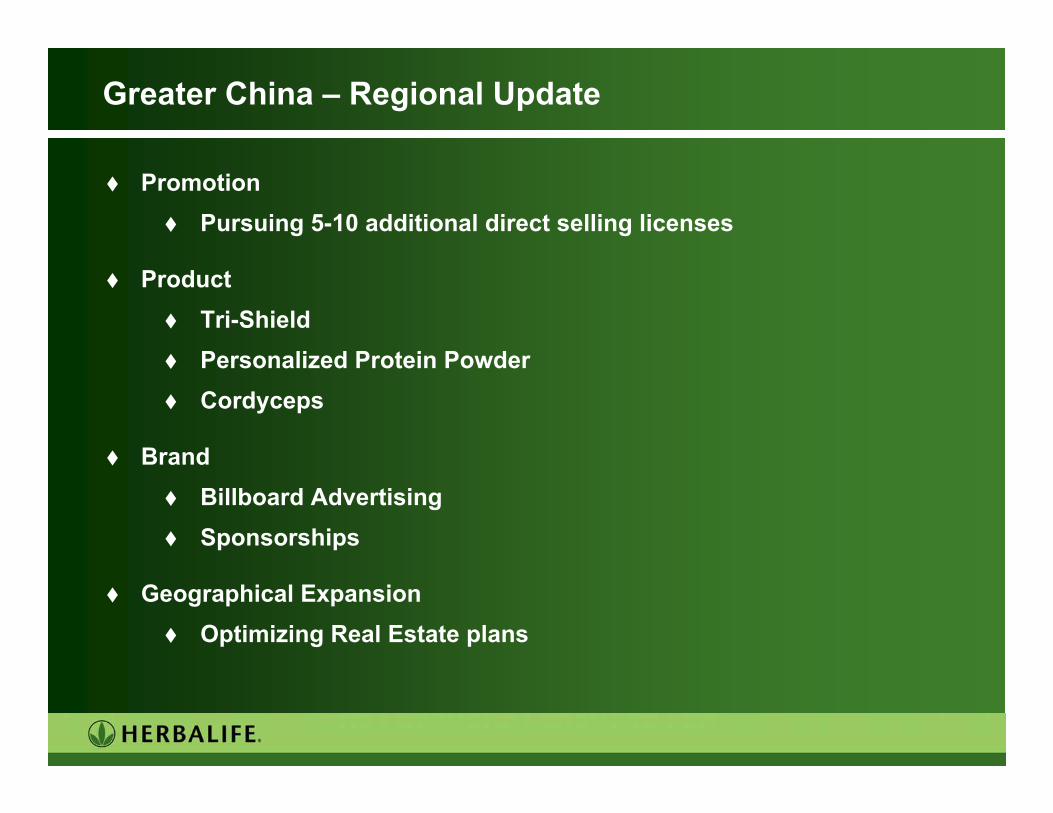
Greater China – Regional Update
Volume Points3 Year Growth Trend
15.9% 7.4% 46.3%
-
50,000
100,000
150,000
200,000
2005 2006 2007 (YTD Sept)
New Supervisors3 Year Growth Trend
82.2% 20.6% 20.2%
-
6,000
12,000
18,000
24,000
2005 2006 2007 (YTD Sept)
53
Greater China – Regional Update
PromotionPursuing 5-10 additional direct selling licenses
ProductTri-ShieldPersonalized Protein PowderCordyceps
BrandBillboard AdvertisingSponsorships
Geographical ExpansionOptimizing Real Estate plans

54
Richard GoudisChief Financial Officer

Financial Statements

56
A Track Record of Growth
$783$867
$956 $944$1,020
$1,094$1,159
$1,309
$1,567
$1,885
$200
$450
$700
$950
$1,200
$1,450
$1,700
$1,950
1997 1998 1999 2000 2001 2002 2003 2004 2005 2006 2007E
$56
$74
$119 $121
$134
$164
$25
$50
$75
$100
$125
$150
$175
2002 2003 2004 2005 2006 2007 YTD
Net Sales $ MM (Y-O-Y growth)
Free Cash Flow ($ MM)
Based on management’s guidance presented in a press release dated 11/6/07. Excludes certain one-time items. Refer to company’s press release dated 11/6/07. Estimates reflect sell-side analysts consensus for 4Q07 as published November 2007.
$2,054 – $2,092
+24%+11% +10% (1%)
+8%+7% +6%
+13%
+19%
+21%9-11%
New Management Team
New Management Team

57
1Q 2006 2Q 2006 3Q 2006 4Q 2006 1Q 2007 2Q 2007 3Q 2007 4Q 2007E
Financial Results
Note: Excludes certain one-time items. Refer to company’s press release dated 11/6/07. Estimates reflect sell-side analysts consensus for 4Q07 as published November 2007.
Operating Income (% of Net Sales)
14.1% 14.0% 13.5%14.5% 14.3%
14.7% 14.8%
15.5% -16.0%
(000s)
$456 $466$487
$508$530 $530
$01Q 2006 2Q 2006 3Q 2006 4Q 2006 1Q 2007 2Q 2007 3Q 2007 4Q
2007E
+22.5% +21.1% +18.8% +19.2%+11.5%
+13.8% +11.1% +9-11%
$531 -$541
$476
Net Sales (% Growth Y-O-Y)

58
Our Financial Model(Based upon September 2007 Y-T-D Results)
Handling & Freight $215m
DISTRIBUTOR ALLOWANCES
$1223m
NET SALES $1556m
21% PRODUCT
COST
36% ROYALTIES
16% DISTRIBUTOR
FACING
12% OVERHEAD
5% TAX1% INTEREST
9% Net Income
73% VARIABLE EXPENSES
18% OVERHEAD EXPENSES
$3.4B RETAIL SALES (Annualized)
Note: Above figures normalized for China distributor royalty payments
59
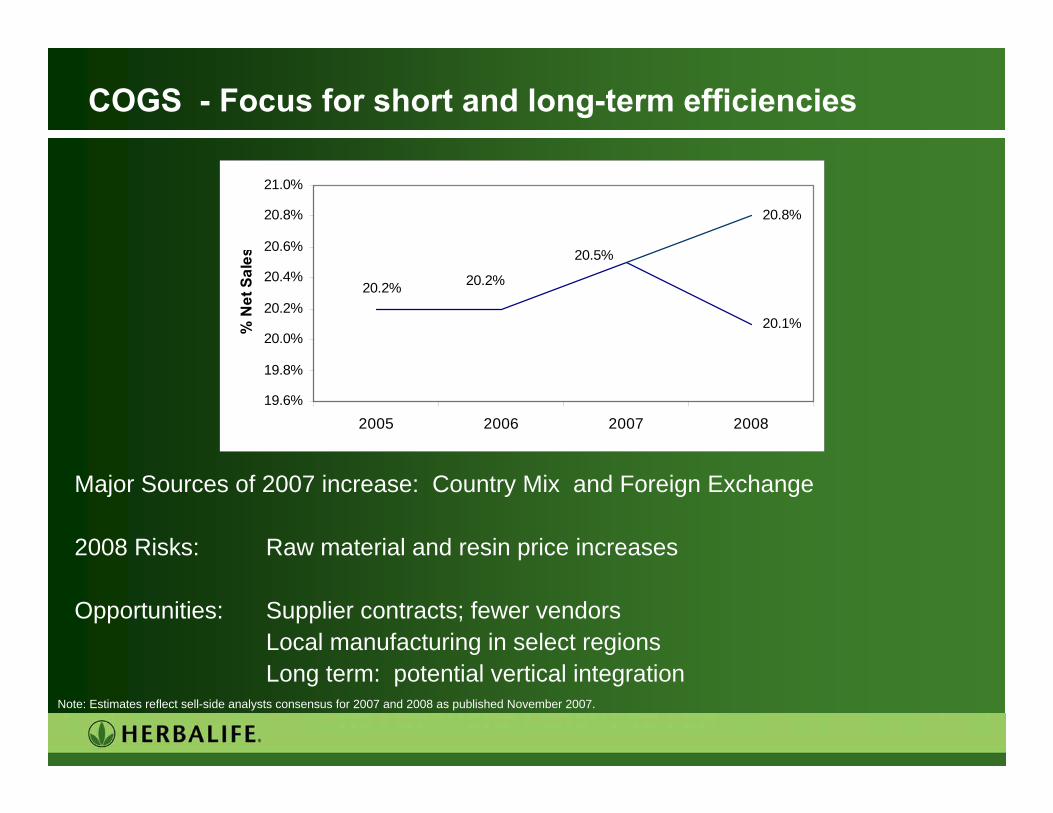
COGS - Focus for short and long-term efficiencies
Major Sources of 2007 increase: Country Mix and Foreign Exchange
2008 Risks: Raw material and resin price increases
Opportunities: Supplier contracts; fewer vendorsLocal manufacturing in select regionsLong term: potential vertical integration
Note: Estimates reflect sell-side analysts consensus for 2007 and 2008 as published November 2007.
20.1%
20.8%
20.2%20.2%
20.5%
19.6%
19.8%
20.0%
20.2%
20.4%
20.6%
20.8%
21.0%
2005 2006 2007 2008
% N
et S
ales

60
SG&A – Improvements
• SG&A as a percentage of net sales continues to decline demonstrating management’s actions to leverage the business
• 2008 Opportunities: Realignment for Growth Phase II
Country Models
28.9%29.5%
28.0%27.3%
30.0%29.2%
29.5%
30.4%
28.0%
25.0%
26.0%
27.0%
28.0%
29.0%
30.0%
31.0%
2005 2006 2007 2008
% N
et S
ales
As reported Normalized for China
Note: Estimates reflect sell-side analysts consensus for 2007 and 2008 as published November 2007.

61
Events by Quarter
20082007
Brazil ExtravaganzaBrazil ExtravaganzaFourth Quarter
North America Extravaganza
Asia Extravaganza
Mexico Extravaganza
Chairman’s Club Retreat (China)
EMEA Extravaganza
North America Extravaganza
Asia Pacific Extravaganza
Mexico Extravaganza
Third Quarter
EMEA ExtravaganzaSecond Quarter
South America Extravaganza
Herbalife Honors (Singapore)
Latin America Extravaganza
Chairman’s Club Retreat (US)
President’s Team Summit (US)
First Quarter

62
Effective Tax Rate
• The effective tax rate has followed an improvement curve reflecting the successful execution of our corporate legal restructuring.
• Operating line exclude significant prior period tax refunds and assessments from our current operating rate.
Note: Estimates reflect sell-side analysts consensus for 2007 and 2008 as published November 2007.
Effective Tax Rate
40.9% 38.1%
lowthirties37.3%
46.8%
34.1%
37.5%
25.0%
30.0%
35.0%
40.0%
45.0%
50.0%
2005 2006 2007 2008
Operating ETR As Reported

63
Strong Balance Sheet
(1) Excludes certain one-time items.
12/31/2004 12/31/2005 12/31/2006 09/30/07Cash & Cash Equivalents $202 $88 $154 $161Debt:
Borrowings Under Senior Credit Facility
200 90 179 149
9½% Notes 268 161 - -Revolver 79Capitalized Leases & Other Debt 18 12 6 6
Total Debt $486 $263 $185 $234
Shareholders’ Equity 64 169 354 295Total Capitalization $550 $432 $539 $529
Total Debt / LTM EBITDA(1) 2.7x 1.1x 0.6x 0.7xNet Debt / LTM EBITDA(1) 1.6x 0.7x 0.1x 0.2xNet Debt $284 $175 $31 $73

64
2002
2003
2004
2005
2006
YTD 2006
YTD 2007
Net Income $23.2 $36.8 $54.9 $103.6 $159.7 $101.5 $137.6
Depreciation and Amortization 26.8 55.6 43.9 35.4 30.0 21.9 25.9
Write-off of Deferred Financing Costs and Unamortized Discounts ─ 1.4 30.8 6.0 7.1 6.6 0.2
Change in Working Capital 25.0 (1.2) 5.1 20.5 37.0 43.6 40.5
Other (9.1) 1.8 14.6 (11.6) (32.8) (28.6) (9.2)
Cash Flow from Operations $65.9 $94.4 $149.3 $153.9 $201.0 $145.0 $195.0
Capital Expenditures (10.4) (20.4) (30.3) (32.6) (66.9) (45.5) (30.6)
Free Cash Flow $55.5 $74.0 $119.0 $121.3 $134.1 $99.5 $164.4
Strong Cash Flow
(1) Excludes $40.6 million in cash recapitalization expenses.(2) Excludes $10.5 million in cash recapitalization expenses.(3) Excludes $16.6 million in cash recapitalization expenses.(4) Includes $7.5 million in TI allowances that will be amortized over the life of a new facility lease.
(1) (2) (3)
(4)

Guidance

66
Consistently Delivering Results
Street Estimate Reported / Guidance
2004 IPO (2005 EPS) $ 1.14 $1.52
At 2005 Secondary (2006 EPS) $1.85 $2.06
2007 EPS
At November 6, 2006 $ 2.45 $2.40 - 2.47
At February 26, 2007 $ 2.46 $2.43 - 2.50
At May 1, 2007 $2.48 $2.49 – 2.56
At August 6, 2007 $2.54 $2.56 – 2.61
At November 9, 2007 $2.65 $2.62 – 2.64
2008 EPS
At November 9, 2007 $ 3.20 $3.17 - 3.23
(1) Source: Thomson First Call
(1)
2007 Guidance Details: 2007 2008
Net sales growth YOY 9.0% - 11.0% 7.0% - 10.0%Effective tax rate 37.0% - 37.5% -----CapEx (mm’s) $43.0 - $45.0 $85.0 - $95.0

67
Questions
Michael O. JohnsonGreg ProbertRich Goudis

68
Michael O. JohnsonChairman and Chief Executive Officer

Closing Remarks

70
Direct Selling Index Components: AVP, BHIP, MTEX, NATR, NATU3, NUS, ORI.SDB, RELV, TUP, USNA (index is equal weighted to prevent Avon skew at 67% of the index)
266
124
120
HLF IPO to Date: Total Shareholder Value(Relative Performance, 12/16/04 = 100)
Source: CapitalIQNote: HLF share price $38.75 at close 11/26/2007; Total Return = stock price changes + dividends
HLF Direct Selling Index S&P 500
50
100
150
200
250
300
350
Dec-04
Mar-05
Jun-05
Sep-05
Dec-05
Mar-06
Jun-06
Sep-06
Dec-06
Mar-07
Jun-07
Sep-07

71
Investment Highlights
• Successful track record, driven by positive global mega trends
• Unique distribution channel for emerging markets and consultative products
• Geographic diversification throughout 65 markets and across four major product categories
• Financial strength – Strong cash flow– Margin expansion– Strong balance sheet– Economically resilient
• High degree of shareholder focus– Disciplined capital allocation– Free cash flow allocated to high ROI programs
• Share repurchase program - +$200MM completed since April 2007
• Proven management team