s1- alphabetical list of aging-related genes
TRANSCRIPT

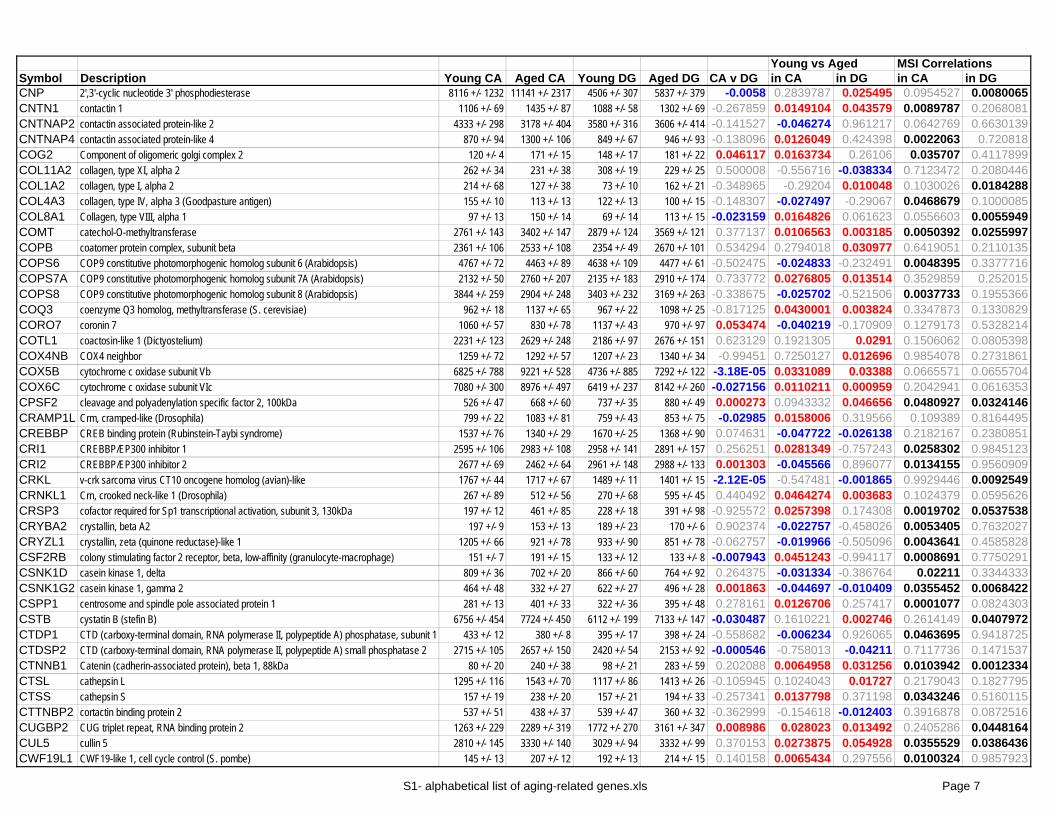
Young vs Aged MSI CorrelationsSymbol Description Young CA Aged CA Young DG Aged DG CA v DG in CA in DG in CA in DGAARSL alanyl-tRNA synthetase like 672 +/- 50 780 +/- 24 666 +/- 26 777 +/- 38 -0.959643 0.0904189 0.04684 0.0097575 0.0922137AASDH 2-aminoadipic 6-semialdehyde dehydrogenase 587 +/- 19 771 +/- 21 501 +/- 29 664 +/- 26 -6.83E-05 8.644E-05 0.002318 0.0046175 0.0347906ABCG2 ATP-binding cassette, sub-family G (WHITE), member 2 437 +/- 47 523 +/- 31 335 +/- 10 398 +/- 11 -0.001844 0.1582204 0.002045 0.1826101 0.0544598ABHD14A abhydrolase domain containing 14A 1760 +/- 56 1515 +/- 91 1973 +/- 103 1818 +/- 29 0.010547 -0.048824 -0.200935 0.0371071 0.3262792ABP1 Amiloride binding protein 1 (amine oxidase (copper-containing)) 105 +/- 10 165 +/- 23 154 +/- 17 181 +/- 18 0.021482 0.0527017 0.302632 5.18E-05 0.0770133ABTB2 Ankyrin repeat and BTB (POZ) domain containing 2 654 +/- 122 485 +/- 39 505 +/- 32 342 +/- 18 -0.030184 -0.236531 -0.002265 0.5021444 0.0832426ACAA2 acetyl-Coenzyme A acyltransferase 2 (mitochondrial 3-oxoacyl-Coenzyme A thiolase) 589 +/- 56 854 +/- 62 529 +/- 31 645 +/- 33 -0.03897 0.0097889 0.030153 0.000594 0.1078687ACACB acetyl-Coenzyme A carboxylase beta 124 +/- 17 175 +/- 13 138 +/- 12 164 +/- 12 0.943167 0.0376355 0.152219 0.0293754 0.3358733ACADL acyl-Coenzyme A dehydrogenase, long chain 234 +/- 12 184 +/- 12 226 +/- 9 179 +/- 19 -0.359297 -0.013599 -0.065477 0.0959391 0.0845069ACAT1 acetyl-Coenzyme A acetyltransferase 1 (acetoacetyl Coenzyme A thiolase) 4099 +/- 188 3515 +/- 106 3250 +/- 137 3238 +/- 137 -0.007467 -0.027046 -0.954273 0.1128106 0.9705821ACCN1 amiloride-sensitive cation channel 1, neuronal (degenerin) 1925 +/- 136 1421 +/- 164 1179 +/- 59 900 +/- 42 -0.000254 -0.040656 -0.004392 0.0273253 0.0121481ACIN1 apoptotic chromatin condensation inducer 1 1859 +/- 171 1790 +/- 102 2092 +/- 94 1822 +/- 45 0.172929 -0.735092 -0.03529 0.8562892 0.0993413ACO1 aconitase 1, soluble 964 +/- 82 811 +/- 43 950 +/- 45 803 +/- 46 -0.754764 -0.139533 -0.048938 0.1183283 0.0289747ACOT9 acyl-CoA thioesterase 9 370 +/- 33 344 +/- 40 284 +/- 9 218 +/- 20 -0.001741 -0.63831 -0.024981 0.6715461 0.2839666ACP1 acid phosphatase 1, soluble 2644 +/- 165 2074 +/- 157 2357 +/- 91 2031 +/- 147 -0.085298 -0.031306 -0.10182 0.009087 0.0106821ACP6 acid phosphatase 6, lysophosphatidic 881 +/- 49 984 +/- 51 742 +/- 28 837 +/- 8 -0.002935 0.171551 0.018151 0.0355159 0.0710112ACSS1 acyl-CoA synthetase short-chain family member 1 229 +/- 21 311 +/- 28 196 +/- 16 228 +/- 23 -0.013777 0.0442198 0.295382 0.092173 0.4151929ACTC actin, alpha, cardiac muscle 84 +/- 15 206 +/- 35 98 +/- 11 212 +/- 35 0.021907 0.0155645 0.029736 0.0980108 0.1657953ACTR10 actin-related protein 10 homolog (S. cerevisiae) 6172 +/- 108 6822 +/- 248 6301 +/- 210 7510 +/- 229 0.046595 0.0483003 0.003988 0.5901922 0.0845271ACTR1A ARP1 actin-related protein 1 homolog A, centractin alpha (yeast) 3191 +/- 134 2571 +/- 136 2763 +/- 211 2529 +/- 81 -0.241727 -0.008683 -0.339256 0.0015617 0.5937013ACVR1B activin A receptor, type IB 1767 +/- 140 1532 +/- 52 1675 +/- 66 1338 +/- 98 -0.117997 -0.163381 -0.023761 0.2017275 0.249096ACY1 aminoacylase 1 493 +/- 28 523 +/- 20 435 +/- 30 520 +/- 22 -0.072713 0.3972113 0.048724 0.6064414 0.155183ACY1L2 aminoacylase 1-like 2 224 +/- 39 230 +/- 24 450 +/- 41 321 +/- 40 0.001236 0.8951819 -0.050237 0.5937618 0.3209364ADA adenosine deaminase 265 +/- 19 352 +/- 29 341 +/- 51 373 +/- 25 0.130605 0.0331452 0.593305 0.0330362 0.5864965ADAM10 ADAM metallopeptidase domain 10 1557 +/- 99 1808 +/- 84 1420 +/- 70 1612 +/- 46 -0.053577 0.0837127 0.049117 0.0627916 0.3649355ADAM15 ADAM metallopeptidase domain 15 (metargidin) 1022 +/- 24 1299 +/- 94 1046 +/- 106 1001 +/- 50 -0.089311 0.0308546 -0.711056 0.1417549 0.7624836ADCK4 aarF domain containing kinase 4 430 +/- 24 546 +/- 40 383 +/- 31 503 +/- 38 -0.139029 0.0374119 0.039519 0.2730918 0.306371ADD1 adducin 1 (alpha) 4262 +/- 135 3716 +/- 140 3921 +/- 116 3527 +/- 163 -0.000231 -0.018613 -0.086088 0.0313122 0.2337141ADD3 adducin 3 (gamma) 2311 +/- 330 3058 +/- 364 3069 +/- 265 3733 +/- 91 0.020001 0.1598374 0.054267 0.1569602 0.2721863ADI1 acireductone dioxygenase 1 841 +/- 61 1306 +/- 144 924 +/- 99 1052 +/- 80 -0.633769 0.0213659 0.342331 0.0411467 0.8502112ADPRH ADP-ribosylarginine hydrolase 189 +/- 23 309 +/- 20 168 +/- 16 281 +/- 20 -0.015382 0.0030101 0.00234 0.0028139 0.0090525AFF3 AF4/FMR2 family, member 3 128 +/- 17 237 +/- 14 224 +/- 20 358 +/- 44 0.000454 0.0007359 0.034613 0.0013776 0.0003071AFTIPHILINaftiphilin protein 689 +/- 9 552 +/- 54 739 +/- 50 699 +/- 28 0.034714 -0.050685 -0.502967 0.1353892 0.6185892AGPAT3 1-acylglycerol-3-phosphate O-acyltransferase 3 124 +/- 10 226 +/- 20 169 +/- 8 232 +/- 26 0.32873 0.0024393 0.066576 0.0077687 0.0848176AGXT2L1 alanine-glyoxylate aminotransferase 2-like 1 3918 +/- 414 5586 +/- 247 3574 +/- 289 4607 +/- 398 -0.017396 0.0082839 0.070131 0.0534143 0.1478785AHCYL1 S-adenosylhomocysteine hydrolase-like 1 5935 +/- 600 7815 +/- 704 6059 +/- 511 8209 +/- 330 0.89046 0.0702645 0.007299 0.178801 0.1949046AHSA1 AHA1, activator of heat shock 90kDa protein ATPase homolog 1 (yeast) 3672 +/- 96 3351 +/- 98 3165 +/- 122 3121 +/- 103 -0.010338 -0.04181 -0.788981 0.0745863 0.7081707AIM1 absent in melanoma 1 368 +/- 97 238 +/- 44 114 +/- 15 175 +/- 22 -0.04556 -0.265509 0.050898 0.4169037 0.3555645AKAP2 A kinase (PRKA) anchor protein 2 119 +/- 16 187 +/- 25 136 +/- 11 180 +/- 30 0.449089 0.048877 0.230583 0.1043416 0.7033942AKAP8L A kinase (PRKA) anchor protein 8-like 115 +/- 15 71 +/- 9 120 +/- 16 99 +/- 3 0.145062 -0.038473 -0.237324 0.0940107 0.464845AKR7A2 aldo-keto reductase family 7, member A2 (aflatoxin aldehyde reductase) 1175 +/- 77 1379 +/- 69 853 +/- 46 1153 +/- 50 -0.000463 0.0781494 0.001841 0.3070654 0.0892846AKR7A3 aldo-keto reductase family 7, member A3 (aflatoxin aldehyde reductase) 722 +/- 43 917 +/- 15 718 +/- 9 959 +/- 30 0.634132 0.0049548 0.000763 0.0088467 0.0075985AKT3 V-akt murine thymoma viral oncogene homolog 3 (protein kinase B, gamma) 4120 +/- 100 3342 +/- 250 3311 +/- 184 3045 +/- 90 -0.019216 -0.025143 -0.234272 0.0121962 0.4146659ALDH3A1 aldehyde dehydrogenase 3 family, memberA1 99 +/- 11 267 +/- 57 115 +/- 22 357 +/- 54 0.192629 0.0317146 0.008136 0.1405832 0.1298736
S1- alphabetical list of aging-related genes.xls Page 1

Young vs Aged MSI CorrelationsSymbol Description Young CA Aged CA Young DG Aged DG CA v DG in CA in DG in CA in DGALDH3B1 aldehyde dehydrogenase 3 family, member B1 147 +/- 9 263 +/- 37 91 +/- 15 124 +/- 5 -0.002691 0.024391 0.084644 0.0284083 0.1508073ALG5 asparagine-linked glycosylation 5 homolog (S. cerevisiae, dolichyl-phosphate beta-glucosylt 601 +/- 24 662 +/- 22 529 +/- 14 623 +/- 25 -0.004397 0.089144 0.015616 0.0442575 0.0523303ALKBH8 alkB, alkylation repair homolog 8 (E. coli) 473 +/- 41 658 +/- 40 571 +/- 39 657 +/- 38 0.100357 0.009148 0.144295 0.026047 0.1802512ALS2CR7 amyotrophic lateral sclerosis 2 (juvenile) chromosome region, candidate 7 167 +/- 14 134 +/- 8 171 +/- 14 126 +/- 13 -0.89375 -0.070817 -0.048406 0.0693331 0.0090109AMY1A amylase, alpha 1A; salivary 217 +/- 46 706 +/- 123 210 +/- 34 692 +/- 108 -0.311506 0.0086487 0.008796 0.20853 0.1553613ANAPC1 anaphase promoting complex subunit 1 942 +/- 48 810 +/- 32 776 +/- 30 736 +/- 25 -0.002459 -0.048252 -0.328608 0.0962622 0.410849ANAPC10 anaphase promoting complex subunit 10 140 +/- 9 189 +/- 9 212 +/- 8 217 +/- 21 0.001658 0.003833 0.804792 0.0042811 0.1671211ANAPC11 APC11 anaphase promoting complex subunit 11 homolog (yeast) 1418 +/- 65 1478 +/- 46 1036 +/- 22 1185 +/- 40 -2.42E-05 0.4651226 0.015793 0.9601436 0.2593954ANAPC13 anaphase promoting complex subunit 13 1133 +/- 61 1351 +/- 62 1288 +/- 122 1286 +/- 100 0.659716 0.0312862 -0.989156 0.0454783 0.4677743ANGPT1 angiopoietin 1 1046 +/- 93 1388 +/- 95 1366 +/- 231 1407 +/- 71 0.128906 0.0281217 0.870727 0.0085604 0.9933055ANKH ankylosis, progressive homolog (mouse) 2365 +/- 119 2794 +/- 121 2527 +/- 92 2834 +/- 84 0.309715 0.0303359 0.035778 0.1664892 0.3065043ANKHD1 ankyrin repeat and KH domain containing 1 870 +/- 60 1083 +/- 30 945 +/- 57 1001 +/- 44 -0.975161 0.0145608 0.45834 0.0060792 0.436999ANKIB1 ankyrin repeat and IBR domain containing 1 1928 +/- 106 2973 +/- 269 1694 +/- 82 1917 +/- 65 -0.007949 0.009743 0.063334 9E-05 0.0839082ANKMY1 ankyrin repeat and MYND domain containing 1 80 +/- 6 123 +/- 12 89 +/- 10 110 +/- 19 -0.871513 0.0124915 0.377353 0.0331304 0.1804862ANKRD10 ankyrin repeat domain 10 912 +/- 51 1028 +/- 46 829 +/- 38 1027 +/- 65 -0.235634 0.116825 0.035519 0.1665156 0.2166634ANKRD11 ankyrin repeat domain 11 147 +/- 24 240 +/- 28 262 +/- 22 250 +/- 72 0.044845 0.0307121 -0.879094 0.0139103 0.3395989ANKRD16 ankyrin repeat domain 16 117 +/- 11 155 +/- 15 124 +/- 12 175 +/- 8 0.207757 0.078603 0.005667 0.4099566 0.0824376ANKRD20Aankyrin repeat domain 20 family, member A1 143 +/- 19 247 +/- 40 57 +/- 20 106 +/- 21 -0.004106 0.0508737 0.130608 0.0214372 0.1929429ANKRD34 ankyrin repeat domain 34 1681 +/- 72 1443 +/- 63 1781 +/- 88 1714 +/- 34 0.039068 -0.031915 -0.501221 0.0025436 0.8755633ANKRD37 ankyrin repeat domain 37 571 +/- 66 630 +/- 24 455 +/- 38 593 +/- 37 -0.099949 0.4327419 0.027995 0.4128942 0.0187851ANKRD43 ankyrin repeat domain 43 1626 +/- 115 1329 +/- 135 1930 +/- 112 1590 +/- 92 0.041881 -0.125069 -0.044003 0.1207345 0.1464073ANKRD52 ankyrin repeat domain 52 1020 +/- 66 863 +/- 45 1073 +/- 53 917 +/- 18 0.324193 -0.080713 -0.030652 0.1436219 0.1729886ANKS1B ankyrin repeat and sterile alpha motif domain containing 1B 7067 +/- 478 8852 +/- 493 7058 +/- 279 8534 +/- 485 -0.731046 0.0265886 0.035709 0.0075347 0.1131341ANP32B acidic (leucine-rich) nuclear phosphoprotein 32 family, member B 5261 +/- 630 6605 +/- 629 4342 +/- 135 4863 +/- 137 -0.020829 0.1620245 0.024182 0.065918 0.0327325AP2B1 adaptor-related protein complex 2, beta 1 subunit 7691 +/- 354 5572 +/- 446 5527 +/- 121 4060 +/- 189 -0.000127 -0.004297 -0.000323 0.0287975 0.0273872AP4E1 adaptor-related protein complex 4, epsilon 1 subunit 302 +/- 25 267 +/- 10 347 +/- 7 261 +/- 13 0.134526 -0.231272 -0.000873 0.8974693 0.010348AP4S1 adaptor-related protein complex 4, sigma 1 subunit 336 +/- 50 195 +/- 7 440 +/- 40 279 +/- 34 0.006951 -0.035594 -0.012958 0.0223472 0.0475868APBB1 amyloid beta (A4) precursor protein-binding, family B, member 1 (Fe65) 5027 +/- 303 5203 +/- 381 4570 +/- 115 4883 +/- 59 -0.153539 0.7245922 0.044144 0.539062 0.0316903APBB1IP amyloid beta (A4) precursor protein-binding, family B, member 1 interacting protein 146 +/- 16 200 +/- 16 146 +/- 13 166 +/- 11 -0.405789 0.0351104 0.285013 0.014208 0.6673145API5 apoptosis inhibitor 5 1659 +/- 24 1825 +/- 54 1812 +/- 42 1906 +/- 76 0.037835 0.0265735 0.322472 0.0189811 0.0551939APLP1 amyloid beta (A4) precursor-like protein 1 12980 +/- 687 13451 +/- 820 11777 +/- 440 13170 +/- 402 -0.27261 0.6699599 0.044232 0.6211934 0.2032392APLP2 Amyloid beta (A4) precursor-like protein 2 397 +/- 24 319 +/- 21 448 +/- 28 403 +/- 22 0.010772 -0.037329 -0.240439 0.077951 0.5159072APOA1BP apolipoprotein A-I binding protein 3444 +/- 146 3736 +/- 191 2627 +/- 74 3301 +/- 117 -0.000886 0.2539505 0.001861 0.2150369 0.0332909APOD apolipoprotein D 1694 +/- 156 2698 +/- 413 1143 +/- 60 1879 +/- 176 -0.002071 0.0605189 0.011046 0.0199683 0.0099519APRIN androgen-induced proliferation inhibitor 2075 +/- 34 1723 +/- 57 2125 +/- 61 1961 +/- 40 0.027176 -0.000695 -0.054459 7.079E-06 0.033862AQP4 aquaporin 4 3429 +/- 247 4405 +/- 244 3780 +/- 277 3499 +/- 199 -0.351243 0.0182687 -0.431325 0.0137531 0.4163361ARFIP2 ADP-ribosylation factor interacting protein 2 (arfaptin 2) 1246 +/- 34 1120 +/- 36 1244 +/- 43 1245 +/- 60 0.241294 -0.029165 0.986526 0.0071719 0.5121562ARHGAP1 Rho GTPase activating protein 1 2732 +/- 133 3160 +/- 91 2618 +/- 114 2959 +/- 91 -0.087418 0.0261302 0.045362 0.1377545 0.4245211ARHGAP2 Rho GTPase activating protein 21 696 +/- 46 796 +/- 50 840 +/- 34 715 +/- 22 0.242334 0.1755294 -0.014326 0.1245424 0.0339893ARHGAP26Rho GTPase activating protein 26 1897 +/- 171 1395 +/- 80 1867 +/- 154 1491 +/- 130 0.927036 -0.031968 -0.095828 0.0959248 0.1306623ARHGEF11Rho guanine nucleotide exchange factor (GEF) 11 658 +/- 70 564 +/- 45 969 +/- 43 769 +/- 57 0.000579 -0.290212 -0.023698 0.2544702 0.0498946ARHGEF12Rho guanine nucleotide exchange factor (GEF) 12 5718 +/- 162 5133 +/- 235 5709 +/- 82 5041 +/- 202 -0.824157 -0.070928 -0.025744 0.01647 0.0003521ARHGEF2 rho/rac guanine nucleotide exchange factor (GEF) 2 667 +/- 82 848 +/- 50 714 +/- 18 958 +/- 49 0.26721 0.093234 0.005343 0.1031341 0.0226937ARHGEF7 Rho guanine nucleotide exchange factor (GEF) 7 3467 +/- 223 2866 +/- 102 2911 +/- 102 2790 +/- 61 -0.02838 -0.043674 -0.336368 0.0223283 0.410873
S1- alphabetical list of aging-related genes.xls Page 2

Young vs Aged MSI CorrelationsSymbol Description Young CA Aged CA Young DG Aged DG CA v DG in CA in DG in CA in DGARID1B AT rich interactive domain 1B (SWI1-like) 517 +/- 50 742 +/- 58 815 +/- 107 980 +/- 67 0.000873 0.0153366 0.224649 0.1181921 0.401326ARIH1 Ariadne homolog, ubiquitin-conjugating enzyme E2 binding protein, 1 (Drosophila) 340 +/- 7 374 +/- 9 372 +/- 17 385 +/- 27 0.253827 0.0120777 0.684705 0.0779694 0.2231039ARIH2 ariadne homolog 2 (Drosophila) 1295 +/- 30 1073 +/- 49 1029 +/- 41 1044 +/- 54 -0.015864 -0.004513 0.829441 0.1147651 0.7756638ARL6IP ADP-ribosylation factor-like 6 interacting protein 153 +/- 21 148 +/- 10 183 +/- 10 128 +/- 9 0.490568 -0.810586 -0.002748 0.8348318 0.1231773ARMC2 armadillo repeat containing 2 247 +/- 26 192 +/- 9 249 +/- 6 220 +/- 6 0.279862 -0.097351 -0.008671 0.1105013 0.0027694ARMC6 armadillo repeat containing 6 565 +/- 25 466 +/- 18 510 +/- 19 463 +/- 34 -0.266613 -0.009367 -0.270282 0.0009704 0.4644186ARMCX1 armadillo repeat containing, X-linked 1 1267 +/- 41 1222 +/- 26 1385 +/- 38 1242 +/- 47 0.066419 -0.3784 -0.043796 0.506433 0.3617033ARPC1B actin related protein 2/3 complex, subunit 1B, 41kDa 265 +/- 16 338 +/- 19 206 +/- 20 235 +/- 20 -0.001183 0.0141484 0.321994 0.0021732 0.7072972ARPC5L actin related protein 2/3 complex, subunit 5-like 2033 +/- 80 1711 +/- 88 1873 +/- 143 1847 +/- 133 -0.931367 -0.022096 -0.8971 0.0104216 0.878848ARRB1 arrestin, beta 1 380 +/- 17 456 +/- 27 349 +/- 27 389 +/- 28 -0.156395 0.0424103 0.331062 0.0404324 0.6828249ARSD arylsulfatase D 461 +/- 56 623 +/- 41 464 +/- 64 612 +/- 50 -0.824537 0.043787 0.101284 0.1024168 0.15605ASAHL N-acylsphingosine amidohydrolase (acid ceramidase)-like 157 +/- 9 116 +/- 12 192 +/- 21 128 +/- 16 0.066622 -0.026696 -0.038097 0.0595455 0.0329058ASB6 ankyrin repeat and SOCS box-containing 6 176 +/- 8 150 +/- 8 238 +/- 19 208 +/- 4 6.79E-05 -0.052557 -0.185877 0.1854066 0.3284327ASB8 ankyrin repeat and SOCS box-containing 8 524 +/- 37 698 +/- 46 630 +/- 54 667 +/- 53 0.160758 0.015618 0.635976 0.0172022 0.3534385ASF1A ASF1 anti-silencing function 1 homolog A (S. cerevisiae) 389 +/- 32 477 +/- 23 500 +/- 19 435 +/- 10 0.20467 0.0535443 -0.016733 0.0253333 0.0195744ASPHD2 aspartate beta-hydroxylase domain containing 2 919 +/- 80 730 +/- 79 1141 +/- 46 992 +/- 32 0.002157 -0.122917 -0.027085 0.0684548 0.0557951ASTN2 Astrotactin 2 149 +/- 10 185 +/- 27 178 +/- 20 260 +/- 21 0.037549 0.2540618 0.021935 0.4993867 0.2857922ATAD2 ATPase family, AAA domain containing 2 97 +/- 15 148 +/- 7 117 +/- 7 127 +/- 8 -0.891597 0.0181211 0.41145 0.0864308 0.2851105ATF1 Activating transcription factor 1 660 +/- 47 833 +/- 36 824 +/- 43 894 +/- 69 0.085587 0.0165201 0.413932 0.0171804 0.3602559ATG12 ATG12 autophagy related 12 homolog (S. cerevisiae) 1361 +/- 96 1868 +/- 140 1316 +/- 125 1632 +/- 120 -0.087718 0.0157577 0.101921 0.0006093 0.020707ATG4B ATG4 autophagy related 4 homolog B (S. cerevisiae) 489 +/- 25 632 +/- 27 517 +/- 23 734 +/- 11 0.023955 0.0030799 5.64E-05 0.0439593 0.0065325ATP2C1 ATPase, Ca++ transporting, type 2C, member 1 2029 +/- 118 1514 +/- 111 1497 +/- 112 1332 +/- 42 -0.003401 -0.009807 -0.213381 0.0042259 0.2469229ATP5D ATP synthase, H+ transporting, mitochondrial F1 complex, delta subunit 1719 +/- 90 1425 +/- 89 2012 +/- 103 1836 +/- 84 0.000518 -0.042683 -0.215555 0.1947563 0.6087121ATP6V1C1ATPase, H+ transporting, lysosomal 42kDa, V1 subunit C1 998 +/- 141 706 +/- 35 1092 +/- 143 659 +/- 56 0.489304 -0.094192 -0.027765 0.1672911 0.1605408ATP6V1D ATPase, H+ transporting, lysosomal 34kDa, V1 subunit D 208 +/- 7 103 +/- 11 218 +/- 21 236 +/- 128 0.419591 -0.000226 0.891766 0.0042581 0.6526729ATP6V1H ATPase, H+ transporting, lysosomal 50/57kDa, V1 subunit H 5128 +/- 416 3241 +/- 499 4550 +/- 162 3067 +/- 564 -0.083263 -0.016199 -0.056256 0.0124313 0.0555702ATP8B2 ATPase, Class I, type 8B, member 2 1260 +/- 36 1102 +/- 43 1508 +/- 74 1279 +/- 39 0.000662 -0.018718 -0.027391 0.0716008 0.1292793ATPBD1B ATP binding domain 1 family, member B 517 +/- 51 773 +/- 37 492 +/- 40 837 +/- 27 0.822615 0.0029109 7.1E-05 0.0124511 0.0230446ATXN2 ataxin 2 1690 +/- 104 2226 +/- 102 1668 +/- 61 2193 +/- 86 -0.80154 0.0043761 0.001322 0.0391748 0.0196687ATXN7L1 ataxin 7-like 1 462 +/- 25 555 +/- 22 612 +/- 31 626 +/- 34 0.003912 0.0190188 0.771269 0.0840158 0.431721ATXN7L3 ataxin 7-like 3 4182 +/- 141 3742 +/- 124 3753 +/- 122 3589 +/- 83 -0.010413 -0.041159 -0.297757 0.0055341 0.7757953AURKA aurora kinase A 143 +/- 8 167 +/- 14 108 +/- 7 135 +/- 5 -0.003063 0.1749027 0.017575 0.0328976 0.0511261AURKAIP1 aurora kinase A interacting protein 1 1086 +/- 137 1595 +/- 169 1097 +/- 103 1678 +/- 137 0.160723 0.0426736 0.009992 0.1630108 0.0713341AXL AXL receptor tyrosine kinase 951 +/- 51 1108 +/- 50 906 +/- 51 754 +/- 67 -0.01455 0.054106 -0.110761 0.2028006 0.0169621AYP1 AYP1 protein 1952 +/- 156 2320 +/- 203 1716 +/- 121 2044 +/- 75 -0.127408 0.1834171 0.049916 0.0808976 0.0674348AZI2 5-azacytidine induced 2 394 +/- 23 458 +/- 16 409 +/- 24 439 +/- 10 -0.660114 0.0482444 0.292643 0.0336147 0.3530425B2M beta-2-microglobulin 7946 +/- 519 10622 +/- 678 6616 +/- 572 9837 +/- 646 -0.020796 0.0114966 0.005147 0.0423626 0.1051803B3GNT1 UDP-GlcNAc:betaGal beta-1,3-N-acetylglucosaminyltransferase 1 7168 +/- 286 6332 +/- 368 7310 +/- 119 6286 +/- 200 0.467301 -0.105163 -0.003595 0.0523104 0.0044193B3GNTL1 UDP-GlcNAc:betaGal beta-1,3-N-acetylglucosaminyltransferase-like 1 215 +/- 11 174 +/- 8 238 +/- 21 202 +/- 7 0.016043 -0.011299 -0.156849 0.0343221 0.3937487B4GALT3 UDP-Gal:betaGlcNAc beta 1,4- galactosyltransferase, polypeptide 3 1509 +/- 46 1313 +/- 50 1304 +/- 35 1196 +/- 29 -0.000177 -0.016366 -0.043079 0.0059715 0.0109205B4GALT5 UDP-Gal:betaGlcNAc beta 1,4- galactosyltransferase, polypeptide 5 2214 +/- 209 1568 +/- 99 1896 +/- 165 1568 +/- 81 -0.03683 -0.026376 -0.117469 0.0216119 0.1666359bA16L21.2 DnaJ-like protein 465 +/- 29 601 +/- 37 472 +/- 48 628 +/- 64 0.563406 0.0162922 0.086858 0.0074342 0.0212148BAALC brain and acute leukemia, cytoplasmic 5677 +/- 195 4724 +/- 234 5418 +/- 180 4924 +/- 267 -0.971717 -0.01105 -0.167427 0.0070715 0.0303023BAG1 BCL2-associated athanogene 642 +/- 54 817 +/- 54 829 +/- 57 905 +/- 31 0.029825 0.0459185 0.271393 0.2549285 0.394043
S1- alphabetical list of aging-related genes.xls Page 3

Young vs Aged MSI CorrelationsSymbol Description Young CA Aged CA Young DG Aged DG CA v DG in CA in DG in CA in DGBAG5 BCL2-associated athanogene 5 1207 +/- 46 1153 +/- 44 1176 +/- 30 1285 +/- 20 0.249987 -0.41745 0.015127 0.4431129 0.0787352BAX BCL2-associated X protein 831 +/- 23 877 +/- 24 728 +/- 13 807 +/- 21 -0.000268 0.188443 0.01614 0.3452937 0.1605293BBS10 Bardet-Biedl syndrome 10 654 +/- 36 800 +/- 32 792 +/- 37 735 +/- 48 0.282967 0.0127777 -0.374216 0.0041161 0.3153397BBX bobby sox homolog (Drosophila) 1408 +/- 90 1558 +/- 89 1131 +/- 18 1251 +/- 43 -0.00139 0.2635379 0.045523 0.1257724 0.0998663BCAP31 B-cell receptor-associated protein 31 1029 +/- 88 1543 +/- 54 860 +/- 54 1436 +/- 92 -0.001081 0.0009896 0.001211 0.004477 0.0133562BCL10 B-cell CLL/lymphoma 10 367 +/- 32 332 +/- 22 459 +/- 20 380 +/- 15 0.010289 -0.395955 -0.011414 0.3654709 0.0460348BCL9L B-cell CLL/lymphoma 9-like 590 +/- 55 534 +/- 38 851 +/- 35 651 +/- 50 0.002662 -0.417435 -0.012774 0.3931402 0.0874792BHLHB9 basic helix-loop-helix domain containing, class B, 9 1246 +/- 54 1079 +/- 55 1348 +/- 40 1378 +/- 74 0.00898 -0.054366 0.738951 0.0366155 0.1918358BICC1 Bicaudal C homolog 1 (Drosophila) 484 +/- 64 390 +/- 42 763 +/- 49 466 +/- 75 0.010564 -0.249579 -0.012458 0.4693602 0.1136697BICD2 bicaudal D homolog 2 (Drosophila) 1123 +/- 23 818 +/- 85 1051 +/- 110 902 +/- 129 0.056606 -0.014435 -0.404725 0.3535027 0.7955801BIRC6 baculoviral IAP repeat-containing 6 (apollon) 348 +/- 15 458 +/- 21 431 +/- 7 524 +/- 30 4.21E-05 0.0020667 0.034166 0.000872 0.0185995BOP1 block of proliferation 1 292 +/- 18 210 +/- 26 357 +/- 15 258 +/- 9 0.005846 -0.026404 -0.000564 0.0936834 0.0022434BPNT1 3'(2'), 5'-bisphosphate nucleotidase 1 161 +/- 18 269 +/- 23 210 +/- 23 267 +/- 28 0.158484 0.0048843 0.156536 0.0169403 0.0348519BRCC2 BRCC2 260 +/- 26 370 +/- 35 220 +/- 11 242 +/- 10 -0.012762 0.0323446 0.172532 0.0087585 0.3163604BRD2 bromodomain containing 2 683 +/- 52 469 +/- 53 945 +/- 41 572 +/- 72 0.004681 -0.016525 -0.003474 0.2800474 0.0970544BRD8 bromodomain containing 8 2792 +/- 155 3452 +/- 144 2758 +/- 92 3162 +/- 229 -0.266079 0.0110736 0.159508 0.0100204 0.057173BRWD2 bromodomain and WD repeat domain containing 2 564 +/- 69 382 +/- 3 593 +/- 41 404 +/- 22 0.615269 -0.046177 -0.004233 0.1376207 0.0357696BTBD12 BTB (POZ) domain containing 12 437 +/- 23 371 +/- 26 440 +/- 20 356 +/- 19 -0.804196 -0.083174 -0.013972 0.1339189 0.2063703BTBD2 BTB (POZ) domain containing 2 1567 +/- 138 1823 +/- 101 1620 +/- 100 2016 +/- 105 0.152705 0.1687539 0.023564 0.4501454 0.0686026BTBD6 BTB (POZ) domain containing 6 118 +/- 4 104 +/- 8 134 +/- 8 104 +/- 6 0.312173 -0.15831 -0.015357 0.0606079 0.014503BTF3 basic transcription factor 3 1055 +/- 87 1438 +/- 101 1121 +/- 86 1351 +/- 104 -0.899068 0.0168246 0.126083 0.001568 0.0303016BTG4 B-cell translocation gene 4 106 +/- 9 193 +/- 31 105 +/- 8 196 +/- 11 0.585522 0.035256 0.000213 0.0939422 0.0050279BTN2A2 butyrophilin, subfamily 2, member A2 158 +/- 20 239 +/- 24 168 +/- 18 199 +/- 14 -0.434283 0.0262197 0.201096 0.0493648 0.6504022BTN3A1 butyrophilin, subfamily 3, member A1 194 +/- 23 323 +/- 36 209 +/- 19 260 +/- 29 -0.381616 0.0163828 0.183902 0.0577965 0.1481924BUB3 BUB3 budding uninhibited by benzimidazoles 3 homolog (yeast) 4140 +/- 127 3656 +/- 142 3469 +/- 169 3052 +/- 117 -0.000718 -0.02942 -0.074618 0.2495534 0.1460212BXDC5 brix domain containing 5 1465 +/- 71 1335 +/- 55 1579 +/- 58 1297 +/- 45 0.533917 -0.17978 -0.004051 0.3902844 0.0388022BZRP benzodiazapine receptor (peripheral) 565 +/- 74 798 +/- 62 374 +/- 21 504 +/- 36 -0.003355 0.0377401 0.018487 0.0214934 0.1014083BZW1 basic leucine zipper and W2 domains 1 5216 +/- 116 4624 +/- 192 4100 +/- 120 3941 +/- 258 -0.000248 -0.028896 -0.596853 0.0047402 0.2150581C1QC complement component 1, q subcomponent, C chain 541 +/- 44 951 +/- 109 482 +/- 52 755 +/- 55 -0.028928 0.0110178 0.006202 0.0003612 0.0024066CA10 carbonic anhydrase X 1854 +/- 361 1852 +/- 301 4062 +/- 174 3455 +/- 172 3.99E-05 -0.996745 -0.035214 0.9563537 0.1060229CABP4 calcium binding protein 4 167 +/- 42 189 +/- 30 193 +/- 12 142 +/- 16 -0.901635 0.6781443 -0.035053 0.3978992 0.0971859CABYR calcium binding tyrosine-(Y)-phosphorylation regulated (fibrousheathin 2) 307 +/- 34 240 +/- 11 269 +/- 21 207 +/- 8 -0.089852 -0.109651 -0.032139 0.1049094 0.0171144CACNA1A calcium channel, voltage-dependent, P/Q type, alpha 1A subunit 961 +/- 89 664 +/- 44 1617 +/- 110 993 +/- 119 0.000194 -0.018645 -0.004193 0.0747641 0.1216223CACNB1 calcium channel, voltage-dependent, beta 1 subunit 1084 +/- 79 825 +/- 44 1214 +/- 70 1044 +/- 36 0.009523 -0.021979 -0.065895 0.0056008 0.145536CALCOCO calcium binding and coiled-coil domain 1 1651 +/- 65 1696 +/- 88 1450 +/- 9 1669 +/- 54 -0.151045 0.6944536 0.014307 0.3147448 0.1743436CALCOCO calcium binding and coiled-coil domain 2 135 +/- 14 182 +/- 16 231 +/- 15 267 +/- 26 0.000718 0.0542604 0.274321 0.0064576 0.2571646CALD1 caldesmon 1 84 +/- 6 130 +/- 15 132 +/- 8 136 +/- 6 0.005626 0.0251705 0.710226 0.0022 0.752043CAMKK2 calcium/calmodulin-dependent protein kinase kinase 2, beta 2835 +/- 306 2109 +/- 116 2217 +/- 96 1716 +/- 125 -0.024082 -0.065712 -0.012947 0.0168465 0.0277705CAMSAP1 calmodulin regulated spectrin-associated protein 1 1864 +/- 55 1556 +/- 68 1653 +/- 70 1442 +/- 53 -0.000838 -0.005929 -0.039507 0.036372 0.1589263CAMTA1 calmodulin binding transcription activator 1 3071 +/- 288 2648 +/- 114 3284 +/- 169 2656 +/- 62 0.5964 -0.218065 -0.011943 0.1678939 0.0245317CAPN2 calpain 2, (m/II) large subunit 2440 +/- 204 3016 +/- 132 1931 +/- 137 2492 +/- 70 -0.000223 0.0430506 0.00757 0.0562623 0.0767471CAPN7 calpain 7 580 +/- 29 674 +/- 27 693 +/- 37 800 +/- 39 0.004627 0.039422 0.081336 0.0466246 0.266771CAPNS1 calpain, small subunit 1 7708 +/- 486 6177 +/- 323 7211 +/- 399 6252 +/- 282 -0.353239 -0.028383 -0.082827 0.0128554 0.156197CAPZB capping protein (actin filament) muscle Z-line, beta 8247 +/- 582 6857 +/- 252 6783 +/- 248 5959 +/- 245 -0.006127 -0.065542 -0.0425 0.1260651 0.0938284
S1- alphabetical list of aging-related genes.xls Page 4

Young vs Aged MSI CorrelationsSymbol Description Young CA Aged CA Young DG Aged DG CA v DG in CA in DG in CA in DGCARD9 caspase recruitment domain family, member 9 119 +/- 10 107 +/- 15 126 +/- 10 91 +/- 8 -0.759742 -0.509165 -0.024558 0.6904611 0.1781829CARF collaborates/cooperates with ARF (alternate reading frame) protein 269 +/- 10 254 +/- 13 331 +/- 17 273 +/- 18 0.037888 -0.405664 -0.042435 0.9848762 0.2328383CASP6 Caspase 6, apoptosis-related cysteine peptidase 345 +/- 21 260 +/- 29 301 +/- 24 283 +/- 18 -0.233104 -0.040368 -0.566645 0.0229999 0.2626178CAST calpastatin 990 +/- 127 1424 +/- 112 822 +/- 41 1048 +/- 19 -0.011634 0.0287645 0.00158 0.0161794 0.0076301CAST1 CAZ-associated structural protein 3281 +/- 360 2648 +/- 269 4391 +/- 181 3526 +/- 194 0.000442 -0.19195 -0.010196 0.208326 0.0276119CBARA1 calcium binding atopy-related autoantigen 1 1698 +/- 52 1549 +/- 37 1445 +/- 72 1507 +/- 58 -0.017109 -0.04407 0.517737 0.1406721 0.701145CBL Cas-Br-M (murine) ecotropic retroviral transforming sequence 1129 +/- 118 865 +/- 92 1148 +/- 81 844 +/- 74 -0.828443 -0.109053 -0.021736 0.1314337 0.0102932CBR4 Carbonyl reductase 4 86 +/- 10 138 +/- 8 105 +/- 19 109 +/- 10 -0.882959 0.0021832 0.871819 0.0006885 0.9016726CBX3 chromobox homolog 3 (HP1 gamma homolog, Drosophila) 2091 +/- 138 2460 +/- 88 2478 +/- 74 2807 +/- 90 0.000466 0.0528484 0.021609 0.0976501 0.0574181CCAR1 Cell division cycle and apoptosis regulator 1 149 +/- 19 225 +/- 17 200 +/- 14 216 +/- 12 0.277002 0.0143201 0.403649 0.0202498 0.8580945CCDC109Acoiled-coil domain containing 109A 569 +/- 44 445 +/- 19 621 +/- 31 560 +/- 29 0.009885 -0.036178 -0.189661 0.0297814 0.12063CCDC28A coiled-coil domain containing 28A 2372 +/- 140 2508 +/- 155 2361 +/- 84 2730 +/- 55 0.347593 0.5291304 0.005847 0.829815 0.0865784CCDC44 coiled-coil domain containing 44 792 +/- 36 669 +/- 27 578 +/- 22 598 +/- 31 -0.00364 -0.021618 0.607391 0.0106531 0.7380396CCDC46 coiled-coil domain containing 46 98 +/- 13 159 +/- 31 208 +/- 13 282 +/- 17 0.000554 0.1194535 0.009056 0.2527666 0.1569679CCDC49 coiled-coil domain containing 49 276 +/- 18 313 +/- 20 246 +/- 12 319 +/- 21 -0.229076 0.2021114 0.019118 0.0975286 0.0471031CCDC72 coiled-coil domain containing 72 4579 +/- 407 4039 +/- 229 3214 +/- 212 2593 +/- 139 -0.000493 -0.281026 -0.038621 0.5045182 0.0746598CCDC74A coiled-coil domain containing 74A 613 +/- 51 646 +/- 93 640 +/- 36 1150 +/- 118 0.030966 0.7647319 0.010155 0.4369118 0.0075341CCDC8 coiled-coil domain containing 8 394 +/- 24 308 +/- 20 374 +/- 23 310 +/- 19 -0.800822 -0.020152 -0.059179 0.1357534 0.1935142CCDC84 coiled-coil domain containing 84 574 +/- 64 492 +/- 41 476 +/- 29 359 +/- 41 -0.004905 -0.311384 -0.049202 0.5339314 0.2964875CCDC85A coiled-coil domain containing 85A 92 +/- 15 41 +/- 10 189 +/- 13 169 +/- 26 9.68E-05 -0.0203 -0.516734 0.0450543 0.794482CCDC86 coiled-coil domain containing 86 471 +/- 31 440 +/- 12 478 +/- 9 411 +/- 12 -0.745525 -0.386079 -0.002237 0.3407222 0.0276324CCDC95 coiled-coil domain containing 95 936 +/- 37 859 +/- 28 1082 +/- 28 950 +/- 21 0.002123 -0.12682 -0.004763 0.0487537 0.0046589CCDC98 coiled-coil domain containing 98 121 +/- 10 163 +/- 15 95 +/- 14 126 +/- 13 -0.036337 0.0442752 0.141438 0.0179696 0.319486CCDC99 Coiled-coil domain containing 99 843 +/- 108 1220 +/- 192 518 +/- 27 688 +/- 24 -0.003641 0.1255292 0.001168 0.0422772 0.0247073CCL27 chemokine (C-C motif) ligand 27 350 +/- 36 242 +/- 23 335 +/- 21 227 +/- 16 -0.621527 -0.034547 -0.002895 0.0368565 0.0037534CCNA1 cyclin A1 165 +/- 10 276 +/- 37 154 +/- 14 177 +/- 31 -0.03939 0.0301126 0.505994 0.0100349 0.5542809CCNDBP1 cyclin D-type binding-protein 1 1466 +/- 70 1579 +/- 106 1288 +/- 57 1562 +/- 89 -0.009416 0.3968733 0.035355 0.750233 0.1385804CCNF cyclin F 133 +/- 13 125 +/- 9 143 +/- 17 196 +/- 13 0.025337 -0.623944 0.034926 0.3664781 0.1488046CCRN4L CCR4 carbon catabolite repression 4-like (S. cerevisiae) 357 +/- 52 222 +/- 9 332 +/- 36 323 +/- 35 0.395085 -0.048061 -0.855937 0.0351474 0.6185892CCT3 chaperonin containing TCP1, subunit 3 (gamma) 2068 +/- 138 2872 +/- 102 1999 +/- 97 2727 +/- 72 -0.051148 0.0010854 0.000218 0.0758965 0.0618846CCT7 chaperonin containing TCP1, subunit 7 (eta) 926 +/- 48 785 +/- 35 940 +/- 51 822 +/- 54 0.409169 -0.039817 -0.146651 0.0916866 0.8382603CD2BP2 CD2 (cytoplasmic tail) binding protein 2 434 +/- 27 533 +/- 24 382 +/- 9 508 +/- 28 -0.052734 0.0224622 0.007719 0.1918141 0.0223613CD44 CD44 molecule (Indian blood group) 390 +/- 49 579 +/- 97 642 +/- 74 919 +/- 44 0.000529 0.1243777 0.012964 0.2130658 0.0386421CD47 CD47 molecule 2438 +/- 231 1877 +/- 56 2572 +/- 107 2131 +/- 78 0.068634 -0.059507 -0.009186 0.1748846 0.0110473CD5 CD5 molecule 143 +/- 6 90 +/- 18 125 +/- 19 122 +/- 17 0.702718 -0.034031 -0.906423 0.2326028 0.6804172CD52 CD52 molecule 303 +/- 58 621 +/- 52 251 +/- 51 388 +/- 37 -0.01515 0.0023325 0.057454 0.0100072 0.2205889CD58 CD58 molecule 179 +/- 17 277 +/- 45 140 +/- 9 195 +/- 13 -0.021073 0.0842023 0.010655 0.0174593 0.0055731CD63 CD63 molecule 3961 +/- 565 4903 +/- 297 3173 +/- 139 3664 +/- 165 -0.011074 0.1803626 0.050996 0.198092 0.4036024CD74 CD74 molecule, major histocompatibility complex, class II invariant chain 1810 +/- 283 3714 +/- 547 1215 +/- 171 2317 +/- 340 -0.016033 0.016153 0.027629 0.0079133 0.1049361CD81 CD81 molecule 13811 +/- 551 15425 +/- 255 12732 +/- 477 14927 +/- 743 -0.099974 0.0323751 0.041803 0.1944335 0.4250111CD99 CD99 molecule 895 +/- 110 1907 +/- 171 1138 +/- 143 2051 +/- 28 0.143353 0.0009003 0.001141 0.0008603 0.0179078CDC16 CDC16 cell division cycle 16 homolog (S. cerevisiae) 1071 +/- 33 1180 +/- 23 991 +/- 39 1063 +/- 17 -8.94E-05 0.0248663 0.13443 0.1310045 0.324503CDC25A cell division cycle 25A 235 +/- 35 330 +/- 18 224 +/- 25 264 +/- 25 -0.041807 0.0419309 0.285905 0.2069823 0.6622406CDC42EP1CDC42 effector protein (Rho GTPase binding) 1 483 +/- 70 667 +/- 95 446 +/- 30 548 +/- 33 -0.229542 0.1502334 0.047948 0.0722411 0.0967348
S1- alphabetical list of aging-related genes.xls Page 5

Young vs Aged MSI CorrelationsSymbol Description Young CA Aged CA Young DG Aged DG CA v DG in CA in DG in CA in DGCDH24 cadherin-like 24 969 +/- 98 925 +/- 70 890 +/- 56 690 +/- 25 -0.060269 -0.726266 -0.014013 0.6436917 0.0086368CDIPT CDP-diacylglycerol--inositol 3-phosphatidyltransferase (phosphatidylinositol synthase) 3358 +/- 206 3149 +/- 168 3343 +/- 117 2839 +/- 95 -0.40566 -0.451126 -0.008778 0.3661446 0.0872679CDK5R1 cyclin-dependent kinase 5, regulatory subunit 1 (p35) 3649 +/- 206 3034 +/- 85 4001 +/- 116 3504 +/- 169 0.04031 -0.029702 -0.043974 0.0157937 0.3073854CDK5RAP3CDK5 regulatory subunit associated protein 3 2040 +/- 139 2326 +/- 68 1983 +/- 100 2344 +/- 76 -0.912757 0.1059012 0.018858 0.2761314 0.1281429CDKL1 Cyclin-dependent kinase-like 1 (CDC2-related kinase) 246 +/- 38 126 +/- 18 235 +/- 31 154 +/- 10 0.544474 -0.02498 -0.045552 0.0374047 0.079404CDKN2D cyclin-dependent kinase inhibitor 2D (p19, inhibits CDK4) 1595 +/- 115 1240 +/- 71 1433 +/- 53 1337 +/- 51 -0.531545 -0.029208 -0.225029 0.0016399 0.2668989CDO1 cysteine dioxygenase, type I 3039 +/- 285 2226 +/- 153 2318 +/- 87 2399 +/- 90 -0.153675 -0.037331 0.537165 0.0164488 0.9143342CDS1 CDP-diacylglycerol synthase (phosphatidate cytidylyltransferase) 1 2137 +/- 201 1588 +/- 146 1255 +/- 83 1183 +/- 110 -0.001244 -0.054361 -0.618529 0.0098995 0.1633426CENPJ centromere protein J 96 +/- 18 264 +/- 61 97 +/- 12 311 +/- 82 0.110635 0.0401782 0.058315 0.0072099 0.0049012CEP170 centrosomal protein 170kDa 1001 +/- 123 1338 +/- 117 981 +/- 72 1209 +/- 49 -0.23448 0.0753206 0.029525 0.1319576 0.3466277CEP27 centrosomal protein 27kDa 292 +/- 19 350 +/- 15 317 +/- 12 384 +/- 28 0.123998 0.0392293 0.075453 0.0522933 0.4491202CEP63 centrosomal protein 63kDa 153 +/- 12 107 +/- 16 136 +/- 25 82 +/- 13 -0.08455 -0.045694 -0.097117 0.4379545 0.3680895CEPT1 choline/ethanolamine phosphotransferase 1 157 +/- 10 233 +/- 10 158 +/- 12 186 +/- 14 -0.098759 0.0003531 0.177277 0.0027786 0.2984887CES2 carboxylesterase 2 (intestine, liver) 171 +/- 23 239 +/- 16 196 +/- 22 188 +/- 19 -0.767725 0.0366105 -0.781637 0.006473 0.9958296CETN3 centrin, EF-hand protein, 3 (CDC31 homolog, yeast) 1063 +/- 34 1071 +/- 46 1089 +/- 38 984 +/- 18 -0.731738 0.8895652 -0.040433 0.2173904 0.2261738CFL2 cofilin 2 (muscle) 1198 +/- 120 1807 +/- 334 1128 +/- 106 1503 +/- 117 -0.245685 0.1350858 0.042518 0.017426 0.0658383CGI-38 brain specific protein 1185 +/- 160 1693 +/- 328 699 +/- 44 901 +/- 69 -0.01281 0.2043037 0.04339 0.1728503 0.1358712CHCHD3 coiled-coil-helix-coiled-coil-helix domain containing 3 2026 +/- 56 2199 +/- 30 2231 +/- 90 2360 +/- 104 0.004669 0.0263417 0.377636 0.0127559 0.5219367CHCHD4 coiled-coil-helix-coiled-coil-helix domain containing 4 566 +/- 39 497 +/- 32 476 +/- 27 398 +/- 11 -9.49E-05 -0.201579 -0.032704 0.2495831 0.0645877CHCHD7 coiled-coil-helix-coiled-coil-helix domain containing 7 1443 +/- 50 1660 +/- 71 1485 +/- 74 1658 +/- 34 0.228951 0.0341582 0.071556 0.1225051 0.1170426ChGn Chondroitin beta1,4 N-acetylgalactosaminyltransferase 117 +/- 12 160 +/- 11 80 +/- 9 120 +/- 16 -0.010554 0.0304215 0.074225 0.0509525 0.0348366CHKA choline kinase alpha 607 +/- 41 586 +/- 44 764 +/- 36 646 +/- 32 0.030471 -0.738949 -0.035292 0.8615465 0.0564405CHL1 cell adhesion molecule with homology to L1CAM (close homolog of L1) 5666 +/- 319 6673 +/- 332 5043 +/- 360 5085 +/- 214 -0.004389 0.0537679 0.922984 0.26906 0.9666862CHM choroideremia (Rab escort protein 1) 1904 +/- 130 2177 +/- 95 1862 +/- 132 2272 +/- 98 0.989552 0.1232673 0.035472 0.0876603 0.0370802CHST3 carbohydrate (chondroitin 6) sulfotransferase 3 639 +/- 84 773 +/- 125 385 +/- 5 482 +/- 26 -0.005146 0.3983593 0.019465 0.1758969 0.0445424CHSY1 carbohydrate (chondroitin) synthase 1 921 +/- 62 844 +/- 26 927 +/- 31 833 +/- 17 -0.880999 -0.289489 -0.031812 0.4493441 0.0670205CHURC1 churchill domain containing 1 2879 +/- 78 3384 +/- 118 2472 +/- 75 2873 +/- 90 -0.000854 0.006514 0.008507 0.0013983 0.0100486CIC capicua homolog (Drosophila) 2030 +/- 162 2055 +/- 125 3575 +/- 166 3066 +/- 138 3.82E-05 0.9079011 -0.042879 0.6272452 0.1751269CKAP1 cytoskeleton associated protein 1 1486 +/- 142 1105 +/- 70 1406 +/- 119 962 +/- 130 -0.374152 -0.045645 -0.033776 0.2838992 0.2017971CKLF chemokine-like factor 686 +/- 32 579 +/- 45 611 +/- 22 492 +/- 40 -0.011824 -0.086706 -0.037465 0.2042547 0.0197104CKMT1B creatine kinase, mitochondrial 1B 6947 +/- 213 5592 +/- 354 5522 +/- 246 4526 +/- 212 -0.00021 -0.010828 -0.013362 0.013891 0.1270608CKS1B CDC28 protein kinase regulatory subunit 1B 822 +/- 24 945 +/- 35 686 +/- 28 763 +/- 14 -0.000153 0.0180419 0.041455 0.0451127 0.2475416CLCC1 chloride channel CLIC-like 1 332 +/- 29 441 +/- 25 310 +/- 14 395 +/- 5 -0.051789 0.0179946 0.001145 0.066525 0.011344CLDN15 claudin 15 352 +/- 48 618 +/- 92 272 +/- 21 393 +/- 56 -0.005536 0.0355177 0.099515 0.0144859 0.0386216CLEC14A C-type lectin domain family 14, member A 139 +/- 9 108 +/- 10 129 +/- 11 111 +/- 13 -0.617085 -0.040997 -0.334514 0.2255612 0.8329779CLEC4A C-type lectin domain family 4, member A 101 +/- 9 155 +/- 10 108 +/- 13 131 +/- 18 -0.499229 0.0027728 0.334357 0.0041785 0.8807759CLK4 CDC-like kinase 4 2680 +/- 52 2262 +/- 87 2336 +/- 119 1847 +/- 72 -1.37E-05 -0.003237 -0.00787 0.0890823 0.0935707CLN3 ceroid-lipofuscinosis, neuronal 3, juvenile (Batten, Spielmeyer-Vogt disease) 69 +/- 19 166 +/- 24 72 +/- 18 167 +/- 36 0.962825 0.0104739 0.059108 0.1621091 0.4560878CLUAP1 clusterin associated protein 1 364 +/- 28 271 +/- 19 359 +/- 25 394 +/- 15 0.11188 -0.021404 0.266993 0.0150513 0.3768423CMTM3 CKLF-like MARVEL transmembrane domain containing 3 684 +/- 73 783 +/- 21 553 +/- 20 645 +/- 18 -0.004933 0.2413487 0.007506 0.1880707 0.0672783CMTM5 CKLF-like MARVEL transmembrane domain containing 5 2631 +/- 293 3487 +/- 483 1346 +/- 59 1861 +/- 191 -0.000853 0.1669512 0.051693 0.069623 0.0709191CNDP1 carnosine dipeptidase 1 (metallopeptidase M20 family) 1872 +/- 548 3446 +/- 569 974 +/- 183 2032 +/- 172 -0.014765 0.0742997 0.002279 0.0431478 0.006867CNNM3 Cyclin M3 133 +/- 9 173 +/- 11 136 +/- 17 194 +/- 15 0.464066 0.0157123 0.030455 0.0124335 0.0476581CNOT1 CCR4-NOT transcription complex, subunit 1 385 +/- 33 315 +/- 9 372 +/- 26 289 +/- 15 -0.133131 -0.091373 -0.022823 0.1665445 0.0437044
S1- alphabetical list of aging-related genes.xls Page 6
Young vs Aged MSI CorrelationsSymbol Description Young CA Aged CA Young DG Aged DG CA v DG in CA in DG in CA in DGCNP 2',3'-cyclic nucleotide 3' phosphodiesterase 8116 +/- 1232 11141 +/- 2317 4506 +/- 307 5837 +/- 379 -0.0058 0.2839787 0.025495 0.0954527 0.0080065CNTN1 contactin 1 1106 +/- 69 1435 +/- 87 1088 +/- 58 1302 +/- 69 -0.267859 0.0149104 0.043579 0.0089787 0.2068081CNTNAP2 contactin associated protein-like 2 4333 +/- 298 3178 +/- 404 3580 +/- 316 3606 +/- 414 -0.141527 -0.046274 0.961217 0.0642769 0.6630139CNTNAP4 contactin associated protein-like 4 870 +/- 94 1300 +/- 106 849 +/- 67 946 +/- 93 -0.138096 0.0126049 0.424398 0.0022063 0.720818COG2 Component of oligomeric golgi complex 2 120 +/- 4 171 +/- 15 148 +/- 17 181 +/- 22 0.046117 0.0163734 0.26106 0.035707 0.4117899COL11A2 collagen, type XI, alpha 2 262 +/- 34 231 +/- 38 308 +/- 19 229 +/- 25 0.500008 -0.556716 -0.038334 0.7123472 0.2080446COL1A2 collagen, type I, alpha 2 214 +/- 68 127 +/- 38 73 +/- 10 162 +/- 21 -0.348965 -0.29204 0.010048 0.1030026 0.0184288COL4A3 collagen, type IV, alpha 3 (Goodpasture antigen) 155 +/- 10 113 +/- 13 122 +/- 13 100 +/- 15 -0.148307 -0.027497 -0.29067 0.0468679 0.1000085COL8A1 Collagen, type VIII, alpha 1 97 +/- 13 150 +/- 14 69 +/- 14 113 +/- 15 -0.023159 0.0164826 0.061623 0.0556603 0.0055949COMT catechol-O-methyltransferase 2761 +/- 143 3402 +/- 147 2879 +/- 124 3569 +/- 121 0.377137 0.0106563 0.003185 0.0050392 0.0255997COPB coatomer protein complex, subunit beta 2361 +/- 106 2533 +/- 108 2354 +/- 49 2670 +/- 101 0.534294 0.2794018 0.030977 0.6419051 0.2110135COPS6 COP9 constitutive photomorphogenic homolog subunit 6 (Arabidopsis) 4767 +/- 72 4463 +/- 89 4638 +/- 109 4477 +/- 61 -0.502475 -0.024833 -0.232491 0.0048395 0.3377716COPS7A COP9 constitutive photomorphogenic homolog subunit 7A (Arabidopsis) 2132 +/- 50 2760 +/- 207 2135 +/- 183 2910 +/- 174 0.733772 0.0276805 0.013514 0.3529859 0.252015COPS8 COP9 constitutive photomorphogenic homolog subunit 8 (Arabidopsis) 3844 +/- 259 2904 +/- 248 3403 +/- 232 3169 +/- 263 -0.338675 -0.025702 -0.521506 0.0037733 0.1955366COQ3 coenzyme Q3 homolog, methyltransferase (S. cerevisiae) 962 +/- 18 1137 +/- 65 967 +/- 22 1098 +/- 25 -0.817125 0.0430001 0.003824 0.3347873 0.1330829CORO7 coronin 7 1060 +/- 57 830 +/- 78 1137 +/- 43 970 +/- 97 0.053474 -0.040219 -0.170909 0.1279173 0.5328214COTL1 coactosin-like 1 (Dictyostelium) 2231 +/- 123 2629 +/- 248 2186 +/- 97 2676 +/- 151 0.623129 0.1921305 0.0291 0.1506062 0.0805398COX4NB COX4 neighbor 1259 +/- 72 1292 +/- 57 1207 +/- 23 1340 +/- 34 -0.99451 0.7250127 0.012696 0.9854078 0.2731861COX5B cytochrome c oxidase subunit Vb 6825 +/- 788 9221 +/- 528 4736 +/- 885 7292 +/- 122 -3.18E-05 0.0331089 0.03388 0.0665571 0.0655704COX6C cytochrome c oxidase subunit VIc 7080 +/- 300 8976 +/- 497 6419 +/- 237 8142 +/- 260 -0.027156 0.0110211 0.000959 0.2042941 0.0616353CPSF2 cleavage and polyadenylation specific factor 2, 100kDa 526 +/- 47 668 +/- 60 737 +/- 35 880 +/- 49 0.000273 0.0943332 0.046656 0.0480927 0.0324146CRAMP1L Crm, cramped-like (Drosophila) 799 +/- 22 1083 +/- 81 759 +/- 43 853 +/- 75 -0.02985 0.0158006 0.319566 0.109389 0.8164495CREBBP CREB binding protein (Rubinstein-Taybi syndrome) 1537 +/- 76 1340 +/- 29 1670 +/- 25 1368 +/- 90 0.074631 -0.047722 -0.026138 0.2182167 0.2380851CRI1 CREBBP/EP300 inhibitor 1 2595 +/- 106 2983 +/- 108 2958 +/- 141 2891 +/- 157 0.256251 0.0281349 -0.757243 0.0258302 0.9845123CRI2 CREBBP/EP300 inhibitor 2 2677 +/- 69 2462 +/- 64 2961 +/- 148 2988 +/- 133 0.001303 -0.045566 0.896077 0.0134155 0.9560909CRKL v-crk sarcoma virus CT10 oncogene homolog (avian)-like 1767 +/- 44 1717 +/- 67 1489 +/- 11 1401 +/- 15 -2.12E-05 -0.547481 -0.001865 0.9929446 0.0092549CRNKL1 Crn, crooked neck-like 1 (Drosophila) 267 +/- 89 512 +/- 56 270 +/- 68 595 +/- 45 0.440492 0.0464274 0.003683 0.1024379 0.0595626CRSP3 cofactor required for Sp1 transcriptional activation, subunit 3, 130kDa 197 +/- 12 461 +/- 85 228 +/- 18 391 +/- 98 -0.925572 0.0257398 0.174308 0.0019702 0.0537538CRYBA2 crystallin, beta A2 197 +/- 9 153 +/- 13 189 +/- 23 170 +/- 6 0.902374 -0.022757 -0.458026 0.0053405 0.7632027CRYZL1 crystallin, zeta (quinone reductase)-like 1 1205 +/- 66 921 +/- 78 933 +/- 90 851 +/- 78 -0.062757 -0.019966 -0.505096 0.0043641 0.4585828CSF2RB colony stimulating factor 2 receptor, beta, low-affinity (granulocyte-macrophage) 151 +/- 7 191 +/- 15 133 +/- 12 133 +/- 8 -0.007943 0.0451243 -0.994117 0.0008691 0.7750291CSNK1D casein kinase 1, delta 809 +/- 36 702 +/- 20 866 +/- 60 764 +/- 92 0.264375 -0.031334 -0.386764 0.02211 0.3344333CSNK1G2 casein kinase 1, gamma 2 464 +/- 48 332 +/- 27 622 +/- 27 496 +/- 28 0.001863 -0.044697 -0.010409 0.0355452 0.0068422CSPP1 centrosome and spindle pole associated protein 1 281 +/- 13 401 +/- 33 322 +/- 36 395 +/- 48 0.278161 0.0126706 0.257417 0.0001077 0.0824303CSTB cystatin B (stefin B) 6756 +/- 454 7724 +/- 450 6112 +/- 199 7133 +/- 147 -0.030487 0.1610221 0.002746 0.2614149 0.0407972CTDP1 CTD (carboxy-terminal domain, RNA polymerase II, polypeptide A) phosphatase, subunit 1 433 +/- 12 380 +/- 8 395 +/- 17 398 +/- 24 -0.558682 -0.006234 0.926065 0.0463695 0.9418725CTDSP2 CTD (carboxy-terminal domain, RNA polymerase II, polypeptide A) small phosphatase 2 2715 +/- 105 2657 +/- 150 2420 +/- 54 2153 +/- 92 -0.000546 -0.758013 -0.04211 0.7117736 0.1471537CTNNB1 Catenin (cadherin-associated protein), beta 1, 88kDa 80 +/- 20 240 +/- 38 98 +/- 21 283 +/- 59 0.202088 0.0064958 0.031256 0.0103942 0.0012334CTSL cathepsin L 1295 +/- 116 1543 +/- 70 1117 +/- 86 1413 +/- 26 -0.105945 0.1024043 0.01727 0.2179043 0.1827795CTSS cathepsin S 157 +/- 19 238 +/- 20 157 +/- 21 194 +/- 33 -0.257341 0.0137798 0.371198 0.0343246 0.5160115CTTNBP2 cortactin binding protein 2 537 +/- 51 438 +/- 37 539 +/- 47 360 +/- 32 -0.362999 -0.154618 -0.012403 0.3916878 0.0872516CUGBP2 CUG triplet repeat, RNA binding protein 2 1263 +/- 229 2289 +/- 319 1772 +/- 270 3161 +/- 347 0.008986 0.028023 0.013492 0.2405286 0.0448164CUL5 cullin 5 2810 +/- 145 3330 +/- 140 3029 +/- 94 3332 +/- 99 0.370153 0.0273875 0.054928 0.0355529 0.0386436CWF19L1 CWF19-like 1, cell cycle control (S. pombe) 145 +/- 13 207 +/- 12 192 +/- 13 214 +/- 15 0.140158 0.0065434 0.297556 0.0100324 0.9857923
S1- alphabetical list of aging-related genes.xls Page 7

Young vs Aged MSI CorrelationsSymbol Description Young CA Aged CA Young DG Aged DG CA v DG in CA in DG in CA in DGCWF19L2 CWF19-like 2, cell cycle control (S. pombe) 477 +/- 43 740 +/- 86 434 +/- 31 541 +/- 30 -0.053544 0.0270477 0.035306 0.0017024 0.0346302CXADR Coxsackie virus and adenovirus receptor 2582 +/- 321 1752 +/- 139 2109 +/- 65 1507 +/- 97 -0.07616 -0.050205 -0.00121 0.0443685 0.0132856CXXC4 CXXC finger 4 336 +/- 31 432 +/- 16 266 +/- 21 359 +/- 24 -0.004324 0.0253939 0.01767 0.098273 0.053262CYB561 cytochrome b-561 156 +/- 15 132 +/- 15 162 +/- 7 131 +/- 10 0.939814 -0.284122 -0.034607 0.4861141 0.1017238CYCS cytochrome c, somatic 1114 +/- 69 1523 +/- 105 1124 +/- 93 1485 +/- 52 -0.99493 0.0103416 0.010191 0.1836039 0.1321904CYP2U1 cytochrome P450, family 2, subfamily U, polypeptide 1 588 +/- 29 675 +/- 23 522 +/- 14 543 +/- 13 -0.000203 0.0432777 0.29925 0.0939982 0.3473348CYR61 cysteine-rich, angiogenic inducer, 61 179 +/- 15 130 +/- 13 126 +/- 20 128 +/- 12 -0.105469 -0.034656 0.939443 0.0150256 0.8075061D21S2056EDNA segment on chromosome 21 (unique) 2056 expressed sequence 941 +/- 105 1138 +/- 59 786 +/- 44 1023 +/- 84 -0.012674 0.1404877 0.04602 0.2599288 0.1698107DAK dihydroxyacetone kinase 2 homolog (S. cerevisiae) 169 +/- 11 116 +/- 13 159 +/- 13 126 +/- 13 -0.883429 -0.009758 -0.113635 0.007527 0.0237072DBF4B DBF4 homolog B (S. cerevisiae) 88 +/- 14 172 +/- 19 93 +/- 13 170 +/- 27 0.81417 0.0066193 0.043191 0.0433228 0.0069601DBNDD2 dysbindin (dystrobrevin binding protein 1) domain containing 2 6719 +/- 435 8157 +/- 929 5664 +/- 297 6675 +/- 313 -0.029077 0.2029886 0.044247 0.0499254 0.0076164DBT dihydrolipoamide branched chain transacylase E2 462 +/- 33 608 +/- 51 504 +/- 30 557 +/- 59 -0.412108 0.0398338 0.4561 0.1623017 0.9693144DCAMKL2 doublecortin and CaM kinase-like 2 1543 +/- 280 1165 +/- 201 1470 +/- 91 1163 +/- 35 -0.698962 -0.30095 -0.017705 0.4026001 0.0526574DCTN4 dynactin 4 (p62) 2167 +/- 114 1786 +/- 115 2057 +/- 72 1769 +/- 87 -0.235129 -0.039592 -0.033853 0.4393145 0.3276353DCTN6 dynactin 6 2538 +/- 127 2919 +/- 63 2668 +/- 126 2992 +/- 196 0.155899 0.0299498 0.207326 0.24043 0.7900069DCUN1D1 DCN1, defective in cullin neddylation 1, domain containing 1 (S. cerevisiae) 2306 +/- 41 1936 +/- 62 1971 +/- 52 1884 +/- 74 -0.002173 -0.00083 -0.365085 0.000397 0.2125893DDB2 damage-specific DNA binding protein 2, 48kDa 98 +/- 11 160 +/- 9 88 +/- 9 129 +/- 8 -0.122515 0.0015318 0.005825 0.0023322 0.0568833DDHD1 DDHD domain containing 1 1480 +/- 235 2265 +/- 180 1320 +/- 221 1767 +/- 178 -0.001847 0.0253805 0.151224 0.1292407 0.5710365DDX48 DEAD (Asp-Glu-Ala-Asp) box polypeptide 48 1505 +/- 88 1696 +/- 45 1343 +/- 72 1561 +/- 54 -0.030789 0.0917214 0.038878 0.0217036 0.228826DDX58 DEAD (Asp-Glu-Ala-Asp) box polypeptide 58 600 +/- 31 706 +/- 25 583 +/- 35 620 +/- 21 -0.077657 0.0259954 0.387283 0.0095351 0.5212467DEDD2 death effector domain containing 2 610 +/- 25 569 +/- 23 643 +/- 21 576 +/- 15 0.190941 -0.256153 -0.027965 0.8402068 0.2988356DENND1C DENN/MADD domain containing 1C 279 +/- 20 236 +/- 9 241 +/- 20 176 +/- 16 -0.018819 -0.089721 -0.034211 0.1710881 0.0882096DENR density-regulated protein 231 +/- 38 119 +/- 19 238 +/- 27 245 +/- 52 0.136663 -0.031448 0.908312 0.0089864 0.8710639DFFA DNA fragmentation factor, 45kDa, alpha polypeptide 632 +/- 34 537 +/- 27 694 +/- 27 593 +/- 28 0.028154 -0.054305 -0.031207 0.1962728 0.2976787DGCR6 DiGeorge syndrome critical region gene 6 979 +/- 27 906 +/- 45 1037 +/- 42 905 +/- 24 0.277388 -0.196474 -0.026268 0.1973073 0.0392253DHX16 DEAH (Asp-Glu-Ala-His) box polypeptide 16 670 +/- 35 550 +/- 12 568 +/- 33 500 +/- 24 -0.001543 -0.01723 -0.127297 0.0113765 0.3034065DHX36 DEAH (Asp-Glu-Ala-His) box polypeptide 36 2428 +/- 119 3034 +/- 236 2322 +/- 107 2271 +/- 112 -0.0288 0.0537281 -0.750334 0.0091283 0.7833466DIP13B DIP13 beta 720 +/- 55 858 +/- 45 786 +/- 23 921 +/- 33 0.241895 0.0820758 0.010297 0.1216435 0.2661512DIP2C DIP2 disco-interacting protein 2 homolog C (Drosophila) 336 +/- 30 418 +/- 15 445 +/- 23 481 +/- 54 0.02934 0.0454459 0.56088 0.0322439 0.2303166DKFZP779 PRO0845 1349 +/- 59 1055 +/- 62 1202 +/- 31 955 +/- 46 -0.002435 -0.006254 -0.002851 0.1175901 0.0847625DLEU8 deleted in lymphocytic leukemia 8 330 +/- 44 467 +/- 42 228 +/- 18 277 +/- 20 -0.002854 0.0495718 0.100475 0.0142841 0.0960935DLG3 discs, large homolog 3 (neuroendocrine-dlg, Drosophila) 3182 +/- 238 2326 +/- 174 2460 +/- 135 2233 +/- 59 -0.069466 -0.017401 -0.167811 0.0156181 0.4314197DLGAP4 discs, large (Drosophila) homolog-associated protein 4 5343 +/- 423 4150 +/- 339 3362 +/- 229 2932 +/- 190 -0.000264 -0.053687 -0.182775 0.0176151 0.2355429DMRTA2 DMRT-like family A2 171 +/- 21 95 +/- 12 262 +/- 37 117 +/- 11 0.057533 -0.012484 -0.009962 0.0533963 0.0209679DMRTC1 DMRT-like family C1 490 +/- 23 258 +/- 25 324 +/- 18 327 +/- 38 -0.19937 -4.48E-05 0.951774 0.0086286 0.75672DMTF1 cyclin D binding myb-like transcription factor 1 2324 +/- 160 2497 +/- 93 2237 +/- 55 2007 +/- 60 -0.025523 0.3743629 -0.021051 0.1431864 0.1538993DNAJA5 DnaJ homology subfamily A member 5 145 +/- 11 219 +/- 23 120 +/- 15 134 +/- 16 -0.006805 0.0223379 0.546184 0.0218671 0.9701908DNAJB4 DnaJ (Hsp40) homolog, subfamily B, member 4 249 +/- 44 273 +/- 40 286 +/- 16 415 +/- 45 0.048566 0.6888496 0.042426 0.6548772 0.1443555DNAJB5 DnaJ (Hsp40) homolog, subfamily B, member 5 1205 +/- 78 888 +/- 41 1163 +/- 41 974 +/- 62 0.797996 -0.007385 -0.038186 0.0029897 0.0444014DNAJB6 DnaJ (Hsp40) homolog, subfamily B, member 6 3673 +/- 317 2730 +/- 233 3649 +/- 170 3344 +/- 450 0.519018 -0.039542 -0.553794 0.0553449 0.4061838DNAJC7 DnaJ (Hsp40) homolog, subfamily C, member 7 2338 +/- 63 1862 +/- 122 2348 +/- 84 2059 +/- 107 0.18815 -0.009345 -0.065691 0.0345218 0.3819805DNAPTP6 DNA polymerase-transactivated protein 6 3467 +/- 109 3025 +/- 90 3104 +/- 157 3123 +/- 114 -0.13326 -0.011511 0.925008 0.0015741 0.6415894DNM2 dynamin 2 623 +/- 66 744 +/- 63 541 +/- 14 626 +/- 29 -0.040153 0.2143312 0.04064 0.1455557 0.0790072DNPEP aspartyl aminopeptidase 711 +/- 27 636 +/- 18 663 +/- 42 616 +/- 40 -0.34376 -0.044533 -0.436049 0.0926153 0.3497293
S1- alphabetical list of aging-related genes.xls Page 8

Young vs Aged MSI CorrelationsSymbol Description Young CA Aged CA Young DG Aged DG CA v DG in CA in DG in CA in DGDOC2B double C2-like domains, beta 258 +/- 27 166 +/- 20 253 +/- 19 182 +/- 20 0.994989 -0.023575 -0.030196 0.0071815 0.0204606DOCK4 dedicator of cytokinesis 4 83 +/- 24 256 +/- 47 145 +/- 31 379 +/- 38 0.004588 0.0118613 0.001341 0.0689508 0.102621DOK4 docking protein 4 476 +/- 29 384 +/- 21 433 +/- 40 391 +/- 20 -0.35646 -0.031212 -0.376148 0.0008963 0.4148033DOK6 docking protein 6 1184 +/- 243 182 +/- 52 1228 +/- 38 204 +/- 68 0.238116 -0.00839 -6.71E-06 0.0219247 0.0162108DPF1 D4, zinc and double PHD fingers family 1 1631 +/- 91 1083 +/- 88 1997 +/- 111 1529 +/- 115 0.001532 -0.001498 -0.017396 0.0084248 0.1077978DPM2 dolichyl-phosphate mannosyltransferase polypeptide 2, regulatory subunit 870 +/- 18 1041 +/- 46 787 +/- 41 847 +/- 24 -0.004586 0.0119429 0.24205 0.0784903 0.3300363DRG2 developmentally regulated GTP binding protein 2 573 +/- 52 606 +/- 35 521 +/- 31 660 +/- 42 0.740595 0.6166757 0.031427 0.9007961 0.1741451DST dystonin 236 +/- 21 370 +/- 38 341 +/- 33 339 +/- 42 0.136939 0.0151058 -0.977158 0.0064604 0.3652233DTX3L deltex 3-like (Drosophila) 251 +/- 13 312 +/- 18 280 +/- 11 256 +/- 22 -0.422602 0.0240969 -0.357979 0.0931643 0.3178735DUS3L dihydrouridine synthase 3-like (S. cerevisiae) 283 +/- 16 306 +/- 11 221 +/- 15 291 +/- 20 -0.028388 0.273665 0.024862 0.3718957 0.1447019DUSP14 dual specificity phosphatase 14 990 +/- 110 838 +/- 108 1439 +/- 43 1252 +/- 51 0.001272 -0.347324 -0.021931 0.3335945 0.1388966DUSP16 dual specificity phosphatase 16 390 +/- 59 565 +/- 40 382 +/- 19 384 +/- 22 -0.062438 0.0381487 0.953696 0.0353272 0.8840471DYM dymeclin 885 +/- 42 957 +/- 31 771 +/- 20 925 +/- 49 -0.025964 0.2012926 0.030225 0.5115503 0.0192984DYNC2H1 dynein, cytoplasmic 2, heavy chain 1 508 +/- 62 728 +/- 72 644 +/- 82 957 +/- 115 0.003354 0.0439453 0.060176 0.2626924 0.3443156DYNC2LI1 dynein, cytoplasmic 2, light intermediate chain 1 663 +/- 56 564 +/- 36 662 +/- 33 520 +/- 17 -0.601184 -0.174754 -0.005517 0.3367994 0.0729974DYRK2 dual-specificity tyrosine-(Y)-phosphorylation regulated kinase 2 831 +/- 140 590 +/- 62 593 +/- 37 489 +/- 19 -0.081726 -0.160623 -0.040427 0.1266689 0.1330754DZIP1 DAZ interacting protein 1 1130 +/- 99 875 +/- 66 1406 +/- 101 904 +/- 129 0.050224 -0.060364 -0.015726 0.1075366 0.0672343DZIP1L DAZ interacting protein 1-like 133 +/- 14 134 +/- 14 213 +/- 16 147 +/- 7 0.00727 0.975474 -0.006561 0.9479433 0.0103985E2F3 E2F transcription factor 3 813 +/- 106 594 +/- 60 697 +/- 22 526 +/- 21 -0.190626 -0.111154 -0.000359 0.0884421 0.0277415EBF2 early B-cell factor 2 119 +/- 5 103 +/- 3 119 +/- 8 91 +/- 19 -0.58918 -0.028084 -0.241927 0.0820613 0.4058296ECD ecdysoneless homolog (Drosophila) 625 +/- 49 805 +/- 64 622 +/- 29 839 +/- 52 0.495522 0.0518555 0.009974 0.0080625 0.0248749ECHDC1 enoyl Coenzyme A hydratase domain containing 1 1796 +/- 60 1599 +/- 72 1651 +/- 62 1404 +/- 53 -0.003041 -0.061427 -0.013714 0.6316257 0.1433039ECRG4 esophageal cancer related gene 4 protein 529 +/- 11 661 +/- 53 803 +/- 58 778 +/- 126 0.00793 0.0538984 -0.863526 0.0081832 0.3276857EDD1 E3 ubiquitin protein ligase, HECT domain containing, 1 880 +/- 28 980 +/- 21 1000 +/- 50 955 +/- 46 0.269351 0.0177322 -0.513782 0.0471093 0.4856002EDF1 endothelial differentiation-related factor 1 2924 +/- 89 3195 +/- 140 2664 +/- 103 3111 +/- 63 -0.081532 0.1393159 0.006026 0.0524779 0.0028085EDG1 endothelial differentiation, sphingolipid G-protein-coupled receptor, 1 2404 +/- 126 2634 +/- 244 2878 +/- 139 2330 +/- 117 0.202934 0.4293595 -0.014497 0.4495916 0.0176538EDG2 endothelial differentiation, lysophosphatidic acid G-protein-coupled receptor, 2 5091 +/- 735 6481 +/- 945 2992 +/- 289 3972 +/- 198 -0.006517 0.2741158 0.022002 0.0528127 0.027661EDG4 endothelial differentiation, lysophosphatidic acid G-protein-coupled receptor, 4 173 +/- 16 166 +/- 12 211 +/- 12 168 +/- 8 0.169011 -0.730366 -0.014332 0.8755287 0.0104144EDG7 Endothelial differentiation, lysophosphatidic acid G-protein-coupled receptor, 7 906 +/- 85 1108 +/- 56 920 +/- 115 1256 +/- 85 0.270578 0.0789611 0.044672 0.0544164 0.1609179EEF1A1 eukaryotic translation elongation factor 1 alpha 1 11705 +/- 649 13512 +/- 606 11114 +/- 370 12852 +/- 588 -0.195276 0.0694277 0.041287 0.3456743 0.4914076EEF1A2 eukaryotic translation elongation factor 1 alpha 2 12229 +/- 451 10754 +/- 445 11925 +/- 233 11098 +/- 267 0.93132 -0.042274 -0.046167 0.0143564 0.3813578EFCAB2 EF-hand calcium binding domain 2 1046 +/- 47 1331 +/- 56 1121 +/- 95 1272 +/- 82 0.705551 0.0031117 0.260353 0.0092354 0.7531719EFEMP1 EGF-containing fibulin-like extracellular matrix protein 1 5116 +/- 149 5852 +/- 332 4920 +/- 274 5811 +/- 259 -0.968883 0.0863104 0.042475 0.0222773 0.1553735EFHA2 EF-hand domain family, member A2 3623 +/- 194 3050 +/- 248 4234 +/- 119 3864 +/- 96 0.006972 -0.100358 -0.038748 0.0544414 0.2160947EFHC2 EF-hand domain (C-terminal) containing 2 234 +/- 19 266 +/- 17 174 +/- 10 237 +/- 7 -0.003752 0.235678 0.000755 0.3789393 0.0642173EFNB2 ephrin-B2 1795 +/- 111 1406 +/- 118 910 +/- 113 742 +/- 59 -4.69E-06 -0.03715 -0.223194 0.0464358 0.3631596EGLN1 egl nine homolog 1 (C. elegans) 599 +/- 67 426 +/- 24 799 +/- 81 561 +/- 31 0.013278 -0.050058 -0.031492 0.0742366 0.0520918EGLN2 egl nine homolog 2 (C. elegans) 198 +/- 34 157 +/- 24 231 +/- 12 268 +/- 10 0.022033 -0.34357 0.04326 0.445131 0.4164312EI24 etoposide induced 2.4 mRNA 1967 +/- 197 2517 +/- 46 2093 +/- 202 2274 +/- 91 -0.648435 0.0374714 0.441747 0.0391908 0.2101078EID-3 EID-2-like inhibitor of differentiation-3 1170 +/- 82 1234 +/- 63 1297 +/- 45 1499 +/- 44 0.003591 0.5512022 0.010926 0.8176413 0.0879027EIF1AX eukaryotic translation initiation factor 1A, X-linked 237 +/- 22 1333 +/- 96 475 +/- 143 1352 +/- 99 0.415428 4.71E-05 0.00082 0.0002253 0.0525047EIF2AK4 eukaryotic translation initiation factor 2 alpha kinase 4 413 +/- 20 484 +/- 18 343 +/- 27 326 +/- 8 -0.000295 0.0263662 -0.570408 0.0087158 0.5093347EIF3S7 eukaryotic translation initiation factor 3, subunit 7 zeta, 66/67kDa 2662 +/- 54 2791 +/- 67 2401 +/- 59 2691 +/- 31 -0.004037 0.1657818 0.002838 0.2860517 0.0059068EIF3S9 eukaryotic translation initiation factor 3, subunit 9 eta, 116kDa 3204 +/- 180 2481 +/- 170 2961 +/- 100 2491 +/- 175 -0.387142 -0.01553 -0.055559 0.1213205 0.4933105
S1- alphabetical list of aging-related genes.xls Page 9

Young vs Aged MSI CorrelationsSymbol Description Young CA Aged CA Young DG Aged DG CA v DG in CA in DG in CA in DGEIF4G3 eukaryotic translation initiation factor 4 gamma, 3 3958 +/- 161 4220 +/- 172 3636 +/- 92 4030 +/- 135 -0.153024 0.2921752 0.045357 0.4686162 0.0015409EIF5A2 eukaryotic translation initiation factor 5A2 834 +/- 58 677 +/- 46 773 +/- 40 626 +/- 24 -0.107501 -0.062435 -0.013845 0.2520963 0.0887465EIF5B eukaryotic translation initiation factor 5B 746 +/- 19 848 +/- 36 734 +/- 20 791 +/- 15 -0.252486 0.0371269 0.052223 0.0020477 0.0552854ELAC1 elaC homolog 1 (E. coli) 257 +/- 16 328 +/- 22 295 +/- 19 351 +/- 12 0.005793 0.0277609 0.037583 0.0035732 0.0142275ELAVL3 ELAV (embryonic lethal, abnormal vision, Drosophila)-like 3 (Hu antigen C) 189 +/- 16 110 +/- 15 287 +/- 18 170 +/- 21 0.001759 -0.005034 -0.002436 0.013616 0.031892ELF3 E74-like factor 3 (ets domain transcription factor, epithelial-specific ) 129 +/- 10 68 +/- 11 136 +/- 10 86 +/- 15 0.139917 -0.002287 -0.022561 0.0009517 0.0674202ELK3 ELK3, ETS-domain protein (SRF accessory protein 2) 355 +/- 29 436 +/- 19 346 +/- 23 388 +/- 29 -0.207108 0.0421148 0.281535 0.0275506 0.4790472ELOVL4 elongation of very long chain fatty acids (FEN1/Elo2, SUR4/Elo3, yeast)-like 4 1955 +/- 115 1623 +/- 79 1858 +/- 101 1621 +/- 69 -0.630383 -0.04206 -0.086909 0.0266101 0.5416739ELTD1 EGF, latrophilin and seven transmembrane domain containing 1 216 +/- 15 319 +/- 20 190 +/- 19 228 +/- 17 -0.026701 0.0022995 0.16525 0.0005254 0.2394358EMD emerin (Emery-Dreifuss muscular dystrophy) 883 +/- 36 950 +/- 27 898 +/- 19 978 +/- 23 0.544975 0.1708619 0.026642 0.7273092 0.3835798EML4 echinoderm microtubule associated protein like 4 276 +/- 12 333 +/- 21 362 +/- 36 401 +/- 18 0.002134 0.0464792 0.35486 0.0068409 0.5067077EMP2 epithelial membrane protein 2 131 +/- 20 209 +/- 17 138 +/- 17 214 +/- 16 0.498061 0.0133384 0.011268 0.0207786 0.0159111EMP3 epithelial membrane protein 3 385 +/- 23 473 +/- 25 311 +/- 21 374 +/- 24 -0.001739 0.0295194 0.081156 0.0951945 0.7970266EMX2 empty spiracles homolog 2 (Drosophila) 860 +/- 116 836 +/- 85 1476 +/- 75 1238 +/- 46 0.000166 -0.874806 -0.027446 0.900048 0.0081431ENO1 enolase 1, (alpha) 7846 +/- 333 9198 +/- 336 6480 +/- 135 7880 +/- 253 -0.000391 0.0169672 0.00252 0.0783902 0.0568711EP400 E1A binding protein p400 812 +/- 48 952 +/- 33 925 +/- 77 961 +/- 76 0.115793 0.0389664 0.741597 0.0088177 0.300628EPB41L5 erythrocyte membrane protein band 4.1 like 5 80 +/- 8 128 +/- 8 94 +/- 11 112 +/- 3 -0.815495 0.002337 0.173636 0.0012424 0.3634233EPHB6 EPH receptor B6 1193 +/- 220 1171 +/- 59 814 +/- 60 1044 +/- 67 -0.122707 -0.925675 0.032399 0.7972843 0.1634836EPS15 epidermal growth factor receptor pathway substrate 15 6961 +/- 240 6152 +/- 333 6822 +/- 320 5815 +/- 233 -0.582912 -0.079764 -0.032351 0.5176281 0.1514397EPS8 epidermal growth factor receptor pathway substrate 8 1375 +/- 55 1537 +/- 28 1326 +/- 75 1257 +/- 47 -0.015856 0.0333534 -0.451632 0.0403725 0.1494764ERBB2IP erbb2 interacting protein 1656 +/- 204 2474 +/- 294 1821 +/- 122 2048 +/- 58 -0.515613 0.0485273 0.137143 0.0054073 0.2314574ERGIC3 ERGIC and golgi 3 2303 +/- 107 2433 +/- 73 2054 +/- 51 2319 +/- 42 -0.015545 0.3425289 0.003142 0.8177734 0.1119695ETF1 eukaryotic translation termination factor 1 243 +/- 4 206 +/- 11 313 +/- 29 253 +/- 16 0.004699 -0.015712 -0.113144 0.0736888 0.1713913ETFA electron-transfer-flavoprotein, alpha polypeptide (glutaric aciduria II) 763 +/- 80 635 +/- 93 926 +/- 45 580 +/- 121 0.182268 -0.323308 -0.043134 0.653015 0.1909163ETFDH electron-transferring-flavoprotein dehydrogenase 382 +/- 17 463 +/- 16 356 +/- 16 395 +/- 22 -0.011825 0.0066056 0.190975 0.1096217 0.4593126EXOC7 exocyst complex component 7 228 +/- 32 391 +/- 33 285 +/- 12 351 +/- 36 0.513132 0.004969 0.144338 0.0761158 0.2113179EXOSC10 exosome component 10 957 +/- 62 1170 +/- 42 800 +/- 35 895 +/- 36 -0.000661 0.0202287 0.092599 0.0296892 0.1904323EXOSC5 exosome component 5 648 +/- 33 544 +/- 16 532 +/- 31 483 +/- 14 -0.008 -0.025109 -0.20146 0.0251747 0.4908932FA2H fatty acid 2-hydroxylase 1088 +/- 162 1680 +/- 349 622 +/- 81 901 +/- 73 -0.012014 0.1668608 0.030927 0.0274475 0.011596FADD Fas (TNFRSF6)-associated via death domain 417 +/- 17 322 +/- 14 411 +/- 35 337 +/- 8 0.802694 -0.001535 -0.090736 0.0364948 0.3206309FADS3 fatty acid desaturase 3 1186 +/- 74 995 +/- 86 1240 +/- 69 944 +/- 62 0.720485 -0.123483 -0.010979 0.1789204 0.0811987FAIM Fas apoptotic inhibitory molecule 608 +/- 41 920 +/- 63 711 +/- 51 974 +/- 37 0.112615 0.0027375 0.00246 0.0032731 0.0292477FANCM Fanconi anemia, complementation group M 187 +/- 20 162 +/- 14 232 +/- 6 158 +/- 16 0.195764 -0.347211 -0.007508 0.511436 0.0197887FARP1 FERM, RhoGEF (ARHGEF) and pleckstrin domain protein 1 (chondrocyte-derived) 387 +/- 68 1140 +/- 179 336 +/- 59 910 +/- 114 -0.005662 0.0066696 0.004169 0.1398067 0.0912823FARP2 FERM, RhoGEF and pleckstrin domain protein 2 207 +/- 32 348 +/- 65 210 +/- 30 315 +/- 16 -0.555578 0.0929471 0.015546 0.0052674 0.0183646FASTK Fas-activated serine/threonine kinase 625 +/- 37 797 +/- 40 549 +/- 14 706 +/- 35 -0.014604 0.010554 0.0082 0.048923 0.0043773FAT3 FAT tumor suppressor homolog 3 (Drosophila) 802 +/- 78 532 +/- 31 691 +/- 50 625 +/- 62 -0.85823 -0.016377 -0.430341 0.0445128 0.8837028FAT4 FAT tumor suppressor homolog 4 (Drosophila) 293 +/- 14 306 +/- 33 708 +/- 23 485 +/- 48 0.000342 0.734089 -0.005929 0.523441 0.1234583FBLN1 fibulin 1 358 +/- 58 415 +/- 18 289 +/- 15 381 +/- 10 -0.114801 0.3817661 0.000674 0.2249587 0.0110259FBP1 fructose-1,6-bisphosphatase 1 89 +/- 10 125 +/- 32 81 +/- 8 136 +/- 13 0.759081 0.3232018 0.009196 0.8116737 0.0144975FBXL12 F-box and leucine-rich repeat protein 12 183 +/- 11 198 +/- 17 225 +/- 11 184 +/- 12 0.303886 0.4935119 -0.040901 0.2257533 0.1786531FBXL14 F-box and leucine-rich repeat protein 14 1117 +/- 114 749 +/- 52 1272 +/- 40 979 +/- 38 0.01286 -0.022121 -0.000484 0.07579 0.0310178FBXL3 F-box and leucine-rich repeat protein 3 2062 +/- 73 1887 +/- 100 2305 +/- 53 1970 +/- 46 0.072848 -0.188586 -0.000995 0.1538691 0.0055467FBXL5 F-box and leucine-rich repeat protein 5 281 +/- 17 233 +/- 9 307 +/- 13 264 +/- 18 0.037003 -0.036268 -0.084253 0.1025076 0.2376194
S1- alphabetical list of aging-related genes.xls Page 10

Young vs Aged MSI CorrelationsSymbol Description Young CA Aged CA Young DG Aged DG CA v DG in CA in DG in CA in DGFBXO17 F-box protein 17 244 +/- 20 351 +/- 30 356 +/- 58 418 +/- 44 0.032456 0.0166647 0.414235 0.1175588 0.2090408FBXO22 F-box protein 22 180 +/- 15 116 +/- 11 204 +/- 17 146 +/- 19 0.02693 -0.007922 -0.047841 0.0438841 0.0742148FBXO38 F-box protein 38 480 +/- 20 548 +/- 23 535 +/- 44 505 +/- 38 0.848991 0.0461007 -0.619412 0.307002 0.4390292FCER1G Fc fragment of IgE, high affinity I, receptor for; gamma polypeptide 283 +/- 30 393 +/- 40 195 +/- 12 277 +/- 15 -0.002161 0.0544574 0.002516 0.0320568 0.0074183FCGR3B Fc fragment of IgG, low affinity IIIb, receptor (CD16b) 158 +/- 14 222 +/- 21 125 +/- 11 167 +/- 20 -0.001601 0.0307221 0.112317 0.0083523 0.0039974FCHO2 FCH domain only 2 843 +/- 52 1043 +/- 48 843 +/- 51 914 +/- 52 -0.201113 0.0177434 0.356726 0.0057916 0.2676989FCHSD2 FCH and double SH3 domains 2 602 +/- 50 541 +/- 45 432 +/- 23 355 +/- 19 -0.000261 -0.3862 -0.031367 0.7664457 0.1745995FCN3 ficolin (collagen/fibrinogen domain containing) 3 (Hakata antigen) 773 +/- 82 612 +/- 38 616 +/- 53 473 +/- 26 -0.007798 -0.119355 -0.044076 0.2732374 0.2516669FECH ferrochelatase (protoporphyria) 822 +/- 52 1099 +/- 86 820 +/- 77 1136 +/- 119 0.772196 0.0239491 0.059793 0.0826612 0.0770816FEN1 flap structure-specific endonuclease 1 189 +/- 9 162 +/- 6 178 +/- 12 185 +/- 19 0.793427 -0.033609 0.754614 0.0065744 0.7169363FEZ1 fasciculation and elongation protein zeta 1 (zygin I) 8114 +/- 604 9755 +/- 837 6969 +/- 218 8397 +/- 232 -0.032367 0.1460565 0.001635 0.0511895 0.0020014FHOD3 formin homology 2 domain containing 3 907 +/- 38 718 +/- 69 579 +/- 57 434 +/- 53 -1.2E-05 -0.043636 -0.096171 0.0103365 0.3282478FKBP3 FK506 binding protein 3, 25kDa 2550 +/- 62 2815 +/- 70 2687 +/- 106 2837 +/- 134 0.260528 0.0182882 0.403423 0.0034066 0.3297541FKRP fukutin related protein 1114 +/- 40 971 +/- 30 1164 +/- 29 1050 +/- 21 0.003275 -0.018583 -0.010989 0.0373924 0.1118994FLCN folliculin 85 +/- 4 102 +/- 4 108 +/- 14 107 +/- 6 0.186896 0.0192329 -0.937967 0.0820393 0.3848393FLII flightless I homolog (Drosophila) 1073 +/- 71 1217 +/- 48 871 +/- 23 1050 +/- 35 -0.002118 0.1284841 0.003355 0.1624965 0.0318487FLJ00038 CXYorf1-related protein 477 +/- 9 660 +/- 29 559 +/- 32 584 +/- 37 0.842738 0.0010179 0.630895 0.0045185 0.6422751FLJ25530 hepatocyte cell adhesion molecule 4362 +/- 359 5227 +/- 460 3822 +/- 130 4496 +/- 91 -0.014625 0.171006 0.002411 0.064663 0.003096FLJ30092 AF-1 specific protein phosphatase 3538 +/- 114 3147 +/- 187 3387 +/- 111 2870 +/- 54 -0.170234 -0.110711 -0.003969 0.0512134 0.0776709FLJ35348 FLJ35348 1340 +/- 120 959 +/- 56 1239 +/- 60 1161 +/- 20 0.746881 -0.023204 -0.260509 0.0089147 0.4034201FLJ37035 FLJ37035 protein 344 +/- 33 221 +/- 20 323 +/- 33 207 +/- 33 -0.550993 -0.012535 -0.035518 0.0414483 0.1060541FLJ39237 FLJ39237 protein 202 +/- 20 175 +/- 23 202 +/- 16 152 +/- 11 -0.531022 -0.390375 -0.028344 0.8533485 0.3503263FLJ41131 FLJ41131 protein 131 +/- 16 159 +/- 16 101 +/- 4 144 +/- 10 -0.203452 0.2471598 0.010712 0.3678931 0.0016689FLJ42875 FLJ42875 protein 320 +/- 16 256 +/- 17 326 +/- 29 256 +/- 19 0.839771 -0.01936 -0.079189 0.3165387 0.1547585FLNC filamin C, gamma (actin binding protein 280) 423 +/- 64 485 +/- 58 196 +/- 21 278 +/- 15 -0.000385 0.4850993 0.012306 0.4644705 0.0496698FLT3 fms-related tyrosine kinase 3 200 +/- 23 262 +/- 27 110 +/- 9 165 +/- 6 -0.000328 0.1216677 0.000867 0.1610886 0.0425169FN3KRP fructosamine-3-kinase-related protein 2327 +/- 186 2932 +/- 222 2878 +/- 211 3527 +/- 36 0.006278 0.0643649 0.027114 0.2476558 0.0954689FNDC5 fibronectin type III domain containing 5 519 +/- 27 422 +/- 25 470 +/- 26 433 +/- 42 -0.627101 -0.024752 -0.489434 0.0305327 0.2422757FOXK1 forkhead box K1 1751 +/- 65 1597 +/- 115 1911 +/- 71 1533 +/- 131 0.062205 -0.279784 -0.042521 0.3870735 0.0940586FOXO1A forkhead box O1A (rhabdomyosarcoma) 720 +/- 44 1108 +/- 81 1000 +/- 116 1225 +/- 114 0.046704 0.0031203 0.199946 0.0662699 0.9658058FOXO3A Forkhead box O3A 331 +/- 35 512 +/- 68 283 +/- 27 375 +/- 22 -0.005025 0.0486744 0.026861 0.0574577 0.0218273FOXP1 forkhead box P1 285 +/- 29 214 +/- 23 213 +/- 24 144 +/- 16 -0.006384 -0.086046 -0.043082 0.7429002 0.2205373FRMD3 FERM domain containing 3 159 +/- 13 124 +/- 13 144 +/- 8 115 +/- 10 -0.244571 -0.090893 -0.04872 0.10747 0.0573653FRMD4A FERM domain containing 4A 926 +/- 37 796 +/- 36 829 +/- 20 663 +/- 39 -0.002359 -0.030713 -0.008665 0.1317086 0.0397146FSTL1 follistatin-like 1 1444 +/- 104 1350 +/- 62 956 +/- 42 1093 +/- 20 -0.000477 -0.458445 0.021569 0.493828 0.1436632FSTL5 follistatin-like 5 790 +/- 173 669 +/- 70 1194 +/- 114 623 +/- 58 0.169852 -0.537903 -0.002692 0.4939755 0.0400866FTL ferritin, light polypeptide 16238 +/- 1033 18500 +/- 704 14150 +/- 408 17258 +/- 618 -0.026136 0.1045271 0.00385 0.1129855 0.1026607FTSJ2 FtsJ homolog 2 (E. coli) 498 +/- 18 476 +/- 31 406 +/- 8 463 +/- 17 -0.012851 -0.548167 0.02704 0.1548927 0.031354FUBP3 far upstream element (FUSE) binding protein 3 1363 +/- 127 1472 +/- 64 1328 +/- 43 1188 +/- 31 -0.129335 0.4660081 -0.026881 0.2734257 0.0251975FUT1 Fucosyltransferase 1 (galactoside 2-alpha-L-fucosyltransferase, H blood group) 147 +/- 13 121 +/- 9 139 +/- 12 91 +/- 13 -0.122949 -0.136086 -0.025098 0.0477271 0.0464862FXYD7 FXYD domain containing ion transport regulator 7 3435 +/- 178 2940 +/- 109 4078 +/- 119 3624 +/- 147 0.000845 -0.044077 -0.042429 0.0048882 0.4833482FYCO1 FYVE and coiled-coil domain containing 1 428 +/- 37 875 +/- 195 355 +/- 20 531 +/- 43 -0.074771 0.0705324 0.01151 0.1195917 0.1176505FYN FYN oncogene related to SRC, FGR, YES 243 +/- 42 94 +/- 25 298 +/- 27 175 +/- 27 0.019308 -0.014817 -0.010902 0.0085926 0.0075934G3BP Ras-GTPase-activating protein SH3-domain-binding protein 1810 +/- 99 1689 +/- 83 1957 +/- 54 1678 +/- 67 0.179365 -0.372115 -0.011908 0.8615342 0.1403157
S1- alphabetical list of aging-related genes.xls Page 11

Young vs Aged MSI CorrelationsSymbol Description Young CA Aged CA Young DG Aged DG CA v DG in CA in DG in CA in DGGABARAP GABA(A) receptor-associated protein 11702 +/- 341 11960 +/- 190 10752 +/- 157 11400 +/- 130 -0.00177 0.5282196 0.011299 0.5584819 0.0638276GABBR2 gamma-aminobutyric acid (GABA) B receptor, 2 1834 +/- 197 1551 +/- 193 2778 +/- 78 2396 +/- 114 0.000164 -0.329709 -0.026833 0.295949 0.324515GABPA GA binding protein transcription factor, alpha subunit 60kDa 387 +/- 45 419 +/- 22 469 +/- 23 342 +/- 6 0.820254 0.5392529 -0.001907 0.438208 0.0268951GABRG3 gamma-aminobutyric acid (GABA) A receptor, gamma 3 83 +/- 11 74 +/- 14 144 +/- 6 100 +/- 6 0.000909 -0.596888 -0.000761 0.4350859 0.0006531GALNTL2 UDP-N-acetyl-alpha-D-galactosamine:polypeptide N-acetylgalactosaminyltransferase-like 2 448 +/- 45 296 +/- 38 272 +/- 18 235 +/- 32 -0.010103 -0.026776 -0.343099 0.0897514 0.3666745GAMT guanidinoacetate N-methyltransferase 1022 +/- 43 1199 +/- 29 1147 +/- 61 1359 +/- 156 0.043166 0.009401 0.261073 0.0097846 0.1781006GANC glucosidase, alpha; neutral C 451 +/- 60 883 +/- 120 322 +/- 16 530 +/- 33 -0.013584 0.0135516 0.001369 0.0051561 0.0059706GAPVD1 GTPase activating protein and VPS9 domains 1 1036 +/- 57 938 +/- 97 956 +/- 26 845 +/- 31 -0.085428 -0.405966 -0.023563 0.8008104 0.4174119GARNL1 GTPase activating Rap/RanGAP domain-like 1 683 +/- 64 626 +/- 46 579 +/- 30 462 +/- 37 -0.012651 -0.48589 -0.040099 0.9233998 0.0687345GAS7 growth arrest-specific 7 9122 +/- 492 10812 +/- 463 7341 +/- 461 8180 +/- 533 -0.000193 0.0313393 0.265978 0.1668645 0.1972682GCAT glycine C-acetyltransferase (2-amino-3-ketobutyrate coenzyme A ligase) 417 +/- 20 365 +/- 15 436 +/- 24 357 +/- 20 0.377023 -0.071902 -0.031789 0.0385055 0.0279241GCDH glutaryl-Coenzyme A dehydrogenase 441 +/- 27 371 +/- 17 418 +/- 24 317 +/- 19 -0.043161 -0.058952 -0.009162 0.0303135 0.0002663GCHFR GTP cyclohydrolase I feedback regulator 417 +/- 27 263 +/- 11 403 +/- 32 315 +/- 18 0.471925 -0.001233 -0.044122 0.0036029 0.2626674GCLM glutamate-cysteine ligase, modifier subunit 771 +/- 36 943 +/- 26 851 +/- 27 1048 +/- 44 0.014231 0.0036647 0.007251 0.0229726 0.0130043GEMIN6 gem (nuclear organelle) associated protein 6 120 +/- 23 102 +/- 10 117 +/- 13 77 +/- 3 -0.177933 -0.493262 -0.024097 0.2569431 0.0779739GFM1 G elongation factor, mitochondrial 1 175 +/- 15 233 +/- 22 216 +/- 6 265 +/- 11 0.043576 0.0637293 0.006752 0.1726557 0.0006379GFM2 G elongation factor, mitochondrial 2 1138 +/- 34 958 +/- 37 1177 +/- 64 993 +/- 71 0.363163 -0.005135 -0.087734 0.0450763 0.2241799GGH gamma-glutamyl hydrolase (conjugase, folylpolygammaglutamyl hydrolase) 1157 +/- 71 923 +/- 51 1159 +/- 47 1032 +/- 52 0.21465 -0.024736 -0.103654 0.0306848 0.2273713GGPS1 Geranylgeranyl diphosphate synthase 1 96 +/- 10 181 +/- 17 152 +/- 9 155 +/- 10 0.121289 0.0025016 0.803336 0.00128 0.7078459GGTL3 gamma-glutamyltransferase-like 3 2529 +/- 133 2114 +/- 121 2837 +/- 156 2630 +/- 103 0.001707 -0.044208 -0.298117 0.1027986 0.4930832GGTLA4 gamma-glutamyltransferase-like activity 4 155 +/- 2 188 +/- 13 139 +/- 10 162 +/- 8 -0.043682 0.0487262 0.12909 0.0644891 0.1799802GINS1 GINS complex subunit 1 (Psf1 homolog) 2077 +/- 122 2623 +/- 181 2094 +/- 32 2596 +/- 160 -0.513677 0.0343205 0.033856 0.3674072 0.3453354GIT2 G protein-coupled receptor kinase interactor 2 2774 +/- 76 3131 +/- 101 2423 +/- 103 2775 +/- 131 -0.004492 0.0196676 0.067079 0.1746952 0.0318407GJA1 gap junction protein, alpha 1, 43kDa (connexin 43) 11658 +/- 328 13350 +/- 420 12800 +/- 751 13085 +/- 225 0.327344 0.0106693 0.728814 0.0135463 0.8528205GJA12 gap junction protein, alpha 12, 47kDa 683 +/- 86 921 +/- 117 493 +/- 44 660 +/- 35 -0.026775 0.1357396 0.015548 0.0902397 0.1246776GK glycerol kinase 118 +/- 7 90 +/- 9 112 +/- 5 102 +/- 8 0.620331 -0.034465 -0.312875 0.1003719 0.1468505GLA galactosidase, alpha 400 +/- 19 475 +/- 12 357 +/- 11 391 +/- 12 -0.005319 0.0101419 0.061628 0.0135964 0.3486946GLDN gliomedin 316 +/- 58 508 +/- 25 308 +/- 25 409 +/- 21 -0.142476 0.0195794 0.013554 0.0270417 0.1303341GLG1 golgi apparatus protein 1 4000 +/- 666 6938 +/- 706 3906 +/- 536 6715 +/- 578 -0.664447 0.0127739 0.006455 0.0200505 0.0060216GLI2 GLI-Kruppel family member GLI2 129 +/- 11 140 +/- 14 176 +/- 10 134 +/- 12 0.036059 0.529673 -0.024784 0.3778247 0.0012399GMFG glia maturation factor, gamma 412 +/- 31 565 +/- 21 316 +/- 21 420 +/- 14 -1.16E-05 0.0027447 0.002888 0.0042369 0.048963GMPS guanine monphosphate synthetase 570 +/- 45 619 +/- 27 438 +/- 20 530 +/- 21 -0.001525 0.3776871 0.011127 0.4369728 0.0406228GNB2L1 guanine nucleotide binding protein (G protein), beta polypeptide 2-like 1 8227 +/- 314 9584 +/- 311 7947 +/- 439 9269 +/- 228 -0.177507 0.0118215 0.030346 0.0378873 0.0959707GNB5 guanine nucleotide binding protein (G protein), beta 5 2978 +/- 211 2392 +/- 140 2607 +/- 211 2224 +/- 172 -0.12632 -0.046541 -0.192619 0.0519976 0.4909399GNG2 guanine nucleotide binding protein (G protein), gamma 2 7405 +/- 371 5485 +/- 393 7908 +/- 317 6914 +/- 174 0.032401 -0.005281 -0.026402 0.0148569 0.0383324GNL2 guanine nucleotide binding protein-like 2 (nucleolar) 347 +/- 23 320 +/- 17 374 +/- 23 301 +/- 18 0.674212 -0.378445 -0.03345 0.8352457 0.1096222GNMT glycine N-methyltransferase 171 +/- 11 138 +/- 16 174 +/- 20 111 +/- 11 -0.347997 -0.126863 -0.024455 0.2559391 0.028209GNPTG N-acetylglucosamine-1-phosphate transferase, gamma subunit 1259 +/- 45 970 +/- 51 1269 +/- 41 946 +/- 36 -0.68594 -0.001691 -0.000242 0.0382462 0.0161032GOLGA2 golgi autoantigen, golgin subfamily a, 2 80 +/- 6 112 +/- 6 118 +/- 19 140 +/- 9 0.009563 0.004714 0.328757 0.0191052 0.5915585GOLGA4 golgi autoantigen, golgin subfamily a, 4 158 +/- 20 223 +/- 19 236 +/- 13 257 +/- 20 0.001219 0.0401902 0.414473 0.0194827 0.1549389GOLT1B golgi transport 1 homolog B (S. cerevisiae) 971 +/- 73 734 +/- 56 960 +/- 48 651 +/- 52 -0.377981 -0.029643 -0.002022 0.0378344 0.0055392GON4L gon-4-like (C.elegans) 260 +/- 13 344 +/- 16 310 +/- 44 351 +/- 20 0.185793 0.0023392 0.428239 0.0011843 0.7783808GOPC golgi associated PDZ and coiled-coil motif containing 462 +/- 34 622 +/- 43 560 +/- 32 730 +/- 26 0.005407 0.0158442 0.002573 0.0673328 0.0086109GORASP2 golgi reassembly stacking protein 2, 55kDa 1888 +/- 69 1700 +/- 21 1893 +/- 58 1861 +/- 71 0.122017 -0.040739 -0.737723 0.1605595 0.6351235
S1- alphabetical list of aging-related genes.xls Page 12

Young vs Aged MSI CorrelationsSymbol Description Young CA Aged CA Young DG Aged DG CA v DG in CA in DG in CA in DGGPATC1 G patch domain containing 1 206 +/- 10 251 +/- 12 231 +/- 21 230 +/- 9 0.570262 0.0168554 -0.9913 0.0059077 0.9608456GPATC2 G patch domain containing 2 364 +/- 9 306 +/- 7 390 +/- 22 307 +/- 16 0.151765 -0.000615 -0.014568 0.0151537 0.0039916GPC4 glypican 4 206 +/- 17 250 +/- 35 346 +/- 28 436 +/- 14 0.000173 0.2887487 0.023212 0.6553604 0.2101967GPHN Gephyrin 468 +/- 36 658 +/- 46 703 +/- 53 656 +/- 40 0.069208 0.0093398 -0.495339 0.070879 0.2864199GPKOW G patch domain and KOW motifs 740 +/- 27 793 +/- 31 690 +/- 27 787 +/- 32 -0.184624 0.2349 0.048299 0.302033 0.022967GPM6A glycoprotein M6A 20299 +/- 453 16530 +/- 744 18774 +/- 263 16875 +/- 764 -0.143631 -0.002342 -0.06605 0.0243419 0.3252601GPM6B glycoprotein M6B 5149 +/- 133 6879 +/- 254 6195 +/- 386 7340 +/- 323 0.026838 0.0003929 0.049273 0.0074918 0.472334GPR135 G protein-coupled receptor 135 154 +/- 8 126 +/- 19 203 +/- 9 163 +/- 8 0.000126 -0.21993 -0.012068 0.5096649 0.0210926GPR153 G protein-coupled receptor 153 395 +/- 32 371 +/- 45 374 +/- 8 300 +/- 22 -0.293169 -0.679135 -0.024123 0.9214764 0.148717GPR155 G protein-coupled receptor 155 3986 +/- 374 3280 +/- 279 5230 +/- 184 4681 +/- 151 3.3E-05 -0.164043 -0.046513 0.3330083 0.2508683GPR68 G protein-coupled receptor 68 143 +/- 27 149 +/- 7 197 +/- 12 151 +/- 16 0.193182 0.8448669 -0.046931 0.6715362 0.0022399GPR89A G protein-coupled receptor 89A 470 +/- 16 578 +/- 23 474 +/- 20 537 +/- 29 -0.56843 0.0043371 0.112575 0.0133367 0.3816914GPRC5B G protein-coupled receptor, family C, group 5, member B 2685 +/- 255 3426 +/- 164 2738 +/- 97 2936 +/- 111 -0.239552 0.0386148 0.214412 0.0495925 0.5363138GPSN2 glycoprotein, synaptic 2 2089 +/- 57 2355 +/- 82 2194 +/- 58 2191 +/- 141 -0.996177 0.0263652 -0.98268 0.0117104 0.5629816GRHPR glyoxylate reductase/hydroxypyruvate reductase 1359 +/- 124 1733 +/- 104 1291 +/- 74 1730 +/- 83 -0.641964 0.0441827 0.003679 0.2286539 0.0686579GRIK1 glutamate receptor, ionotropic, kainate 1 107 +/- 11 355 +/- 42 65 +/- 9 194 +/- 15 -0.005795 0.0015561 0.000176 0.0077755 0.005943GRINA glutamate receptor, ionotropic, N-methyl D-asparate-associated protein 1 (glutamate binding 5549 +/- 298 4625 +/- 234 6955 +/- 300 6870 +/- 234 2.45E-05 -0.036044 -0.828973 0.0232317 0.6928194GRLF1 glucocorticoid receptor DNA binding factor 1 2246 +/- 57 1916 +/- 112 2476 +/- 123 2257 +/- 73 0.029725 -0.031675 -0.162091 0.0059261 0.5659028GRM5 Glutamate receptor, metabotropic 5 4099 +/- 219 3135 +/- 171 3523 +/- 175 2644 +/- 98 -0.054363 -0.006511 -0.00259 0.0064815 0.0858297GRSF1 G-rich RNA sequence binding factor 1 2254 +/- 87 1851 +/- 104 2017 +/- 89 2006 +/- 155 -0.596221 -0.014165 -0.955008 0.1787168 0.278694GRTP1 Growth hormone regulated TBC protein 1 446 +/- 50 299 +/- 12 412 +/- 52 272 +/- 16 -0.178175 -0.030153 -0.042958 0.0352107 0.1037726GSK3A glycogen synthase kinase 3 alpha 4199 +/- 213 3357 +/- 277 4155 +/- 242 3593 +/- 133 0.784863 -0.038139 -0.078496 0.0164546 0.0481041GSN gelsolin (amyloidosis, Finnish type) 4180 +/- 541 5269 +/- 560 2845 +/- 206 3577 +/- 214 -0.001124 0.1927344 0.03637 0.2336001 0.1320149GSTT1 Glutathione S-transferase theta 1 180 +/- 17 259 +/- 19 171 +/- 15 240 +/- 13 -0.697357 0.0126606 0.00744 0.0033555 0.0462028GTF2H2 general transcription factor IIH, polypeptide 2, 44kDa 104 +/- 9 178 +/- 26 133 +/- 21 150 +/- 15 0.777899 0.0334695 0.540628 0.0253704 0.8989462GTF2H5 general transcription factor IIH, polypeptide 5 1686 +/- 106 1502 +/- 113 1400 +/- 61 1199 +/- 50 -0.002828 -0.260413 -0.030987 0.2897615 0.0226314GTF2IRD2 GTF2I repeat domain containing 2 310 +/- 18 224 +/- 27 365 +/- 33 210 +/- 55 0.339862 -0.028055 -0.04721 0.4826959 0.3391896GTF3C4 General transcription factor IIIC, polypeptide 4, 90kDa 1590 +/- 79 1380 +/- 69 1484 +/- 45 1344 +/- 39 -0.361086 -0.072365 -0.043751 0.0805172 0.1480084GUF1 GUF1 GTPase homolog (S. cerevisiae) 391 +/- 29 526 +/- 32 365 +/- 39 430 +/- 27 -0.017923 0.0116682 0.209153 0.0437322 0.3849475GUP1 GUP1 glycerol uptake/transporter homolog (S. cerevisiae) 602 +/- 64 1060 +/- 102 467 +/- 55 753 +/- 60 -0.00411 0.0046362 0.006826 0.0049883 0.0567797H1F0 H1 histone family, member 0 1586 +/- 121 1504 +/- 164 1458 +/- 52 1178 +/- 25 -0.030654 -0.696287 -0.001738 0.4357901 0.0087921H3F3A H3 histone, family 3A 1040 +/- 71 1128 +/- 59 1218 +/- 63 874 +/- 46 -0.801652 0.3635832 -0.001899 0.1794462 0.0132891H6PD hexose-6-phosphate dehydrogenase (glucose 1-dehydrogenase) 144 +/- 17 242 +/- 29 154 +/- 17 173 +/- 8 -0.200044 0.0197659 0.354235 0.0445199 0.6634603HADH2 hydroxyacyl-Coenzyme A dehydrogenase, type II 2567 +/- 64 2333 +/- 98 2257 +/- 48 2004 +/- 54 -4.57E-05 -0.078236 -0.007019 0.1175237 0.0859568HAGH hydroxyacylglutathione hydrolase 3456 +/- 243 2690 +/- 123 2867 +/- 137 2258 +/- 72 -0.000327 -0.024497 -0.005119 0.0301329 0.0219011HAGHL hydroxyacylglutathione hydrolase-like 559 +/- 53 491 +/- 35 436 +/- 21 337 +/- 5 -0.000591 -0.315099 -0.004581 0.402573 0.0145572HAX1 HCLS1 associated protein X-1 2262 +/- 81 1987 +/- 38 2212 +/- 35 1989 +/- 78 -0.668707 -0.017283 -0.042094 0.0329426 0.0178014HBII-276HGHBII-276 host gene 4992 +/- 293 6134 +/- 326 5486 +/- 284 6432 +/- 380 0.262127 0.0264066 0.082377 0.0798043 0.2160083HBS1L HBS1-like (S. cerevisiae) 1048 +/- 89 1565 +/- 156 1275 +/- 83 1473 +/- 162 0.545985 0.0206289 0.319037 0.0863452 0.9183126HDAC11 Histone deacetylase 11 3200 +/- 431 3729 +/- 400 2319 +/- 144 2838 +/- 131 -0.009873 0.3894085 0.025646 0.2581662 0.0703184HDAC6 histone deacetylase 6 858 +/- 46 1082 +/- 96 763 +/- 14 907 +/- 33 -0.011085 0.0726796 0.008625 0.2408406 0.0768492HECTD1 HECT domain containing 1 154 +/- 14 131 +/- 13 204 +/- 13 162 +/- 11 0.009086 -0.238273 -0.041532 0.852479 0.2248975HECTD2 HECT domain containing 2 1579 +/- 126 2196 +/- 109 1410 +/- 84 1984 +/- 71 -0.109324 0.0041351 0.000569 0.0807731 0.0415738HERC1 hect (homologous to the E6-AP (UBE3A) carboxyl terminus) domain and RCC1 (CHC1)-like 3490 +/- 87 3209 +/- 99 3290 +/- 56 3128 +/- 37 -0.051693 -0.059808 -0.04215 0.0071283 0.1525603
S1- alphabetical list of aging-related genes.xls Page 13

Young vs Aged MSI CorrelationsSymbol Description Young CA Aged CA Young DG Aged DG CA v DG in CA in DG in CA in DGHERC2P7 hect domain and RLD 2 pseudogene 7 170 +/- 14 126 +/- 21 225 +/- 17 160 +/- 19 0.014426 -0.114895 -0.033002 0.110836 0.0130911HERC4 hect domain and RLD 4 725 +/- 37 638 +/- 58 882 +/- 55 667 +/- 35 0.057109 -0.240881 -0.010634 0.3338926 0.1338468HES1 hairy and enhancer of split 1, (Drosophila) 395 +/- 33 353 +/- 23 461 +/- 26 352 +/- 18 0.113672 -0.327047 -0.008026 0.3528417 0.0281143HES5 hairy and enhancer of split 5 (Drosophila) 714 +/- 104 558 +/- 31 840 +/- 53 603 +/- 61 0.147906 -0.201518 -0.017729 0.1811541 0.0107066HEXDC hexosaminidase (glycosyl hydrolase family 20, catalytic domain) containing 148 +/- 17 180 +/- 18 173 +/- 20 274 +/- 24 0.002521 0.2261819 0.011704 0.4469197 0.0067908HEXIM1 hexamethylene bis-acetamide inducible 1 1258 +/- 39 1102 +/- 16 1185 +/- 37 1098 +/- 42 -0.018271 -0.008471 -0.155924 0.0188297 0.4940762HEY2 hairy/enhancer-of-split related with YRPW motif 2 500 +/- 20 595 +/- 32 557 +/- 20 531 +/- 30 -0.861635 0.0360203 -0.480894 0.0436667 0.3612082HIGD1B HIG1 domain family, member 1B 225 +/- 13 268 +/- 11 154 +/- 8 203 +/- 12 -2.08E-05 0.0303291 0.009653 0.0324301 0.0572933HIGD2A HIG1 domain family, member 2A 3641 +/- 182 2920 +/- 183 3456 +/- 163 2935 +/- 93 -0.36263 -0.019089 -0.024691 0.0239717 0.0874323HIPK2 Homeodomain interacting protein kinase 2 13628 +/- 1528 17700 +/- 1910 8772 +/- 365 10920 +/- 395 -0.001574 0.1284122 0.003367 0.0120334 0.0028744HKR2 GLI-Kruppel family member HKR2 186 +/- 15 198 +/- 14 187 +/- 10 237 +/- 13 0.28536 0.5834441 0.017131 0.9304687 0.0181515HLA-DMA major histocompatibility complex, class II, DM alpha 100 +/- 12 213 +/- 26 81 +/- 17 132 +/- 17 -0.03817 0.0051739 0.062295 0.0063115 0.1378359HLA-DPA1 major histocompatibility complex, class II, DP alpha 1 242 +/- 37 469 +/- 34 224 +/- 35 351 +/- 66 -0.052627 0.0011439 0.139667 0.0230307 0.3222405HLA-DPB1 major histocompatibility complex, class II, DP beta 1 275 +/- 55 485 +/- 42 153 +/- 53 409 +/- 56 -0.000767 0.0138141 0.009355 0.1031803 0.0248301HLA-DRA major histocompatibility complex, class II, DR alpha 537 +/- 59 893 +/- 114 350 +/- 59 668 +/- 140 -0.022781 0.0254037 0.086285 0.0282195 0.3021055HLF hepatic leukemia factor 3087 +/- 125 2470 +/- 174 3295 +/- 234 3001 +/- 197 0.134433 -0.017992 -0.361245 0.0214442 0.5651557HMBOX1 homeobox containing 1 2019 +/- 129 1029 +/- 14 1858 +/- 133 1219 +/- 270 0.225131 -0.000547 -0.078476 0.0022485 0.0116758HMG2L1 high-mobility group protein 2-like 1 827 +/- 48 1078 +/- 75 788 +/- 50 931 +/- 40 -0.119134 0.0208691 0.052829 0.0053343 0.098226HMGCR 3-hydroxy-3-methylglutaryl-Coenzyme A reductase 1890 +/- 172 1539 +/- 69 2130 +/- 95 1817 +/- 102 0.047367 -0.101924 -0.052681 0.0647459 0.186102HMGCS2 3-hydroxy-3-methylglutaryl-Coenzyme A synthase 2 (mitochondrial) 244 +/- 51 182 +/- 18 480 +/- 52 240 +/- 77 0.015867 -0.292636 -0.035266 0.5851959 0.0341019HMGN2 high-mobility group nucleosomal binding domain 2 197 +/- 23 265 +/- 10 221 +/- 5 255 +/- 33 0.519438 0.0313723 0.376562 0.0222216 0.6900252HNMT histamine N-methyltransferase 396 +/- 32 235 +/- 22 494 +/- 59 338 +/- 17 0.006664 -0.002524 -0.044935 0.0213492 0.0723774HNRPA0 Heterogeneous nuclear ribonucleoprotein A0 336 +/- 12 561 +/- 28 394 +/- 18 576 +/- 23 0.107938 0.0001989 0.000242 0.0094807 0.0192505HNRPA3P1heterogeneous nuclear ribonucleoprotein A3 pseudogene 1 1370 +/- 59 1182 +/- 49 1527 +/- 55 1349 +/- 65 0.026639 -0.033981 -0.067248 0.1591375 0.2003319HNRPD heterogeneous nuclear ribonucleoprotein D (AU-rich element RNA binding protein 1, 37kDa 1406 +/- 64 1586 +/- 51 1838 +/- 60 1825 +/- 128 0.000959 0.0542112 -0.927465 0.2100338 0.9676209HNRPH3 heterogeneous nuclear ribonucleoprotein H3 (2H9) 973 +/- 64 1240 +/- 83 1247 +/- 84 1322 +/- 104 0.019894 0.0303551 0.590177 0.0251709 0.9298828HNRPL heterogeneous nuclear ribonucleoprotein L 5232 +/- 292 6250 +/- 170 6161 +/- 225 7259 +/- 144 0.000633 0.0167305 0.003234 0.1424168 0.0232842HOMER1 homer homolog 1 (Drosophila) 2901 +/- 169 2385 +/- 132 2363 +/- 91 2257 +/- 80 -0.023078 -0.038188 -0.408436 0.0448595 0.3022804HP1BP3 heterochromatin protein 1, binding protein 3 5237 +/- 233 4163 +/- 95 5620 +/- 224 4368 +/- 255 0.136307 -0.004208 -0.005507 0.0308372 0.0730441HRASLS3 HRAS-like suppressor 3 3691 +/- 429 4571 +/- 653 2117 +/- 93 2770 +/- 179 -0.001697 0.290076 0.017368 0.1218947 0.0152259HRH1 Histamine receptor H1 110 +/- 13 169 +/- 16 148 +/- 14 93 +/- 20 -0.627131 0.0178774 -0.055363 0.0742791 0.0269023HS1BP3 HS1-binding protein 3 323 +/- 18 374 +/- 24 190 +/- 32 362 +/- 29 -0.023458 0.1289462 0.0032 0.3309578 0.0331526HSD11B1 hydroxysteroid (11-beta) dehydrogenase 1 182 +/- 39 214 +/- 25 78 +/- 15 136 +/- 13 -0.009558 0.5032791 0.015016 0.5861892 0.0606506HSD17B6 hydroxysteroid (17-beta) dehydrogenase 6 3312 +/- 301 2181 +/- 99 2842 +/- 167 1796 +/- 97 -0.003708 -0.011557 -0.00067 0.0240631 0.0116791HSDL2 hydroxysteroid dehydrogenase like 2 117 +/- 13 171 +/- 18 115 +/- 10 148 +/- 16 -0.684815 0.0367751 0.129427 0.085526 0.0049882HSFY1 heat shock transcription factor, Y-linked 1 126 +/- 19 179 +/- 15 169 +/- 7 138 +/- 5 0.717732 0.0546282 -0.007341 0.0049516 0.0533977HSMPP8 M-phase phosphoprotein, mpp8 1015 +/- 35 1210 +/- 68 1054 +/- 61 1091 +/- 69 -0.903502 0.0355074 0.696141 0.0074211 0.4485377HSP90AB1heat shock protein 90kDa alpha (cytosolic), class B member 1 11071 +/- 195 13271 +/- 831 9909 +/- 375 10714 +/- 222 -0.006433 0.0450899 0.102338 0.1705916 0.0942842HSP90B1 heat shock protein 90kDa beta (Grp94), member 1 5233 +/- 258 4774 +/- 119 5615 +/- 180 4876 +/- 111 0.109294 -0.150045 -0.008041 0.4535918 0.200611HSPA12A heat shock 70kDa protein 12A 420 +/- 40 297 +/- 27 455 +/- 42 300 +/- 28 0.471796 -0.030854 -0.015229 0.0541254 0.100143HSPB8 heat shock 22kDa protein 8 2202 +/- 213 3231 +/- 299 2037 +/- 225 2797 +/- 223 -0.014424 0.0205075 0.040316 0.0801769 0.3845944HSPC159 HSPC159 protein 145 +/- 22 117 +/- 17 161 +/- 15 118 +/- 10 0.821222 -0.332804 -0.042647 0.2118259 0.0564253HSPC176 hematopoietic stem/progenitor cells 176 666 +/- 60 863 +/- 48 612 +/- 77 712 +/- 53 -0.184744 0.0290196 0.316878 0.2618604 0.2751186HSPE1 heat shock 10kDa protein 1 (chaperonin 10) 3558 +/- 135 3064 +/- 138 3300 +/- 90 2930 +/- 94 -0.054454 -0.028255 -0.019469 0.0466405 0.0305899
S1- alphabetical list of aging-related genes.xls Page 14

Young vs Aged MSI CorrelationsSymbol Description Young CA Aged CA Young DG Aged DG CA v DG in CA in DG in CA in DGHTR3A 5-hydroxytryptamine (serotonin) receptor 3A 166 +/- 21 103 +/- 13 182 +/- 25 126 +/- 12 0.045284 -0.03231 -0.078401 0.2517837 0.1153546HYLS1 hydrolethalus syndrome 1 748 +/- 26 632 +/- 33 635 +/- 12 572 +/- 47 -0.002791 -0.020014 -0.253758 0.0580063 0.9635505IARS2 isoleucine-tRNA synthetase 2, mitochondrial 656 +/- 36 831 +/- 33 634 +/- 50 784 +/- 31 -0.111969 0.004645 0.033032 0.0003749 0.0058128IBRDC3 IBR domain containing 3 179 +/- 43 292 +/- 22 217 +/- 41 344 +/- 26 0.004416 0.0476291 0.029838 0.2191918 0.2995504ICA1L islet cell autoantigen 1,69kDa-like 791 +/- 58 1295 +/- 113 876 +/- 42 1345 +/- 82 0.081592 0.0046744 0.002173 0.0466876 0.0171912ICAM1 intercellular adhesion molecule 1 (CD54), human rhinovirus receptor 120 +/- 10 185 +/- 13 126 +/- 9 167 +/- 8 -0.509902 0.0027757 0.007974 0.0012246 0.1861653IDH3B isocitrate dehydrogenase 3 (NAD+) beta 1428 +/- 48 1204 +/- 29 1103 +/- 38 1036 +/- 36 -0.00011 -0.003798 -0.233414 0.0286207 0.7010248IFIT3 interferon-induced protein with tetratricopeptide repeats 3 309 +/- 18 383 +/- 25 287 +/- 18 321 +/- 15 -0.051765 0.0397857 0.17307 0.0204367 0.3699558IFIT5 interferon-induced protein with tetratricopeptide repeats 5 467 +/- 26 398 +/- 26 493 +/- 24 422 +/- 16 0.29216 -0.091013 -0.035868 0.1658923 0.2210693IFNAR1 interferon (alpha, beta and omega) receptor 1 514 +/- 18 825 +/- 71 497 +/- 23 630 +/- 59 -0.027489 0.0063634 0.088126 0.0011211 0.1302925IFNAR2 interferon (alpha, beta and omega) receptor 2 189 +/- 22 286 +/- 18 155 +/- 25 256 +/- 36 -0.140271 0.0071881 0.051828 0.0403499 0.1299888IFNGR1 interferon gamma receptor 1 1775 +/- 52 2011 +/- 102 1350 +/- 54 1527 +/- 56 -0.000166 0.0756206 0.049648 0.0313991 0.0954485IFT140 intraflagellar transport 140 homolog (Chlamydomonas) 212 +/- 12 263 +/- 17 244 +/- 23 276 +/- 16 0.045038 0.0372744 0.272873 0.071048 0.3425192IGBP1 immunoglobulin (CD79A) binding protein 1 1965 +/- 47 2506 +/- 69 1885 +/- 71 1954 +/- 88 -0.021218 0.0001316 0.556128 0.0088608 0.3758762IGF1R Insulin-like growth factor 1 receptor 545 +/- 60 811 +/- 50 668 +/- 61 725 +/- 86 0.402059 0.0071628 0.608119 0.0077351 0.1993183IGF2 insulin-like growth factor 2 (somatomedin A) 536 +/- 149 327 +/- 80 242 +/- 33 429 +/- 64 -0.525197 -0.252466 0.040788 0.1133974 0.1150699IGFBP5 insulin-like growth factor binding protein 5 174 +/- 19 323 +/- 54 358 +/- 138 309 +/- 76 0.85311 0.0392256 -0.763078 0.0056486 0.9501952IGSF11 immunoglobulin superfamily, member 11 1835 +/- 127 2330 +/- 191 1702 +/- 60 1916 +/- 70 -0.044071 0.0602246 0.048375 0.0127626 0.0923113IGSF9 immunoglobulin superfamily, member 9 140 +/- 15 213 +/- 22 159 +/- 9 169 +/- 13 -0.457673 0.0209872 0.530616 0.0624533 0.1719082IKBKAP inhibitor of kappa light polypeptide gene enhancer in B-cells, kinase complex-associated pro 3512 +/- 159 3207 +/- 197 3071 +/- 108 2708 +/- 98 -0.000191 -0.257208 -0.034273 0.9879113 0.3691163IL13RA1 interleukin 13 receptor, alpha 1 147 +/- 22 136 +/- 18 121 +/- 7 176 +/- 7 0.760091 -0.703974 0.000284 0.7379283 0.0454232INADL InaD-like (Drosophila) 87 +/- 10 135 +/- 10 146 +/- 6 143 +/- 14 0.010416 0.0084226 -0.845084 0.0070272 0.4992556INSIG1 insulin induced gene 1 1796 +/- 160 2510 +/- 276 2251 +/- 175 2909 +/- 224 0.144515 0.0554641 0.049265 0.0828132 0.4063671IPLA2(GAMintracellular membrane-associated calcium-independent phospholipase A2 gamma 3034 +/- 116 2924 +/- 99 3184 +/- 174 2707 +/- 92 -0.886454 -0.488736 -0.043352 0.8441567 0.1281932IPO9 importin 9 1211 +/- 95 1365 +/- 81 1369 +/- 47 1573 +/- 68 0.010492 0.2437822 0.042275 0.2746075 0.0033788ISG15 ISG15 ubiquitin-like modifier 312 +/- 25 375 +/- 30 216 +/- 17 298 +/- 16 -0.001794 0.1427383 0.007132 0.1085195 0.2043022ISG20L1 interferon stimulated exonuclease gene 20kDa-like 1 320 +/- 14 256 +/- 21 292 +/- 17 271 +/- 4 -0.540022 -0.034363 -0.270545 0.3314558 0.5291386ITCH itchy homolog E3 ubiquitin protein ligase (mouse) 198 +/- 29 78 +/- 10 178 +/- 21 75 +/- 12 -0.536965 -0.007101 -0.002595 0.061654 0.0227736ITFG1 Integrin alpha FG-GAP repeat containing 1 7600 +/- 215 6251 +/- 221 6538 +/- 483 6093 +/- 241 -0.020899 -0.001403 -0.437198 0.0083954 0.6222976ITGA6 integrin, alpha 6 1277 +/- 56 1145 +/- 70 1213 +/- 98 804 +/- 50 -0.066816 -0.173709 -0.00691 0.6177074 0.0750815ITGA8 integrin, alpha 8 101 +/- 17 101 +/- 14 126 +/- 12 92 +/- 3 0.133125 -0.982265 -0.035995 0.9156943 0.1779205ITGAM integrin, alpha M (complement component 3 receptor 3 subunit) 332 +/- 23 412 +/- 12 323 +/- 26 348 +/- 34 -0.171997 0.0167668 0.584584 0.0840144 0.5527492ITGB1 integrin, beta 1 (fibronectin receptor, beta polypeptide, antigen CD29 includes MDF2, MSK1 657 +/- 64 790 +/- 95 641 +/- 35 744 +/- 25 -0.375166 0.2811003 0.041142 0.1133481 0.0789991ITGB1BP1 integrin beta 1 binding protein 1 832 +/- 41 713 +/- 53 853 +/- 30 743 +/- 28 0.744054 -0.108727 -0.025875 0.0989607 0.1395426ITGB4 integrin, beta 4 433 +/- 101 626 +/- 98 854 +/- 90 1205 +/- 70 4.03E-05 0.1993225 0.013637 0.3119505 0.1281018ITIH5 inter-alpha (globulin) inhibitor H5 396 +/- 40 251 +/- 36 310 +/- 50 237 +/- 35 -0.111694 -0.023919 -0.263543 0.0161808 0.1563735ITM2A integral membrane protein 2A 1463 +/- 86 1990 +/- 49 1400 +/- 32 1806 +/- 148 -0.175187 0.0007281 0.050001 0.0209382 0.2477824IVNS1ABP influenza virus NS1A binding protein 993 +/- 80 1097 +/- 80 745 +/- 17 848 +/- 36 -0.000147 0.3783459 0.043123 0.2703699 0.0029402JMJD4 jumonji domain containing 4 451 +/- 27 321 +/- 25 448 +/- 15 402 +/- 26 0.150407 -0.005768 -0.172553 0.0117518 0.3260716KARCA1 kelch/ankyrin repeat containing cyclin A1 interacting protein 2299 +/- 44 1908 +/- 148 2213 +/- 74 1909 +/- 113 -0.414643 -0.045072 -0.058893 0.0134478 0.0133977KBTBD3 kelch repeat and BTB (POZ) domain containing 3 245 +/- 17 231 +/- 14 224 +/- 11 186 +/- 9 -0.00714 -0.559314 -0.027498 0.8803297 0.0445753KCMF1 potassium channel modulatory factor 1 904 +/- 45 798 +/- 43 861 +/- 25 761 +/- 23 -0.410119 -0.117733 -0.018055 0.1185997 0.1866276KCNA5 potassium voltage-gated channel, shaker-related subfamily, member 5 160 +/- 33 140 +/- 13 180 +/- 11 124 +/- 7 0.926943 -0.581877 -0.002309 0.9751667 0.0322322KCNH2 potassium voltage-gated channel, subfamily H (eag-related), member 2 579 +/- 45 458 +/- 18 529 +/- 26 467 +/- 29 -0.641046 -0.043132 -0.147815 0.1007191 0.5059796
S1- alphabetical list of aging-related genes.xls Page 15

Young vs Aged MSI CorrelationsSymbol Description Young CA Aged CA Young DG Aged DG CA v DG in CA in DG in CA in DGKCNIP1 Kv channel interacting protein 1 233 +/- 13 189 +/- 12 243 +/- 17 208 +/- 14 0.497706 -0.03342 -0.148767 0.2405216 0.0271914KCNJ16 potassium inwardly-rectifying channel, subfamily J, member 16 132 +/- 23 102 +/- 14 178 +/- 23 116 +/- 14 0.010593 -0.296493 -0.050114 0.2193097 0.0426232KCNK17 potassium channel, subfamily K, member 17 175 +/- 17 111 +/- 10 253 +/- 20 177 +/- 20 0.000433 -0.011002 -0.023816 0.0727271 0.0841288KCNK2 potassium channel, subfamily K, member 2 130 +/- 38 100 +/- 18 109 +/- 11 75 +/- 3 -0.23212 -0.483793 -0.02277 0.257196 0.0298694KCNQ2 potassium voltage-gated channel, KQT-like subfamily, member 2 279 +/- 12 234 +/- 12 261 +/- 17 237 +/- 14 -0.756787 -0.025523 -0.286495 0.170292 0.331447KCTD17 potassium channel tetramerisation domain containing 17 288 +/- 31 189 +/- 16 389 +/- 31 381 +/- 41 0.003133 -0.022214 -0.885017 0.0242203 0.706816KCTD3 potassium channel tetramerisation domain containing 3 1153 +/- 87 1018 +/- 49 1352 +/- 65 947 +/- 142 0.354361 -0.213512 -0.043041 0.556885 0.316617KHDRBS1 KH domain containing, RNA binding, signal transduction associated 1 434 +/- 12 512 +/- 23 424 +/- 28 401 +/- 15 -0.035547 0.0168749 -0.478305 0.3175819 0.3900469KIAA1559 mouse zinc finger protein 14-like 130 +/- 17 122 +/- 12 158 +/- 9 116 +/- 6 0.142807 -0.731879 -0.003437 0.5966349 0.0162574KIDINS220Kinase D-interacting substance of 220 kDa 221 +/- 98 520 +/- 82 208 +/- 72 376 +/- 75 -0.033925 0.0420293 0.142025 0.1127798 0.3116226KIF21A kinesin family member 21A 3821 +/- 217 2757 +/- 229 4422 +/- 302 3119 +/- 95 0.000296 -0.007043 -0.00637 0.0635413 0.0334699KIF21B kinesin family member 21B 3015 +/- 342 2089 +/- 271 2816 +/- 158 2164 +/- 78 -0.802722 -0.060923 -0.007346 0.0726565 0.0210055KIF26B kinesin family member 26B 192 +/- 20 165 +/- 9 221 +/- 16 158 +/- 13 0.368792 -0.247789 -0.012319 0.1008889 0.042473KIF3A kinesin family member 3A 6022 +/- 351 7526 +/- 490 5756 +/- 353 7952 +/- 415 0.932262 0.0338848 0.003446 0.4477694 0.1042408KIF3B kinesin family member 3B 1592 +/- 199 1106 +/- 96 1784 +/- 164 1327 +/- 44 0.033434 -0.062974 -0.037931 0.1085254 0.1408668KIF3C kinesin family member 3C 5625 +/- 458 4054 +/- 161 4195 +/- 251 3767 +/- 99 -0.012429 -0.016957 -0.16042 0.0051181 0.2302338KIF5A kinesin family member 5A 2488 +/- 627 4967 +/- 527 2216 +/- 519 3839 +/- 250 -0.025483 0.0131554 0.025515 0.0698021 0.1681597KLF13 Kruppel-like factor 13 1790 +/- 60 1158 +/- 151 2000 +/- 133 1313 +/- 196 0.021147 -0.006851 -0.02201 0.1488425 0.3862592KLHDC5 kelch domain containing 5 3067 +/- 144 2879 +/- 162 2960 +/- 80 2641 +/- 82 -0.059624 -0.405494 -0.02161 0.2110651 0.0813829KLHL15 kelch-like 15 (Drosophila) 646 +/- 36 564 +/- 39 642 +/- 26 552 +/- 15 -0.838295 -0.154466 -0.016239 0.1567848 0.0784295KLHL2 kelch-like 2, Mayven (Drosophila) 4816 +/- 510 3890 +/- 688 7319 +/- 565 5661 +/- 464 0.000996 -0.306975 -0.049757 0.4627157 0.301802KLHL21 kelch-like 21 (Drosophila) 1952 +/- 122 1902 +/- 103 1702 +/- 32 1533 +/- 45 -0.00605 -0.762969 -0.016513 0.7908324 0.0086259KLHL8 kelch-like 8 (Drosophila) 1978 +/- 100 2286 +/- 94 2118 +/- 103 2280 +/- 170 0.594119 0.0492286 0.442491 0.2317898 0.5971461KPNA1 karyopherin alpha 1 (importin alpha 5) 2311 +/- 102 1982 +/- 79 2132 +/- 68 2092 +/- 86 -0.346058 -0.030322 -0.725154 0.0426209 0.9721896KPNA3 karyopherin alpha 3 (importin alpha 4) 2725 +/- 82 2246 +/- 35 2709 +/- 42 2343 +/- 59 0.394828 -0.001187 -0.001242 0.0066767 0.0312176KRR1 KRR1, small subunit (SSU) processome component, homolog (yeast) 143 +/- 22 372 +/- 77 168 +/- 37 387 +/- 79 0.592803 0.0303006 0.048322 0.2824591 0.3277337KRTCAP2 Keratinocyte associated protein 2 159 +/- 10 120 +/- 17 200 +/- 25 128 +/- 5 0.096235 -0.08101 -0.033837 0.0763629 0.1569348KTN1 kinectin 1 (kinesin receptor) 3032 +/- 249 3355 +/- 275 3498 +/- 199 2780 +/- 142 -0.732438 0.4031136 -0.017362 0.1279059 0.2641368Kua ubiquitin-conjugating enzyme variant Kua 968 +/- 77 876 +/- 70 858 +/- 38 702 +/- 42 -0.020679 -0.400916 -0.022812 0.6755094 0.0203844LARP1 La ribonucleoprotein domain family, member 1 2654 +/- 61 2210 +/- 101 2989 +/- 126 2762 +/- 90 0.000182 -0.005348 -0.178466 0.0044175 0.1765114LASP1 LIM and SH3 protein 1 3715 +/- 152 3291 +/- 108 3992 +/- 179 3563 +/- 143 0.122979 -0.048664 -0.094855 0.0526266 0.4095864LASS2 LAG1 longevity assurance homolog 2 (S. cerevisiae) 1543 +/- 159 2019 +/- 247 1012 +/- 58 1354 +/- 79 -0.005517 0.1417419 0.008589 0.0146985 0.0166976LASS5 LAG1 longevity assurance homolog 5 (S. cerevisiae) 1328 +/- 43 993 +/- 51 1277 +/- 72 1037 +/- 33 -0.695083 -0.000566 -0.019 0.0004572 0.1274037LASS6 LAG1 longevity assurance homolog 6 (S. cerevisiae) 241 +/- 14 185 +/- 9 233 +/- 20 237 +/- 21 0.248882 -0.009063 0.911095 0.0018281 0.6992862LAT2 linker for activation of T cells family, member 2 246 +/- 22 214 +/- 23 266 +/- 22 203 +/- 17 0.630977 -0.346152 -0.047563 0.6063961 0.1040978LAYN layilin 174 +/- 39 137 +/- 9 89 +/- 5 120 +/- 9 -0.030574 -0.392233 0.018567 0.164778 0.2289666LCN6 lipocalin 6 288 +/- 28 285 +/- 19 344 +/- 14 251 +/- 22 0.347287 -0.929214 -0.009157 0.5618894 0.0411434LEAP-2 liver-expressed antimicrobial peptide 2 142 +/- 15 191 +/- 11 154 +/- 13 150 +/- 10 -0.441339 0.0251609 -0.775806 0.0087654 0.5451072LENG9 leukocyte receptor cluster (LRC) member 9 234 +/- 30 234 +/- 18 289 +/- 10 218 +/- 13 0.314411 0.9943279 -0.003089 0.8686565 0.0145138LEREPO4 likely ortholog of mouse immediate early response, erythropoietin 4 3868 +/- 230 3508 +/- 145 4093 +/- 95 3354 +/- 211 0.539991 -0.219625 -0.020663 0.2803356 0.1262894LETM2 leucine zipper-EF-hand containing transmembrane protein 2 125 +/- 7 98 +/- 8 102 +/- 12 112 +/- 8 -0.676823 -0.025883 0.501709 0.098268 0.3344092LETMD1 LETM1 domain containing 1 392 +/- 31 684 +/- 39 420 +/- 19 632 +/- 54 -0.999437 0.0002075 0.013536 0.0004107 0.0035636LGMN legumain 2017 +/- 149 2333 +/- 156 1847 +/- 52 2339 +/- 106 -0.147583 0.1751615 0.006075 0.4551521 0.1335073LHPP phospholysine phosphohistidine inorganic pyrophosphate phosphatase 1897 +/- 163 2175 +/- 138 1606 +/- 105 1935 +/- 93 -0.035074 0.2232212 0.043902 0.1423172 0.2170396
S1- alphabetical list of aging-related genes.xls Page 16

Young vs Aged MSI CorrelationsSymbol Description Young CA Aged CA Young DG Aged DG CA v DG in CA in DG in CA in DGLIFR leukemia inhibitory factor receptor alpha 2392 +/- 272 3256 +/- 164 2200 +/- 139 2374 +/- 110 -0.023868 0.025646 0.350575 0.0182029 0.8117387LIMS1 LIM and senescent cell antigen-like domains 1 815 +/- 63 1059 +/- 110 676 +/- 38 871 +/- 66 -0.017507 0.0901478 0.040073 0.0174023 0.0048156LITAF lipopolysaccharide-induced TNF factor 1951 +/- 250 2975 +/- 472 1460 +/- 69 1769 +/- 112 -0.014996 0.0932603 0.052765 0.0133063 0.013689LIX1L Lix1 homolog (mouse) like 1777 +/- 112 2141 +/- 118 1728 +/- 67 1848 +/- 69 -0.087621 0.0493095 0.244961 0.0814555 0.4486052LNPEP leucyl/cystinyl aminopeptidase 2120 +/- 127 2540 +/- 116 2687 +/- 122 2808 +/- 110 0.003585 0.0351572 0.478574 0.1309289 0.6568302LNX1 ligand of numb-protein X 1 2480 +/- 118 1905 +/- 184 2474 +/- 174 1901 +/- 108 -0.98299 -0.02857 -0.022991 0.0026034 0.1566009LONPL peroxisomal LON protease like 691 +/- 82 856 +/- 45 737 +/- 44 891 +/- 39 0.347324 0.1154895 0.02841 0.079131 0.0767525LPHN1 latrophilin 1 3273 +/- 149 2840 +/- 165 3901 +/- 181 3300 +/- 124 0.001197 -0.080279 -0.023978 0.0840345 0.2816035LRBA LPS-responsive vesicle trafficking, beach and anchor containing 170 +/- 21 175 +/- 6 242 +/- 14 194 +/- 12 0.019703 0.8467267 -0.031553 0.6117714 0.0536147LRFN5 Leucine rich repeat and fibronectin type III domain containing 5 378 +/- 17 288 +/- 38 451 +/- 36 256 +/- 16 0.310075 -0.066662 -0.001746 0.0415564 0.0325591LRIG1 leucine-rich repeats and immunoglobulin-like domains 1 2933 +/- 304 3934 +/- 210 2719 +/- 203 3170 +/- 146 -0.057252 0.0242412 0.105787 0.0790443 0.6036524LRP11 low density lipoprotein receptor-related protein 11 4775 +/- 167 4237 +/- 116 4754 +/- 143 4135 +/- 226 -0.765163 -0.026691 -0.054358 0.2136043 0.4776775LRPPRC leucine-rich PPR-motif containing 4632 +/- 236 3748 +/- 142 4099 +/- 157 3800 +/- 34 -0.185503 -0.011934 -0.116118 0.0130121 0.2733722LRRC28 leucine rich repeat containing 28 389 +/- 32 357 +/- 24 478 +/- 25 395 +/- 14 0.02138 -0.447189 -0.021643 0.3077422 0.1417298LRRC37B leucine rich repeat containing 37B 85 +/- 12 114 +/- 6 139 +/- 7 97 +/- 7 0.12692 0.0633626 -0.002603 0.1591368 0.0191785LRRC39 leucine rich repeat containing 39 91 +/- 6 115 +/- 9 98 +/- 6 108 +/- 9 0.900485 0.0438754 0.398742 0.1491985 0.5798223LRRC3B leucine rich repeat containing 3B 1060 +/- 61 844 +/- 59 1402 +/- 91 1140 +/- 58 0.001031 -0.029331 -0.040665 0.0542119 0.2739959LRRC8C Leucine rich repeat containing 8 family, member C 232 +/- 33 400 +/- 51 193 +/- 36 225 +/- 20 -0.039294 0.0233036 0.464991 0.0011553 0.528369LRRFIP1 leucine rich repeat (in FLII) interacting protein 1 1529 +/- 101 1224 +/- 53 1604 +/- 56 1461 +/- 75 0.036357 -0.0299 -0.167583 0.0459792 0.224864LRRN1 leucine rich repeat neuronal 1 2089 +/- 141 1602 +/- 137 2532 +/- 162 1964 +/- 83 0.003337 -0.032954 -0.015981 0.0543872 0.048776LRRN3 leucine rich repeat neuronal 3 1738 +/- 84 1547 +/- 86 1796 +/- 57 1379 +/- 50 -0.873505 -0.142278 -0.000375 0.325884 0.0072199LRRN5 leucine rich repeat neuronal 5 1461 +/- 68 1120 +/- 25 1554 +/- 45 1289 +/- 57 0.017935 -0.002904 -0.006257 0.0073701 0.0648862LSM4 LSM4 homolog, U6 small nuclear RNA associated (S. cerevisiae) 1636 +/- 167 1825 +/- 54 1373 +/- 9 1750 +/- 75 -0.126485 0.3202361 0.007012 0.4957141 0.0036394LSM5 LSM5 homolog, U6 small nuclear RNA associated (S. cerevisiae) 860 +/- 61 808 +/- 19 1126 +/- 50 958 +/- 52 6.31E-05 -0.44519 -0.045762 0.5446384 0.0887925LSM8 LSM8 homolog, U6 small nuclear RNA associated (S. cerevisiae) 638 +/- 35 457 +/- 26 600 +/- 28 455 +/- 21 -0.276978 -0.002364 -0.002654 0.1130698 0.0509296LTB lymphotoxin beta (TNF superfamily, member 3) 150 +/- 32 249 +/- 30 143 +/- 12 161 +/- 19 -0.05276 0.0471031 0.446585 0.0280837 0.4278686LTBP1 latent transforming growth factor beta binding protein 1 361 +/- 17 236 +/- 20 447 +/- 38 218 +/- 28 0.195132 -0.000715 -0.000959 0.0982468 0.0743978LTC4S leukotriene C4 synthase 236 +/- 25 314 +/- 22 201 +/- 17 191 +/- 16 -0.013328 0.0419076 -0.662254 0.0265734 0.2643918LUZP2 Leucine zipper protein 2 148 +/- 21 101 +/- 16 116 +/- 17 69 +/- 8 -0.002594 -0.10366 -0.035562 0.0774908 0.0654404LYK5 protein kinase LYK5 1182 +/- 41 1209 +/- 34 1201 +/- 21 1266 +/- 17 0.393391 0.6225568 0.038831 0.5404764 0.0660318LYPLA3 lysophospholipase 3 (lysosomal phospholipase A2) 288 +/- 21 365 +/- 24 331 +/- 23 339 +/- 18 0.341431 0.0344424 0.774489 0.1625305 0.8967138LYPLAL1 Lysophospholipase-like 1 1724 +/- 216 2920 +/- 69 2065 +/- 232 3308 +/- 85 0.00125 0.0018445 0.002086 0.0113258 0.0342218LYZ lysozyme (renal amyloidosis) 354 +/- 21 541 +/- 71 247 +/- 38 330 +/- 29 -0.002236 0.045574 0.117092 0.0080013 0.1612533LZIC Leucine zipper and CTNNBIP1 domain containing 187 +/- 11 146 +/- 17 188 +/- 10 125 +/- 20 -0.614058 -0.073599 -0.033697 0.6669541 0.1506325LZTR2 Leucine zipper transcription regulator 2 124 +/- 12 87 +/- 9 134 +/- 23 117 +/- 16 0.058076 -0.033319 -0.554797 0.0032105 0.1444458MAD2L1BPMAD2L1 binding protein 801 +/- 48 804 +/- 14 744 +/- 14 700 +/- 10 -0.014653 0.9520305 -0.030987 0.8433146 0.1503947MAD2L2 MAD2 mitotic arrest deficient-like 2 (yeast) 622 +/- 72 573 +/- 24 543 +/- 12 601 +/- 20 -0.397027 -0.546859 0.044277 0.4975125 0.2097003MAGEE1 melanoma antigen family E, 1 1315 +/- 90 1045 +/- 85 1385 +/- 82 1313 +/- 89 0.032925 -0.054496 -0.568035 0.0144637 0.2644807MAGEH1 melanoma antigen family H, 1 5195 +/- 193 4645 +/- 235 6391 +/- 306 5229 +/- 199 0.003344 -0.101413 -0.012417 0.1068453 0.0896327MALAT1 metastasis associated lung adenocarcinoma transcript 1 (non-coding RNA) 999 +/- 139 1887 +/- 224 1230 +/- 192 2019 +/- 444 0.09744 0.0092905 0.158901 0.0157138 0.2406337MAML2 Mastermind-like 2 (Drosophila) 200 +/- 11 150 +/- 14 192 +/- 13 180 +/- 9 0.215953 -0.018402 -0.467975 0.0818255 0.3713773MAN2A1 Mannosidase, alpha, class 2A, member 1 1559 +/- 217 2028 +/- 286 855 +/- 94 1116 +/- 57 -0.000591 0.2219283 0.044273 0.1878816 0.1437013MANEAL mannosidase, endo-alpha-like 2351 +/- 85 2004 +/- 64 2117 +/- 72 1985 +/- 75 -0.041567 -0.009304 -0.239499 0.0043888 0.1250339MAP1LC3Amicrotubule-associated protein 1 light chain 3 alpha 3967 +/- 274 2363 +/- 245 4800 +/- 253 2961 +/- 404 7.47E-05 -0.001442 -0.006366 0.0598346 0.1636142
S1- alphabetical list of aging-related genes.xls Page 17

Young vs Aged MSI CorrelationsSymbol Description Young CA Aged CA Young DG Aged DG CA v DG in CA in DG in CA in DGMAP3K13 Mitogen-activated protein kinase kinase kinase 13 655 +/- 36 806 +/- 40 539 +/- 37 736 +/- 36 -0.003978 0.0192338 0.004278 0.1930077 0.0880737MAP3K3 mitogen-activated protein kinase kinase kinase 3 365 +/- 26 320 +/- 15 396 +/- 23 317 +/- 17 0.421251 -0.179094 -0.021845 0.1388563 0.0452086MAP3K6 mitogen-activated protein kinase kinase kinase 6 292 +/- 47 544 +/- 98 200 +/- 27 272 +/- 34 -0.006841 0.0514709 0.136153 0.0664212 0.0156765MAP4K2 mitogen-activated protein kinase kinase kinase kinase 2 313 +/- 12 258 +/- 18 306 +/- 26 255 +/- 7 -0.83887 -0.032048 -0.101177 0.061029 0.3369089MAP4K4 mitogen-activated protein kinase kinase kinase kinase 4 1103 +/- 94 1434 +/- 119 899 +/- 30 954 +/- 55 -0.002764 0.0546811 0.40866 0.0191518 0.1934536MAP4K5 mitogen-activated protein kinase kinase kinase kinase 5 695 +/- 83 1080 +/- 188 670 +/- 51 919 +/- 70 -0.238071 0.1036578 0.021575 0.0090824 0.0035709MAP6 microtubule-associated protein 6 1084 +/- 21 874 +/- 23 1109 +/- 50 972 +/- 50 0.114599 -4.96E-05 -0.084488 0.0035326 0.3205931MAPK8IP1 mitogen-activated protein kinase 8 interacting protein 1 4276 +/- 133 3711 +/- 134 3607 +/- 165 3762 +/- 73 -0.066483 -0.013644 0.420129 0.0263949 0.3424538MAPK9 Mitogen-activated protein kinase 9 4733 +/- 223 3991 +/- 177 4745 +/- 208 4279 +/- 155 0.386593 -0.027089 -0.107048 0.0045747 0.528748MAPRE1 microtubule-associated protein, RP/EB family, member 1 1826 +/- 135 2236 +/- 182 1327 +/- 73 1595 +/- 31 -0.000328 0.1033306 0.012844 0.0227255 0.0289238MAPRE3 microtubule-associated protein, RP/EB family, member 3 3330 +/- 90 2945 +/- 89 3841 +/- 102 3654 +/- 41 7.86E-06 -0.012243 -0.134442 0.0240235 0.3335935MARCH6 membrane-associated ring finger (C3HC4) 6 1489 +/- 19 1154 +/- 34 1345 +/- 50 1122 +/- 25 -0.028684 -2.87E-05 -0.004757 0.0050401 0.0443174MARK2 MAP/microtubule affinity-regulating kinase 2 823 +/- 33 702 +/- 30 941 +/- 40 765 +/- 25 0.022501 -0.023036 -0.005707 0.1351836 0.132393MASP1 mannan-binding lectin serine peptidase 1 (C4/C2 activating component of Ra-reactive facto 248 +/- 14 181 +/- 18 233 +/- 11 210 +/- 10 0.400344 -0.013609 -0.157176 0.0765893 0.4725587MAST4 microtubule associated serine/threonine kinase family member 4 163 +/- 7 143 +/- 21 168 +/- 2 203 +/- 10 0.09567 -0.408933 0.022908 0.2140955 0.0018216MAT2B methionine adenosyltransferase II, beta 1924 +/- 121 3545 +/- 199 2623 +/- 156 3789 +/- 141 0.006021 9.944E-05 0.00036 0.0073799 0.0041307MATR3 matrin 3 18535 +/- 672 15789 +/- 403 18512 +/- 661 16674 +/- 807 0.506425 -0.007754 -0.115262 0.0347903 0.2129205MAX MYC associated factor X 1031 +/- 87 779 +/- 39 1103 +/- 54 911 +/- 39 0.098348 -0.034214 -0.019564 0.0674485 0.2076106MBD5 methyl-CpG binding domain protein 5 1291 +/- 137 1781 +/- 99 1091 +/- 72 1304 +/- 87 -0.00565 0.0174222 0.094876 0.0314458 0.2979001MBNL2 Muscleblind-like 2 (Drosophila) 431 +/- 36 550 +/- 27 566 +/- 22 603 +/- 44 0.010202 0.0275284 0.492126 0.0026829 0.0633907MBP myelin basic protein 267 +/- 30 382 +/- 30 198 +/- 26 233 +/- 24 -0.002067 0.0221518 0.35689 0.1632095 0.6588283MCAM melanoma cell adhesion molecule 1170 +/- 212 1662 +/- 293 589 +/- 48 817 +/- 61 -0.004321 0.2075345 0.018798 0.0884724 0.0316572MCCC1 methylcrotonoyl-Coenzyme A carboxylase 1 (alpha) 588 +/- 18 799 +/- 27 614 +/- 25 820 +/- 25 0.119145 0.0001339 0.000249 0.0255502 0.0645935MCF2L MCF.2 cell line derived transforming sequence-like 169 +/- 11 113 +/- 10 232 +/- 24 135 +/- 8 0.008463 -0.003333 -0.007613 0.033675 0.0679351MCM3AP MCM3 minichromosome maintenance deficient 3 (S. cerevisiae) associated protein 113 +/- 18 175 +/- 17 138 +/- 12 186 +/- 14 0.320971 0.0344173 0.029902 0.1390213 0.017435MCOLN1 mucolipin 1 869 +/- 34 752 +/- 20 733 +/- 41 707 +/- 21 -0.001182 -0.019151 -0.582762 0.1177468 0.6944621MDH1B malate dehydrogenase 1B, NAD (soluble) 438 +/- 14 356 +/- 17 295 +/- 17 277 +/- 4 -0.000321 -0.004634 -0.33135 0.064732 0.4103282MED19 mediator of RNA polymerase II transcription, subunit 19 homolog (S. cerevisiae) 1426 +/- 32 1306 +/- 36 1307 +/- 44 1177 +/- 45 -0.003276 -0.032648 -0.069495 0.2870689 0.2965897MED6 mediator of RNA polymerase II transcription, subunit 6 homolog (S. cerevisiae) 256 +/- 21 344 +/- 26 281 +/- 19 322 +/- 15 0.403661 0.0259116 0.125755 0.0140672 0.1003775MEGF10 multiple EGF-like-domains 10 775 +/- 88 1122 +/- 99 648 +/- 44 768 +/- 24 -0.025721 0.0259818 0.045696 0.0129927 0.2333869MEIS3 Meis1, myeloid ecotropic viral integration site 1 homolog 3 (mouse) 654 +/- 42 481 +/- 45 714 +/- 138 476 +/- 75 0.528244 -0.019556 -0.170505 0.2113097 0.4813491MEIS3P1 Meis1 homolog 3 (mouse) pseudogene 1 175 +/- 34 118 +/- 10 239 +/- 25 167 +/- 18 0.009456 -0.158737 -0.043823 0.2176017 0.0063298MEST mesoderm specific transcript homolog (mouse) 2485 +/- 318 2364 +/- 191 3814 +/- 151 3349 +/- 120 0.00046 -0.752188 -0.039852 0.8600518 0.0791152METT11D1methyltransferase 11 domain containing 1 227 +/- 25 163 +/- 12 203 +/- 17 195 +/- 18 0.931643 -0.049923 -0.753512 0.0643284 0.4893438METTL5 methyltransferase like 5 537 +/- 35 732 +/- 38 613 +/- 18 740 +/- 26 0.227934 0.0036136 0.004301 0.0647282 0.1395292METTL7A methyltransferase like 7A 306 +/- 63 569 +/- 51 420 +/- 87 661 +/- 102 0.006533 0.009059 0.107987 0.0092362 0.0722464MFAP1 microfibrillar-associated protein 1 1476 +/- 22 1315 +/- 35 1367 +/- 41 1252 +/- 27 -0.012697 -0.004145 -0.047852 0.0023246 0.0629694MFN2 mitofusin 2 4230 +/- 255 4976 +/- 285 3779 +/- 52 4823 +/- 275 -0.132154 0.0800305 0.017921 0.2288597 0.0157142MGLL monoglyceride lipase 886 +/- 65 790 +/- 40 920 +/- 52 666 +/- 35 -0.472827 -0.24052 -0.003363 0.167516 0.0155586MID1IP1 MID1 interacting protein 1 (gastrulation specific G12-like (zebrafish)) 3282 +/- 363 4184 +/- 464 3175 +/- 236 3893 +/- 110 -0.500175 0.1584278 0.028131 0.0559358 0.0671908MIER1 mesoderm induction early response 1 homolog (Xenopus laevis) 445 +/- 23 518 +/- 23 603 +/- 34 526 +/- 34 0.029382 0.0521286 -0.13956 0.1971887 0.0703255MKKS McKusick-Kaufman syndrome 2005 +/- 127 1739 +/- 127 2049 +/- 26 1793 +/- 93 0.347105 -0.169457 -0.049556 0.3633382 0.1914514MKLN1 muskelin 1, intracellular mediator containing kelch motifs 727 +/- 42 901 +/- 60 770 +/- 27 780 +/- 19 -0.507414 0.0406878 0.759906 0.0249527 0.9913302MLH1 mutL homolog 1, colon cancer, nonpolyposis type 2 (E. coli) 569 +/- 45 480 +/- 41 470 +/- 32 363 +/- 16 -0.005193 -0.174971 -0.019893 0.7383671 0.0561074
S1- alphabetical list of aging-related genes.xls Page 18

Young vs Aged MSI CorrelationsSymbol Description Young CA Aged CA Young DG Aged DG CA v DG in CA in DG in CA in DGMLL5 myeloid/lymphoid or mixed-lineage leukemia 5 (trithorax homolog, Drosophila) 1973 +/- 306 931 +/- 182 2063 +/- 365 760 +/- 108 -0.799589 -0.018738 -0.014619 0.0601887 0.038758MLLT10 Myeloid/lymphoid or mixed-lineage leukemia (trithorax homolog, Drosophila); translocated to 261 +/- 16 374 +/- 37 406 +/- 32 426 +/- 73 0.008615 0.0273662 0.811362 0.0087313 0.4124782MNS1 meiosis-specific nuclear structural 1 261 +/- 32 177 +/- 16 182 +/- 17 182 +/- 19 -0.258874 -0.048126 0.990468 0.0778357 0.9215701MOBKL2A MOB1, Mps One Binder kinase activator-like 2A (yeast) 166 +/- 17 108 +/- 15 199 +/- 13 144 +/- 22 0.03428 -0.030366 -0.067489 0.1776544 0.0137142MOBKL2B MOB1, Mps One Binder kinase activator-like 2B (yeast) 138 +/- 10 100 +/- 11 127 +/- 7 86 +/- 4 -0.094381 -0.028522 -0.001404 0.0629582 0.0559199MOBP myelin-associated oligodendrocyte basic protein 3329 +/- 750 6661 +/- 1634 1660 +/- 465 3347 +/- 458 -0.029555 0.106168 0.029747 0.0163244 0.0573451MORC2 MORC family CW-type zinc finger 2 239 +/- 17 310 +/- 23 255 +/- 14 259 +/- 19 -0.537671 0.0330106 0.847917 0.1445579 0.5493222MOSPD2 motile sperm domain containing 2 378 +/- 37 537 +/- 58 304 +/- 24 339 +/- 26 -0.01698 0.0480053 0.356208 0.001366 0.4828524MPEG1 macrophage expressed gene 1 612 +/- 60 826 +/- 70 399 +/- 27 583 +/- 25 -0.001424 0.0432552 0.000738 0.0122355 0.0359659MPP5 membrane protein, palmitoylated 5 (MAGUK p55 subfamily member 5) 1226 +/- 50 1391 +/- 42 1232 +/- 32 1396 +/- 65 0.953747 0.0313973 0.065186 0.0737731 0.4395924MPP6 membrane protein, palmitoylated 6 (MAGUK p55 subfamily member 6) 324 +/- 28 239 +/- 22 340 +/- 27 328 +/- 27 0.053454 -0.038754 -0.752353 0.0603883 0.912007MRFAP1 Mof4 family associated protein 1 14404 +/- 697 16399 +/- 660 13724 +/- 840 16337 +/- 665 -0.332911 0.0644536 0.037762 0.0522461 0.0649041M-RIP myosin phosphatase-Rho interacting protein 3617 +/- 157 3133 +/- 138 3127 +/- 109 2889 +/- 119 -0.019774 -0.043121 -0.177579 0.0014899 0.3564228MRP63 mitochondrial ribosomal protein 63 1794 +/- 66 1575 +/- 30 1880 +/- 76 1746 +/- 80 0.092583 -0.01964 -0.257592 0.0421543 0.3046604MRPL20 mitochondrial ribosomal protein L20 2020 +/- 172 2410 +/- 102 1610 +/- 52 1867 +/- 59 -0.000857 0.0863428 0.010571 0.1739134 0.0151383MRPL22 mitochondrial ribosomal protein L22 706 +/- 20 652 +/- 26 641 +/- 17 556 +/- 21 -0.001229 -0.128265 -0.014089 0.2421444 0.2526271MRPL54 mitochondrial ribosomal protein L54 455 +/- 104 726 +/- 46 610 +/- 107 982 +/- 113 0.004144 0.049292 0.041066 0.0545014 0.0413921MRPS15 mitochondrial ribosomal protein S15 1027 +/- 36 1142 +/- 68 917 +/- 42 1056 +/- 29 -0.056432 0.1731679 0.02398 0.1192765 0.1058852MRPS22 mitochondrial ribosomal protein S22 836 +/- 43 995 +/- 69 810 +/- 40 988 +/- 24 -0.212622 0.0845011 0.005432 0.1050563 0.0043636MRPS7 mitochondrial ribosomal protein S7 629 +/- 23 658 +/- 22 625 +/- 13 709 +/- 21 0.29472 0.3882636 0.011889 0.7491648 0.1191748MRRF mitochondrial ribosome recycling factor 420 +/- 20 360 +/- 12 352 +/- 20 323 +/- 20 -0.019024 -0.032655 -0.331146 0.0505642 0.376247MSTO1 misato homolog 1 (Drosophila) 494 +/- 31 687 +/- 43 490 +/- 34 667 +/- 50 -0.82405 0.00503 0.021227 0.0543974 0.2613201MT1X metallothionein 1X 5805 +/- 490 4035 +/- 332 4142 +/- 463 3622 +/- 294 -0.003586 -0.015631 -0.370711 0.0501186 0.8429125MTG1 mitochondrial GTPase 1 homolog (S. cerevisiae) 1704 +/- 61 1474 +/- 43 1403 +/- 55 1356 +/- 42 -0.00047 -0.01262 -0.51801 0.0267037 0.549807MTHFD2L methylenetetrahydrofolate dehydrogenase (NADP+ dependent) 2-like 641 +/- 53 440 +/- 16 569 +/- 21 415 +/- 23 -0.110664 -0.010974 -0.000814 0.0829861 0.0236995MUM1 melanoma associated antigen (mutated) 1 419 +/- 34 814 +/- 85 436 +/- 18 624 +/- 61 -0.209137 0.0042012 0.035077 0.0063943 0.0028992MXI1 MAX interactor 1 6342 +/- 614 7312 +/- 652 4531 +/- 138 5071 +/- 166 -0.000504 0.3040709 0.036293 0.11012 0.0351373MXRA7 matrix-remodelling associated 7 203 +/- 23 119 +/- 18 218 +/- 27 164 +/- 25 0.017414 -0.018307 -0.17431 0.0471686 0.2162351MYADM myeloid-associated differentiation marker 444 +/- 27 337 +/- 28 548 +/- 77 393 +/- 23 0.064807 -0.020701 -0.10446 0.0197366 0.1079235MYBBP1A MYB binding protein (P160) 1a 227 +/- 13 300 +/- 10 267 +/- 21 271 +/- 13 0.741657 0.0015408 0.877027 0.007627 0.8952852MYEOV2 myeloma overexpressed 2 11575 +/- 867 12859 +/- 629 9590 +/- 539 11808 +/- 395 -0.019511 0.2608522 0.009414 0.3886535 0.0341309MYL6 myosin, light polypeptide 6, alkali, smooth muscle and non-muscle 5381 +/- 175 5499 +/- 158 4330 +/- 103 4685 +/- 116 -1.69E-05 0.6286577 0.048931 0.9036789 0.209868MYLK myosin, light polypeptide kinase 2425 +/- 309 3340 +/- 241 1446 +/- 132 2443 +/- 131 -0.000588 0.043083 0.000478 0.1166348 0.0693647MYO1B myosin IB 240 +/- 40 180 +/- 30 189 +/- 25 121 +/- 13 -0.019778 -0.250919 -0.045613 0.4635443 0.0741961MYSM1 myb-like, SWIRM and MPN domains 1 1621 +/- 104 1918 +/- 60 1905 +/- 135 2056 +/- 106 0.103681 0.0388338 0.400279 0.0991938 0.1981637MYST1 MYST histone acetyltransferase 1 110 +/- 7 152 +/- 8 123 +/- 16 139 +/- 15 0.79701 0.0039066 0.484767 0.0917782 0.4486188N4BP1 Nedd4 binding protein 1 375 +/- 24 511 +/- 28 401 +/- 42 438 +/- 25 -0.70576 0.0045694 0.473765 0.004723 0.3522507N4BP3 Nedd4 binding protein 3 109 +/- 7 101 +/- 7 119 +/- 9 90 +/- 4 -0.532155 -0.409775 -0.022975 0.5139064 0.1388443NADSYN1 NAD synthetase 1 338 +/- 32 449 +/- 39 242 +/- 20 262 +/- 19 -0.000626 0.054237 0.498735 0.0355291 0.7809915NAG neuroblastoma-amplified protein 98 +/- 12 158 +/- 21 165 +/- 17 192 +/- 26 0.046839 0.0385576 0.425889 0.014356 0.4542652NAG8 nasopharyngeal carcinoma associated gene protein-8 312 +/- 11 399 +/- 15 334 +/- 33 363 +/- 26 -0.98914 0.0013178 0.517727 0.0054183 0.419765NAP1L1 nucleosome assembly protein 1-like 1 1463 +/- 33 1829 +/- 95 1400 +/- 79 1475 +/- 74 -0.038209 0.0102 0.499868 0.0008993 0.2561711NAP5 Nck-associated protein 5 211 +/- 31 212 +/- 27 162 +/- 11 123 +/- 8 -0.011994 0.97362 -0.021145 0.6593897 0.1115944NAPB N-ethylmaleimide-sensitive factor attachment protein, beta 177 +/- 26 406 +/- 74 348 +/- 67 475 +/- 68 0.013533 0.0261124 0.218482 0.1134007 0.3241578
S1- alphabetical list of aging-related genes.xls Page 19

Young vs Aged MSI CorrelationsSymbol Description Young CA Aged CA Young DG Aged DG CA v DG in CA in DG in CA in DGNARFL nuclear prelamin A recognition factor-like 763 +/- 44 946 +/- 80 767 +/- 41 988 +/- 52 0.278881 0.0815146 0.010085 0.264246 0.1347152NASP Nuclear autoantigenic sperm protein (histone-binding) 466 +/- 56 813 +/- 84 458 +/- 42 736 +/- 35 -0.070871 0.0078378 0.000662 0.0060059 0.0010065NAT5 N-acetyltransferase 5 5238 +/- 136 4713 +/- 92 5091 +/- 104 4770 +/- 113 -0.579759 -0.011364 -0.067795 0.0215746 0.2718969NBR1 neighbor of BRCA1 gene 1 1100 +/- 31 1283 +/- 49 1205 +/- 34 1320 +/- 16 0.027118 0.0122479 0.018009 0.0015849 0.086231NCAM1 neural cell adhesion molecule 1 374 +/- 80 1218 +/- 237 262 +/- 43 746 +/- 266 -0.031607 0.014441 0.142824 0.0932677 0.5633117NCKIPSD NCK interacting protein with SH3 domain 1420 +/- 128 2242 +/- 157 1411 +/- 94 2164 +/- 111 -0.57819 0.0024476 0.000745 0.0937244 0.0319407NCOA5 nuclear receptor coactivator 5 279 +/- 3 222 +/- 19 348 +/- 18 305 +/- 13 6.26E-05 -0.02781 -0.088613 0.0763502 0.2254017NDRG1 N-myc downstream regulated gene 1 6429 +/- 896 7904 +/- 978 4264 +/- 354 5467 +/- 340 -0.011262 0.2923671 0.036858 0.1415015 0.025735NDUFA1 NADH dehydrogenase (ubiquinone) 1 alpha subcomplex, 1, 7.5kDa 12545 +/- 378 10794 +/- 469 11641 +/- 107 11222 +/- 234 -0.624295 -0.016288 -0.157323 0.0037112 0.0136428NDUFB10 NADH dehydrogenase (ubiquinone) 1 beta subcomplex, 10, 22kDa 397 +/- 30 271 +/- 22 317 +/- 19 301 +/- 26 -0.284404 -0.007124 -0.622555 0.0041018 0.2428042NDUFB2 NADH dehydrogenase (ubiquinone) 1 beta subcomplex, 2, 8kDa 2656 +/- 38 2528 +/- 107 2217 +/- 39 2426 +/- 38 -0.003763 -0.300337 0.003892 0.0102589 0.1145787NDUFB8 NADH dehydrogenase (ubiquinone) 1 beta subcomplex, 8, 19kDa 11769 +/- 658 13321 +/- 391 9711 +/- 250 12186 +/- 194 -0.00071 0.0763743 2.97E-05 0.311303 0.0182935NDUFC1 NADH dehydrogenase (ubiquinone) 1, subcomplex unknown, 1, 6kDa 6197 +/- 241 5433 +/- 247 6237 +/- 149 5646 +/- 145 0.370562 -0.05122 -0.019431 0.0329258 0.0326521NDUFS2 NADH dehydrogenase (ubiquinone) Fe-S protein 2, 49kDa (NADH-coenzyme Q reductase) 2696 +/- 97 2386 +/- 111 2750 +/- 69 2421 +/- 74 0.905299 -0.062112 -0.010541 0.0223896 0.012268NDUFV1 NADH dehydrogenase (ubiquinone) flavoprotein 1, 51kDa 2923 +/- 155 2506 +/- 143 2595 +/- 65 2288 +/- 108 -0.051091 -0.076226 -0.045771 0.1271505 0.2553183NECAP2 NECAP endocytosis associated 2 1224 +/- 129 1647 +/- 142 993 +/- 53 1204 +/- 15 -0.006308 0.0523344 0.009162 0.0413594 0.0504406NEDD9 neural precursor cell expressed, developmentally down-regulated 9 171 +/- 24 264 +/- 31 142 +/- 23 201 +/- 20 -0.016703 0.0430915 0.08859 0.0470127 0.0403083NEK7 NIMA (never in mitosis gene a)-related kinase 7 2990 +/- 247 3754 +/- 214 2291 +/- 122 2919 +/- 48 -0.000365 0.0420786 0.002479 0.0245299 0.0114918NETO2 neuropilin (NRP) and tolloid (TLL)-like 2 2261 +/- 64 1727 +/- 92 1797 +/- 68 1378 +/- 100 -1.76E-05 -0.001018 -0.009544 0.0059959 0.0224438NEU4 sialidase 4 318 +/- 28 531 +/- 71 374 +/- 25 540 +/- 33 0.215951 0.0294723 0.003914 0.0028642 0.0682563NFAT5 nuclear factor of activated T-cells 5, tonicity-responsive 3892 +/- 75 3653 +/- 71 3843 +/- 56 3902 +/- 34 0.309128 -0.043532 0.39059 0.0610563 0.3535764NFIA nuclear factor I/A 731 +/- 78 982 +/- 55 989 +/- 53 935 +/- 121 0.147136 0.0267501 -0.697485 0.1030034 0.1772282NFIC nuclear factor I/C (CCAAT-binding transcription factor) 198 +/- 10 244 +/- 11 275 +/- 22 264 +/- 14 0.015033 0.0111857 -0.689607 0.0046001 0.8942694NFIL3 nuclear factor, interleukin 3 regulated 495 +/- 40 462 +/- 38 822 +/- 51 669 +/- 29 0.000782 -0.562878 -0.032292 0.5630724 0.1254024NFKBIZ Nuclear factor of kappa light polypeptide gene enhancer in B-cells inhibitor, zeta 167 +/- 11 264 +/- 26 150 +/- 6 206 +/- 14 -0.035425 0.0112849 0.01217 0.0001388 0.0254422NFX1 nuclear transcription factor, X-box binding 1 115 +/- 15 162 +/- 12 126 +/- 3 169 +/- 16 0.480669 0.0398384 0.047698 0.1197636 0.0784361NHP2L1 NHP2 non-histone chromosome protein 2-like 1 (S. cerevisiae) 59 +/- 14 219 +/- 15 65 +/- 8 167 +/- 16 -0.298555 1.605E-05 0.001334 8.789E-05 0.0458718NIBP NIK and IKK{beta} binding protein 744 +/- 67 889 +/- 46 598 +/- 42 755 +/- 42 -0.019114 0.1096693 0.026365 0.160192 0.1644102NIFUN NifU-like N-terminal domain containing 10519 +/- 373 10858 +/- 390 9520 +/- 257 10727 +/- 229 -0.01697 0.5434208 0.00664 0.7958581 0.0285253NINJ2 ninjurin 2 672 +/- 49 990 +/- 158 361 +/- 35 494 +/- 25 -0.002231 0.1042603 0.014367 0.0107827 0.03445NIPBL Nipped-B homolog (Drosophila) 651 +/- 32 814 +/- 41 781 +/- 26 815 +/- 32 0.035838 0.0111975 0.434143 0.0066467 0.6387933NISCH nischarin 262 +/- 23 343 +/- 27 377 +/- 20 423 +/- 44 0.008463 0.0475203 0.38318 0.1719379 0.043231NKD2 naked cuticle homolog 2 (Drosophila) 229 +/- 12 225 +/- 18 335 +/- 22 274 +/- 16 0.00102 -0.873328 -0.053989 0.951125 0.1893995NKTR natural killer-tumor recognition sequence 456 +/- 55 637 +/- 40 647 +/- 63 788 +/- 65 0.000111 0.024757 0.155518 0.0520207 0.3418644NME1 Non-metastatic cells 1, protein (NM23A) expressed in 1207 +/- 74 1482 +/- 34 1218 +/- 92 1399 +/- 47 -0.488309 0.011643 0.119899 0.1119294 0.3363699NMNAT1 nicotinamide nucleotide adenylyltransferase 1 148 +/- 15 217 +/- 22 178 +/- 10 206 +/- 24 0.360594 0.0291658 0.321266 0.0339437 0.2288575NMRAL1 NmrA-like family domain containing 1 1470 +/- 75 1003 +/- 79 1214 +/- 54 797 +/- 29 -0.000141 -0.00164 -0.000186 0.0303439 0.0085358NMT2 N-myristoyltransferase 2 443 +/- 35 350 +/- 17 594 +/- 32 534 +/- 28 1.87E-05 -0.045269 -0.185807 0.0344018 0.2033577NOG Noggin 599 +/- 81 458 +/- 67 733 +/- 50 542 +/- 33 0.051327 -0.208994 -0.011914 0.1772806 0.0994863NOL8 nucleolar protein 8 1828 +/- 50 1420 +/- 66 1771 +/- 73 1225 +/- 62 -0.162685 -0.000763 -0.00031 0.0134244 0.0071962NOP17 NOP17 882 +/- 62 1108 +/- 85 828 +/- 45 1014 +/- 32 -0.183839 0.0600401 0.00885 0.2589579 0.0290224NOTUM notum pectinacetylesterase homolog (Drosophila) 87 +/- 16 107 +/- 11 136 +/- 15 92 +/- 6 0.274664 0.3216937 -0.036055 0.3311443 0.1019138NPAS2 neuronal PAS domain protein 2 1237 +/- 69 1027 +/- 36 1162 +/- 50 1055 +/- 32 -0.492833 -0.028196 -0.104973 0.0059946 0.3813514NPAT nuclear protein, ataxia-telangiectasia locus 490 +/- 15 619 +/- 32 435 +/- 15 535 +/- 41 -0.001088 0.0079427 0.071889 0.0227281 0.1146014
S1- alphabetical list of aging-related genes.xls Page 20

Young vs Aged MSI CorrelationsSymbol Description Young CA Aged CA Young DG Aged DG CA v DG in CA in DG in CA in DGNPC1 Niemann-Pick disease, type C1 1631 +/- 195 2450 +/- 429 909 +/- 54 1244 +/- 72 -0.003597 0.1255651 0.006001 0.0150477 0.004993NPEPL1 aminopeptidase-like 1 143 +/- 12 156 +/- 13 174 +/- 8 136 +/- 11 0.554359 0.4813468 -0.025601 0.7999007 0.1183292NPHP3 nephronophthisis 3 (adolescent) 113 +/- 9 157 +/- 10 147 +/- 18 189 +/- 8 0.005721 0.0088437 0.07045 0.0690173 0.13618NPL N-acetylneuraminate pyruvate lyase (dihydrodipicolinate synthase) 229 +/- 29 384 +/- 51 300 +/- 21 335 +/- 41 0.994805 0.0306947 0.479418 0.1158414 0.6960425NPLOC4 nuclear protein localization 4 homolog (S. cerevisiae) 1165 +/- 45 1126 +/- 45 1102 +/- 47 968 +/- 34 -0.06142 -0.55794 -0.046812 0.6237396 0.1433947NR2F1 Nuclear receptor subfamily 2, group F, member 1 3880 +/- 234 4227 +/- 278 4775 +/- 257 5717 +/- 210 0.001232 0.3628789 0.019733 0.6493127 0.043827NR3C1 Nuclear receptor subfamily 3, group C, member 1 (glucocorticoid receptor) 263 +/- 52 681 +/- 115 326 +/- 52 464 +/- 66 -0.266534 0.012777 0.138402 0.0010057 0.0254784NRBP2 nuclear receptor binding protein 2 3166 +/- 354 3523 +/- 368 2980 +/- 110 3462 +/- 135 -0.457122 0.5009616 0.023662 0.355252 0.0119777NRF1 nuclear respiratory factor 1 180 +/- 11 223 +/- 12 164 +/- 5 186 +/- 16 -0.006482 0.0251685 0.246261 0.0249377 0.1096532NRP2 neuropilin 2 178 +/- 27 256 +/- 23 279 +/- 17 347 +/- 12 0.001843 0.0546684 0.010231 0.0441847 0.0569377NRXN1 neurexin 1 10862 +/- 245 9499 +/- 402 10764 +/- 142 9886 +/- 287 0.770465 -0.019308 -0.03393 0.0314915 0.1487276NSUN2 NOL1/NOP2/Sun domain family, member 2 521 +/- 29 653 +/- 50 633 +/- 51 677 +/- 39 0.005451 0.0534071 0.513679 0.2984479 0.8637154NUBP1 nucleotide binding protein 1 (MinD homolog, E. coli) 679 +/- 25 548 +/- 12 607 +/- 21 506 +/- 19 -0.004407 -0.002201 -0.006862 0.0254274 0.0773208NUDT10 nudix (nucleoside diphosphate linked moiety X)-type motif 10 282 +/- 18 221 +/- 15 266 +/- 20 231 +/- 22 -0.68097 -0.0254 -0.265813 0.0055507 0.163942NUDT4 nudix (nucleoside diphosphate linked moiety X)-type motif 4 341 +/- 23 281 +/- 33 505 +/- 25 364 +/- 47 0.000121 -0.167955 -0.036215 0.2096351 0.049617NUDT5 nudix (nucleoside diphosphate linked moiety X)-type motif 5 884 +/- 75 1105 +/- 67 672 +/- 11 954 +/- 63 -0.003564 0.0533906 0.010161 0.0942105 0.1224147NUFIP1 nuclear fragile X mental retardation protein interacting protein 1 389 +/- 16 344 +/- 13 423 +/- 26 378 +/- 24 0.012366 -0.053026 -0.23428 0.0239729 0.108255NUFIP2 nuclear fragile X mental retardation protein interacting protein 2 761 +/- 34 710 +/- 36 845 +/- 39 746 +/- 16 0.029363 -0.328267 -0.051374 0.748716 0.0581558NUP50 nucleoporin 50kDa 2247 +/- 143 3427 +/- 362 2766 +/- 251 3193 +/- 321 0.052566 0.0208199 0.325114 0.0368692 0.442796NUP62 nucleoporin 62kDa 885 +/- 11 1158 +/- 43 1053 +/- 49 1241 +/- 35 0.01417 0.0009882 0.012691 0.0697167 0.041829NUPL1 nucleoporin like 1 80 +/- 12 133 +/- 19 138 +/- 7 175 +/- 24 0.000357 0.0436761 0.212114 0.2357862 0.8285182NUPL2 nucleoporin like 2 194 +/- 5 182 +/- 13 206 +/- 12 164 +/- 7 -0.987486 -0.45405 -0.015258 0.7668864 0.0074733NUTF2 Nuclear transport factor 2 611 +/- 38 479 +/- 23 607 +/- 22 528 +/- 32 0.48148 -0.01707 -0.081001 0.022601 0.1385723NVL nuclear VCP-like 300 +/- 30 444 +/- 43 292 +/- 21 362 +/- 6 -0.185107 0.0231641 0.018625 0.0013892 0.0526935OBFC1 oligonucleotide/oligosaccharide-binding fold containing 1 224 +/- 12 220 +/- 22 169 +/- 11 211 +/- 12 -0.012381 -0.891075 0.028949 0.4253951 0.3264349OCRL oculocerebrorenal syndrome of Lowe 5167 +/- 351 2651 +/- 414 4835 +/- 441 3145 +/- 483 0.924081 -0.000997 -0.030467 0.0289456 0.2772858ODZ4 odz, odd Oz/ten-m homolog 4 (Drosophila) 1909 +/- 94 1463 +/- 108 1647 +/- 86 1434 +/- 117 -0.248314 -0.011219 -0.179929 0.0042511 0.0642511OGDH oxoglutarate (alpha-ketoglutarate) dehydrogenase (lipoamide) 1659 +/- 60 1455 +/- 67 1434 +/- 34 1400 +/- 37 -0.010026 -0.045988 -0.523984 0.0404441 0.3839513OGFRL1 opioid growth factor receptor-like 1 121 +/- 12 168 +/- 17 211 +/- 16 189 +/- 23 0.006054 0.0544192 -0.447763 0.0564482 0.47636OGG1 8-oxoguanine DNA glycosylase 301 +/- 28 351 +/- 24 298 +/- 15 364 +/- 22 0.700106 0.2095177 0.039468 0.3472369 0.0004648OGN osteoglycin (osteoinductive factor, mimecan) 1651 +/- 630 839 +/- 341 397 +/- 58 709 +/- 94 -0.132398 -0.290932 0.029188 0.0859827 0.0012253OGT O-linked N-acetylglucosamine (GlcNAc) transferase (UDP-N-acetylglucosamine:polypeptide 1094 +/- 60 899 +/- 25 1800 +/- 83 1694 +/- 67 4.43E-07 -0.022121 -0.34876 0.1719069 0.6526878OLIG1 oligodendrocyte transcription factor 1 10505 +/- 1321 11917 +/- 1508 6389 +/- 320 7664 +/- 455 -0.002276 0.4974144 0.053366 0.2657782 0.0402461OLR1 oxidised low density lipoprotein (lectin-like) receptor 1 109 +/- 11 211 +/- 34 91 +/- 17 134 +/- 20 -0.097589 0.0274779 0.137991 0.000134 0.3977128OPTN optineurin 1234 +/- 134 1443 +/- 56 1440 +/- 68 1677 +/- 80 0.000947 0.1953036 0.051872 0.2762996 0.044902OR2C1 olfactory receptor, family 2, subfamily C, member 1 141 +/- 10 140 +/- 11 189 +/- 16 125 +/- 15 0.394261 -0.916289 -0.014564 0.8436501 0.0243241ORC4L origin recognition complex, subunit 4-like (yeast) 941 +/- 34 812 +/- 27 846 +/- 20 797 +/- 54 -0.061326 -0.014334 -0.430875 0.0731478 0.5829527OSBPL11 oxysterol binding protein-like 11 1537 +/- 69 1374 +/- 41 1376 +/- 35 1266 +/- 31 -0.011451 -0.075652 -0.044285 0.0694511 0.0146336OSBPL1A oxysterol binding protein-like 1A 5228 +/- 458 5797 +/- 389 3578 +/- 80 4173 +/- 148 -0.000969 0.3665203 0.011533 0.3098806 0.0059963OSBPL2 oxysterol binding protein-like 2 588 +/- 28 649 +/- 27 587 +/- 10 638 +/- 14 -0.745547 0.1550401 0.019473 0.0725911 0.0811676OSBPL6 oxysterol binding protein-like 6 2412 +/- 155 1905 +/- 45 2468 +/- 135 1963 +/- 75 0.382613 -0.020642 -0.012145 0.0934375 0.2274816OSGEP O-sialoglycoprotein endopeptidase 459 +/- 30 536 +/- 32 410 +/- 14 486 +/- 23 -0.0199 0.11213 0.027453 0.4425687 0.0759765OSTalpha organic solute transporter alpha 185 +/- 40 66 +/- 8 151 +/- 24 54 +/- 13 -0.10308 -0.028624 -0.007414 0.0171587 0.046107P2RX5 purinergic receptor P2X, ligand-gated ion channel, 5 1338 +/- 74 1083 +/- 93 1528 +/- 87 1238 +/- 63 0.025993 -0.058172 -0.025511 0.0974106 0.0695644
S1- alphabetical list of aging-related genes.xls Page 21

Young vs Aged MSI CorrelationsSymbol Description Young CA Aged CA Young DG Aged DG CA v DG in CA in DG in CA in DGP2RY12 purinergic receptor P2Y, G-protein coupled, 12 1248 +/- 88 1177 +/- 79 1077 +/- 48 848 +/- 66 -0.011588 -0.565026 -0.023701 0.9972657 0.0388881P8 p8 protein (candidate of metastasis 1) 397 +/- 62 578 +/- 55 378 +/- 56 493 +/- 36 -0.036934 0.0539708 0.12096 0.0367176 0.1038003PA2G4 proliferation-associated 2G4, 38kDa 712 +/- 69 939 +/- 45 885 +/- 51 1182 +/- 44 0.000332 0.0231989 0.001752 0.0297561 0.0004348PABPC1 Poly(A) binding protein, cytoplasmic 1 183 +/- 21 254 +/- 18 240 +/- 24 272 +/- 26 0.073825 0.0283996 0.40093 0.0113999 0.6629855PABPC5 poly(A) binding protein, cytoplasmic 5 153 +/- 5 103 +/- 10 160 +/- 15 110 +/- 8 0.609611 -0.003193 -0.019985 0.089754 0.1251707PACRG PARK2 co-regulated 1071 +/- 37 1394 +/- 73 893 +/- 44 1132 +/- 74 -0.000382 0.0049231 0.028089 0.0005899 0.0063267PAIP1 poly(A) binding protein interacting protein 1 2718 +/- 182 2080 +/- 74 3154 +/- 104 2326 +/- 67 0.015668 -0.015324 -0.000136 0.031099 0.0141581PAIP2 poly(A) binding protein interacting protein 2 6014 +/- 283 6884 +/- 216 5284 +/- 145 5886 +/- 240 -0.001414 0.0363882 0.070781 0.0951697 0.28479PAK2 p21 (CDKN1A)-activated kinase 2 335 +/- 25 481 +/- 33 362 +/- 10 410 +/- 22 -0.468014 0.0059192 0.096547 0.0016975 0.5022974PAK3 P21 (CDKN1A)-activated kinase 3 227 +/- 18 167 +/- 19 271 +/- 16 203 +/- 14 0.052076 -0.048202 -0.010497 0.0506195 0.0772543PALLD palladin, cytoskeletal associated protein 483 +/- 53 658 +/- 48 529 +/- 39 581 +/- 31 -0.86 0.0351675 0.314434 0.0136144 0.5775141PALMD palmdelphin 203 +/- 17 151 +/- 13 248 +/- 26 204 +/- 20 0.000514 -0.039876 -0.211303 0.202666 0.2398417PAN3 PAN3 polyA specific ribonuclease subunit homolog (S. cerevisiae) 1456 +/- 117 1346 +/- 43 1368 +/- 61 1193 +/- 38 -0.214488 -0.411628 -0.040479 0.6692186 0.1739636PAPD1 PAP associated domain containing 1 886 +/- 44 1400 +/- 87 1045 +/- 67 1422 +/- 80 0.027286 0.0009632 0.006476 0.002258 0.0023265PAPOLG poly(A) polymerase gamma 791 +/- 23 698 +/- 22 821 +/- 24 839 +/- 22 0.005476 -0.014573 0.597447 0.041462 0.8523547PAQR8 progestin and adipoQ receptor family member VIII 3877 +/- 236 4674 +/- 31 4024 +/- 144 4047 +/- 240 -0.556169 0.0191116 0.939482 0.1003113 0.3960777PARP3 poly (ADP-ribose) polymerase family, member 3 333 +/- 39 495 +/- 52 342 +/- 27 363 +/- 17 -0.190787 0.0340818 0.517761 0.0298083 0.8354114PARP8 poly (ADP-ribose) polymerase family, member 8 406 +/- 45 403 +/- 30 443 +/- 29 519 +/- 18 0.010472 -0.951028 0.053006 0.9421587 0.1955899PASK PAS domain containing serine/threonine kinase 171 +/- 15 144 +/- 18 171 +/- 11 130 +/- 11 -0.845199 -0.279469 -0.029536 0.3171243 0.2230276PB1 polybromo 1 2458 +/- 285 3086 +/- 101 2471 +/- 95 3125 +/- 70 0.913899 0.0817419 0.000415 0.137583 0.0063458PBX1 Pre-B-cell leukemia transcription factor 1 1716 +/- 118 2769 +/- 217 1455 +/- 111 2238 +/- 91 -0.003412 0.0029746 0.000413 0.0044114 0.0061288PCBP1 poly(rC) binding protein 1 3493 +/- 69 3140 +/- 89 3412 +/- 103 3322 +/- 114 0.975077 -0.011417 -0.572879 0.007885 0.4987079PCDH1 protocadherin 1 (cadherin-like 1) 178 +/- 17 162 +/- 12 240 +/- 16 186 +/- 15 0.001299 -0.439022 -0.039922 0.1526281 0.0256257PCDH10 protocadherin 10 956 +/- 148 1051 +/- 135 653 +/- 82 380 +/- 31 -0.000867 0.6474616 -0.019473 0.7187845 0.0700467PCDHB14 protocadherin beta 14 224 +/- 13 229 +/- 9 342 +/- 16 269 +/- 6 0.001369 0.7321903 -0.004447 0.2135377 0.0333462PCDHGB6 protocadherin gamma subfamily B, 6 4504 +/- 348 5671 +/- 569 2978 +/- 131 3473 +/- 103 -0.000517 0.1168144 0.016108 0.0748677 0.0446749PCF11 PCF11, cleavage and polyadenylation factor subunit, homolog (S. cerevisiae) 929 +/- 93 1221 +/- 73 1180 +/- 136 1270 +/- 151 0.268297 0.0346984 0.669485 0.0934137 0.7682323PCGF2 polycomb group ring finger 2 253 +/- 17 158 +/- 15 362 +/- 10 234 +/- 26 2.51E-05 -0.001817 -0.005282 0.0438859 0.0396435PCGF5 polycomb group ring finger 5 241 +/- 31 382 +/- 71 220 +/- 18 310 +/- 16 -0.126114 0.1128983 0.004382 0.024573 0.016707PCID2 PCI domain containing 2 422 +/- 26 371 +/- 24 406 +/- 11 289 +/- 11 -0.037605 -0.183262 -4.09E-05 0.0833054 0.0063696PCNP PEST proteolytic signal containing nuclear protein 4478 +/- 358 5960 +/- 334 4068 +/- 199 4741 +/- 246 -0.010461 0.0127892 0.065491 0.0062998 0.2290232PCOLN3 procollagen (type III) N-endopeptidase 961 +/- 26 1244 +/- 123 979 +/- 64 1383 +/- 101 0.252081 0.069583 0.012167 0.2008688 0.147378PCSK2 proprotein convertase subtilisin/kexin type 2 3146 +/- 220 2328 +/- 198 2601 +/- 119 2049 +/- 105 -0.013546 -0.020418 -0.006951 0.0123245 0.060491PCTK2 PCTAIRE protein kinase 2 4630 +/- 476 3780 +/- 295 5133 +/- 337 4095 +/- 92 0.204156 -0.166031 -0.02624 0.2028421 0.1347022PDCD6IP programmed cell death 6 interacting protein 1108 +/- 45 997 +/- 36 1209 +/- 22 1087 +/- 41 0.005832 -0.084134 -0.03722 0.1395256 0.0535386PDDC1 Parkinson disease 7 domain containing 1 828 +/- 44 710 +/- 44 853 +/- 30 700 +/- 27 0.635195 -0.084896 -0.003948 0.1653166 0.0069087PDE8B phosphodiesterase 8B 248 +/- 54 368 +/- 71 377 +/- 54 570 +/- 63 0.005075 0.2073609 0.04528 0.6610919 0.3982629PDGFA platelet-derived growth factor alpha polypeptide 71 +/- 16 134 +/- 20 87 +/- 13 170 +/- 42 0.29246 0.0358641 0.119292 0.1336643 0.0960993PDGFB platelet-derived growth factor beta polypeptide (simian sarcoma viral (v-sis) oncogene homo 468 +/- 21 394 +/- 23 454 +/- 37 444 +/- 37 0.70054 -0.042901 -0.846961 0.0993042 0.6062047PDIA2 protein disulfide isomerase family A, member 2 137 +/- 34 221 +/- 20 178 +/- 12 237 +/- 20 0.237967 0.0633597 0.044121 0.1151384 0.0657758PDIA4 protein disulfide isomerase family A, member 4 1106 +/- 38 1038 +/- 64 1073 +/- 53 906 +/- 43 -0.218147 -0.387693 -0.038213 0.5783893 0.0289826PDK3 Pyruvate dehydrogenase kinase, isozyme 3 704 +/- 98 960 +/- 111 993 +/- 129 1593 +/- 94 0.000496 0.113882 0.00477 0.4282027 0.0643055PDLIM4 PDZ and LIM domain 4 397 +/- 29 502 +/- 35 398 +/- 27 477 +/- 30 -0.430923 0.0456115 0.083153 0.0597891 0.2987527PDXP pyridoxal (pyridoxine, vitamin B6) phosphatase 5584 +/- 267 4404 +/- 240 5656 +/- 156 4968 +/- 141 0.186091 -0.00839 -0.009631 0.0004247 0.0147433
S1- alphabetical list of aging-related genes.xls Page 22

Young vs Aged MSI CorrelationsSymbol Description Young CA Aged CA Young DG Aged DG CA v DG in CA in DG in CA in DGPDZRN4 PDZ domain containing RING finger 4 961 +/- 82 934 +/- 58 831 +/- 30 732 +/- 22 -0.021366 -0.790399 -0.028345 0.5257061 0.0958787PEA15 phosphoprotein enriched in astrocytes 15 14228 +/- 407 15719 +/- 171 16261 +/- 383 17626 +/- 635 0.001449 0.0125159 0.110018 0.0156896 0.3490645PEG10 paternally expressed 10 1103 +/- 193 1186 +/- 106 1593 +/- 124 1132 +/- 65 0.264642 0.7157906 -0.012088 0.7585418 0.0534317PEX11A Peroxisomal biogenesis factor 11A 115 +/- 9 142 +/- 7 134 +/- 13 144 +/- 10 0.222655 0.0408075 0.54528 0.0214573 0.610458PEX14 peroxisomal biogenesis factor 14 1046 +/- 74 925 +/- 41 1172 +/- 79 945 +/- 26 0.257463 -0.190372 -0.034155 0.0849895 0.0661495PEX6 peroxisomal biogenesis factor 6 1024 +/- 62 855 +/- 43 1081 +/- 68 886 +/- 19 0.262729 -0.051379 -0.033672 0.0169983 0.0531548PFAAP5 phosphonoformate immuno-associated protein 5 540 +/- 18 663 +/- 31 644 +/- 46 682 +/- 23 0.08712 0.0093525 0.484303 0.0360972 0.9992894PFDN1 prefoldin subunit 1 3757 +/- 69 3495 +/- 74 3517 +/- 72 3281 +/- 42 -0.02002 -0.026758 -0.022375 0.003462 0.1034135PFDN4 prefoldin subunit 4 737 +/- 71 858 +/- 41 809 +/- 83 1017 +/- 19 0.014219 0.178896 0.053249 0.1720676 0.2405397PFKFB2 6-phosphofructo-2-kinase/fructose-2,6-biphosphatase 2 531 +/- 38 759 +/- 35 440 +/- 25 533 +/- 18 -0.00079 0.0013335 0.014641 0.005562 0.0135006PFKL phosphofructokinase, liver 1784 +/- 148 1890 +/- 147 1627 +/- 63 1907 +/- 88 -0.861285 0.6198749 0.033723 0.8964558 0.1126362PGAM1 phosphoglycerate mutase 1 (brain) 11785 +/- 417 13568 +/- 474 10224 +/- 320 12402 +/- 471 -0.001479 0.0183042 0.006018 0.1469321 0.0390915PGAM2 phosphoglycerate mutase 2 (muscle) 175 +/- 19 219 +/- 19 163 +/- 19 222 +/- 6 -0.945968 0.1251703 0.024152 0.1214422 0.0491783PGM2L1 phosphoglucomutase 2-like 1 4422 +/- 615 3043 +/- 130 4291 +/- 170 3223 +/- 103 0.986368 -0.07524 -0.000674 0.0376398 0.0035047PHC3 Polyhomeotic like 3 (Drosophila) 83 +/- 5 113 +/- 9 127 +/- 13 127 +/- 17 0.036711 0.0254323 -0.986452 0.0747679 0.4313701PHF10 PHD finger protein 10 327 +/- 31 419 +/- 15 380 +/- 14 460 +/- 26 0.044383 0.0325161 0.034908 0.0388483 0.1085417PHF20 PHD finger protein 20 592 +/- 14 520 +/- 25 526 +/- 18 503 +/- 18 -0.093536 -0.036912 -0.388661 0.1862259 0.8539314PHF21A PHD finger protein 21A 468 +/- 21 547 +/- 29 481 +/- 21 523 +/- 41 -0.946357 0.0494199 0.396797 0.0360878 0.4265687PHF3 PHD finger protein 3 1737 +/- 78 2049 +/- 109 1967 +/- 66 2013 +/- 122 0.257221 0.04437 0.752339 0.0019306 0.2314451PHLDA1 pleckstrin homology-like domain, family A, member 1 421 +/- 36 319 +/- 24 453 +/- 52 320 +/- 63 0.712182 -0.043072 -0.140808 0.014175 0.1210356PHOSPHOphosphatase, orphan 2 671 +/- 78 1066 +/- 59 648 +/- 36 1124 +/- 54 0.761082 0.0026659 0.000135 0.0303631 0.0066343PIGB phosphatidylinositol glycan, class B 477 +/- 19 647 +/- 44 496 +/- 15 519 +/- 26 -0.178267 0.0099728 0.456551 0.0010067 0.5582237PIGG phosphatidylinositol glycan, class G 748 +/- 78 456 +/- 62 758 +/- 104 521 +/- 43 0.535688 -0.015859 -0.075387 0.0958849 0.2558164PIGS phosphatidylinositol glycan, class S 2823 +/- 73 3263 +/- 183 2696 +/- 71 3307 +/- 125 -0.826099 0.062593 0.004496 0.2144759 0.0931655PIGZ phosphatidylinositol glycan, class Z 644 +/- 33 916 +/- 90 686 +/- 41 941 +/- 35 0.263631 0.0274333 0.001051 0.094047 0.0159916PIK3C2A Phosphoinositide-3-kinase, class 2, alpha polypeptide 1130 +/- 44 1263 +/- 40 1085 +/- 33 1109 +/- 30 -0.003738 0.0481159 0.603829 0.0485674 0.7559619PIK3R2 phosphoinositide-3-kinase, regulatory subunit 2 (p85 beta) 5364 +/- 460 3833 +/- 348 4458 +/- 93 3892 +/- 156 -0.338919 -0.025608 -0.017781 0.0210901 0.0952849PINK1 PTEN induced putative kinase 1 5970 +/- 290 3813 +/- 313 5732 +/- 418 4288 +/- 150 0.726644 -0.000504 -0.016544 0.0050779 0.1139928PIP5K1B phosphatidylinositol-4-phosphate 5-kinase, type I, beta 1195 +/- 134 787 +/- 70 608 +/- 59 541 +/- 13 -0.001939 -0.028873 -0.314437 0.0181839 0.2623352PIP5K3 phosphatidylinositol-3-phosphate/phosphatidylinositol 5-kinase, type III 1685 +/- 66 1442 +/- 57 1387 +/- 56 1232 +/- 71 -0.000187 -0.020366 -0.126116 0.1793597 0.222708PIPOX pipecolic acid oxidase 388 +/- 35 493 +/- 32 447 +/- 29 523 +/- 16 0.046104 0.0521533 0.051334 0.0365581 0.3326665PITPNC1 Phosphatidylinositol transfer protein, cytoplasmic 1 130 +/- 18 150 +/- 13 145 +/- 6 207 +/- 21 0.04088 0.3841422 0.036598 0.1265199 0.0304022PKIA Protein kinase (cAMP-dependent, catalytic) inhibitor alpha 252 +/- 9 223 +/- 13 277 +/- 14 229 +/- 14 0.102118 -0.094144 -0.041148 0.5273853 0.1715247PKN1 protein kinase N1 1025 +/- 87 1327 +/- 101 952 +/- 42 1034 +/- 60 -0.051585 0.0479771 0.299131 0.1114371 0.5076743PKP4 plakophilin 4 192 +/- 40 356 +/- 46 228 +/- 41 321 +/- 34 0.802794 0.0232074 0.116215 0.1495779 0.0667115PLA2G12Aphospholipase A2, group XIIA 659 +/- 57 425 +/- 65 583 +/- 43 397 +/- 74 -0.059816 -0.021907 -0.068933 0.0042712 0.0052474PLA2G4C phospholipase A2, group IVC (cytosolic, calcium-independent) 321 +/- 37 368 +/- 21 312 +/- 19 375 +/- 20 -0.774809 0.3108117 0.048104 0.8041481 0.0485503PLAA phospholipase A2-activating protein 952 +/- 29 788 +/- 29 921 +/- 43 883 +/- 20 0.539691 -0.002377 -0.443566 0.010247 0.8711376PLAC9 placenta-specific 9 1835 +/- 282 1130 +/- 254 1524 +/- 212 916 +/- 172 -0.023748 -0.093037 -0.053552 0.4320796 0.3136659PLAGL2 pleiomorphic adenoma gene-like 2 189 +/- 12 240 +/- 12 225 +/- 13 207 +/- 23 0.772152 0.013757 -0.511907 0.0128052 0.6163932PLCH1 phospholipase C, eta 1 327 +/- 12 405 +/- 32 217 +/- 23 304 +/- 19 -3.84E-05 0.0581358 0.016981 0.1075869 0.099588PLCH2 phospholipase C, eta 2 370 +/- 51 502 +/- 14 513 +/- 63 801 +/- 59 0.000977 0.0493627 0.008957 0.0679472 0.0876322PLCXD2 Phosphatidylinositol-specific phospholipase C, X domain containing 2 4569 +/- 505 3022 +/- 283 4069 +/- 225 3379 +/- 431 -0.783292 -0.028738 -0.20446 0.0259544 0.4051163PLD2 phospholipase D2 201 +/- 20 312 +/- 13 231 +/- 27 280 +/- 18 -0.805722 0.0013884 0.165643 0.0072535 0.2020121
S1- alphabetical list of aging-related genes.xls Page 23

Young vs Aged MSI CorrelationsSymbol Description Young CA Aged CA Young DG Aged DG CA v DG in CA in DG in CA in DGPLEK pleckstrin 301 +/- 28 251 +/- 18 267 +/- 22 206 +/- 13 -0.133986 -0.167953 -0.044632 0.3739507 0.1348917PLEKHA1 pleckstrin homology domain containing, family A (phosphoinositide binding specific) membe 1885 +/- 104 2268 +/- 98 1949 +/- 90 1867 +/- 107 -0.243407 0.0234509 -0.575564 0.0477602 0.8494424PLEKHA5 Pleckstrin homology domain containing, family A member 5 566 +/- 51 398 +/- 55 952 +/- 56 599 +/- 55 0.000798 -0.048983 -0.001487 0.0944605 0.0453485PLEKHA6 pleckstrin homology domain containing, family A member 6 566 +/- 46 738 +/- 53 585 +/- 29 732 +/- 40 0.443461 0.0342898 0.018921 0.1626649 0.080752PLEKHB1 pleckstrin homology domain containing, family B (evectins) member 1 6842 +/- 885 9643 +/- 1345 4705 +/- 239 6453 +/- 287 -0.01047 0.1174381 0.001452 0.0255133 0.0059289PLEKHG6 pleckstrin homology domain containing, family G (with RhoGef domain) member 6 368 +/- 21 360 +/- 55 442 +/- 17 355 +/- 17 0.442256 -0.889862 -0.006192 0.8010314 0.2480882PLEKHH1 pleckstrin homology domain containing, family H (with MyTH4 domain) member 1 5498 +/- 891 7056 +/- 1244 2329 +/- 184 3044 +/- 221 -0.001295 0.3350938 0.037095 0.1269824 0.055862PLK1 polo-like kinase 1 (Drosophila) 21403 +/- 877 23680 +/- 475 19863 +/- 1093 22695 +/- 710 -0.047931 0.0530814 0.060486 0.3501264 0.3189812PLK2 polo-like kinase 2 (Drosophila) 4576 +/- 519 3141 +/- 223 3989 +/- 267 3502 +/- 175 -0.793838 -0.039743 -0.163947 0.0759949 0.7166391PLSCR4 phospholipid scramblase 4 292 +/- 36 311 +/- 25 313 +/- 18 251 +/- 17 -0.832147 0.6731242 -0.032128 0.341487 0.0208081PLTP phospholipid transfer protein 1127 +/- 38 1268 +/- 54 1124 +/- 55 1435 +/- 28 0.098579 0.0620181 0.001337 0.0178421 0.0316474PLXNA2 Plexin A2 261 +/- 24 167 +/- 18 177 +/- 13 194 +/- 14 -0.334845 -0.011535 0.392874 0.0942256 0.6578159PLXNA3 plexin A3 205 +/- 22 318 +/- 36 319 +/- 36 416 +/- 24 0.017336 0.0281193 0.054836 0.0386071 0.213522PLXNB3 plexin B3 457 +/- 56 453 +/- 43 384 +/- 19 316 +/- 15 -0.015855 -0.953366 -0.019454 0.6546227 0.0750267PMS2 PMS2 postmeiotic segregation increased 2 (S. cerevisiae) 429 +/- 49 1254 +/- 258 530 +/- 58 1843 +/- 341 0.028227 0.0231495 0.017205 0.2009082 0.1194689PNCK pregnancy upregulated non-ubiquitously expressed CaM kinase 583 +/- 36 459 +/- 43 769 +/- 37 629 +/- 37 0.000565 -0.052096 -0.026386 0.0213662 0.0186213PNLDC1 poly(A)-specific ribonuclease (PARN)-like domain containing 1 203 +/- 62 42 +/- 1 212 +/- 57 60 +/- 6 0.271555 -0.047861 -0.044612 0.1958038 0.1312138PNMA1 paraneoplastic antigen MA1 10959 +/- 391 9451 +/- 261 10858 +/- 318 10579 +/- 360 0.288548 -0.011211 -0.577071 0.0056188 0.4872609PNN pinin, desmosome associated protein 870 +/- 34 1067 +/- 32 937 +/- 58 1028 +/- 61 0.875786 0.0019071 0.307626 0.0385508 0.8431402POLD2 Polymerase (DNA directed), delta 2, regulatory subunit 50kDa 88 +/- 13 142 +/- 12 136 +/- 20 197 +/- 12 0.002295 0.0118311 0.028238 0.0796663 0.2561202POLDIP2 polymerase (DNA-directed), delta interacting protein 2 1060 +/- 90 803 +/- 50 1016 +/- 25 1023 +/- 36 0.348473 -0.039051 0.87296 0.0189631 0.6370655POLE4 polymerase (DNA-directed), epsilon 4 (p12 subunit) 2611 +/- 103 2205 +/- 69 2073 +/- 57 2027 +/- 37 -0.004837 -0.009911 -0.52405 0.0030335 0.945593POLG polymerase (DNA directed), gamma 1237 +/- 137 1440 +/- 127 1489 +/- 88 1711 +/- 27 0.01403 0.3033735 0.053158 0.1883551 0.1166869POLR2G polymerase (RNA) II (DNA directed) polypeptide G 1501 +/- 46 1883 +/- 158 1045 +/- 54 1288 +/- 36 -0.000348 0.0603422 0.005367 0.0213566 0.0389687POLR2J polymerase (RNA) II (DNA directed) polypeptide J, 13.3kDa 2255 +/- 115 1934 +/- 54 2042 +/- 31 1942 +/- 47 -0.214424 -0.039377 -0.118458 0.0652443 0.1761409PON2 paraoxonase 2 3263 +/- 296 4425 +/- 150 3317 +/- 229 3671 +/- 180 -0.11293 0.0090922 0.255642 0.0131171 0.5617798PPAP2B phosphatidic acid phosphatase type 2B 2720 +/- 167 3718 +/- 213 2634 +/- 127 2728 +/- 239 -0.040275 0.0045712 0.74131 0.0631569 0.390909PPARG Peroxisome proliferative activated receptor, gamma 118 +/- 5 118 +/- 16 156 +/- 13 117 +/- 8 0.11829 -0.977405 -0.035008 0.8395201 0.0221271PPIA peptidylprolyl isomerase A (cyclophilin A) 281 +/- 45 463 +/- 32 349 +/- 57 440 +/- 15 0.185757 0.0089627 0.174852 0.0153725 0.261195PPID peptidylprolyl isomerase D (cyclophilin D) 303 +/- 34 207 +/- 13 325 +/- 26 339 +/- 63 0.069387 -0.034976 0.847746 0.0315415 0.2788419PPM1B protein phosphatase 1B (formerly 2C), magnesium-dependent, beta isoform 2968 +/- 253 3629 +/- 258 2741 +/- 80 2996 +/- 47 -0.046699 0.0972619 0.02543 0.0367724 0.0098338PPM1E protein phosphatase 1E (PP2C domain containing) 2356 +/- 357 1782 +/- 252 2989 +/- 122 2473 +/- 54 0.006709 -0.221718 -0.0065 0.2717452 0.074406PPP1R3E Protein phosphatase 1, regulatory (inhibitor) subunit 3E 694 +/- 57 902 +/- 71 992 +/- 47 1125 +/- 45 0.000582 0.0457328 0.071171 0.0148811 0.0623085PPP2R5C protein phosphatase 2, regulatory subunit B (B56), gamma isoform 1380 +/- 94 967 +/- 75 1220 +/- 33 860 +/- 51 -0.02482 -0.006726 -0.000553 0.1080542 0.0232061PPP4R2 protein phosphatase 4, regulatory subunit 2 886 +/- 44 1162 +/- 105 1013 +/- 60 1050 +/- 98 0.899093 0.0471725 0.759742 0.0002986 0.3021204PPWD1 peptidylprolyl isomerase domain and WD repeat containing 1 248 +/- 10 294 +/- 14 268 +/- 8 252 +/- 15 -0.678991 0.0226652 -0.389625 0.0013421 0.9955112PQLC3 PQ loop repeat containing 3 422 +/- 15 400 +/- 47 254 +/- 11 298 +/- 12 -0.000134 -0.674626 0.023289 0.696103 0.3334257PR47 platelet receptor for type III collagen, 47 kDa 322 +/- 22 435 +/- 46 397 +/- 25 512 +/- 42 0.002998 0.0619977 0.054506 0.0131489 0.0095289PRDM2 PR domain containing 2, with ZNF domain 347 +/- 45 386 +/- 34 436 +/- 22 557 +/- 23 0.001651 0.5105142 0.004008 0.5401439 0.004555PRDX5 peroxiredoxin 5 3941 +/- 95 3412 +/- 66 3326 +/- 71 3314 +/- 37 -0.008912 -0.0014 -0.885484 0.0020949 0.9175833PRELP proline/arginine-rich end leucine-rich repeat protein 1546 +/- 52 1157 +/- 104 1515 +/- 84 1157 +/- 70 -0.685069 -0.011629 -0.009821 0.0140331 0.0041108PRKAA1 protein kinase, AMP-activated, alpha 1 catalytic subunit 294 +/- 22 397 +/- 21 287 +/- 16 334 +/- 20 -0.073036 0.0066895 0.103806 0.0041265 0.0405637PRKAB2 protein kinase, AMP-activated, beta 2 non-catalytic subunit 697 +/- 64 885 +/- 68 772 +/- 23 952 +/- 40 0.079533 0.0722526 0.006777 0.2516626 0.1004645PRKCH protein kinase C, eta 181 +/- 18 255 +/- 18 129 +/- 12 131 +/- 19 -0.000728 0.0168632 0.943452 0.1302874 0.8546068
S1- alphabetical list of aging-related genes.xls Page 24

Young vs Aged MSI CorrelationsSymbol Description Young CA Aged CA Young DG Aged DG CA v DG in CA in DG in CA in DGPRKRIR protein-kinase, interferon-inducible double stranded RNA dependent inhibitor, repressor of ( 1194 +/- 105 1357 +/- 44 1231 +/- 45 1098 +/- 38 -0.177295 0.196904 -0.049313 0.2622106 0.112416PRNPIP prion protein interacting protein 2458 +/- 123 2089 +/- 74 2388 +/- 39 2292 +/- 67 0.600677 -0.032218 -0.26005 0.0264134 0.1030597PRO0149 PRO0149 protein 3917 +/- 388 3006 +/- 191 4784 +/- 216 3768 +/- 160 0.000998 -0.071798 -0.004643 0.1491221 0.0692187PROCA1 proline-rich cyclin A1-interacting protein 188 +/- 17 132 +/- 6 195 +/- 11 162 +/- 7 0.097641 -0.019045 -0.031181 0.1049325 0.2584503PROS1 protein S (alpha) 774 +/- 108 426 +/- 28 473 +/- 63 375 +/- 23 -0.044059 -0.022169 -0.190453 0.0335408 0.2462449PRPF39 PRP39 pre-mRNA processing factor 39 homolog (S. cerevisiae) 398 +/- 54 361 +/- 33 488 +/- 33 340 +/- 41 0.273474 -0.57176 -0.023066 0.945514 0.0178668PRPS2 phosphoribosyl pyrophosphate synthetase 2 1966 +/- 106 1443 +/- 29 1604 +/- 58 1369 +/- 46 -0.02071 -0.003525 -0.011978 0.0015139 0.084104PRR13 proline rich 13 3251 +/- 117 3856 +/- 164 2723 +/- 24 3074 +/- 150 -0.000652 0.0147229 0.079234 0.0860497 0.1849899PRRG1 proline rich Gla (G-carboxyglutamic acid) 1 909 +/- 109 1222 +/- 166 601 +/- 15 713 +/- 29 -0.004497 0.149903 0.01455 0.0265939 0.0612018PRRX2 paired related homeobox 2 228 +/- 13 276 +/- 7 263 +/- 27 273 +/- 24 0.431085 0.0126135 0.791143 0.1193473 0.7892399PRSS21 protease, serine, 21 (testisin) 154 +/- 18 182 +/- 13 167 +/- 4 246 +/- 21 0.020264 0.2276938 0.019111 0.026258 2.454E-05PRSS22 protease, serine, 22 376 +/- 33 245 +/- 15 364 +/- 29 215 +/- 21 -0.385129 -0.009084 -0.002358 0.0469894 0.0596132PSCD4 pleckstrin homology, Sec7 and coiled-coil domains 4 213 +/- 21 291 +/- 13 199 +/- 18 202 +/- 16 -0.035829 0.012288 0.924077 0.0949477 0.4844499PSMA3 proteasome (prosome, macropain) subunit, alpha type, 3 1537 +/- 38 1871 +/- 67 1481 +/- 61 1913 +/- 144 -0.654743 0.0025823 0.036339 0.0475916 0.1628958PSMA6 proteasome (prosome, macropain) subunit, alpha type, 6 5154 +/- 216 4141 +/- 221 4713 +/- 143 4252 +/- 182 -0.356986 -0.008318 -0.081582 0.1311745 0.0202982PSMB4 proteasome (prosome, macropain) subunit, beta type, 4 3705 +/- 115 3631 +/- 124 3280 +/- 73 3573 +/- 83 -0.020303 -0.669068 0.027907 0.9954379 0.0416578PSMB7 Proteasome (prosome, macropain) subunit, beta type, 7 371 +/- 27 515 +/- 39 467 +/- 43 650 +/- 85 0.007924 0.0143763 0.103113 0.0689831 0.4534666PSMB9 proteasome (prosome, macropain) subunit, beta type, 9 (large multifunctional peptidase 2) 262 +/- 10 349 +/- 12 233 +/- 6 295 +/- 8 -0.001327 0.0002752 0.000367 0.0088962 0.033051PSMC5 proteasome (prosome, macropain) 26S subunit, ATPase, 5 4810 +/- 47 5639 +/- 234 4899 +/- 178 5254 +/- 108 -0.344103 0.015609 0.125388 0.1834994 0.3064435PSMD11 proteasome (prosome, macropain) 26S subunit, non-ATPase, 11 1622 +/- 35 1788 +/- 38 1666 +/- 29 1742 +/- 29 -0.96161 0.0092493 0.094643 0.0050109 0.225815PSMD4 proteasome (prosome, macropain) 26S subunit, non-ATPase, 4 2476 +/- 113 2897 +/- 73 2016 +/- 75 2132 +/- 95 -1.49E-05 0.0127068 0.364098 0.0997047 0.5086628PSME2 proteasome (prosome, macropain) activator subunit 2 (PA28 beta) 821 +/- 80 977 +/- 77 784 +/- 43 921 +/- 39 -0.696512 0.1883069 0.042435 0.3134244 0.2395558PSME3 proteasome (prosome, macropain) activator subunit 3 (PA28 gamma; Ki) 1539 +/- 66 1271 +/- 42 1431 +/- 65 1338 +/- 73 -0.704044 -0.008494 -0.364471 0.0033565 0.4156583PSPC1 paraspeckle component 1 4137 +/- 535 3110 +/- 267 3353 +/- 193 2357 +/- 289 -0.016884 -0.127704 -0.023391 0.5110806 0.1583018PTBP2 polypyrimidine tract binding protein 2 2307 +/- 103 1782 +/- 161 2298 +/- 39 1811 +/- 152 0.989039 -0.023819 -0.03083 0.4386139 0.2161026PTDSS2 phosphatidylserine synthase 2 563 +/- 47 649 +/- 35 490 +/- 18 620 +/- 48 -0.098639 0.1791052 0.049207 0.2676431 0.0150726PTHB1 parathyroid hormone-responsive B1 158 +/- 16 111 +/- 9 140 +/- 6 113 +/- 12 -0.416564 -0.033637 -0.08911 0.0305044 0.0151372PTK2 PTK2 protein tyrosine kinase 2 352 +/- 24 487 +/- 29 419 +/- 31 528 +/- 44 0.091486 0.005345 0.081022 0.0593681 0.1412482PTMS parathymosin 564 +/- 27 451 +/- 59 772 +/- 43 611 +/- 28 0.001747 -0.12446 -0.013133 0.1036381 0.0200266PTP4A2 protein tyrosine phosphatase type IVA, member 2 6286 +/- 287 7210 +/- 518 5634 +/- 234 7240 +/- 434 -0.388109 0.1580916 0.016418 0.0715423 0.1463042PTP4A3 protein tyrosine phosphatase type IVA, member 3 107 +/- 7 143 +/- 10 103 +/- 8 139 +/- 10 -0.497831 0.0132158 0.023196 0.1971961 0.0717171PTPLAD2 protein tyrosine phosphatase-like A domain containing 2 114 +/- 22 191 +/- 25 74 +/- 9 99 +/- 11 -0.003222 0.0418422 0.112482 0.0235631 0.4311144PTPN21 Protein tyrosine phosphatase, non-receptor type 21 156 +/- 37 305 +/- 48 153 +/- 15 276 +/- 31 -0.174366 0.036046 0.013349 0.1043827 0.0182375PTPRB protein tyrosine phosphatase, receptor type, B 193 +/- 17 229 +/- 15 142 +/- 9 176 +/- 12 -0.000313 0.1467456 0.053789 0.1643753 0.1592827PTPRN2 protein tyrosine phosphatase, receptor type, N polypeptide 2 6494 +/- 194 5488 +/- 322 6194 +/- 400 5533 +/- 188 -0.566377 -0.027432 -0.178053 0.0014077 0.3132724PUM2 pumilio homolog 2 (Drosophila) 2633 +/- 77 1935 +/- 111 2753 +/- 131 1997 +/- 141 0.411145 -0.000604 -0.003648 0.0556231 0.0816452PVALB parvalbumin 391 +/- 24 469 +/- 50 287 +/- 22 418 +/- 28 -0.020259 0.1995472 0.005842 0.5771577 0.0334362PVRL1 poliovirus receptor-related 1 (herpesvirus entry mediator C; nectin) 255 +/- 18 185 +/- 22 246 +/- 25 246 +/- 12 0.393693 -0.032584 0.995348 0.0722514 0.7996456PYCR1 pyrroline-5-carboxylate reductase 1 547 +/- 59 391 +/- 22 506 +/- 30 365 +/- 21 -0.39905 -0.045017 -0.004592 0.0374613 0.0463616QSCN6L1 quiescin Q6-like 1 715 +/- 62 579 +/- 58 1381 +/- 87 1148 +/- 33 1.21E-09 -0.143148 -0.044212 0.175206 0.1498206QTRT1 queuine tRNA-ribosyltransferase 1 (tRNA-guanine transglycosylase) 256 +/- 22 498 +/- 21 323 +/- 31 587 +/- 36 0.020811 1.482E-05 0.000476 0.0059661 0.0016492RAB12 RAB12, member RAS oncogene family 321 +/- 25 439 +/- 34 442 +/- 78 498 +/- 58 0.034932 0.0211394 0.581549 0.0528651 0.6551118RAB21 RAB21, member RAS oncogene family 670 +/- 41 691 +/- 68 764 +/- 30 643 +/- 32 0.677724 0.800378 -0.022052 0.2947003 0.0113321RAB28 RAB28, member RAS oncogene family 757 +/- 67 1355 +/- 52 860 +/- 38 1404 +/- 71 0.110907 4.717E-05 0.000444 0.0053232 0.0093864
S1- alphabetical list of aging-related genes.xls Page 25

Young vs Aged MSI CorrelationsSymbol Description Young CA Aged CA Young DG Aged DG CA v DG in CA in DG in CA in DGRAB32 RAB32, member RAS oncogene family 198 +/- 18 242 +/- 23 137 +/- 8 201 +/- 18 -0.000716 0.1654716 0.020572 0.1703733 0.1214088RAB35 RAB35, member RAS oncogene family 778 +/- 29 811 +/- 19 718 +/- 14 670 +/- 5 -0.001143 0.3674905 -0.015566 0.5906463 0.0883262RAB3GAP2RAB3 GTPase activating protein subunit 2 (non-catalytic) 2868 +/- 148 3105 +/- 104 2399 +/- 77 2721 +/- 85 -0.000532 0.2241835 0.020968 0.4857475 0.0543959RAB6B RAB6B, member RAS oncogene family 1509 +/- 149 954 +/- 120 1616 +/- 206 1444 +/- 168 0.170469 -0.016509 -0.532763 0.0119622 0.5249062RAB7 RAB7, member RAS oncogene family 9341 +/- 493 9851 +/- 264 7242 +/- 277 8105 +/- 249 -1.27E-05 0.3893238 0.045658 0.7249005 0.2878582RAB8A RAB8A, member RAS oncogene family 660 +/- 25 807 +/- 25 552 +/- 11 656 +/- 19 -6.22E-05 0.0021892 0.002421 0.0048684 0.0003511RABGAP1 RAB GTPase activating protein 1 116 +/- 13 189 +/- 11 144 +/- 11 164 +/- 8 0.560861 0.0016235 0.157811 0.0074506 0.1397332RABL4 RAB, member of RAS oncogene family-like 4 740 +/- 95 1128 +/- 110 549 +/- 56 835 +/- 106 -0.000823 0.0238958 0.054058 0.0768268 0.3212915RAC1 ras-related C3 botulinum toxin substrate 1 (rho family, small GTP binding protein Rac1) 4505 +/- 188 3402 +/- 520 4425 +/- 250 3002 +/- 507 -0.648917 -0.091015 -0.045985 0.1407843 0.0506256RAD50 RAD50 homolog (S. cerevisiae) 416 +/- 27 289 +/- 24 390 +/- 21 293 +/- 18 -0.34837 -0.005346 -0.006816 0.0174557 0.0062243RAE1 RAE1 RNA export 1 homolog (S. pombe) 1175 +/- 43 1040 +/- 42 1125 +/- 36 1035 +/- 26 -0.368441 -0.048286 -0.073808 0.063973 0.3403386RALGPS2 Ral GEF with PH domain and SH3 binding motif 2 280 +/- 27 193 +/- 19 326 +/- 37 295 +/- 16 0.008765 -0.026246 -0.484099 0.2424974 0.6605985RANBP5 RAN binding protein 5 936 +/- 51 1233 +/- 94 1110 +/- 54 1359 +/- 44 0.039116 0.025319 0.005956 0.1892396 0.1865095RANBP6 RAN binding protein 6 782 +/- 58 993 +/- 47 796 +/- 88 1061 +/- 36 0.631819 0.0186024 0.02899 0.0471226 0.0747294RANGNRF RAN guanine nucleotide release factor 425 +/- 34 318 +/- 15 318 +/- 17 272 +/- 27 -0.003175 -0.024131 -0.192118 0.0152892 0.0205336RAP80 receptor associated protein 80 1079 +/- 80 1269 +/- 127 891 +/- 21 956 +/- 15 -0.005113 0.2402403 0.033389 0.3779647 0.1303282RAPGEF1 Rap guanine nucleotide exchange factor (GEF) 1 616 +/- 50 396 +/- 101 775 +/- 26 416 +/- 82 0.043348 -0.091584 -0.0095 0.072241 0.0039693RASA3 RAS p21 protein activator 3 162 +/- 27 166 +/- 20 200 +/- 15 257 +/- 20 0.008713 0.9114708 0.052284 0.8869965 0.0237445RASGRF1 Ras protein-specific guanine nucleotide-releasing factor 1 125 +/- 16 76 +/- 11 145 +/- 12 104 +/- 10 0.077015 -0.031471 -0.025192 0.0752486 0.0253698RASGRF2 Ras protein-specific guanine nucleotide-releasing factor 2 335 +/- 22 273 +/- 17 423 +/- 53 365 +/- 12 0.015254 -0.048142 -0.333609 0.0328393 0.3533591RBBP6 retinoblastoma binding protein 6 272 +/- 14 345 +/- 18 397 +/- 27 330 +/- 14 0.070355 0.0101782 -0.061654 0.010118 0.1057453RBM17 RNA binding motif protein 17 269 +/- 33 382 +/- 35 305 +/- 29 360 +/- 17 0.878038 0.0413517 0.146628 0.1058318 0.4964689RBM19 RNA binding motif protein 19 727 +/- 55 514 +/- 46 537 +/- 38 381 +/- 60 -0.002644 -0.014212 -0.062673 0.07568 0.1984864RBM25 RNA binding motif protein 25 1188 +/- 33 1453 +/- 33 1540 +/- 42 1830 +/- 101 3.38E-05 0.0002076 0.041769 0.0052 0.2262857RBM3 RNA binding motif (RNP1, RRM) protein 3 669 +/- 111 1358 +/- 95 805 +/- 127 1331 +/- 55 0.377647 0.0008674 0.007144 0.0213976 0.0454136RBM5 RNA binding motif protein 5 1495 +/- 88 1813 +/- 55 1547 +/- 80 1848 +/- 62 0.706355 0.0147948 0.016372 0.0280061 0.0253899RBM8A RNA binding motif protein 8A 1042 +/- 66 948 +/- 45 1249 +/- 91 986 +/- 63 0.097058 -0.270772 -0.042824 0.2082881 0.0329119RBM9 RNA binding motif protein 9 5783 +/- 65 4948 +/- 171 5058 +/- 152 4836 +/- 215 -0.057821 -0.003139 -0.424617 0.0028475 0.6246533RBMS1 RNA binding motif, single stranded interacting protein 1 195 +/- 15 138 +/- 12 149 +/- 8 122 +/- 10 -0.023495 -0.016158 -0.059221 0.0416093 0.2834169RCHY1 ring finger and CHY zinc finger domain containing 1 986 +/- 103 1349 +/- 54 982 +/- 90 1245 +/- 17 -0.368051 0.0152129 0.031787 0.05468 0.2021653RCOR3 REST corepressor 3 986 +/- 96 990 +/- 27 1072 +/- 16 989 +/- 23 0.375004 0.9724902 -0.020621 0.7145102 0.0091227RECK reversion-inducing-cysteine-rich protein with kazal motifs 328 +/- 29 364 +/- 13 406 +/- 21 327 +/- 12 0.334784 0.3037052 -0.011968 0.3841479 0.0449901RECQL5 RecQ protein-like 5 88 +/- 21 145 +/- 16 75 +/- 7 129 +/- 9 -0.380111 0.0593871 0.001053 0.0101489 0.039322REEP1 receptor accessory protein 1 3525 +/- 94 2995 +/- 201 2782 +/- 183 2618 +/- 100 -0.00511 -0.048147 -0.455031 0.0133104 0.8612964RENBP renin binding protein 106 +/- 14 148 +/- 12 134 +/- 15 152 +/- 8 0.018497 0.053118 0.33391 0.1560433 0.2784616REPS2 RALBP1 associated Eps domain containing 2 1087 +/- 40 1316 +/- 59 1227 +/- 99 1360 +/- 65 0.112952 0.0106745 0.295187 0.0300184 0.3975312REV3L REV3-like, catalytic subunit of DNA polymerase zeta (yeast) 1626 +/- 79 1510 +/- 68 1694 +/- 74 1485 +/- 50 0.868533 -0.293951 -0.046104 0.2878013 0.0987565REXO1 REX1, RNA exonuclease 1 homolog (S. cerevisiae) 655 +/- 28 517 +/- 30 915 +/- 58 744 +/- 67 0.000389 -0.007209 -0.08753 0.0019855 0.2431326RFT1 RFT1 homolog (S. cerevisiae) 144 +/- 6 123 +/- 7 159 +/- 9 123 +/- 5 0.458934 -0.053412 -0.00949 0.1162332 0.0183997RFXANK regulatory factor X-associated ankyrin-containing protein 382 +/- 19 443 +/- 19 312 +/- 22 350 +/- 23 -0.000451 0.0455876 0.256114 0.0324922 0.0503628RGS11 regulator of G-protein signalling 11 262 +/- 54 525 +/- 62 397 +/- 50 606 +/- 54 0.016368 0.0094108 0.019498 0.0761906 0.0269708RGS12 regulator of G-protein signalling 12 350 +/- 21 452 +/- 21 478 +/- 32 437 +/- 24 0.174224 0.0060087 -0.324886 0.0331131 0.4451116RHEB Ras homolog enriched in brain 7133 +/- 176 6424 +/- 174 6526 +/- 211 6223 +/- 272 -0.097901 -0.016741 -0.40473 0.0010941 0.2249409RHOBTB2 Rho-related BTB domain containing 2 686 +/- 32 533 +/- 29 663 +/- 45 502 +/- 41 -0.513856 -0.005245 -0.028314 0.0079489 0.0887015
S1- alphabetical list of aging-related genes.xls Page 26

Young vs Aged MSI CorrelationsSymbol Description Young CA Aged CA Young DG Aged DG CA v DG in CA in DG in CA in DGRHOU ras homolog gene family, member U 2390 +/- 265 3326 +/- 556 1311 +/- 72 1705 +/- 52 -0.001259 0.1711621 0.00185 0.0287121 0.0028013RICTOR rapamycin-insensitive companion of mTOR 2415 +/- 271 3115 +/- 219 2053 +/- 54 2477 +/- 109 -0.018334 0.073289 0.013266 0.0617395 0.0030748RIF1 RAP1 interacting factor homolog (yeast) 637 +/- 107 956 +/- 124 515 +/- 28 671 +/- 28 -0.040163 0.080335 0.003329 0.0156319 0.0176562RINT1 RAD50 interactor 1 379 +/- 15 428 +/- 6 425 +/- 14 401 +/- 17 0.39507 0.0175241 -0.303253 0.0913129 0.0759984RIPK2 receptor-interacting serine-threonine kinase 2 475 +/- 23 551 +/- 22 420 +/- 19 435 +/- 19 -0.000169 0.040023 0.590228 0.2592377 0.9694159RIT2 Ras-like without CAAX 2 609 +/- 31 437 +/- 55 775 +/- 62 568 +/- 48 0.002842 -0.025575 -0.027876 0.0778629 0.0628945RNASE4 ribonuclease, RNase A family, 4 204 +/- 17 250 +/- 22 133 +/- 12 240 +/- 28 -0.003533 0.1324862 0.015739 0.2850226 0.0024759RNASE6 ribonuclease, RNase A family, k6 397 +/- 35 654 +/- 73 255 +/- 16 436 +/- 47 -0.003229 0.0149096 0.014506 0.0062424 0.0746811RNASEH1 ribonuclease H1 129 +/- 15 178 +/- 14 148 +/- 7 241 +/- 18 0.013749 0.0416065 0.004633 0.229431 0.0325456RNASEH2Aribonuclease H2, large subunit 227 +/- 15 280 +/- 16 209 +/- 14 224 +/- 16 -0.051719 0.0374968 0.500722 0.1277155 0.7681737RNF10 ring finger protein 10 3235 +/- 192 2478 +/- 121 3155 +/- 83 2677 +/- 130 0.583397 -0.009518 -0.01745 0.0827088 0.4093223RNF130 ring finger protein 130 2915 +/- 322 3688 +/- 372 2157 +/- 119 2608 +/- 105 -0.00724 0.1481042 0.019517 0.0619848 0.0806561RNF141 ring finger protein 141 443 +/- 75 613 +/- 119 430 +/- 48 621 +/- 45 -0.739558 0.2618356 0.017611 0.1060353 0.1070647RNF149 ring finger protein 149 862 +/- 59 752 +/- 33 938 +/- 25 772 +/- 46 0.24407 -0.140754 -0.018644 0.2632535 0.0609607RNF165 ring finger protein 165 582 +/- 25 444 +/- 19 525 +/- 34 419 +/- 29 -0.207282 -0.00155 -0.042494 0.0434461 0.1918806RNF180 ring finger protein 180 252 +/- 11 196 +/- 5 237 +/- 14 213 +/- 19 0.986678 -0.002121 -0.336434 0.0101429 0.2583389RNF187 ring finger protein 187 4466 +/- 174 4113 +/- 168 4156 +/- 120 3630 +/- 66 -0.038965 -0.175609 -0.005496 0.0383765 0.0309644RNF40 ring finger protein 40 697 +/- 31 616 +/- 10 876 +/- 27 750 +/- 31 0.000102 -0.043587 -0.014865 0.3401724 0.1080425RNGTT RNA guanylyltransferase and 5'-phosphatase 1248 +/- 42 1197 +/- 32 1228 +/- 26 1129 +/- 20 -0.223406 -0.358666 -0.01555 0.2173333 0.0250786RNPS1 RNA binding protein S1, serine-rich domain 2748 +/- 78 3124 +/- 133 3034 +/- 149 3248 +/- 132 0.026594 0.0408598 0.310943 0.2161541 0.4479756ROBO2 roundabout, axon guidance receptor, homolog 2 (Drosophila) 1844 +/- 48 1630 +/- 69 1649 +/- 73 1537 +/- 82 -0.030465 -0.032174 -0.337925 0.001026 0.6461609RP11-217Himplantation-associated protein 540 +/- 57 800 +/- 92 433 +/- 35 574 +/- 40 -0.025838 0.0414708 0.027973 0.004277 0.1483887RP13-297EDNA segment on chromosome X and Y (unique) 155 expressed sequence, isoform 1 610 +/- 39 823 +/- 49 675 +/- 31 664 +/- 44 -0.4263 0.0073577 -0.836699 0.0389275 0.9081344RP2 retinitis pigmentosa 2 (X-linked recessive) 105 +/- 12 148 +/- 15 124 +/- 13 142 +/- 17 0.609397 0.0470855 0.433553 0.0756167 0.9130397RPESP RPE-spondin 216 +/- 36 219 +/- 54 370 +/- 37 509 +/- 43 0.001557 0.9565057 0.036551 0.7215285 0.0174944RPIB9 Rap2-binding protein 9 1388 +/- 111 1270 +/- 94 1665 +/- 42 1512 +/- 53 0.005251 -0.437014 -0.054718 0.4532659 0.3512872RPL13 ribosomal protein L13 3331 +/- 242 4584 +/- 286 2546 +/- 122 3520 +/- 104 -9.29E-05 0.0076985 0.000189 0.0087231 0.0059545RPL15 Ribosomal protein L15 201 +/- 25 146 +/- 14 188 +/- 13 126 +/- 10 -0.236996 -0.091943 -0.005182 0.1365207 0.0084855RPL23AP1 ribosomal protein L23a pseudogene 13 491 +/- 25 617 +/- 43 598 +/- 72 594 +/- 30 0.193147 0.0359498 -0.961361 0.0245244 0.90389RPL24 ribosomal protein L24 6992 +/- 211 7638 +/- 185 6738 +/- 313 6697 +/- 239 -0.021558 0.0444177 -0.919546 0.1335962 0.5753282RPL30 ribosomal protein L30 15248 +/- 656 16050 +/- 750 15243 +/- 600 17322 +/- 644 0.248868 0.4397322 0.04333 0.6162516 0.0238786RPL31 ribosomal protein L31 232 +/- 31 172 +/- 17 275 +/- 9 198 +/- 25 0.048221 -0.128385 -0.032936 0.3364343 0.2694518RPL36AL ribosomal protein L36a-like 2981 +/- 70 3410 +/- 137 2856 +/- 113 3117 +/- 174 -0.074253 0.0256528 0.246812 0.1261708 0.0732023RPL37 ribosomal protein L37 1311 +/- 97 1831 +/- 155 1601 +/- 107 1229 +/- 57 -0.522377 0.0208005 -0.016961 0.0313841 0.0721045RPL6 ribosomal protein L6 10615 +/- 183 9845 +/- 191 10876 +/- 273 9843 +/- 437 0.385019 -0.015594 -0.0857 0.0602139 0.3123224RPL9 ribosomal protein L9 12030 +/- 543 14358 +/- 285 10191 +/- 563 9811 +/- 1825 -0.000122 0.0062042 -0.850374 0.0454903 0.908068RPP30 ribonuclease P/MRP 30kDa subunit 391 +/- 15 345 +/- 14 392 +/- 26 360 +/- 9 0.881613 -0.044504 -0.284057 0.014672 0.4228909RPP40 ribonuclease P 40kDa subunit 814 +/- 28 680 +/- 26 723 +/- 28 663 +/- 58 -0.147894 -0.006009 -0.389147 0.0010622 0.3528995RPRC1 arginine/proline rich coiled-coil 1 6598 +/- 221 6480 +/- 243 6871 +/- 111 7286 +/- 69 0.036021 -0.725681 0.013169 0.5078475 0.1042715RPS12 ribosomal protein S12 4329 +/- 211 3150 +/- 239 3422 +/- 186 2508 +/- 191 -0.000234 -0.004219 -0.007636 0.0932139 0.1503967RPS15A ribosomal protein S15a 14626 +/- 477 16659 +/- 556 11527 +/- 341 13684 +/- 211 -3.97E-06 0.019978 0.000642 0.0187529 0.0088016RPS24 ribosomal protein S24 19440 +/- 754 21550 +/- 931 17416 +/- 712 21538 +/- 983 -0.088979 0.1101938 0.010136 0.358614 0.0975053RPS25 ribosomal protein S25 403 +/- 49 270 +/- 30 272 +/- 35 279 +/- 26 -0.066277 -0.049243 0.872731 0.063496 0.9284774RPS6KB1 ribosomal protein S6 kinase, 70kDa, polypeptide 1 1507 +/- 66 2010 +/- 89 1589 +/- 57 1912 +/- 83 -0.830514 0.0013009 0.013807 0.0432698 0.1213117
S1- alphabetical list of aging-related genes.xls Page 27

Young vs Aged MSI CorrelationsSymbol Description Young CA Aged CA Young DG Aged DG CA v DG in CA in DG in CA in DGRRAGC Ras-related GTP binding C 2912 +/- 161 3207 +/- 157 2579 +/- 91 2330 +/- 56 -0.000557 0.2207537 -0.047748 0.4301719 0.0631591RRBP1 ribosome binding protein 1 homolog 180kDa (dog) 119 +/- 18 186 +/- 24 125 +/- 7 169 +/- 11 -0.733988 0.0494896 0.010814 0.0186224 0.014766RSBN1 round spermatid basic protein 1 1261 +/- 90 1171 +/- 26 1341 +/- 54 1091 +/- 43 -0.957078 -0.373711 -0.005686 0.6094607 0.0586524RTCD1 RNA terminal phosphate cyclase domain 1 145 +/- 9 194 +/- 12 137 +/- 5 174 +/- 10 -0.104237 0.0082334 0.01704 0.0120018 0.0005568RTF1 Rtf1, Paf1/RNA polymerase II complex component, homolog (S. cerevisiae) 1080 +/- 61 889 +/- 52 1157 +/- 39 1177 +/- 28 0.006301 -0.039212 0.687224 0.0166795 0.9882032RTN3 reticulon 3 21006 +/- 1230 13544 +/- 1159 20556 +/- 206 13859 +/- 1090 -0.830862 -0.001314 -0.002946 0.0470105 0.0448787RUFY3 RUN and FYVE domain containing 3 69 +/- 10 111 +/- 9 114 +/- 13 156 +/- 17 0.001984 0.0099158 0.096064 0.0138411 0.0161513RUNX1T1 runt-related transcription factor 1; translocated to, 1 (cyclin D-related) 2489 +/- 125 1740 +/- 89 2274 +/- 171 1707 +/- 184 -0.409014 -0.000847 -0.051017 0.016456 0.4956507RYBP RING1 and YY1 binding protein 922 +/- 102 1454 +/- 142 927 +/- 96 1306 +/- 164 -0.27578 0.0136345 0.088025 0.0688902 0.3124103RYR1 ryanodine receptor 1 (skeletal) 1032 +/- 27 722 +/- 33 993 +/- 101 590 +/- 54 -0.212346 -3.08E-05 -0.008597 0.000353 0.0252594S100A6 S100 calcium binding protein A6 (calcyclin) 923 +/- 64 1156 +/- 72 682 +/- 81 1085 +/- 58 -0.00207 0.0359624 0.003149 0.2202466 0.1084609SAMD1 sterile alpha motif domain containing 1 363 +/- 22 312 +/- 35 561 +/- 23 439 +/- 31 2.83E-07 -0.249772 -0.013804 0.2150173 0.0153949SAMD13 sterile alpha motif domain containing 13 234 +/- 23 238 +/- 21 261 +/- 20 314 +/- 8 0.027004 0.9033007 0.044956 0.9222472 0.2310658SAMD4A sterile alpha motif domain containing 4A 1424 +/- 134 2109 +/- 170 1803 +/- 166 1808 +/- 59 0.63583 0.0108006 0.978024 0.0244032 0.9829683SAP130 Sin3A-associated protein, 130kDa 1623 +/- 42 1504 +/- 24 1469 +/- 39 1472 +/- 40 -0.005698 -0.03916 0.964552 0.0232187 0.486987SAP18 Sin3A-associated protein, 18kDa 2878 +/- 140 4280 +/- 172 2600 +/- 139 3721 +/- 168 -0.020479 0.0001016 0.000789 9.322E-05 0.0050428SAPS3 SAPS domain family, member 3 485 +/- 34 610 +/- 18 601 +/- 21 616 +/- 32 0.056729 0.0133135 0.717097 0.0080744 0.9801772SBK1 SH3-binding domain kinase 1 898 +/- 90 609 +/- 68 744 +/- 48 642 +/- 28 -0.583487 -0.029437 -0.101301 0.0578548 0.5750621SC4MOL sterol-C4-methyl oxidase-like 5593 +/- 587 6927 +/- 418 5526 +/- 348 7175 +/- 378 0.869536 0.0972138 0.011246 0.2418129 0.0870044SCD5 stearoyl-CoA desaturase 5 15204 +/- 701 15897 +/- 556 13728 +/- 231 15363 +/- 292 -0.060969 0.4577856 0.002264 0.3129803 0.0462543SCFD1 sec1 family domain containing 1 83 +/- 2 121 +/- 10 105 +/- 6 109 +/- 8 0.715434 0.0094376 0.733605 0.0408128 0.5680569SCGB3A1 secretoglobin, family 3A, member 1 110 +/- 8 98 +/- 11 132 +/- 9 101 +/- 7 0.278805 -0.404157 -0.023415 0.9165568 0.0928432SCNM1 sodium channel modifier 1 257 +/- 18 318 +/- 18 261 +/- 8 288 +/- 10 -0.531044 0.0364379 0.059946 0.0305578 0.2725919SCRN1 secernin 1 9838 +/- 238 10891 +/- 605 8473 +/- 141 10001 +/- 220 -0.003911 0.152799 0.000635 0.8102889 0.0171262SCYE1 small inducible cytokine subfamily E, member 1 (endothelial monocyte-activating) 1313 +/- 43 1283 +/- 31 1364 +/- 27 1259 +/- 16 0.524237 -0.585045 -0.009865 0.670895 0.0321536SDCCAG1 serologically defined colon cancer antigen 1 388 +/- 20 315 +/- 15 516 +/- 63 441 +/- 28 0.005473 -0.017003 -0.314805 0.0037034 0.1962015SDCCAG8 serologically defined colon cancer antigen 8 262 +/- 8 225 +/- 12 276 +/- 23 239 +/- 4 0.48909 -0.027839 -0.167449 0.1029925 0.362649SDHC succinate dehydrogenase complex, subunit C, integral membrane protein, 15kDa 1763 +/- 91 1634 +/- 45 1610 +/- 52 1461 +/- 35 -0.000608 -0.242924 -0.043667 0.2746808 0.025762SDK2 sidekick homolog 2 (chicken) 931 +/- 129 836 +/- 94 667 +/- 46 527 +/- 27 -0.009243 -0.563399 -0.030214 0.5199325 0.0915624SDS serine dehydratase 467 +/- 22 597 +/- 50 542 +/- 35 590 +/- 52 0.166932 0.0486479 0.469207 0.3174204 0.680392SEC14L1 SEC14-like 1 (S. cerevisiae) 4771 +/- 153 4085 +/- 221 5018 +/- 284 3990 +/- 299 0.420052 -0.031449 -0.034708 0.4597004 0.2615953SEC22A SEC22 vesicle trafficking protein homolog A (S. cerevisiae) 388 +/- 11 342 +/- 16 440 +/- 19 453 +/- 44 0.00208 -0.03712 0.804564 0.1895016 0.1610125SEC22C SEC22 vesicle trafficking protein homolog C (S. cerevisiae) 250 +/- 23 183 +/- 15 231 +/- 16 204 +/- 13 0.902933 -0.03838 -0.216114 0.0244856 0.1285385SEC23B Sec23 homolog B (S. cerevisiae) 1038 +/- 61 1069 +/- 58 923 +/- 23 1057 +/- 33 -0.045226 0.7178976 0.0106 0.7702871 0.0156109SEC23IP SEC23 interacting protein 945 +/- 34 1092 +/- 23 868 +/- 39 1118 +/- 42 -0.482944 0.0065327 0.001979 0.017476 0.0363604SEC61A1 Sec61 alpha 1 subunit (S. cerevisiae) 320 +/- 43 269 +/- 28 351 +/- 21 276 +/- 12 0.651065 -0.340419 -0.014546 0.3899871 0.0086829SEC61G Sec61 gamma subunit 2171 +/- 111 2251 +/- 109 1907 +/- 76 2224 +/- 48 -0.105523 0.6173269 0.007253 0.7257383 0.0489315SEH1L SEH1-like (S. cerevisiae) 297 +/- 24 216 +/- 13 286 +/- 18 233 +/- 18 0.98717 -0.01853 -0.067982 0.0875544 0.0323097SEL1L sel-1 suppressor of lin-12-like (C. elegans) 350 +/- 53 493 +/- 66 413 +/- 38 592 +/- 39 0.343813 0.1217242 0.010126 0.1524493 0.1654514SELPLG selectin P ligand 660 +/- 60 886 +/- 79 469 +/- 46 573 +/- 50 -0.001155 0.047568 0.159001 0.0551214 0.3252283SELS selenoprotein S 2984 +/- 127 2979 +/- 209 2303 +/- 53 2615 +/- 85 -0.002081 -0.98617 0.017136 0.7899292 0.0790283SEMA6B sema domain, transmembrane domain (TM), and cytoplasmic domain, (semaphorin) 6B 2141 +/- 281 1472 +/- 204 2572 +/- 104 2191 +/- 53 0.002351 -0.085956 -0.013093 0.1058834 0.195481SEPT11 Septin 11 2461 +/- 262 1813 +/- 192 2281 +/- 37 1816 +/- 76 -0.517864 -0.076742 -0.00158 0.1117263 0.0423811SEPT3 septin 3 7220 +/- 468 5490 +/- 263 8056 +/- 320 7357 +/- 258 0.000891 -0.012451 -0.1241 0.0213601 0.4560522
S1- alphabetical list of aging-related genes.xls Page 28

Young vs Aged MSI CorrelationsSymbol Description Young CA Aged CA Young DG Aged DG CA v DG in CA in DG in CA in DGSEPT8 septin 8 2774 +/- 489 5315 +/- 965 1763 +/- 94 3266 +/- 249 -0.02563 0.0491891 0.002205 0.0143031 0.0038959SERPINA1 serpin peptidase inhibitor, clade A (alpha-1 antiproteinase, antitrypsin), member 1 442 +/- 80 836 +/- 138 331 +/- 29 562 +/- 91 -0.057256 0.0392633 0.062067 0.0050755 0.0643242SERPINB6 serpin peptidase inhibitor, clade B (ovalbumin), member 6 139 +/- 16 197 +/- 19 232 +/- 20 249 +/- 10 0.003543 0.0405549 0.469389 0.2040456 0.7728342SERPINB8 serpin peptidase inhibitor, clade B (ovalbumin), member 8 103 +/- 14 142 +/- 10 101 +/- 7 125 +/- 8 -0.229819 0.0451369 0.047732 0.2104028 0.5678892SERPIND1serpin peptidase inhibitor, clade D (heparin cofactor), member 1 237 +/- 137 92 +/- 52 51 +/- 5 74 +/- 6 -0.347633 -0.356912 0.02389 0.1291434 0.0302886SERPINF1 serpin peptidase inhibitor, clade F (alpha-2 antiplasmin, pigment epithelium derived factor), 508 +/- 96 868 +/- 124 280 +/- 49 579 +/- 121 -0.001876 0.0462446 0.067889 0.2048228 0.1776994SET SET translocation (myeloid leukemia-associated) 698 +/- 22 583 +/- 14 1015 +/- 52 866 +/- 35 2.46E-07 -0.002193 -0.04242 0.020561 0.0522707SETBP1 SET binding protein 1 177 +/- 22 138 +/- 17 245 +/- 24 131 +/- 20 0.139943 -0.191834 -0.005449 0.4480021 0.1355688SETD6 SET domain containing 6 357 +/- 14 262 +/- 22 362 +/- 8 285 +/- 23 0.351473 -0.006155 -0.024761 0.0713392 0.1575501SETX senataxin 1154 +/- 76 1267 +/- 18 1110 +/- 19 1244 +/- 44 -0.478762 0.2036891 0.033306 0.2141339 6.061E-05SEZ6L2 Seizure related 6 homolog (mouse)-like 2 1565 +/- 18 1244 +/- 115 2230 +/- 72 2186 +/- 114 0.000161 -0.038027 -0.756044 0.0439181 0.9303992SF1 splicing factor 1 140 +/- 11 201 +/- 16 207 +/- 11 256 +/- 26 0.000508 0.01371 0.143512 0.0146115 0.103229SF3A3 Splicing factor 3a, subunit 3, 60kDa 3426 +/- 274 2814 +/- 133 2964 +/- 63 2412 +/- 70 -0.010701 -0.082988 -0.000278 0.0193853 0.0052495SFRP2 secreted frizzled-related protein 2 277 +/- 172 120 +/- 40 22 +/- 6 268 +/- 36 -0.993815 -0.415931 0.001974 0.2592274 0.0514684SFRS11 splicing factor, arginine/serine-rich 11 4017 +/- 267 5453 +/- 187 4660 +/- 175 5391 +/- 406 0.162392 0.0017133 0.153883 0.0002397 0.0174607SFRS14 splicing factor, arginine/serine-rich 14 2501 +/- 104 2096 +/- 137 2785 +/- 51 2631 +/- 85 0.00293 -0.04162 -0.167002 0.0062501 0.0353494SFRS7 splicing factor, arginine/serine-rich 7, 35kDa 2011 +/- 79 1722 +/- 78 1994 +/- 57 1707 +/- 55 -0.903556 -0.026627 -0.005697 0.0569491 0.0114376SFT2D1 SFT2 domain containing 1 2004 +/- 101 2392 +/- 168 1748 +/- 92 2190 +/- 64 -0.063607 0.0826378 0.003836 0.0186036 0.0524282SFXN1 sideroflexin 1 947 +/- 84 649 +/- 46 800 +/- 33 630 +/- 29 -0.014836 -0.014754 -0.004025 0.0228448 0.0559987SFXN3 sideroflexin 3 918 +/- 58 841 +/- 34 1028 +/- 50 787 +/- 44 0.596632 -0.290513 -0.005491 0.5475952 0.0698529SFXN5 Sideroflexin 5 157 +/- 8 208 +/- 14 190 +/- 13 226 +/- 9 0.010934 0.0109709 0.05192 0.0002757 0.0306315SGCE sarcoglycan, epsilon 754 +/- 60 1219 +/- 49 868 +/- 51 1204 +/- 28 0.231804 0.0001575 0.000483 0.0032894 0.0064522SGEF Src homology 3 domain-containing guanine nucleotide exchange factor 828 +/- 77 772 +/- 31 904 +/- 53 676 +/- 59 -0.971235 -0.51893 -0.01897 0.8045084 0.0061152SGK serum/glucocorticoid regulated kinase 1969 +/- 150 2626 +/- 225 1220 +/- 179 1632 +/- 102 -0.000539 0.0390527 0.08161 0.0471041 0.2118836SGPL1 sphingosine-1-phosphate lyase 1 613 +/- 28 522 +/- 26 640 +/- 24 524 +/- 12 0.561927 -0.040206 -0.002866 0.2319508 0.0578856SGSH N-sulfoglucosamine sulfohydrolase (sulfamidase) 274 +/- 62 276 +/- 24 224 +/- 8 190 +/- 9 -0.056384 0.9756562 -0.023478 0.8671328 0.1881173SH2B SH2-B homolog 1071 +/- 20 1347 +/- 59 1612 +/- 117 1439 +/- 90 0.013408 0.0041889 -0.272413 0.046181 0.3927911SH3BGRL SH3 domain binding glutamic acid-rich protein like 1959 +/- 216 2188 +/- 169 2416 +/- 113 2842 +/- 144 0.014296 0.4222461 0.048322 0.3057342 0.2728617SH3GL1 SH3-domain GRB2-like 1 517 +/- 28 419 +/- 30 649 +/- 35 550 +/- 32 0.000487 -0.037857 -0.069011 0.062626 0.4344739SH3MD4 SH3 multiple domains 4 1732 +/- 142 1583 +/- 171 1400 +/- 71 1205 +/- 43 -0.003383 -0.518297 -0.047787 0.9282667 0.2591898SH3PX3 SH3 and PX domain containing 3 243 +/- 24 325 +/- 26 209 +/- 22 227 +/- 14 -0.015925 0.0443613 0.515619 0.0464582 0.7937885SHANK2 SH3 and multiple ankyrin repeat domains 2 3124 +/- 137 2183 +/- 63 2942 +/- 130 2120 +/- 154 -0.403233 -0.000418 -0.003277 0.0009546 0.0749451SHMT2 serine hydroxymethyltransferase 2 (mitochondrial) 193 +/- 15 139 +/- 8 177 +/- 12 147 +/- 8 -0.723763 -0.014907 -0.071431 0.0316628 0.1098978SIN3B SIN3 homolog B, transcription regulator (yeast) 1456 +/- 63 1539 +/- 57 1516 +/- 56 1759 +/- 48 0.062398 0.3464777 0.009402 0.9941848 0.022693SIRT6 sirtuin (silent mating type information regulation 2 homolog) 6 (S. cerevisiae) 255 +/- 17 215 +/- 16 279 +/- 15 203 +/- 7 0.692921 -0.116656 -0.002473 0.0531824 0.0015775SKIV2L superkiller viralicidic activity 2-like (S. cerevisiae) 624 +/- 40 474 +/- 21 631 +/- 36 490 +/- 27 0.53802 -0.011364 -0.012191 0.0067653 0.0223014SLA/LP soluble liver antigen/liver pancreas antigen 90 +/- 8 130 +/- 15 95 +/- 11 94 +/- 4 -0.230051 0.044906 -0.958316 0.0342527 0.9074774SLC11A2 solute carrier family 11 (proton-coupled divalent metal ion transporters), member 2 475 +/- 88 1020 +/- 94 461 +/- 69 952 +/- 81 -0.338113 0.0017448 0.001506 0.009127 0.01046SLC12A5 solute carrier family 12, (potassium-chloride transporter) member 5 9260 +/- 395 7923 +/- 381 8510 +/- 287 7677 +/- 214 -0.162509 -0.035166 -0.045788 0.0154776 0.2021898SLC12A9 solute carrier family 12 (potassium/chloride transporters), member 9 1093 +/- 101 1413 +/- 80 1023 +/- 47 1257 +/- 43 -0.069404 0.0331331 0.005051 0.1444962 0.1520423SLC13A4 solute carrier family 13 (sodium/sulfate symporters), member 4 758 +/- 418 154 +/- 92 35 +/- 8 120 +/- 24 -0.213465 -0.212461 0.019909 0.2274349 0.0059444SLC14A1 Solute carrier family 14 (urea transporter), member 1 (Kidd blood group) 669 +/- 53 1000 +/- 92 657 +/- 68 883 +/- 90 -0.418944 0.0141667 0.079572 0.002607 0.1256663SLC15A3 solute carrier family 15, member 3 255 +/- 27 313 +/- 19 234 +/- 7 271 +/- 8 -0.020326 0.1124988 0.005854 0.1031174 0.0062236SLC15A4 Solute carrier family 15, member 4 630 +/- 46 885 +/- 55 671 +/- 24 756 +/- 14 -0.434673 0.0053372 0.014982 0.0129992 0.036015
S1- alphabetical list of aging-related genes.xls Page 29

Young vs Aged MSI CorrelationsSymbol Description Young CA Aged CA Young DG Aged DG CA v DG in CA in DG in CA in DGSLC16A14 solute carrier family 16 (monocarboxylic acid transporters), member 14 1075 +/- 41 1004 +/- 75 1195 +/- 34 1038 +/- 52 0.036333 -0.435972 -0.03911 0.4885692 0.0290485SLC1A4 solute carrier family 1 (glutamate/neutral amino acid transporter), member 4 3466 +/- 213 3097 +/- 143 3093 +/- 119 2554 +/- 111 -0.007805 -0.185181 -0.009141 0.0994061 0.0194672SLC22A18 solute carrier family 22 (organic cation transporter), member 18 269 +/- 23 400 +/- 39 191 +/- 11 317 +/- 21 -0.002158 0.0198389 0.00162 0.1136965 0.0449552SLC24A5 Solute carrier family 24, member 5 1183 +/- 81 1115 +/- 57 1455 +/- 56 1211 +/- 48 0.028959 -0.514493 -0.008949 0.3598755 0.0032771SLC25A16 solute carrier family 25 (mitochondrial carrier; Graves disease autoantigen), member 16 472 +/- 27 547 +/- 23 566 +/- 28 661 +/- 17 0.001135 0.0629683 0.021427 0.4766455 0.0789001SLC25A18 solute carrier family 25 (mitochondrial carrier), member 18 2127 +/- 291 3200 +/- 170 2193 +/- 184 3259 +/- 127 0.481108 0.0129141 0.001186 0.0504416 0.0149975SLC25A25 solute carrier family 25 (mitochondrial carrier; phosphate carrier), member 25 1121 +/- 61 974 +/- 52 1300 +/- 67 1101 +/- 43 0.028599 -0.096748 -0.036721 0.0306786 0.1145057SLC26A2 solute carrier family 26 (sulfate transporter), member 2 87 +/- 10 217 +/- 49 135 +/- 50 223 +/- 61 0.418715 0.0457219 0.294341 0.1288492 0.2520888SLC2A5 solute carrier family 2 (facilitated glucose/fructose transporter), member 5 534 +/- 45 707 +/- 82 446 +/- 26 613 +/- 49 -0.166705 0.1022042 0.023848 0.1259176 0.2899389SLC2A6 solute carrier family 2 (facilitated glucose transporter), member 6 542 +/- 34 512 +/- 27 621 +/- 36 490 +/- 11 0.406867 -0.497871 -0.013618 0.5270778 0.1016912SLC30A5 solute carrier family 30 (zinc transporter), member 5 457 +/- 12 540 +/- 14 505 +/- 21 552 +/- 21 0.086592 0.0011692 0.145466 0.0041833 0.1944157SLC31A1 solute carrier family 31 (copper transporters), member 1 325 +/- 19 228 +/- 24 334 +/- 28 277 +/- 30 0.229054 -0.011782 -0.198781 0.03351 0.5673277SLC35A2 solute carrier family 35 (UDP-galactose transporter), member A2 628 +/- 18 538 +/- 17 657 +/- 30 593 +/- 23 0.095799 -0.004802 -0.127267 0.0158227 0.2921415SLC35E3 solute carrier family 35, member E3 812 +/- 93 775 +/- 32 861 +/- 58 712 +/- 17 -0.905383 -0.724466 -0.049851 0.9435954 0.0795312SLC37A4 solute carrier family 37 (glycerol-6-phosphate transporter), member 4 195 +/- 20 266 +/- 23 170 +/- 18 236 +/- 25 -0.092963 0.0446113 0.068065 0.1746472 0.2769666SLC39A3 solute carrier family 39 (zinc transporter), member 3 529 +/- 35 429 +/- 22 453 +/- 33 436 +/- 14 -0.066127 -0.039489 -0.651066 0.0072498 0.5052375SLC39A4 solute carrier family 39 (zinc transporter), member 4 534 +/- 35 698 +/- 42 516 +/- 28 599 +/- 44 -0.094072 0.0142727 0.152657 0.2165457 0.061296SLC45A3 solute carrier family 45, member 3 194 +/- 24 304 +/- 46 108 +/- 28 201 +/- 22 -0.005552 0.0675492 0.027744 0.0448504 0.0220202SLC4A7 solute carrier family 4, sodium bicarbonate cotransporter, member 7 1387 +/- 232 3599 +/- 647 1815 +/- 290 4114 +/- 614 0.096811 0.0171541 0.015698 0.028831 0.0115593SLC5A11 solute carrier family 5 (sodium/glucose cotransporter), member 11 675 +/- 128 1122 +/- 169 389 +/- 31 607 +/- 40 -0.006695 0.063233 0.002558 0.0506597 0.0129141SLC5A3 solute carrier family 5 (inositol transporters), member 3 289 +/- 39 240 +/- 38 429 +/- 33 342 +/- 17 0.000569 -0.391169 -0.052976 0.3881746 0.0789157SLCO1C1 solute carrier organic anion transporter family, member 1C1 525 +/- 72 446 +/- 45 404 +/- 18 280 +/- 27 -0.008426 -0.380552 -0.006315 0.5831536 0.0395767SLFNL1 schlafen-like 1 165 +/- 16 140 +/- 13 183 +/- 10 119 +/- 9 -0.983024 -0.23417 -0.001116 0.1409249 0.0660907SMARCC1 SWI/SNF related, matrix associated, actin dependent regulator of chromatin, subfamily c, m 482 +/- 28 591 +/- 24 542 +/- 16 570 +/- 13 0.379305 0.0152509 0.203948 0.0043738 0.0863637SMCHD1 structural maintenance of chromosomes flexible hinge domain containing 1 694 +/- 40 886 +/- 59 797 +/- 51 844 +/- 38 0.526667 0.0252493 0.477217 0.0001743 0.4448773SMG7 Smg-7 homolog, nonsense mediated mRNA decay factor (C. elegans) 162 +/- 20 141 +/- 13 158 +/- 9 189 +/- 8 0.291061 -0.403041 0.024009 0.4951647 0.2251241SMS spermine synthase 1440 +/- 104 1361 +/- 60 1756 +/- 49 1533 +/- 42 0.001876 -0.531937 -0.00736 0.6064133 0.1179732SMU1 Smu-1 suppressor of mec-8 and unc-52 homolog (C. elegans) 1021 +/- 44 845 +/- 49 1000 +/- 21 892 +/- 31 0.756623 -0.024101 -0.021558 0.0619541 0.1675365SMYD2 SET and MYND domain containing 2 109 +/- 17 181 +/- 16 144 +/- 19 192 +/- 26 0.015144 0.0113553 0.180434 0.003035 0.0154565SNAP25 Synaptosomal-associated protein, 25kDa 583 +/- 70 304 +/- 41 826 +/- 34 518 +/- 59 0.001182 -0.008466 -0.00321 0.0112881 0.0123304SNAP91 synaptosomal-associated protein, 91kDa homolog (mouse) 10224 +/- 579 10352 +/- 809 10870 +/- 483 12419 +/- 359 0.016655 0.9003596 0.030731 0.7005781 0.2501644SNAPC5 small nuclear RNA activating complex, polypeptide 5, 19kDa 221 +/- 25 289 +/- 15 232 +/- 9 285 +/- 45 0.995998 0.0457243 0.302887 0.260286 0.4904325SNF1LK SNF1-like kinase 448 +/- 53 272 +/- 52 268 +/- 49 172 +/- 19 -0.002689 -0.038141 -0.114625 0.0501826 0.2906952SNF8 SNF8, ESCRT-II complex subunit, homolog (S. cerevisiae) 2300 +/- 87 2382 +/- 140 1932 +/- 69 2281 +/- 69 -0.06192 0.6337008 0.005861 0.9171056 0.0610403SNORA24 Small nucleolar RNA, H/ACA box 24 4609 +/- 197 5659 +/- 543 3508 +/- 255 4534 +/- 188 -0.00027 0.1169872 0.010709 0.2964168 0.0667392SNRPG small nuclear ribonucleoprotein polypeptide G 658 +/- 21 808 +/- 50 678 +/- 26 740 +/- 42 -0.602182 0.0276006 0.250459 0.0004022 0.1002554SNX1 Sorting nexin 1 172 +/- 19 261 +/- 27 175 +/- 13 234 +/- 16 -0.780355 0.0242684 0.020265 0.0134602 0.2426572SNX17 sorting nexin 17 2369 +/- 40 2361 +/- 64 1963 +/- 54 2132 +/- 51 -1.88E-05 -0.920823 0.050425 0.208648 0.3840665SNX3 sorting nexin 3 14461 +/- 818 11436 +/- 483 13459 +/- 458 11655 +/- 653 -0.295057 -0.012676 -0.055872 0.0689298 0.4183005SNX9 sorting nexin 9 1081 +/- 34 1199 +/- 60 1155 +/- 37 1282 +/- 40 0.012901 0.1251068 0.045268 0.0200866 0.0494946SOCS1 suppressor of cytokine signaling 1 193 +/- 12 114 +/- 15 214 +/- 14 159 +/- 18 0.001196 -0.002148 -0.038543 0.0006493 0.0014373SOHLH2 spermatogenesis and oogenesis specific basic helix-loop-helix 2 101 +/- 10 163 +/- 15 88 +/- 6 159 +/- 11 -0.295007 0.0070528 0.001347 0.1139626 0.0336817SORBS1 sorbin and SH3 domain containing 1 688 +/- 45 536 +/- 41 818 +/- 42 620 +/- 39 0.045933 -0.032044 -0.007103 0.0445536 0.0045809SORBS2 Sorbin and SH3 domain containing 2 432 +/- 19 353 +/- 14 405 +/- 14 294 +/- 41 -0.075433 -0.007595 -0.049321 0.0784408 0.3642089
S1- alphabetical list of aging-related genes.xls Page 30

Young vs Aged MSI CorrelationsSymbol Description Young CA Aged CA Young DG Aged DG CA v DG in CA in DG in CA in DGSOS2 Son of sevenless homolog 2 (Drosophila) 298 +/- 20 354 +/- 13 311 +/- 25 351 +/- 34 0.820968 0.0394209 0.369756 0.0328588 0.4459191SOX1 SRY (sex determining region Y)-box 1 375 +/- 39 272 +/- 18 455 +/- 28 336 +/- 23 0.006275 -0.050161 -0.010004 0.1370089 0.0085711SOX11 SRY (sex determining region Y)-box 11 664 +/- 52 459 +/- 46 303 +/- 32 221 +/- 13 -9.38E-06 -0.014598 -0.048754 0.0117623 0.0555967SOX2 SRY (sex determining region Y)-box 2 4887 +/- 267 6273 +/- 249 4911 +/- 290 5382 +/- 228 -0.106097 0.0035426 0.233451 0.0098802 0.654743SPA17 sperm autoantigenic protein 17 537 +/- 65 330 +/- 45 443 +/- 23 329 +/- 17 -0.506302 -0.027597 -0.003344 0.094749 0.0312364SPAG9 sperm associated antigen 9 477 +/- 60 705 +/- 50 407 +/- 40 498 +/- 44 -0.007115 0.0161276 0.158938 0.0151246 0.0335196SPCS1 signal peptidase complex subunit 1 homolog (S. cerevisiae) 6159 +/- 178 6206 +/- 222 5341 +/- 222 6203 +/- 226 -0.008114 0.8729474 0.023845 0.565696 0.2051347SPG20 spastic paraplegia 20, spartin (Troyer syndrome) 1329 +/- 71 1486 +/- 143 1459 +/- 35 1302 +/- 45 -0.826379 0.3571879 -0.02541 0.0228355 0.1961751SPG21 spastic paraplegia 21 (autosomal recessive, Mast syndrome) 2258 +/- 168 2325 +/- 93 1675 +/- 47 1917 +/- 25 -0.000469 0.7353056 0.002344 0.9724206 0.0643185SPINK2 serine peptidase inhibitor, Kazal type 2 (acrosin-trypsin inhibitor) 187 +/- 45 123 +/- 5 124 +/- 3 177 +/- 17 -0.848383 -0.214183 0.037427 0.3169453 0.0206818SPSB3 splA/ryanodine receptor domain and SOCS box containing 3 474 +/- 49 493 +/- 23 461 +/- 22 396 +/- 17 -0.137979 0.7266565 -0.049146 0.7436191 0.0334969SPTBN1 spectrin, beta, non-erythrocytic 1 1270 +/- 153 835 +/- 88 1365 +/- 200 1056 +/- 161 0.020923 -0.038683 -0.260652 0.1486036 0.4901887SPTLC1 serine palmitoyltransferase, long chain base subunit 1 2170 +/- 85 2440 +/- 104 1815 +/- 58 2111 +/- 70 -0.000449 0.0739814 0.010986 0.0123306 0.0526412SPTY2D1 SPT2, Suppressor of Ty, domain containing 1 (S. cerevisiae) 213 +/- 23 140 +/- 13 201 +/- 16 189 +/- 22 0.484866 -0.025219 -0.667917 0.0458095 0.2302019SR-A1 serine arginine-rich pre-mRNA splicing factor SR-A1 440 +/- 30 527 +/- 58 660 +/- 33 789 +/- 43 3.71E-05 0.2204766 0.046113 0.8153769 0.1057452SRBD1 S1 RNA binding domain 1 122 +/- 36 182 +/- 29 85 +/- 6 173 +/- 17 -0.630624 0.2292686 0.004933 0.1758022 0.0027783SRCAP Snf2-related CBP activator protein 190 +/- 10 242 +/- 8 232 +/- 5 203 +/- 9 0.830548 0.0022256 -0.025474 0.0125831 0.0369587SRD5A1 steroid-5-alpha-reductase, alpha polypeptide 1 (3-oxo-5 alpha-steroid delta 4-dehydrogenas 264 +/- 147 539 +/- 62 255 +/- 133 609 +/- 56 0.588714 0.130382 0.04472 0.2397767 0.0728013SREBF2 sterol regulatory element binding transcription factor 2 1173 +/- 80 1157 +/- 64 1650 +/- 13 1844 +/- 70 1.99E-05 -0.882991 0.049562 0.5901255 0.2589213SRP19 signal recognition particle 19kDa 2698 +/- 166 3239 +/- 67 2572 +/- 101 3210 +/- 30 -0.287468 0.0210947 0.001033 0.1127686 0.0121634SRrp35 serine-arginine repressor protein (35 kDa) 851 +/- 61 650 +/- 57 860 +/- 61 692 +/- 42 0.721963 -0.036873 -0.051147 0.0637382 0.1931891SS18 synovial sarcoma translocation, chromosome 18 179 +/- 34 427 +/- 43 209 +/- 34 419 +/- 49 0.352157 0.0012461 0.00897 0.0029971 0.0621581SS18L2 synovial sarcoma translocation gene on chromosome 18-like 2 2273 +/- 100 2573 +/- 55 2299 +/- 38 2484 +/- 84 -0.719714 0.0306707 0.093923 0.0663328 0.018152SSB Sjogren syndrome antigen B (autoantigen La) 2114 +/- 118 1777 +/- 99 2359 +/- 70 1882 +/- 138 0.063217 -0.054698 -0.021628 0.0612614 0.1620291SSBP2 Single-stranded DNA binding protein 2 148 +/- 42 473 +/- 63 131 +/- 36 339 +/- 32 -0.014338 0.0021597 0.00188 0.0049527 0.0027213SSR2 signal sequence receptor, beta (translocon-associated protein beta) 2068 +/- 137 1585 +/- 78 1623 +/- 93 1483 +/- 68 -0.002111 -0.01556 -0.256528 0.0048081 0.1498578SSR3 signal sequence receptor, gamma (translocon-associated protein gamma) 1416 +/- 40 1776 +/- 112 1570 +/- 46 1920 +/- 158 0.082192 0.022161 0.090364 0.1522552 0.6361821SSTR2 somatostatin receptor 2 181 +/- 26 94 +/- 7 135 +/- 18 66 +/- 7 -0.029494 -0.018012 -0.010197 0.0054803 0.0554253SSU72 SSU72 RNA polymerase II CTD phosphatase homolog (S. cerevisiae) 2015 +/- 93 2625 +/- 115 1716 +/- 93 2050 +/- 54 -0.001308 0.0022663 0.015168 0.1119429 0.0672956SSX2IP synovial sarcoma, X breakpoint 2 interacting protein 256 +/- 17 190 +/- 21 218 +/- 7 166 +/- 12 -0.085889 -0.036497 -0.007626 0.0327467 0.0090246ST3GAL6 ST3 beta-galactoside alpha-2,3-sialyltransferase 6 690 +/- 106 1161 +/- 162 768 +/- 42 966 +/- 63 -0.437144 0.0390735 0.033662 0.0120219 0.074534ST6GALNAST6 (alpha-N-acetyl-neuraminyl-2,3-beta-galactosyl-1,3)-N-acetylgalactosaminide alpha-2,6 172 +/- 52 131 +/- 25 89 +/- 27 181 +/- 22 -0.762714 -0.494846 0.027556 0.7086499 0.1969843ST6GALNAST6 (alpha-N-acetyl-neuraminyl-2,3-beta-galactosyl-1,3)-N-acetylgalactosaminide alpha-2,6 776 +/- 23 926 +/- 60 825 +/- 32 928 +/- 25 0.614432 0.0553481 0.031677 0.0060311 0.3455751ST6GALNAST6 (alpha-N-acetyl-neuraminyl-2,3-beta-galactosyl-1,3)-N-acetylgalactosaminide alpha-2,6 422 +/- 12 305 +/- 23 413 +/- 44 385 +/- 11 0.219607 -0.002102 -0.562837 0.0090066 0.8653916ST8SIA2 ST8 alpha-N-acetyl-neuraminide alpha-2,8-sialyltransferase 2 339 +/- 35 212 +/- 17 124 +/- 23 93 +/- 11 -6.27E-05 -0.013714 -0.261209 0.0369402 0.6086224ST8SIA3 ST8 alpha-N-acetyl-neuraminide alpha-2,8-sialyltransferase 3 2875 +/- 542 3178 +/- 335 2260 +/- 206 3420 +/- 132 -0.708791 0.6458159 0.001363 0.8601663 0.0345403STARD3NLSTARD3 N-terminal like 1387 +/- 85 942 +/- 16 1203 +/- 86 834 +/- 52 -0.044391 -0.003026 -0.006158 0.0077875 0.0443081STAT2 signal transducer and activator of transcription 2, 113kDa 863 +/- 108 1063 +/- 113 815 +/- 45 976 +/- 46 -0.59488 0.2297582 0.034695 0.1012264 0.0698112STAT5B signal transducer and activator of transcription 5B 521 +/- 41 647 +/- 33 390 +/- 30 402 +/- 19 -0.000162 0.0378386 0.730509 0.0959601 0.5692423STK11IP serine/threonine kinase 11 interacting protein 832 +/- 22 692 +/- 33 760 +/- 43 675 +/- 37 -0.140135 -0.007128 -0.167253 0.2201706 0.617637STMN2 stathmin-like 2 15575 +/- 785 11635 +/- 678 13350 +/- 985 11673 +/- 910 -0.111545 -0.003626 -0.242694 0.0123956 0.5208959STOM stomatin 2053 +/- 253 2990 +/- 261 1953 +/- 163 2755 +/- 171 -0.159255 0.0275157 0.008201 0.0632377 0.1575077STRBP spermatid perinuclear RNA binding protein 926 +/- 84 754 +/- 29 785 +/- 30 663 +/- 42 -0.037528 -0.098304 -0.049348 0.2126192 0.2508432STRC stereocilin 345 +/- 54 551 +/- 31 332 +/- 31 472 +/- 34 -0.132417 0.0108514 0.015354 0.0540734 0.0744316
S1- alphabetical list of aging-related genes.xls Page 31

Young vs Aged MSI CorrelationsSymbol Description Young CA Aged CA Young DG Aged DG CA v DG in CA in DG in CA in DGSTS steroid sulfatase (microsomal), arylsulfatase C, isozyme S 522 +/- 29 428 +/- 25 424 +/- 42 346 +/- 14 -0.021387 -0.033391 -0.124594 0.0267615 0.1852603SUB1 SUB1 homolog (S. cerevisiae) 198 +/- 12 153 +/- 13 233 +/- 7 187 +/- 11 0.008317 -0.029381 -0.009334 0.0705728 0.2008498SUGT1 SGT1, suppressor of G2 allele of SKP1 (S. cerevisiae) 266 +/- 18 181 +/- 12 342 +/- 23 283 +/- 32 0.000158 -0.003216 -0.181555 0.0325977 0.7391313SUGT1L1 SGT1, suppressor of G2 allele of SKP1 like 1 (S. cerevisiae) 240 +/- 35 130 +/- 4 288 +/- 39 162 +/- 19 0.1329 -0.024887 -0.02192 0.0184495 0.0371058SUHW3 suppressor of hairy wing homolog 3 (Drosophila) 164 +/- 8 195 +/- 7 232 +/- 8 239 +/- 11 0.000226 0.0123894 0.663982 0.0018506 0.4146132SULT1A3 sulfotransferase family, cytosolic, 1A, phenol-preferring, member 3 375 +/- 64 226 +/- 35 292 +/- 26 202 +/- 21 -0.066602 -0.078388 -0.02414 0.2439979 0.1542381SUOX sulfite oxidase 266 +/- 15 222 +/- 19 301 +/- 8 220 +/- 19 0.242459 -0.100405 -0.008879 0.261112 0.0967416SUPT4H1 suppressor of Ty 4 homolog 1 (S. cerevisiae) 854 +/- 45 1062 +/- 48 905 +/- 30 1088 +/- 32 0.110911 0.0099546 0.0024 0.0533066 0.1139936SUPT7L suppressor of Ty 7 (S. cerevisiae)-like 547 +/- 33 403 +/- 23 594 +/- 42 454 +/- 21 0.073236 -0.005811 -0.01997 0.012705 0.0286548SURB7 SRB7 suppressor of RNA polymerase B homolog (yeast) 1618 +/- 167 2473 +/- 241 1436 +/- 158 2200 +/- 169 -0.002882 0.0173654 0.00959 0.0264854 0.0236746SURF1 surfeit 1 1906 +/- 52 2026 +/- 101 1667 +/- 86 1959 +/- 45 -0.001352 0.3240518 0.018135 0.7308047 0.0332671SURF4 surfeit 4 844 +/- 29 730 +/- 19 751 +/- 33 661 +/- 21 -0.005552 -0.010483 -0.048623 0.1021851 0.242073SYNGR4 synaptogyrin 4 345 +/- 36 312 +/- 23 289 +/- 21 221 +/- 22 -0.008731 -0.459799 -0.054898 0.6978628 0.2609005SYNJ2BP Synaptojanin 2 binding protein 752 +/- 43 787 +/- 33 1031 +/- 19 944 +/- 14 6.14E-05 0.5393535 -0.005859 0.1846546 0.0128158SYNPO2L synaptopodin 2-like 274 +/- 17 355 +/- 22 261 +/- 23 265 +/- 16 -0.049675 0.0168779 0.89537 0.025081 0.8519871SYT11 synaptotagmin XI 2979 +/- 924 523 +/- 91 2747 +/- 804 738 +/- 96 -0.719216 -0.0449 -0.054405 0.0455452 0.0918564SYT17 synaptotagmin XVII 1654 +/- 367 1225 +/- 137 1568 +/- 101 1227 +/- 51 -0.965794 -0.314314 -0.01883 0.2654489 0.0557006SYTL2 synaptotagmin-like 2 300 +/- 78 429 +/- 112 148 +/- 20 94 +/- 10 -0.006273 0.368996 -0.048362 0.4373566 0.1563739TAB3 TAK1-binding protein 3 1451 +/- 63 1273 +/- 30 1302 +/- 27 1272 +/- 19 -0.1265 -0.036765 -0.391402 0.0272875 0.3710045TACC1 transforming, acidic coiled-coil containing protein 1 1582 +/- 114 2047 +/- 42 1759 +/- 107 2070 +/- 195 0.362427 0.0077848 0.207245 0.0065097 0.1016656TADA1L transcriptional adaptor 1 (HFI1 homolog, yeast)-like 1627 +/- 54 1500 +/- 42 1705 +/- 66 1508 +/- 31 0.491764 -0.095764 -0.030645 0.385539 0.048167TADA3L transcriptional adaptor 3 (NGG1 homolog, yeast)-like 1631 +/- 31 1444 +/- 60 1480 +/- 44 1513 +/- 52 -0.522145 -0.025412 0.647547 0.0317519 0.5628612TAF1A TATA box binding protein (TBP)-associated factor, RNA polymerase I, A, 48kDa 204 +/- 13 258 +/- 14 251 +/- 18 253 +/- 11 0.110518 0.0173625 0.923978 0.0024907 0.9106105TAF1B TATA box binding protein (TBP)-associated factor, RNA polymerase I, B, 63kDa 234 +/- 23 246 +/- 38 330 +/- 22 422 +/- 23 0.000316 0.7891915 0.019503 0.8921318 0.0425003TAF3 TAF3 RNA polymerase II, TATA box binding protein (TBP)-associated factor, 140kDa 296 +/- 8 367 +/- 26 310 +/- 6 301 +/- 21 -0.114659 0.03724 -0.710751 0.0028884 0.3174497TAF5L TAF5-like RNA polymerase II, p300/CBP-associated factor (PCAF)-associated factor, 65kD 511 +/- 14 496 +/- 10 521 +/- 15 459 +/- 15 -0.489525 -0.402736 -0.015641 0.6288704 0.1895366TALDO1 transaldolase 1 955 +/- 59 1652 +/- 264 1013 +/- 64 1727 +/- 292 0.631178 0.0454565 0.069641 0.0718661 0.0513873TAP1 transporter 1, ATP-binding cassette, sub-family B (MDR/TAP) 270 +/- 14 334 +/- 23 295 +/- 13 305 +/- 17 -0.861563 0.0462617 0.667673 0.4137277 0.6093939TAS2R14 Taste receptor, type 2, member 14 101 +/- 20 203 +/- 19 104 +/- 21 230 +/- 27 0.395906 0.0044384 0.005974 0.0368933 0.0982432TASP1 taspase, threonine aspartase, 1 270 +/- 19 225 +/- 18 323 +/- 12 254 +/- 14 0.006132 -0.113118 -0.005654 0.0680737 0.0494189TATDN3 TatD DNase domain containing 3 116 +/- 9 169 +/- 11 138 +/- 16 192 +/- 10 0.063554 0.0041436 0.021647 0.0724146 0.0553409TBC1D14 TBC1 domain family, member 14 2125 +/- 84 1815 +/- 92 1795 +/- 52 1639 +/- 43 -0.001141 -0.031696 -0.047245 0.2222672 0.2088684TBC1D16 TBC1 domain family, member 16 132 +/- 15 84 +/- 12 134 +/- 13 147 +/- 12 0.129378 -0.030785 0.494538 0.016613 0.5945469TBC1D17 TBC1 domain family, member 17 1262 +/- 103 1539 +/- 80 1047 +/- 42 1261 +/- 39 -0.007657 0.0615205 0.004927 0.0854102 0.0422091TBC1D22BTBC1 domain family, member 22B 1294 +/- 39 1120 +/- 36 1174 +/- 53 1149 +/- 18 -0.33937 -0.008401 -0.662916 0.0040568 0.8721195TBC1D2B TBC1 domain family, member 2B 261 +/- 20 351 +/- 28 327 +/- 28 322 +/- 34 0.379198 0.0283692 -0.924665 0.0893058 0.4755989TBC1D9 TBC1 domain family, member 9 5875 +/- 79 5392 +/- 40 4902 +/- 118 5160 +/- 124 -0.000105 -0.000793 0.165632 0.0006887 0.6018428TBCA tubulin-specific chaperone a 3775 +/- 186 3218 +/- 114 3953 +/- 59 3483 +/- 98 0.069263 -0.033245 -0.004841 0.0289523 0.0236638TBCE tubulin-specific chaperone e 1108 +/- 25 1090 +/- 54 1222 +/- 53 1055 +/- 42 0.172167 -0.763513 -0.035533 0.7667842 0.0142401TBL1X transducin (beta)-like 1X-linked 155 +/- 28 369 +/- 21 212 +/- 17 525 +/- 99 0.040271 0.0001457 0.033161 0.0033462 0.0739863TBL3 transducin (beta)-like 3 579 +/- 36 464 +/- 23 541 +/- 36 472 +/- 24 -0.613143 -0.024171 -0.141556 0.017076 0.2097045TCEAL4 transcription elongation factor A (SII)-like 4 8509 +/- 229 10384 +/- 384 8133 +/- 200 10329 +/- 553 -0.234371 0.0028996 0.013326 0.0979095 0.1382757TCEAL8 transcription elongation factor A (SII)-like 8 2261 +/- 121 2724 +/- 87 2754 +/- 147 2815 +/- 38 0.006499 0.012366 0.698956 0.0146709 0.6065382TCERG1 transcription elongation regulator 1 1003 +/- 111 1042 +/- 31 1253 +/- 60 1001 +/- 75 0.145381 0.7451163 -0.029947 0.5976185 0.2930007
S1- alphabetical list of aging-related genes.xls Page 32

Young vs Aged MSI CorrelationsSymbol Description Young CA Aged CA Young DG Aged DG CA v DG in CA in DG in CA in DGTCF4 transcription factor 4 4852 +/- 158 4083 +/- 243 6014 +/- 463 4769 +/- 717 0.034252 -0.027614 -0.187716 0.3837346 0.9305804TCF7L2 transcription factor 7-like 2 (T-cell specific, HMG-box) 1721 +/- 95 2204 +/- 120 1530 +/- 109 1712 +/- 113 -0.004094 0.0109185 0.276317 0.0005919 0.481373TCFL5 transcription factor-like 5 (basic helix-loop-helix) 2337 +/- 183 1879 +/- 150 2593 +/- 180 1960 +/- 48 0.130726 -0.082168 -0.015834 0.29797 0.0273095TDRD6 tudor domain containing 6 160 +/- 22 164 +/- 14 169 +/- 12 130 +/- 7 -0.652629 0.8808388 -0.026082 0.7248955 0.0643988TEKT2 tektin 2 (testicular) 171 +/- 8 125 +/- 7 156 +/- 5 133 +/- 14 -0.371626 -0.001607 -0.191239 0.029531 0.6701408TERF2 telomeric repeat binding factor 2 123 +/- 13 83 +/- 8 103 +/- 11 90 +/- 11 -0.519571 -0.027878 -0.404464 0.0020105 0.4186014TEX10 testis expressed sequence 10 462 +/- 12 415 +/- 8 455 +/- 18 446 +/- 12 0.52937 -0.010267 -0.66446 0.019685 0.765926TF transferrin 7019 +/- 1463 9974 +/- 1622 4189 +/- 354 6128 +/- 572 -0.012445 0.2061852 0.024171 0.1130597 0.0107645TFG TRK-fused gene 5280 +/- 199 4443 +/- 99 4815 +/- 94 4186 +/- 147 -0.008725 -0.006472 -0.008783 0.00884 0.2431836TFPI tissue factor pathway inhibitor (lipoprotein-associated coagulation inhibitor) 202 +/- 14 337 +/- 20 145 +/- 11 265 +/- 18 -0.000333 0.0003604 0.001002 0.0062585 0.0073557TFPT TCF3 (E2A) fusion partner (in childhood Leukemia) 369 +/- 36 499 +/- 34 283 +/- 25 365 +/- 25 -0.000916 0.0243374 0.04248 0.0484472 0.0114551TGFB3 transforming growth factor, beta 3 505 +/- 61 393 +/- 48 651 +/- 37 486 +/- 46 0.001231 -0.182678 -0.022851 0.548311 0.08447TGM2 transglutaminase 2 (C polypeptide, protein-glutamine-gamma-glutamyltransferase) 141 +/- 8 82 +/- 19 137 +/- 20 132 +/- 28 0.264099 -0.026135 -0.900788 0.249611 0.8557524TGOLN2 trans-golgi network protein 2 6539 +/- 384 7975 +/- 222 6466 +/- 326 7084 +/- 273 -0.178439 0.0119243 0.179939 0.002868 0.1434965THAP11 THAP domain containing 11 1105 +/- 29 934 +/- 18 1207 +/- 52 1091 +/- 55 0.014562 -0.000838 -0.162464 0.0183226 0.0649289THBS3 thrombospondin 3 546 +/- 53 445 +/- 55 780 +/- 44 597 +/- 55 0.002165 -0.214844 -0.03159 0.2819204 0.0687474THEDC1 thioesterase domain containing 1 35 +/- 9 287 +/- 70 65 +/- 11 160 +/- 25 -0.294325 0.0152784 0.014874 0.000761 0.0131682THNSL1 threonine synthase-like 1 (bacterial) 904 +/- 69 911 +/- 73 1077 +/- 20 1202 +/- 28 0.002795 0.9472046 0.007608 0.7074732 0.0448758THRAP1 thyroid hormone receptor associated protein 1 2516 +/- 97 2385 +/- 106 2836 +/- 108 2482 +/- 58 0.047824 -0.383922 -0.021616 0.9182598 0.0677997THUMPD3 THUMP domain containing 3 1272 +/- 40 1006 +/- 65 1229 +/- 30 921 +/- 79 -0.324468 -0.007846 -0.014491 0.030597 0.0080008THY1 Thy-1 cell surface antigen 9156 +/- 962 5509 +/- 551 8393 +/- 478 6379 +/- 427 0.924806 -0.011092 -0.01192 0.0048733 0.0125296TICAM1 toll-like receptor adaptor molecule 1 274 +/- 11 229 +/- 13 241 +/- 16 230 +/- 10 -0.221891 -0.025245 -0.55569 0.0035756 0.4334359TIMM10 translocase of inner mitochondrial membrane 10 homolog (yeast) 1629 +/- 120 1047 +/- 77 1208 +/- 47 967 +/- 68 -0.01987 -0.003153 -0.021238 0.0054885 0.1440759TIMM17A translocase of inner mitochondrial membrane 17 homolog A (yeast) 4599 +/- 193 5229 +/- 399 4545 +/- 37 5734 +/- 354 0.257734 0.1964322 0.027969 0.8853455 0.246689TIMM17B translocase of inner mitochondrial membrane 17 homolog B (yeast) 797 +/- 21 693 +/- 17 734 +/- 44 746 +/- 42 -0.712147 -0.003378 0.8512 0.0013456 0.8624957TIMM8A translocase of inner mitochondrial membrane 8 homolog A (yeast) 203 +/- 12 163 +/- 10 217 +/- 9 201 +/- 18 0.147768 -0.032671 -0.462692 0.0516373 0.6911374TJP1 tight junction protein 1 (zona occludens 1) 881 +/- 94 1108 +/- 148 851 +/- 67 1056 +/- 37 -0.339328 0.2295937 0.029728 0.1657114 0.1157546TJP2 tight junction protein 2 (zona occludens 2) 2291 +/- 204 3125 +/- 237 2144 +/- 139 2859 +/- 124 -0.146935 0.0240802 0.004053 0.0210485 0.0660687TLK1 tousled-like kinase 1 109 +/- 15 104 +/- 11 155 +/- 15 108 +/- 11 0.088518 -0.817544 -0.029834 0.496871 0.0485331TLN2 Talin 2 152 +/- 19 223 +/- 17 218 +/- 33 262 +/- 39 0.10167 0.0194107 0.416037 0.0162748 0.1306185TM2D1 TM2 domain containing 1 743 +/- 38 713 +/- 50 856 +/- 54 690 +/- 41 0.295772 -0.642777 -0.037847 0.7145125 0.1792442TM7SF2 transmembrane 7 superfamily member 2 1226 +/- 65 1455 +/- 59 1141 +/- 34 1258 +/- 73 -0.037433 0.0261398 0.201389 0.0392401 0.5412888TM9SF2 transmembrane 9 superfamily member 2 1860 +/- 104 971 +/- 362 1861 +/- 69 746 +/- 349 -0.721198 -0.057369 -0.031588 0.4411309 0.162169TM9SF3 transmembrane 9 superfamily member 3 965 +/- 31 1185 +/- 61 976 +/- 42 1008 +/- 62 -0.128617 0.0135836 0.683605 3.797E-05 0.2243917TMBIM1 transmembrane BAX inhibitor motif containing 1 2080 +/- 216 2514 +/- 203 1362 +/- 54 1608 +/- 56 -0.000612 0.1734264 0.012063 0.0932183 0.1379688TMBIM4 transmembrane BAX inhibitor motif containing 4 1977 +/- 143 2256 +/- 151 2223 +/- 85 1815 +/- 95 -0.970131 0.2105026 -0.011327 0.0921827 0.0409543TMCC1 Transmembrane and coiled-coil domain family 1 100 +/- 14 167 +/- 12 175 +/- 18 218 +/- 27 0.008644 0.0045566 0.232236 0.002973 0.630778TMCO3 transmembrane and coiled-coil domains 3 771 +/- 94 966 +/- 81 781 +/- 44 952 +/- 37 -0.694839 0.1469131 0.015859 0.0708804 0.1668245TMED4 transmembrane emp24 protein transport domain containing 4 1134 +/- 55 1431 +/- 104 1087 +/- 50 1361 +/- 59 -0.045916 0.0364997 0.007201 0.0773 0.0247357TMEM100 transmembrane protein 100 1126 +/- 85 764 +/- 92 810 +/- 93 482 +/- 73 -8.87E-06 -0.016282 -0.021697 0.0020981 0.0122112TMEM106Ctransmembrane protein 106C 1970 +/- 98 2345 +/- 128 1940 +/- 209 2804 +/- 219 0.163504 0.0434133 0.019262 0.31285 0.2273303TMEM107 transmembrane protein 107 159 +/- 12 208 +/- 5 187 +/- 9 204 +/- 18 0.319892 0.0060148 0.449575 0.0516834 0.946283TMEM11 transmembrane protein 11 845 +/- 33 981 +/- 25 769 +/- 31 945 +/- 37 -0.003105 0.0089299 0.006195 0.1398978 0.1068125TMEM116 transmembrane protein 116 119 +/- 13 198 +/- 25 90 +/- 10 142 +/- 15 -0.009295 0.0227208 0.023266 0.0091373 0.0654129
S1- alphabetical list of aging-related genes.xls Page 33

Young vs Aged MSI CorrelationsSymbol Description Young CA Aged CA Young DG Aged DG CA v DG in CA in DG in CA in DGTMEM125 transmembrane protein 125 1877 +/- 348 2703 +/- 395 920 +/- 69 1320 +/- 139 -0.003931 0.1481536 0.042879 0.0392519 0.0982602TMEM126Btransmembrane protein 126B 118 +/- 16 90 +/- 10 126 +/- 9 89 +/- 10 0.883673 -0.171889 -0.026306 0.2725305 0.0575722TMEM132Btransmembrane protein 132B 1274 +/- 123 930 +/- 71 1051 +/- 67 730 +/- 54 -0.001972 -0.041705 -0.004742 0.2404027 0.1566965TMEM132Etransmembrane protein 132E 138 +/- 10 118 +/- 18 232 +/- 19 159 +/- 19 0.003245 -0.347428 -0.023539 0.1210173 0.0709417TMEM133 transmembrane protein 133 206 +/- 30 171 +/- 21 278 +/- 7 172 +/- 19 0.207571 -0.363118 -0.00354 0.2633708 0.0208326TMEM14B transmembrane protein 14B 10702 +/- 355 8858 +/- 414 10426 +/- 173 9258 +/- 433 0.738658 -0.007202 -0.051729 0.000494 0.0016488TMEM153 transmembrane protein 153 685 +/- 27 814 +/- 25 671 +/- 36 814 +/- 70 -0.95985 0.0060623 0.119132 0.0093753 0.288559TMEM16D transmembrane protein 16D 287 +/- 24 220 +/- 14 135 +/- 14 141 +/- 14 -2.12E-05 -0.043747 0.778349 0.0263544 0.8800053TMEM25 transmembrane protein 25 2517 +/- 184 2187 +/- 216 3846 +/- 199 3254 +/- 106 0.000106 -0.27173 -0.032156 0.2729187 0.1297675TMEM30A transmembrane protein 30A 8163 +/- 210 7246 +/- 252 7449 +/- 446 7041 +/- 398 -0.142752 -0.019401 -0.511949 0.0284447 0.9216308TMEM42 transmembrane protein 42 1365 +/- 45 1466 +/- 33 1244 +/- 38 1458 +/- 62 -0.040193 0.1013395 0.022844 0.3727597 0.1865494TMEM48 transmembrane protein 48 109 +/- 18 137 +/- 12 135 +/- 6 164 +/- 4 0.066946 0.2324573 0.003928 0.3911182 0.1098339TMEM50A transmembrane protein 50A 3252 +/- 47 2957 +/- 223 4076 +/- 139 3448 +/- 34 0.001072 -0.248078 -0.005475 0.4666802 0.025314TMEM50B transmembrane protein 50B 10086 +/- 744 7418 +/- 951 7691 +/- 435 6249 +/- 882 -0.010509 -0.053133 -0.193944 0.0045491 0.0299147TMEM51 transmembrane protein 51 459 +/- 34 555 +/- 15 354 +/- 21 396 +/- 28 -0.000141 0.0384605 0.277148 0.1356155 0.5956454TMEM57 transmembrane protein 57 604 +/- 27 705 +/- 15 723 +/- 33 725 +/- 8 0.046032 0.0126412 0.945545 0.0242234 0.8980879TMEM62 transmembrane protein 62 272 +/- 20 338 +/- 21 254 +/- 9 273 +/- 20 -0.024941 0.0504131 0.433539 0.0665573 0.7988088TMEM64 Transmembrane protein 64 338 +/- 27 289 +/- 14 377 +/- 21 301 +/- 16 0.17955 -0.146266 -0.020925 0.2949438 0.0073293TMEM76 transmembrane protein 76 3761 +/- 96 3217 +/- 173 4452 +/- 182 4256 +/- 291 0.000104 -0.025905 -0.587721 0.0215696 0.3439686TMEM80 transmembrane protein 80 995 +/- 50 1270 +/- 42 785 +/- 32 942 +/- 27 -1.15E-05 0.0019743 0.00455 0.0025206 0.0233829TMEM87B Transmembrane protein 87B 96 +/- 30 190 +/- 26 87 +/- 22 198 +/- 10 -0.869969 0.0397936 0.002631 0.1807296 0.0209088TMEM91 transmembrane protein 91 837 +/- 63 517 +/- 43 501 +/- 26 438 +/- 36 -0.003916 -0.00249 -0.196617 0.0104634 0.54782TMEM93 transmembrane protein 93 2312 +/- 100 1990 +/- 126 2258 +/- 82 1965 +/- 87 -0.971757 -0.075388 -0.037945 0.1866277 0.0607565TMEM97 transmembrane protein 97 1042 +/- 36 1322 +/- 88 914 +/- 45 1135 +/- 30 -0.00711 0.0231497 0.003205 0.0174164 0.0196386TMEPAI transmembrane, prostate androgen induced RNA 899 +/- 154 699 +/- 73 772 +/- 55 601 +/- 44 -0.256243 -0.277782 -0.038059 0.1698743 0.1604555TMF1 TATA element modulatory factor 1 2030 +/- 133 1560 +/- 130 2148 +/- 200 1684 +/- 181 0.247176 -0.029535 -0.118838 0.0634494 0.0932345TMTC4 transmembrane and tetratricopeptide repeat containing 4 1389 +/- 212 2022 +/- 276 751 +/- 81 984 +/- 63 -0.000888 0.1009476 0.049565 0.1159551 0.1834717TncRNA trophoblast-derived noncoding RNA 1717 +/- 180 2482 +/- 183 1618 +/- 126 1986 +/- 125 -0.103308 0.0137655 0.068035 0.0034843 0.0251874TNFAIP6 tumor necrosis factor, alpha-induced protein 6 258 +/- 31 467 +/- 111 161 +/- 13 251 +/- 29 -0.02623 0.1228848 0.031792 0.012802 0.0430429TNFAIP8L1tumor necrosis factor, alpha-induced protein 8-like 1 625 +/- 37 647 +/- 29 658 +/- 40 775 +/- 14 0.03887 0.6471604 0.032229 0.8891392 0.0755139TNFRSF19tumor necrosis factor receptor superfamily, member 19 113 +/- 17 70 +/- 3 136 +/- 13 101 +/- 8 0.022313 -0.052431 -0.056666 0.0367617 0.1181179TNFSF13 tumor necrosis factor (ligand) superfamily, member 13 626 +/- 50 900 +/- 75 508 +/- 50 663 +/- 50 -0.023771 0.0144421 0.056884 0.006527 0.1341425TNFSF13B tumor necrosis factor (ligand) superfamily, member 13b 429 +/- 38 458 +/- 44 416 +/- 30 552 +/- 32 0.229499 0.6342725 0.013214 0.3676074 0.0230484TNIP2 TNFAIP3 interacting protein 2 474 +/- 48 575 +/- 35 439 +/- 19 505 +/- 20 -0.129579 0.124973 0.042061 0.3179682 0.042892TNRC4 trinucleotide repeat containing 4 4534 +/- 210 3677 +/- 260 5558 +/- 185 4760 +/- 252 0.000551 -0.029148 -0.035167 0.0107826 0.1256802TNRC9 trinucleotide repeat containing 9 230 +/- 31 204 +/- 19 217 +/- 25 147 +/- 15 -0.153798 -0.488732 -0.042514 0.4769329 0.0994167TNS3 tensin 3 5926 +/- 520 7061 +/- 361 4964 +/- 174 6047 +/- 403 -0.002609 0.1067943 0.052473 0.3937513 0.3502093TNXA tenascin XA pseudogene 497 +/- 80 915 +/- 160 295 +/- 39 476 +/- 26 -0.012749 0.0506152 0.004207 0.0098381 0.0079701TOLLIP toll interacting protein 3373 +/- 197 2715 +/- 128 3379 +/- 182 2936 +/- 92 0.371372 -0.021608 -0.065072 0.007421 0.1245387TOM1L1 Target of myb1-like 1 (chicken) 114 +/- 13 121 +/- 6 130 +/- 12 171 +/- 11 0.025777 0.6318576 0.030309 0.6264392 0.0957465TOMM40L translocase of outer mitochondrial membrane 40 homolog-like (yeast) 1176 +/- 55 1011 +/- 26 1124 +/- 72 1062 +/- 68 -0.862307 -0.029641 -0.5499 0.0120262 0.9358822TOP1MT topoisomerase (DNA) I, mitochondrial 381 +/- 24 369 +/- 14 378 +/- 17 328 +/- 12 -0.086456 -0.659272 -0.038398 0.8367292 0.0365229TOR1AIP1 torsin A interacting protein 1 848 +/- 70 1089 +/- 39 1211 +/- 42 1195 +/- 20 0.002503 0.0176232 -0.739001 0.0164243 0.7918809TOR1B torsin family 1, member B (torsin B) 824 +/- 61 605 +/- 42 797 +/- 27 668 +/- 33 0.758247 -0.015886 -0.016497 0.0286671 0.0185479
S1- alphabetical list of aging-related genes.xls Page 34

Young vs Aged MSI CorrelationsSymbol Description Young CA Aged CA Young DG Aged DG CA v DG in CA in DG in CA in DGTOR3A torsin family 3, member A 298 +/- 17 220 +/- 15 308 +/- 11 206 +/- 13 -0.734421 -0.006224 -0.000303 0.0676836 0.0017675TP53BP2 tumor protein p53 binding protein, 2 3969 +/- 331 4293 +/- 320 4425 +/- 200 3879 +/- 120 0.304194 0.496883 -0.047499 0.2495646 0.298379TP53RK TP53 regulating kinase 189 +/- 12 227 +/- 11 170 +/- 2 221 +/- 13 -0.156343 0.0375501 0.014507 0.0098446 5.072E-06TPD52 tumor protein D52 200 +/- 13 258 +/- 21 346 +/- 17 380 +/- 12 1.36E-06 0.0473867 0.132678 0.1577976 0.2435336TPM1 Tropomyosin 1 (alpha) 396 +/- 71 679 +/- 70 626 +/- 100 856 +/- 98 0.000756 0.0180423 0.135836 0.0174101 0.0760796TPP1 tripeptidyl peptidase I 1777 +/- 184 2252 +/- 226 1825 +/- 88 2210 +/- 122 0.745375 0.1350991 0.03549 0.1099582 0.072628TPT1 tumor protein, translationally-controlled 1 440 +/- 33 330 +/- 27 527 +/- 42 469 +/- 48 0.001767 -0.028535 -0.385139 0.0312002 0.4178308TRA2A transformer-2 alpha 1956 +/- 84 1639 +/- 102 2458 +/- 104 1919 +/- 80 0.000253 -0.03851 -0.002777 0.3163716 0.022919TRAF3 TNF receptor-associated factor 3 1143 +/- 89 1002 +/- 66 1473 +/- 46 1224 +/- 60 0.001402 -0.233136 -0.011177 0.193721 0.0476289TRAFD1 TRAF-type zinc finger domain containing 1 1185 +/- 77 1021 +/- 41 913 +/- 16 812 +/- 32 -0.000443 -0.098765 -0.028756 0.2705776 0.0476544TRAK1 trafficking protein, kinesin binding 1 827 +/- 63 630 +/- 58 1039 +/- 46 885 +/- 23 0.000187 -0.044996 -0.018605 0.0166329 0.0124228TRAK2 trafficking protein, kinesin binding 2 2695 +/- 155 3432 +/- 218 2515 +/- 153 2941 +/- 67 -0.029831 0.0224005 0.039325 0.0113992 0.044261TRAM2 translocation associated membrane protein 2 242 +/- 13 139 +/- 24 223 +/- 20 171 +/- 18 0.890633 -0.005996 -0.081752 0.0558812 0.1085386TRAPPC2 trafficking protein particle complex 2 1738 +/- 51 1929 +/- 62 1792 +/- 47 1967 +/- 42 0.376883 0.0389203 0.020946 0.0442794 0.0368327TRAPPC5 trafficking protein particle complex 5 2581 +/- 63 2125 +/- 116 2463 +/- 162 2219 +/- 88 -0.873413 -0.009296 -0.223797 0.0244116 0.7278398TREX2 three prime repair exonuclease 2 95 +/- 10 117 +/- 10 117 +/- 14 160 +/- 11 0.001483 0.1529645 0.039352 0.6087976 0.2772861TRIM2 tripartite motif-containing 2 134 +/- 28 96 +/- 14 147 +/- 12 92 +/- 9 0.9229 -0.251682 -0.00594 0.3928277 0.0230353TRIM37 tripartite motif-containing 37 6886 +/- 322 6344 +/- 360 6293 +/- 202 6895 +/- 149 -0.639424 -0.288018 0.041014 0.093437 0.1241056TRIM46 tripartite motif-containing 46 886 +/- 40 715 +/- 65 1011 +/- 67 787 +/- 42 0.07113 -0.052704 -0.021733 0.0189775 0.0721362TRIM72 tripartite motif-containing 72 123 +/- 14 108 +/- 18 125 +/- 21 67 +/- 8 -0.29077 -0.549455 -0.039728 0.8562585 0.0466648TRIO Triple functional domain (PTPRF interacting) 232 +/- 36 388 +/- 49 416 +/- 22 423 +/- 36 0.012866 0.0303455 0.867579 0.15146 0.6239491TRIP6 thyroid hormone receptor interactor 6 448 +/- 39 566 +/- 21 435 +/- 17 459 +/- 14 -0.045033 0.0308227 0.305349 0.1291424 0.8550607TRMT12 tRNA methyltranferase 12 homolog (S. cerevisiae) 506 +/- 22 617 +/- 34 498 +/- 40 575 +/- 20 -0.364153 0.0234104 0.12859 0.3505438 0.4556509TRPM7 transient receptor potential cation channel, subfamily M, member 7 356 +/- 40 334 +/- 21 378 +/- 30 285 +/- 20 -0.870857 -0.62917 -0.031435 0.9676145 0.2030345TRUB2 TruB pseudouridine (psi) synthase homolog 2 (E. coli) 855 +/- 93 1100 +/- 56 795 +/- 42 1011 +/- 37 -0.134749 0.0521423 0.003953 0.1284202 0.1004199TSC22D2 TSC22 domain family, member 2 2203 +/- 83 2607 +/- 109 2346 +/- 100 2554 +/- 91 0.222684 0.0158673 0.157063 0.0651624 0.5944183TSEN34 tRNA splicing endonuclease 34 homolog (S. cerevisiae) 991 +/- 52 1198 +/- 77 784 +/- 49 985 +/- 39 -0.00045 0.0529505 0.010934 0.3530183 0.0224772TSGA2 testis specific A2 homolog (mouse) 658 +/- 150 274 +/- 41 370 +/- 40 239 +/- 30 -0.149288 -0.049774 -0.027797 0.0441117 0.1137503TSPAN3 tetraspanin 3 4001 +/- 86 3629 +/- 136 3966 +/- 66 3699 +/- 96 0.92958 -0.047448 -0.05388 0.0498443 0.2401377TSPYL3 TSPY-like 3 (pseudogene) 716 +/- 53 638 +/- 63 867 +/- 80 645 +/- 47 0.049766 -0.361301 -0.04429 0.4325361 0.1425855TTBK2 Tau tubulin kinase 2 1287 +/- 128 1604 +/- 88 1035 +/- 99 1388 +/- 79 -8.85E-05 0.0719335 0.02098 0.0493838 0.0120741TTC19 tetratricopeptide repeat domain 19 2924 +/- 101 1559 +/- 359 3189 +/- 138 1757 +/- 528 0.051201 -0.011318 -0.051447 0.0656807 0.1680265TTC27 tetratricopeptide repeat domain 27 442 +/- 31 538 +/- 25 493 +/- 26 422 +/- 31 -0.641755 0.0399541 -0.120361 0.1612213 0.2185023TTF1 transcription termination factor, RNA polymerase I 700 +/- 25 781 +/- 23 793 +/- 51 789 +/- 50 0.135399 0.0398668 -0.961344 0.0755174 0.7383038TTLL4 tubulin tyrosine ligase-like family, member 4 380 +/- 22 458 +/- 23 287 +/- 14 309 +/- 11 -0.000194 0.0373522 0.234891 0.0031157 0.3031171TUBB tubulin, beta 14019 +/- 320 12891 +/- 352 13789 +/- 333 13992 +/- 673 0.502382 -0.039425 0.795458 0.0112813 0.4504876TUBB2A tubulin, beta 2A 32505 +/- 1058 29201 +/- 789 30330 +/- 702 30704 +/- 944 -0.647763 -0.033009 0.759243 0.0168572 0.6398083TUBB2B tubulin, beta 2B 3672 +/- 237 3414 +/- 308 3355 +/- 175 2679 +/- 191 -0.021638 -0.521948 -0.029004 0.7455158 0.0914478TUBGCP2 tubulin, gamma complex associated protein 2 1011 +/- 12 1088 +/- 28 991 +/- 31 1088 +/- 35 -0.688769 0.0396274 0.069901 0.0187537 0.1460281TUBGCP5 tubulin, gamma complex associated protein 5 697 +/- 50 478 +/- 121 647 +/- 36 371 +/- 78 -0.185068 -0.139882 -0.020017 0.3173034 0.0374281TUFM Tu translation elongation factor, mitochondrial 1075 +/- 75 895 +/- 60 995 +/- 31 811 +/- 30 -0.058157 -0.091891 -0.002054 0.0799602 0.055396TUFT1 tuftelin 1 796 +/- 100 1318 +/- 115 650 +/- 8 921 +/- 37 -0.01834 0.0067359 0.001405 0.0112191 0.03166TUSC1 tumor suppressor candidate 1 965 +/- 92 888 +/- 78 1306 +/- 67 1105 +/- 34 0.012341 -0.537009 -0.031015 0.4691942 0.0926691TUSC3 tumor suppressor candidate 3 593 +/- 43 437 +/- 30 743 +/- 35 545 +/- 36 0.00246 -0.015208 -0.003574 0.0268112 0.0789955
S1- alphabetical list of aging-related genes.xls Page 35

Young vs Aged MSI CorrelationsSymbol Description Young CA Aged CA Young DG Aged DG CA v DG in CA in DG in CA in DGTUSC4 tumor suppressor candidate 4 680 +/- 15 597 +/- 17 608 +/- 25 633 +/- 24 -0.361644 -0.004189 0.477032 0.0017272 0.8305597TWSG1 twisted gastrulation homolog 1 (Drosophila) 237 +/- 29 361 +/- 36 277 +/- 24 370 +/- 42 0.540404 0.0239225 0.098445 0.0549182 0.3838287TXNDC10 thioredoxin domain containing 10 1152 +/- 79 1252 +/- 69 1427 +/- 33 1248 +/- 63 0.091054 0.366338 -0.046452 0.6779952 0.1847538TXNDC4 thioredoxin domain containing 4 (endoplasmic reticulum) 1246 +/- 67 1050 +/- 62 1153 +/- 88 920 +/- 29 -0.037892 -0.057809 -0.044765 0.3896292 0.2612776TXNDC9 thioredoxin domain containing 9 1042 +/- 34 872 +/- 30 979 +/- 44 900 +/- 61 -0.755935 -0.003787 -0.325893 0.0694099 0.2750064TXNL1 thioredoxin-like 1 2413 +/- 328 2952 +/- 186 3020 +/- 129 3692 +/- 218 0.011617 0.1909979 0.03449 0.2960004 0.0595136TXNL5 thioredoxin-like 5 875 +/- 37 924 +/- 31 895 +/- 46 1038 +/- 34 0.124208 0.3406681 0.033641 0.2201285 0.0538183TYROBP TYRO protein tyrosine kinase binding protein 1055 +/- 57 1424 +/- 146 717 +/- 24 899 +/- 63 -0.00327 0.0533008 0.041326 0.0060139 0.1496422UBAP2L ubiquitin associated protein 2-like 1045 +/- 48 1221 +/- 34 950 +/- 19 1068 +/- 43 -0.002699 0.0145306 0.047736 0.033027 0.2012221UBC ubiquitin C 6672 +/- 739 5772 +/- 426 7116 +/- 734 5191 +/- 278 -0.856537 -0.321669 -0.047247 0.4124151 0.1821162UBE1 ubiquitin-activating enzyme E1 (A1S9T and BN75 temperature sensitivity complementing) 6200 +/- 205 6514 +/- 169 6473 +/- 145 7267 +/- 148 0.00557 0.2658432 0.004142 0.8529343 0.0520709UBE1DC1 ubiquitin-activating enzyme E1-domain containing 1 944 +/- 81 433 +/- 60 1060 +/- 122 436 +/- 35 0.016502 -0.00065 -0.00298 0.0148963 0.0210426UBE2G1 ubiquitin-conjugating enzyme E2G 1 (UBC7 homolog, yeast) 643 +/- 51 771 +/- 63 502 +/- 12 695 +/- 17 -0.021358 0.150032 2.34E-05 0.3163649 0.0032084UBE2H ubiquitin-conjugating enzyme E2H (UBC8 homolog, yeast) 3587 +/- 143 4508 +/- 50 3408 +/- 125 4376 +/- 229 -0.282662 0.0007993 0.00919 0.0016336 0.0835148UBE2J1 ubiquitin-conjugating enzyme E2, J1 (UBC6 homolog, yeast) 447 +/- 25 412 +/- 15 587 +/- 24 472 +/- 9 0.001425 -0.256295 -0.003566 0.1363247 0.0170116UBE2J2 ubiquitin-conjugating enzyme E2, J2 (UBC6 homolog, yeast) 433 +/- 20 329 +/- 22 433 +/- 21 410 +/- 38 0.112513 -0.005392 -0.608341 0.0326802 0.9463236UBE2L6 ubiquitin-conjugating enzyme E2L 6 690 +/- 43 965 +/- 37 708 +/- 47 941 +/- 37 -0.890367 0.0006893 0.003762 0.0040887 0.0059346UBE2V2 ubiquitin-conjugating enzyme E2 variant 2 1294 +/- 48 1322 +/- 90 1405 +/- 72 1126 +/- 68 -0.846888 0.7892999 -0.020027 0.9176096 0.1203577UBE3A ubiquitin protein ligase E3A (human papilloma virus E6-associated protein, Angelman syndr 6737 +/- 339 5705 +/- 371 5837 +/- 154 5224 +/- 81 -0.046238 -0.067394 -0.008728 0.1696783 0.0658193UBR1 ubiquitin protein ligase E3 component n-recognin 1 655 +/- 48 599 +/- 38 837 +/- 25 692 +/- 31 0.002617 -0.387825 -0.006326 0.393552 0.0068199UBR2 ubiquitin protein ligase E3 component n-recognin 2 1287 +/- 52 1516 +/- 35 1269 +/- 37 1337 +/- 21 -0.090797 0.0056816 0.154154 0.004776 0.5701314UCK1 uridine-cytidine kinase 1 1401 +/- 163 1218 +/- 106 1046 +/- 54 836 +/- 69 -0.004824 -0.371207 -0.04278 0.4779683 0.0327209UCN urocortin 399 +/- 28 387 +/- 22 380 +/- 17 317 +/- 13 -0.110004 -0.741044 -0.017921 0.9887089 0.1015131UFD1L ubiquitin fusion degradation 1 like (yeast) 1115 +/- 186 1832 +/- 170 1206 +/- 182 1617 +/- 52 -0.884698 0.0175615 0.073879 0.0244533 0.1332247UGCG UDP-glucose ceramide glucosyltransferase 1454 +/- 63 1024 +/- 64 1638 +/- 69 1487 +/- 121 0.016063 -0.000733 -0.318254 0.0010664 0.4295965UNC13C unc-13 homolog C (C. elegans) 555 +/- 100 536 +/- 112 1134 +/- 113 1508 +/- 113 6.49E-05 -0.904622 0.044441 0.9489766 0.1532116UNC45A unc-45 homolog A (C. elegans) 863 +/- 83 692 +/- 25 923 +/- 40 731 +/- 59 0.200837 -0.096748 -0.029506 0.3684818 0.4271125UNC84A unc-84 homolog A (C. elegans) 302 +/- 15 412 +/- 31 411 +/- 55 383 +/- 30 0.290753 0.0148922 -0.669887 0.1154254 0.8653508UNC93B1 unc-93 homolog B1 (C. elegans) 102 +/- 18 164 +/- 21 91 +/- 9 122 +/- 14 -0.191111 0.0498508 0.105323 0.0264692 0.0892444UQCRC1 ubiquinol-cytochrome c reductase core protein I 5480 +/- 38 5588 +/- 258 5191 +/- 86 5734 +/- 178 -0.468081 0.695535 0.034439 0.4736981 0.1237464USP14 ubiquitin specific peptidase 14 (tRNA-guanine transglycosylase) 1553 +/- 103 1788 +/- 135 1582 +/- 72 1981 +/- 114 0.491904 0.1987562 0.021016 0.2845093 0.001748USP15 ubiquitin specific peptidase 15 2158 +/- 53 1639 +/- 107 2009 +/- 51 1697 +/- 92 -0.29659 -0.003135 -0.023253 0.0583221 0.3244356USP31 ubiquitin specific peptidase 31 360 +/- 19 436 +/- 27 499 +/- 36 687 +/- 45 0.000805 0.0458499 0.011486 0.1335057 0.1219157USP4 ubiquitin specific peptidase 4 (proto-oncogene) 2228 +/- 74 1806 +/- 34 2258 +/- 99 1973 +/- 65 0.074557 -0.001324 -0.041874 0.0153513 0.3543365USP53 ubiquitin specific peptidase 53 346 +/- 23 476 +/- 40 443 +/- 44 496 +/- 19 0.078882 0.0220377 0.304397 0.1497631 0.6399372UTP11L UTP11-like, U3 small nucleolar ribonucleoprotein, (yeast) 1063 +/- 52 748 +/- 78 1102 +/- 32 926 +/- 140 0.076356 -0.009004 -0.282294 0.0156669 0.2929523UTP14C UTP14, U3 small nucleolar ribonucleoprotein, homolog C (yeast) 1372 +/- 46 1224 +/- 51 1428 +/- 32 1176 +/- 49 0.546197 -0.056119 -0.00361 0.2103452 0.0278904UTP18 UTP18, small subunit (SSU) processome component, homolog (yeast) 599 +/- 58 413 +/- 38 673 +/- 50 479 +/- 70 0.043722 -0.026658 -0.055462 0.1362504 0.3656743VAPA VAMP (vesicle-associated membrane protein)-associated protein A, 33kDa 11082 +/- 381 9798 +/- 151 10132 +/- 197 8992 +/- 317 -0.01107 -0.018084 -0.018774 0.1149009 0.004102VASH1 Vasohibin 1 535 +/- 16 744 +/- 63 1011 +/- 90 999 +/- 53 2.52E-05 0.0198306 -0.908355 0.071398 0.9152143VDP vesicle docking protein p115 333 +/- 23 487 +/- 24 387 +/- 27 440 +/- 22 0.478245 0.0008437 0.162965 0.0003588 0.0685504VEGF vascular endothelial growth factor 2713 +/- 90 2084 +/- 104 2439 +/- 134 2150 +/- 54 -0.407872 -0.001085 -0.088854 0.0081142 0.1448131VEZT vezatin, adherens junctions transmembrane protein 486 +/- 18 420 +/- 10 474 +/- 38 465 +/- 24 0.627724 -0.01232 -0.832441 0.0080561 0.5767741VMO1 vitelline membrane outer layer 1 homolog (chicken) 691 +/- 50 1261 +/- 202 543 +/- 79 843 +/- 117 -0.002328 0.0360849 0.069831 0.0180857 0.022593
S1- alphabetical list of aging-related genes.xls Page 36

Young vs Aged MSI CorrelationsSymbol Description Young CA Aged CA Young DG Aged DG CA v DG in CA in DG in CA in DGVPS13B vacuolar protein sorting 13B (yeast) 993 +/- 26 852 +/- 41 949 +/- 24 938 +/- 47 0.843752 -0.018654 -0.831078 0.1952555 0.5089745VPS13C Vacuolar protein sorting 13 homolog C (S. cerevisiae) 1099 +/- 47 1286 +/- 45 1139 +/- 97 1352 +/- 95 0.438574 0.0175363 0.149298 0.0306072 0.5404622VPS37A vacuolar protein sorting 37 homolog A (S. cerevisiae) 350 +/- 19 271 +/- 22 344 +/- 18 318 +/- 14 0.339961 -0.022864 -0.295475 0.0472386 0.0712447VPS39 vacuolar protein sorting 39 (yeast) 1307 +/- 34 1456 +/- 46 1449 +/- 64 1330 +/- 79 0.668535 0.0282843 -0.273342 0.0310715 0.5496363VPS52 vacuolar protein sorting 52 (S. cerevisiae) 2096 +/- 88 2181 +/- 130 2255 +/- 63 2679 +/- 158 0.004678 0.6022707 0.052527 0.8677483 0.0234175VPS53 vacuolar protein sorting 53 (S. cerevisiae) 146 +/- 12 263 +/- 30 186 +/- 19 252 +/- 27 0.499944 0.0089525 0.084191 0.0156657 0.1320008VTI1B vesicle transport through interaction with t-SNAREs homolog 1B (yeast) 3503 +/- 235 3273 +/- 106 2823 +/- 159 3297 +/- 104 -0.120362 -0.403886 0.03647 0.2761022 0.0257349WAC WW domain containing adaptor with coiled-coil 3946 +/- 99 4045 +/- 77 3700 +/- 73 4022 +/- 31 -0.008381 0.4501341 0.005534 0.3428936 0.03231WAPAL wings apart-like homolog (Drosophila) 1297 +/- 39 1452 +/- 53 1324 +/- 21 1373 +/- 65 -0.928265 0.0422755 0.509868 0.0426606 0.6191482WAS Wiskott-Aldrich syndrome (eczema-thrombocytopenia) 214 +/- 11 177 +/- 8 239 +/- 10 176 +/- 17 0.227253 -0.021343 -0.016449 0.1170599 0.003993WASPIP Wiskott-Aldrich syndrome protein interacting protein 453 +/- 53 836 +/- 159 339 +/- 48 483 +/- 31 -0.031369 0.0615464 0.036627 0.0056073 0.0362281WBP1 WW domain binding protein 1 1823 +/- 116 2506 +/- 129 1839 +/- 149 2251 +/- 134 -0.111839 0.0028595 0.069745 0.0103896 0.1447055WBSCR17 Williams-Beuren syndrome chromosome region 17 3846 +/- 222 2759 +/- 329 4476 +/- 273 3946 +/- 239 0.003811 -0.023533 -0.178057 0.0095031 0.5398113WDFY1 WD repeat and FYVE domain containing 1 1082 +/- 175 808 +/- 190 857 +/- 69 579 +/- 68 -0.015588 -0.316252 -0.018632 0.8156256 0.2181605WDR20 WD repeat domain 20 126 +/- 15 179 +/- 17 107 +/- 16 129 +/- 10 -0.02678 0.039402 0.281023 0.0059351 0.4156628WDR23 WD repeat domain 23 428 +/- 44 312 +/- 19 348 +/- 33 318 +/- 26 -0.274186 -0.046415 -0.501504 0.0755089 0.6240834WDR25 WD repeat domain 25 360 +/- 15 348 +/- 18 272 +/- 4 365 +/- 15 -0.2405 -0.6193 0.002078 0.272477 0.0034098WDR36 WD repeat domain 36 210 +/- 17 205 +/- 18 260 +/- 9 213 +/- 15 0.121961 -0.841738 -0.037096 0.9362799 0.0466436WDR47 WD repeat domain 47 4038 +/- 157 3797 +/- 170 4306 +/- 111 3939 +/- 111 0.055136 -0.322562 -0.045221 0.1430744 0.1724067WDR57 WD repeat domain 57 (U5 snRNP specific) 959 +/- 34 1105 +/- 11 958 +/- 17 1063 +/- 49 -0.619116 0.0063689 0.097725 0.0200081 0.4501393WDR71 WD repeat domain 71 1094 +/- 63 1355 +/- 56 978 +/- 43 1086 +/- 116 -0.007047 0.0110987 0.422752 0.0963653 0.7656435WDR73 WD repeat domain 73 236 +/- 7 291 +/- 13 265 +/- 22 258 +/- 15 -0.882034 0.0056071 -0.775932 0.0124797 0.6874124WDR74 WD repeat domain 74 744 +/- 14 687 +/- 26 664 +/- 37 566 +/- 24 -0.004433 -0.095725 -0.05306 0.2019727 0.1043173WEE1 WEE1 homolog (S. pombe) 156 +/- 15 113 +/- 11 162 +/- 19 156 +/- 13 0.080558 -0.043433 -0.792523 0.0274297 0.3148447WHDC1 WAS protein homology region 2 domain containing 1 276 +/- 18 251 +/- 22 322 +/- 19 263 +/- 13 0.001236 -0.402533 -0.033976 0.2380032 0.061158WHDC1L1 WAS protein homology region 2 domain containing 1-like 1 103 +/- 9 161 +/- 16 133 +/- 14 116 +/- 11 -0.905068 0.0147173 -0.368477 0.0166033 0.1508871WHSC1 Wolf-Hirschhorn syndrome candidate 1 291 +/- 18 359 +/- 21 296 +/- 30 337 +/- 23 -0.629015 0.0335982 0.30691 0.0574177 0.2165234WNK1 WNK lysine deficient protein kinase 1 169 +/- 12 233 +/- 22 147 +/- 11 191 +/- 17 -0.025793 0.0311083 0.069392 0.0020538 0.0029629WNT5A wingless-type MMTV integration site family, member 5A 485 +/- 51 763 +/- 107 574 +/- 90 877 +/- 81 0.234303 0.0504035 0.034137 0.0055733 0.0175677WTAP Wilms tumor 1 associated protein 519 +/- 31 710 +/- 21 683 +/- 41 771 +/- 66 0.012206 0.0006447 0.292143 0.0003647 0.0433612WWOX WW domain containing oxidoreductase 524 +/- 32 696 +/- 66 457 +/- 17 483 +/- 57 -0.018561 0.0511504 0.684042 0.0066884 0.8592822WWP1 WW domain containing E3 ubiquitin protein ligase 1 1658 +/- 161 2181 +/- 165 1410 +/- 176 1562 +/- 24 -0.003309 0.0466357 0.43057 0.0263697 0.3583863XKR4 XK, Kell blood group complex subunit-related family, member 4 1695 +/- 77 1381 +/- 64 1756 +/- 52 1344 +/- 38 0.813186 -0.010927 -0.000144 0.0064131 0.0078778XPNPEP1 X-prolyl aminopeptidase (aminopeptidase P) 1, soluble 1226 +/- 73 1063 +/- 32 1269 +/- 56 1109 +/- 24 0.337722 -0.080738 -0.035698 0.0328858 0.0767639XPO5 exportin 5 429 +/- 36 342 +/- 18 461 +/- 21 383 +/- 24 0.284697 -0.066394 -0.040657 0.2169755 0.0262118XRCC5 X-ray repair complementing defective repair in Chinese hamster cells 5 (double-strand-brea 1545 +/- 90 1864 +/- 59 1424 +/- 33 1774 +/- 97 -0.034978 0.0164915 0.019361 0.2486474 0.11865XTP3TPA XTP3-transactivated protein A 1242 +/- 57 1263 +/- 36 1182 +/- 54 1352 +/- 33 0.976487 0.7683885 0.027719 0.5634529 0.0450114YIF1A Yip1 interacting factor homolog A (S. cerevisiae) 1268 +/- 101 1457 +/- 104 804 +/- 64 1043 +/- 52 -0.000185 0.2207861 0.017631 0.1303022 0.2988299YIF1B Yip1 interacting factor homolog B (S. cerevisiae) 521 +/- 34 657 +/- 43 514 +/- 32 631 +/- 45 -0.173589 0.0319616 0.067484 0.012497 0.006137YIPF5 Yip1 domain family, member 5 2776 +/- 72 2388 +/- 136 2883 +/- 102 2798 +/- 74 0.02751 -0.037028 -0.516929 0.0084887 0.633725YME1L1 YME1-like 1 (S. cerevisiae) 3560 +/- 193 4334 +/- 244 3653 +/- 205 4168 +/- 128 -0.80019 0.0331531 0.065747 0.3551589 0.3036552YRDC yrdC domain containing (E. coli) 396 +/- 15 305 +/- 14 466 +/- 9 394 +/- 30 0.001004 -0.001409 -0.075638 0.0027356 0.4238058YTHDC1 YTH domain containing 1 3734 +/- 134 4179 +/- 118 3676 +/- 128 4478 +/- 290 0.634002 0.0314959 0.048117 0.003624 0.1540466YTHDF2 YTH domain family, member 2 2059 +/- 97 1665 +/- 58 2492 +/- 66 2178 +/- 98 0.00012 -0.007866 -0.031414 0.1128308 0.432849
S1- alphabetical list of aging-related genes.xls Page 37

Young vs Aged MSI CorrelationsSymbol Description Young CA Aged CA Young DG Aged DG CA v DG in CA in DG in CA in DGYTHDF3 YTH domain family, member 3 3848 +/- 269 3599 +/- 115 3721 +/- 144 3177 +/- 92 -0.217782 -0.424114 -0.012373 0.6292132 0.0622836ZBTB24 zinc finger and BTB domain containing 24 626 +/- 63 454 +/- 23 608 +/- 38 435 +/- 38 -0.536329 -0.039583 -0.010113 0.1877211 0.1509857ZBTB26 zinc finger and BTB domain containing 26 380 +/- 28 505 +/- 16 502 +/- 29 427 +/- 37 0.501763 0.0047141 -0.148916 0.0009437 0.4279081ZBTB7A zinc finger and BTB domain containing 7A 1920 +/- 64 1641 +/- 79 2555 +/- 279 2188 +/- 127 0.001221 -0.021473 -0.27096 0.1108262 0.5977751ZBTB7C zinc finger and BTB domain containing 7C 448 +/- 21 348 +/- 43 483 +/- 41 358 +/- 31 0.221755 -0.074596 -0.037872 0.0804206 0.1577621ZC3H13 Zinc finger CCCH-type containing 13 2082 +/- 90 1605 +/- 162 1861 +/- 75 1362 +/- 193 -0.012616 -0.0334 -0.05896 0.0151073 0.0145363ZC3H14 zinc finger CCCH-type containing 14 1650 +/- 138 1245 +/- 70 1782 +/- 55 1603 +/- 67 0.006636 -0.033219 -0.072998 0.0842893 0.4758872ZC3H5 zinc finger CCCH-type containing 5 511 +/- 50 651 +/- 39 464 +/- 35 503 +/- 41 -0.035672 0.0536802 0.490227 0.1864741 0.5588391ZCCHC10 zinc finger, CCHC domain containing 10 274 +/- 13 341 +/- 16 327 +/- 16 328 +/- 20 0.207084 0.0091703 0.953354 0.0262749 0.5930633ZCCHC6 zinc finger, CCHC domain containing 6 609 +/- 30 750 +/- 31 578 +/- 31 641 +/- 42 -0.152995 0.0086991 0.260145 0.0085913 0.1891606ZCCHC7 Zinc finger, CCHC domain containing 7 91 +/- 10 151 +/- 6 114 +/- 11 145 +/- 19 0.362943 0.0009984 0.205209 0.0324606 0.9378469ZF HCF-binding transcription factor Zhangfei 481 +/- 22 590 +/- 26 608 +/- 20 692 +/- 20 0.000708 0.0098783 0.016805 0.0079603 0.3500007ZFP90 zinc finger protein 90 homolog (mouse) 3528 +/- 279 4260 +/- 161 3870 +/- 345 4323 +/- 157 0.025622 0.0525751 0.270959 0.0915682 0.4421446ZKSCAN1 zinc finger with KRAB and SCAN domains 1 1152 +/- 95 1766 +/- 191 984 +/- 18 1287 +/- 34 -0.037284 0.0226658 0.000206 0.0075827 0.0004425ZMPSTE24zinc metallopeptidase (STE24 homolog, yeast) 681 +/- 23 630 +/- 24 787 +/- 36 633 +/- 19 0.116857 -0.153945 -0.005707 0.3891191 0.1089935ZNF131 Zinc finger protein 131 (clone pHZ-10) 124 +/- 18 238 +/- 29 160 +/- 22 267 +/- 25 0.016536 0.0100522 0.011395 0.1261566 0.0668083ZNF134 zinc finger protein 134 (clone pHZ-15) 473 +/- 12 593 +/- 38 437 +/- 27 544 +/- 37 -0.049071 0.0233991 0.04835 0.0086541 0.3033516ZNF142 zinc finger protein 142 (clone pHZ-49) 769 +/- 26 723 +/- 22 760 +/- 22 633 +/- 26 -0.068212 -0.217211 -0.005034 0.4714697 0.0379537ZNF154 zinc finger protein 154 (pHZ-92) 164 +/- 17 242 +/- 25 176 +/- 18 248 +/- 31 0.223358 0.0288284 0.087217 0.000705 0.0149402ZNF16 zinc finger protein 16 568 +/- 69 420 +/- 40 479 +/- 21 350 +/- 25 -0.089977 -0.099141 -0.004059 0.2275985 0.0013397ZNF161 zinc finger protein 161 1955 +/- 205 2188 +/- 214 1741 +/- 43 1557 +/- 39 -0.029816 0.4513335 -0.01118 0.120171 0.0720792ZNF197 zinc finger protein 197 370 +/- 35 200 +/- 10 492 +/- 28 326 +/- 18 1.85E-05 -0.00368 -0.000982 0.0070485 0.01695ZNF200 zinc finger protein 200 442 +/- 11 377 +/- 17 482 +/- 19 399 +/- 22 0.061584 -0.011261 -0.018821 0.003 0.0151804ZNF238 zinc finger protein 238 7398 +/- 390 6014 +/- 471 8244 +/- 127 6592 +/- 730 0.049554 -0.047964 -0.08576 0.1522323 0.5300615ZNF25 zinc finger protein 25 1239 +/- 41 1519 +/- 51 1305 +/- 50 1653 +/- 73 0.004793 0.0018547 0.00525 0.0858856 0.0659915ZNF278 zinc finger protein 278 239 +/- 11 277 +/- 12 317 +/- 19 300 +/- 16 0.019184 0.0427149 -0.486719 0.0601858 0.7465071ZNF285 zinc finger protein 285 234 +/- 6 184 +/- 8 245 +/- 9 194 +/- 13 0.258421 -0.000899 -0.014433 0.0031872 0.0029601ZNF304 zinc finger protein 304 417 +/- 19 402 +/- 10 433 +/- 15 375 +/- 12 -0.668323 -0.484143 -0.014962 0.3962942 0.004852ZNF313 zinc finger protein 313 694 +/- 43 845 +/- 53 607 +/- 21 631 +/- 16 -0.006952 0.0520928 0.396094 0.033531 0.7041382ZNF323 zinc finger protein 323 162 +/- 15 187 +/- 22 236 +/- 13 296 +/- 17 0.001103 0.368404 0.023073 0.6848203 0.0231175ZNF336 zinc finger protein 336 1688 +/- 83 1861 +/- 80 1511 +/- 33 1629 +/- 15 -0.001594 0.1653536 0.013896 0.0909008 0.1093542ZNF342 zinc finger protein 342 170 +/- 21 134 +/- 18 176 +/- 17 96 +/- 14 -0.574278 -0.232631 -0.00472 0.2812068 0.0030706ZNF347 zinc finger protein 347 126 +/- 11 178 +/- 7 162 +/- 16 181 +/- 15 0.030671 0.0042757 0.409142 0.0166876 0.8325214ZNF358 zinc finger protein 358 556 +/- 13 684 +/- 43 872 +/- 81 877 +/- 12 0.000402 0.028655 0.953891 0.0864711 0.9796446ZNF384 zinc finger protein 384 657 +/- 34 714 +/- 19 682 +/- 19 758 +/- 21 0.164487 0.1755146 0.026243 0.0597001 0.0489691ZNF416 zinc finger protein 416 101 +/- 8 139 +/- 8 105 +/- 12 116 +/- 13 -0.474243 0.0079955 0.556996 0.0169251 0.5581361ZNF435 zinc finger protein 435 110 +/- 9 147 +/- 5 143 +/- 12 160 +/- 5 0.033286 0.0094135 0.248189 0.0044561 0.7177566ZNF436 zinc finger protein 436 845 +/- 77 754 +/- 83 1185 +/- 39 1061 +/- 36 0.000267 -0.443221 -0.045877 0.4482469 0.0157843ZNF44 zinc finger protein 44 227 +/- 19 193 +/- 5 249 +/- 13 199 +/- 12 0.209191 -0.132476 -0.02205 0.4477143 0.2000242ZNF45 zinc finger protein 45 279 +/- 18 336 +/- 17 332 +/- 22 400 +/- 18 0.001286 0.0495013 0.045354 0.2410449 0.225943ZNF452 zinc finger protein 452 148 +/- 21 151 +/- 15 209 +/- 9 177 +/- 7 0.014954 0.8964179 -0.023525 0.9426293 0.0763942ZNF469 zinc finger protein 469 394 +/- 35 350 +/- 17 320 +/- 12 250 +/- 18 -0.002244 -0.294886 -0.015176 0.2768855 0.1902113ZNF501 zinc finger protein 501 137 +/- 4 217 +/- 10 206 +/- 8 206 +/- 8 0.044857 0.0002728 -0.95366 0.0016356 0.8863999ZNF503 zinc finger protein 503 989 +/- 27 822 +/- 31 1260 +/- 34 1165 +/- 60 1.25E-06 -0.002239 -0.214355 0.0017121 0.1866212
S1- alphabetical list of aging-related genes.xls Page 38

Young vs Aged MSI CorrelationsSymbol Description Young CA Aged CA Young DG Aged DG CA v DG in CA in DG in CA in DGZNF527 zinc finger protein 527 174 +/- 9 109 +/- 12 181 +/- 11 142 +/- 18 0.083895 -0.001326 -0.10689 0.0387104 0.463509ZNF529 zinc finger protein 529 1055 +/- 71 885 +/- 61 1009 +/- 20 833 +/- 33 -0.45572 -0.101266 -0.003095 0.113982 0.0024192ZNF561 zinc finger protein 561 444 +/- 41 512 +/- 38 329 +/- 24 397 +/- 16 -0.001359 0.2492244 0.046431 0.617956 0.0441045ZNF564 zinc finger protein 564 324 +/- 32 430 +/- 24 307 +/- 19 390 +/- 12 -0.151689 0.0253231 0.006176 0.0877133 0.046735ZNF573 zinc finger protein 573 187 +/- 34 144 +/- 13 251 +/- 30 152 +/- 28 0.039697 -0.279536 -0.039265 0.5620131 0.4317854ZNF585A zinc finger protein 585A 327 +/- 14 417 +/- 21 339 +/- 13 322 +/- 21 -0.117363 0.0053951 -0.492896 0.0066549 0.2596855ZNF586 zinc finger protein 586 316 +/- 21 232 +/- 26 438 +/- 20 279 +/- 34 0.00204 -0.031863 -0.005803 0.0353043 0.0017489ZNF592 zinc finger protein 592 288 +/- 9 242 +/- 16 283 +/- 13 268 +/- 16 0.293743 -0.040746 -0.501622 0.141727 0.5779437ZNF596 zinc finger protein 596 360 +/- 12 434 +/- 25 392 +/- 8 446 +/- 11 0.182693 0.0291735 0.004146 0.0037791 0.0013029ZNF598 zinc finger protein 598 783 +/- 25 699 +/- 38 826 +/- 24 723 +/- 33 0.41735 -0.098271 -0.035159 0.0232282 0.0712391ZNF615 zinc finger protein 615 148 +/- 12 112 +/- 12 154 +/- 12 102 +/- 14 -0.762868 -0.057015 -0.019856 0.2040706 0.2784524ZNF622 zinc finger protein 622 946 +/- 28 1045 +/- 22 741 +/- 18 848 +/- 18 -1.86E-05 0.0219261 0.002302 0.0210693 0.0499573ZNF624 zinc finger protein 624 203 +/- 12 260 +/- 11 231 +/- 15 261 +/- 14 0.183643 0.0053659 0.177366 0.0006624 0.2310938ZNF626 Zinc finger protein 626 262 +/- 29 140 +/- 14 248 +/- 23 150 +/- 12 -0.967662 -0.006163 -0.005929 0.0368409 0.041037ZNF650 zinc finger protein 650 1129 +/- 62 1186 +/- 66 1399 +/- 98 1075 +/- 82 0.299377 0.5365531 -0.031841 0.0619822 0.2010406ZNF652 Zinc finger protein 652 479 +/- 32 629 +/- 35 465 +/- 24 532 +/- 28 -0.092059 0.0102613 0.106058 0.032785 0.2717889ZNF658 zinc finger protein 658 201 +/- 19 171 +/- 8 278 +/- 14 206 +/- 22 0.013475 -0.206711 -0.026069 0.2586914 0.1252363ZNF664 zinc finger protein 664 4855 +/- 461 4156 +/- 264 5217 +/- 185 4351 +/- 285 0.219105 -0.224378 -0.037811 0.4622582 0.189499ZNF669 zinc finger protein 669 417 +/- 25 647 +/- 62 504 +/- 23 634 +/- 44 0.333179 0.011644 0.038529 0.017253 0.0599344ZNF697 zinc finger protein 697 458 +/- 22 383 +/- 9 394 +/- 27 303 +/- 1 -0.000306 -0.018619 -0.020789 0.0263098 0.033517ZNF70 Zinc finger protein 70 162 +/- 13 219 +/- 18 207 +/- 13 233 +/- 8 0.087186 0.0282527 0.14106 0.0447341 0.5020141ZNF74 zinc finger protein 74 147 +/- 15 91 +/- 13 170 +/- 12 113 +/- 14 0.06611 -0.018936 -0.01637 0.1127438 0.2064913ZNF75 zinc finger protein 75 (D8C6) 118 +/- 9 171 +/- 11 232 +/- 23 191 +/- 11 0.013173 0.0039383 -0.160314 0.0464456 0.0901358ZNF83 zinc finger protein 83 385 +/- 25 545 +/- 35 388 +/- 21 477 +/- 31 -0.212678 0.0046795 0.046906 0.0006789 0.0442847ZNF9 zinc finger protein 9 6431 +/- 219 5316 +/- 196 5728 +/- 139 4867 +/- 76 -0.000164 -0.00362 -0.000742 0.0312627 0.0114342ZNFN1A1 zinc finger protein, subfamily 1A, 1 (Ikaros) 114 +/- 15 175 +/- 22 102 +/- 11 150 +/- 6 -0.194663 0.0449452 0.005623 0.0083714 0.0808889ZNFN1A5 zinc finger protein, subfamily 1A, 5 579 +/- 151 1239 +/- 161 624 +/- 101 993 +/- 136 -0.280489 0.0136385 0.061689 0.0075454 0.0129977ZNHIT3 zinc finger, HIT type 3 1626 +/- 109 1266 +/- 38 1613 +/- 77 1374 +/- 14 0.522316 -0.01978 -0.026213 0.0269002 0.0389438ZNRD1 zinc ribbon domain containing 1 926 +/- 41 625 +/- 37 853 +/- 26 720 +/- 30 0.940327 -0.000269 -0.009908 0.0596257 0.0992138ZNRF1 zinc and ring finger 1 184 +/- 15 139 +/- 13 202 +/- 22 172 +/- 11 0.259778 -0.045444 -0.273991 0.0873131 0.2765162ZNRF2 zinc and ring finger 2 122 +/- 11 116 +/- 9 87 +/- 7 125 +/- 7 -0.157226 -0.667415 0.004702 0.7264889 0.0789072ZRANB1 zinc finger, RAN-binding domain containing 1 849 +/- 44 1040 +/- 45 887 +/- 57 1073 +/- 52 0.411994 0.012515 0.039302 0.2520777 0.2650146ZRANB3 zinc finger, RAN-binding domain containing 3 569 +/- 41 434 +/- 28 513 +/- 24 455 +/- 29 -0.646283 -0.024725 -0.165971 0.1341786 0.5240794ZWINT ZW10 interactor 592 +/- 49 356 +/- 55 462 +/- 44 332 +/- 21 -0.105522 -0.009325 -0.032176 0.0074061 0.0888791ZXDB zinc finger, X-linked, duplicated B 667 +/- 61 496 +/- 39 665 +/- 46 479 +/- 61 -0.95921 -0.044559 -0.041047 0.2601647 0.2486741ZYG11B Zyg-11 homolog B (C. elegans) 783 +/- 95 1096 +/- 114 916 +/- 54 1329 +/- 49 0.004684 0.0627527 0.000304 0.2823152 0.0091151ZZEF1 zinc finger, ZZ-type with EF-hand domain 1 1717 +/- 133 1604 +/- 63 1605 +/- 32 1429 +/- 41 -0.124003 -0.465891 -0.009886 0.6526544 0.0785597
S1- alphabetical list of aging-related genes.xls Page 39

Symbol Description Young CA Aged CA Young DG Aged DG CA v DG CA Y v A DG Y v A CA to PMI DG to PMIOverexpressed in CA2'-PDE 2'-phosphodiesterase 274 +/- 14 302 +/- 11 344 +/- 8 359 +/- 8 5.62E-05 0.1501669 0.214248 0.1382908 0.676623AADACL1 arylacetamide deacetylase-like 1 2372 +/- 68 2331 +/- 133 2570 +/- 66 2679 +/- 108 0.001544 -0.787768 0.419757 0.1454127 0.9179538AASDHPPTaminoadipate-semialdehyde dehydrogenase-phosphopantetheinyl transferase 8050 +/- 338 7445 +/- 313 8380 +/- 331 7797 +/- 378 0.043071 -0.217551 -0.277423 0.6774587 0.9614512ABCA5 ATP-binding cassette, sub-family A (ABC1), member 5 539 +/- 47 572 +/- 45 663 +/- 71 669 +/- 19 0.028807 0.6232489 0.938339 0.8611567 0.9380525ABCB9 ATP-binding cassette, sub-family B (MDR/TAP), member 9 81 +/- 12 75 +/- 8 142 +/- 25 137 +/- 26 0.011372 -0.714643 -0.89493 0.6969868 0.4761067ABCG4 ATP-binding cassette, sub-family G (WHITE), member 4 113 +/- 5 98 +/- 12 166 +/- 10 159 +/- 19 2.64E-05 -0.301902 -0.76083 0.0767186 0.462626ABHD13 abhydrolase domain containing 13 130 +/- 12 111 +/- 9 150 +/- 11 146 +/- 10 0.008996 -0.247523 -0.793308 0.5320683 0.9735457ABHD14A abhydrolase domain containing 14A 1760 +/- 56 1515 +/- 91 1973 +/- 103 1818 +/- 29 0.010547 -0.048824 -0.200935 0.0371071 0.3262792ABI1 abl-interactor 1 513 +/- 68 396 +/- 59 675 +/- 49 584 +/- 41 0.001619 -0.220504 -0.19246 0.3330538 0.161837ABI2 Abl interactor 2 4246 +/- 313 3508 +/- 132 4833 +/- 237 4953 +/- 337 0.002763 -0.06816 0.778145 0.0315127 0.8189551ABP1 Amiloride binding protein 1 (amine oxidase (copper-containing)) 105 +/- 10 165 +/- 23 154 +/- 17 181 +/- 18 0.021482 0.0527017 0.302632 5.18E-05 0.0770133ACADSB acyl-Coenzyme A dehydrogenase, short/branched chain 1081 +/- 68 908 +/- 83 1155 +/- 57 1004 +/- 111 0.04789 -0.140293 -0.270539 0.1869661 0.2566964ACBD6 acyl-Coenzyme A binding domain containing 6 209 +/- 23 207 +/- 7 290 +/- 25 261 +/- 19 0.001028 -0.936329 -0.377156 0.902757 0.5933015ACD adrenocortical dysplasia homolog (mouse) 445 +/- 5 448 +/- 27 510 +/- 18 519 +/- 24 0.039645 0.9180367 0.77176 0.5878682 0.3935524ACHE acetylcholinesterase (Yt blood group) 247 +/- 28 246 +/- 21 390 +/- 22 370 +/- 26 0.000271 -0.966857 -0.571979 0.6940565 0.4052951ACLY ATP citrate lyase 2336 +/- 139 2016 +/- 72 2429 +/- 110 2221 +/- 46 0.042315 -0.07669 -0.127295 0.1508285 0.192972ACTC actin, alpha, cardiac muscle 84 +/- 15 206 +/- 35 98 +/- 11 212 +/- 35 0.021907 0.0155645 0.029736 0.0980108 0.1657953ACTL6B actin-like 6B 789 +/- 27 810 +/- 60 981 +/- 47 987 +/- 32 0.002024 0.7508105 0.916057 0.5004999 0.4981511ACTN1 actinin, alpha 1 3839 +/- 279 3397 +/- 240 4211 +/- 216 4122 +/- 276 0.032517 -0.258876 -0.804727 0.2014078 0.8719828ACTR10 actin-related protein 10 homolog (S. cerevisiae) 6172 +/- 108 6822 +/- 248 6301 +/- 210 7510 +/- 229 0.046595 0.0483003 0.003988 0.5901922 0.0845271ACVR1C activin A receptor, type IC 504 +/- 117 394 +/- 115 1153 +/- 118 1015 +/- 47 2.67E-05 -0.517474 -0.312178 0.419665 0.2356285ACY1L2 aminoacylase 1-like 2 224 +/- 39 230 +/- 24 450 +/- 41 321 +/- 40 0.001236 0.8951819 -0.050237 0.5937618 0.3209364ADAM23 ADAM metallopeptidase domain 23 502 +/- 63 450 +/- 44 637 +/- 76 595 +/- 48 0.015084 -0.514329 -0.651493 0.243668 0.4382308ADAMTS8 ADAM metallopeptidase with thrombospondin type 1 motif, 8 301 +/- 27 381 +/- 34 411 +/- 34 447 +/- 27 0.033527 0.0930654 0.436453 0.2897654 0.3255868ADCYAP1Radenylate cyclase activating polypeptide 1 (pituitary) receptor type I 142 +/- 22 159 +/- 16 263 +/- 11 230 +/- 39 0.001271 0.5497295 -0.455398 0.3994654 0.5230391ADD3 adducin 3 (gamma) 2311 +/- 330 3058 +/- 364 3069 +/- 265 3733 +/- 91 0.020001 0.1598374 0.054267 0.1569602 0.2721863ADIPOQ adiponectin, C1Q and collagen domain containing 232 +/- 23 224 +/- 30 348 +/- 34 306 +/- 18 0.011454 -0.83889 -0.30877 0.6419291 0.2673007ADIPOR1 adiponectin receptor 1 1312 +/- 71 1217 +/- 68 1418 +/- 80 1497 +/- 61 0.021222 -0.359681 0.452814 0.7762157 0.2931045ADRA1D adrenergic, alpha-1D-, receptor 375 +/- 88 305 +/- 60 626 +/- 89 648 +/- 71 0.0008 -0.527737 0.848975 0.4919625 0.9511084AFF3 AF4/FMR2 family, member 3 128 +/- 17 237 +/- 14 224 +/- 20 358 +/- 44 0.000454 0.0007359 0.034613 0.0013776 0.0003071AFTIPHILINaftiphilin protein 689 +/- 9 552 +/- 54 739 +/- 50 699 +/- 28 0.034714 -0.050685 -0.502967 0.1353892 0.6185892AGPAT1 1-acylglycerol-3-phosphate O-acyltransferase 1 (lysophosphatidic acid acyltransferase, al 3385 +/- 154 3061 +/- 119 3681 +/- 81 3655 +/- 174 0.004437 -0.128538 -0.897533 0.0854121 0.3155426AGTRL1 angiotensin II receptor-like 1 747 +/- 232 1295 +/- 454 1735 +/- 367 2547 +/- 206 0.002059 0.3161342 0.091231 0.7427029 0.2258739AHDC1 AT hook, DNA binding motif, containing 1 339 +/- 26 276 +/- 12 411 +/- 27 349 +/- 35 0.023351 -0.062351 -0.206902 0.0844899 0.430451AK2 adenylate kinase 2 232 +/- 19 205 +/- 13 283 +/- 15 268 +/- 21 0.001205 -0.258729 -0.573395 0.6323663 0.7294777AK5 adenylate kinase 5 1192 +/- 282 777 +/- 131 1479 +/- 76 1553 +/- 208 0.018182 -0.224209 0.751364 0.2526122 0.4765015AKAP1 A kinase (PRKA) anchor protein 1 1834 +/- 110 1934 +/- 117 2107 +/- 94 2316 +/- 204 0.008273 0.5466616 0.389688 0.4308971 0.0718354AKAP8 A kinase (PRKA) anchor protein 8 442 +/- 54 500 +/- 46 573 +/- 28 668 +/- 58 0.00162 0.4311339 0.190676 0.2053949 0.027958AKR1CL2 aldo-keto reductase family 1, member C-like 2 153 +/- 15 135 +/- 24 186 +/- 10 168 +/- 19 0.006243 -0.538217 -0.450109 0.3480839 0.1868468AKT1S1 AKT1 substrate 1 (proline-rich) 1591 +/- 147 1450 +/- 58 1862 +/- 67 1671 +/- 81 0.005553 -0.402899 -0.105151 0.4278656 0.2906017ALDH3A2 aldehyde dehydrogenase 3 family, member A2 891 +/- 72 1013 +/- 70 1099 +/- 68 1247 +/- 102 0.014821 0.2502131 0.26533 0.3635668 0.7900991ALDH5A1 aldehyde dehydrogenase 5 family, member A1 (succinate-semialdehyde dehydrogenase) 2044 +/- 186 2461 +/- 205 2314 +/- 135 2541 +/- 155 0.026427 0.163796 0.299879 0.3742309 0.4976003ALPL alkaline phosphatase, liver/bone/kidney 99 +/- 9 108 +/- 9 142 +/- 11 116 +/- 11 0.029567 0.4960101 -0.13156 0.865689 0.5622892ANAPC10 anaphase promoting complex subunit 10 140 +/- 9 189 +/- 9 212 +/- 8 217 +/- 21 0.001658 0.003833 0.804792 0.0042811 0.1671211
S2-genes differentially expressed across region.xls Page 1

Symbol Description Young CA Aged CA Young DG Aged DG CA v DG CA Y v A DG Y v A CA to PMI DG to PMIANKFY1 ankyrin repeat and FYVE domain containing 1 411 +/- 39 333 +/- 24 438 +/- 14 444 +/- 18 0.021417 -0.126179 0.816911 0.1019464 0.3766156ANKMY2 ankyrin repeat and MYND domain containing 2 3980 +/- 219 3697 +/- 250 4113 +/- 165 4265 +/- 127 0.033575 -0.413618 0.48654 0.2056545 0.6121396ANKRD11 ankyrin repeat domain 11 147 +/- 24 240 +/- 28 262 +/- 22 250 +/- 72 0.044845 0.0307121 -0.879094 0.0139103 0.3395989ANKRD13Bankyrin repeat domain 13B 672 +/- 70 607 +/- 28 807 +/- 53 826 +/- 80 0.019989 -0.414871 0.850495 0.4833244 0.1845796ANKRD23 ankyrin repeat domain 23 382 +/- 37 460 +/- 36 555 +/- 43 493 +/- 41 0.017891 0.1611868 -0.322199 0.0418279 0.7286784ANKRD29 ankyrin repeat domain 29 698 +/- 63 868 +/- 91 1108 +/- 49 1287 +/- 104 6.44E-06 0.1609981 0.173041 0.2651558 0.3558069ANKRD34 ankyrin repeat domain 34 1681 +/- 72 1443 +/- 63 1781 +/- 88 1714 +/- 34 0.039068 -0.031915 -0.501221 0.0025436 0.8755633ANKRD43 ankyrin repeat domain 43 1626 +/- 115 1329 +/- 135 1930 +/- 112 1590 +/- 92 0.041881 -0.125069 -0.044003 0.1207345 0.1464073ANXA11 annexin A11 2586 +/- 271 2346 +/- 337 4026 +/- 210 4033 +/- 163 1.96E-05 -0.592439 0.980271 0.4934545 0.6586726AOF1 amine oxidase (flavin containing) domain 1 169 +/- 18 130 +/- 10 243 +/- 18 242 +/- 16 0.000487 -0.096114 -0.979838 0.095309 0.4089211AP1G1 adaptor-related protein complex 1, gamma 1 subunit 998 +/- 57 879 +/- 39 1020 +/- 43 1094 +/- 57 0.037127 -0.12403 0.3245 0.1385012 0.3912204AP1G2 adaptor-related protein complex 1, gamma 2 subunit 408 +/- 27 425 +/- 41 631 +/- 65 604 +/- 42 0.000529 0.7400845 -0.734539 0.7774056 0.9823444AP2A1 adaptor-related protein complex 2, alpha 1 subunit 783 +/- 97 744 +/- 70 1165 +/- 64 1129 +/- 66 0.000548 -0.74769 -0.704203 0.5428389 0.6002089AP2A2 adaptor-related protein complex 2, alpha 2 subunit 2448 +/- 81 2854 +/- 170 2751 +/- 48 3195 +/- 203 0.001975 0.0671658 0.093842 0.4204682 0.3764182AP3B2 adaptor-related protein complex 3, beta 2 subunit 2564 +/- 199 2544 +/- 202 2734 +/- 85 3030 +/- 117 0.025402 -0.944737 0.07538 0.4439021 0.2170597AP4S1 adaptor-related protein complex 4, sigma 1 subunit 336 +/- 50 195 +/- 7 440 +/- 40 279 +/- 34 0.006951 -0.035594 -0.012958 0.0223472 0.0475868APBA2BP amyloid beta (A4) precursor protein-binding, family A, member 2 binding protein 249 +/- 22 279 +/- 31 447 +/- 30 429 +/- 26 0.000693 0.4430347 -0.659582 0.9747118 0.5733366APCDD1 adenomatosis polyposis coli down-regulated 1 2086 +/- 164 2327 +/- 131 2605 +/- 98 2804 +/- 143 0.000106 0.2778884 0.287828 0.3922611 0.4336873APH1A anterior pharynx defective 1 homolog A (C. elegans) 223 +/- 32 209 +/- 27 309 +/- 20 337 +/- 59 0.013161 -0.74851 0.669645 0.5503959 0.8284411API5 apoptosis inhibitor 5 1659 +/- 24 1825 +/- 54 1812 +/- 42 1906 +/- 76 0.037835 0.0265735 0.322472 0.0189811 0.0551939APIP APAF1 interacting protein 342 +/- 22 396 +/- 23 428 +/- 26 427 +/- 27 0.039992 0.1232617 -0.987226 0.0717332 0.9139034APLP2 Amyloid beta (A4) precursor-like protein 2 397 +/- 24 319 +/- 21 448 +/- 28 403 +/- 22 0.010772 -0.037329 -0.240439 0.077951 0.5159072APRIN androgen-induced proliferation inhibitor 2075 +/- 34 1723 +/- 57 2125 +/- 61 1961 +/- 40 0.027176 -0.000695 -0.054459 7.079E-06 0.033862ARF5 ADP-ribosylation factor 5 2506 +/- 85 2334 +/- 218 2867 +/- 103 3044 +/- 177 0.000129 -0.487833 0.418757 0.0661736 0.6368668ARHGAP28Rho GTPase activating protein 28 120 +/- 6 123 +/- 16 146 +/- 9 142 +/- 13 0.004923 0.844647 -0.82487 0.7439749 0.6618588ARHGAP5 Rho GTPase activating protein 5 2457 +/- 65 2709 +/- 129 2871 +/- 96 3130 +/- 126 0.000148 0.1239275 0.140657 0.3775916 0.7391119ARHGDIA Rho GDP dissociation inhibitor (GDI) alpha 1206 +/- 41 1174 +/- 74 1423 +/- 42 1527 +/- 50 0.000727 -0.712096 0.145065 0.2967029 0.3901063ARHGEF11Rho guanine nucleotide exchange factor (GEF) 11 658 +/- 70 564 +/- 45 969 +/- 43 769 +/- 57 0.000579 -0.290212 -0.023698 0.2544702 0.0498946ARHGEF4 Rho guanine nucleotide exchange factor (GEF) 4 357 +/- 44 396 +/- 44 544 +/- 38 584 +/- 28 0.00026 0.5440807 0.415946 0.6376248 0.4753666ARHGEF9 Cdc42 guanine nucleotide exchange factor (GEF) 9 7240 +/- 569 6125 +/- 451 8090 +/- 208 7683 +/- 152 0.005476 -0.157349 -0.148485 0.1078374 0.2790658ARID1A AT rich interactive domain 1A (SWI- like) 2884 +/- 31 3123 +/- 159 3720 +/- 77 3607 +/- 106 1.91E-05 0.1960555 -0.410718 0.1496971 0.9241797ARID1B AT rich interactive domain 1B (SWI1-like) 517 +/- 50 742 +/- 58 815 +/- 107 980 +/- 67 0.000873 0.0153366 0.224649 0.1181921 0.401326ARL16 ADP-ribosylation factor-like 16 257 +/- 44 228 +/- 17 301 +/- 34 294 +/- 29 0.026097 -0.563512 -0.872004 0.426811 0.8893289ARL2BP ADP-ribosylation factor-like 2 binding protein 993 +/- 81 1080 +/- 91 1206 +/- 39 1294 +/- 58 0.004021 0.4925035 0.250814 0.3229259 0.0634048ARL3 ADP-ribosylation factor-like 3 1333 +/- 68 1158 +/- 83 1687 +/- 85 1504 +/- 42 0.00067 -0.13414 -0.092918 0.050519 0.2444836ARL5A ADP-ribosylation factor-like 5A 486 +/- 29 436 +/- 13 580 +/- 35 497 +/- 28 0.000409 -0.161788 -0.094801 0.0572492 0.0387886ARL6 ADP-ribosylation factor-like 6 281 +/- 26 222 +/- 15 332 +/- 29 308 +/- 39 0.031421 -0.086062 -0.640371 0.2411581 0.7018738ARL8A ADP-ribosylation factor-like 8A 508 +/- 44 550 +/- 48 703 +/- 29 609 +/- 35 0.002964 0.5347678 -0.073656 0.4696596 0.0959133ARMC5 armadillo repeat containing 5 470 +/- 32 534 +/- 18 557 +/- 18 573 +/- 20 0.007836 0.1212344 0.55613 0.0882489 0.4560272ARNTL2 aryl hydrocarbon receptor nuclear translocator-like 2 97 +/- 9 122 +/- 10 161 +/- 21 211 +/- 17 0.000537 0.0902796 0.100973 0.2192966 0.0874126ARPC4 actin related protein 2/3 complex, subunit 4, 20kDa 426 +/- 90 601 +/- 106 668 +/- 134 761 +/- 120 0.004356 0.2392811 0.616102 0.09266 0.2413576ARPP-21 cyclic AMP-regulated phosphoprotein, 21 kD 224 +/- 24 296 +/- 23 275 +/- 24 340 +/- 21 0.029844 0.0558941 0.071046 0.1586405 0.0442336ARS2 ARS2 protein 131 +/- 21 120 +/- 22 196 +/- 25 179 +/- 18 0.047929 -0.730739 -0.588868 0.8098916 0.6827881AS3MT arsenic (+3 oxidation state) methyltransferase 275 +/- 16 260 +/- 13 335 +/- 16 321 +/- 5 0.000133 -0.466809 -0.404534 0.6779068 0.4678598ASB6 ankyrin repeat and SOCS box-containing 6 176 +/- 8 150 +/- 8 238 +/- 19 208 +/- 4 6.79E-05 -0.052557 -0.185877 0.1854066 0.3284327
S2-genes differentially expressed across region.xls Page 2

Symbol Description Young CA Aged CA Young DG Aged DG CA v DG CA Y v A DG Y v A CA to PMI DG to PMIASPH aspartate beta-hydroxylase 294 +/- 56 432 +/- 58 456 +/- 44 635 +/- 89 0.000322 0.1194833 0.122998 0.3048759 0.3573241ASPHD2 aspartate beta-hydroxylase domain containing 2 919 +/- 80 730 +/- 79 1141 +/- 46 992 +/- 32 0.002157 -0.122917 -0.027085 0.0684548 0.0557951ASTN2 Astrotactin 2 149 +/- 10 185 +/- 27 178 +/- 20 260 +/- 21 0.037549 0.2540618 0.021935 0.4993867 0.2857922ATF2 activating transcription factor 2 294 +/- 27 312 +/- 27 407 +/- 29 463 +/- 35 0.001418 0.6380896 0.254474 0.8619435 0.9481229ATG4B ATG4 autophagy related 4 homolog B (S. cerevisiae) 489 +/- 25 632 +/- 27 517 +/- 23 734 +/- 11 0.023955 0.0030799 5.64E-05 0.0439593 0.0065325ATP1B1 ATPase, Na+/K+ transporting, beta 1 polypeptide 16024 +/- 756 14419 +/- 558 16669 +/- 305 16773 +/- 630 0.011541 -0.121283 0.886514 0.0637325 0.4483327ATP1B2 ATPase, Na+/K+ transporting, beta 2 polypeptide 2211 +/- 353 1622 +/- 108 3541 +/- 507 2379 +/- 126 1.21E-05 -0.162072 -0.070906 0.3327971 0.2195488ATP5D ATP synthase, H+ transporting, mitochondrial F1 complex, delta subunit 1719 +/- 90 1425 +/- 89 2012 +/- 103 1836 +/- 84 0.000518 -0.042683 -0.215555 0.1947563 0.6087121ATP5J ATP synthase, H+ transporting, mitochondrial F0 complex, subunit F6 1190 +/- 81 1279 +/- 83 1365 +/- 104 1473 +/- 52 0.020777 0.4571621 0.380695 0.7932993 0.4209813ATP6V0A1 ATPase, H+ transporting, lysosomal V0 subunit a1 1437 +/- 216 1172 +/- 163 2027 +/- 135 2029 +/- 122 0.001694 -0.351797 0.991517 0.3783119 0.9022873ATP6V0C Homo sapiens, clone IMAGE:5500209, mRNA 190 +/- 15 205 +/- 25 273 +/- 24 251 +/- 30 0.021063 0.6160935 -0.583558 0.783347 0.540117ATP6V0E2 ATPase, H+ transporting V0 subunit E2-like (rat) 8864 +/- 439 7917 +/- 479 10765 +/- 390 11364 +/- 442 3.58E-05 -0.17568 0.336823 0.102467 0.5368466ATP6V1A ATPase, H+ transporting, lysosomal 70kDa, V1 subunit A 6850 +/- 355 6520 +/- 371 7663 +/- 310 7712 +/- 397 6.03E-05 -0.535105 0.923551 0.1879775 0.5609475ATP8B2 ATPase, Class I, type 8B, member 2 1260 +/- 36 1102 +/- 43 1508 +/- 74 1279 +/- 39 0.000662 -0.018718 -0.027391 0.0716008 0.1292793ATPIF1 ATPase inhibitory factor 1 1235 +/- 44 1173 +/- 19 1343 +/- 67 1274 +/- 57 0.035568 -0.230525 -0.456891 0.3872839 0.8454393ATXN7L1 ataxin 7-like 1 462 +/- 25 555 +/- 22 612 +/- 31 626 +/- 34 0.003912 0.0190188 0.771269 0.0840158 0.431721AUH AU RNA binding protein/enoyl-Coenzyme A hydratase 1067 +/- 86 1010 +/- 43 1076 +/- 20 1120 +/- 56 0.001395 -0.572988 0.489241 0.5370059 0.9428233AUP1 ancient ubiquitous protein 1 1882 +/- 51 1935 +/- 42 1952 +/- 46 2088 +/- 56 0.002488 0.4357029 0.096496 0.2888487 0.0663254B3GALNT1UDP-GalNAc:betaGlcNAc beta 1,3-galactosaminyltransferase, polypeptide 1 (Globoside b 1088 +/- 64 964 +/- 77 1325 +/- 116 1134 +/- 81 0.024793 -0.243063 -0.210777 0.1477903 0.0797626B3GNT4 UDP-GlcNAc:betaGal beta-1,3-N-acetylglucosaminyltransferase 4 355 +/- 36 310 +/- 36 516 +/- 29 517 +/- 17 9.93E-06 -0.400114 0.95899 0.2660171 0.6913465B3GNTL1 UDP-GlcNAc:betaGal beta-1,3-N-acetylglucosaminyltransferase-like 1 215 +/- 11 174 +/- 8 238 +/- 21 202 +/- 7 0.016043 -0.011299 -0.156849 0.0343221 0.3937487B4GALNT1beta-1,4-N-acetyl-galactosaminyl transferase 1 823 +/- 133 661 +/- 89 961 +/- 50 984 +/- 51 0.014772 -0.339789 0.749304 0.2584943 0.816825B4GALNT4beta-1,4-N-acetyl-galactosaminyl transferase 4 304 +/- 26 292 +/- 36 553 +/- 22 559 +/- 48 1.53E-06 -0.797378 0.913627 0.2124745 0.5069836B4GALT6 UDP-Gal:betaGlcNAc beta 1,4- galactosyltransferase, polypeptide 6 3702 +/- 250 3117 +/- 295 4186 +/- 123 4025 +/- 189 0.002035 -0.16124 -0.498299 0.1132214 0.2258758BAG1 BCL2-associated athanogene 642 +/- 54 817 +/- 54 829 +/- 57 905 +/- 31 0.029825 0.0459185 0.271393 0.2549285 0.394043BAI1 brain-specific angiogenesis inhibitor 1 410 +/- 32 348 +/- 39 566 +/- 28 470 +/- 36 0.000411 -0.249366 -0.071541 0.0436578 0.0544465BAIAP2L2 BAI1-associated protein 2-like 2 398 +/- 24 459 +/- 32 514 +/- 48 575 +/- 36 0.000532 0.1596491 0.330204 0.2301458 0.2857937BASP1 brain abundant, membrane attached signal protein 1 21373 +/- 964 19251 +/- 1027 23568 +/- 675 24329 +/- 669 0.000747 -0.162978 0.444189 0.0563427 0.9034569BAT3 HLA-B associated transcript 3 2559 +/- 103 2642 +/- 81 2825 +/- 91 2890 +/- 81 0.016473 0.5371019 0.607559 0.6693524 0.8267535BBS1 Bardet-Biedl syndrome 1 113 +/- 24 85 +/- 11 152 +/- 16 143 +/- 12 0.013695 -0.341177 -0.678375 0.2367785 0.3067299BCAT1 branched chain aminotransferase 1, cytosolic 167 +/- 14 163 +/- 20 234 +/- 24 247 +/- 8 0.003387 -0.859226 0.649539 0.7129766 0.6276384BCL10 B-cell CLL/lymphoma 10 367 +/- 32 332 +/- 22 459 +/- 20 380 +/- 15 0.010289 -0.395955 -0.011414 0.3654709 0.0460348BCL7A B-cell CLL/lymphoma 7A 1042 +/- 53 931 +/- 51 1372 +/- 79 1245 +/- 71 0.000271 -0.160016 -0.262591 0.0222234 0.5541953BCL9L B-cell CLL/lymphoma 9-like 590 +/- 55 534 +/- 38 851 +/- 35 651 +/- 50 0.002662 -0.417435 -0.012774 0.3931402 0.0874792BCORL1 BCL6 co-repressor-like 1 389 +/- 27 443 +/- 24 433 +/- 27 482 +/- 12 0.005365 0.165648 0.148061 0.2334638 0.1158968BEX1 brain expressed, X-linked 1 15228 +/- 640 14475 +/- 323 16692 +/- 1062 15384 +/- 600 0.01875 -0.326958 -0.316014 0.3896235 0.5326835BEXL1 brain expressed X-linked-like 1 12212 +/- 540 11531 +/- 649 13679 +/- 351 14275 +/- 318 0.000607 -0.439546 0.24007 0.0828828 0.8279986BHLHB3 basic helix-loop-helix domain containing, class B, 3 119 +/- 21 160 +/- 29 214 +/- 15 265 +/- 31 0.000743 0.2717205 0.183697 0.1479952 0.3265801BHLHB5 basic helix-loop-helix domain containing, class B, 5 117 +/- 38 78 +/- 27 238 +/- 21 192 +/- 35 0.000537 -0.434633 -0.29279 0.5262515 0.5144178BHLHB8 Basic helix-loop-helix domain containing, class B, 8 143 +/- 16 125 +/- 35 174 +/- 12 164 +/- 19 0.043961 -0.658563 -0.667069 0.4724671 0.2276161BHLHB9 basic helix-loop-helix domain containing, class B, 9 1246 +/- 54 1079 +/- 55 1348 +/- 40 1378 +/- 74 0.00898 -0.054366 0.738951 0.0366155 0.1918358BICC1 Bicaudal C homolog 1 (Drosophila) 484 +/- 64 390 +/- 42 763 +/- 49 466 +/- 75 0.010564 -0.249579 -0.012458 0.4693602 0.1136697BID BH3 interacting domain death agonist 393 +/- 40 414 +/- 40 567 +/- 35 557 +/- 15 5.36E-05 0.7185824 -0.807205 0.9766086 0.4356621BIRC6 baculoviral IAP repeat-containing 6 (apollon) 348 +/- 15 458 +/- 21 431 +/- 7 524 +/- 30 4.21E-05 0.0020667 0.034166 0.000872 0.0185995BLOC1S1 biogenesis of lysosome-related organelles complex-1, subunit 1 2581 +/- 187 2677 +/- 93 3051 +/- 286 2823 +/- 198 0.028279 0.6585796 -0.529075 0.6067355 0.8023716
S2-genes differentially expressed across region.xls Page 3

Symbol Description Young CA Aged CA Young DG Aged DG CA v DG CA Y v A DG Y v A CA to PMI DG to PMIBNIP3 BCL2/adenovirus E1B 19kDa interacting protein 3 2942 +/- 368 2074 +/- 55 3533 +/- 262 3525 +/- 283 0.009231 -0.065053 -0.984991 0.1002062 0.7394053BOP1 block of proliferation 1 292 +/- 18 210 +/- 26 357 +/- 15 258 +/- 9 0.005846 -0.026404 -0.000564 0.0936834 0.0022434BPY2IP1 BPY2 interacting protein 1 1258 +/- 80 1088 +/- 56 1546 +/- 83 1454 +/- 64 0.000386 -0.115916 -0.403279 0.1065485 0.9397104BRCC3 BRCA1/BRCA2-containing complex, subunit 3 122 +/- 3 144 +/- 12 177 +/- 11 201 +/- 28 0.002541 0.138862 0.462484 0.0068226 0.2287188BRD2 bromodomain containing 2 683 +/- 52 469 +/- 53 945 +/- 41 572 +/- 72 0.004681 -0.016525 -0.003474 0.2800474 0.0970544BRD4 bromodomain containing 4 1364 +/- 60 1532 +/- 76 1613 +/- 77 1817 +/- 168 0.002429 0.113258 0.314125 0.0282218 0.0337512BRP44 brain protein 44 2917 +/- 183 3180 +/- 167 3323 +/- 135 3325 +/- 141 0.001797 0.313945 0.992651 0.3514422 0.9447145BRSK1 BR serine/threonine kinase 1 5242 +/- 394 5795 +/- 357 6191 +/- 224 6220 +/- 270 0.022998 0.3228068 0.936685 0.5132612 0.8895316BRUNOL4 bruno-like 4, RNA binding protein (Drosophila) 529 +/- 80 495 +/- 78 707 +/- 49 713 +/- 69 0.012868 -0.770154 0.947456 0.7203313 0.9861663BRUNOL5 bruno-like 5, RNA binding protein (Drosophila) 5949 +/- 259 5064 +/- 363 6861 +/- 189 6748 +/- 300 0.003164 -0.078252 -0.760875 0.0320415 0.8382862BTBD9 BTB (POZ) domain containing 9 986 +/- 112 775 +/- 85 1434 +/- 60 1243 +/- 125 0.000221 -0.167701 -0.21918 0.3738754 0.4306061BTG1 B-cell translocation gene 1, anti-proliferative 613 +/- 93 775 +/- 199 1509 +/- 170 1482 +/- 63 0.000824 0.4863909 -0.888423 0.7197071 0.845833BTRC beta-transducin repeat containing 373 +/- 15 369 +/- 16 437 +/- 36 454 +/- 23 0.008498 -0.85504 0.70077 0.7733985 0.4187493C1QTNF4 C1q and tumor necrosis factor related protein 4 1896 +/- 138 1558 +/- 136 2524 +/- 162 2239 +/- 97 0.000368 -0.112224 -0.168387 0.1473202 0.4586117C4A complement component 4A (Rodgers blood group) 692 +/- 140 453 +/- 51 820 +/- 173 604 +/- 82 0.035302 -0.157983 -0.297159 0.2052612 0.4115422CA10 carbonic anhydrase X 1854 +/- 361 1852 +/- 301 4062 +/- 174 3455 +/- 172 3.99E-05 -0.996745 -0.035214 0.9563537 0.1060229CA4 carbonic anhydrase IV 614 +/- 77 577 +/- 69 979 +/- 67 927 +/- 74 0.000362 -0.727668 -0.616974 0.5360975 0.2270823CACNA1A calcium channel, voltage-dependent, P/Q type, alpha 1A subunit 961 +/- 89 664 +/- 44 1617 +/- 110 993 +/- 119 0.000194 -0.018645 -0.004193 0.0747641 0.1216223CACNA1B calcium channel, voltage-dependent, L type, alpha 1B subunit 1982 +/- 101 1808 +/- 172 2242 +/- 49 2084 +/- 149 0.029899 -0.407625 -0.362213 0.0742244 0.5244628CACNA1C Calcium channel, voltage-dependent, L type, alpha 1C subunit 230 +/- 30 267 +/- 24 443 +/- 36 377 +/- 27 0.001409 0.3637032 -0.174917 0.5685678 0.2007988CACNA1D calcium channel, voltage-dependent, L type, alpha 1D subunit 275 +/- 14 241 +/- 31 393 +/- 22 346 +/- 16 0.000482 -0.345133 -0.120709 0.2080854 0.3728838CACNB1 calcium channel, voltage-dependent, beta 1 subunit 1084 +/- 79 825 +/- 44 1214 +/- 70 1044 +/- 36 0.009523 -0.021979 -0.065895 0.0056008 0.145536CACNB2 calcium channel, voltage-dependent, beta 2 subunit 715 +/- 48 653 +/- 54 799 +/- 59 786 +/- 48 0.029995 -0.416033 -0.86656 0.1161396 0.2420466CACNG2 calcium channel, voltage-dependent, gamma subunit 2 437 +/- 87 573 +/- 89 862 +/- 54 1025 +/- 88 3.41E-05 0.3000925 0.15818 0.3928038 0.5968357CADPS Ca2+-dependent secretion activator 840 +/- 160 689 +/- 115 1049 +/- 81 1151 +/- 113 0.002395 -0.461221 0.484948 0.2912296 0.5434116CALCOCO calcium binding and coiled-coil domain 2 135 +/- 14 182 +/- 16 231 +/- 15 267 +/- 26 0.000718 0.0542604 0.274321 0.0064576 0.2571646CALD1 caldesmon 1 84 +/- 6 130 +/- 15 132 +/- 8 136 +/- 6 0.005626 0.0251705 0.710226 0.0022 0.752043CALM1 calmodulin 1 (phosphorylase kinase, delta) 19009 +/- 992 17370 +/- 903 20650 +/- 696 20727 +/- 744 0.007508 -0.249949 0.940973 0.1815429 0.9189091CALM3 calmodulin 3 (phosphorylase kinase, delta) 16267 +/- 1508 13584 +/- 984 17973 +/- 885 18301 +/- 521 0.003687 -0.172039 0.757292 0.0933515 0.8406487CALU calumenin 1229 +/- 91 1066 +/- 40 1331 +/- 57 1230 +/- 23 0.010395 -0.146633 -0.145997 0.0906051 0.3096159CAMK1D calcium/calmodulin-dependent protein kinase ID 5742 +/- 860 4749 +/- 865 8971 +/- 946 7264 +/- 308 0.000192 -0.43445 -0.136781 0.4668444 0.322584CAMK2A calcium/calmodulin-dependent protein kinase (CaM kinase) II alpha 1142 +/- 306 753 +/- 139 2093 +/- 147 1714 +/- 114 0.002798 -0.285894 -0.072636 0.2766242 0.1630859CAMK2B calcium/calmodulin-dependent protein kinase (CaM kinase) II beta 8378 +/- 995 6517 +/- 684 9930 +/- 446 9486 +/- 334 0.002314 -0.158147 -0.446286 0.1291989 0.3175824CAMK2N1 calcium/calmodulin-dependent protein kinase II inhibitor 1 1334 +/- 217 1125 +/- 205 2983 +/- 242 2989 +/- 145 8.05E-07 -0.500331 0.983502 0.2788314 0.7905494CAMK2N2 calcium/calmodulin-dependent protein kinase II inhibitor 2 223 +/- 16 232 +/- 28 458 +/- 21 427 +/- 32 9.77E-06 0.7862696 -0.443863 0.860843 0.0652476CAPN14 calpain 14 515 +/- 142 457 +/- 103 1121 +/- 120 810 +/- 208 0.004505 -0.745406 -0.238602 0.906264 0.7542111CAPN7 calpain 7 580 +/- 29 674 +/- 27 693 +/- 37 800 +/- 39 0.004627 0.039422 0.081336 0.0466246 0.266771CARF collaborates/cooperates with ARF (alternate reading frame) protein 269 +/- 10 254 +/- 13 331 +/- 17 273 +/- 18 0.037888 -0.405664 -0.042435 0.9848762 0.2328383CARM1 coactivator-associated arginine methyltransferase 1 1526 +/- 57 1475 +/- 97 2331 +/- 125 2415 +/- 71 1.31E-06 -0.662596 0.577205 0.5637708 0.3021402CASD1 CAS1 domain containing 1 1631 +/- 123 1528 +/- 125 1808 +/- 82 1784 +/- 126 0.000249 -0.569272 -0.87929 0.8673704 0.6750259CAST1 CAZ-associated structural protein 3281 +/- 360 2648 +/- 269 4391 +/- 181 3526 +/- 194 0.000442 -0.19195 -0.010196 0.208326 0.0276119CATSPER2Cation channel, sperm associated 2 1251 +/- 192 1531 +/- 138 1696 +/- 132 1731 +/- 115 0.024856 0.2654922 0.844114 0.4829183 0.6128966CBFA2T3 core-binding factor, runt domain, alpha subunit 2; translocated to, 3 270 +/- 31 270 +/- 34 456 +/- 32 421 +/- 33 0.001795 -0.99537 -0.466516 0.7951848 0.74031CBLL1 Cas-Br-M (murine) ecotropic retroviral transforming sequence-like 1 113 +/- 15 138 +/- 11 160 +/- 9 149 +/- 13 0.023467 0.2033422 -0.535853 0.3451051 0.7470143CBX3 chromobox homolog 3 (HP1 gamma homolog, Drosophila) 2091 +/- 138 2460 +/- 88 2478 +/- 74 2807 +/- 90 0.000466 0.0528484 0.021609 0.0976501 0.0574181
S2-genes differentially expressed across region.xls Page 4

Symbol Description Young CA Aged CA Young DG Aged DG CA v DG CA Y v A DG Y v A CA to PMI DG to PMICCBL1 cysteine conjugate-beta lyase; cytoplasmic (glutamine transaminase K, kyneurenine amin 94 +/- 15 147 +/- 21 187 +/- 29 204 +/- 29 0.003461 0.0726369 0.690722 0.0218178 0.2362619CCDC104 coiled-coil domain containing 104 1930 +/- 93 1980 +/- 89 2238 +/- 65 2306 +/- 52 0.004092 0.7036113 0.430708 0.6125537 0.4844624CCDC106 coiled-coil domain containing 106 825 +/- 51 823 +/- 38 996 +/- 13 1076 +/- 33 0.000201 -0.974663 0.069488 0.569547 0.1544263CCDC109Acoiled-coil domain containing 109A 569 +/- 44 445 +/- 19 621 +/- 31 560 +/- 29 0.009885 -0.036178 -0.189661 0.0297814 0.12063CCDC22 coiled-coil domain containing 22 256 +/- 15 289 +/- 14 333 +/- 6 355 +/- 28 0.000165 0.1451373 0.480868 0.0343588 0.2142034CCDC46 coiled-coil domain containing 46 98 +/- 13 159 +/- 31 208 +/- 13 282 +/- 17 0.000554 0.1194535 0.009056 0.2527666 0.1569679CCDC47 coiled-coil domain containing 47 1332 +/- 119 1261 +/- 75 1649 +/- 62 1703 +/- 40 3.6E-05 -0.628113 0.485883 0.9270622 0.4524718CCDC53 coiled-coil domain containing 53 2279 +/- 84 2070 +/- 45 2483 +/- 66 2361 +/- 61 0.000809 -0.061328 -0.207288 0.2132139 0.2471815CCDC62 coiled-coil domain containing 62 202 +/- 10 192 +/- 24 255 +/- 15 220 +/- 13 0.022727 -0.723421 -0.110854 0.5350947 0.1017136CCDC64 coiled-coil domain containing 64 303 +/- 11 246 +/- 29 415 +/- 24 310 +/- 41 0.000978 -0.113729 -0.065624 0.0106806 0.0841138CCDC71 coiled-coil domain containing 71 186 +/- 16 185 +/- 18 261 +/- 10 233 +/- 16 0.000646 -0.959453 -0.190742 0.9001207 0.5420564CCDC73 Coiled-coil domain containing 73 148 +/- 13 193 +/- 19 208 +/- 24 243 +/- 22 0.000349 0.0771419 0.31368 0.4759757 0.9971332CCDC74A coiled-coil domain containing 74A 613 +/- 51 646 +/- 93 640 +/- 36 1150 +/- 118 0.030966 0.7647319 0.010155 0.4369118 0.0075341CCDC85A coiled-coil domain containing 85A 92 +/- 15 41 +/- 10 189 +/- 13 169 +/- 26 9.68E-05 -0.0203 -0.516734 0.0450543 0.794482CCDC95 coiled-coil domain containing 95 936 +/- 37 859 +/- 28 1082 +/- 28 950 +/- 21 0.002123 -0.12682 -0.004763 0.0487537 0.0046589CCNF cyclin F 133 +/- 13 125 +/- 9 143 +/- 17 196 +/- 13 0.025337 -0.623944 0.034926 0.3664781 0.1488046CCNJL cyclin J-like 140 +/- 28 97 +/- 14 231 +/- 18 221 +/- 17 2.83E-05 -0.205966 -0.696316 0.542244 0.7534013CCNK cyclin K 94 +/- 9 83 +/- 7 112 +/- 8 118 +/- 5 0.012638 -0.358048 0.519178 0.7239941 0.3823066CD109 CD109 molecule 328 +/- 25 296 +/- 14 469 +/- 45 429 +/- 37 0.000521 -0.285965 -0.513863 0.3022911 0.5978264CD44 CD44 molecule (Indian blood group) 390 +/- 49 579 +/- 97 642 +/- 74 919 +/- 44 0.000529 0.1243777 0.012964 0.2130658 0.0386421CDC2L5 cell division cycle 2-like 5 (cholinesterase-related cell division controller) 154 +/- 15 189 +/- 18 254 +/- 19 238 +/- 25 0.00237 0.1611339 -0.614223 0.1396571 0.9833535CDC42EP3CDC42 effector protein (Rho GTPase binding) 3 542 +/- 27 709 +/- 197 1566 +/- 202 1280 +/- 118 0.002988 0.4375089 -0.258786 0.920361 0.6431995CDC42EP4CDC42 effector protein (Rho GTPase binding) 4 1927 +/- 191 2266 +/- 191 2361 +/- 146 2592 +/- 76 0.003363 0.2373062 0.200284 0.2947706 0.5421832CDH2 cadherin 2, type 1, N-cadherin (neuronal) 810 +/- 57 761 +/- 34 909 +/- 44 800 +/- 28 0.042697 -0.480515 -0.067522 0.350174 0.0352823CDK10 cyclin-dependent kinase (CDC2-like) 10 317 +/- 23 260 +/- 21 376 +/- 30 300 +/- 29 0.0455 -0.098302 -0.099045 0.0284414 0.1408962CDK5R1 cyclin-dependent kinase 5, regulatory subunit 1 (p35) 3649 +/- 206 3034 +/- 85 4001 +/- 116 3504 +/- 169 0.04031 -0.029702 -0.043974 0.0157937 0.3073854CDS2 CDP-diacylglycerol synthase (phosphatidate cytidylyltransferase) 2 268 +/- 25 253 +/- 20 315 +/- 30 357 +/- 19 0.020849 -0.643399 0.255582 0.5062351 0.5768903CEBPD CCAAT/enhancer binding protein (C/EBP), delta 935 +/- 162 910 +/- 202 1864 +/- 174 1819 +/- 146 0.000387 -0.924942 -0.846859 0.9948041 0.8402012CEBPZ CCAAT/enhancer binding protein zeta 199 +/- 29 139 +/- 16 273 +/- 28 215 +/- 25 0.000421 -0.109977 -0.150503 0.1083294 0.3433929CECR2 cat eye syndrome chromosome region, candidate 2 185 +/- 10 254 +/- 43 502 +/- 51 532 +/- 21 2.89E-05 0.1727411 0.607575 0.1698566 0.4379265CENTB2 centaurin, beta 2 1858 +/- 361 1644 +/- 455 3924 +/- 776 2263 +/- 292 0.003896 -0.721737 -0.089417 0.7361791 0.1530143CENTB5 centaurin, beta 5 1430 +/- 52 1228 +/- 84 1951 +/- 111 1836 +/- 122 0.000185 -0.074093 -0.504068 0.0713182 0.8265509CEP57 centrosomal protein 57kDa 423 +/- 44 326 +/- 24 490 +/- 24 410 +/- 42 0.016229 -0.088678 -0.143011 0.0644437 0.1963139CEP68 centrosomal protein 68kDa 351 +/- 53 275 +/- 40 468 +/- 35 417 +/- 34 0.002646 -0.278426 -0.330937 0.4806711 0.9132289CERK ceramide kinase 696 +/- 53 650 +/- 54 784 +/- 35 782 +/- 38 0.014076 -0.562579 -0.967478 0.3109122 0.3681514CFI complement factor I 194 +/- 21 157 +/- 16 215 +/- 13 209 +/- 24 0.04605 -0.18989 -0.832641 0.3000795 0.9297855CGI-69 CGI-69 protein 557 +/- 15 587 +/- 32 593 +/- 25 620 +/- 38 0.025048 0.432272 0.560359 0.9092316 0.9988542CHAC1 ChaC, cation transport regulator-like 1 (E. coli) 407 +/- 29 288 +/- 46 453 +/- 22 383 +/- 54 0.03788 -0.057374 -0.280775 0.0015119 0.0879659CHAC2 ChaC, cation transport regulator-like 2 (E. coli) 224 +/- 21 268 +/- 12 317 +/- 26 293 +/- 30 0.020588 0.1038168 -0.565578 0.0669849 0.3067155CHCHD3 coiled-coil-helix-coiled-coil-helix domain containing 3 2026 +/- 56 2199 +/- 30 2231 +/- 90 2360 +/- 104 0.004669 0.0263417 0.377636 0.0127559 0.5219367CHCHD6 coiled-coil-helix-coiled-coil-helix domain containing 6 1282 +/- 127 1172 +/- 74 1401 +/- 55 1444 +/- 71 0.017171 -0.472891 0.649748 0.3828076 0.7174202CHD9 chromodomain helicase DNA binding protein 9 223 +/- 26 284 +/- 14 310 +/- 19 323 +/- 28 0.00303 0.0745458 0.708413 0.0921462 0.2791218CHGA chromogranin A (parathyroid secretory protein 1) 1586 +/- 138 1605 +/- 137 2124 +/- 206 1846 +/- 125 0.00198 0.9243539 -0.282052 0.9940694 0.4290749CHKA choline kinase alpha 607 +/- 41 586 +/- 44 764 +/- 36 646 +/- 32 0.030471 -0.738949 -0.035292 0.8615465 0.0564405CHST1 carbohydrate (keratan sulfate Gal-6) sulfotransferase 1 6002 +/- 405 5582 +/- 554 8515 +/- 319 8492 +/- 398 5.29E-07 -0.555316 -0.966527 0.2428978 0.4775345
S2-genes differentially expressed across region.xls Page 5

Symbol Description Young CA Aged CA Young DG Aged DG CA v DG CA Y v A DG Y v A CA to PMI DG to PMICHST12 carbohydrate (chondroitin 4) sulfotransferase 12 604 +/- 59 580 +/- 36 767 +/- 25 729 +/- 34 0.000345 -0.744886 -0.38913 0.9187087 0.961015CHST7 carbohydrate (N-acetylglucosamine 6-O) sulfotransferase 7 268 +/- 17 266 +/- 8 379 +/- 11 384 +/- 14 4.28E-07 -0.913632 0.778645 0.588775 0.8120931CIB2 calcium and integrin binding family member 2 601 +/- 121 688 +/- 196 1797 +/- 98 2311 +/- 302 8.72E-07 0.7157727 0.168871 0.71586 0.4907188CIC capicua homolog (Drosophila) 2030 +/- 162 2055 +/- 125 3575 +/- 166 3066 +/- 138 3.82E-05 0.9079011 -0.042879 0.6272452 0.1751269CKAP4 cytoskeleton-associated protein 4 204 +/- 24 208 +/- 23 322 +/- 15 280 +/- 17 0.001174 0.9160312 -0.098186 0.8731486 0.0295255CLASP1 cytoplasmic linker associated protein 1 2136 +/- 118 2302 +/- 115 2430 +/- 99 2422 +/- 66 0.025048 0.3364966 -0.947592 0.665754 0.6712575CLDN12 claudin 12 1033 +/- 55 999 +/- 54 1262 +/- 42 1127 +/- 73 0.016263 -0.665938 -0.155331 0.44356 0.2265472CLEC2L C-type lectin domain family 2, member L 1172 +/- 148 1076 +/- 84 1876 +/- 62 1736 +/- 78 0.000223 -0.586729 -0.200326 0.4398249 0.2982463CLIC2 chloride intracellular channel 2 216 +/- 8 204 +/- 11 253 +/- 13 217 +/- 20 0.036701 -0.395662 -0.169803 0.3587369 0.1787874CLIPR-59 CLIP-170-related protein 9682 +/- 312 9221 +/- 283 10098 +/- 459 10336 +/- 205 0.021261 -0.298931 0.650289 0.033528 0.6103093CLSTN1 calsyntenin 1 10328 +/- 379 10245 +/- 671 11462 +/- 390 11985 +/- 352 0.00441 -0.91705 0.346355 0.4198951 0.5355616CLTB clathrin, light polypeptide (Lcb) 1137 +/- 74 975 +/- 45 1787 +/- 81 1662 +/- 80 3.7E-08 -0.099012 -0.298477 0.1114392 0.2881023CNIH2 cornichon homolog 2 (Drosophila) 4845 +/- 1276 3557 +/- 721 5938 +/- 434 6322 +/- 120 0.020794 -0.405364 0.427508 0.3805487 0.363364CNNM1 cyclin M1 1123 +/- 60 1055 +/- 59 1264 +/- 76 1334 +/- 49 0.008325 -0.436617 0.463508 0.1842889 0.2939187CNNM2 cyclin M2 138 +/- 14 126 +/- 10 173 +/- 5 173 +/- 20 0.009837 -0.503143 0.989428 0.5082101 0.3084902CNNM4 cyclin M4 725 +/- 27 725 +/- 65 820 +/- 58 939 +/- 107 0.030544 0.9984802 0.362688 0.9856083 0.4626591CNO cappuccino homolog (mouse) 618 +/- 47 639 +/- 24 696 +/- 28 720 +/- 24 0.025041 0.6941246 0.531721 0.872911 0.8813339CNOT4 CCR4-NOT transcription complex, subunit 4 154 +/- 17 203 +/- 23 198 +/- 14 236 +/- 26 0.045992 0.1180435 0.24617 0.1207696 0.1818664CNOT6 CCR4-NOT transcription complex, subunit 6 294 +/- 19 256 +/- 19 427 +/- 33 359 +/- 33 0.001479 -0.179628 -0.177625 0.4135085 0.5111732CNOT7 CCR4-NOT transcription complex, subunit 7 155 +/- 23 135 +/- 21 176 +/- 17 197 +/- 16 0.041018 -0.529895 0.382661 0.2880574 0.7030476COBRA1 cofactor of BRCA1 1580 +/- 53 1459 +/- 54 1712 +/- 117 1680 +/- 76 0.043338 -0.139631 -0.827083 0.0286412 0.8131698COG2 Component of oligomeric golgi complex 2 120 +/- 4 171 +/- 15 148 +/- 17 181 +/- 22 0.046117 0.0163734 0.26106 0.035707 0.4117899COIL coilin 391 +/- 11 442 +/- 36 416 +/- 14 457 +/- 23 0.004235 0.2181572 0.166501 0.3938599 0.7520259COL11A1 Collagen, type XI, alpha 1 242 +/- 36 233 +/- 53 334 +/- 77 299 +/- 25 0.008343 -0.890714 -0.683071 0.9713261 0.7598363COQ10A coenzyme Q10 homolog A (S. cerevisiae) 1795 +/- 102 1613 +/- 139 2087 +/- 128 2110 +/- 56 0.00078 -0.31693 0.877575 0.1218872 0.7051987CORO7 coronin 7 1060 +/- 57 830 +/- 78 1137 +/- 43 970 +/- 97 0.053474 -0.040219 -0.170909 0.1279173 0.5328214COVA1 cytosolic ovarian carcinoma antigen 1 368 +/- 18 319 +/- 18 431 +/- 30 438 +/- 49 0.002276 -0.089331 0.909505 0.0664763 0.9379283COX15 COX15 homolog, cytochrome c oxidase assembly protein (yeast) 352 +/- 99 165 +/- 17 388 +/- 108 209 +/- 22 0.049281 -0.119876 -0.159232 0.1202296 0.1603139COX18 COX18 cytochrome c oxidase assembly homolog (S. cerevisiae) 768 +/- 30 805 +/- 66 969 +/- 79 995 +/- 52 0.000911 0.6230822 0.793104 0.8085991 0.7805394CPEB3 cytoplasmic polyadenylation element binding protein 3 804 +/- 59 910 +/- 76 1183 +/- 88 1022 +/- 26 0.004859 0.2998087 -0.131368 0.2571263 0.4687073CPEB4 cytoplasmic polyadenylation element binding protein 4 4799 +/- 191 4286 +/- 268 5536 +/- 303 4833 +/- 381 0.035796 -0.153788 -0.186138 0.3958748 0.5125972CPNE3 copine III 231 +/- 31 263 +/- 45 344 +/- 38 339 +/- 10 0.003274 0.5662515 -0.905409 0.9872536 0.6483312CPNE6 copine VI (neuronal) 4669 +/- 606 3745 +/- 532 5577 +/- 183 5452 +/- 182 0.005525 -0.27879 -0.640193 0.2058663 0.3720702CPSF2 cleavage and polyadenylation specific factor 2, 100kDa 526 +/- 47 668 +/- 60 737 +/- 35 880 +/- 49 0.000273 0.0943332 0.046656 0.0480927 0.0324146CRB1 crumbs homolog 1 (Drosophila) 582 +/- 81 470 +/- 73 756 +/- 152 570 +/- 91 0.01675 -0.331403 -0.322583 0.3216722 0.3430662CREG2 cellular repressor of E1A-stimulated genes 2 846 +/- 121 830 +/- 83 1680 +/- 147 1811 +/- 202 1.54E-06 -0.914142 0.61356 0.8321873 0.6283235CRELD1 cysteine-rich with EGF-like domains 1 1059 +/- 51 1176 +/- 83 1194 +/- 37 1408 +/- 109 0.011576 0.260255 0.121994 0.7935709 0.6368704CRHR1 corticotropin releasing hormone receptor 1 111 +/- 17 127 +/- 20 184 +/- 13 194 +/- 13 0.000804 0.5588239 0.598013 0.7764756 0.6334302CRI2 CREBBP/EP300 inhibitor 2 2677 +/- 69 2462 +/- 64 2961 +/- 148 2988 +/- 133 0.001303 -0.045566 0.896077 0.0134155 0.9560909CRIP2 cysteine-rich protein 2 1382 +/- 134 1325 +/- 147 2343 +/- 159 2154 +/- 201 0.001191 -0.781721 -0.481786 0.8060977 0.8227177CRK v-crk sarcoma virus CT10 oncogene homolog (avian) 1006 +/- 105 1180 +/- 70 1192 +/- 75 1386 +/- 52 0.039045 0.201792 0.064645 0.4156511 0.0839076CRLS1 cardiolipin synthase 1 588 +/- 53 627 +/- 37 696 +/- 30 755 +/- 37 0.012277 0.564588 0.24712 0.5340446 0.2880741CRSP7 cofactor required for Sp1 transcriptional activation, subunit 7, 70kDa 128 +/- 17 155 +/- 13 208 +/- 16 237 +/- 19 0.001635 0.2374435 0.275427 0.5756172 0.0582313CRSP8 Cofactor required for Sp1 transcriptional activation, subunit 8, 34kDa 434 +/- 20 498 +/- 71 603 +/- 36 587 +/- 58 0.007796 0.4151226 -0.822411 0.2665485 0.3816379CRTAP cartilage associated protein 291 +/- 21 263 +/- 16 339 +/- 21 323 +/- 30 0.017178 -0.317219 -0.677885 0.214606 0.1597177
S2-genes differentially expressed across region.xls Page 6

Symbol Description Young CA Aged CA Young DG Aged DG CA v DG CA Y v A DG Y v A CA to PMI DG to PMICRTC1 CREB regulated transcription coactivator 1 694 +/- 49 669 +/- 39 886 +/- 54 816 +/- 49 0.00174 -0.697372 -0.355334 0.6067761 0.4343661CRY2 cryptochrome 2 (photolyase-like) 1270 +/- 141 1238 +/- 108 1549 +/- 101 1570 +/- 118 0.00779 -0.860285 0.895037 0.6416839 0.7163026CRYL1 crystallin, lambda 1 1943 +/- 176 2157 +/- 185 2168 +/- 123 2251 +/- 109 0.039096 0.4199032 0.62659 0.2927045 0.8211372CSDC2 cold shock domain containing C2, RNA binding 680 +/- 46 613 +/- 33 1125 +/- 176 708 +/- 42 0.029274 -0.263454 -0.06501 0.1841661 0.1956686CSNK1G1 casein kinase 1, gamma 1 1177 +/- 134 1044 +/- 127 1871 +/- 108 1783 +/- 152 0.000222 -0.48549 -0.648574 0.5988358 0.6995579CSNK1G2 casein kinase 1, gamma 2 464 +/- 48 332 +/- 27 622 +/- 27 496 +/- 28 0.001863 -0.044697 -0.010409 0.0355452 0.0068422CSPG5 chondroitin sulfate proteoglycan 5 (neuroglycan C) 645 +/- 130 684 +/- 71 783 +/- 137 842 +/- 34 0.04332 0.7995659 0.689491 0.9793079 0.8222223CSPG6 chondroitin sulfate proteoglycan 6 (bamacan) 905 +/- 42 999 +/- 35 1043 +/- 23 1095 +/- 26 0.006321 0.1144404 0.173763 0.1777793 0.7387256CTBP1 C-terminal binding protein 1 2888 +/- 204 2604 +/- 172 3515 +/- 93 3484 +/- 319 7.83E-05 -0.311226 -0.930297 0.6742056 0.2127629CTDSPL CTD (carboxy-terminal domain, RNA polymerase II, polypeptide A) small phosphatase-lik 1200 +/- 112 1139 +/- 107 1460 +/- 104 1482 +/- 75 0.039304 -0.703027 0.872239 0.395167 0.9769086CTDSPL2 CTD (carboxy-terminal domain, RNA polymerase II, polypeptide A) small phosphatase like 152 +/- 18 148 +/- 23 211 +/- 12 220 +/- 11 0.002249 -0.89057 0.613072 0.5318435 0.8634848CTSD cathepsin D (lysosomal aspartyl peptidase) 96 +/- 9 129 +/- 13 113 +/- 15 163 +/- 20 0.037274 0.0665338 0.076052 0.3399761 0.392234CUGBP2 CUG triplet repeat, RNA binding protein 2 1263 +/- 229 2289 +/- 319 1772 +/- 270 3161 +/- 347 0.008986 0.028023 0.013492 0.2405286 0.0448164CUTL1 Cut-like 1, CCAAT displacement protein (Drosophila) 378 +/- 77 485 +/- 43 522 +/- 91 525 +/- 41 0.006217 0.257602 0.979451 0.2423987 0.8681033CX3CL1 chemokine (C-X3-C motif) ligand 1 1624 +/- 152 1601 +/- 101 2323 +/- 188 2403 +/- 164 0.000276 -0.900153 0.755045 0.8558982 0.7205099CXCL12 chemokine (C-X-C motif) ligand 12 (stromal cell-derived factor 1) 703 +/- 160 527 +/- 166 1328 +/- 203 1073 +/- 141 0.009785 -0.464018 -0.331816 0.4080976 0.4173706CXXC5 CXXC finger 5 994 +/- 34 1117 +/- 49 1164 +/- 73 1189 +/- 50 0.031187 0.0700206 0.784176 0.041982 0.7165496CYB5B cytochrome b5 type B (outer mitochondrial membrane) 133 +/- 13 119 +/- 10 172 +/- 12 184 +/- 15 0.000387 -0.419336 0.53555 0.2457467 0.7379613CYB5R4 cytochrome b5 reductase 4 572 +/- 78 466 +/- 12 883 +/- 67 901 +/- 23 1.41E-05 -0.232518 0.80378 0.3417509 0.7785196CYFIP2 cytoplasmic FMR1 interacting protein 2 7939 +/- 518 7026 +/- 654 9734 +/- 416 9881 +/- 227 9.99E-05 -0.300743 0.764292 0.1419411 0.9954549CYGB cytoglobin 435 +/- 35 481 +/- 67 817 +/- 75 758 +/- 65 0.002032 0.5689869 -0.562951 0.9473438 0.7994819CYHR1 cysteine/histidine-rich 1 407 +/- 30 454 +/- 11 482 +/- 39 573 +/- 18 0.005119 0.18949 0.070349 0.3292366 0.0866017CYP1A2 cytochrome P450, family 1, subfamily A, polypeptide 2 392 +/- 71 435 +/- 15 516 +/- 61 515 +/- 45 0.027864 0.5762672 -0.994071 0.7181627 0.8737705CYP51A1 cytochrome P450, family 51, subfamily A, polypeptide 1 944 +/- 116 942 +/- 122 1222 +/- 149 1322 +/- 110 0.008165 -0.990052 0.601357 0.6060112 0.9310146D15Wsu75 DNA segment, Chr 15, Wayne State University 75, expressed 91 +/- 11 85 +/- 13 120 +/- 9 131 +/- 7 0.0032 -0.763386 0.32525 0.716918 0.3790334DAB1 disabled homolog 1 (Drosophila) 460 +/- 76 362 +/- 64 654 +/- 77 658 +/- 110 0.005479 -0.350083 0.979193 0.2728483 0.6631248DARC Duffy blood group, chemokine receptor 193 +/- 21 183 +/- 27 223 +/- 9 224 +/- 22 0.02157 -0.792417 0.988793 0.9473223 0.3797672DARS2 aspartyl-tRNA synthetase 2 (mitochondrial) 227 +/- 13 222 +/- 17 290 +/- 14 260 +/- 15 0.004032 -0.837741 -0.184773 0.4260238 0.154951DCAMKL3 doublecortin and CaM kinase-like 3 109 +/- 33 103 +/- 30 307 +/- 29 309 +/- 45 0.000967 -0.900873 0.976056 0.9106733 0.5100497DCP2 DCP2 decapping enzyme homolog (S. cerevisiae) 1397 +/- 130 1177 +/- 146 1797 +/- 108 1546 +/- 28 0.010662 -0.284266 -0.067186 0.2466468 0.1278582DDA1 DDA1 732 +/- 46 716 +/- 45 779 +/- 25 794 +/- 29 0.044076 -0.801424 0.693934 0.7946806 0.5668183DDAH2 dimethylarginine dimethylaminohydrolase 2 1020 +/- 65 913 +/- 36 1130 +/- 29 1042 +/- 58 0.030592 -0.18735 -0.227553 0.0553096 0.0946574DDX27 DEAD (Asp-Glu-Ala-Asp) box polypeptide 27 174 +/- 17 135 +/- 12 208 +/- 13 187 +/- 11 0.002145 -0.089149 -0.244527 0.3361899 0.2221413DDX5 DEAD (Asp-Glu-Ala-Asp) box polypeptide 5 6120 +/- 241 6129 +/- 153 6713 +/- 153 6541 +/- 98 0.009559 0.9746182 -0.370793 0.4789319 0.771724DEAF1 deformed epidermal autoregulatory factor 1 (Drosophila) 2565 +/- 177 2227 +/- 171 2971 +/- 112 2869 +/- 133 0.001992 -0.201086 -0.575484 0.0484783 0.2487354DENND4A DENN/MADD domain containing 4A 532 +/- 22 507 +/- 27 580 +/- 34 590 +/- 33 0.03551 -0.497617 0.831348 0.4205501 0.9938668DENND4C DENN/MADD domain containing 4C 820 +/- 63 974 +/- 25 964 +/- 32 1109 +/- 62 0.01039 0.0583166 0.081732 0.0165599 0.0189646DEXI dexamethasone-induced transcript 1477 +/- 130 1606 +/- 45 1674 +/- 75 1776 +/- 85 0.031108 0.3867041 0.39338 0.2644254 0.9119021DFFA DNA fragmentation factor, 45kDa, alpha polypeptide 632 +/- 34 537 +/- 27 694 +/- 27 593 +/- 28 0.028154 -0.054305 -0.031207 0.1962728 0.2976787DGCR2 DiGeorge syndrome critical region gene 2 193 +/- 33 205 +/- 29 345 +/- 33 363 +/- 20 0.000107 0.7792145 0.645864 0.9385848 0.9617381DGKB diacylglycerol kinase, beta 90kDa 158 +/- 21 119 +/- 19 253 +/- 37 177 +/- 22 0.006968 -0.19859 -0.117655 0.4566594 0.2105405DHCR7 7-dehydrocholesterol reductase 440 +/- 49 518 +/- 33 575 +/- 44 595 +/- 31 0.011554 0.2184644 0.713567 0.4011856 0.954846DHX30 DEAH (Asp-Glu-Ala-His) box polypeptide 30 1017 +/- 53 1151 +/- 57 1245 +/- 83 1161 +/- 43 0.04522 0.1170477 -0.396867 0.0335157 0.5880852DHX33 DEAH (Asp-Glu-Ala-His) box polypeptide 33 97 +/- 25 75 +/- 8 129 +/- 17 161 +/- 69 0.017251 -0.449436 0.669206 0.8623757 0.0422655DHX57 DEAH (Asp-Glu-Ala-Asp/His) box polypeptide 57 537 +/- 46 592 +/- 42 699 +/- 24 771 +/- 27 0.002757 0.3940215 0.080692 0.4733718 0.0625953
S2-genes differentially expressed across region.xls Page 7

Symbol Description Young CA Aged CA Young DG Aged DG CA v DG CA Y v A DG Y v A CA to PMI DG to PMIDIP death-inducing-protein 965 +/- 62 835 +/- 40 1120 +/- 63 939 +/- 66 0.006587 -0.11048 -0.080808 0.2459481 0.0600143DIP2C DIP2 disco-interacting protein 2 homolog C (Drosophila) 336 +/- 30 418 +/- 15 445 +/- 23 481 +/- 54 0.02934 0.0454459 0.56088 0.0322439 0.2303166DKFZP434 DKFZP434B0335 protein 1010 +/- 70 889 +/- 105 1390 +/- 56 1264 +/- 72 1.77E-05 -0.362325 -0.204199 0.3256262 0.0372663DKK3 dickkopf homolog 3 (Xenopus laevis) 662 +/- 94 813 +/- 76 1201 +/- 170 970 +/- 100 0.016658 0.2381366 -0.276984 0.0777283 0.2230512DLGAP2 discs, large (Drosophila) homolog-associated protein 2 456 +/- 23 437 +/- 25 554 +/- 43 586 +/- 54 0.010298 -0.590922 0.654245 0.3748396 0.7508683DMWD dystrophia myotonica-containing WD repeat motif 852 +/- 123 758 +/- 79 1066 +/- 46 1069 +/- 147 0.011512 -0.535811 0.986847 0.3373324 0.656268DMXL2 Dmx-like 2 5689 +/- 431 5295 +/- 435 7966 +/- 288 7474 +/- 325 6.13E-07 -0.534754 -0.287522 0.5348546 0.2484567DNA2L DNA2 DNA replication helicase 2-like (yeast) 152 +/- 18 166 +/- 13 190 +/- 8 180 +/- 15 0.018567 0.5618428 -0.595505 0.6752629 0.3368106DNAJB14 DnaJ (Hsp40) homolog, subfamily B, member 14 745 +/- 75 583 +/- 44 992 +/- 140 720 +/- 97 0.003076 -0.099763 -0.145233 0.2740894 0.4450893DNAJB4 DnaJ (Hsp40) homolog, subfamily B, member 4 249 +/- 44 273 +/- 40 286 +/- 16 415 +/- 45 0.048566 0.6888496 0.042426 0.6548772 0.1443555DNAJC12 DnaJ (Hsp40) homolog, subfamily C, member 12 465 +/- 101 368 +/- 82 634 +/- 98 534 +/- 82 0.001016 -0.472979 -0.449626 0.2282365 0.2423587DNAJC15 DnaJ (Hsp40) homolog, subfamily C, member 15 1031 +/- 44 970 +/- 62 1158 +/- 83 1039 +/- 74 0.015752 -0.442216 -0.311672 0.4514713 0.1567617DNAJC18 DnaJ (Hsp40) homolog, subfamily C, member 18 191 +/- 25 173 +/- 20 259 +/- 21 252 +/- 23 0.016433 -0.582231 -0.835489 0.9652133 0.914995DNAJC5 DnaJ (Hsp40) homolog, subfamily C, member 5 2366 +/- 278 2055 +/- 187 3214 +/- 219 2977 +/- 149 4.45E-05 -0.377171 -0.395941 0.2683837 0.2709331DNAJC6 DnaJ (Hsp40) homolog, subfamily C, member 6 140 +/- 15 221 +/- 38 168 +/- 9 226 +/- 44 0.026514 0.0908478 0.26663 0.0211226 0.0375376DNAL4 dynein, axonemal, light polypeptide 4 705 +/- 71 658 +/- 44 767 +/- 42 865 +/- 25 0.01005 -0.590838 0.083973 0.2457717 0.197536DNER delta-notch-like EGF repeat-containing transmembrane 10019 +/- 428 10769 +/- 581 11403 +/- 460 12362 +/- 358 0.000776 0.3249559 0.135095 0.7686456 0.2154026DOC2A double C2-like domains, alpha 1168 +/- 131 999 +/- 81 1474 +/- 61 1333 +/- 72 0.001571 -0.302181 -0.171678 0.1868709 0.6785955DOCK11 dedicator of cytokinesis 11 252 +/- 34 340 +/- 20 340 +/- 23 371 +/- 36 0.005945 0.0554595 0.504763 0.166568 0.6281943DOCK4 dedicator of cytokinesis 4 83 +/- 24 256 +/- 47 145 +/- 31 379 +/- 38 0.004588 0.0118613 0.001341 0.0689508 0.102621DONSON downstream neighbor of SON 391 +/- 20 421 +/- 12 456 +/- 14 469 +/- 18 0.001059 0.2336859 0.596983 0.2772727 0.4314983DPF1 D4, zinc and double PHD fingers family 1 1631 +/- 91 1083 +/- 88 1997 +/- 111 1529 +/- 115 0.001532 -0.001498 -0.017396 0.0084248 0.1077978DPH1 DPH1 homolog (S. cerevisiae) 1108 +/- 78 1033 +/- 107 1407 +/- 137 1177 +/- 49 0.002102 -0.585895 -0.163628 0.720144 0.3985284DPH2 DPH2 homolog (S. cerevisiae) 436 +/- 19 388 +/- 22 458 +/- 21 458 +/- 28 0.034739 -0.138192 0.992342 0.2010963 0.6862508DPY19L3 dpy-19-like 3 (C. elegans) 1853 +/- 163 1900 +/- 215 2092 +/- 93 2260 +/- 81 0.049851 0.8663101 0.204321 0.9444893 0.4277343DRD1IP dopamine receptor D1 interacting protein 4415 +/- 228 3841 +/- 274 6342 +/- 328 6147 +/- 161 8.98E-06 -0.139716 -0.609595 0.0883924 0.4570165DTNBP1 dystrobrevin binding protein 1 2536 +/- 191 2610 +/- 141 2864 +/- 166 3189 +/- 244 0.002722 0.7609774 0.306114 0.9993805 0.4100094DTX3 deltex 3 homolog (Drosophila) 397 +/- 50 340 +/- 59 552 +/- 34 512 +/- 44 0.00556 -0.477097 -0.490723 0.42899 0.4698627DUSP14 dual specificity phosphatase 14 990 +/- 110 838 +/- 108 1439 +/- 43 1252 +/- 51 0.001272 -0.347324 -0.021931 0.3335945 0.1388966DUSP22 Dual specificity phosphatase 22 574 +/- 24 595 +/- 42 651 +/- 37 723 +/- 24 0.011773 0.6723092 0.146268 0.6205026 0.2387273DUSP23 dual specificity phosphatase 23 1324 +/- 83 1107 +/- 72 1378 +/- 31 1385 +/- 41 0.045857 -0.078192 0.896273 0.1645791 0.6684534DVL1 dishevelled, dsh homolog 1 (Drosophila) 3587 +/- 231 3544 +/- 263 4279 +/- 294 4258 +/- 179 0.008718 -0.905066 -0.952509 0.5087976 0.6858871DVL3 dishevelled, dsh homolog 3 (Drosophila) 658 +/- 28 719 +/- 33 730 +/- 31 776 +/- 43 0.023519 0.1909086 0.409533 0.0701807 0.4355523DYNC2H1 dynein, cytoplasmic 2, heavy chain 1 508 +/- 62 728 +/- 72 644 +/- 82 957 +/- 115 0.003354 0.0439453 0.060176 0.2626924 0.3443156DYRK1B dual-specificity tyrosine-(Y)-phosphorylation regulated kinase 1B 532 +/- 30 487 +/- 26 841 +/- 50 765 +/- 43 1.26E-06 -0.280948 -0.279783 0.243966 0.3933199DZIP1 DAZ interacting protein 1 1130 +/- 99 875 +/- 66 1406 +/- 101 904 +/- 129 0.050224 -0.060364 -0.015726 0.1075366 0.0672343DZIP1L DAZ interacting protein 1-like 133 +/- 14 134 +/- 14 213 +/- 16 147 +/- 7 0.00727 0.975474 -0.006561 0.9479433 0.0103985DZIP3 zinc finger DAZ interacting protein 3 497 +/- 49 471 +/- 55 668 +/- 42 679 +/- 54 0.001176 -0.73415 0.87964 0.5371562 0.4316046EAF1 ELL associated factor 1 709 +/- 48 801 +/- 62 865 +/- 41 947 +/- 27 0.003573 0.268006 0.125524 0.6984566 0.4632446ECAT8 ES cell associated transcript 8 328 +/- 108 313 +/- 88 822 +/- 55 656 +/- 136 0.001692 -0.918819 -0.305837 0.9664477 0.962472ECE2 endothelin converting enzyme 2 941 +/- 140 1072 +/- 116 1417 +/- 106 1392 +/- 85 0.014156 0.4874433 -0.85908 0.7478143 0.5309516ECHDC3 enoyl Coenzyme A hydratase domain containing 3 401 +/- 25 467 +/- 64 527 +/- 73 557 +/- 60 0.007072 0.3730127 0.754636 0.511956 0.7472365ECM1 extracellular matrix protein 1 346 +/- 61 521 +/- 76 736 +/- 48 984 +/- 94 7.77E-06 0.1026941 0.057273 0.1711863 0.3533547ECRG4 esophageal cancer related gene 4 protein 529 +/- 11 661 +/- 53 803 +/- 58 778 +/- 126 0.00793 0.0538984 -0.863526 0.0081832 0.3276857EDIL3 EGF-like repeats and discoidin I-like domains 3 291 +/- 46 446 +/- 55 477 +/- 58 560 +/- 72 0.012705 0.0581498 0.393761 0.0063375 0.0860742
S2-genes differentially expressed across region.xls Page 8

Symbol Description Young CA Aged CA Young DG Aged DG CA v DG CA Y v A DG Y v A CA to PMI DG to PMIEDNRB endothelin receptor type B 673 +/- 94 582 +/- 62 937 +/- 97 716 +/- 58 0.00781 -0.439832 -0.08722 0.2887409 0.0297193EFCBP1 EF-hand calcium binding protein 1 121 +/- 11 170 +/- 24 211 +/- 30 210 +/- 35 0.017398 0.1105925 -0.989858 0.5250665 0.5514518EFHA2 EF-hand domain family, member A2 3623 +/- 194 3050 +/- 248 4234 +/- 119 3864 +/- 96 0.006972 -0.100358 -0.038748 0.0544414 0.2160947EFNB3 ephrin-B3 290 +/- 36 225 +/- 36 614 +/- 34 584 +/- 47 1.71E-05 -0.233242 -0.624008 0.2287089 0.7365298EGLN1 egl nine homolog 1 (C. elegans) 599 +/- 67 426 +/- 24 799 +/- 81 561 +/- 31 0.013278 -0.050058 -0.031492 0.0742366 0.0520918EGLN2 egl nine homolog 2 (C. elegans) 198 +/- 34 157 +/- 24 231 +/- 12 268 +/- 10 0.022033 -0.34357 0.04326 0.445131 0.4164312EHBP1 EH domain binding protein 1 107 +/- 15 87 +/- 15 184 +/- 14 154 +/- 11 0.000497 -0.391006 -0.132182 0.4230867 0.1493682EHD3 EH-domain containing 3 2227 +/- 172 1963 +/- 177 2875 +/- 148 2928 +/- 145 6.35E-05 -0.311007 0.80588 0.1501196 0.5372698EHMT1 euchromatic histone-lysine N-methyltransferase 1 821 +/- 47 849 +/- 43 982 +/- 9 938 +/- 44 0.009595 0.6746315 -0.375558 0.7973994 0.217701EID-3 EID-2-like inhibitor of differentiation-3 1170 +/- 82 1234 +/- 63 1297 +/- 45 1499 +/- 44 0.003591 0.5512022 0.010926 0.8176413 0.0879027EIF2C4 Eukaryotic translation initiation factor 2C, 4 170 +/- 17 196 +/- 12 237 +/- 11 247 +/- 13 0.001749 0.236178 0.579522 0.1128747 0.539488EIF2S3 eukaryotic translation initiation factor 2, subunit 3 gamma, 52kDa 554 +/- 55 594 +/- 35 656 +/- 54 692 +/- 61 0.000368 0.5527542 0.668271 0.4860182 0.7889089EIF4G1 eukaryotic translation initiation factor 4 gamma, 1 235 +/- 38 191 +/- 18 279 +/- 22 320 +/- 20 0.003886 -0.334348 0.191017 0.3836689 0.1165018EIF4G2 eukaryotic translation initiation factor 4 gamma, 2 153 +/- 23 166 +/- 18 320 +/- 72 280 +/- 29 0.004565 0.6761395 -0.625765 0.9352234 0.7651205EIF5A eukaryotic translation initiation factor 5A 172 +/- 16 277 +/- 44 235 +/- 19 930 +/- 466 0.001977 0.0942463 0.210331 0.1928354 0.3713673ELAC1 elaC homolog 1 (E. coli) 257 +/- 16 328 +/- 22 295 +/- 19 351 +/- 12 0.005793 0.0277609 0.037583 0.0035732 0.0142275ELAVL3 ELAV (embryonic lethal, abnormal vision, Drosophila)-like 3 (Hu antigen C) 189 +/- 16 110 +/- 15 287 +/- 18 170 +/- 21 0.001759 -0.005034 -0.002436 0.013616 0.031892ELF2 E74-like factor 2 (ets domain transcription factor) 138 +/- 9 166 +/- 11 197 +/- 6 171 +/- 17 0.024871 0.0838396 -0.19985 0.0171331 0.6475829ELK1 ELK1, member of ETS oncogene family 717 +/- 108 657 +/- 98 1501 +/- 60 1575 +/- 136 2.82E-05 -0.688073 0.634924 0.4987335 0.9619796ELMOD1 ELMO/CED-12 domain containing 1 5572 +/- 627 4657 +/- 660 7451 +/- 421 6427 +/- 390 0.009367 -0.338393 -0.107837 0.3466935 0.3386839ELN elastin (supravalvular aortic stenosis, Williams-Beuren syndrome) 192 +/- 17 162 +/- 23 235 +/- 18 259 +/- 25 0.035427 -0.332852 0.467104 0.1283553 0.3257394EML4 echinoderm microtubule associated protein like 4 276 +/- 12 333 +/- 21 362 +/- 36 401 +/- 18 0.002134 0.0464792 0.35486 0.0068409 0.5067077EMX2 empty spiracles homolog 2 (Drosophila) 860 +/- 116 836 +/- 85 1476 +/- 75 1238 +/- 46 0.000166 -0.874806 -0.027446 0.900048 0.0081431ENAH enabled homolog (Drosophila) 1733 +/- 261 2281 +/- 99 2232 +/- 238 2833 +/- 118 0.001729 0.0946837 0.057042 0.1828381 0.2257849ENTPD3 ectonucleoside triphosphate diphosphohydrolase 3 123 +/- 12 126 +/- 13 163 +/- 19 189 +/- 23 0.018 0.8719711 0.400683 0.5841725 0.5645495EPB41L1 erythrocyte membrane protein band 4.1-like 1 1223 +/- 101 1109 +/- 46 1374 +/- 63 1354 +/- 84 0.017996 -0.340198 -0.860587 0.1554998 0.9936991EPDR1 ependymin related protein 1 (zebrafish) 3508 +/- 458 3845 +/- 122 4080 +/- 335 4663 +/- 230 0.00328 0.5058147 0.187223 0.332857 0.3547092EPHA4 EPH receptor A4 577 +/- 137 322 +/- 39 807 +/- 161 909 +/- 151 0.02243 -0.126746 0.655593 0.1410946 0.9201381EPHA7 EPH receptor A7 262 +/- 30 171 +/- 33 462 +/- 88 499 +/- 58 0.002215 -0.069329 0.731956 0.1151844 0.9413568EPM2AIP1 EPM2A (laforin) interacting protein 1 2931 +/- 139 3229 +/- 109 3423 +/- 144 3492 +/- 127 0.004493 0.1249675 0.729232 0.1119277 0.4417082EPS15L1 Epidermal growth factor receptor pathway substrate 15-like 1 180 +/- 22 143 +/- 17 279 +/- 57 215 +/- 47 0.003892 -0.203355 -0.409016 0.3931495 0.4727973ERCC2 excision repair cross-complementing rodent repair deficiency, complementation group 2 (x 583 +/- 12 530 +/- 34 609 +/- 18 621 +/- 42 0.01766 -0.187647 0.807246 0.0028255 0.4710394ERH enhancer of rudimentary homolog (Drosophila) 5444 +/- 236 5908 +/- 260 6027 +/- 113 6411 +/- 139 0.002513 0.2162074 0.06389 0.2280333 0.2420871ETF1 eukaryotic translation termination factor 1 243 +/- 4 206 +/- 11 313 +/- 29 253 +/- 16 0.004699 -0.015712 -0.113144 0.0736888 0.1713913EVL Enah/Vasp-like 119 +/- 27 136 +/- 18 222 +/- 18 218 +/- 14 0.001608 0.6146204 -0.884942 0.9700323 0.4287214EZH2 Enhancer of zeste homolog 2 (Drosophila) 117 +/- 5 104 +/- 11 129 +/- 9 134 +/- 9 0.045748 -0.337857 0.694433 0.1457552 0.7307891FAAH fatty acid amide hydrolase 921 +/- 103 1040 +/- 105 1172 +/- 52 1240 +/- 41 0.000843 0.4358339 0.327389 0.5863743 0.4157951FAT4 FAT tumor suppressor homolog 4 (Drosophila) 293 +/- 14 306 +/- 33 708 +/- 23 485 +/- 48 0.000342 0.734089 -0.005929 0.523441 0.1234583FBF1 Fas (TNFRSF6) binding factor 1 301 +/- 22 263 +/- 19 385 +/- 40 329 +/- 21 0.001402 -0.218039 -0.255397 0.4085579 0.5000467FBS1 fibrosin 1 289 +/- 27 327 +/- 24 478 +/- 34 434 +/- 31 0.000393 0.3114305 -0.362316 0.09211 0.8376005FBXL14 F-box and leucine-rich repeat protein 14 1117 +/- 114 749 +/- 52 1272 +/- 40 979 +/- 38 0.01286 -0.022121 -0.000484 0.07579 0.0310178FBXL16 F-box and leucine-rich repeat protein 16 16392 +/- 1271 14554 +/- 732 18139 +/- 806 17755 +/- 602 0.011005 -0.245562 -0.711925 0.0892318 0.6411969FBXL22 F-box and leucine-rich repeat protein 22 361 +/- 49 489 +/- 61 492 +/- 40 573 +/- 39 0.004069 0.1327113 0.181173 0.5323009 0.48109FBXL5 F-box and leucine-rich repeat protein 5 281 +/- 17 233 +/- 9 307 +/- 13 264 +/- 18 0.037003 -0.036268 -0.084253 0.1025076 0.2376194FBXL8 F-box and leucine-rich repeat protein 8 206 +/- 19 215 +/- 15 261 +/- 19 254 +/- 18 0.011465 0.7200951 -0.794115 0.7535524 0.4887186
S2-genes differentially expressed across region.xls Page 9

Symbol Description Young CA Aged CA Young DG Aged DG CA v DG CA Y v A DG Y v A CA to PMI DG to PMIFBXO11 F-box protein 11 186 +/- 11 190 +/- 7 236 +/- 5 209 +/- 13 0.00503 0.7763734 -0.112843 0.5277932 0.2062247FBXO16 F-box protein 16 189 +/- 18 150 +/- 6 242 +/- 23 186 +/- 15 0.022549 -0.091117 -0.076947 0.2163744 0.0881347FBXO17 F-box protein 17 244 +/- 20 351 +/- 30 356 +/- 58 418 +/- 44 0.032456 0.0166647 0.414235 0.1175588 0.2090408FBXO21 F-box protein 21 1991 +/- 126 2086 +/- 145 2348 +/- 61 2519 +/- 105 0.000666 0.6300796 0.205681 0.8915782 0.7800935FBXO22 F-box protein 22 180 +/- 15 116 +/- 11 204 +/- 17 146 +/- 19 0.02693 -0.007922 -0.047841 0.0438841 0.0742148FBXO27 F-box protein 27 212 +/- 14 233 +/- 26 348 +/- 27 305 +/- 10 0.002175 0.5098698 -0.191056 0.6237129 0.3757434FCMD Fukuyama type congenital muscular dystrophy (fukutin) 472 +/- 35 530 +/- 22 633 +/- 45 626 +/- 19 6.03E-05 0.1943305 -0.899316 0.3609528 0.8782935FDPS farnesyl diphosphate synthase (farnesyl pyrophosphate synthetase, dimethylallyltranstran 1589 +/- 215 1840 +/- 90 2139 +/- 93 2184 +/- 100 0.003061 0.3174014 0.749522 0.3701 0.9397995FEM1C fem-1 homolog c (C.elegans) 612 +/- 43 626 +/- 59 1022 +/- 64 954 +/- 49 3.42E-07 0.8582392 -0.421968 0.9831552 0.4749837FEZ2 fasciculation and elongation protein zeta 2 (zygin II) 1737 +/- 241 1573 +/- 117 2033 +/- 66 1982 +/- 96 0.02175 -0.560788 -0.673907 0.4311277 0.829374FFAR1 free fatty acid receptor 1 207 +/- 12 189 +/- 7 233 +/- 9 225 +/- 11 0.014977 -0.245908 -0.575869 0.2867314 0.7268566FGF14 fibroblast growth factor 14 412 +/- 60 310 +/- 56 536 +/- 10 473 +/- 30 0.001987 -0.246025 -0.104421 0.1099533 0.0242961FGFR1OP FGFR1 oncogene partner 74 +/- 12 115 +/- 24 88 +/- 12 154 +/- 27 0.001951 0.173336 0.072678 0.0989278 0.0449516FGFR3 fibroblast growth factor receptor 3 (achondroplasia, thanatophoric dwarfism) 423 +/- 43 492 +/- 67 667 +/- 47 764 +/- 48 0.000629 0.40945 0.181361 0.93586 0.8557974FHL1 four and a half LIM domains 1 4434 +/- 296 3835 +/- 494 6047 +/- 320 5973 +/- 158 0.000198 -0.328015 -0.841396 0.2901799 0.7031929FKBP8 FK506 binding protein 8, 38kDa 3108 +/- 68 2961 +/- 65 3952 +/- 187 3766 +/- 47 3.96E-06 -0.152896 -0.375424 0.0347444 0.7967463FKRP fukutin related protein 1114 +/- 40 971 +/- 30 1164 +/- 29 1050 +/- 21 0.003275 -0.018583 -0.010989 0.0373924 0.1118994FKSG2 apoptosis inhibitor 29339 +/- 1284 28372 +/- 715 30087 +/- 1812 33819 +/- 1043 0.039645 -0.529781 0.113107 0.2781718 0.4307543FLJ44635 TPT1-like protein 1333 +/- 348 1462 +/- 245 2543 +/- 219 2505 +/- 175 0.003356 0.7685697 -0.89449 0.7290715 0.9303296FLJ46385 FLJ46385 protein 191 +/- 14 173 +/- 15 254 +/- 16 224 +/- 23 0.000322 -0.415263 -0.31024 0.6144274 0.2681464FLOT2 flotillin 2 1471 +/- 66 1362 +/- 76 1778 +/- 32 1705 +/- 72 2.11E-05 -0.306641 -0.391453 0.090366 0.0994665FLRT3 fibronectin leucine rich transmembrane protein 3 419 +/- 78 293 +/- 23 1012 +/- 121 991 +/- 55 2.68E-05 -0.17456 -0.875918 0.4273151 0.7927669FMN2 formin 2 1208 +/- 69 1285 +/- 50 1543 +/- 63 1483 +/- 92 0.000164 0.3917429 -0.606964 0.2662723 0.8023059FMNL2 Formin-like 2 255 +/- 17 315 +/- 26 332 +/- 35 355 +/- 27 0.048316 0.089932 0.603152 0.3237956 0.7885349FN3KRP fructosamine-3-kinase-related protein 2327 +/- 186 2932 +/- 222 2878 +/- 211 3527 +/- 36 0.006278 0.0643649 0.027114 0.2476558 0.0954689FNDC3A fibronectin type III domain containing 3A 1222 +/- 87 1485 +/- 91 1606 +/- 69 1768 +/- 140 0.002547 0.0639021 0.340913 0.0070505 0.1317991FOSB FBJ murine osteosarcoma viral oncogene homolog B 198 +/- 18 177 +/- 19 241 +/- 17 205 +/- 15 0.020095 -0.451011 -0.133046 0.2796759 0.2405775FOXG1B forkhead box G1B 826 +/- 115 654 +/- 50 1306 +/- 91 1218 +/- 89 6.11E-05 -0.212258 -0.509875 0.0922756 0.3043829FOXO1A forkhead box O1A (rhabdomyosarcoma) 720 +/- 44 1108 +/- 81 1000 +/- 116 1225 +/- 114 0.046704 0.0031203 0.199946 0.0662699 0.9658058FREQ frequenin homolog (Drosophila) 6907 +/- 692 7729 +/- 846 8284 +/- 516 9850 +/- 567 0.019921 0.4703367 0.072857 0.9888769 0.2084912FRMD6 FERM domain containing 6 525 +/- 56 619 +/- 76 674 +/- 46 801 +/- 55 0.032384 0.3435957 0.111662 0.7417658 0.1729376FRMPD3 FERM and PDZ domain containing 3 272 +/- 14 234 +/- 12 489 +/- 36 416 +/- 20 5.84E-06 -0.069503 -0.11258 0.1358001 0.2627123FRZB frizzled-related protein 1424 +/- 211 1158 +/- 155 1741 +/- 146 1961 +/- 70 0.003272 -0.336448 0.216872 0.1586214 0.3399969FST follistatin 144 +/- 19 122 +/- 15 243 +/- 50 155 +/- 19 0.02443 -0.390855 -0.147771 0.6861016 0.2177977FXYD2 FXYD domain containing ion transport regulator 2 277 +/- 35 363 +/- 36 397 +/- 24 387 +/- 49 0.034664 0.1194221 -0.860187 0.2084073 0.5366977FXYD7 FXYD domain containing ion transport regulator 7 3435 +/- 178 2940 +/- 109 4078 +/- 119 3624 +/- 147 0.000845 -0.044077 -0.042429 0.0048882 0.4833482FYN FYN oncogene related to SRC, FGR, YES 243 +/- 42 94 +/- 25 298 +/- 27 175 +/- 27 0.019308 -0.014817 -0.010902 0.0085926 0.0075934FYTTD1 forty-two-three domain containing 1 2121 +/- 87 2284 +/- 62 2708 +/- 97 2791 +/- 90 5.17E-07 0.1629674 0.548577 0.067963 0.395422FZD2 frizzled homolog 2 (Drosophila) 334 +/- 25 288 +/- 17 413 +/- 18 436 +/- 26 0.000698 -0.170664 0.491132 0.0405848 0.7298265FZD3 frizzled homolog 3 (Drosophila) 131 +/- 15 121 +/- 13 197 +/- 17 207 +/- 24 0.000222 -0.617122 0.726419 0.5251586 0.8708405FZD7 frizzled homolog 7 (Drosophila) 1370 +/- 195 1399 +/- 180 2077 +/- 204 2255 +/- 352 0.005963 0.9128107 0.674675 0.8398471 0.1989453G3BP2 Ras-GTPase activating protein SH3 domain-binding protein 2 1789 +/- 231 1551 +/- 163 2121 +/- 201 2288 +/- 214 0.023349 -0.420581 0.583686 0.2960857 0.9346932G6PC3 glucose 6 phosphatase, catalytic, 3 461 +/- 24 427 +/- 16 500 +/- 22 491 +/- 18 0.031307 -0.281473 -0.752934 0.4959696 0.7923472GABARAP GABA(A) receptor-associated protein like 1 9847 +/- 283 9124 +/- 693 11429 +/- 285 10912 +/- 593 0.000133 -0.368485 -0.462866 0.1495443 0.5761301GABBR2 gamma-aminobutyric acid (GABA) B receptor, 2 1834 +/- 197 1551 +/- 193 2778 +/- 78 2396 +/- 114 0.000164 -0.329709 -0.026833 0.295949 0.324515
S2-genes differentially expressed across region.xls Page 10

Symbol Description Young CA Aged CA Young DG Aged DG CA v DG CA Y v A DG Y v A CA to PMI DG to PMIGABRA2 gamma-aminobutyric acid (GABA) A receptor, alpha 2 57 +/- 8 75 +/- 13 170 +/- 57 157 +/- 30 0.005803 0.2646191 -0.846925 0.8127874 0.5829782GABRA4 gamma-aminobutyric acid (GABA) A receptor, alpha 4 183 +/- 26 187 +/- 33 257 +/- 19 281 +/- 28 0.009741 0.9302957 0.509349 0.8329809 0.7571369GABRA5 gamma-aminobutyric acid (GABA) A receptor, alpha 5 838 +/- 204 422 +/- 28 1101 +/- 147 1162 +/- 133 0.022414 -0.097817 0.767828 0.1039505 0.9880073GABRD gamma-aminobutyric acid (GABA) A receptor, delta 701 +/- 68 649 +/- 83 1003 +/- 85 887 +/- 75 0.026986 -0.636314 -0.333611 0.4160224 0.622816GABRG1 gamma-aminobutyric acid (GABA) A receptor, gamma 1 342 +/- 56 432 +/- 60 483 +/- 43 607 +/- 92 0.007933 0.3039362 0.269559 0.5849873 0.7187393GABRG2 gamma-aminobutyric acid (GABA) A receptor, gamma 2 1039 +/- 164 880 +/- 168 1298 +/- 128 1363 +/- 117 0.009642 -0.513831 0.716639 0.2837804 0.9899453GABRG3 gamma-aminobutyric acid (GABA) A receptor, gamma 3 83 +/- 11 74 +/- 14 144 +/- 6 100 +/- 6 0.000909 -0.596888 -0.000761 0.4350859 0.0006531GALNT13 UDP-N-acetyl-alpha-D-galactosamine:polypeptide N-acetylgalactosaminyltransferase 13 ( 136 +/- 13 176 +/- 20 297 +/- 43 257 +/- 9 0.001412 0.1351323 -0.396693 0.1590541 0.1878207GAMT guanidinoacetate N-methyltransferase 1022 +/- 43 1199 +/- 29 1147 +/- 61 1359 +/- 156 0.043166 0.009401 0.261073 0.0097846 0.1781006GAS2L1 growth arrest-specific 2 like 1 943 +/- 45 848 +/- 37 1121 +/- 40 1151 +/- 41 0.000767 -0.13517 0.612697 0.0671882 0.3502762GCH1 GTP cyclohydrolase 1 (dopa-responsive dystonia) 291 +/- 49 249 +/- 25 329 +/- 12 310 +/- 6 0.04428 -0.470068 -0.19348 0.6914637 0.5471291GCLM glutamate-cysteine ligase, modifier subunit 771 +/- 36 943 +/- 26 851 +/- 27 1048 +/- 44 0.014231 0.0036647 0.007251 0.0229726 0.0130043GCSH glycine cleavage system protein H (aminomethyl carrier) 1237 +/- 28 1190 +/- 53 1393 +/- 61 1377 +/- 35 0.004168 -0.45238 -0.822031 0.9678108 0.6651284GDAP1 Ganglioside-induced differentiation-associated protein 1 919 +/- 22 758 +/- 116 990 +/- 105 1037 +/- 86 0.045305 -0.225724 0.738091 0.1511409 0.9772839GDF1 growth differentiation factor 1 3123 +/- 224 3123 +/- 191 4092 +/- 159 4433 +/- 137 3.52E-05 -0.999455 0.140238 0.8322473 0.3915141GEFT RAC/CDC42 exchange factor 4463 +/- 807 3672 +/- 634 5521 +/- 340 5416 +/- 232 0.007289 -0.459803 -0.804137 0.5017979 0.9708475GEMIN4 gem (nuclear organelle) associated protein 4 297 +/- 12 327 +/- 28 385 +/- 46 421 +/- 32 0.016723 0.3698105 0.531421 0.5633264 0.4472374GFM1 G elongation factor, mitochondrial 1 175 +/- 15 233 +/- 22 216 +/- 6 265 +/- 11 0.043576 0.0637293 0.006752 0.1726557 0.0006379GFOD1 glucose-fructose oxidoreductase domain containing 1 75 +/- 14 98 +/- 8 118 +/- 8 127 +/- 16 0.005827 0.1802826 0.649305 0.2751452 0.834584GGA2 golgi associated, gamma adaptin ear containing, ARF binding protein 2 287 +/- 13 339 +/- 28 373 +/- 22 349 +/- 15 0.013331 0.1346189 -0.398993 0.6237514 0.1638804GGTL3 gamma-glutamyltransferase-like 3 2529 +/- 133 2114 +/- 121 2837 +/- 156 2630 +/- 103 0.001707 -0.044208 -0.298117 0.1027986 0.4930832GLI2 GLI-Kruppel family member GLI2 129 +/- 11 140 +/- 14 176 +/- 10 134 +/- 12 0.036059 0.529673 -0.024784 0.3778247 0.0012399GLI4 GLI-Kruppel family member GLI4 125 +/- 9 133 +/- 5 151 +/- 11 174 +/- 16 0.016417 0.4595862 0.274318 0.6359208 0.5492366GLIS3 GLIS family zinc finger 3 388 +/- 37 480 +/- 71 558 +/- 66 677 +/- 59 0.015482 0.2833095 0.214882 0.5336861 0.3416032GLRX glutaredoxin (thioltransferase) 834 +/- 71 849 +/- 75 1050 +/- 90 1074 +/- 86 4.62E-05 0.8871256 0.852071 0.7512997 0.5864873GLS2 glutaminase 2 (liver, mitochondrial) 82 +/- 12 93 +/- 9 102 +/- 9 138 +/- 21 0.030768 0.4757278 0.179944 0.821633 0.4060063GLT28D1 glycosyltransferase 28 domain containing 1 327 +/- 25 277 +/- 25 366 +/- 8 330 +/- 30 0.016684 -0.194319 -0.30991 0.6877399 0.9688704GMPR guanosine monophosphate reductase 374 +/- 38 297 +/- 19 429 +/- 26 379 +/- 7 0.004685 -0.115215 -0.108907 0.3935775 0.2870423GNAL guanine nucleotide binding protein (G protein), alpha activating activity polypeptide, olfact 140 +/- 19 156 +/- 36 298 +/- 25 321 +/- 39 0.000523 0.7077585 0.625625 0.8691083 0.6103434GNAS GNAS complex locus 3449 +/- 199 3168 +/- 250 4315 +/- 161 3991 +/- 231 1.65E-05 -0.401516 -0.284916 0.2674715 0.1274547GNB1 Guanine nucleotide binding protein (G protein), beta polypeptide 1 353 +/- 46 428 +/- 41 522 +/- 40 546 +/- 40 0.000334 0.254155 0.676345 0.7893997 0.6535021GNB3 guanine nucleotide binding protein (G protein), beta polypeptide 3 421 +/- 47 444 +/- 41 494 +/- 49 505 +/- 47 0.027355 0.7241183 0.879865 0.869043 0.888017GNG2 guanine nucleotide binding protein (G protein), gamma 2 7405 +/- 371 5485 +/- 393 7908 +/- 317 6914 +/- 174 0.032401 -0.005281 -0.026402 0.0148569 0.0383324GNG8 guanine nucleotide binding protein (G protein), gamma 8 409 +/- 52 397 +/- 57 518 +/- 45 467 +/- 27 0.007122 -0.882171 -0.353694 0.4651831 0.3743873GNL1 guanine nucleotide binding protein-like 1 904 +/- 30 837 +/- 29 948 +/- 17 954 +/- 43 0.008019 -0.141093 0.892055 0.050439 0.5760857GNL3 guanine nucleotide binding protein-like 3 (nucleolar) 1815 +/- 92 1779 +/- 43 1965 +/- 44 1955 +/- 52 0.019684 -0.733802 -0.891571 0.5039377 0.6281171GNPDA2 glucosamine-6-phosphate deaminase 2 534 +/- 61 533 +/- 53 619 +/- 33 711 +/- 36 0.002453 -0.987729 0.094687 0.9060291 0.0323168GNPNAT1 glucosamine-phosphate N-acetyltransferase 1 238 +/- 18 232 +/- 12 300 +/- 12 272 +/- 14 0.00129 -0.789861 -0.149359 0.5986641 0.2879633GNPTAB N-acetylglucosamine-1-phosphate transferase, alpha and beta subunits 215 +/- 29 180 +/- 19 266 +/- 35 230 +/- 23 0.025482 -0.344188 -0.415843 0.4108043 0.3759269GOLGA2 golgi autoantigen, golgin subfamily a, 2 80 +/- 6 112 +/- 6 118 +/- 19 140 +/- 9 0.009563 0.004714 0.328757 0.0191052 0.5915585GOLGA3 golgi autoantigen, golgin subfamily a, 3 381 +/- 32 421 +/- 43 537 +/- 24 537 +/- 52 0.003461 0.4731609 0.993657 0.6605646 0.8496925GOLGA4 golgi autoantigen, golgin subfamily a, 4 158 +/- 20 223 +/- 19 236 +/- 13 257 +/- 20 0.001219 0.0401902 0.414473 0.0194827 0.1549389GOLGA8A golgi autoantigen, golgin subfamily a, 8A 394 +/- 25 529 +/- 94 697 +/- 69 702 +/- 40 0.012805 0.2181383 0.947143 0.3422535 0.5193582GOPC golgi associated PDZ and coiled-coil motif containing 462 +/- 34 622 +/- 43 560 +/- 32 730 +/- 26 0.005407 0.0158442 0.002573 0.0673328 0.0086109GPC4 glypican 4 206 +/- 17 250 +/- 35 346 +/- 28 436 +/- 14 0.000173 0.2887487 0.023212 0.6553604 0.2101967
S2-genes differentially expressed across region.xls Page 11

Symbol Description Young CA Aged CA Young DG Aged DG CA v DG CA Y v A DG Y v A CA to PMI DG to PMIGPD1 glycerol-3-phosphate dehydrogenase 1 (soluble) 451 +/- 61 597 +/- 65 607 +/- 50 773 +/- 69 0.045866 0.1314136 0.089405 0.423724 0.298508GPD2 glycerol-3-phosphate dehydrogenase 2 (mitochondrial) 2261 +/- 127 1979 +/- 148 2578 +/- 83 2297 +/- 121 0.01089 -0.178976 -0.095333 0.3208829 0.575921GPM6B glycoprotein M6B 5149 +/- 133 6879 +/- 254 6195 +/- 386 7340 +/- 323 0.026838 0.0003929 0.049273 0.0074918 0.472334GPR113 G protein-coupled receptor 113 563 +/- 48 608 +/- 39 717 +/- 33 746 +/- 36 0.000884 0.4796388 0.574288 0.3806208 0.4497928GPR135 G protein-coupled receptor 135 154 +/- 8 126 +/- 19 203 +/- 9 163 +/- 8 0.000126 -0.21993 -0.012068 0.5096649 0.0210926GPR137 G protein-coupled receptor 137 729 +/- 83 643 +/- 52 973 +/- 57 1145 +/- 56 0.000209 -0.400288 0.058957 0.194919 0.3349041GPR155 G protein-coupled receptor 155 3986 +/- 374 3280 +/- 279 5230 +/- 184 4681 +/- 151 3.3E-05 -0.164043 -0.046513 0.3330083 0.2508683GPR172A G protein-coupled receptor 172A 286 +/- 15 326 +/- 19 338 +/- 12 328 +/- 11 0.040254 0.1274381 -0.562292 0.3696797 0.2480862GPR180 G protein-coupled receptor 180 132 +/- 7 151 +/- 16 204 +/- 21 167 +/- 18 0.006745 0.3204351 -0.205347 0.2462715 0.2568266GPR27 G protein-coupled receptor 27 529 +/- 62 481 +/- 36 639 +/- 57 570 +/- 34 0.042753 -0.520105 -0.330107 0.2696002 0.297231GPR85 G protein-coupled receptor 85 1693 +/- 269 1343 +/- 234 2174 +/- 179 2095 +/- 40 0.002029 -0.349516 -0.680881 0.2561828 0.6094984GPT glutamic-pyruvate transaminase (alanine aminotransferase) 486 +/- 30 518 +/- 24 544 +/- 23 561 +/- 13 0.021849 0.4113017 0.54496 0.6801934 0.7675988GRB2 growth factor receptor-bound protein 2 1517 +/- 146 1282 +/- 44 1734 +/- 63 1619 +/- 38 0.011426 -0.175326 -0.154069 0.2972443 0.4572524GREB1 GREB1 protein 96 +/- 10 88 +/- 4 144 +/- 12 135 +/- 16 0.000699 -0.472592 -0.682844 0.7973792 0.7831327GRIA1 Glutamate receptor, ionotropic, AMPA 1 3467 +/- 436 2792 +/- 443 4126 +/- 258 3711 +/- 227 0.003329 -0.302831 -0.257704 0.2975945 0.1636895GRIK5 glutamate receptor, ionotropic, kainate 5 277 +/- 19 255 +/- 19 562 +/- 22 498 +/- 49 8.77E-06 -0.434699 -0.286314 0.4054351 0.7718675GRIN1 glutamate receptor, ionotropic, N-methyl D-aspartate 1 3870 +/- 384 3282 +/- 267 4398 +/- 321 3934 +/- 220 0.002578 -0.239918 -0.264496 0.1362697 0.1880672GRINA glutamate receptor, ionotropic, N-methyl D-asparate-associated protein 1 (glutamate bind 5549 +/- 298 4625 +/- 234 6955 +/- 300 6870 +/- 234 2.45E-05 -0.036044 -0.828973 0.0232317 0.6928194GRK4 G protein-coupled receptor kinase 4 143 +/- 17 209 +/- 46 181 +/- 22 264 +/- 67 0.004132 0.2320659 0.295227 0.0623202 0.0840736GRK5 G protein-coupled receptor kinase 5 137 +/- 12 120 +/- 4 241 +/- 16 198 +/- 21 4.62E-05 -0.252808 -0.134346 0.2761808 0.2275984GRLF1 glucocorticoid receptor DNA binding factor 1 2246 +/- 57 1916 +/- 112 2476 +/- 123 2257 +/- 73 0.029725 -0.031675 -0.162091 0.0059261 0.5659028GRM1 glutamate receptor, metabotropic 1 307 +/- 35 313 +/- 56 533 +/- 65 555 +/- 37 0.001219 0.9373081 0.773595 0.8368322 0.8886467GRM2 glutamate receptor, metabotropic 2 418 +/- 73 480 +/- 42 730 +/- 37 724 +/- 63 0.001939 0.4840915 -0.937246 0.5220645 0.5923801GRP gastrin-releasing peptide 586 +/- 219 844 +/- 288 2051 +/- 268 2392 +/- 358 0.001535 0.4937027 0.468801 0.6502949 0.6941366GRPEL2 GrpE-like 2, mitochondrial (E. coli) 607 +/- 25 650 +/- 49 682 +/- 25 684 +/- 39 0.044846 0.4535761 0.969181 0.8714972 0.2324075GSTM4 glutathione S-transferase M4 298 +/- 31 363 +/- 47 423 +/- 21 462 +/- 29 0.002276 0.2820748 0.314813 0.4815968 0.2712704GSTM5 glutathione S-transferase M5 2800 +/- 328 2758 +/- 252 3679 +/- 430 3715 +/- 211 0.002895 -0.921256 0.943222 0.9192678 0.4723403GTDC1 glycosyltransferase-like domain containing 1 360 +/- 16 422 +/- 48 436 +/- 42 481 +/- 27 0.01014 0.2578888 0.387105 0.2335922 0.3734054GUCY1A2 guanylate cyclase 1, soluble, alpha 2 96 +/- 13 85 +/- 10 150 +/- 27 154 +/- 17 0.014184 -0.501046 0.911147 0.6043195 0.981656GUCY1A3 Guanylate cyclase 1, soluble, alpha 3 1920 +/- 323 2521 +/- 220 2846 +/- 165 3163 +/- 421 0.01302 0.1585896 0.512546 0.1393403 0.3832425H1FX H1 histone family, member X 1737 +/- 192 1668 +/- 134 2282 +/- 156 2483 +/- 184 0.001001 -0.776865 0.42888 0.7052893 0.409936HARS histidyl-tRNA synthetase 1394 +/- 62 1252 +/- 62 1493 +/- 15 1500 +/- 30 0.005996 -0.136764 0.838428 0.152974 0.2899605HCA112 hepatocellular carcinoma-associated antigen 112 690 +/- 60 647 +/- 42 806 +/- 33 740 +/- 17 0.015848 -0.573373 -0.115838 0.7563873 0.3084458HCCS holocytochrome c synthase (cytochrome c heme-lyase) 1410 +/- 87 1271 +/- 59 1539 +/- 74 1469 +/- 44 0.000618 -0.220366 -0.438849 0.1417296 0.2996703HCFC1 host cell factor C1 (VP16-accessory protein) 314 +/- 21 281 +/- 21 373 +/- 15 336 +/- 26 0.001016 -0.297414 -0.250952 0.8516292 0.4392442HDAC10 histone deacetylase 10 591 +/- 58 670 +/- 49 985 +/- 78 1051 +/- 80 0.000236 0.3280811 0.573331 0.8933866 0.7304392HDAC2 histone deacetylase 2 1860 +/- 100 1904 +/- 97 2276 +/- 79 2208 +/- 82 0.002372 0.7567067 -0.568327 0.6282243 0.6304701HDGFRP3 hepatoma-derived growth factor, related protein 3 4085 +/- 421 3281 +/- 207 5237 +/- 272 5467 +/- 363 0.000191 -0.128682 0.627277 0.048227 0.9714237HDLBP high density lipoprotein binding protein (vigilin) 416 +/- 18 379 +/- 20 448 +/- 16 464 +/- 24 0.024441 -0.196271 0.611821 0.5856326 0.2957037HEATR2 HEAT repeat containing 2 236 +/- 26 286 +/- 20 347 +/- 18 351 +/- 21 0.003897 0.165463 0.90079 0.2922576 0.8619665HEATR3 HEAT repeat containing 3 584 +/- 59 612 +/- 30 808 +/- 50 658 +/- 71 0.015511 0.6834378 -0.123977 0.4237959 0.4240297HEBP2 heme binding protein 2 125 +/- 34 114 +/- 13 177 +/- 11 138 +/- 14 0.020881 -0.769882 -0.07033 0.8551733 0.053405HECTD1 HECT domain containing 1 154 +/- 14 131 +/- 13 204 +/- 13 162 +/- 11 0.009086 -0.238273 -0.041532 0.852479 0.2248975HERC2P7 hect domain and RLD 2 pseudogene 7 170 +/- 14 126 +/- 21 225 +/- 17 160 +/- 19 0.014426 -0.114895 -0.033002 0.110836 0.0130911HEXDC hexosaminidase (glycosyl hydrolase family 20, catalytic domain) containing 148 +/- 17 180 +/- 18 173 +/- 20 274 +/- 24 0.002521 0.2261819 0.011704 0.4469197 0.0067908
S2-genes differentially expressed across region.xls Page 12

Symbol Description Young CA Aged CA Young DG Aged DG CA v DG CA Y v A DG Y v A CA to PMI DG to PMIHFE hemochromatosis 171 +/- 34 112 +/- 14 205 +/- 34 169 +/- 21 0.013946 -0.149714 -0.384548 0.1243031 0.098543HIC2 hypermethylated in cancer 2 316 +/- 33 385 +/- 11 436 +/- 19 484 +/- 44 0.001918 0.0942498 0.356125 0.1175151 0.3392852HISPPD2A Histidine acid phosphatase domain containing 2A 1213 +/- 73 1266 +/- 63 1466 +/- 60 1458 +/- 61 0.011616 0.5940609 -0.931676 0.9300534 0.8525424HMGCR 3-hydroxy-3-methylglutaryl-Coenzyme A reductase 1890 +/- 172 1539 +/- 69 2130 +/- 95 1817 +/- 102 0.047367 -0.101924 -0.052681 0.0647459 0.186102HMGCS1 3-hydroxy-3-methylglutaryl-Coenzyme A synthase 1 (soluble) 888 +/- 127 1088 +/- 135 1339 +/- 193 1624 +/- 217 0.005967 0.30577 0.352461 0.6309546 0.7187677HMGCS2 3-hydroxy-3-methylglutaryl-Coenzyme A synthase 2 (mitochondrial) 244 +/- 51 182 +/- 18 480 +/- 52 240 +/- 77 0.015867 -0.292636 -0.035266 0.5851959 0.0341019HMGN4 high mobility group nucleosomal binding domain 4 674 +/- 26 748 +/- 34 777 +/- 29 836 +/- 55 0.009419 0.1181175 0.378199 0.0081088 0.1820736HN1 hematological and neurological expressed 1 2135 +/- 127 1867 +/- 131 2279 +/- 72 2214 +/- 49 0.005547 -0.173159 -0.474472 0.1677082 0.3839684HNMT histamine N-methyltransferase 396 +/- 32 235 +/- 22 494 +/- 59 338 +/- 17 0.006664 -0.002524 -0.044935 0.0213492 0.0723774HNRPA3P1heterogeneous nuclear ribonucleoprotein A3 pseudogene 1 1370 +/- 59 1182 +/- 49 1527 +/- 55 1349 +/- 65 0.026639 -0.033981 -0.067248 0.1591375 0.2003319HNRPD heterogeneous nuclear ribonucleoprotein D (AU-rich element RNA binding protein 1, 37kD 1406 +/- 64 1586 +/- 51 1838 +/- 60 1825 +/- 128 0.000959 0.0542112 -0.927465 0.2100338 0.9676209HNRPH1 heterogeneous nuclear ribonucleoprotein H1 (H) 235 +/- 32 224 +/- 31 278 +/- 35 343 +/- 48 0.009307 -0.813817 0.311559 0.7810284 0.3762832HNRPH3 heterogeneous nuclear ribonucleoprotein H3 (2H9) 973 +/- 64 1240 +/- 83 1247 +/- 84 1322 +/- 104 0.019894 0.0303551 0.590177 0.0251709 0.9298828HNRPL heterogeneous nuclear ribonucleoprotein L 5232 +/- 292 6250 +/- 170 6161 +/- 225 7259 +/- 144 0.000633 0.0167305 0.003234 0.1424168 0.0232842HNRPLL heterogeneous nuclear ribonucleoprotein L-like 2146 +/- 110 2030 +/- 59 2632 +/- 129 2515 +/- 72 0.00017 -0.382238 -0.451629 0.6659535 0.6115848HNRPU heterogeneous nuclear ribonucleoprotein U (scaffold attachment factor A) 398 +/- 37 321 +/- 12 490 +/- 22 438 +/- 23 0.002062 -0.099309 -0.149069 0.164647 0.2954007HNRPUL1 heterogeneous nuclear ribonucleoprotein U-like 1 1585 +/- 48 1735 +/- 65 2072 +/- 63 2094 +/- 52 2.07E-05 0.0951585 0.787684 0.0367925 0.4223104HNRPUL2 heterogeneous nuclear ribonucleoprotein U-like 2 237 +/- 37 290 +/- 23 318 +/- 35 333 +/- 27 0.034099 0.2442639 0.742169 0.4194135 0.9459743HOMER3 homer homolog 3 (Drosophila) 250 +/- 55 168 +/- 32 356 +/- 16 267 +/- 46 0.042918 -0.235754 -0.127127 0.3149873 0.5691435HPCA hippocalcin 4525 +/- 1471 3518 +/- 972 6948 +/- 943 7510 +/- 790 0.001009 -0.582327 0.658268 0.524834 0.8374407HPCAL1 hippocalcin-like 1 2659 +/- 438 3108 +/- 442 4291 +/- 447 3897 +/- 386 0.031443 0.486751 -0.522166 0.8306465 0.318843HPS6 Hermansky-Pudlak syndrome 6 434 +/- 16 386 +/- 21 475 +/- 21 482 +/- 25 0.021706 -0.100081 0.836963 0.1500101 0.6898117HRAS v-Ha-ras Harvey rat sarcoma viral oncogene homolog 1817 +/- 77 1987 +/- 109 2042 +/- 85 2290 +/- 106 0.02028 0.235603 0.104562 0.657285 0.1823637HS2ST1 heparan sulfate 2-O-sulfotransferase 1 360 +/- 44 287 +/- 18 416 +/- 11 365 +/- 23 0.038668 -0.170988 -0.092215 0.1631496 0.2742107HSF1 heat shock transcription factor 1 560 +/- 17 589 +/- 8 660 +/- 38 628 +/- 44 0.028456 0.1619299 -0.598394 0.2298407 0.8881215HSFX1 heat shock transcription factor family, X linked 1 176 +/- 12 194 +/- 11 228 +/- 7 212 +/- 15 0.010125 0.3121045 -0.36992 0.6879921 0.3948915HSPBAP1 HSPB (heat shock 27kDa) associated protein 1 348 +/- 61 277 +/- 18 428 +/- 62 447 +/- 30 0.001334 -0.307183 0.801409 0.7873278 0.4533114HTATSF1 HIV-1 Tat specific factor 1 303 +/- 38 331 +/- 35 382 +/- 17 411 +/- 24 0.034487 0.5984194 0.359528 0.7409079 0.2627508HTF9C HpaII tiny fragments locus 9C 237 +/- 18 254 +/- 15 332 +/- 19 284 +/- 19 0.005588 0.5139139 -0.111411 0.4184348 0.3975385HTR1E 5-hydroxytryptamine (serotonin) receptor 1E 240 +/- 27 232 +/- 25 373 +/- 34 364 +/- 19 0.000181 -0.830667 -0.816784 0.8928121 0.6659734HTR3A 5-hydroxytryptamine (serotonin) receptor 3A 166 +/- 21 103 +/- 13 182 +/- 25 126 +/- 12 0.045284 -0.03231 -0.078401 0.2517837 0.1153546HTR6 5-hydroxytryptamine (serotonin) receptor 6 215 +/- 16 173 +/- 20 309 +/- 33 301 +/- 16 9.04E-05 -0.135812 -0.827321 0.3142413 0.9396733HUWE1 HECT, UBA and WWE domain containing 1 814 +/- 59 736 +/- 76 1046 +/- 70 945 +/- 85 0.017673 -0.435488 -0.387623 0.4131299 0.6272215HYI hydroxypyruvate isomerase homolog (E. coli) 463 +/- 46 521 +/- 42 537 +/- 51 594 +/- 37 0.01668 0.3744449 0.391382 0.4585689 0.5332631IBRDC3 IBR domain containing 3 179 +/- 43 292 +/- 22 217 +/- 41 344 +/- 26 0.004416 0.0476291 0.029838 0.2191918 0.2995504ICAM5 intercellular adhesion molecule 5, telencephalin 1523 +/- 281 1420 +/- 243 1957 +/- 122 2241 +/- 112 0.007053 -0.785652 0.121609 0.6239313 0.3475594ID2 inhibitor of DNA binding 2, dominant negative helix-loop-helix protein 2280 +/- 212 2637 +/- 202 3203 +/- 248 2865 +/- 90 0.028319 0.2513884 -0.245195 0.3611387 0.4927106IDH3A isocitrate dehydrogenase 3 (NAD+) alpha 1935 +/- 237 1452 +/- 86 2076 +/- 200 2187 +/- 115 0.037656 -0.101217 0.645302 0.0840321 0.8426569IDS iduronate 2-sulfatase (Hunter syndrome) 10394 +/- 724 9112 +/- 735 15736 +/- 599 15812 +/- 752 1.85E-05 -0.242618 0.938793 0.0762014 0.7956363IER5 immediate early response 5 755 +/- 51 814 +/- 44 1018 +/- 84 905 +/- 41 0.012306 0.3973124 -0.267984 0.7081438 0.4821491IFT140 intraflagellar transport 140 homolog (Chlamydomonas) 212 +/- 12 263 +/- 17 244 +/- 23 276 +/- 16 0.045038 0.0372744 0.272873 0.071048 0.3425192IFT52 intraflagellar transport 52 homolog (Chlamydomonas) 799 +/- 54 918 +/- 33 929 +/- 63 1021 +/- 27 0.003244 0.0941256 0.221829 0.1459342 0.1899747IGF1 insulin-like growth factor 1 (somatomedin C) 111 +/- 20 131 +/- 23 173 +/- 16 154 +/- 11 0.009665 0.5345284 -0.373254 0.6335202 0.6232785IGFBP2 insulin-like growth factor binding protein 2, 36kDa 370 +/- 44 326 +/- 37 652 +/- 87 579 +/- 101 0.000872 -0.485188 -0.598233 0.1163711 0.4198447IGHMBP2 immunoglobulin mu binding protein 2 554 +/- 41 550 +/- 55 617 +/- 24 699 +/- 66 0.014741 -0.963606 0.295088 0.7070517 0.3533595
S2-genes differentially expressed across region.xls Page 13

Symbol Description Young CA Aged CA Young DG Aged DG CA v DG CA Y v A DG Y v A CA to PMI DG to PMIIGSF4D immunoglobulin superfamily, member 4D 1940 +/- 206 1782 +/- 134 2685 +/- 208 2627 +/- 75 6.8E-06 -0.538536 -0.800081 0.5051144 0.9677798IGSF8 immunoglobulin superfamily, member 8 4894 +/- 541 4812 +/- 361 6767 +/- 442 6580 +/- 191 0.000917 -0.901578 -0.710392 0.636277 0.7357781IL17D Interleukin 17D 1606 +/- 78 1561 +/- 74 1700 +/- 81 1768 +/- 30 0.012473 -0.682848 0.454498 0.2227996 0.5948912IL27RA interleukin 27 receptor, alpha 828 +/- 63 715 +/- 55 949 +/- 34 878 +/- 37 0.003618 -0.207187 -0.19514 0.3098327 0.4235523INADL InaD-like (Drosophila) 87 +/- 10 135 +/- 10 146 +/- 6 143 +/- 14 0.010416 0.0084226 -0.845084 0.0070272 0.4992556ING1 inhibitor of growth family, member 1 186 +/- 13 186 +/- 6 282 +/- 13 272 +/- 18 1.41E-06 -0.971879 -0.680355 0.6826541 0.8893313ING5 inhibitor of growth family, member 5 476 +/- 29 580 +/- 43 552 +/- 25 617 +/- 39 0.000235 0.0763868 0.210031 0.1598318 0.7769837INPP5B inositol polyphosphate-5-phosphatase, 75kDa 713 +/- 76 853 +/- 19 911 +/- 51 953 +/- 52 0.020455 0.1261006 0.577468 0.187619 0.9563544INSIG2 insulin induced gene 2 1452 +/- 70 1343 +/- 45 1520 +/- 41 1523 +/- 36 0.04289 -0.223566 0.956665 0.1441873 0.5775221INVS inversin 194 +/- 23 211 +/- 24 213 +/- 20 234 +/- 32 0.020893 0.6114824 0.594496 0.7407488 0.7511405IPO9 importin 9 1211 +/- 95 1365 +/- 81 1369 +/- 47 1573 +/- 68 0.010492 0.2437822 0.042275 0.2746075 0.0033788IQCA IQ motif containing with AAA domain 229 +/- 18 273 +/- 33 294 +/- 35 338 +/- 43 0.003202 0.2729979 0.449717 0.2129285 0.1890866IQCE IQ motif containing E 730 +/- 62 780 +/- 65 1107 +/- 59 1179 +/- 64 6.25E-06 0.5938427 0.429064 0.6022065 0.0956478IRF2 Interferon regulatory factor 2 107 +/- 6 144 +/- 17 144 +/- 15 154 +/- 14 0.024761 0.0785215 0.624112 0.0237249 0.3975184IRF2BP1 interferon regulatory factor 2 binding protein 1 670 +/- 55 598 +/- 44 766 +/- 42 707 +/- 50 1.33E-05 -0.329302 -0.386847 0.9177444 0.6375269ISLR2 immunoglobulin superfamily containing leucine-rich repeat 2 424 +/- 36 459 +/- 44 763 +/- 160 734 +/- 58 0.00695 0.5466159 -0.872166 0.9717311 0.8218768ITGA7 integrin, alpha 7 389 +/- 76 464 +/- 92 862 +/- 112 749 +/- 58 0.007579 0.5465482 -0.398263 0.8453405 0.4909085ITGB4 integrin, beta 4 433 +/- 101 626 +/- 98 854 +/- 90 1205 +/- 70 4.03E-05 0.1993225 0.013637 0.3119505 0.1281018ITGBL1 Integrin, beta-like 1 (with EGF-like repeat domains) 93 +/- 24 53 +/- 9 161 +/- 21 143 +/- 14 2.34E-05 -0.162713 -0.498235 0.1259113 0.3718629ITSN1 Intersectin 1 (SH3 domain protein) 111 +/- 11 94 +/- 11 157 +/- 18 110 +/- 31 0.015893 -0.29698 -0.228448 0.8433469 0.8498111JAG2 jagged 2 536 +/- 24 626 +/- 44 662 +/- 54 716 +/- 70 0.015944 0.1127483 0.56334 0.1711277 0.2967106JAM2 junctional adhesion molecule 2 636 +/- 61 627 +/- 41 711 +/- 45 744 +/- 37 0.011207 -0.895998 0.587077 0.5073111 0.8330516JMJD1C jumonji domain containing 1C 827 +/- 66 909 +/- 72 1069 +/- 50 1184 +/- 57 2.87E-05 0.4223155 0.163598 0.285488 0.1940872JMJD2B jumonji domain containing 2B 560 +/- 53 484 +/- 31 727 +/- 47 686 +/- 18 0.001229 -0.253275 -0.451231 0.3877165 0.8324024JMJD3 jumonji domain containing 3 284 +/- 28 254 +/- 20 377 +/- 19 338 +/- 14 0.004005 -0.410618 -0.133085 0.3738156 0.1195429JPH1 junctophilin 1 272 +/- 30 243 +/- 28 341 +/- 31 350 +/- 22 0.001426 -0.497456 0.815964 0.6778913 0.5875592JUN v-jun sarcoma virus 17 oncogene homolog (avian) 700 +/- 55 634 +/- 49 1304 +/- 111 1155 +/- 39 5.94E-05 -0.391705 -0.250602 0.4950022 0.3608595JUND jun D proto-oncogene 679 +/- 56 787 +/- 57 912 +/- 63 1118 +/- 106 0.00083 0.2023003 0.140334 0.3349942 0.0431503KALRN Kalirin, RhoGEF kinase 475 +/- 54 556 +/- 48 860 +/- 121 921 +/- 109 0.00051 0.2851089 0.718312 0.555694 0.6324193KBTBD11 kelch repeat and BTB (POZ) domain containing 11 5249 +/- 698 6336 +/- 653 6767 +/- 348 7712 +/- 454 0.010134 0.2820761 0.137638 0.3833872 0.2150897KCNA3 potassium voltage-gated channel, shaker-related subfamily, member 3 1164 +/- 208 1231 +/- 268 2262 +/- 115 2064 +/- 121 0.001671 0.8489167 -0.266962 0.987146 0.3684191KCNC4 potassium voltage-gated channel, Shaw-related subfamily, member 4 984 +/- 119 935 +/- 85 1328 +/- 106 1184 +/- 129 0.042686 -0.743626 -0.413179 0.3906643 0.3977448KCNG3 potassium voltage-gated channel, subfamily G, member 3 523 +/- 91 366 +/- 66 679 +/- 39 608 +/- 33 0.008937 -0.195832 -0.198259 0.172145 0.5526645KCNH4 potassium voltage-gated channel, subfamily H (eag-related), member 4 169 +/- 12 150 +/- 11 216 +/- 16 183 +/- 13 0.012511 -0.264364 -0.141993 0.3292707 0.1373193KCNIP2 Kv channel interacting protein 2 431 +/- 85 376 +/- 106 985 +/- 40 993 +/- 45 3.01E-06 -0.691264 0.904062 0.5677863 0.6624142KCNJ16 potassium inwardly-rectifying channel, subfamily J, member 16 132 +/- 23 102 +/- 14 178 +/- 23 116 +/- 14 0.010593 -0.296493 -0.050114 0.2193097 0.0426232KCNK17 potassium channel, subfamily K, member 17 175 +/- 17 111 +/- 10 253 +/- 20 177 +/- 20 0.000433 -0.011002 -0.023816 0.0727271 0.0841288KCNQ5 potassium voltage-gated channel, KQT-like subfamily, member 5 59 +/- 10 66 +/- 18 152 +/- 32 177 +/- 40 0.002529 0.7587449 0.642275 0.9241791 0.9925552KCNS2 potassium voltage-gated channel, delayed-rectifier, subfamily S, member 2 234 +/- 46 284 +/- 60 424 +/- 6 400 +/- 19 0.009011 0.5311907 -0.284717 0.9951389 0.070614KCNT2 Potassium channel, subfamily T, member 2 268 +/- 76 178 +/- 41 517 +/- 52 419 +/- 144 0.001616 -0.329348 -0.550496 0.4796351 0.4538349KCTD12 potassium channel tetramerisation domain containing 12 4101 +/- 460 4864 +/- 238 5833 +/- 307 6138 +/- 213 3.49E-05 0.1807223 0.435947 0.4129087 0.9201584KCTD17 potassium channel tetramerisation domain containing 17 288 +/- 31 189 +/- 16 389 +/- 31 381 +/- 41 0.003133 -0.022214 -0.885017 0.0242203 0.706816KCTD4 potassium channel tetramerisation domain containing 4 2281 +/- 345 1961 +/- 245 2815 +/- 213 2898 +/- 46 0.001162 -0.46836 0.715737 0.6567367 0.6523038KCTD6 potassium channel tetramerisation domain containing 6 2353 +/- 130 2478 +/- 383 5186 +/- 419 4859 +/- 318 2.02E-07 0.7700119 -0.550604 0.9370203 0.5564221KCTD7 potassium channel tetramerisation domain containing 7 267 +/- 20 323 +/- 36 326 +/- 27 392 +/- 21 0.037404 0.2119376 0.082319 0.1270004 0.1744268
S2-genes differentially expressed across region.xls Page 14

Symbol Description Young CA Aged CA Young DG Aged DG CA v DG CA Y v A DG Y v A CA to PMI DG to PMIKDELR1 KDEL (Lys-Asp-Glu-Leu) endoplasmic reticulum protein retention receptor 1 1452 +/- 117 1410 +/- 52 2023 +/- 51 1999 +/- 50 1.58E-06 -0.755012 -0.73857 0.8268704 0.5485392KDELR2 KDEL (Lys-Asp-Glu-Leu) endoplasmic reticulum protein retention receptor 2 559 +/- 51 614 +/- 53 706 +/- 46 757 +/- 62 0.021324 0.4801087 0.521549 0.6808327 0.893134KHDRBS3 KH domain containing, RNA binding, signal transduction associated 3 2499 +/- 180 2392 +/- 103 3016 +/- 147 2784 +/- 189 0.008025 -0.619665 -0.359977 0.6470696 0.7862015KIAA1893 G protein-regulated inducer of neurite outgrowth 1 775 +/- 69 666 +/- 73 1435 +/- 125 1268 +/- 93 0.000114 -0.302767 -0.314141 0.4024895 0.560882KIF21A kinesin family member 21A 3821 +/- 217 2757 +/- 229 4422 +/- 302 3119 +/- 95 0.000296 -0.007043 -0.00637 0.0635413 0.0334699KIF3B kinesin family member 3B 1592 +/- 199 1106 +/- 96 1784 +/- 164 1327 +/- 44 0.033434 -0.062974 -0.037931 0.1085254 0.1408668KIFAP3 Kinesin-associated protein 3 238 +/- 28 260 +/- 24 502 +/- 36 455 +/- 29 3.12E-05 0.5514032 -0.332079 0.8528891 0.4359631KIT v-kit Hardy-Zuckerman 4 feline sarcoma viral oncogene homolog 4667 +/- 898 3619 +/- 752 5985 +/- 275 5401 +/- 655 0.010069 -0.392792 -0.445848 0.3987621 0.4003654KLF13 Kruppel-like factor 13 1790 +/- 60 1158 +/- 151 2000 +/- 133 1313 +/- 196 0.021147 -0.006851 -0.02201 0.1488425 0.3862592KLF16 Kruppel-like factor 16 1527 +/- 100 1253 +/- 111 1717 +/- 83 1565 +/- 66 0.004856 -0.098029 -0.187953 0.056007 0.2334464KLF9 Kruppel-like factor 9 183 +/- 15 217 +/- 25 307 +/- 27 264 +/- 16 0.003894 0.2641485 -0.210261 0.4466555 0.3029169KLHDC8A kelch domain containing 8A 686 +/- 105 674 +/- 74 1132 +/- 96 908 +/- 78 0.008728 -0.928761 -0.103777 0.867842 0.1019849KLHDC8B kelch domain containing 8B 826 +/- 85 933 +/- 55 1066 +/- 46 1056 +/- 64 0.009987 0.3200842 -0.896994 0.5793904 0.1798474KLHL12 kelch-like 12 (Drosophila) 496 +/- 56 456 +/- 40 622 +/- 52 642 +/- 58 0.002254 -0.576798 0.802859 0.3337456 0.7970282KLHL2 kelch-like 2, Mayven (Drosophila) 4816 +/- 510 3890 +/- 688 7319 +/- 565 5661 +/- 464 0.000996 -0.306975 -0.049757 0.4627157 0.301802KLHL23 kelch-like 23 (Drosophila) 1020 +/- 86 1240 +/- 95 1216 +/- 99 1392 +/- 89 0.002869 0.1166858 0.217507 0.5984007 0.6129454KLHL25 kelch-like 25 (Drosophila) 287 +/- 20 348 +/- 24 415 +/- 25 411 +/- 18 0.003626 0.0766178 -0.889554 0.3562486 0.9184839KLHL7 kelch-like 7 (Drosophila) 133 +/- 14 122 +/- 4 194 +/- 19 220 +/- 17 0.001843 -0.475304 0.327631 0.5814065 0.4098213KLP1 K562 cell-derived leucine-zipper-like protein 1 2094 +/- 238 1827 +/- 124 2448 +/- 139 2466 +/- 103 0.001487 -0.350868 0.921092 0.444062 0.6980082KPNA6 karyopherin alpha 6 (importin alpha 7) 351 +/- 17 399 +/- 37 432 +/- 15 435 +/- 25 0.036901 0.27178 0.930368 0.2579965 0.7139128KTI12 KTI12 homolog, chromatin associated (S. cerevisiae) 730 +/- 40 633 +/- 40 843 +/- 23 827 +/- 43 6.22E-05 -0.115791 -0.747893 0.0482223 0.1717447L1CAM L1 cell adhesion molecule 605 +/- 36 460 +/- 68 836 +/- 71 770 +/- 75 0.000367 -0.098096 -0.539336 0.1486527 0.881255LARP1 La ribonucleoprotein domain family, member 1 2654 +/- 61 2210 +/- 101 2989 +/- 126 2762 +/- 90 0.000182 -0.005348 -0.178466 0.0044175 0.1765114LARP4 La ribonucleoprotein domain family, member 4 166 +/- 10 226 +/- 28 218 +/- 15 281 +/- 67 0.007355 0.0850047 0.407276 0.5538886 0.9329248LASS1 LAG1 longevity assurance homolog 1 (S. cerevisiae) 522 +/- 32 475 +/- 31 612 +/- 18 600 +/- 29 0.000454 -0.318118 -0.731634 0.5055776 0.2447506LDOC1 leucine zipper, down-regulated in cancer 1 5604 +/- 497 5003 +/- 329 6003 +/- 186 5865 +/- 263 0.020232 -0.341571 -0.679001 0.1696446 0.3248242LENG8 leukocyte receptor cluster (LRC) member 8 1847 +/- 278 1913 +/- 186 2578 +/- 194 2546 +/- 160 0.003858 0.8473801 -0.900734 0.8968818 0.8371419LETM1 Leucine zipper-EF-hand containing transmembrane protein 1 657 +/- 89 493 +/- 44 787 +/- 66 695 +/- 75 0.015072 -0.141475 -0.383286 0.3173109 0.8063094LGALS14 lectin, galactoside-binding, soluble, 14 188 +/- 23 237 +/- 28 217 +/- 25 242 +/- 37 0.040774 0.2050578 0.588314 0.2577323 0.9470156LGI4 leucine-rich repeat LGI family, member 4 997 +/- 80 1142 +/- 70 1188 +/- 71 1200 +/- 77 0.001258 0.2035096 0.90965 0.192654 0.8466354LGR5 leucine-rich repeat-containing G protein-coupled receptor 5 105 +/- 24 112 +/- 25 191 +/- 9 227 +/- 41 0.012207 0.827651 0.43584 0.8092794 0.3970343LIMD2 LIM domain containing 2 662 +/- 37 561 +/- 70 1039 +/- 34 994 +/- 82 5.75E-05 -0.237391 -0.630843 0.3209015 0.4317537LIMK1 LIM domain kinase 1 300 +/- 31 305 +/- 27 388 +/- 31 454 +/- 30 0.001386 0.9073882 0.161668 0.8432656 0.4218545LIN7C lin-7 homolog C (C. elegans) 517 +/- 76 419 +/- 87 761 +/- 86 713 +/- 57 0.000577 -0.415881 -0.65744 0.299029 0.7459311LIN9 lin-9 homolog (C. elegans) 100 +/- 19 109 +/- 20 180 +/- 21 131 +/- 5 0.009493 0.7354892 -0.06393 0.78466 0.0507246LINS1 lines homolog 1 (Drosophila) 163 +/- 17 267 +/- 53 219 +/- 23 301 +/- 68 0.001456 0.1113764 0.306792 0.201907 0.4287942LKAP limkain b1 149 +/- 26 143 +/- 34 216 +/- 33 226 +/- 18 0.038753 -0.901446 0.803337 0.9097234 0.7748115LMBR1 limb region 1 homolog (mouse) 128 +/- 17 169 +/- 18 182 +/- 19 211 +/- 20 0.008148 0.1326831 0.321422 0.3524662 0.3874522LMTK2 lemur tyrosine kinase 2 170 +/- 26 132 +/- 23 307 +/- 24 333 +/- 31 0.000104 -0.291227 0.519676 0.032858 0.4552069LMTK3 lemur tyrosine kinase 3 2829 +/- 148 2865 +/- 137 5491 +/- 441 6358 +/- 451 1.2E-06 0.8617652 0.203198 0.8632938 0.6641366LNPEP leucyl/cystinyl aminopeptidase 2120 +/- 127 2540 +/- 116 2687 +/- 122 2808 +/- 110 0.003585 0.0351572 0.478574 0.1309289 0.6568302LOC51334 mesenchymal stem cell protein DSC54 149 +/- 18 123 +/- 12 220 +/- 9 173 +/- 19 0.004622 -0.261091 -0.074858 0.2001632 0.5641509LOH11CR2loss of heterozygosity, 11, chromosomal region 2, gene A 89 +/- 17 88 +/- 3 310 +/- 27 344 +/- 32 5.99E-06 -0.989318 0.428491 0.813235 0.8124613LONRF2 LON peptidase N-terminal domain and ring finger 2 5246 +/- 318 4952 +/- 358 6979 +/- 169 6923 +/- 170 9.94E-06 -0.553416 -0.819758 0.2949449 0.6316242LOR loricrin 136 +/- 10 142 +/- 11 168 +/- 19 186 +/- 15 0.011063 0.6891519 0.48061 0.782402 0.575451
S2-genes differentially expressed across region.xls Page 15

Symbol Description Young CA Aged CA Young DG Aged DG CA v DG CA Y v A DG Y v A CA to PMI DG to PMILPHN1 latrophilin 1 3273 +/- 149 2840 +/- 165 3901 +/- 181 3300 +/- 124 0.001197 -0.080279 -0.023978 0.0840345 0.2816035LPIN2 lipin 2 2047 +/- 82 1800 +/- 219 2374 +/- 156 1943 +/- 168 0.013782 -0.328971 -0.094644 0.3390454 0.203824LPL lipoprotein lipase 464 +/- 38 692 +/- 112 1711 +/- 182 1760 +/- 102 1.69E-06 0.1031246 0.819531 0.1659804 0.610734LRBA LPS-responsive vesicle trafficking, beach and anchor containing 170 +/- 21 175 +/- 6 242 +/- 14 194 +/- 12 0.019703 0.8467267 -0.031553 0.6117714 0.0536147LRCH2 leucine-rich repeats and calponin homology (CH) domain containing 2 1068 +/- 87 859 +/- 108 1283 +/- 45 1287 +/- 47 0.00239 -0.165552 0.958238 0.1014569 0.4056246LRCH3 leucine-rich repeats and calponin homology (CH) domain containing 3 203 +/- 21 255 +/- 25 251 +/- 27 310 +/- 23 0.049952 0.1432771 0.124876 0.1976662 0.3874693LRCH4 leucine-rich repeats and calponin homology (CH) domain containing 4 282 +/- 15 296 +/- 16 392 +/- 27 354 +/- 34 0.00137 0.5451383 -0.403157 0.533911 0.6711157LRFN4 leucine rich repeat and fibronectin type III domain containing 4 952 +/- 54 811 +/- 44 1099 +/- 61 1016 +/- 37 0.005731 -0.071285 -0.27678 0.0654939 0.401723LRP1 low density lipoprotein-related protein 1 (alpha-2-macroglobulin receptor) 2003 +/- 63 1954 +/- 76 2328 +/- 60 2621 +/- 151 0.000374 -0.630331 0.127871 0.3776362 0.6146987LRP3 low density lipoprotein receptor-related protein 3 1738 +/- 85 1898 +/- 194 1955 +/- 148 2034 +/- 76 0.0495 0.4749156 0.646848 0.8507438 0.6838935LRRC2 leucine rich repeat containing 2 106 +/- 15 88 +/- 11 234 +/- 37 148 +/- 31 0.005304 -0.353719 -0.109006 0.3587107 0.1228812LRRC28 leucine rich repeat containing 28 389 +/- 32 357 +/- 24 478 +/- 25 395 +/- 14 0.02138 -0.447189 -0.021643 0.3077422 0.1417298LRRC35 leucine rich repeat containing 35 261 +/- 29 272 +/- 27 313 +/- 23 359 +/- 19 0.000303 0.7864287 0.163857 0.7922677 0.7283294LRRC3B leucine rich repeat containing 3B 1060 +/- 61 844 +/- 59 1402 +/- 91 1140 +/- 58 0.001031 -0.029331 -0.040665 0.0542119 0.2739959LRRC41 leucine rich repeat containing 41 863 +/- 56 818 +/- 62 1000 +/- 29 967 +/- 36 0.038964 -0.601833 -0.497717 0.3503785 0.6995281LRRC4B leucine rich repeat containing 4B 824 +/- 116 770 +/- 31 1338 +/- 49 1398 +/- 68 3.91E-06 -0.666631 0.496685 0.4995362 0.7855827LRRC55 Leucine rich repeat containing 55 145 +/- 27 159 +/- 14 292 +/- 35 260 +/- 20 0.00261 0.6577763 -0.455844 0.8431364 0.6451832LRRC57 leucine rich repeat containing 57 227 +/- 50 241 +/- 59 519 +/- 50 505 +/- 22 7.42E-05 0.861464 -0.812119 0.8970009 0.6480956LRRC61 leucine rich repeat containing 61 283 +/- 25 252 +/- 17 366 +/- 34 325 +/- 19 0.000281 -0.330489 -0.317726 0.5487117 0.469245LRRC8A leucine rich repeat containing 8 family, member A 317 +/- 17 285 +/- 28 411 +/- 39 345 +/- 27 0.004224 -0.377667 -0.204792 0.4588345 0.3172088LRRFIP1 leucine rich repeat (in FLII) interacting protein 1 1529 +/- 101 1224 +/- 53 1604 +/- 56 1461 +/- 75 0.036357 -0.0299 -0.167583 0.0459792 0.224864LRRN1 leucine rich repeat neuronal 1 2089 +/- 141 1602 +/- 137 2532 +/- 162 1964 +/- 83 0.003337 -0.032954 -0.015981 0.0543872 0.048776LRRN5 leucine rich repeat neuronal 5 1461 +/- 68 1120 +/- 25 1554 +/- 45 1289 +/- 57 0.017935 -0.002904 -0.006257 0.0073701 0.0648862LRRN6C Leucine rich repeat neuronal 6C 399 +/- 94 458 +/- 120 1054 +/- 98 1154 +/- 101 0.000404 0.7091207 0.494246 0.9091991 0.3626123LRTM2 leucine-rich repeats and transmembrane domains 2 686 +/- 106 669 +/- 40 1026 +/- 68 956 +/- 44 0.004322 -0.885224 -0.416184 0.7653357 0.6197482LSG1 large subunit GTPase 1 homolog (S. cerevisiae) 860 +/- 66 708 +/- 50 937 +/- 47 835 +/- 22 0.026655 -0.099076 -0.088301 0.0872797 0.0926958LSM12 LSM12 homolog (S. cerevisiae) 860 +/- 30 755 +/- 41 912 +/- 33 911 +/- 68 0.017168 -0.06857 -0.98211 0.1320416 0.9456833LSM5 LSM5 homolog, U6 small nuclear RNA associated (S. cerevisiae) 860 +/- 61 808 +/- 19 1126 +/- 50 958 +/- 52 6.31E-05 -0.44519 -0.045762 0.5446384 0.0887925LSS lanosterol synthase (2,3-oxidosqualene-lanosterol cyclase) 109 +/- 28 144 +/- 20 177 +/- 34 182 +/- 28 0.032032 0.3303026 0.906594 0.9343314 0.8774983LUC7L LUC7-like (S. cerevisiae) 849 +/- 108 935 +/- 58 1181 +/- 114 1112 +/- 46 0.001695 0.5065231 -0.594731 0.5554497 0.9725307LUC7L2 LUC7-like 2 (S. cerevisiae) 465 +/- 27 434 +/- 20 498 +/- 28 468 +/- 26 0.048281 -0.365101 -0.448684 0.515575 0.2894865LY6E lymphocyte antigen 6 complex, locus E 3030 +/- 326 2371 +/- 331 3650 +/- 198 3326 +/- 204 0.001099 -0.187069 -0.282981 0.1628787 0.2247906LY6G5C lymphocyte antigen 6 complex, locus G5C 161 +/- 14 176 +/- 20 205 +/- 22 217 +/- 34 0.038885 0.5383382 0.768042 0.4038461 0.3150411LYNX1 Ly6/neurotoxin 1 3602 +/- 286 2910 +/- 272 3730 +/- 134 3698 +/- 394 0.044527 -0.109859 -0.942264 0.0699691 0.5168291LYPLA1 lysophospholipase I 367 +/- 48 344 +/- 44 492 +/- 38 427 +/- 11 0.012604 -0.722277 -0.154767 0.7439144 0.0446651LYPLAL1 Lysophospholipase-like 1 1724 +/- 216 2920 +/- 69 2065 +/- 232 3308 +/- 85 0.00125 0.0018445 0.002086 0.0113258 0.0342218LZTFL1 leucine zipper transcription factor-like 1 99 +/- 8 113 +/- 8 131 +/- 17 156 +/- 7 0.001652 0.2556093 0.203118 0.4647294 0.7150796M6PR mannose-6-phosphate receptor (cation dependent) 2454 +/- 102 2245 +/- 88 2610 +/- 102 2447 +/- 77 0.016454 -0.153424 -0.235769 0.0925325 0.3412548MAB21L2 mab-21-like 2 (C. elegans) 86 +/- 15 117 +/- 25 178 +/- 18 171 +/- 14 0.000164 0.3357437 -0.759375 0.4536169 0.8032387MADD MAP-kinase activating death domain 2078 +/- 156 1974 +/- 159 2452 +/- 135 2445 +/- 162 9.92E-05 -0.651835 -0.971254 0.2608435 0.4870023MAGEE1 melanoma antigen family E, 1 1315 +/- 90 1045 +/- 85 1385 +/- 82 1313 +/- 89 0.032925 -0.054496 -0.568035 0.0144637 0.2644807MAGEF1 melanoma antigen family F, 1 1035 +/- 43 1097 +/- 24 1133 +/- 67 1264 +/- 79 0.037275 0.243333 0.243475 0.4844176 0.2357351MAGEH1 melanoma antigen family H, 1 5195 +/- 193 4645 +/- 235 6391 +/- 306 5229 +/- 199 0.003344 -0.101413 -0.012417 0.1068453 0.0896327MAGI2 membrane associated guanylate kinase, WW and PDZ domain containing 2 202 +/- 32 221 +/- 30 363 +/- 50 346 +/- 28 0.000557 0.6772391 -0.785633 0.5898564 0.6563832MAK10 MAK10 homolog, amino-acid N-acetyltransferase subunit, (S. cerevisiae) 584 +/- 72 678 +/- 47 636 +/- 47 726 +/- 41 0.03569 0.3052668 0.183323 0.2341747 0.2930989
S2-genes differentially expressed across region.xls Page 16

Symbol Description Young CA Aged CA Young DG Aged DG CA v DG CA Y v A DG Y v A CA to PMI DG to PMIMANBA mannosidase, beta A, lysosomal 160 +/- 11 169 +/- 8 205 +/- 12 201 +/- 11 0.014028 0.5022976 -0.824881 0.631972 0.6221121MAP1LC3Amicrotubule-associated protein 1 light chain 3 alpha 3967 +/- 274 2363 +/- 245 4800 +/- 253 2961 +/- 404 7.47E-05 -0.001442 -0.006366 0.0598346 0.1636142MAP2K2 mitogen-activated protein kinase kinase 2 356 +/- 31 447 +/- 42 602 +/- 25 669 +/- 29 2.08E-05 0.113189 0.116597 0.3058045 0.3221498MAP3K5 mitogen-activated protein kinase kinase kinase 5 1628 +/- 220 1557 +/- 187 1959 +/- 115 2245 +/- 101 0.001064 -0.811413 0.094242 0.6049975 0.1478791MAPK1 mitogen-activated protein kinase 1 10274 +/- 704 8702 +/- 613 10851 +/- 475 10382 +/- 169 0.027474 -0.123569 -0.387302 0.0685587 0.3118207MAPK8 mitogen-activated protein kinase 8 222 +/- 17 180 +/- 11 286 +/- 23 237 +/- 17 0.003571 -0.070726 -0.122021 0.0853678 0.3060009MAPK8IP2 mitogen-activated protein kinase 8 interacting protein 2 5349 +/- 300 4874 +/- 259 6786 +/- 156 6811 +/- 183 2.9E-06 -0.258705 0.919258 0.1535892 0.5778675MAPK8IP3 mitogen-activated protein kinase 8 interacting protein 3 1073 +/- 40 1036 +/- 39 1922 +/- 109 1927 +/- 87 1.18E-08 -0.530567 0.971108 0.2939765 0.7712267MAPRE3 microtubule-associated protein, RP/EB family, member 3 3330 +/- 90 2945 +/- 89 3841 +/- 102 3654 +/- 41 7.86E-06 -0.012243 -0.134442 0.0240235 0.3335935MARCH7 Membrane-associated ring finger (C3HC4) 7 78 +/- 9 107 +/- 10 117 +/- 12 120 +/- 14 0.010726 0.0589768 0.883444 0.0219383 0.2960323MARK2 MAP/microtubule affinity-regulating kinase 2 823 +/- 33 702 +/- 30 941 +/- 40 765 +/- 25 0.022501 -0.023036 -0.005707 0.1351836 0.132393MARS methionine-tRNA synthetase 1159 +/- 62 1049 +/- 63 1287 +/- 56 1247 +/- 41 0.00513 -0.242528 -0.578667 0.1757808 0.3967699MAT2A methionine adenosyltransferase II, alpha 1133 +/- 111 1391 +/- 164 1459 +/- 136 1761 +/- 98 0.043784 0.2260081 0.107641 0.1227169 0.2084369MAT2B methionine adenosyltransferase II, beta 1924 +/- 121 3545 +/- 199 2623 +/- 156 3789 +/- 141 0.006021 9.944E-05 0.00036 0.0073799 0.0041307MBNL2 Muscleblind-like 2 (Drosophila) 431 +/- 36 550 +/- 27 566 +/- 22 603 +/- 44 0.010202 0.0275284 0.492126 0.0026829 0.0633907MCF2 MCF.2 cell line derived transforming sequence 162 +/- 25 145 +/- 8 292 +/- 36 245 +/- 29 5.27E-05 -0.540855 -0.337597 0.6234139 0.3495585MCF2L MCF.2 cell line derived transforming sequence-like 169 +/- 11 113 +/- 10 232 +/- 24 135 +/- 8 0.008463 -0.003333 -0.007613 0.033675 0.0679351MCFD2 multiple coagulation factor deficiency 2 2292 +/- 120 2106 +/- 122 2550 +/- 85 2403 +/- 53 0.010072 -0.303654 -0.181778 0.154751 0.0872331MCM4 MCM4 minichromosome maintenance deficient 4 (S. cerevisiae) 187 +/- 13 208 +/- 18 265 +/- 17 288 +/- 15 0.000145 0.3725244 0.328651 0.8830199 0.5398512MCPH1 microcephaly, primary autosomal recessive 1 138 +/- 10 168 +/- 10 193 +/- 10 187 +/- 14 0.006829 0.0657567 -0.750027 0.1742722 0.6854824MDM1 Mdm4, transformed 3T3 cell double minute 1, p53 binding protein (mouse) 458 +/- 30 398 +/- 37 553 +/- 33 459 +/- 37 0.010915 -0.232939 -0.093504 0.6703842 0.3530479ME1 malic enzyme 1, NADP(+)-dependent, cytosolic 1348 +/- 68 1454 +/- 99 1706 +/- 95 1593 +/- 64 0.01077 0.4040871 -0.349194 0.1012746 0.9352921MED12L Mediator of RNA polymerase II transcription, subunit 12 homolog (S. cerevisiae)-like 276 +/- 27 317 +/- 34 447 +/- 40 495 +/- 51 0.002238 0.3669759 0.482094 0.3684587 0.1847388MEGF8 multiple EGF-like-domains 8 382 +/- 42 348 +/- 25 503 +/- 22 461 +/- 30 0.000986 -0.511495 -0.292769 0.324304 0.1859379MEIS3P1 Meis1 homolog 3 (mouse) pseudogene 1 175 +/- 34 118 +/- 10 239 +/- 25 167 +/- 18 0.009456 -0.158737 -0.043823 0.2176017 0.0063298MESP2 mesoderm posterior 2 homolog (mouse) 412 +/- 70 410 +/- 59 474 +/- 83 426 +/- 73 0.021265 -0.984394 -0.673635 0.8656661 0.436771MEST mesoderm specific transcript homolog (mouse) 2485 +/- 318 2364 +/- 191 3814 +/- 151 3349 +/- 120 0.00046 -0.752188 -0.039852 0.8600518 0.0791152METTL7A methyltransferase like 7A 306 +/- 63 569 +/- 51 420 +/- 87 661 +/- 102 0.006533 0.009059 0.107987 0.0092362 0.0722464METTL7B methyltransferase like 7B 719 +/- 115 846 +/- 122 1029 +/- 72 936 +/- 44 0.013554 0.4659878 -0.301892 0.3801525 0.734737MFAP5 microfibrillar associated protein 5 89 +/- 44 16 +/- 7 273 +/- 67 350 +/- 69 6.28E-05 -0.15794 0.443624 0.3644509 0.8945759MFGE8 Milk fat globule-EGF factor 8 protein 258 +/- 26 312 +/- 40 353 +/- 27 319 +/- 33 0.006206 0.2847829 -0.450712 0.2658975 0.071113MFSD2 major facilitator superfamily domain containing 2 579 +/- 26 656 +/- 46 733 +/- 47 698 +/- 77 0.0101 0.1862206 -0.705865 0.4158092 0.1609365MFSD4 major facilitator superfamily domain containing 4 1487 +/- 177 1155 +/- 97 1969 +/- 109 1846 +/- 21 4.65E-05 -0.139953 -0.315991 0.0871056 0.3532448MGAT4B mannosyl (alpha-1,3-)-glycoprotein beta-1,4-N-acetylglucosaminyltransferase, isozyme B 1582 +/- 45 1343 +/- 116 1738 +/- 117 1588 +/- 157 0.017236 -0.101043 -0.466262 0.0043315 0.1194114MGC15476thymus expressed gene 3-like 4612 +/- 295 4262 +/- 199 5026 +/- 230 5010 +/- 220 0.008135 -0.350424 -0.96139 0.1596113 0.9112123MGEA5 meningioma expressed antigen 5 (hyaluronidase) 945 +/- 136 829 +/- 65 1149 +/- 90 1013 +/- 47 0.002231 -0.466572 -0.220947 0.5413074 0.2266776MGRN1 mahogunin, ring finger 1 884 +/- 55 887 +/- 59 1037 +/- 58 1015 +/- 73 0.001422 0.9741278 -0.821427 0.8908812 0.8041259MIER1 mesoderm induction early response 1 homolog (Xenopus laevis) 445 +/- 23 518 +/- 23 603 +/- 34 526 +/- 34 0.029382 0.0521286 -0.13956 0.1971887 0.0703255MIER2 mesoderm induction early response 1, family member 2 361 +/- 19 357 +/- 15 431 +/- 35 396 +/- 17 0.036495 -0.856862 -0.400533 0.9324747 0.2267353MINK1 misshapen-like kinase 1 (zebrafish) 4263 +/- 507 3750 +/- 335 6232 +/- 524 5580 +/- 328 0.000174 -0.420875 -0.321407 0.4264203 0.7196405MKRN1 makorin, ring finger protein, 1 1477 +/- 115 1219 +/- 47 1585 +/- 102 1555 +/- 49 0.043362 -0.079717 -0.798288 0.061871 0.791392MKRN2 makorin, ring finger protein, 2 562 +/- 28 628 +/- 58 747 +/- 46 785 +/- 43 0.000747 0.3405765 0.565667 0.6464234 0.9149528MLC1 megalencephalic leukoencephalopathy with subcortical cysts 1 2374 +/- 112 2737 +/- 163 2567 +/- 136 2912 +/- 205 0.045387 0.1000663 0.202745 0.2221613 0.8221101MLLT10 Myeloid/lymphoid or mixed-lineage leukemia (trithorax homolog, Drosophila); translocated 261 +/- 16 374 +/- 37 406 +/- 32 426 +/- 73 0.008615 0.0273662 0.811362 0.0087313 0.4124782MLPH melanophilin 164 +/- 33 243 +/- 35 237 +/- 27 278 +/- 23 0.045564 0.1295967 0.273809 0.3349234 0.3182119
S2-genes differentially expressed across region.xls Page 17

Symbol Description Young CA Aged CA Young DG Aged DG CA v DG CA Y v A DG Y v A CA to PMI DG to PMIMLXIP MLX interacting protein 717 +/- 34 798 +/- 38 1173 +/- 49 1202 +/- 47 2.35E-06 0.1473828 0.676798 0.31844 0.3349351MMP16 matrix metallopeptidase 16 (membrane-inserted) 267 +/- 38 205 +/- 20 387 +/- 31 308 +/- 36 0.000527 -0.191611 -0.135813 0.5045814 0.1127163MMP17 matrix metallopeptidase 17 (membrane-inserted) 318 +/- 39 257 +/- 33 434 +/- 49 367 +/- 40 0.009736 -0.26276 -0.316446 0.3300199 0.5251296MMS19L MMS19-like (MET18 homolog, S. cerevisiae) 675 +/- 24 691 +/- 38 802 +/- 25 816 +/- 22 0.002354 0.7298489 0.687312 0.7606622 0.8082316MNT MAX binding protein 2071 +/- 128 2142 +/- 150 2566 +/- 153 2514 +/- 84 0.002494 0.7258884 -0.773544 0.8901995 0.9744644MOBKL1A MOB1, Mps One Binder kinase activator-like 1A (yeast) 1079 +/- 157 903 +/- 143 1512 +/- 68 1278 +/- 101 0.008659 -0.427334 -0.095545 0.5215872 0.3940588MOBKL2A MOB1, Mps One Binder kinase activator-like 2A (yeast) 166 +/- 17 108 +/- 15 199 +/- 13 144 +/- 22 0.03428 -0.030366 -0.067489 0.1776544 0.0137142MORN2 MORN repeat containing 2 641 +/- 58 699 +/- 20 708 +/- 14 801 +/- 49 0.040355 0.3765853 0.127411 0.1600465 0.0285689MOXD1 monooxygenase, DBH-like 1 1815 +/- 225 2226 +/- 115 2505 +/- 340 2767 +/- 213 0.017494 0.1449141 0.531957 0.211907 0.8288417MPHOSPHM-phase phosphoprotein 9 810 +/- 122 669 +/- 84 903 +/- 62 804 +/- 68 0.045125 -0.364047 -0.308987 0.3016514 0.180062MPI Mannose phosphate isomerase 303 +/- 26 272 +/- 31 341 +/- 16 352 +/- 22 0.029129 -0.455689 0.702325 0.91808 0.3072803MPP2 membrane protein, palmitoylated 2 (MAGUK p55 subfamily member 2) 313 +/- 25 334 +/- 27 499 +/- 39 536 +/- 41 0.000159 0.578992 0.536558 0.9397736 0.6852628MPP6 membrane protein, palmitoylated 6 (MAGUK p55 subfamily member 6) 324 +/- 28 239 +/- 22 340 +/- 27 328 +/- 27 0.053454 -0.038754 -0.752353 0.0603883 0.912007MPP7 membrane protein, palmitoylated 7 (MAGUK p55 subfamily member 7) 84 +/- 38 106 +/- 21 220 +/- 29 254 +/- 18 2.58E-05 0.6144646 0.337363 0.5966691 0.246474MPPED2 metallophosphoesterase domain containing 2 607 +/- 23 730 +/- 110 1329 +/- 26 1446 +/- 86 1.26E-10 0.3212101 0.254058 0.590878 0.6425262MRAS muscle RAS oncogene homolog 437 +/- 31 419 +/- 16 563 +/- 36 606 +/- 31 0.000115 -0.61239 0.392977 0.8955626 0.324905MRFAP1L1Morf4 family associated protein 1-like 1 2399 +/- 97 2557 +/- 45 2605 +/- 103 2784 +/- 128 0.016852 0.1837818 0.308081 0.3973423 0.6958509MRPL11 mitochondrial ribosomal protein L11 1205 +/- 44 1225 +/- 86 1294 +/- 25 1385 +/- 113 0.00228 0.8425577 0.473353 0.3533103 0.6511952MRPL3 mitochondrial ribosomal protein L3 781 +/- 81 819 +/- 36 903 +/- 64 1004 +/- 53 0.003113 0.6800191 0.25401 0.6926698 0.117146MRPL39 mitochondrial ribosomal protein L39 473 +/- 27 523 +/- 19 566 +/- 19 640 +/- 39 0.000183 0.1679329 0.144294 0.3338956 0.3832933MRPL54 mitochondrial ribosomal protein L54 455 +/- 104 726 +/- 46 610 +/- 107 982 +/- 113 0.004144 0.049292 0.041066 0.0545014 0.0413921MRPL9 mitochondrial ribosomal protein L9 575 +/- 46 549 +/- 31 651 +/- 28 737 +/- 74 0.003324 -0.639284 0.32733 0.3500354 0.4619352MRPS10 mitochondrial ribosomal protein S10 356 +/- 43 360 +/- 37 469 +/- 31 497 +/- 43 0.004835 0.9399476 0.606438 0.9899411 0.7233633MRPS25 mitochondrial ribosomal protein S25 218 +/- 26 254 +/- 22 280 +/- 29 300 +/- 28 0.000808 0.3162447 0.636723 0.5897029 0.808781MRPS36 mitochondrial ribosomal protein S36 958 +/- 65 818 +/- 28 1027 +/- 74 912 +/- 20 0.01874 -0.089233 -0.185864 0.1237787 0.4673682MRVI1 murine retrovirus integration site 1 homolog 457 +/- 46 524 +/- 51 613 +/- 45 594 +/- 61 9.99E-05 0.3481361 -0.808375 0.6697419 0.320923MSL2L1 male-specific lethal 2-like 1 (Drosophila) 398 +/- 18 459 +/- 49 464 +/- 13 511 +/- 53 7.62E-05 0.284194 0.430695 0.2878629 0.4890039MSRB3 methionine sulfoxide reductase B3 117 +/- 13 133 +/- 28 266 +/- 24 253 +/- 13 5.95E-05 0.6210646 -0.649591 0.9291476 0.766074MST101 MSTP101 779 +/- 39 705 +/- 21 871 +/- 42 785 +/- 45 0.039148 -0.13329 -0.195258 0.1290803 0.2686055MTA1 metastasis associated 1 571 +/- 15 536 +/- 18 732 +/- 26 656 +/- 41 0.000472 -0.166695 -0.159407 0.1660907 0.0126497MTA3 metastasis associated 1 family, member 3 299 +/- 14 293 +/- 29 367 +/- 15 346 +/- 28 0.001465 -0.870304 -0.537243 0.5785176 0.5012516MTCH2 mitochondrial carrier homolog 2 (C. elegans) 920 +/- 29 979 +/- 56 1087 +/- 41 1002 +/- 69 0.013021 0.3770053 -0.323832 0.6495518 0.0216887MTF1 metal-regulatory transcription factor 1 916 +/- 47 905 +/- 59 1010 +/- 45 1012 +/- 81 0.017789 -0.876415 0.980004 0.9970961 0.9823894MTMR7 myotubularin related protein 7 514 +/- 85 382 +/- 44 710 +/- 69 724 +/- 78 0.001643 -0.206931 0.898316 0.1320345 0.922503MTPN myotrophin 9221 +/- 411 8161 +/- 473 9817 +/- 285 9520 +/- 335 0.017772 -0.122391 -0.517672 0.0516526 0.6858339MUM1L1 melanoma associated antigen (mutated) 1-like 1 981 +/- 146 739 +/- 116 1184 +/- 67 1198 +/- 168 0.005044 -0.224307 0.937025 0.1619051 0.9637021MXD4 MAX dimerization protein 4 549 +/- 32 530 +/- 56 609 +/- 44 590 +/- 30 0.037312 -0.774293 -0.734029 0.874651 0.7037527MXRA7 matrix-remodelling associated 7 203 +/- 23 119 +/- 18 218 +/- 27 164 +/- 25 0.017414 -0.018307 -0.17431 0.0471686 0.2162351MYCBP2 MYC binding protein 2 1656 +/- 229 1566 +/- 167 2789 +/- 279 2333 +/- 274 0.002512 -0.758852 -0.273458 0.6861531 0.8487281MYO5B myosin VB 327 +/- 86 237 +/- 59 476 +/- 56 404 +/- 35 0.023161 -0.406118 -0.306366 0.2940251 0.4447915MYT1L myelin transcription factor 1-like 170 +/- 37 93 +/- 8 240 +/- 30 264 +/- 19 0.002595 -0.095685 0.522797 0.0965847 0.4031136N4BP2 Nedd4 binding protein 2 631 +/- 115 776 +/- 103 1155 +/- 110 1168 +/- 144 0.007361 0.3691606 0.945 0.3571545 0.7668876NAALAD2 N-acetylated alpha-linked acidic dipeptidase 2 111 +/- 18 179 +/- 41 512 +/- 50 532 +/- 42 7.91E-06 0.1688075 0.758886 0.2949729 0.6330303NAB2 NGFI-A binding protein 2 (EGR1 binding protein 2) 419 +/- 51 363 +/- 38 552 +/- 20 533 +/- 21 0.001168 -0.39681 -0.521498 0.2266163 0.6278468NACA nascent-polypeptide-associated complex alpha polypeptide 13050 +/- 239 13192 +/- 270 13999 +/- 370 14323 +/- 262 0.003425 0.7028534 0.493872 0.639576 0.4010861
S2-genes differentially expressed across region.xls Page 18

Symbol Description Young CA Aged CA Young DG Aged DG CA v DG CA Y v A DG Y v A CA to PMI DG to PMINAG neuroblastoma-amplified protein 98 +/- 12 158 +/- 21 165 +/- 17 192 +/- 26 0.046839 0.0385576 0.425889 0.014356 0.4542652NANOS1 nanos homolog 1 (Drosophila) 291 +/- 47 301 +/- 59 618 +/- 64 529 +/- 35 0.001251 0.8989935 -0.257588 0.8131065 0.4376344NAP1L2 nucleosome assembly protein 1-like 2 5107 +/- 280 4441 +/- 157 5850 +/- 309 5272 +/- 263 0.013288 -0.072808 -0.187873 0.0257402 0.3462678NAPA N-ethylmaleimide-sensitive factor attachment protein, alpha 1686 +/- 112 1839 +/- 100 2364 +/- 17 2358 +/- 74 1.41E-05 0.3343235 -0.934933 0.5760743 0.8215754NAPB N-ethylmaleimide-sensitive factor attachment protein, beta 177 +/- 26 406 +/- 74 348 +/- 67 475 +/- 68 0.013533 0.0261124 0.218482 0.1134007 0.3241578NAPG N-ethylmaleimide-sensitive factor attachment protein, gamma 2846 +/- 59 2625 +/- 247 3514 +/- 149 3585 +/- 331 2.77E-05 -0.418425 0.851188 0.1632512 0.8997516NARG1 NMDA receptor regulated 1 465 +/- 57 616 +/- 59 591 +/- 31 710 +/- 79 0.010074 0.0961971 0.21605 0.0884586 0.1912418NARG1L NMDA receptor regulated 1-like 453 +/- 43 495 +/- 23 551 +/- 12 524 +/- 29 0.036716 0.4144784 -0.414229 0.2567032 0.5546383NAT11 N-acetyltransferase 11 331 +/- 40 324 +/- 20 400 +/- 33 411 +/- 18 0.001232 -0.87335 0.784123 0.9556599 0.8155108NBEA neurobeachin 1246 +/- 191 967 +/- 153 1825 +/- 171 1607 +/- 53 9.12E-05 -0.282402 -0.270868 0.1198024 0.2284989NBL1 neuroblastoma, suppression of tumorigenicity 1 1787 +/- 164 1655 +/- 135 2106 +/- 144 2115 +/- 73 0.001221 -0.549548 0.955041 0.3781639 0.7789883NBR1 neighbor of BRCA1 gene 1 1100 +/- 31 1283 +/- 49 1205 +/- 34 1320 +/- 16 0.027118 0.0122479 0.018009 0.0015849 0.086231NCDN neurochondrin 1739 +/- 322 1197 +/- 79 3697 +/- 273 3599 +/- 184 2.32E-07 -0.157264 -0.774503 0.2520294 0.9843508NCKAP1 NCK-associated protein 1 4172 +/- 479 3691 +/- 189 5125 +/- 363 4600 +/- 295 0.006711 -0.383198 -0.290745 0.4365796 0.9712606NCOA3 Nuclear receptor coactivator 3 89 +/- 15 124 +/- 9 166 +/- 12 180 +/- 18 0.000271 0.0723115 0.528324 0.1500254 0.694608NCOA5 nuclear receptor coactivator 5 279 +/- 3 222 +/- 19 348 +/- 18 305 +/- 13 6.26E-05 -0.02781 -0.088613 0.0763502 0.2254017NCOA6IP nuclear receptor coactivator 6 interacting protein 483 +/- 36 554 +/- 44 578 +/- 42 566 +/- 41 0.041829 0.2406947 -0.837756 0.398501 0.5393954NCOR2 nuclear receptor co-repressor 2 541 +/- 62 580 +/- 42 1088 +/- 67 1184 +/- 80 3.38E-06 0.6235234 0.388699 0.8987635 0.3801074NDRG4 NDRG family member 4 12069 +/- 928 10040 +/- 881 14103 +/- 758 14395 +/- 580 0.00016 -0.144083 0.766934 0.0346613 0.7670733NDUFS8 NADH dehydrogenase (ubiquinone) Fe-S protein 8, 23kDa (NADH-coenzyme Q reductas 3356 +/- 146 2942 +/- 127 3465 +/- 97 3358 +/- 116 0.031185 -0.058368 -0.498414 0.0373897 0.2724169NECAP1 NECAP endocytosis associated 1 5116 +/- 339 4448 +/- 326 5799 +/- 190 5863 +/- 204 0.000488 -0.185835 0.8237 0.0812145 0.8729847NEK6 NIMA (never in mitosis gene a)-related kinase 6 812 +/- 36 732 +/- 50 839 +/- 58 877 +/- 67 0.046974 -0.228245 0.680198 0.0955072 0.5734199NELL1 NEL-like 1 (chicken) 2297 +/- 225 1832 +/- 209 3169 +/- 220 2599 +/- 185 1.52E-05 -0.160379 -0.078758 0.1259619 0.1806587NELL2 NEL-like 2 (chicken) 3619 +/- 287 3012 +/- 285 4656 +/- 394 3639 +/- 278 0.025357 -0.16434 -0.065561 0.3255075 0.4702339NEUROD1 neurogenic differentiation 1 3513 +/- 1010 2385 +/- 631 4285 +/- 253 3926 +/- 228 0.049023 -0.370107 -0.320447 0.3538158 0.4492102NFIC nuclear factor I/C (CCAAT-binding transcription factor) 198 +/- 10 244 +/- 11 275 +/- 22 264 +/- 14 0.015033 0.0111857 -0.689607 0.0046001 0.8942694NFIL3 nuclear factor, interleukin 3 regulated 495 +/- 40 462 +/- 38 822 +/- 51 669 +/- 29 0.000782 -0.562878 -0.032292 0.5630724 0.1254024NFIX nuclear factor I/X (CCAAT-binding transcription factor) 215 +/- 16 195 +/- 13 347 +/- 26 287 +/- 15 0.000259 -0.358422 -0.083323 0.4906664 0.1183526NFKB1 nuclear factor of kappa light polypeptide gene enhancer in B-cells 1 (p105) 175 +/- 8 201 +/- 13 206 +/- 6 207 +/- 7 0.038789 0.1254885 0.92693 0.0277622 0.5966369NFKBIL1 nuclear factor of kappa light polypeptide gene enhancer in B-cells inhibitor-like 1 309 +/- 20 323 +/- 16 370 +/- 9 356 +/- 34 0.02112 0.595381 -0.705425 0.4148677 0.5578979NFXL1 nuclear transcription factor, X-box binding-like 1 253 +/- 22 233 +/- 20 303 +/- 28 251 +/- 30 0.028711 -0.517945 -0.234563 0.7187681 0.672197NIPBL Nipped-B homolog (Drosophila) 651 +/- 32 814 +/- 41 781 +/- 26 815 +/- 32 0.035838 0.0111975 0.434143 0.0066467 0.6387933NIPSNAP3 nipsnap homolog 3B (C. elegans) 376 +/- 28 344 +/- 40 429 +/- 39 393 +/- 44 0.036614 -0.522689 -0.560903 0.2714854 0.1574623NISCH nischarin 262 +/- 23 343 +/- 27 377 +/- 20 423 +/- 44 0.008463 0.0475203 0.38318 0.1719379 0.043231NKAP NF-kappaB activating protein 839 +/- 49 818 +/- 40 910 +/- 38 909 +/- 26 0.002981 -0.753006 -0.984875 0.9589675 0.6519798NKD2 naked cuticle homolog 2 (Drosophila) 229 +/- 12 225 +/- 18 335 +/- 22 274 +/- 16 0.00102 -0.873328 -0.053989 0.951125 0.1893995NKTR natural killer-tumor recognition sequence 456 +/- 55 637 +/- 40 647 +/- 63 788 +/- 65 0.000111 0.024757 0.155518 0.0520207 0.3418644NLGN2 neuroligin 2 3341 +/- 188 2899 +/- 223 3703 +/- 183 3464 +/- 128 0.007712 -0.161946 -0.313345 0.0405993 0.3029904NLGN4X neuroligin 4, X-linked 508 +/- 68 429 +/- 65 789 +/- 46 879 +/- 62 1.06E-05 -0.42024 0.276884 0.2797469 0.7043568NLGN4Y neuroligin 4, Y-linked 170 +/- 27 172 +/- 25 325 +/- 32 341 +/- 35 0.000109 0.9638457 0.733012 0.7659185 0.880029NLK nemo-like kinase 466 +/- 83 408 +/- 44 662 +/- 86 588 +/- 61 0.008496 -0.559971 -0.50039 0.2209082 0.1324337NMB neuromedin B 567 +/- 49 552 +/- 48 714 +/- 85 748 +/- 60 0.015368 -0.827904 0.744727 0.401796 0.2734817NME5 non-metastatic cells 5, protein expressed in (nucleoside-diphosphate kinase) 104 +/- 6 122 +/- 11 124 +/- 13 140 +/- 10 0.004503 0.1871633 0.34171 0.4481356 0.5136443NME7 non-metastatic cells 7, protein expressed in (nucleoside-diphosphate kinase) 497 +/- 29 562 +/- 53 812 +/- 92 632 +/- 91 0.017043 0.3116744 -0.197924 0.2471425 0.3164143NMNAT3 nicotinamide nucleotide adenylyltransferase 3 330 +/- 40 255 +/- 42 470 +/- 45 414 +/- 33 0.007466 -0.226734 -0.343572 0.2636034 0.334217
S2-genes differentially expressed across region.xls Page 19

Symbol Description Young CA Aged CA Young DG Aged DG CA v DG CA Y v A DG Y v A CA to PMI DG to PMINMT2 N-myristoyltransferase 2 443 +/- 35 350 +/- 17 594 +/- 32 534 +/- 28 1.87E-05 -0.045269 -0.185807 0.0344018 0.2033577NOG Noggin 599 +/- 81 458 +/- 67 733 +/- 50 542 +/- 33 0.051327 -0.208994 -0.011914 0.1772806 0.0994863NOL5A nucleolar protein 5A (56kDa with KKE/D repeat) 2245 +/- 141 2213 +/- 112 2567 +/- 69 2616 +/- 123 0.002654 -0.860991 0.736242 0.9063336 0.5395845NPAS3 neuronal PAS domain protein 3 566 +/- 42 643 +/- 29 757 +/- 27 753 +/- 32 0.000841 0.1593994 -0.926031 0.2934572 0.1591154NPDC1 neural proliferation, differentiation and control, 1 4559 +/- 197 3968 +/- 202 5745 +/- 207 5401 +/- 126 3.34E-05 -0.062505 -0.193739 0.0194807 0.319617NPHP1 nephronophthisis 1 (juvenile) 338 +/- 22 294 +/- 26 541 +/- 52 436 +/- 34 0.000315 -0.226588 -0.129014 0.3839328 0.1181205NPHP3 nephronophthisis 3 (adolescent) 113 +/- 9 157 +/- 10 147 +/- 18 189 +/- 8 0.005721 0.0088437 0.07045 0.0690173 0.13618NPNT nephronectin 805 +/- 96 684 +/- 56 1208 +/- 217 758 +/- 30 0.041919 -0.307481 -0.092806 0.3814183 0.2691812NPTX1 neuronal pentraxin I 8387 +/- 1267 9161 +/- 1287 14648 +/- 897 15790 +/- 811 1.22E-05 0.6773072 0.369852 0.7540747 0.2938702NPTX2 neuronal pentraxin II 4585 +/- 1217 3276 +/- 1016 6166 +/- 781 6761 +/- 706 0.03526 -0.428822 0.586341 0.3484818 0.5435351NPTXR neuronal pentraxin receptor 12565 +/- 1977 10967 +/- 1803 16606 +/- 714 16669 +/- 892 0.002955 -0.563599 0.957286 0.4686714 0.9669253NPY2R neuropeptide Y receptor Y2 107 +/- 19 294 +/- 143 991 +/- 64 1064 +/- 74 2.01E-05 0.248922 0.472566 0.481955 0.5481925NR1I2 nuclear receptor subfamily 1, group I, member 2 115 +/- 5 95 +/- 10 128 +/- 12 128 +/- 13 0.038964 -0.123811 -0.991496 0.0259035 0.5608694NR2F1 Nuclear receptor subfamily 2, group F, member 1 3880 +/- 234 4227 +/- 278 4775 +/- 257 5717 +/- 210 0.001232 0.3628789 0.019733 0.6493127 0.043827NRBF2 nuclear receptor binding factor 2 542 +/- 29 490 +/- 19 617 +/- 19 556 +/- 29 0.004482 -0.168413 -0.118279 0.2261694 0.1943647NRCAM neuronal cell adhesion molecule 1212 +/- 154 1214 +/- 127 1400 +/- 88 1697 +/- 126 0.032805 0.9944409 0.093955 0.5839952 0.5416734NRG2 neuregulin 2 233 +/- 16 227 +/- 24 286 +/- 29 285 +/- 16 0.004614 -0.856168 -0.975767 0.8517187 0.8332187NRP2 neuropilin 2 178 +/- 27 256 +/- 23 279 +/- 17 347 +/- 12 0.001843 0.0546684 0.010231 0.0441847 0.0569377NRXN2 neurexin 2 1755 +/- 188 1788 +/- 81 2185 +/- 139 2148 +/- 158 0.000237 0.8762021 -0.863398 0.5134719 0.4395353NRXN3 neurexin 3 3938 +/- 223 3611 +/- 150 4753 +/- 193 5012 +/- 308 0.000116 -0.254617 0.499592 0.2176793 0.8767913NSBP1 nucleosomal binding protein 1 223 +/- 25 184 +/- 11 265 +/- 12 267 +/- 18 0.010517 -0.191626 0.948789 0.2883785 0.6356066NSUN2 NOL1/NOP2/Sun domain family, member 2 521 +/- 29 653 +/- 50 633 +/- 51 677 +/- 39 0.005451 0.0534071 0.513679 0.2984479 0.8637154NT5DC3 5'-nucleotidase domain containing 3 3937 +/- 446 3377 +/- 456 4650 +/- 234 4550 +/- 238 0.003112 -0.399949 -0.76973 0.2562128 0.6632909NTF3 neurotrophin 3 180 +/- 45 189 +/- 22 361 +/- 59 312 +/- 30 0.014268 0.8641472 -0.474539 0.9074538 0.5847139NTNG2 netrin G2 1182 +/- 175 925 +/- 139 2032 +/- 132 2043 +/- 94 1.63E-05 -0.277893 0.94951 0.2466772 0.8993512NTRK3 neurotrophic tyrosine kinase, receptor, type 3 363 +/- 49 319 +/- 48 524 +/- 16 509 +/- 32 0.000153 -0.542719 -0.678636 0.5654823 0.9532434NUDT11 nudix (nucleoside diphosphate linked moiety X)-type motif 11 1910 +/- 119 1671 +/- 195 2069 +/- 90 2038 +/- 196 0.039126 -0.324739 -0.891197 0.1912925 0.709447NUDT17 nudix (nucleoside diphosphate linked moiety X)-type motif 17 128 +/- 5 139 +/- 9 173 +/- 3 168 +/- 14 0.000542 0.3077328 -0.78463 0.0901453 0.3533989NUDT4 nudix (nucleoside diphosphate linked moiety X)-type motif 4 341 +/- 23 281 +/- 33 505 +/- 25 364 +/- 47 0.000121 -0.167955 -0.036215 0.2096351 0.049617NUDT6 nudix (nucleoside diphosphate linked moiety X)-type motif 6 221 +/- 25 217 +/- 12 279 +/- 33 237 +/- 23 0.01906 -0.902999 -0.325162 0.7622408 0.8276301NUFIP1 nuclear fragile X mental retardation protein interacting protein 1 389 +/- 16 344 +/- 13 423 +/- 26 378 +/- 24 0.012366 -0.053026 -0.23428 0.0239729 0.108255NUFIP2 nuclear fragile X mental retardation protein interacting protein 2 761 +/- 34 710 +/- 36 845 +/- 39 746 +/- 16 0.029363 -0.328267 -0.051374 0.748716 0.0581558NUMA1 nuclear mitotic apparatus protein 1 102 +/- 11 139 +/- 28 124 +/- 11 171 +/- 22 0.04309 0.2684087 0.108222 0.1979136 0.0481205NUMBL numb homolog (Drosophila)-like 973 +/- 100 832 +/- 70 1483 +/- 86 1438 +/- 91 4.71E-06 -0.277297 -0.731692 0.116575 0.4496121NUP50 nucleoporin 50kDa 2247 +/- 143 3427 +/- 362 2766 +/- 251 3193 +/- 321 0.052566 0.0208199 0.325114 0.0368692 0.442796NUP62 nucleoporin 62kDa 885 +/- 11 1158 +/- 43 1053 +/- 49 1241 +/- 35 0.01417 0.0009882 0.012691 0.0697167 0.041829NUP85 nucleoporin 85kDa 1138 +/- 76 1108 +/- 81 1222 +/- 25 1286 +/- 25 0.031802 -0.79416 0.101761 0.7198646 0.6097356NUPL1 nucleoporin like 1 80 +/- 12 133 +/- 19 138 +/- 7 175 +/- 24 0.000357 0.0436761 0.212114 0.2357862 0.8285182OBSL1 obscurin-like 1 676 +/- 34 758 +/- 38 846 +/- 33 930 +/- 30 0.000343 0.1391008 0.095893 0.3398491 0.1534025OGDHL oxoglutarate dehydrogenase-like 1566 +/- 124 1440 +/- 147 1713 +/- 83 1788 +/- 117 0.005452 -0.52877 0.615523 0.3348651 0.7775816OGFRL1 opioid growth factor receptor-like 1 121 +/- 12 168 +/- 17 211 +/- 16 189 +/- 23 0.006054 0.0544192 -0.447763 0.0564482 0.47636OGT O-linked N-acetylglucosamine (GlcNAc) transferase (UDP-N-acetylglucosamine:polypepti 1094 +/- 60 899 +/- 25 1800 +/- 83 1694 +/- 67 4.43E-07 -0.022121 -0.34876 0.1719069 0.6526878OLFM2 olfactomedin 2 1429 +/- 94 1459 +/- 94 1830 +/- 214 1804 +/- 107 0.002395 0.826934 -0.915851 0.6750257 0.759015OLFML1 olfactomedin-like 1 106 +/- 22 94 +/- 12 127 +/- 21 99 +/- 7 0.044007 -0.637883 -0.242967 0.7561494 0.2797264OPRS1 opioid receptor, sigma 1 649 +/- 74 520 +/- 38 828 +/- 61 872 +/- 44 0.002167 -0.16362 0.580699 0.1794188 0.621622
S2-genes differentially expressed across region.xls Page 20

Symbol Description Young CA Aged CA Young DG Aged DG CA v DG CA Y v A DG Y v A CA to PMI DG to PMIOPTN optineurin 1234 +/- 134 1443 +/- 56 1440 +/- 68 1677 +/- 80 0.000947 0.1953036 0.051872 0.2762996 0.044902ORMDL3 ORM1-like 3 (S. cerevisiae) 240 +/- 23 235 +/- 13 311 +/- 12 273 +/- 13 0.00113 -0.861437 -0.065597 0.6230597 0.2103392OSBPL7 oxysterol binding protein-like 7 109 +/- 8 132 +/- 8 195 +/- 8 172 +/- 26 0.003122 0.0771645 -0.42948 0.1158777 0.5957631OSRF osmosis responsive factor 556 +/- 112 499 +/- 61 709 +/- 85 607 +/- 43 0.002391 -0.665699 -0.322839 0.8312407 0.5798275OVOL1 ovo-like 1(Drosophila) 112 +/- 15 124 +/- 9 157 +/- 14 140 +/- 10 0.044664 0.5287326 -0.361026 0.7448317 0.7150908P2RX5 purinergic receptor P2X, ligand-gated ion channel, 5 1338 +/- 74 1083 +/- 93 1528 +/- 87 1238 +/- 63 0.025993 -0.058172 -0.025511 0.0974106 0.0695644P2RY14 purinergic receptor P2Y, G-protein coupled, 14 107 +/- 11 100 +/- 8 175 +/- 23 148 +/- 18 0.001602 -0.588146 -0.370044 0.8603651 0.74963P4HB procollagen-proline, 2-oxoglutarate 4-dioxygenase (proline 4-hydroxylase), beta polypepti 387 +/- 57 498 +/- 37 540 +/- 34 637 +/- 39 0.00917 0.1426439 0.092837 0.2291056 0.6851306PA2G4 proliferation-associated 2G4, 38kDa 712 +/- 69 939 +/- 45 885 +/- 51 1182 +/- 44 0.000332 0.0231989 0.001752 0.0297561 0.0004348PACSIN1 protein kinase C and casein kinase substrate in neurons 1 6703 +/- 229 7137 +/- 561 8175 +/- 310 8546 +/- 341 0.000473 0.498076 0.442272 0.8546795 0.872812PAG1 phosphoprotein associated with glycosphingolipid microdomains 1 1306 +/- 191 1142 +/- 178 2064 +/- 236 1954 +/- 144 0.00167 -0.544718 -0.699719 0.4568409 0.9529992PAIP1 poly(A) binding protein interacting protein 1 2718 +/- 182 2080 +/- 74 3154 +/- 104 2326 +/- 67 0.015668 -0.015324 -0.000136 0.031099 0.0141581PAK3 P21 (CDKN1A)-activated kinase 3 227 +/- 18 167 +/- 19 271 +/- 16 203 +/- 14 0.052076 -0.048202 -0.010497 0.0506195 0.0772543PALMD palmdelphin 203 +/- 17 151 +/- 13 248 +/- 26 204 +/- 20 0.000514 -0.039876 -0.211303 0.202666 0.2398417PAPD1 PAP associated domain containing 1 886 +/- 44 1400 +/- 87 1045 +/- 67 1422 +/- 80 0.027286 0.0009632 0.006476 0.002258 0.0023265PAPOLG poly(A) polymerase gamma 791 +/- 23 698 +/- 22 821 +/- 24 839 +/- 22 0.005476 -0.014573 0.597447 0.041462 0.8523547PARK2 Parkinson disease (autosomal recessive, juvenile) 2, parkin 143 +/- 18 177 +/- 24 203 +/- 17 251 +/- 14 0.007899 0.2936315 0.05811 0.5035322 0.0350739PARP8 poly (ADP-ribose) polymerase family, member 8 406 +/- 45 403 +/- 30 443 +/- 29 519 +/- 18 0.010472 -0.951028 0.053006 0.9421587 0.1955899PAX6 paired box gene 6 (aniridia, keratitis) 1091 +/- 49 1069 +/- 41 1263 +/- 63 1174 +/- 51 0.010181 -0.73126 -0.302512 0.4929127 0.1817337PBX2 pre-B-cell leukemia transcription factor 2 132 +/- 18 116 +/- 19 181 +/- 22 166 +/- 11 0.014928 -0.566728 -0.565075 0.3138172 0.7277874PCBD1 pterin-4 alpha-carbinolamine dehydratase/dimerization cofactor of hepatocyte nuclear fact 1102 +/- 56 1160 +/- 70 1490 +/- 100 1509 +/- 72 6.79E-05 0.5360118 0.880065 0.6517877 0.8975378PCBD2 pterin-4 alpha-carbinolamine dehydratase/dimerization cofactor of hepatocyte nuclear fact 859 +/- 60 907 +/- 30 1075 +/- 79 945 +/- 51 0.020975 0.4912241 -0.204049 0.4636112 0.5532759PCBP3 poly(rC) binding protein 3 391 +/- 60 520 +/- 48 834 +/- 74 869 +/- 61 0.000428 0.1251358 0.718854 0.0887636 0.8597245PCDH1 protocadherin 1 (cadherin-like 1) 178 +/- 17 162 +/- 12 240 +/- 16 186 +/- 15 0.001299 -0.439022 -0.039922 0.1526281 0.0256257PCDH18 protocadherin 18 341 +/- 79 322 +/- 66 770 +/- 76 653 +/- 119 0.001588 -0.858248 -0.434952 0.8253399 0.2472093PCDHB13 protocadherin beta 13 189 +/- 13 200 +/- 26 291 +/- 20 249 +/- 25 0.003952 0.7113407 -0.227119 0.7238273 0.1904339PCDHB14 protocadherin beta 14 224 +/- 13 229 +/- 9 342 +/- 16 269 +/- 6 0.001369 0.7321903 -0.004447 0.2135377 0.0333462PCDHB4 protocadherin beta 4 738 +/- 56 649 +/- 66 806 +/- 71 933 +/- 152 0.023461 -0.328135 0.479213 0.3082233 0.4744722PCDHB5 protocadherin beta 5 309 +/- 10 309 +/- 25 412 +/- 23 457 +/- 43 8.77E-05 0.989283 0.391303 0.9355144 0.4391364PCDHGC3 protocadherin gamma subfamily C, 3 5303 +/- 514 4484 +/- 605 5809 +/- 536 4995 +/- 765 0.032893 -0.326987 -0.410816 0.076912 0.1403336PCGF2 polycomb group ring finger 2 253 +/- 17 158 +/- 15 362 +/- 10 234 +/- 26 2.51E-05 -0.001817 -0.005282 0.0438859 0.0396435PCLO Piccolo (presynaptic cytomatrix protein) 70 +/- 10 73 +/- 10 145 +/- 14 129 +/- 13 2.24E-05 0.8356554 -0.419956 0.2790293 0.4108378PCMTD1 protein-L-isoaspartate (D-aspartate) O-methyltransferase domain containing 1 416 +/- 44 527 +/- 52 610 +/- 46 619 +/- 28 0.008168 0.1355157 0.868923 0.1658645 0.9334954PCSK1N proprotein convertase subtilisin/kexin type 1 inhibitor 4821 +/- 222 4645 +/- 264 6220 +/- 120 6379 +/- 174 2.78E-06 -0.621131 0.473382 0.2943972 0.962108PCTK1 PCTAIRE protein kinase 1 623 +/- 24 568 +/- 32 793 +/- 32 758 +/- 34 2.5E-05 -0.195485 -0.471522 0.1665812 0.1593949PCYT1A phosphate cytidylyltransferase 1, choline, alpha 86 +/- 6 95 +/- 8 108 +/- 11 132 +/- 17 0.03225 0.4287356 0.262044 0.3271767 0.162941PDAP1 PDGFA associated protein 1 1147 +/- 90 1105 +/- 54 1359 +/- 51 1259 +/- 19 0.029413 -0.703854 -0.113849 0.5077124 0.469584PDCD2 programmed cell death 2 1615 +/- 90 1458 +/- 56 1921 +/- 63 1848 +/- 68 0.000578 -0.173641 -0.454813 0.1904585 0.7437484PDCD6IP programmed cell death 6 interacting protein 1108 +/- 45 997 +/- 36 1209 +/- 22 1087 +/- 41 0.005832 -0.084134 -0.03722 0.1395256 0.0535386PDE3B phosphodiesterase 3B, cGMP-inhibited 128 +/- 7 139 +/- 13 172 +/- 13 156 +/- 9 0.023799 0.503465 -0.335448 0.667793 0.3003892PDE8B phosphodiesterase 8B 248 +/- 54 368 +/- 71 377 +/- 54 570 +/- 63 0.005075 0.2073609 0.04528 0.6610919 0.3982629PDGFC Platelet derived growth factor C 131 +/- 24 160 +/- 22 158 +/- 20 179 +/- 30 0.04805 0.4023728 0.572921 0.5540251 0.8339853PDIA3 protein disulfide isomerase family A, member 3 143 +/- 8 130 +/- 18 173 +/- 14 152 +/- 15 0.037991 -0.523208 -0.341739 0.2420777 0.1275054PDK2 pyruvate dehydrogenase kinase, isozyme 2 858 +/- 49 910 +/- 38 1065 +/- 42 1142 +/- 36 0.000265 0.4284164 0.192543 0.8789779 0.4805409PDK3 Pyruvate dehydrogenase kinase, isozyme 3 704 +/- 98 960 +/- 111 993 +/- 129 1593 +/- 94 0.000496 0.113882 0.00477 0.4282027 0.0643055
S2-genes differentially expressed across region.xls Page 21

Symbol Description Young CA Aged CA Young DG Aged DG CA v DG CA Y v A DG Y v A CA to PMI DG to PMIPDLIM5 PDZ and LIM domain 5 599 +/- 216 870 +/- 119 731 +/- 217 1228 +/- 86 0.005761 0.3051137 0.074103 0.4120091 0.2290282PDZD4 PDZ domain containing 4 3783 +/- 310 3565 +/- 446 4446 +/- 316 4425 +/- 290 0.032335 -0.699013 -0.961908 0.4809484 0.9422691PDZD8 PDZ domain containing 8 271 +/- 60 345 +/- 37 353 +/- 56 445 +/- 22 0.004394 0.321713 0.175416 0.2597872 0.2398167PEA15 phosphoprotein enriched in astrocytes 15 14228 +/- 407 15719 +/- 171 16261 +/- 383 17626 +/- 635 0.001449 0.0125159 0.110018 0.0156896 0.3490645PECR peroxisomal trans-2-enoyl-CoA reductase 242 +/- 16 218 +/- 22 292 +/- 26 246 +/- 17 0.01089 -0.396809 -0.183302 0.9023752 0.398901PELI1 Pellino homolog 1 (Drosophila) 365 +/- 31 387 +/- 31 450 +/- 34 479 +/- 55 0.009326 0.6226172 0.669479 0.4346985 0.1170485PELI3 pellino homolog 3 (Drosophila) 395 +/- 37 431 +/- 37 464 +/- 27 466 +/- 12 0.001595 0.5145036 0.926785 0.7288256 0.7831766PER3 Period homolog 3 (Drosophila) 83 +/- 10 104 +/- 11 142 +/- 17 152 +/- 16 0.005783 0.189197 0.689759 0.4690703 0.8291918PERLD1 per1-like domain containing 1 518 +/- 27 460 +/- 26 554 +/- 25 531 +/- 25 0.047237 -0.153677 -0.53496 0.3604362 0.8646718PERQ1 PERQ amino acid rich, with GYF domain 1 277 +/- 29 340 +/- 41 386 +/- 30 385 +/- 32 0.026901 0.2373479 -0.977119 0.1391125 0.7945747PEX1 peroxisome biogenesis factor 1 287 +/- 25 338 +/- 14 427 +/- 38 421 +/- 41 0.013313 0.1115574 -0.927683 0.1595497 0.3825966PFDN4 prefoldin subunit 4 737 +/- 71 858 +/- 41 809 +/- 83 1017 +/- 19 0.014219 0.178896 0.053249 0.1720676 0.2405397PFTK1 PFTAIRE protein kinase 1 5855 +/- 484 4985 +/- 417 7553 +/- 181 6831 +/- 397 7.23E-05 -0.203789 -0.151968 0.2039817 0.2849173PGAM5 phosphoglycerate mutase family member 5 281 +/- 55 207 +/- 18 322 +/- 30 313 +/- 30 0.013395 -0.242154 -0.821408 0.1651589 0.6510883PGBD1 piggyBac transposable element derived 1 355 +/- 32 424 +/- 35 412 +/- 15 406 +/- 35 0.038967 0.1790127 -0.876439 0.0109031 0.2874278PGBD3 piggyBac transposable element derived 3 247 +/- 13 262 +/- 17 310 +/- 15 281 +/- 16 0.025233 0.5062626 -0.226667 0.3932836 0.3399674PGBD5 piggyBac transposable element derived 5 6236 +/- 795 5493 +/- 857 7638 +/- 365 7827 +/- 266 0.004081 -0.539617 0.686516 0.422325 0.9795432PGLS 6-phosphogluconolactonase 1831 +/- 34 1684 +/- 66 2078 +/- 78 2070 +/- 115 0.000516 -0.085313 -0.953696 0.1252865 0.7999246PGRMC1 progesterone receptor membrane component 1 2730 +/- 146 2649 +/- 115 3350 +/- 249 2861 +/- 162 0.011082 -0.676088 -0.136712 0.5490754 0.2978251PHACTR2 phosphatase and actin regulator 2 137 +/- 29 119 +/- 11 169 +/- 31 179 +/- 24 0.012061 -0.569764 0.809339 0.4427445 0.9309784PHC3 Polyhomeotic like 3 (Drosophila) 83 +/- 5 113 +/- 9 127 +/- 13 127 +/- 17 0.036711 0.0254323 -0.986452 0.0747679 0.4313701PHF10 PHD finger protein 10 327 +/- 31 419 +/- 15 380 +/- 14 460 +/- 26 0.044383 0.0325161 0.034908 0.0388483 0.1085417PHKA2 phosphorylase kinase, alpha 2 (liver) 175 +/- 5 160 +/- 11 207 +/- 18 184 +/- 9 0.016274 -0.233042 -0.285452 0.9906048 0.5778136PHKG2 phosphorylase kinase, gamma 2 (testis) 1152 +/- 43 1029 +/- 48 1264 +/- 53 1159 +/- 41 0.002258 -0.087534 -0.152446 0.1256141 0.223844PHYHIP phytanoyl-CoA 2-hydroxylase interacting protein 4118 +/- 485 3734 +/- 478 5326 +/- 231 5449 +/- 217 0.001771 -0.585295 0.708588 0.4241773 0.5794907PIB5PA phosphatidylinositol (4,5) bisphosphate 5-phosphatase, A 467 +/- 42 481 +/- 47 576 +/- 45 639 +/- 49 0.002976 0.8285 0.370199 0.7533565 0.7512232PIGX phosphatidylinositol glycan, class X 397 +/- 18 439 +/- 27 565 +/- 30 500 +/- 19 0.005052 0.2297089 -0.105512 0.3086768 0.0410702PIK4CA phosphatidylinositol 4-kinase, catalytic, alpha polypeptide 5386 +/- 366 4686 +/- 391 5724 +/- 179 5401 +/- 76 0.02877 -0.220025 -0.142191 0.1857942 0.3860298PIP5K1C phosphatidylinositol-4-phosphate 5-kinase, type I, gamma 1274 +/- 207 997 +/- 81 1681 +/- 70 1642 +/- 50 0.001558 -0.254248 -0.665272 0.1665274 0.9126233PIPOX pipecolic acid oxidase 388 +/- 35 493 +/- 32 447 +/- 29 523 +/- 16 0.046104 0.0521533 0.051334 0.0365581 0.3326665PITPNC1 Phosphatidylinositol transfer protein, cytoplasmic 1 130 +/- 18 150 +/- 13 145 +/- 6 207 +/- 21 0.04088 0.3841422 0.036598 0.1265199 0.0304022PKD1 polycystic kidney disease 1 (autosomal dominant) 206 +/- 28 238 +/- 17 397 +/- 27 389 +/- 35 0.000259 0.3630592 -0.845297 0.9366522 0.8629816PLCB4 phospholipase C, beta 4 168 +/- 17 177 +/- 16 198 +/- 6 207 +/- 9 0.017946 0.7101964 0.439328 0.9362058 0.2352323PLCH2 phospholipase C, eta 2 370 +/- 51 502 +/- 14 513 +/- 63 801 +/- 59 0.000977 0.0493627 0.008957 0.0679472 0.0876322PLDN pallidin homolog (mouse) 2387 +/- 83 2511 +/- 102 2561 +/- 45 2750 +/- 87 0.010351 0.3677328 0.100902 0.8406481 0.4915065PLEKHA2 pleckstrin homology domain containing, family A (phosphoinositide binding specific) mem 1645 +/- 642 2063 +/- 631 4165 +/- 342 4910 +/- 263 0.000506 0.652401 0.119086 0.6865533 0.1803055PLEKHA5 Pleckstrin homology domain containing, family A member 5 566 +/- 51 398 +/- 55 952 +/- 56 599 +/- 55 0.000798 -0.048983 -0.001487 0.0944605 0.0453485PLEKHG5 pleckstrin homology domain containing, family G (with RhoGef domain) member 5 548 +/- 58 556 +/- 54 879 +/- 69 875 +/- 97 0.000183 0.928448 -0.973622 0.7542979 0.7238556PLIN perilipin 253 +/- 24 316 +/- 33 401 +/- 27 354 +/- 7 0.000972 0.1520385 -0.141389 0.1926004 0.1674565PLOD2 procollagen-lysine, 2-oxoglutarate 5-dioxygenase 2 200 +/- 26 179 +/- 19 274 +/- 19 272 +/- 4 0.000682 -0.526641 -0.922163 0.7050425 0.7733562PLXNA3 plexin A3 205 +/- 22 318 +/- 36 319 +/- 36 416 +/- 24 0.017336 0.0281193 0.054836 0.0386071 0.213522PLXNA4A plexin A4, A 1258 +/- 206 1199 +/- 232 2560 +/- 186 2273 +/- 82 3.24E-05 -0.853418 -0.202188 0.7929925 0.1445527PMM1 phosphomannomutase 1 557 +/- 41 531 +/- 20 616 +/- 23 601 +/- 34 0.035453 -0.589295 -0.724655 0.482258 0.7162024PMS2 PMS2 postmeiotic segregation increased 2 (S. cerevisiae) 429 +/- 49 1254 +/- 258 530 +/- 58 1843 +/- 341 0.028227 0.0231495 0.017205 0.2009082 0.1194689PMS2L1 postmeiotic segregation increased 2-like 1 1989 +/- 162 1846 +/- 195 2743 +/- 170 2739 +/- 122 0.00052 -0.583559 -0.985026 0.3680355 0.3705689
S2-genes differentially expressed across region.xls Page 22

Symbol Description Young CA Aged CA Young DG Aged DG CA v DG CA Y v A DG Y v A CA to PMI DG to PMIPNCK pregnancy upregulated non-ubiquitously expressed CaM kinase 583 +/- 36 459 +/- 43 769 +/- 37 629 +/- 37 0.000565 -0.052096 -0.026386 0.0213662 0.0186213PNMA6A paraneoplastic antigen like 6A 352 +/- 18 343 +/- 34 403 +/- 30 414 +/- 16 0.047138 -0.804881 0.765792 0.4455074 0.7412188PNPO pyridoxine 5'-phosphate oxidase 786 +/- 88 738 +/- 63 971 +/- 36 1091 +/- 52 0.000492 -0.671859 0.096909 0.5164823 0.3120607POLD2 Polymerase (DNA directed), delta 2, regulatory subunit 50kDa 88 +/- 13 142 +/- 12 136 +/- 20 197 +/- 12 0.002295 0.0118311 0.028238 0.0796663 0.2561202POLG polymerase (DNA directed), gamma 1237 +/- 137 1440 +/- 127 1489 +/- 88 1711 +/- 27 0.01403 0.3033735 0.053158 0.1883551 0.1166869POLR2J2 DNA directed RNA polymerase II polypeptide J-related gene 99 +/- 12 109 +/- 12 148 +/- 7 152 +/- 18 0.000431 0.5514201 0.845704 0.5854269 0.8352996POLR3G polymerase (RNA) III (DNA directed) polypeptide G (32kD) 105 +/- 12 145 +/- 26 185 +/- 19 196 +/- 22 0.001781 0.1969307 0.703311 0.0626024 0.8856579POLS Polymerase (DNA directed) sigma 123 +/- 12 117 +/- 13 164 +/- 16 125 +/- 15 0.045445 -0.72565 -0.103764 0.9247623 0.1931912PPARGC1Bperoxisome proliferative activated receptor, gamma, coactivator 1, beta 214 +/- 21 190 +/- 18 302 +/- 26 318 +/- 26 0.000445 -0.395729 0.688727 0.291459 0.6419474PPAT phosphoribosyl pyrophosphate amidotransferase 402 +/- 24 384 +/- 26 457 +/- 19 448 +/- 9 0.021824 -0.625755 -0.711799 0.6931226 0.8975347PPFIA2 protein tyrosine phosphatase, receptor type, f polypeptide (PTPRF), interacting protein (lip 2104 +/- 410 1922 +/- 516 4103 +/- 315 4205 +/- 250 0.000988 -0.787347 0.806498 0.6836595 0.7915775PPFIA4 protein tyrosine phosphatase, receptor type, f polypeptide (PTPRF), interacting protein (lip 1441 +/- 132 1292 +/- 155 2032 +/- 145 1947 +/- 101 0.000379 -0.484273 -0.645035 0.3093163 0.6870115PPM1E protein phosphatase 1E (PP2C domain containing) 2356 +/- 357 1782 +/- 252 2989 +/- 122 2473 +/- 54 0.006709 -0.221718 -0.0065 0.2717452 0.074406PPM1G protein phosphatase 1G (formerly 2C), magnesium-dependent, gamma isoform 878 +/- 33 852 +/- 20 906 +/- 20 891 +/- 11 0.022641 -0.519842 -0.537097 0.6782777 0.8354357PPP1CB protein phosphatase 1, catalytic subunit, beta isoform 508 +/- 37 480 +/- 29 699 +/- 42 612 +/- 54 0.000824 -0.558828 -0.237574 0.8092809 0.2882098PPP1CC protein phosphatase 1, catalytic subunit, gamma isoform 5446 +/- 240 5140 +/- 254 5881 +/- 153 6000 +/- 183 0.001545 -0.401496 0.630623 0.3485333 0.8270337PPP1R1A protein phosphatase 1, regulatory (inhibitor) subunit 1A 1913 +/- 322 2096 +/- 505 4210 +/- 569 4809 +/- 390 0.001982 0.7666381 0.409282 0.8644658 0.3356238PPP1R3E Protein phosphatase 1, regulatory (inhibitor) subunit 3E 694 +/- 57 902 +/- 71 992 +/- 47 1125 +/- 45 0.000582 0.0457328 0.071171 0.0148811 0.0623085PPP1R3F protein phosphatase 1, regulatory (inhibitor) subunit 3F 346 +/- 24 382 +/- 21 470 +/- 15 458 +/- 26 0.001123 0.2919433 -0.703384 0.429591 0.1955556PPP1R9B protein phosphatase 1, regulatory subunit 9B, spinophilin 7112 +/- 616 6504 +/- 616 8895 +/- 337 9332 +/- 312 0.00063 -0.500824 0.366438 0.3552957 0.1971081PPTC7 PTC7 protein phosphatase homolog (S. cerevisiae) 1273 +/- 82 1367 +/- 107 1348 +/- 44 1566 +/- 91 0.031917 0.5031911 0.074304 0.8513528 0.1415888PR47 platelet receptor for type III collagen, 47 kDa 322 +/- 22 435 +/- 46 397 +/- 25 512 +/- 42 0.002998 0.0619977 0.054506 0.0131489 0.0095289PRDM2 PR domain containing 2, with ZNF domain 347 +/- 45 386 +/- 34 436 +/- 22 557 +/- 23 0.001651 0.5105142 0.004008 0.5401439 0.004555PRDM5 PR domain containing 5 120 +/- 17 108 +/- 8 149 +/- 6 142 +/- 12 0.00768 -0.539256 -0.64462 0.3091156 0.2586583PRDM7 PR domain containing 7 105 +/- 9 95 +/- 9 145 +/- 16 145 +/- 10 0.000165 -0.448909 0.978421 0.5126945 0.8346422PRDM8 PR domain containing 8 152 +/- 13 167 +/- 16 295 +/- 39 307 +/- 45 0.000259 0.473436 0.851306 0.7118337 0.9701559PRDX6 peroxiredoxin 6 5355 +/- 529 6504 +/- 257 6108 +/- 398 7058 +/- 298 0.036231 0.0905172 0.089208 0.113441 0.527258PRKACA protein kinase, cAMP-dependent, catalytic, alpha 100 +/- 12 122 +/- 12 205 +/- 16 218 +/- 20 5.43E-05 0.2280085 0.641599 0.3751015 0.6618126PRKCE protein kinase C, epsilon 3996 +/- 353 3507 +/- 372 4337 +/- 256 4031 +/- 136 0.006434 -0.362185 -0.323772 0.4046337 0.7751352PRKCG protein kinase C, gamma 2371 +/- 543 1678 +/- 233 3102 +/- 262 3228 +/- 306 0.012822 -0.280593 0.762009 0.1618917 0.8708546PRMT6 protein arginine methyltransferase 6 268 +/- 33 294 +/- 30 321 +/- 41 345 +/- 27 0.009411 0.5607052 0.638768 0.605056 0.7282607PRO0149 PRO0149 protein 3917 +/- 388 3006 +/- 191 4784 +/- 216 3768 +/- 160 0.000998 -0.071798 -0.004643 0.1491221 0.0692187ProSAPiP1ProSAPiP1 protein 3884 +/- 236 3677 +/- 237 4142 +/- 254 4345 +/- 227 0.037457 -0.5503 0.566546 0.2422239 0.643564PROSC proline synthetase co-transcribed homolog (bacterial) 599 +/- 88 459 +/- 83 723 +/- 106 583 +/- 146 0.034988 -0.274495 -0.461482 0.3828644 0.3152514PROX1 Prospero-related homeobox 1 672 +/- 187 825 +/- 133 1884 +/- 163 1688 +/- 231 0.000538 0.5229816 -0.510036 0.3625898 0.872622PRPF18 PRP18 pre-mRNA processing factor 18 homolog (S. cerevisiae) 115 +/- 10 97 +/- 13 153 +/- 18 133 +/- 14 0.023639 -0.293936 -0.414367 0.4640357 0.5258124PRPF38B PRP38 pre-mRNA processing factor 38 (yeast) domain containing B 78 +/- 7 84 +/- 11 106 +/- 10 151 +/- 25 0.010801 0.655778 0.15812 0.3464512 0.5934427PRPS1 phosphoribosyl pyrophosphate synthetase 1 134 +/- 15 123 +/- 11 177 +/- 14 207 +/- 9 0.00147 -0.554264 0.115717 0.208459 0.7674876PRR12 proline rich 12 521 +/- 29 456 +/- 25 874 +/- 37 813 +/- 56 6.58E-06 -0.119664 -0.401013 0.0721456 0.8684192PRR14 proline rich 14 629 +/- 43 691 +/- 22 1014 +/- 25 946 +/- 28 7.93E-06 0.233552 -0.104254 0.2307053 0.4352825PRR5 proline rich 5 (renal) 314 +/- 23 325 +/- 37 385 +/- 30 404 +/- 57 0.017983 0.8135638 0.776268 0.5733081 0.6633652PRRT2 proline-rich transmembrane protein 2 2834 +/- 205 2773 +/- 306 4220 +/- 265 4039 +/- 143 4.38E-05 -0.872433 -0.565246 0.4240193 0.344864PRSS21 protease, serine, 21 (testisin) 154 +/- 18 182 +/- 13 167 +/- 4 246 +/- 21 0.020264 0.2276938 0.019111 0.026258 2.454E-05PRUNE prune homolog (Drosophila) 113 +/- 20 83 +/- 8 141 +/- 15 138 +/- 7 0.024337 -0.195964 -0.864036 0.2726022 0.6885329PSAP prosaposin (variant Gaucher disease and variant metachromatic leukodystrophy) 7343 +/- 430 6944 +/- 440 7898 +/- 292 8391 +/- 294 0.002159 -0.5309 0.264842 0.2125014 0.8457605
S2-genes differentially expressed across region.xls Page 23

Symbol Description Young CA Aged CA Young DG Aged DG CA v DG CA Y v A DG Y v A CA to PMI DG to PMIPSCD2 pleckstrin homology, Sec7 and coiled-coil domains 2 (cytohesin-2) 1012 +/- 49 896 +/- 46 1070 +/- 31 1034 +/- 25 0.014539 -0.11572 -0.402603 0.0387049 0.153735PSD pleckstrin and Sec7 domain containing 6439 +/- 917 5362 +/- 836 8516 +/- 437 8250 +/- 403 0.002204 -0.406092 -0.664429 0.1999838 0.4657071PSMA1 proteasome (prosome, macropain) subunit, alpha type, 1 2881 +/- 149 2517 +/- 112 3221 +/- 146 2822 +/- 191 0.049485 -0.081981 -0.135503 0.1593462 0.6351256PSMB7 Proteasome (prosome, macropain) subunit, beta type, 7 371 +/- 27 515 +/- 39 467 +/- 43 650 +/- 85 0.007924 0.0143763 0.103113 0.0689831 0.4534666PSMF1 proteasome (prosome, macropain) inhibitor subunit 1 (PI31) 521 +/- 41 572 +/- 19 669 +/- 30 638 +/- 45 0.0045 0.2966879 -0.573243 0.2071042 0.4439162PSRC1 proline/serine-rich coiled-coil 1 1655 +/- 228 1682 +/- 286 2422 +/- 176 2462 +/- 145 0.00491 0.9429163 0.86546 0.9621631 0.5532965PTCHD2 patched domain containing 2 219 +/- 37 281 +/- 44 410 +/- 14 382 +/- 62 0.012216 0.3094278 -0.683136 0.3869426 0.9903197PTK2B PTK2B protein tyrosine kinase 2 beta 1130 +/- 248 892 +/- 144 1495 +/- 96 1331 +/- 31 0.008662 -0.430023 -0.15465 0.2807783 0.4040677PTMS parathymosin 564 +/- 27 451 +/- 59 772 +/- 43 611 +/- 28 0.001747 -0.12446 -0.013133 0.1036381 0.0200266PTOV1 prostate tumor overexpressed gene 1 3925 +/- 83 4061 +/- 73 4615 +/- 175 5076 +/- 123 0.000138 0.2433193 0.060998 0.0969817 0.2466308PTPLA protein tyrosine phosphatase-like (proline instead of catalytic arginine), member A 173 +/- 49 187 +/- 26 358 +/- 29 307 +/- 36 5.84E-05 0.81363 -0.304362 0.5596936 0.5725918PTPLAD1 protein tyrosine phosphatase-like A domain containing 1 6112 +/- 562 7457 +/- 399 7287 +/- 65 8263 +/- 403 0.015102 0.0830088 0.071859 0.2210998 0.188772PTPN2 protein tyrosine phosphatase, non-receptor type 2 179 +/- 25 130 +/- 5 268 +/- 19 220 +/- 30 0.001237 -0.10636 -0.22009 0.1014129 0.3462098PTPN23 protein tyrosine phosphatase, non-receptor type 23 151 +/- 10 158 +/- 7 380 +/- 24 437 +/- 34 6.44E-07 0.5989845 0.219274 0.9075274 0.3110285PTPN4 protein tyrosine phosphatase, non-receptor type 4 (megakaryocyte) 246 +/- 44 202 +/- 24 319 +/- 38 235 +/- 20 0.030546 -0.405015 -0.085597 0.4106939 0.1783452PTPRS protein tyrosine phosphatase, receptor type, S 82 +/- 20 72 +/- 18 131 +/- 10 126 +/- 15 0.004117 -0.719537 -0.797785 0.9997926 0.7536546PTS 6-pyruvoyltetrahydropterin synthase 385 +/- 18 425 +/- 33 533 +/- 49 536 +/- 60 0.000163 0.3145322 0.975155 0.4432393 0.911116PTTG1IP pituitary tumor-transforming 1 interacting protein 1120 +/- 55 1138 +/- 62 1299 +/- 51 1386 +/- 77 0.017836 0.823153 0.375653 0.3940951 0.8723619PURB purine-rich element binding protein B 936 +/- 78 839 +/- 60 1218 +/- 51 1114 +/- 68 0.001017 -0.347596 -0.259331 0.1063926 0.0474873PUS7 pseudouridylate synthase 7 homolog (S. cerevisiae) 228 +/- 10 224 +/- 36 248 +/- 12 252 +/- 46 0.021269 -0.916403 0.934618 0.3232159 0.1708657PVR poliovirus receptor 87 +/- 11 110 +/- 6 130 +/- 6 144 +/- 14 0.003259 0.0942913 0.390507 0.0707403 0.1747505QPCT glutaminyl-peptide cyclotransferase (glutaminyl cyclase) 527 +/- 102 510 +/- 108 984 +/- 86 1096 +/- 204 2.22E-05 -0.912268 0.633141 0.8001084 0.690394QSCN6L1 quiescin Q6-like 1 715 +/- 62 579 +/- 58 1381 +/- 87 1148 +/- 33 1.21E-09 -0.143148 -0.044212 0.175206 0.1498206QTRT1 queuine tRNA-ribosyltransferase 1 (tRNA-guanine transglycosylase) 256 +/- 22 498 +/- 21 323 +/- 31 587 +/- 36 0.020811 1.482E-05 0.000476 0.0059661 0.0016492RAB10 RAB10, member RAS oncogene family 105 +/- 12 136 +/- 19 144 +/- 11 143 +/- 8 0.039699 0.2097026 -0.918551 0.1844926 0.3004474RAB11B RAB11B, member RAS oncogene family 4485 +/- 192 4565 +/- 280 6708 +/- 245 6448 +/- 94 3.62E-07 0.8183857 -0.358544 0.855232 0.4698891RAB11FIP2RAB11 family interacting protein 2 (class I) 804 +/- 77 838 +/- 90 1269 +/- 118 1219 +/- 37 9.71E-05 0.7825742 -0.700985 0.8370775 0.748893RAB12 RAB12, member RAS oncogene family 321 +/- 25 439 +/- 34 442 +/- 78 498 +/- 58 0.034932 0.0211394 0.581549 0.0528651 0.6551118RAB22A RAB22A, member RAS oncogene family 3247 +/- 178 2973 +/- 123 3675 +/- 96 3565 +/- 162 0.001043 -0.238385 -0.577928 0.1773529 0.5680772RAB39B RAB39B, member RAS oncogene family 898 +/- 51 860 +/- 25 1029 +/- 72 1040 +/- 31 0.004883 -0.520088 0.893186 0.2007007 0.9953222RAB3D RAB3D, member RAS oncogene family 194 +/- 32 175 +/- 17 257 +/- 27 288 +/- 16 0.001971 -0.602833 0.354208 0.8057355 0.2833045RAB3IP RAB3A interacting protein (rabin3) 167 +/- 12 191 +/- 19 202 +/- 19 246 +/- 15 0.00961 0.3068411 0.097491 0.2146503 0.361122RAB6IP2 RAB6 interacting protein 2 153 +/- 26 103 +/- 9 195 +/- 25 180 +/- 21 0.015009 -0.120469 -0.665416 0.0685205 0.7651142RAB8B RAB8B, member RAS oncogene family 397 +/- 38 402 +/- 36 545 +/- 46 601 +/- 43 0.001902 0.9257873 0.402756 0.9600861 0.8778103RABEPK Rab9 effector protein with kelch motifs 1221 +/- 139 1124 +/- 116 1788 +/- 162 1733 +/- 114 0.000954 -0.604913 -0.788298 0.3888761 0.4776052RAC3 ras-related C3 botulinum toxin substrate 3 (rho family, small GTP binding protein Rac3) 489 +/- 32 422 +/- 12 573 +/- 36 591 +/- 29 0.004033 -0.099674 0.703528 0.0434275 0.7173997RAD23A RAD23 homolog A (S. cerevisiae) 2113 +/- 100 2174 +/- 122 2527 +/- 127 2568 +/- 209 0.005817 0.7071364 0.870964 0.9465637 0.3990426RAD51L3 RAD51-like 3 (S. cerevisiae) 190 +/- 9 204 +/- 12 250 +/- 15 240 +/- 10 0.004866 0.3655233 -0.592161 0.2344551 0.7811717RAD52 RAD52 homolog (S. cerevisiae) 114 +/- 21 165 +/- 13 189 +/- 16 213 +/- 25 0.0174 0.0744451 0.449711 0.0124654 0.6361856RALGPS2 Ral GEF with PH domain and SH3 binding motif 2 280 +/- 27 193 +/- 19 326 +/- 37 295 +/- 16 0.008765 -0.026246 -0.484099 0.2424974 0.6605985RANBP5 RAN binding protein 5 936 +/- 51 1233 +/- 94 1110 +/- 54 1359 +/- 44 0.039116 0.025319 0.005956 0.1892396 0.1865095RANBP9 RAN binding protein 9 690 +/- 55 605 +/- 43 849 +/- 24 906 +/- 80 0.002602 -0.253063 0.527108 0.2836185 0.9596956RAPGEF1 Rap guanine nucleotide exchange factor (GEF) 1 616 +/- 50 396 +/- 101 775 +/- 26 416 +/- 82 0.043348 -0.091584 -0.0095 0.072241 0.0039693RAPGEF2 Rap guanine nucleotide exchange factor (GEF) 2 83 +/- 10 62 +/- 10 145 +/- 12 119 +/- 4 2.34E-05 -0.179458 -0.088938 0.1507976 0.037781RAPGEFL1Rap guanine nucleotide exchange factor (GEF)-like 1 1885 +/- 109 1723 +/- 162 2860 +/- 200 2567 +/- 150 6.42E-05 -0.427791 -0.271608 0.3111031 0.5439641
S2-genes differentially expressed across region.xls Page 24

Symbol Description Young CA Aged CA Young DG Aged DG CA v DG CA Y v A DG Y v A CA to PMI DG to PMIRAPH1 Ras association (RalGDS/AF-6) and pleckstrin homology domains 1 176 +/- 32 166 +/- 25 251 +/- 33 244 +/- 29 0.030404 -0.797325 -0.860131 0.6091869 0.6624251RASA1 RAS p21 protein activator (GTPase activating protein) 1 280 +/- 29 303 +/- 28 361 +/- 33 358 +/- 48 0.034413 0.5864133 -0.957737 0.1111604 0.5111607RASA2 RAS p21 protein activator 2 418 +/- 42 488 +/- 35 603 +/- 51 671 +/- 18 0.000205 0.2347056 0.252934 0.4320581 0.5140061RASA3 RAS p21 protein activator 3 162 +/- 27 166 +/- 20 200 +/- 15 257 +/- 20 0.008713 0.9114708 0.052284 0.8869965 0.0237445RASAL1 RAS protein activator like 1 (GAP1 like) 314 +/- 37 235 +/- 36 343 +/- 28 328 +/- 17 0.047983 -0.153951 -0.670509 0.2264319 0.5461943RASAL2 RAS protein activator like 2 324 +/- 18 409 +/- 46 449 +/- 47 452 +/- 65 0.008586 0.1290618 0.972509 0.0276984 0.5289273RASD2 RASD family, member 2 813 +/- 162 773 +/- 176 1607 +/- 232 1677 +/- 147 0.000628 -0.872824 0.806836 0.6943011 0.6564199RASGRF2 Ras protein-specific guanine nucleotide-releasing factor 2 335 +/- 22 273 +/- 17 423 +/- 53 365 +/- 12 0.015254 -0.048142 -0.333609 0.0328393 0.3533591RASL10B RAS-like, family 10, member B 590 +/- 59 624 +/- 87 801 +/- 45 879 +/- 127 0.001014 0.7507346 0.588747 0.98104 0.8326617RASL11A RAS-like, family 11, member A 132 +/- 22 136 +/- 9 169 +/- 20 178 +/- 23 0.039437 0.8723694 0.788188 0.7101726 0.6581739RBBP4 Retinoblastoma binding protein 4 249 +/- 20 207 +/- 24 276 +/- 21 291 +/- 29 0.006744 -0.19939 0.685426 0.1893722 0.4350101RBM11 RNA binding motif protein 11 201 +/- 38 195 +/- 16 284 +/- 42 306 +/- 16 0.001256 -0.884347 0.644036 0.9732285 0.7444476RBM13 RNA binding motif protein 13 463 +/- 34 385 +/- 16 506 +/- 17 477 +/- 18 0.009931 -0.077644 -0.271747 0.1756137 0.9210227RBM15B RNA binding motif protein 15B 878 +/- 30 852 +/- 59 943 +/- 44 973 +/- 49 0.039279 -0.704646 0.658372 0.7465815 0.5583219RBM25 RNA binding motif protein 25 1188 +/- 33 1453 +/- 33 1540 +/- 42 1830 +/- 101 3.38E-05 0.0002076 0.041769 0.0052 0.2262857RBM33 RNA binding motif protein 33 475 +/- 19 501 +/- 6 548 +/- 20 591 +/- 30 0.001125 0.2382658 0.271446 0.1788918 0.2214815RBMXL1 RNA binding motif protein, X-linked-like 1 1447 +/- 44 1539 +/- 65 1762 +/- 51 1747 +/- 55 0.000596 0.2720333 -0.851126 0.2747617 0.9421726RBP4 retinol binding protein 4, plasma 3170 +/- 320 2513 +/- 318 3602 +/- 191 3351 +/- 160 0.021238 -0.175499 -0.341143 0.1610624 0.1462001RCE1 RCE1 homolog, prenyl protein peptidase (S. cerevisiae) 601 +/- 19 662 +/- 33 808 +/- 58 687 +/- 35 0.016929 0.1446353 -0.108276 0.1947384 0.2062164RCOR1 REST corepressor 1 724 +/- 69 692 +/- 65 959 +/- 33 890 +/- 52 0.004938 -0.740265 -0.305182 0.6085367 0.8458175RDH10 retinol dehydrogenase 10 (all-trans) 114 +/- 20 92 +/- 17 135 +/- 14 145 +/- 26 0.015836 -0.419978 0.725073 0.719916 0.8607565RDH11 retinol dehydrogenase 11 (all-trans/9-cis/11-cis) 849 +/- 27 901 +/- 60 1459 +/- 71 1744 +/- 114 9.86E-07 0.4576926 0.073114 0.4798064 0.354908REEP2 receptor accessory protein 2 1273 +/- 34 1129 +/- 71 1401 +/- 45 1248 +/- 55 0.000165 -0.108961 -0.061383 0.1025827 0.0758981RENBP renin binding protein 106 +/- 14 148 +/- 12 134 +/- 15 152 +/- 8 0.018497 0.053118 0.33391 0.1560433 0.2784616REXO1 REX1, RNA exonuclease 1 homolog (S. cerevisiae) 655 +/- 28 517 +/- 30 915 +/- 58 744 +/- 67 0.000389 -0.007209 -0.08753 0.0019855 0.2431326RFNG radical fringe homolog (Drosophila) 490 +/- 18 545 +/- 21 583 +/- 19 626 +/- 14 0.000199 0.0700264 0.109561 0.1126252 0.41884RFP2 ret finger protein 2 851 +/- 43 760 +/- 39 942 +/- 65 860 +/- 22 0.014094 -0.153933 -0.27531 0.4538743 0.7489593RFXDC2 regulatory factor X domain containing 2 118 +/- 18 107 +/- 10 152 +/- 16 146 +/- 13 0.036934 -0.615093 -0.770932 0.8637923 0.7002586RGAG4 retrotransposon gag domain containing 4 755 +/- 18 741 +/- 51 846 +/- 36 768 +/- 36 0.035734 -0.805065 -0.157981 0.8526463 0.178816RGMB RGM domain family, member B 819 +/- 119 647 +/- 111 1010 +/- 93 865 +/- 99 0.000703 -0.315691 -0.315332 0.1146151 0.1019076RGPD5 RANBP2-like and GRIP domain containing 5 241 +/- 37 184 +/- 13 312 +/- 43 248 +/- 22 0.019929 -0.194614 -0.220043 0.2570417 0.5634338RGS11 regulator of G-protein signalling 11 262 +/- 54 525 +/- 62 397 +/- 50 606 +/- 54 0.016368 0.0094108 0.019498 0.0761906 0.0269708RHOT1 ras homolog gene family, member T1 273 +/- 25 323 +/- 28 377 +/- 19 343 +/- 13 0.006699 0.2147774 -0.164211 0.2595788 0.1355325RIC3 resistance to inhibitors of cholinesterase 3 homolog (C. elegans) 250 +/- 42 198 +/- 12 287 +/- 31 316 +/- 23 0.037902 -0.281804 0.46362 0.1732732 0.8237914RICS Rho GTPase-activating protein 284 +/- 32 258 +/- 18 351 +/- 20 392 +/- 24 0.004588 -0.500555 0.218109 0.3805116 0.1281806RIS1 Ras-induced senescence 1 1904 +/- 153 2190 +/- 193 2560 +/- 118 2356 +/- 92 0.013539 0.2718364 -0.207118 0.7430148 0.1753443RIT2 Ras-like without CAAX 2 609 +/- 31 437 +/- 55 775 +/- 62 568 +/- 48 0.002842 -0.025575 -0.027876 0.0778629 0.0628945RLTPR RGD, leucine-rich repeat, tropomodulin and proline-rich containing protein 1022 +/- 127 895 +/- 85 1350 +/- 79 1389 +/- 68 0.001896 -0.429193 0.713318 0.4223463 0.7380079RMND5A required for meiotic nuclear division 5 homolog A (S. cerevisiae) 1839 +/- 181 1737 +/- 125 2391 +/- 146 2367 +/- 191 0.000845 -0.653898 -0.923399 0.9939108 0.8336583RMND5B required for meiotic nuclear division 5 homolog B (S. cerevisiae) 479 +/- 38 527 +/- 42 584 +/- 33 601 +/- 17 0.006951 0.4215034 0.657046 0.7190742 0.8324462RNASEH1 ribonuclease H1 129 +/- 15 178 +/- 14 148 +/- 7 241 +/- 18 0.013749 0.0416065 0.004633 0.229431 0.0325456RNF123 ring finger protein 123 577 +/- 21 600 +/- 34 633 +/- 43 704 +/- 35 0.03273 0.5805279 0.232506 0.9420261 0.2414312RNF170 ring finger protein 170 384 +/- 39 453 +/- 32 518 +/- 55 493 +/- 32 0.023423 0.1997535 -0.698505 0.1197989 0.7497304RNF182 ring finger protein 182 1190 +/- 126 1299 +/- 67 1679 +/- 123 1573 +/- 80 8.75E-06 0.4644971 -0.4904 0.1707664 0.6235059RNF19 ring finger protein 19 293 +/- 27 343 +/- 26 377 +/- 19 413 +/- 31 0.002022 0.2099337 0.357874 0.0553089 0.0604769
S2-genes differentially expressed across region.xls Page 25

Symbol Description Young CA Aged CA Young DG Aged DG CA v DG CA Y v A DG Y v A CA to PMI DG to PMIRNF24 ring finger protein 24 1650 +/- 211 1457 +/- 243 2321 +/- 131 2201 +/- 160 1.03E-05 -0.562966 -0.574743 0.3200983 0.384435RNF40 ring finger protein 40 697 +/- 31 616 +/- 10 876 +/- 27 750 +/- 31 0.000102 -0.043587 -0.014865 0.3401724 0.1080425RNF41 ring finger protein 41 827 +/- 108 700 +/- 95 920 +/- 42 898 +/- 97 0.038621 -0.398743 -0.845613 0.3846319 0.7096138RNF7 ring finger protein 7 1784 +/- 108 1655 +/- 68 1864 +/- 122 1940 +/- 81 0.008816 -0.341892 0.615917 0.2100194 0.973737RNMT RNA (guanine-7-) methyltransferase 171 +/- 23 268 +/- 68 232 +/- 22 332 +/- 75 0.001433 0.2213002 0.25954 0.2409138 0.1839788RNPC2 RNA-binding region (RNP1, RRM) containing 2 2981 +/- 203 2776 +/- 143 3467 +/- 85 3303 +/- 105 0.001494 -0.430685 -0.258494 0.6252206 0.383015RNPS1 RNA binding protein S1, serine-rich domain 2748 +/- 78 3124 +/- 133 3034 +/- 149 3248 +/- 132 0.026594 0.0408598 0.310943 0.2161541 0.4479756ROBO1 Roundabout, axon guidance receptor, homolog 1 (Drosophila) 342 +/- 33 264 +/- 31 489 +/- 6 390 +/- 40 0.000387 -0.110332 -0.06635 0.3312246 0.603104ROD1 ROD1 regulator of differentiation 1 (S. pombe) 1784 +/- 98 1541 +/- 71 1943 +/- 113 1743 +/- 34 0.011037 -0.074084 -0.142457 0.0463187 0.1875405ROGDI rogdi homolog (Drosophila) 4108 +/- 229 4655 +/- 269 5282 +/- 353 5333 +/- 277 4.61E-05 0.1530418 0.91117 0.1079876 0.8690097ROR1 Receptor tyrosine kinase-like orphan receptor 1 124 +/- 55 109 +/- 33 385 +/- 44 336 +/- 30 0.000969 -0.81109 -0.385332 0.8684625 0.3481164RP6-213H1Mst3 and SOK1-related kinase 140 +/- 24 156 +/- 39 261 +/- 60 281 +/- 49 0.01556 0.7356112 0.799393 0.9374917 0.8537854RPESP RPE-spondin 216 +/- 36 219 +/- 54 370 +/- 37 509 +/- 43 0.001557 0.9565057 0.036551 0.7215285 0.0174944RPIB9 Rap2-binding protein 9 1388 +/- 111 1270 +/- 94 1665 +/- 42 1512 +/- 53 0.005251 -0.437014 -0.054718 0.4532659 0.3512872RPIP8 RaP2 interacting protein 8 3549 +/- 231 3204 +/- 200 3873 +/- 200 4026 +/- 156 0.010044 -0.286464 0.56282 0.16043 0.6201375RPL31 ribosomal protein L31 232 +/- 31 172 +/- 17 275 +/- 9 198 +/- 25 0.048221 -0.128385 -0.032936 0.3364343 0.2694518RPRC1 arginine/proline rich coiled-coil 1 6598 +/- 221 6480 +/- 243 6871 +/- 111 7286 +/- 69 0.036021 -0.725681 0.013169 0.5078475 0.1042715RRAGD Ras-related GTP binding D 2145 +/- 150 1853 +/- 133 2546 +/- 120 2476 +/- 88 0.003177 -0.177376 -0.647677 0.1387147 0.5482913RRH retinal pigment epithelium-derived rhodopsin homolog 138 +/- 8 123 +/- 14 177 +/- 19 150 +/- 4 0.008474 -0.36222 -0.203525 0.3094094 0.4788856RSAD1 radical S-adenosyl methionine domain containing 1 480 +/- 57 589 +/- 47 652 +/- 40 794 +/- 59 0.001206 0.1749976 0.084648 0.4121308 0.3750654RSC1A1 regulatory solute carrier protein, family 1, member 1 800 +/- 32 890 +/- 37 1000 +/- 54 1029 +/- 56 0.002255 0.0946429 0.720803 0.0176162 0.3233742RTEL1 regulator of telomere elongation helicase 1 121 +/- 22 88 +/- 9 196 +/- 27 159 +/- 22 0.000236 -0.209402 -0.314121 0.4474691 0.7839512RTF1 Rtf1, Paf1/RNA polymerase II complex component, homolog (S. cerevisiae) 1080 +/- 61 889 +/- 52 1157 +/- 39 1177 +/- 28 0.006301 -0.039212 0.687224 0.0166795 0.9882032RTN4IP1 reticulon 4 interacting protein 1 154 +/- 6 130 +/- 11 186 +/- 18 167 +/- 25 0.033602 -0.101709 -0.537449 0.1266909 0.550043RTN4RL2 reticulon 4 receptor-like 2 163 +/- 33 113 +/- 19 235 +/- 8 213 +/- 18 0.003015 -0.220541 -0.317217 0.1607859 0.1478692RUFY2 RUN and FYVE domain containing 2 706 +/- 76 907 +/- 57 1027 +/- 29 1122 +/- 40 0.000576 0.0633193 0.09295 0.0648253 0.0346075RUFY3 RUN and FYVE domain containing 3 69 +/- 10 111 +/- 9 114 +/- 13 156 +/- 17 0.001984 0.0099158 0.096064 0.0138411 0.0161513RUTBC1 RUN and TBC1 domain containing 1 206 +/- 31 241 +/- 29 415 +/- 35 402 +/- 20 0.000147 0.4340995 -0.758055 0.4950478 0.6240771RXRG retinoid X receptor, gamma 219 +/- 45 249 +/- 28 413 +/- 47 365 +/- 26 7.42E-05 0.5891601 -0.396336 0.6832858 0.4130308SAC3D1 SAC3 domain containing 1 657 +/- 52 643 +/- 23 778 +/- 30 788 +/- 31 0.005319 -0.817125 0.82524 0.9655861 0.6202256SAFB2 scaffold attachment factor B2 1217 +/- 84 1373 +/- 83 1547 +/- 101 1630 +/- 96 0.004611 0.2123291 0.56266 0.2630684 0.4842056SALL3 sal-like 3 (Drosophila) 194 +/- 13 178 +/- 21 249 +/- 17 210 +/- 26 0.000545 -0.543745 -0.251428 0.2743355 0.0482473SAMD1 sterile alpha motif domain containing 1 363 +/- 22 312 +/- 35 561 +/- 23 439 +/- 31 2.83E-07 -0.249772 -0.013804 0.2150173 0.0153949SAMD13 sterile alpha motif domain containing 13 234 +/- 23 238 +/- 21 261 +/- 20 314 +/- 8 0.027004 0.9033007 0.044956 0.9222472 0.2310658SAP30L SAP30-like 230 +/- 15 253 +/- 20 262 +/- 5 279 +/- 19 0.04287 0.4003901 0.418652 0.1061515 0.0425077SAPS1 SAPS domain family, member 1 1077 +/- 65 1094 +/- 119 1530 +/- 101 1540 +/- 59 0.000181 0.9038836 0.938047 0.7853608 0.8280362SAS10 disrupter of silencing 10 741 +/- 61 612 +/- 20 813 +/- 19 717 +/- 46 0.026176 -0.090135 -0.109822 0.0878673 0.0545552SBF2 SET binding factor 2 129 +/- 20 128 +/- 22 180 +/- 15 156 +/- 18 0.000919 -0.985719 -0.31673 0.8668356 0.9668462SBNO1 Sno, strawberry notch homolog 1 (Drosophila) 160 +/- 25 122 +/- 25 232 +/- 40 181 +/- 35 0.003463 -0.303871 -0.361305 0.4112182 0.4143627SCAMP4 secretory carrier membrane protein 4 743 +/- 44 842 +/- 65 875 +/- 23 973 +/- 45 0.002716 0.2408748 0.098777 0.414176 0.3994015SCAMP5 secretory carrier membrane protein 5 7112 +/- 255 6561 +/- 419 7973 +/- 275 8158 +/- 266 7.52E-05 -0.29298 0.640297 0.0321993 0.8316471SCARNA9 Small Cajal body-specific RNA 9 162 +/- 16 184 +/- 16 196 +/- 4 209 +/- 24 0.008919 0.3537661 0.614271 0.7804901 0.9937399SCC-112 SCC-112 protein 108 +/- 16 158 +/- 17 157 +/- 25 200 +/- 16 4.32E-05 0.0567059 0.184584 0.2494883 0.6263184SCG3 secretogranin III 3061 +/- 250 2848 +/- 214 3541 +/- 106 3310 +/- 145 0.03373 -0.532236 -0.23503 0.4220333 0.6622037SCHIP1 schwannomin interacting protein 1 6881 +/- 187 6571 +/- 171 7488 +/- 294 7302 +/- 360 0.021994 -0.248516 -0.699557 0.9727114 0.4526198
S2-genes differentially expressed across region.xls Page 26

Symbol Description Young CA Aged CA Young DG Aged DG CA v DG CA Y v A DG Y v A CA to PMI DG to PMISCN1B sodium channel, voltage-gated, type I, beta 2478 +/- 96 2640 +/- 159 3251 +/- 193 3267 +/- 114 6.85E-05 0.409883 0.942946 0.5323587 0.9471917SCN2A2 sodium channel, voltage-gated, type II, alpha 2 8450 +/- 471 7294 +/- 521 9209 +/- 438 8616 +/- 254 0.040612 -0.131204 -0.275937 0.0441534 0.8125718SCN8A sodium channel, voltage gated, type VIII, alpha 103 +/- 23 90 +/- 16 139 +/- 21 164 +/- 13 0.020038 -0.65351 0.35844 0.4338307 0.5295296SCRT1 scratch homolog 1, zinc finger protein (Drosophila) 88 +/- 8 99 +/- 12 158 +/- 16 169 +/- 14 0.000196 0.4553579 0.639665 0.6343513 0.5550117SCYL1BP1SCY1-like 1 binding protein 1 559 +/- 81 610 +/- 81 850 +/- 66 797 +/- 29 0.007999 0.6639639 -0.486864 0.8315539 0.3998438SCYL2 SCY1-like 2 (S. cerevisiae) 1488 +/- 95 1321 +/- 44 1638 +/- 109 1535 +/- 60 0.02375 -0.153763 -0.433654 0.1074676 0.3250074SDC2 syndecan 2 (heparan sulfate proteoglycan 1, cell surface-associated, fibroglycan) 504 +/- 26 546 +/- 65 821 +/- 58 807 +/- 31 0.000454 0.5681716 -0.84154 0.7228506 0.9073002SDCBP syndecan binding protein (syntenin) 8109 +/- 578 6955 +/- 227 9638 +/- 508 9175 +/- 303 6.17E-05 -0.10881 -0.456545 0.0481946 0.5684862SDCBP2 syndecan binding protein (syntenin) 2 165 +/- 43 139 +/- 25 243 +/- 36 220 +/- 24 0.00035 -0.609193 -0.611958 0.5407396 0.4125482SDCCAG1 serologically defined colon cancer antigen 1 388 +/- 20 315 +/- 15 516 +/- 63 441 +/- 28 0.005473 -0.017003 -0.314805 0.0037034 0.1962015SEC22A SEC22 vesicle trafficking protein homolog A (S. cerevisiae) 388 +/- 11 342 +/- 16 440 +/- 19 453 +/- 44 0.00208 -0.03712 0.804564 0.1895016 0.1610125SEC23A Sec23 homolog A (S. cerevisiae) 459 +/- 49 359 +/- 21 572 +/- 52 577 +/- 46 0.007078 -0.101159 0.947131 0.065943 0.6801096SEC63 SEC63-like (S. cerevisiae) 192 +/- 34 126 +/- 32 277 +/- 24 221 +/- 34 0.010326 -0.191457 -0.216541 0.2569293 0.397006SEMA3B sema domain, immunoglobulin domain (Ig), short basic domain, secreted, (semaphorin) 3 215 +/- 39 327 +/- 34 260 +/- 19 343 +/- 40 0.031486 0.0586599 0.113443 0.1486362 0.2385468SEMA6B sema domain, transmembrane domain (TM), and cytoplasmic domain, (semaphorin) 6B 2141 +/- 281 1472 +/- 204 2572 +/- 104 2191 +/- 53 0.002351 -0.085956 -0.013093 0.1058834 0.195481SEPHS1 selenophosphate synthetase 1 297 +/- 33 289 +/- 25 383 +/- 23 377 +/- 28 0.006151 -0.845896 -0.879328 0.9433685 0.9045879SEPT3 septin 3 7220 +/- 468 5490 +/- 263 8056 +/- 320 7357 +/- 258 0.000891 -0.012451 -0.1241 0.0213601 0.4560522SERBP1 SERPINE1 mRNA binding protein 1 681 +/- 62 812 +/- 90 888 +/- 80 925 +/- 98 0.018134 0.260052 0.774907 0.2594121 0.4099514SERPINB6 serpin peptidase inhibitor, clade B (ovalbumin), member 6 139 +/- 16 197 +/- 19 232 +/- 20 249 +/- 10 0.003543 0.0405549 0.469389 0.2040456 0.7728342SERTAD2 SERTA domain containing 2 361 +/- 29 373 +/- 27 472 +/- 16 447 +/- 23 0.001359 0.7650236 -0.414877 0.4638359 0.4515351SET SET translocation (myeloid leukemia-associated) 698 +/- 22 583 +/- 14 1015 +/- 52 866 +/- 35 2.46E-07 -0.002193 -0.04242 0.020561 0.0522707SETD2 SET domain containing 2 77 +/- 9 85 +/- 12 129 +/- 22 118 +/- 12 0.032902 0.597282 -0.674125 0.3016181 0.6631157SEZ6L2 Seizure related 6 homolog (mouse)-like 2 1565 +/- 18 1244 +/- 115 2230 +/- 72 2186 +/- 114 0.000161 -0.038027 -0.756044 0.0439181 0.9303992SF1 splicing factor 1 140 +/- 11 201 +/- 16 207 +/- 11 256 +/- 26 0.000508 0.01371 0.143512 0.0146115 0.103229SF3A1 splicing factor 3a, subunit 1, 120kDa 1775 +/- 85 1593 +/- 29 1910 +/- 46 1838 +/- 72 0.006802 -0.087211 -0.420864 0.119543 0.9283587SF3A2 Splicing factor 3a, subunit 2, 66kDa 332 +/- 27 363 +/- 24 492 +/- 35 438 +/- 27 0.001428 0.4060509 -0.248432 0.6079222 0.5013208SFPQ splicing factor proline/glutamine-rich (polypyrimidine tract binding protein associated) 2328 +/- 109 2456 +/- 58 2770 +/- 74 2832 +/- 78 0.000208 0.3319386 0.578521 0.2694177 0.7807726SFRS14 splicing factor, arginine/serine-rich 14 2501 +/- 104 2096 +/- 137 2785 +/- 51 2631 +/- 85 0.00293 -0.04162 -0.167002 0.0062501 0.0353494SFRS2 splicing factor, arginine/serine-rich 2 255 +/- 34 335 +/- 13 324 +/- 26 380 +/- 21 0.002841 0.069861 0.133479 0.0253347 0.1884405SFRS4 splicing factor, arginine/serine-rich 4 2735 +/- 61 2832 +/- 42 2933 +/- 52 2991 +/- 82 0.030369 0.2220573 0.569278 0.1905043 0.8098299SFXN4 sideroflexin 4 342 +/- 24 319 +/- 11 365 +/- 11 379 +/- 28 0.037644 -0.418334 0.657969 0.5080271 0.7719076SFXN5 Sideroflexin 5 157 +/- 8 208 +/- 14 190 +/- 13 226 +/- 9 0.010934 0.0109709 0.05192 0.0002757 0.0306315SGCB sarcoglycan, beta (43kDa dystrophin-associated glycoprotein) 220 +/- 12 203 +/- 11 252 +/- 21 222 +/- 22 0.037749 -0.329488 -0.36182 0.1779702 0.2191165SGIP1 SH3-domain GRB2-like (endophilin) interacting protein 1 2156 +/- 211 1772 +/- 114 2457 +/- 112 2168 +/- 82 0.001989 -0.150026 -0.068561 0.1536249 0.0617374SH2B SH2-B homolog 1071 +/- 20 1347 +/- 59 1612 +/- 117 1439 +/- 90 0.013408 0.0041889 -0.272413 0.046181 0.3927911SH2D5 SH2 domain containing 5 596 +/- 74 690 +/- 40 819 +/- 19 878 +/- 49 0.002288 0.2932819 0.313419 0.815493 0.6624593SH3BGRL SH3 domain binding glutamic acid-rich protein like 1959 +/- 216 2188 +/- 169 2416 +/- 113 2842 +/- 144 0.014296 0.4222461 0.048322 0.3057342 0.2728617SH3BGRL2SH3 domain binding glutamic acid-rich protein like 2 1572 +/- 143 1638 +/- 177 1882 +/- 178 1811 +/- 170 0.037863 0.778515 -0.779388 0.4765014 0.455684SH3GL1 SH3-domain GRB2-like 1 517 +/- 28 419 +/- 30 649 +/- 35 550 +/- 32 0.000487 -0.037857 -0.069011 0.062626 0.4344739SH3GLB2 SH3-domain GRB2-like endophilin B2 1534 +/- 197 1752 +/- 251 2334 +/- 168 2780 +/- 116 0.000801 0.5112276 0.058696 0.9239354 0.4527989SH3PXD2ASH3 and PX domains 2A 408 +/- 23 519 +/- 49 572 +/- 22 578 +/- 46 0.018692 0.0816228 0.914945 0.0456051 0.3901388SHANK1 SH3 and multiple ankyrin repeat domains 1 186 +/- 19 155 +/- 7 208 +/- 15 185 +/- 20 0.048705 -0.1764 -0.371794 0.0686279 0.3554657SIDT1 SID1 transmembrane family, member 1 745 +/- 120 796 +/- 82 1543 +/- 51 1669 +/- 181 4.34E-05 0.7309273 0.534895 0.8091259 0.8948326SIRT2 Sirtuin (silent mating type information regulation 2 homolog) 2 (S. cerevisiae) 1243 +/- 145 1521 +/- 75 1590 +/- 87 1721 +/- 146 0.011069 0.130881 0.469834 0.2097638 0.3628542SKIL SKI-like 118 +/- 14 143 +/- 10 155 +/- 9 163 +/- 23 0.032871 0.1791027 0.777989 0.0542374 0.1069061
S2-genes differentially expressed across region.xls Page 27

Symbol Description Young CA Aged CA Young DG Aged DG CA v DG CA Y v A DG Y v A CA to PMI DG to PMISLC16A14 solute carrier family 16 (monocarboxylic acid transporters), member 14 1075 +/- 41 1004 +/- 75 1195 +/- 34 1038 +/- 52 0.036333 -0.435972 -0.03911 0.4885692 0.0290485SLC16A4 Solute carrier family 16 (monocarboxylic acid transporters), member 4 359 +/- 31 331 +/- 40 433 +/- 20 387 +/- 34 0.044918 -0.596445 -0.296733 0.9986879 0.6256058SLC17A7 solute carrier family 17 (sodium-dependent inorganic phosphate cotransporter), member 7 20947 +/- 1525 19370 +/- 1552 21896 +/- 745 22824 +/- 1012 0.035327 -0.485189 0.482079 0.2697982 0.9226882SLC19A2 Solute carrier family 19 (thiamine transporter), member 2 174 +/- 35 226 +/- 16 240 +/- 47 295 +/- 24 0.003342 0.2128254 0.332039 0.2491747 0.3336887SLC1A1 solute carrier family 1 (neuronal/epithelial high affinity glutamate transporter, system Xag) 511 +/- 80 386 +/- 60 657 +/- 64 673 +/- 55 0.005747 -0.239542 0.857943 0.194656 0.9149181SLC1A6 solute carrier family 1 (high affinity aspartate/glutamate transporter), member 6 685 +/- 50 598 +/- 48 942 +/- 40 974 +/- 44 1.11E-06 -0.237822 0.612922 0.1094085 0.7801005SLC24A4 solute carrier family 24 (sodium/potassium/calcium exchanger), member 4 200 +/- 40 153 +/- 20 388 +/- 93 279 +/- 55 0.049151 -0.328575 -0.344011 0.4826206 0.6022908SLC24A5 Solute carrier family 24, member 5 1183 +/- 81 1115 +/- 57 1455 +/- 56 1211 +/- 48 0.028959 -0.514493 -0.008949 0.3598755 0.0032771SLC25A16 solute carrier family 25 (mitochondrial carrier; Graves disease autoantigen), member 16 472 +/- 27 547 +/- 23 566 +/- 28 661 +/- 17 0.001135 0.0629683 0.021427 0.4766455 0.0789001SLC25A22 solute carrier family 25 (mitochondrial carrier: glutamate), member 22 3663 +/- 121 3709 +/- 334 5093 +/- 275 5807 +/- 450 4.23E-05 0.9003307 0.219003 0.4577215 0.6732024SLC25A25 solute carrier family 25 (mitochondrial carrier; phosphate carrier), member 25 1121 +/- 61 974 +/- 52 1300 +/- 67 1101 +/- 43 0.028599 -0.096748 -0.036721 0.0306786 0.1145057SLC25A30 solute carrier family 25, member 30 159 +/- 9 164 +/- 29 256 +/- 26 219 +/- 27 0.016928 0.8833456 -0.355562 0.8229475 0.3991031SLC25A37 solute carrier family 25, member 37 1037 +/- 82 1243 +/- 98 1265 +/- 119 1375 +/- 54 0.007367 0.1387508 0.427593 0.0715431 0.3137814SLC26A10 solute carrier family 26, member 10 99 +/- 20 85 +/- 13 132 +/- 17 114 +/- 12 0.012561 -0.587428 -0.426805 0.3089693 0.2860397SLC2A11 solute carrier family 2 (facilitated glucose transporter), member 11 337 +/- 24 347 +/- 19 470 +/- 21 450 +/- 14 3.6E-05 0.7394265 -0.461701 0.9635415 0.5019672SLC2A13 solute carrier family 2 (facilitated glucose transporter), member 13 2788 +/- 251 2900 +/- 266 4267 +/- 144 4652 +/- 260 5.35E-05 0.7649466 0.239651 0.8029756 0.5666795SLC2A3 solute carrier family 2 (facilitated glucose transporter), member 3 1026 +/- 38 880 +/- 62 1104 +/- 55 1085 +/- 58 0.021003 -0.078467 -0.818739 0.0242551 0.5835713SLC35F2 solute carrier family 35, member F2 207 +/- 46 144 +/- 16 326 +/- 25 305 +/- 24 0.000324 -0.244329 -0.561463 0.3249204 0.5505928SLC37A3 solute carrier family 37 (glycerol-3-phosphate transporter), member 3 931 +/- 71 1070 +/- 51 1261 +/- 82 1354 +/- 60 0.001297 0.1455695 0.387178 0.2447314 0.4459497SLC39A13 solute carrier family 39 (zinc transporter), member 13 442 +/- 18 474 +/- 23 630 +/- 58 656 +/- 34 0.000119 0.3063952 0.707409 0.0912653 0.6165761SLC44A2 solute carrier family 44, member 2 1048 +/- 76 1120 +/- 49 1283 +/- 77 1445 +/- 118 0.006709 0.4475349 0.283952 0.3156359 0.8745153SLC4A10 solute carrier family 4, sodium bicarbonate transporter-like, member 10 1184 +/- 170 1069 +/- 138 1402 +/- 112 1397 +/- 63 0.029531 -0.610961 -0.968619 0.3256783 0.5149316SLC4A4 solute carrier family 4, sodium bicarbonate cotransporter, member 4 157 +/- 10 174 +/- 20 254 +/- 30 241 +/- 14 0.00147 0.4829416 -0.713869 0.9127288 0.6282629SLC5A3 solute carrier family 5 (inositol transporters), member 3 289 +/- 39 240 +/- 38 429 +/- 33 342 +/- 17 0.000569 -0.391169 -0.052976 0.3881746 0.0789157SLC6A17 Solute carrier family 6, member 17 210 +/- 17 169 +/- 34 271 +/- 19 276 +/- 44 0.003758 -0.311296 0.914598 0.322681 0.7293514SLC6A8 solute carrier family 6 (neurotransmitter transporter, creatine), member 8 1035 +/- 135 1096 +/- 125 1491 +/- 82 1629 +/- 86 0.00203 0.7458516 0.274069 0.6006384 0.5520465SLC7A10 solute carrier family 7, (neutral amino acid transporter, y+ system) member 10 357 +/- 22 330 +/- 22 416 +/- 20 346 +/- 25 0.038904 -0.393374 -0.060576 0.3787784 0.0353852SLC7A3 solute carrier family 7 (cationic amino acid transporter, y+ system), member 3 224 +/- 20 260 +/- 16 268 +/- 16 274 +/- 24 0.025146 0.2035323 0.859225 0.2463997 0.9711642SLC7A8 solute carrier family 7 (cationic amino acid transporter, y+ system), member 8 154 +/- 24 138 +/- 24 223 +/- 35 238 +/- 30 0.031272 -0.661655 0.75489 0.7313684 0.9456271SLC8A2 solute carrier family 8 (sodium-calcium exchanger), member 2 8880 +/- 579 7417 +/- 677 10805 +/- 749 9813 +/- 387 0.00037 -0.132175 -0.276414 0.0615612 0.2075135SLC9A5 Solute carrier family 9 (sodium/hydrogen exchanger), member 5 79 +/- 8 66 +/- 16 153 +/- 21 117 +/- 16 0.001044 -0.490409 -0.218032 0.4030349 0.5140448SLIT3 slit homolog 3 (Drosophila) 168 +/- 14 215 +/- 28 281 +/- 24 327 +/- 30 0.001512 0.1668762 0.264163 0.1731033 0.2279621SLITRK3 SLIT and NTRK-like family, member 3 805 +/- 73 681 +/- 48 900 +/- 60 883 +/- 35 0.003988 -0.187426 -0.810348 0.1503791 0.5879921SLU7 step II splicing factor SLU7 686 +/- 49 651 +/- 34 820 +/- 45 760 +/- 36 9.72E-06 -0.574939 -0.323368 0.9977697 0.4958945SMAD1 SMAD, mothers against DPP homolog 1 (Drosophila) 643 +/- 44 720 +/- 16 780 +/- 22 738 +/- 27 0.015328 0.1515251 -0.25302 0.0856621 0.693038SMAD3 SMAD, mothers against DPP homolog 3 (Drosophila) 188 +/- 33 121 +/- 27 344 +/- 37 309 +/- 37 0.000421 -0.148624 -0.522044 0.0728908 0.5333286SMAD7 SMAD, mothers against DPP homolog 7 (Drosophila) 307 +/- 16 324 +/- 24 412 +/- 21 416 +/- 28 0.000386 0.5585009 0.910322 0.7755308 0.9310852SMAD9 SMAD, mothers against DPP homolog 9 (Drosophila) 257 +/- 56 213 +/- 34 442 +/- 75 408 +/- 55 6.24E-05 -0.512901 -0.723789 0.5260257 0.819869SMARCA1 SWI/SNF related, matrix associated, actin dependent regulator of chromatin, subfamily a, 952 +/- 143 852 +/- 93 1284 +/- 94 1301 +/- 131 0.001373 -0.572468 0.915481 0.495872 0.6066946SMARCB1 SWI/SNF related, matrix associated, actin dependent regulator of chromatin, subfamily b, 1109 +/- 26 1171 +/- 34 1237 +/- 33 1243 +/- 59 0.040304 0.177362 0.93229 0.4453046 0.4318511SMC1L1 SMC1 structural maintenance of chromosomes 1-like 1 (yeast) 109 +/- 11 124 +/- 5 124 +/- 8 155 +/- 12 0.002664 0.2579351 0.068434 0.1604097 0.012924SMC5L1 SMC5 structural maintenance of chromosomes 5-like 1 (yeast) 80 +/- 7 105 +/- 11 119 +/- 18 132 +/- 16 0.0119 0.0903609 0.598996 0.0340661 0.9771966SMCX Smcy homolog, X-linked (mouse) 532 +/- 25 498 +/- 36 799 +/- 43 712 +/- 66 0.00098 -0.46199 -0.306702 0.3722781 0.3141839SMPD3 sphingomyelin phosphodiesterase 3, neutral membrane (neutral sphingomyelinase II) 1229 +/- 172 973 +/- 155 1527 +/- 73 1365 +/- 83 0.004174 -0.294544 -0.178859 0.320479 0.3281313SMS spermine synthase 1440 +/- 104 1361 +/- 60 1756 +/- 49 1533 +/- 42 0.001876 -0.531937 -0.00736 0.6064133 0.1179732
S2-genes differentially expressed across region.xls Page 28

Symbol Description Young CA Aged CA Young DG Aged DG CA v DG CA Y v A DG Y v A CA to PMI DG to PMISMYD2 SET and MYND domain containing 2 109 +/- 17 181 +/- 16 144 +/- 19 192 +/- 26 0.015144 0.0113553 0.180434 0.003035 0.0154565SNAP25 Synaptosomal-associated protein, 25kDa 583 +/- 70 304 +/- 41 826 +/- 34 518 +/- 59 0.001182 -0.008466 -0.00321 0.0112881 0.0123304SNAP91 synaptosomal-associated protein, 91kDa homolog (mouse) 10224 +/- 579 10352 +/- 809 10870 +/- 483 12419 +/- 359 0.016655 0.9003596 0.030731 0.7005781 0.2501644SNAPC2 small nuclear RNA activating complex, polypeptide 2, 45kDa 561 +/- 35 472 +/- 29 611 +/- 43 565 +/- 27 0.009263 -0.081153 -0.396468 0.0297021 0.2882394SNAPC3 small nuclear RNA activating complex, polypeptide 3, 50kDa 237 +/- 12 210 +/- 12 240 +/- 8 264 +/- 11 0.032721 -0.150438 0.122994 0.2219438 0.1821385SNCA synuclein, alpha (non A4 component of amyloid precursor) 8572 +/- 460 8035 +/- 541 10395 +/- 780 10982 +/- 711 0.000525 -0.466771 0.591098 0.1529883 0.7778674SNIP SNAP25-interacting protein 171 +/- 8 150 +/- 14 197 +/- 10 199 +/- 9 0.002983 -0.217767 0.8845 0.4745023 0.5472284SNPH syntaphilin 2613 +/- 145 2551 +/- 229 3210 +/- 152 2979 +/- 147 0.000413 -0.824861 -0.304685 0.5676558 0.557265SNRPD1 small nuclear ribonucleoprotein D1 polypeptide 16kDa 576 +/- 52 651 +/- 23 669 +/- 57 782 +/- 25 1.44E-05 0.2287422 0.116701 0.4277502 0.2528515SNRPN small nuclear ribonucleoprotein polypeptide N 132 +/- 14 163 +/- 31 176 +/- 10 237 +/- 52 0.017771 0.3858409 0.318396 0.1257248 0.0182757SNX4 sorting nexin 4 300 +/- 31 376 +/- 26 403 +/- 33 453 +/- 12 0.001799 0.0956579 0.213336 0.0266034 0.2046534SNX9 sorting nexin 9 1081 +/- 34 1199 +/- 60 1155 +/- 37 1282 +/- 40 0.012901 0.1251068 0.045268 0.0200866 0.0494946SOCS1 suppressor of cytokine signaling 1 193 +/- 12 114 +/- 15 214 +/- 14 159 +/- 18 0.001196 -0.002148 -0.038543 0.0006493 0.0014373SORBS1 sorbin and SH3 domain containing 1 688 +/- 45 536 +/- 41 818 +/- 42 620 +/- 39 0.045933 -0.032044 -0.007103 0.0445536 0.0045809SORBS3 sorbin and SH3 domain containing 3 492 +/- 36 495 +/- 36 591 +/- 39 549 +/- 15 0.048526 0.9556806 -0.352191 0.7225567 0.3175566SORD sorbitol dehydrogenase 145 +/- 14 169 +/- 20 200 +/- 17 225 +/- 15 0.001378 0.3531917 0.297006 0.9720434 0.7361801SOX1 SRY (sex determining region Y)-box 1 375 +/- 39 272 +/- 18 455 +/- 28 336 +/- 23 0.006275 -0.050161 -0.010004 0.1370089 0.0085711SOX12 SRY (sex determining region Y)-box 12 320 +/- 19 281 +/- 25 370 +/- 17 338 +/- 14 0.02039 -0.24604 -0.183594 0.2677755 0.3727289SOX21 SRY (sex determining region Y)-box 21 152 +/- 17 149 +/- 21 246 +/- 19 235 +/- 20 0.003097 -0.91847 -0.703642 0.9548535 0.4735048SOX9 SRY (sex determining region Y)-box 9 (campomelic dysplasia, autosomal sex-reversal) 2092 +/- 250 2332 +/- 152 3201 +/- 297 3377 +/- 147 5.26E-05 0.4345332 0.611422 0.7155578 0.8029809SP3 Sp3 transcription factor 192 +/- 6 217 +/- 16 257 +/- 16 258 +/- 16 0.004414 0.1733608 0.9805 0.0307224 0.9935729SPAG5 sperm associated antigen 5 430 +/- 73 461 +/- 68 641 +/- 77 620 +/- 57 0.030989 0.7603672 -0.829771 0.9383403 0.6253147SPATA5L1 spermatogenesis associated 5-like 1 165 +/- 23 207 +/- 16 215 +/- 12 299 +/- 49 0.012911 0.1620911 0.161599 0.2291866 0.4044434SPATS2 spermatogenesis associated, serine-rich 2 189 +/- 17 228 +/- 22 259 +/- 31 311 +/- 24 0.003773 0.1994109 0.211877 0.1310841 0.2909312SPEG SPEG complex locus 382 +/- 16 419 +/- 56 489 +/- 33 545 +/- 69 0.001074 0.550069 0.485418 0.1441813 0.2410492SPIN3 spindlin family, member 3 583 +/- 41 531 +/- 70 834 +/- 37 749 +/- 30 0.00046 -0.544367 -0.112436 0.4072844 0.0904056SPINLW1 serine peptidase inhibitor-like, with Kunitz and WAP domains 1 (eppin) 118 +/- 6 137 +/- 15 187 +/- 9 158 +/- 15 0.011178 0.2607438 -0.147915 0.2346082 0.0700427SPOCD1 SPOC domain containing 1 158 +/- 17 118 +/- 16 211 +/- 18 162 +/- 27 0.008586 -0.123117 -0.169082 0.224603 0.5423912SPOCK1 sparc/osteonectin, cwcv and kazal-like domains proteoglycan (testican) 1 7167 +/- 214 7938 +/- 1021 13027 +/- 650 13078 +/- 476 2.33E-06 0.4916382 0.950583 0.84795 0.879922SPPL2B signal peptide peptidase-like 2B 326 +/- 22 313 +/- 24 418 +/- 18 351 +/- 27 0.00919 -0.707456 -0.0787 0.9510915 0.3276354SPRN shadow of prion protein homolog (zebrafish) 269 +/- 38 230 +/- 17 364 +/- 21 375 +/- 25 0.000965 -0.378278 0.741331 0.0754887 0.5748826SPRYD3 SPRY domain containing 3 4819 +/- 160 4681 +/- 224 5328 +/- 112 5128 +/- 120 0.01062 -0.630231 -0.254198 0.1993207 0.1067404SPTAN1 spectrin, alpha, non-erythrocytic 1 (alpha-fodrin) 7252 +/- 431 6761 +/- 337 7762 +/- 270 7878 +/- 221 0.014299 -0.392515 0.746458 0.1154177 0.862094SPTB spectrin, beta, erythrocytic (includes spherocytosis, clinical type I) 269 +/- 8 261 +/- 20 349 +/- 22 330 +/- 23 0.002036 -0.711673 -0.571083 0.9517376 0.8940819SPTBN1 spectrin, beta, non-erythrocytic 1 1270 +/- 153 835 +/- 88 1365 +/- 200 1056 +/- 161 0.020923 -0.038683 -0.260652 0.1486036 0.4901887SPTBN2 spectrin, beta, non-erythrocytic 2 1861 +/- 231 1513 +/- 170 2833 +/- 203 2733 +/- 201 0.000275 -0.25685 -0.733922 0.1506683 0.8724221SR-A1 serine arginine-rich pre-mRNA splicing factor SR-A1 440 +/- 30 527 +/- 58 660 +/- 33 789 +/- 43 3.71E-05 0.2204766 0.046113 0.8153769 0.1057452SREBF2 sterol regulatory element binding transcription factor 2 1173 +/- 80 1157 +/- 64 1650 +/- 13 1844 +/- 70 1.99E-05 -0.882991 0.049562 0.5901255 0.2589213SRM spermidine synthase 1721 +/- 23 1637 +/- 95 1864 +/- 78 1890 +/- 56 0.009582 -0.423893 0.79391 0.1461832 0.9354647SRP9 signal recognition particle 9kDa 4130 +/- 251 4473 +/- 110 4814 +/- 303 4892 +/- 242 0.006342 0.2511049 0.845472 0.2851241 0.9372765SRXN1 sulfiredoxin 1 homolog (S. cerevisiae) 1120 +/- 71 1170 +/- 51 1218 +/- 61 1286 +/- 56 0.030218 0.5755012 0.437612 0.9049488 0.6239331SSBP4 single stranded DNA binding protein 4 1116 +/- 95 896 +/- 82 1436 +/- 99 1297 +/- 62 0.000873 -0.111448 -0.266965 0.0710235 0.2834373SSR4 Signal sequence receptor, delta (translocon-associated protein delta) 211 +/- 36 243 +/- 27 273 +/- 15 296 +/- 28 0.002643 0.4919386 0.496365 0.3513944 0.1385836SSRP1 structure specific recognition protein 1 461 +/- 41 489 +/- 26 598 +/- 31 625 +/- 24 0.001692 0.575885 0.497805 0.7468257 0.3328728ST8SIA4 ST8 alpha-N-acetyl-neuraminide alpha-2,8-sialyltransferase 4 420 +/- 36 487 +/- 18 530 +/- 45 521 +/- 14 0.030783 0.1405574 -0.854865 0.2535427 0.8085928
S2-genes differentially expressed across region.xls Page 29

Symbol Description Young CA Aged CA Young DG Aged DG CA v DG CA Y v A DG Y v A CA to PMI DG to PMISTAU1 Staufen, RNA binding protein, homolog 1 (Drosophila) 135 +/- 17 151 +/- 17 155 +/- 8 159 +/- 7 0.023236 0.5348711 0.685589 0.2607829 0.6094558STC1 stanniocalcin 1 166 +/- 23 116 +/- 17 235 +/- 30 186 +/- 29 0.004022 -0.112545 -0.272351 0.1284177 0.4235365STEAP3 STEAP family member 3 95 +/- 19 83 +/- 5 159 +/- 18 149 +/- 19 0.000498 -0.55905 -0.720709 0.8429664 0.4117541STH saitohin 204 +/- 19 176 +/- 18 224 +/- 25 274 +/- 26 0.011096 -0.30825 0.194955 0.2280277 0.2497963STK11 serine/threonine kinase 11 840 +/- 24 788 +/- 36 928 +/- 20 849 +/- 36 0.011475 -0.270219 -0.101026 0.0078114 0.0298969STK32B serine/threonine kinase 32B 243 +/- 24 228 +/- 32 384 +/- 31 326 +/- 32 0.002198 -0.711977 -0.220768 0.4002021 0.0260982STK38 serine/threonine kinase 38 341 +/- 28 391 +/- 25 433 +/- 21 437 +/- 26 0.003453 0.2154051 0.888895 0.3961512 0.8886195STRN4 striatin, calmodulin binding protein 4 2259 +/- 118 2127 +/- 112 3229 +/- 188 3070 +/- 160 5.2E-05 -0.436998 -0.536684 0.4629875 0.8324429STX17 syntaxin 17 148 +/- 13 149 +/- 12 205 +/- 19 180 +/- 21 0.02549 0.9697172 -0.41372 0.6681478 0.2259742STX1B2 Syntaxin 1B2 2479 +/- 136 2482 +/- 193 2925 +/- 136 3039 +/- 90 0.005405 0.9900455 0.506406 0.3052837 0.4007239SUB1 SUB1 homolog (S. cerevisiae) 198 +/- 12 153 +/- 13 233 +/- 7 187 +/- 11 0.008317 -0.029381 -0.009334 0.0705728 0.2008498SUGT1 SGT1, suppressor of G2 allele of SKP1 (S. cerevisiae) 266 +/- 18 181 +/- 12 342 +/- 23 283 +/- 32 0.000158 -0.003216 -0.181555 0.0325977 0.7391313SUHW3 suppressor of hairy wing homolog 3 (Drosophila) 164 +/- 8 195 +/- 7 232 +/- 8 239 +/- 11 0.000226 0.0123894 0.663982 0.0018506 0.4146132SUMO1 SMT3 suppressor of mif two 3 homolog 1 (S. cerevisiae) 319 +/- 19 270 +/- 20 387 +/- 34 307 +/- 18 0.033679 -0.100938 -0.073092 0.3731749 0.2069742SUMO2 SMT3 suppressor of mif two 3 homolog 2 (S. cerevisiae) 12943 +/- 496 11884 +/- 615 16502 +/- 609 16284 +/- 549 2.99E-05 -0.211266 -0.796145 0.0992828 0.7056612SUPT6H suppressor of Ty 6 homolog (S. cerevisiae) 1172 +/- 55 1281 +/- 91 1334 +/- 101 1469 +/- 81 0.002814 0.3359974 0.328502 0.8999097 0.9211334SURF6 surfeit 6 376 +/- 23 356 +/- 13 414 +/- 22 397 +/- 25 0.001643 -0.46303 -0.637214 0.367044 0.6966128SUSD1 sushi domain containing 1 189 +/- 19 169 +/- 14 260 +/- 28 234 +/- 13 0.001415 -0.415794 -0.424985 0.1215955 0.5501742SUSD4 sushi domain containing 4 4749 +/- 449 3837 +/- 255 5238 +/- 182 5024 +/- 172 0.004361 -0.115599 -0.414886 0.1190265 0.4527459SUV420H1Suppressor of variegation 4-20 homolog 1 (Drosophila) 123 +/- 7 134 +/- 6 175 +/- 16 167 +/- 11 0.000595 0.2879019 -0.682286 0.1197948 0.9587164SWAP70 SWAP-70 protein 261 +/- 38 328 +/- 44 534 +/- 48 549 +/- 36 0.000669 0.2799525 0.813608 0.6487726 0.7354966SYN1 synapsin I 9377 +/- 166 8662 +/- 478 9876 +/- 310 9961 +/- 440 0.013961 -0.206004 0.878363 0.0050647 0.8227875SYNJ2BP Synaptojanin 2 binding protein 752 +/- 43 787 +/- 33 1031 +/- 19 944 +/- 14 6.14E-05 0.5393535 -0.005859 0.1846546 0.0128158SYNPR synaptoporin 7801 +/- 1027 6762 +/- 1198 12700 +/- 298 11939 +/- 542 5.49E-05 -0.52563 -0.262481 0.6085074 0.718369SYT13 synaptotagmin XIII 3220 +/- 472 4234 +/- 268 3776 +/- 271 4951 +/- 494 0.029122 0.0988615 0.079487 0.2194171 0.1377098SYT4 synaptotagmin IV 9719 +/- 546 8818 +/- 490 10923 +/- 459 10364 +/- 486 0.00467 -0.247397 -0.424941 0.3130202 0.8516169SYT5 synaptotagmin V 1590 +/- 119 1315 +/- 96 2095 +/- 145 1945 +/- 55 3.29E-05 -0.1048 -0.367943 0.0417789 0.3913412SYT7 synaptotagmin VII 114 +/- 17 89 +/- 14 257 +/- 20 201 +/- 21 2.81E-05 -0.287383 -0.086561 0.5795385 0.2106884TACR1 tachykinin receptor 1 118 +/- 3 103 +/- 12 193 +/- 23 142 +/- 11 0.002369 -0.259958 -0.085604 0.1369636 0.091764TACSTD1 tumor-associated calcium signal transducer 1 86 +/- 16 85 +/- 5 123 +/- 14 124 +/- 16 0.003462 -0.925072 0.965966 0.8481644 0.7204601TAF1B TATA box binding protein (TBP)-associated factor, RNA polymerase I, B, 63kDa 234 +/- 23 246 +/- 38 330 +/- 22 422 +/- 23 0.000316 0.7891915 0.019503 0.8921318 0.0425003TAF1L TAF1-like RNA polymerase II, TATA box binding protein (TBP)-associated factor, 210kDa 212 +/- 20 232 +/- 11 284 +/- 14 279 +/- 6 0.001271 0.4072719 -0.736238 0.2955867 0.9889043TANC1 tetratricopeptide repeat, ankyrin repeat and coiled-coil containing 1 1471 +/- 317 1200 +/- 295 2982 +/- 167 2612 +/- 197 1.88E-05 -0.545908 -0.187932 0.7487271 0.3194197TANC2 tetratricopeptide repeat, ankyrin repeat and coiled-coil containing 2 183 +/- 32 149 +/- 22 226 +/- 11 226 +/- 9 0.024707 -0.408692 -0.998032 0.4164271 0.9535105TAOK1 TAO kinase 1 173 +/- 17 198 +/- 24 218 +/- 20 226 +/- 29 0.033917 0.4185466 0.823241 0.0750809 0.4564026TAOK2 TAO kinase 2 625 +/- 34 519 +/- 39 790 +/- 45 709 +/- 38 0.000751 -0.068182 -0.196187 0.0138477 0.2934772TARSL1 threonyl-tRNA synthetase-like 1 436 +/- 27 420 +/- 16 475 +/- 27 483 +/- 12 0.010493 -0.628132 0.796268 0.6217059 0.9312237TASP1 taspase, threonine aspartase, 1 270 +/- 19 225 +/- 18 323 +/- 12 254 +/- 14 0.006132 -0.113118 -0.005654 0.0680737 0.0494189TBC1D19 TBC1 domain family, member 19 395 +/- 25 343 +/- 13 415 +/- 31 417 +/- 24 0.043573 -0.099158 0.968567 0.0678114 0.9021212TBC1D24 TBC1 domain family, member 24 2474 +/- 168 2207 +/- 117 2868 +/- 190 2598 +/- 160 0.001489 -0.22621 -0.305466 0.0484201 0.1543133TBCCD1 TBCC domain containing 1 233 +/- 24 296 +/- 18 329 +/- 21 322 +/- 5 0.009985 0.0619208 -0.733815 0.2555343 0.6875354TBL1X transducin (beta)-like 1X-linked 155 +/- 28 369 +/- 21 212 +/- 17 525 +/- 99 0.040271 0.0001457 0.033161 0.0033462 0.0739863tcag7.981 juxtaposed with another zinc finger gene 1 381 +/- 39 292 +/- 28 458 +/- 39 490 +/- 40 0.007887 -0.096156 0.578672 0.0446762 0.7339668TCEAL8 transcription elongation factor A (SII)-like 8 2261 +/- 121 2724 +/- 87 2754 +/- 147 2815 +/- 38 0.006499 0.012366 0.698956 0.0146709 0.6065382TCF4 transcription factor 4 4852 +/- 158 4083 +/- 243 6014 +/- 463 4769 +/- 717 0.034252 -0.027614 -0.187716 0.3837346 0.9305804
S2-genes differentially expressed across region.xls Page 30

Symbol Description Young CA Aged CA Young DG Aged DG CA v DG CA Y v A DG Y v A CA to PMI DG to PMITEAD1 TEA domain family member 1 (SV40 transcriptional enhancer factor) 138 +/- 24 120 +/- 19 207 +/- 11 183 +/- 24 0.003691 -0.552191 -0.404854 0.7806656 0.5873142TFAP2C transcription factor AP-2 gamma (activating enhancer binding protein 2 gamma) 162 +/- 7 171 +/- 15 220 +/- 12 192 +/- 14 0.006882 0.6086945 -0.160198 0.7618906 0.0750851TFE3 transcription factor binding to IGHM enhancer 3 464 +/- 38 530 +/- 20 669 +/- 32 746 +/- 49 0.000306 0.1647344 0.2308 0.7114555 0.591942TGFB2 Transforming growth factor, beta 2 228 +/- 32 306 +/- 56 395 +/- 33 454 +/- 28 0.005897 0.2570186 0.213191 0.4591064 0.1115706TGFB3 transforming growth factor, beta 3 505 +/- 61 393 +/- 48 651 +/- 37 486 +/- 46 0.001231 -0.182678 -0.022851 0.548311 0.08447THAP11 THAP domain containing 11 1105 +/- 29 934 +/- 18 1207 +/- 52 1091 +/- 55 0.014562 -0.000838 -0.162464 0.0183226 0.0649289THBS3 thrombospondin 3 546 +/- 53 445 +/- 55 780 +/- 44 597 +/- 55 0.002165 -0.214844 -0.03159 0.2819204 0.0687474THNSL1 threonine synthase-like 1 (bacterial) 904 +/- 69 911 +/- 73 1077 +/- 20 1202 +/- 28 0.002795 0.9472046 0.007608 0.7074732 0.0448758THOC3 THO complex 3 822 +/- 43 768 +/- 27 912 +/- 33 917 +/- 44 0.006396 -0.314602 0.926553 0.7553929 0.4127478THRAP1 thyroid hormone receptor associated protein 1 2516 +/- 97 2385 +/- 106 2836 +/- 108 2482 +/- 58 0.047824 -0.383922 -0.021616 0.9182598 0.0677997THUMPD1 THUMP domain containing 1 742 +/- 69 810 +/- 24 942 +/- 25 840 +/- 57 0.04308 0.389768 -0.156107 0.1551043 0.7150661TIA1 TIA1 cytotoxic granule-associated RNA binding protein 874 +/- 68 1007 +/- 33 956 +/- 62 1060 +/- 49 0.0472 0.1217875 0.221386 0.0524667 0.4665781TIAL1 TIA1 cytotoxic granule-associated RNA binding protein-like 1 649 +/- 26 712 +/- 30 716 +/- 24 763 +/- 39 0.040576 0.1379057 0.340948 0.2041902 0.9254245TIAM1 T-cell lymphoma invasion and metastasis 1 7165 +/- 523 6210 +/- 579 8375 +/- 702 7935 +/- 526 0.039446 -0.249449 -0.628303 0.2288296 0.735679TIFA TRAF-interacting protein with a forkhead-associated domain 97 +/- 8 121 +/- 14 110 +/- 14 155 +/- 22 0.049453 0.1748475 0.128136 0.2620997 0.3263587TIGD1 tigger transposable element derived 1 131 +/- 10 163 +/- 16 178 +/- 9 158 +/- 6 0.03645 0.1265411 -0.099891 0.0570281 0.3808026TIGD4 Tigger transposable element derived 4 169 +/- 19 172 +/- 8 219 +/- 22 201 +/- 18 0.037805 0.8777507 -0.533143 0.5864319 0.7218253TIMM9 translocase of inner mitochondrial membrane 9 homolog (yeast) 1054 +/- 79 1023 +/- 58 1314 +/- 116 1222 +/- 67 0.029722 -0.758442 -0.516216 0.6882885 0.8239718TLCD1 TLC domain containing 1 244 +/- 18 250 +/- 25 290 +/- 13 305 +/- 19 0.00131 0.8458537 0.533168 0.4851929 0.534917TM2D3 TM2 domain containing 3 1598 +/- 99 1706 +/- 91 1817 +/- 112 1766 +/- 67 0.003348 0.4378893 -0.706016 0.6280413 0.9190701TMCC1 Transmembrane and coiled-coil domain family 1 100 +/- 14 167 +/- 12 175 +/- 18 218 +/- 27 0.008644 0.0045566 0.232236 0.002973 0.630778TMEM101 transmembrane protein 101 675 +/- 42 618 +/- 45 750 +/- 17 705 +/- 15 0.01854 -0.369877 -0.080463 0.3060146 0.1110347TMEM106ATransmembrane protein 106A 262 +/- 38 357 +/- 34 391 +/- 26 405 +/- 32 0.03326 0.0927646 0.754754 0.0391729 0.482147TMEM106Btransmembrane protein 106B 4831 +/- 291 4025 +/- 238 5533 +/- 280 4811 +/- 200 0.007133 -0.058398 -0.066771 0.150374 0.086534TMEM132Etransmembrane protein 132E 138 +/- 10 118 +/- 18 232 +/- 19 159 +/- 19 0.003245 -0.347428 -0.023539 0.1210173 0.0709417TMEM145 transmembrane protein 145 217 +/- 45 302 +/- 45 461 +/- 25 437 +/- 46 0.004792 0.2133024 -0.656727 0.2795145 0.5993333TMEM155 transmembrane protein 155 681 +/- 159 731 +/- 102 1005 +/- 95 952 +/- 109 0.005603 0.7964121 -0.719275 0.8814584 0.5369674TMEM157 transmembrane protein 157 1071 +/- 81 1357 +/- 141 1396 +/- 135 1514 +/- 51 0.00413 0.1169164 0.443375 0.3751543 0.860073TMEM17 transmembrane protein 17 1201 +/- 190 943 +/- 121 1496 +/- 81 1397 +/- 26 0.002791 -0.284126 -0.288136 0.2533249 0.2733874TMEM2 transmembrane protein 2 579 +/- 105 540 +/- 122 879 +/- 63 937 +/- 51 0.001128 -0.816285 0.492065 0.8577714 0.1842878TMEM25 transmembrane protein 25 2517 +/- 184 2187 +/- 216 3846 +/- 199 3254 +/- 106 0.000106 -0.27173 -0.032156 0.2729187 0.1297675TMEM34 transmembrane protein 34 461 +/- 47 399 +/- 28 561 +/- 32 509 +/- 34 0.013101 -0.288718 -0.288026 0.213151 0.1128186TMEM35 transmembrane protein 35 3372 +/- 336 2655 +/- 290 3993 +/- 156 3988 +/- 198 0.000691 -0.138043 -0.982368 0.0911204 0.490275TMEM50A transmembrane protein 50A 3252 +/- 47 2957 +/- 223 4076 +/- 139 3448 +/- 34 0.001072 -0.248078 -0.005475 0.4666802 0.025314TMEM57 transmembrane protein 57 604 +/- 27 705 +/- 15 723 +/- 33 725 +/- 8 0.046032 0.0126412 0.945545 0.0242234 0.8980879TMEM69 transmembrane protein 69 384 +/- 5 399 +/- 22 508 +/- 26 437 +/- 37 0.032387 0.5290993 -0.159565 0.6220057 0.009146TMEM76 transmembrane protein 76 3761 +/- 96 3217 +/- 173 4452 +/- 182 4256 +/- 291 0.000104 -0.025905 -0.587721 0.0215696 0.3439686TNC Tenascin C (hexabrachion) 123 +/- 12 95 +/- 12 170 +/- 14 135 +/- 16 0.005698 -0.134881 -0.136861 0.1756168 0.0793545TNFAIP3 tumor necrosis factor, alpha-induced protein 3 384 +/- 33 430 +/- 22 498 +/- 36 553 +/- 20 3.42E-06 0.2742655 0.217638 0.6023076 0.7698438TNFAIP8L1tumor necrosis factor, alpha-induced protein 8-like 1 625 +/- 37 647 +/- 29 658 +/- 40 775 +/- 14 0.03887 0.6471604 0.032229 0.8891392 0.0755139TNFRSF19tumor necrosis factor receptor superfamily, member 19 113 +/- 17 70 +/- 3 136 +/- 13 101 +/- 8 0.022313 -0.052431 -0.056666 0.0367617 0.1181179TNFRSF21tumor necrosis factor receptor superfamily, member 21 1253 +/- 128 1127 +/- 85 1726 +/- 160 1813 +/- 182 0.000373 -0.435265 0.73039 0.2155143 0.9284655TNFRSF25tumor necrosis factor receptor superfamily, member 25 329 +/- 55 221 +/- 33 476 +/- 65 375 +/- 17 0.001449 -0.127113 -0.18511 0.1017872 0.2260367TNIK TRAF2 and NCK interacting kinase 1817 +/- 199 1891 +/- 141 2203 +/- 142 2032 +/- 65 0.042747 0.7697162 -0.309801 0.8328915 0.4567642TNPO1 Transportin 1 463 +/- 30 493 +/- 19 563 +/- 32 586 +/- 23 0.002662 0.4321005 0.574342 0.2614933 0.5518329
S2-genes differentially expressed across region.xls Page 31

Symbol Description Young CA Aged CA Young DG Aged DG CA v DG CA Y v A DG Y v A CA to PMI DG to PMITNRC4 trinucleotide repeat containing 4 4534 +/- 210 3677 +/- 260 5558 +/- 185 4760 +/- 252 0.000551 -0.029148 -0.035167 0.0107826 0.1256802TNRC6B trinucleotide repeat containing 6B 1117 +/- 123 1256 +/- 41 1325 +/- 75 1510 +/- 107 0.000842 0.3218746 0.199193 0.4025022 0.1235851TNRC6C trinucleotide repeat containing 6C 152 +/- 17 203 +/- 20 220 +/- 12 223 +/- 22 0.039677 0.0849266 0.933611 0.020591 0.837777TOB1 transducer of ERBB2, 1 172 +/- 34 132 +/- 24 260 +/- 18 168 +/- 38 0.034751 -0.356433 -0.07453 0.2580621 0.0374096TOM1L1 Target of myb1-like 1 (chicken) 114 +/- 13 121 +/- 6 130 +/- 12 171 +/- 11 0.025777 0.6318576 0.030309 0.6264392 0.0957465TOM1L2 target of myb1-like 2 (chicken) 427 +/- 53 454 +/- 32 627 +/- 29 729 +/- 42 0.000143 0.6758655 0.083306 0.7544948 0.0737582TOMM20 translocase of outer mitochondrial membrane 20 homolog (yeast) 2077 +/- 219 1780 +/- 210 2535 +/- 203 2410 +/- 320 0.00979 -0.350615 -0.74992 0.1375626 0.5406237TOPORS topoisomerase I binding, arginine/serine-rich 675 +/- 31 711 +/- 19 808 +/- 28 789 +/- 20 0.00139 0.3338017 -0.58379 0.0562058 0.8958109TOR1AIP1 torsin A interacting protein 1 848 +/- 70 1089 +/- 39 1211 +/- 42 1195 +/- 20 0.002503 0.0176232 -0.739001 0.0164243 0.7918809TP53BP1 tumor protein p53 binding protein, 1 161 +/- 33 128 +/- 20 228 +/- 14 192 +/- 13 0.00526 -0.425918 -0.094506 0.3988633 0.4583462TP53I11 tumor protein p53 inducible protein 11 260 +/- 27 226 +/- 20 441 +/- 27 402 +/- 21 2.92E-05 -0.3405 -0.289464 0.1040261 0.6878425TPARL TPA regulated locus 2090 +/- 91 1940 +/- 66 2330 +/- 87 2232 +/- 49 0.014825 -0.218201 -0.352865 0.3419041 0.4953587TPD52 tumor protein D52 200 +/- 13 258 +/- 21 346 +/- 17 380 +/- 12 1.36E-06 0.0473867 0.132678 0.1577976 0.2435336TPM1 Tropomyosin 1 (alpha) 396 +/- 71 679 +/- 70 626 +/- 100 856 +/- 98 0.000756 0.0180423 0.135836 0.0174101 0.0760796TPM3 Tropomyosin 3 66 +/- 18 93 +/- 16 149 +/- 12 140 +/- 8 0.001461 0.2891188 -0.537357 0.2336129 0.2107406TPP2 tripeptidyl peptidase II 551 +/- 39 474 +/- 52 619 +/- 20 581 +/- 36 0.026383 -0.261144 -0.386592 0.152663 0.2232007TPT1 tumor protein, translationally-controlled 1 440 +/- 33 330 +/- 27 527 +/- 42 469 +/- 48 0.001767 -0.028535 -0.385139 0.0312002 0.4178308TRA2A transformer-2 alpha 1956 +/- 84 1639 +/- 102 2458 +/- 104 1919 +/- 80 0.000253 -0.03851 -0.002777 0.3163716 0.022919TRAF3 TNF receptor-associated factor 3 1143 +/- 89 1002 +/- 66 1473 +/- 46 1224 +/- 60 0.001402 -0.233136 -0.011177 0.193721 0.0476289TRAK1 trafficking protein, kinesin binding 1 827 +/- 63 630 +/- 58 1039 +/- 46 885 +/- 23 0.000187 -0.044996 -0.018605 0.0166329 0.0124228TRAPPC1 trafficking protein particle complex 1 2834 +/- 124 2513 +/- 112 3260 +/- 100 3381 +/- 157 0.000489 -0.084079 0.533986 0.062045 0.4098492TREX2 three prime repair exonuclease 2 95 +/- 10 117 +/- 10 117 +/- 14 160 +/- 11 0.001483 0.1529645 0.039352 0.6087976 0.2772861TRFP Trf (TATA binding protein-related factor)-proximal homolog (Drosophila) 760 +/- 31 669 +/- 45 899 +/- 11 837 +/- 43 0.000485 -0.131777 -0.229599 0.3502448 0.9840086TRIM25 tripartite motif-containing 25 564 +/- 66 671 +/- 95 691 +/- 50 799 +/- 33 0.023927 0.3766349 0.108873 0.5719798 0.2297354TRIM28 tripartite motif-containing 28 2148 +/- 73 2098 +/- 79 2740 +/- 118 2779 +/- 71 0.000141 -0.652851 0.784704 0.4603828 0.6012828TRIM33 tripartite motif-containing 33 174 +/- 16 183 +/- 20 252 +/- 21 241 +/- 25 0.009426 0.7354711 -0.743118 0.9353268 0.3024073TRIO Triple functional domain (PTPRF interacting) 232 +/- 36 388 +/- 49 416 +/- 22 423 +/- 36 0.012866 0.0303455 0.867579 0.15146 0.6239491TRIT1 tRNA isopentenyltransferase 1 289 +/- 26 281 +/- 55 428 +/- 45 417 +/- 54 0.003712 -0.90035 -0.890699 0.3481056 0.3372158TSEN2 tRNA splicing endonuclease 2 homolog (S. cerevisiae) 680 +/- 36 775 +/- 24 764 +/- 50 848 +/- 36 0.036102 0.0587654 0.200491 0.200548 0.3558005TSHZ1 teashirt family zinc finger 1 1426 +/- 157 1624 +/- 111 1877 +/- 150 2037 +/- 168 0.027596 0.3298796 0.497611 0.4602512 0.3670014TSPAN17 tetraspanin 17 446 +/- 46 438 +/- 39 552 +/- 47 559 +/- 56 0.001608 -0.900023 0.924545 0.6270373 0.8927033TSPAN33 tetraspanin 33 602 +/- 55 629 +/- 49 799 +/- 8 815 +/- 30 6.61E-05 0.7228646 0.624172 0.5972228 0.5699226TSPYL3 TSPY-like 3 (pseudogene) 716 +/- 53 638 +/- 63 867 +/- 80 645 +/- 47 0.049766 -0.361301 -0.04429 0.4325361 0.1425855TSPYL5 TSPY-like 5 2033 +/- 101 1907 +/- 210 2531 +/- 101 2467 +/- 60 0.000968 -0.603119 -0.598137 0.186607 0.1726726TSR1 TSR1, 20S rRNA accumulation, homolog (S. cerevisiae) 478 +/- 37 400 +/- 29 506 +/- 20 512 +/- 34 0.035658 -0.129096 0.892873 0.1401649 0.9607942TSTA3 tissue specific transplantation antigen P35B 575 +/- 27 585 +/- 20 622 +/- 26 649 +/- 29 0.024056 0.7729235 0.501225 0.8804125 0.9551662TTC13 Tetratricopeptide repeat domain 13 138 +/- 8 126 +/- 8 200 +/- 12 191 +/- 19 3.46E-05 -0.322786 -0.717409 0.643149 0.9171223TTC19 tetratricopeptide repeat domain 19 2924 +/- 101 1559 +/- 359 3189 +/- 138 1757 +/- 528 0.051201 -0.011318 -0.051447 0.0656807 0.1680265TTC21A tetratricopeptide repeat domain 21A 332 +/- 47 407 +/- 38 457 +/- 68 502 +/- 47 0.016501 0.247463 0.596643 0.2961846 0.3642178TTC3 tetratricopeptide repeat domain 3 2645 +/- 419 2041 +/- 301 3000 +/- 226 3160 +/- 310 0.046395 -0.271423 0.68729 0.2178277 0.9574265TTC7B tetratricopeptide repeat domain 7B 3304 +/- 232 3005 +/- 181 3535 +/- 88 3570 +/- 154 0.045743 -0.334656 0.847084 0.2314993 0.1073848TTC9B tetratricopeptide repeat domain 9B 1423 +/- 122 1065 +/- 141 1668 +/- 84 1424 +/- 82 0.038822 -0.084279 -0.068593 0.0566297 0.1299875TTLL3 tubulin tyrosine ligase-like family, member 3 482 +/- 36 418 +/- 52 618 +/- 61 483 +/- 42 0.006441 -0.343168 -0.103728 0.0970144 0.0704493TTYH3 tweety homolog 3 (Drosophila) 919 +/- 53 806 +/- 80 1280 +/- 86 1140 +/- 79 0.001661 -0.2702 -0.26088 0.0512111 0.1536357TUSC1 tumor suppressor candidate 1 965 +/- 92 888 +/- 78 1306 +/- 67 1105 +/- 34 0.012341 -0.537009 -0.031015 0.4691942 0.0926691
S2-genes differentially expressed across region.xls Page 32

Symbol Description Young CA Aged CA Young DG Aged DG CA v DG CA Y v A DG Y v A CA to PMI DG to PMITUSC3 tumor suppressor candidate 3 593 +/- 43 437 +/- 30 743 +/- 35 545 +/- 36 0.00246 -0.015208 -0.003574 0.0268112 0.0789955TWISTNB TWIST neighbor 120 +/- 10 136 +/- 17 170 +/- 19 172 +/- 10 0.003003 0.4217582 0.937788 0.4335335 0.7887629TXNDC thioredoxin domain containing 476 +/- 65 553 +/- 69 609 +/- 50 751 +/- 51 0.014994 0.4355608 0.077209 0.2584736 0.2376259TXNL1 thioredoxin-like 1 2413 +/- 328 2952 +/- 186 3020 +/- 129 3692 +/- 218 0.011617 0.1909979 0.03449 0.2960004 0.0595136TYW3 tRNA-yW synthesizing protein 3 homolog (S. cerevisiae) 375 +/- 42 369 +/- 42 440 +/- 45 426 +/- 47 0.020135 -0.918334 -0.839601 0.5098858 0.5781038UBE1 ubiquitin-activating enzyme E1 (A1S9T and BN75 temperature sensitivity complementing) 6200 +/- 205 6514 +/- 169 6473 +/- 145 7267 +/- 148 0.00557 0.2658432 0.004142 0.8529343 0.0520709UBE1C Ubiquitin-activating enzyme E1C (UBA3 homolog, yeast) 132 +/- 17 140 +/- 15 180 +/- 15 161 +/- 7 0.042562 0.7276579 -0.268491 0.6819736 0.3028668UBE1DC1 ubiquitin-activating enzyme E1-domain containing 1 944 +/- 81 433 +/- 60 1060 +/- 122 436 +/- 35 0.016502 -0.00065 -0.00298 0.0148963 0.0210426UBE2E3 Ubiquitin-conjugating enzyme E2E 3 (UBC4/5 homolog, yeast) 228 +/- 39 362 +/- 76 367 +/- 52 438 +/- 93 0.030393 0.1566628 0.529079 0.4646421 0.9420953UBE2J1 ubiquitin-conjugating enzyme E2, J1 (UBC6 homolog, yeast) 447 +/- 25 412 +/- 15 587 +/- 24 472 +/- 9 0.001425 -0.256295 -0.003566 0.1363247 0.0170116UBE2M ubiquitin-conjugating enzyme E2M (UBC12 homolog, yeast) 1036 +/- 59 1047 +/- 67 1358 +/- 89 1401 +/- 79 0.001926 0.9009209 0.72824 0.8286661 0.994021UBE2R2 ubiquitin-conjugating enzyme E2R 2 1064 +/- 43 984 +/- 33 1216 +/- 47 1128 +/- 17 0.006447 -0.169439 -0.126029 0.2372278 0.2827777UBE3B ubiquitin protein ligase E3B 1301 +/- 22 1234 +/- 44 1463 +/- 39 1389 +/- 48 0.000393 -0.215786 -0.26552 0.2228435 0.4061134UBLCP1 ubiquitin-like domain containing CTD phosphatase 1 704 +/- 65 599 +/- 48 1007 +/- 130 701 +/- 68 0.003007 -0.22025 -0.072872 0.1877406 0.0890775UBPH ubiquitin-binding protein homolog 1695 +/- 104 1607 +/- 42 1871 +/- 43 1800 +/- 84 0.018389 -0.456352 -0.476111 0.7825261 0.7518558UBR1 ubiquitin protein ligase E3 component n-recognin 1 655 +/- 48 599 +/- 38 837 +/- 25 692 +/- 31 0.002617 -0.387825 -0.006326 0.393552 0.0068199UBTF upstream binding transcription factor, RNA polymerase I 637 +/- 57 695 +/- 48 792 +/- 49 824 +/- 23 0.006395 0.4502225 0.577258 0.4149284 0.9642524UBXD1 UBX domain containing 1 2280 +/- 115 2689 +/- 177 2731 +/- 204 3215 +/- 112 0.000632 0.0862916 0.072838 0.4621686 0.131601UEV3 ubiquitin-conjugating enzyme E2-like 206 +/- 22 244 +/- 17 285 +/- 21 283 +/- 11 0.023915 0.2131659 -0.910342 0.2155643 0.5593932UGCG UDP-glucose ceramide glucosyltransferase 1454 +/- 63 1024 +/- 64 1638 +/- 69 1487 +/- 121 0.016063 -0.000733 -0.318254 0.0010664 0.4295965UHMK1 U2AF homology motif (UHM) kinase 1 347 +/- 98 318 +/- 62 466 +/- 78 581 +/- 90 0.037222 -0.80937 0.362263 0.6089661 0.4656584UNC13A unc-13 homolog A (C. elegans) 4375 +/- 548 3490 +/- 308 4914 +/- 292 4433 +/- 101 0.015851 -0.19733 -0.169391 0.2125362 0.4315568UNC13C unc-13 homolog C (C. elegans) 555 +/- 100 536 +/- 112 1134 +/- 113 1508 +/- 113 6.49E-05 -0.904622 0.044441 0.9489766 0.1532116UNC5A unc-5 homolog A (C. elegans) 2942 +/- 415 2588 +/- 308 4685 +/- 192 4537 +/- 141 6.4E-06 -0.509057 -0.553178 0.4376494 0.7312857UNQ9391 tryptophan/serine protease 230 +/- 32 230 +/- 28 376 +/- 68 330 +/- 64 0.001186 0.9995504 -0.638373 0.9957608 0.9262423URG4 Up-regulated gene 4 143 +/- 13 185 +/- 39 207 +/- 17 225 +/- 44 0.002523 0.3477214 0.722383 0.1728096 0.5130241USF2 upstream transcription factor 2, c-fos interacting 1751 +/- 120 1856 +/- 103 2246 +/- 71 2251 +/- 91 0.000256 0.5198199 0.963564 0.7121665 0.3098994USP1 ubiquitin specific peptidase 1 246 +/- 23 298 +/- 23 324 +/- 22 333 +/- 20 0.04091 0.13719 0.749478 0.0504862 0.4958402USP11 ubiquitin specific peptidase 11 5050 +/- 405 5345 +/- 377 6253 +/- 122 6562 +/- 395 0.002376 0.6063314 0.490697 0.8201948 0.0599795USP22 ubiquitin specific peptidase 22 6620 +/- 505 6082 +/- 535 7734 +/- 576 7141 +/- 522 0.000709 -0.481633 -0.465468 0.6597791 0.6400643USP28 ubiquitin specific peptidase 28 309 +/- 28 362 +/- 44 450 +/- 38 451 +/- 43 0.00054 0.3286532 0.985795 0.0764637 0.6491161USP31 ubiquitin specific peptidase 31 360 +/- 19 436 +/- 27 499 +/- 36 687 +/- 45 0.000805 0.0458499 0.011486 0.1335057 0.1219157USP33 ubiquitin specific peptidase 33 626 +/- 44 814 +/- 106 896 +/- 94 889 +/- 102 0.002988 0.1474969 -0.956814 0.0288263 0.3352423USP54 ubiquitin specific peptidase 54 290 +/- 19 331 +/- 30 392 +/- 38 347 +/- 31 0.046401 0.2828821 -0.38414 0.4232834 0.1444715UST uronyl-2-sulfotransferase 78 +/- 24 140 +/- 44 249 +/- 39 293 +/- 39 0.000857 0.2434981 0.450922 0.5862095 0.8619314UTP18 UTP18, small subunit (SSU) processome component, homolog (yeast) 599 +/- 58 413 +/- 38 673 +/- 50 479 +/- 70 0.043722 -0.026658 -0.055462 0.1362504 0.3656743UXS1 UDP-glucuronate decarboxylase 1 801 +/- 71 662 +/- 61 974 +/- 34 857 +/- 59 0.001719 -0.170227 -0.133849 0.1819497 0.4824605VAMP2 vesicle-associated membrane protein 2 (synaptobrevin 2) 12990 +/- 255 12003 +/- 489 16322 +/- 332 16183 +/- 451 2.51E-07 -0.113853 -0.811338 0.0068253 0.6205985VASH1 Vasohibin 1 535 +/- 16 744 +/- 63 1011 +/- 90 999 +/- 53 2.52E-05 0.0198306 -0.908355 0.071398 0.9152143VEGFB vascular endothelial growth factor B 190 +/- 21 174 +/- 25 345 +/- 11 376 +/- 33 9.22E-06 -0.622574 0.410876 0.6961231 0.3428105VGCNL1 voltage gated channel like 1 82 +/- 17 96 +/- 16 158 +/- 21 136 +/- 15 0.012019 0.5640064 -0.416453 0.4779032 0.429056VPS13A vacuolar protein sorting 13 homolog A (S. cerevisiae) 1676 +/- 195 1449 +/- 92 2198 +/- 82 1927 +/- 110 4.42E-05 -0.326019 -0.08481 0.4163498 0.3039349VPS37B vacuolar protein sorting 37 homolog B (S. cerevisiae) 1798 +/- 95 1607 +/- 186 2109 +/- 138 1793 +/- 92 0.045411 -0.389358 -0.091311 0.3721637 0.2454975VPS37D vacuolar protein sorting 37 homolog D (S. cerevisiae) 519 +/- 26 502 +/- 35 638 +/- 37 616 +/- 49 0.018984 -0.717953 -0.737571 0.3614872 0.4340391VPS41 vacuolar protein sorting 41 (yeast) 837 +/- 38 914 +/- 46 896 +/- 48 1005 +/- 64 0.004625 0.2251202 0.209433 0.2144679 0.2704232
S2-genes differentially expressed across region.xls Page 33

Symbol Description Young CA Aged CA Young DG Aged DG CA v DG CA Y v A DG Y v A CA to PMI DG to PMIVPS52 vacuolar protein sorting 52 (S. cerevisiae) 2096 +/- 88 2181 +/- 130 2255 +/- 63 2679 +/- 158 0.004678 0.6022707 0.052527 0.8677483 0.0234175WBP11 WW domain binding protein 11 3554 +/- 268 3189 +/- 119 3778 +/- 79 3610 +/- 55 0.035057 -0.254967 -0.11805 0.1339353 0.0502493WBP5 WW domain binding protein 5 2443 +/- 318 2531 +/- 139 3156 +/- 84 2951 +/- 97 0.008611 0.8083123 -0.146902 0.7072396 0.2504388WBSCR17 Williams-Beuren syndrome chromosome region 17 3846 +/- 222 2759 +/- 329 4476 +/- 273 3946 +/- 239 0.003811 -0.023533 -0.178057 0.0095031 0.5398113WDFY3 WD repeat and FYVE domain containing 3 2635 +/- 304 2528 +/- 167 3233 +/- 258 3486 +/- 170 0.009028 -0.764655 0.435442 0.9916405 0.4114281WDR39 WD repeat domain 39 633 +/- 28 580 +/- 22 791 +/- 33 754 +/- 48 0.000392 -0.169727 -0.546174 0.2151565 0.8293635WDR45L WDR45-like 610 +/- 39 568 +/- 18 726 +/- 26 684 +/- 24 0.000238 -0.366247 -0.264986 0.2734846 0.8377011WDR67 WD repeat domain 67 408 +/- 52 473 +/- 25 518 +/- 47 573 +/- 44 0.010942 0.2989411 0.413276 0.2648955 0.6170061WDSUB1 WD repeat, sterile alpha motif and U-box domain containing 1 515 +/- 23 464 +/- 34 586 +/- 34 515 +/- 28 0.035757 -0.258457 -0.138048 0.2613205 0.455581WFIKKN1 WAP, follistatin/kazal, immunoglobulin, kunitz and netrin domain containing 1 171 +/- 26 162 +/- 21 244 +/- 22 211 +/- 20 0.002521 -0.788262 -0.300441 0.5165338 0.3147883WHDC1 WAS protein homology region 2 domain containing 1 276 +/- 18 251 +/- 22 322 +/- 19 263 +/- 13 0.001236 -0.402533 -0.033976 0.2380032 0.061158WIZ widely-interspaced zinc finger motifs 1361 +/- 65 1217 +/- 28 1483 +/- 47 1401 +/- 85 0.004563 -0.082209 -0.42558 0.0485294 0.4006016WNT2B wingless-type MMTV integration site family, member 2B 141 +/- 11 118 +/- 11 163 +/- 9 142 +/- 19 0.042071 -0.168066 -0.362651 0.0346482 0.1807721WNT3 wingless-type MMTV integration site family, member 3 355 +/- 36 256 +/- 29 472 +/- 51 342 +/- 26 0.001763 -0.059504 -0.055886 0.1603254 0.1346164WRNIP1 Werner helicase interacting protein 1 2354 +/- 101 2186 +/- 134 3033 +/- 152 2971 +/- 26 4.26E-05 -0.340677 -0.698637 0.3712669 0.7585791WSB2 WD repeat and SOCS box-containing 2 7569 +/- 145 7300 +/- 367 8524 +/- 288 8313 +/- 399 0.001263 -0.519115 -0.679261 0.2104443 0.4683081WTAP Wilms tumor 1 associated protein 519 +/- 31 710 +/- 21 683 +/- 41 771 +/- 66 0.012206 0.0006447 0.292143 0.0003647 0.0433612WWC3 WWC family member 3 680 +/- 28 741 +/- 29 739 +/- 37 775 +/- 48 0.034064 0.1617262 0.569867 0.0872943 0.5981949XPR1 Xenotropic and polytropic retrovirus receptor 1829 +/- 201 1625 +/- 117 2672 +/- 206 2242 +/- 152 0.005698 -0.405808 -0.128756 0.5144049 0.395138XRCC6BP1XRCC6 binding protein 1 301 +/- 20 313 +/- 32 419 +/- 27 409 +/- 17 0.000586 0.7486826 -0.760635 0.429831 0.9985575XRN1 5'-3' exoribonuclease 1 314 +/- 23 346 +/- 18 416 +/- 18 408 +/- 28 0.003161 0.3058441 -0.80817 0.4214337 0.4761623YIPF2 Yip1 domain family, member 2 771 +/- 39 783 +/- 85 966 +/- 39 1017 +/- 43 0.002247 0.9009127 0.405569 0.8341146 0.138297YIPF5 Yip1 domain family, member 5 2776 +/- 72 2388 +/- 136 2883 +/- 102 2798 +/- 74 0.02751 -0.037028 -0.516929 0.0084887 0.633725YRDC yrdC domain containing (E. coli) 396 +/- 15 305 +/- 14 466 +/- 9 394 +/- 30 0.001004 -0.001409 -0.075638 0.0027356 0.4238058YTHDF2 YTH domain family, member 2 2059 +/- 97 1665 +/- 58 2492 +/- 66 2178 +/- 98 0.00012 -0.007866 -0.031414 0.1128308 0.432849YWHAG tyrosine 3-monooxygenase/tryptophan 5-monooxygenase activation protein, gamma polyp 20235 +/- 783 18812 +/- 635 20710 +/- 678 21437 +/- 756 0.028379 -0.189738 0.492819 0.1535006 0.9845022ZA20D3 Zinc finger, A20 domain containing 3 171 +/- 10 222 +/- 21 222 +/- 14 221 +/- 13 0.019293 0.0655536 -0.940827 0.0085964 0.7023625ZAK sterile alpha motif and leucine zipper containing kinase AZK 523 +/- 34 457 +/- 37 703 +/- 101 533 +/- 46 0.022417 -0.215943 -0.169083 0.2238292 0.3289735ZBED1 zinc finger, BED-type containing 1 1205 +/- 69 1265 +/- 97 1434 +/- 62 1473 +/- 72 0.020184 0.6245763 0.695318 0.9299459 0.427471ZBTB2 zinc finger and BTB domain containing 2 196 +/- 4 189 +/- 6 236 +/- 8 210 +/- 10 8.85E-05 -0.426691 -0.078207 0.7487008 0.5458288ZBTB20 Zinc finger and BTB domain containing 20 73 +/- 9 98 +/- 8 119 +/- 14 127 +/- 11 0.000232 0.0645116 0.623125 0.0108026 0.5206635ZBTB33 zinc finger and BTB domain containing 33 2068 +/- 190 1926 +/- 93 2266 +/- 50 2340 +/- 47 0.007219 -0.520695 0.305785 0.5668458 0.3407075ZBTB6 zinc finger and BTB domain containing 6 241 +/- 10 243 +/- 12 301 +/- 12 279 +/- 10 0.000162 0.9477737 -0.184121 0.7667897 0.0544392ZBTB7A zinc finger and BTB domain containing 7A 1920 +/- 64 1641 +/- 79 2555 +/- 279 2188 +/- 127 0.001221 -0.021473 -0.27096 0.1108262 0.5977751ZBTB8 zinc finger and BTB domain containing 8 163 +/- 26 200 +/- 13 226 +/- 23 248 +/- 21 0.007398 0.2512714 0.501441 0.5335853 0.7457664ZC3H14 zinc finger CCCH-type containing 14 1650 +/- 138 1245 +/- 70 1782 +/- 55 1603 +/- 67 0.006636 -0.033219 -0.072998 0.0842893 0.4758872ZC3H7A zinc finger CCCH-type containing 7A 323 +/- 29 364 +/- 14 362 +/- 23 412 +/- 17 0.0263 0.2413865 0.11879 0.3548957 0.297632ZCCHC17 zinc finger, CCHC domain containing 17 904 +/- 39 1024 +/- 47 1131 +/- 49 1021 +/- 52 0.016006 0.0762725 -0.162783 0.4129188 0.0337418ZCCHC4 zinc finger, CCHC domain containing 4 129 +/- 15 142 +/- 11 179 +/- 11 158 +/- 13 0.003647 0.5316745 -0.255222 0.2284574 0.3419854ZCCHC9 zinc finger, CCHC domain containing 9 897 +/- 53 848 +/- 32 1071 +/- 46 942 +/- 45 0.022511 -0.454538 -0.074569 0.8930571 0.2459693ZDHHC1 zinc finger, DHHC-type containing 1 157 +/- 21 200 +/- 25 235 +/- 16 257 +/- 16 0.004213 0.2159697 0.347212 0.2799185 0.9170135ZDHHC15 zinc finger, DHHC-type containing 15 332 +/- 20 338 +/- 18 397 +/- 14 362 +/- 14 0.009873 0.8314976 -0.108421 0.9000848 0.0795048ZDHHC18 zinc finger, DHHC-type containing 18 223 +/- 14 215 +/- 9 266 +/- 15 299 +/- 19 0.000597 -0.625972 0.204311 0.9259997 0.1438175ZDHHC3 zinc finger, DHHC-type containing 3 327 +/- 26 276 +/- 38 418 +/- 25 375 +/- 15 0.006707 -0.297697 -0.168635 0.201915 0.1320413ZDHHC8 zinc finger, DHHC-type containing 8 483 +/- 29 442 +/- 16 630 +/- 45 536 +/- 23 0.006318 -0.254056 -0.103633 0.3887959 0.2342682
S2-genes differentially expressed across region.xls Page 34

Symbol Description Young CA Aged CA Young DG Aged DG CA v DG CA Y v A DG Y v A CA to PMI DG to PMIZF HCF-binding transcription factor Zhangfei 481 +/- 22 590 +/- 26 608 +/- 20 692 +/- 20 0.000708 0.0098783 0.016805 0.0079603 0.3500007ZFP30 zinc finger protein 30 homolog (mouse) 507 +/- 14 543 +/- 38 615 +/- 45 648 +/- 71 0.003177 0.4017811 0.710667 0.0485218 0.3973963ZFP90 zinc finger protein 90 homolog (mouse) 3528 +/- 279 4260 +/- 161 3870 +/- 345 4323 +/- 157 0.025622 0.0525751 0.270959 0.0915682 0.4421446ZFYVE1 zinc finger, FYVE domain containing 1 204 +/- 23 229 +/- 17 263 +/- 13 296 +/- 17 0.013793 0.4098305 0.171816 0.6915038 0.3958799ZFYVE20 zinc finger, FYVE domain containing 20 102 +/- 17 70 +/- 6 122 +/- 11 112 +/- 5 0.023073 -0.121761 -0.455929 0.0874595 0.4969319ZFYVE27 zinc finger, FYVE domain containing 27 2177 +/- 96 2097 +/- 162 2316 +/- 52 2309 +/- 109 0.040981 -0.68373 -0.952885 0.1717035 0.2790218ZFYVE28 zinc finger, FYVE domain containing 28 425 +/- 19 395 +/- 10 596 +/- 35 569 +/- 51 0.000193 -0.210957 -0.667875 0.2468468 0.9875766ZMYM3 zinc finger, MYM-type 3 281 +/- 15 293 +/- 13 354 +/- 15 392 +/- 20 4.39E-05 0.5681973 0.174397 0.9456254 0.4530916ZMYM4 zinc finger, MYM-type 4 607 +/- 22 589 +/- 35 721 +/- 22 682 +/- 13 0.000205 -0.676327 -0.159697 0.5478719 0.0538551ZNF114 zinc finger protein 114 107 +/- 3 125 +/- 14 135 +/- 12 126 +/- 11 0.020501 0.2593782 -0.598494 0.3699002 0.4357346ZNF12 zinc finger protein 12 809 +/- 59 700 +/- 10 934 +/- 44 828 +/- 54 0.008745 -0.122813 -0.165469 0.1224268 0.4543277ZNF131 Zinc finger protein 131 (clone pHZ-10) 124 +/- 18 238 +/- 29 160 +/- 22 267 +/- 25 0.016536 0.0100522 0.011395 0.1261566 0.0668083ZNF189 zinc finger protein 189 1618 +/- 207 1411 +/- 158 1863 +/- 46 1837 +/- 69 0.018596 -0.446162 -0.756508 0.5814633 0.8002239ZNF19 zinc finger protein 19 148 +/- 17 107 +/- 13 190 +/- 15 173 +/- 14 0.020289 -0.087649 -0.438561 0.3217213 0.43376ZNF195 zinc finger protein 195 327 +/- 48 323 +/- 19 379 +/- 48 349 +/- 14 0.042791 -0.938495 -0.568958 0.7849727 0.4991122ZNF197 zinc finger protein 197 370 +/- 35 200 +/- 10 492 +/- 28 326 +/- 18 1.85E-05 -0.00368 -0.000982 0.0070485 0.01695ZNF219 zinc finger protein 219 720 +/- 46 791 +/- 57 886 +/- 23 918 +/- 33 0.000566 0.3616298 0.449246 0.84916 0.8722246ZNF221 zinc finger protein 221 175 +/- 14 164 +/- 12 202 +/- 14 195 +/- 17 0.03668 -0.55094 -0.770858 0.8516415 0.5586447ZNF238 zinc finger protein 238 7398 +/- 390 6014 +/- 471 8244 +/- 127 6592 +/- 730 0.049554 -0.047964 -0.08576 0.1522323 0.5300615ZNF25 zinc finger protein 25 1239 +/- 41 1519 +/- 51 1305 +/- 50 1653 +/- 73 0.004793 0.0018547 0.00525 0.0858856 0.0659915ZNF267 zinc finger protein 267 177 +/- 18 186 +/- 22 250 +/- 8 228 +/- 16 0.00191 0.7579929 -0.284428 0.4325489 0.6491789ZNF268 zinc finger protein 268 176 +/- 5 187 +/- 9 248 +/- 13 245 +/- 10 6.97E-05 0.3168509 -0.866404 0.1821338 0.6363664ZNF278 zinc finger protein 278 239 +/- 11 277 +/- 12 317 +/- 19 300 +/- 16 0.019184 0.0427149 -0.486719 0.0601858 0.7465071ZNF282 zinc finger protein 282 587 +/- 32 638 +/- 26 745 +/- 26 698 +/- 20 0.00278 0.2408864 -0.172911 0.4845465 0.3355149ZNF292 zinc finger protein 292 587 +/- 17 672 +/- 38 793 +/- 46 717 +/- 48 0.019011 0.0801015 -0.289456 0.0765608 0.6619526ZNF30 zinc finger protein 30 183 +/- 21 193 +/- 20 252 +/- 36 225 +/- 26 0.001603 0.7322227 -0.558786 0.1122953 0.6091916ZNF306 Zinc finger protein 306 118 +/- 16 157 +/- 18 180 +/- 18 182 +/- 18 0.005107 0.1371985 0.951361 0.2601777 0.6833357ZNF323 zinc finger protein 323 162 +/- 15 187 +/- 22 236 +/- 13 296 +/- 17 0.001103 0.368404 0.023073 0.6848203 0.0231175ZNF331 zinc finger protein 331 749 +/- 77 878 +/- 49 955 +/- 35 1047 +/- 27 0.001112 0.193887 0.067534 0.1724808 0.028373ZNF347 zinc finger protein 347 126 +/- 11 178 +/- 7 162 +/- 16 181 +/- 15 0.030671 0.0042757 0.409142 0.0166876 0.8325214ZNF358 zinc finger protein 358 556 +/- 13 684 +/- 43 872 +/- 81 877 +/- 12 0.000402 0.028655 0.953891 0.0864711 0.9796446ZNF364 zinc finger protein 364 1966 +/- 224 1611 +/- 142 2340 +/- 263 1915 +/- 122 0.000806 -0.215149 -0.185383 0.3870021 0.4582997ZNF385 zinc finger protein 385 773 +/- 60 764 +/- 62 1254 +/- 67 1190 +/- 42 4.87E-06 -0.916787 -0.443772 0.4341433 0.2357291ZNF390 zinc finger protein 390 168 +/- 21 180 +/- 10 217 +/- 15 212 +/- 9 0.014646 0.6272967 -0.758499 0.7023835 0.7942171ZNF430 zinc finger protein 430 359 +/- 59 450 +/- 57 481 +/- 70 519 +/- 74 0.027438 0.2894408 0.715109 0.4684203 0.9933476ZNF434 zinc finger protein 434 229 +/- 27 279 +/- 34 429 +/- 30 416 +/- 54 0.000965 0.2723783 -0.832146 0.1064989 0.8937655ZNF435 zinc finger protein 435 110 +/- 9 147 +/- 5 143 +/- 12 160 +/- 5 0.033286 0.0094135 0.248189 0.0044561 0.7177566ZNF436 zinc finger protein 436 845 +/- 77 754 +/- 83 1185 +/- 39 1061 +/- 36 0.000267 -0.443221 -0.045877 0.4482469 0.0157843ZNF444 zinc finger protein 444 641 +/- 67 642 +/- 25 770 +/- 39 731 +/- 38 0.01247 0.9900256 -0.478501 0.8013133 0.6119273ZNF447 zinc finger protein 447 6480 +/- 176 6013 +/- 367 8138 +/- 192 8323 +/- 247 8.12E-07 -0.287621 0.57145 0.0133939 0.6867979ZNF45 zinc finger protein 45 279 +/- 18 336 +/- 17 332 +/- 22 400 +/- 18 0.001286 0.0495013 0.045354 0.2410449 0.225943ZNF452 zinc finger protein 452 148 +/- 21 151 +/- 15 209 +/- 9 177 +/- 7 0.014954 0.8964179 -0.023525 0.9426293 0.0763942ZNF493 zinc finger protein 493 153 +/- 21 181 +/- 15 179 +/- 24 212 +/- 8 0.001711 0.3042095 0.226304 0.5064487 0.3033026ZNF501 zinc finger protein 501 137 +/- 4 217 +/- 10 206 +/- 8 206 +/- 8 0.044857 0.0002728 -0.95366 0.0016356 0.8863999ZNF502 zinc finger protein 502 356 +/- 27 410 +/- 20 386 +/- 16 431 +/- 16 0.037923 0.1447858 0.072678 0.5431746 0.0974448
S2-genes differentially expressed across region.xls Page 35

Symbol Description Young CA Aged CA Young DG Aged DG CA v DG CA Y v A DG Y v A CA to PMI DG to PMIZNF503 zinc finger protein 503 989 +/- 27 822 +/- 31 1260 +/- 34 1165 +/- 60 1.25E-06 -0.002239 -0.214355 0.0017121 0.1866212ZNF555 zinc finger protein 555 362 +/- 20 380 +/- 17 437 +/- 27 378 +/- 24 0.04619 0.516341 -0.136688 0.5125201 0.1286823ZNF559 Zinc finger protein 559 116 +/- 9 94 +/- 8 149 +/- 18 118 +/- 7 0.005537 -0.095442 -0.166653 0.2433891 0.4638124ZNF566 zinc finger protein 566 228 +/- 18 246 +/- 30 336 +/- 14 336 +/- 34 2.04E-05 0.6175617 0.993307 0.2325645 0.5332713ZNF570 zinc finger protein 570 94 +/- 6 112 +/- 10 149 +/- 4 137 +/- 7 0.000537 0.1720326 -0.145391 0.2220687 0.9296035ZNF573 zinc finger protein 573 187 +/- 34 144 +/- 13 251 +/- 30 152 +/- 28 0.039697 -0.279536 -0.039265 0.5620131 0.4317854ZNF575 zinc finger protein 575 345 +/- 35 284 +/- 22 392 +/- 19 412 +/- 13 0.019584 -0.171246 0.412578 0.0419573 0.1456269ZNF580 zinc finger protein 580 977 +/- 46 933 +/- 22 1370 +/- 34 1366 +/- 51 3.43E-06 -0.415504 -0.952135 0.5930736 0.7841005ZNF586 zinc finger protein 586 316 +/- 21 232 +/- 26 438 +/- 20 279 +/- 34 0.00204 -0.031863 -0.005803 0.0353043 0.0017489ZNF607 zinc finger protein 607 223 +/- 9 235 +/- 18 291 +/- 11 257 +/- 17 0.001841 0.5705562 -0.126544 0.4880873 0.1250607ZNF625 zinc finger protein 625 105 +/- 8 110 +/- 9 122 +/- 14 113 +/- 8 0.04849 0.6801533 -0.600199 0.4741532 0.8616622ZNF629 zinc finger protein 629 637 +/- 43 636 +/- 24 753 +/- 28 734 +/- 21 0.003072 -0.991827 -0.587096 0.8007429 0.7441857ZNF644 zinc finger protein 644 199 +/- 32 259 +/- 36 281 +/- 20 341 +/- 52 0.046895 0.236237 0.326765 0.2638957 0.5021827ZNF651 zinc finger protein 651 305 +/- 22 361 +/- 29 396 +/- 9 412 +/- 43 0.044273 0.1526737 0.740549 0.0634426 0.6643048ZNF658 zinc finger protein 658 201 +/- 19 171 +/- 8 278 +/- 14 206 +/- 22 0.013475 -0.206711 -0.026069 0.2586914 0.1252363ZNF672 zinc finger protein 672 159 +/- 20 192 +/- 23 219 +/- 8 245 +/- 24 0.008891 0.2914762 0.373429 0.3790093 0.6438691ZNF75 zinc finger protein 75 (D8C6) 118 +/- 9 171 +/- 11 232 +/- 23 191 +/- 11 0.013173 0.0039383 -0.160314 0.0464456 0.0901358ZNF76 zinc finger protein 76 (expressed in testis) 527 +/- 36 550 +/- 37 616 +/- 36 580 +/- 23 0.046598 0.6650163 -0.429049 0.6548385 0.7129831ZNHIT4 zinc finger, HIT type 4 320 +/- 15 362 +/- 24 394 +/- 18 402 +/- 35 0.024347 0.1659424 0.831873 0.1170649 0.4533148ZYG11B Zyg-11 homolog B (C. elegans) 783 +/- 95 1096 +/- 114 916 +/- 54 1329 +/- 49 0.004684 0.0627527 0.000304 0.2823152 0.0091151Overexpressed in DGAACS acetoacetyl-CoA synthetase 1751 +/- 102 1591 +/- 86 1523 +/- 75 1481 +/- 49 -0.016233 -0.258778 -0.648834 0.128366 0.6137267AADAT aminoadipate aminotransferase 271 +/- 29 237 +/- 19 145 +/- 17 143 +/- 19 -0.000335 -0.370529 -0.959854 0.3032134 0.7254791AASDH 2-aminoadipic 6-semialdehyde dehydrogenase 587 +/- 19 771 +/- 21 501 +/- 29 664 +/- 26 -6.83E-05 8.644E-05 0.002318 0.0046175 0.0347906AATF apoptosis antagonizing transcription factor 389 +/- 16 435 +/- 24 350 +/- 17 373 +/- 10 -0.013171 0.1575421 0.265816 0.0173386 0.1137768ABCA2 ATP-binding cassette, sub-family A (ABC1), member 2 3508 +/- 582 4558 +/- 624 2835 +/- 141 3151 +/- 200 -0.044031 0.2467877 0.235291 0.0806423 0.2178105ABCA8 ATP-binding cassette, sub-family A (ABC1), member 8 492 +/- 90 430 +/- 93 322 +/- 37 285 +/- 38 -0.014315 -0.645006 -0.50183 0.7149486 0.8450982ABCC4 ATP-binding cassette, sub-family C (CFTR/MRP), member 4 437 +/- 32 380 +/- 18 322 +/- 22 284 +/- 35 -0.003298 -0.154478 -0.389004 0.4768687 0.2189396ABCC5 ATP-binding cassette, sub-family C (CFTR/MRP), member 5 882 +/- 71 833 +/- 12 721 +/- 31 739 +/- 53 -0.005957 -0.522499 0.775559 0.6652941 0.6341033ABCD4 ATP-binding cassette, sub-family D (ALD), member 4 223 +/- 61 147 +/- 28 162 +/- 33 99 +/- 17 -0.013608 -0.300099 -0.139387 0.4001925 0.211957ABCG2 ATP-binding cassette, sub-family G (WHITE), member 2 437 +/- 47 523 +/- 31 335 +/- 10 398 +/- 11 -0.001844 0.1582204 0.002045 0.1826101 0.0544598ABHD10 abhydrolase domain containing 10 2354 +/- 67 2239 +/- 127 1737 +/- 50 1834 +/- 41 -0.000188 -0.450627 0.165473 0.2208405 0.0744561ABHD4 abhydrolase domain containing 4 719 +/- 43 630 +/- 34 585 +/- 27 564 +/- 36 -0.001432 -0.134428 -0.651686 0.2115173 0.3011896ABHD7 abhydrolase domain containing 7 227 +/- 36 201 +/- 30 140 +/- 21 163 +/- 15 -0.004116 -0.590751 0.400479 0.2824869 0.4086488ABL1 v-abl Abelson murine leukemia viral oncogene homolog 1 1405 +/- 84 1379 +/- 70 1223 +/- 31 1231 +/- 20 -0.008732 -0.81665 0.834521 0.8396622 0.481535ABR active BCR-related gene 4665 +/- 282 4223 +/- 241 3977 +/- 225 3991 +/- 129 -0.011536 -0.261566 0.959197 0.0809025 0.9587233ABTB2 Ankyrin repeat and BTB (POZ) domain containing 2 654 +/- 122 485 +/- 39 505 +/- 32 342 +/- 18 -0.030184 -0.236531 -0.002265 0.5021444 0.0832426ACAA2 acetyl-Coenzyme A acyltransferase 2 (mitochondrial 3-oxoacyl-Coenzyme A thiolase) 589 +/- 56 854 +/- 62 529 +/- 31 645 +/- 33 -0.03897 0.0097889 0.030153 0.000594 0.1078687ACADS acyl-Coenzyme A dehydrogenase, C-2 to C-3 short chain 311 +/- 31 346 +/- 34 261 +/- 15 265 +/- 24 -0.021818 0.4642014 0.876887 0.2333204 0.3001278ACAT1 acetyl-Coenzyme A acetyltransferase 1 (acetoacetyl Coenzyme A thiolase) 4099 +/- 188 3515 +/- 106 3250 +/- 137 3238 +/- 137 -0.007467 -0.027046 -0.954273 0.1128106 0.9705821ACBD5 acyl-Coenzyme A binding domain containing 5 4356 +/- 369 4915 +/- 354 3761 +/- 224 3927 +/- 60 -0.003678 0.3001289 0.503026 0.1545917 0.3403616ACCN1 amiloride-sensitive cation channel 1, neuronal (degenerin) 1925 +/- 136 1421 +/- 164 1179 +/- 59 900 +/- 42 -0.000254 -0.040656 -0.004392 0.0273253 0.0121481ACOT7 acyl-CoA thioesterase 7 4567 +/- 119 4226 +/- 238 3764 +/- 158 3740 +/- 137 -0.000176 -0.239117 -0.91357 0.0443048 0.7733545ACOT8 acyl-CoA thioesterase 8 651 +/- 34 662 +/- 39 571 +/- 17 601 +/- 28 -0.023548 0.8362974 0.403548 0.3351409 0.1514284ACOT9 acyl-CoA thioesterase 9 370 +/- 33 344 +/- 40 284 +/- 9 218 +/- 20 -0.001741 -0.63831 -0.024981 0.6715461 0.2839666
S2-genes differentially expressed across region.xls Page 36

Symbol Description Young CA Aged CA Young DG Aged DG CA v DG CA Y v A DG Y v A CA to PMI DG to PMIACP6 acid phosphatase 6, lysophosphatidic 881 +/- 49 984 +/- 51 742 +/- 28 837 +/- 8 -0.002935 0.171551 0.018151 0.0355159 0.0710112ACPL2 acid phosphatase-like 2 2269 +/- 344 1642 +/- 129 1273 +/- 65 1279 +/- 73 -0.016713 -0.135982 0.955883 0.0922752 0.8212643ACSS1 acyl-CoA synthetase short-chain family member 1 229 +/- 21 311 +/- 28 196 +/- 16 228 +/- 23 -0.013777 0.0442198 0.295382 0.092173 0.4151929ACTL6A actin-like 6A 309 +/- 22 369 +/- 42 267 +/- 20 291 +/- 12 -0.020727 0.2424735 0.356269 0.0266745 0.3532226ADAM10 ADAM metallopeptidase domain 10 1557 +/- 99 1808 +/- 84 1420 +/- 70 1612 +/- 46 -0.053577 0.0837127 0.049117 0.0627916 0.3649355ADAMTS17ADAM metallopeptidase with thrombospondin type 1 motif, 17 113 +/- 10 126 +/- 15 89 +/- 6 97 +/- 13 -0.030633 0.4731131 0.544571 0.1948285 0.2868528ADCK1 aarF domain containing kinase 1 478 +/- 32 485 +/- 25 408 +/- 25 400 +/- 26 -0.002745 0.8668716 -0.83027 0.5364103 0.5037556ADCY5 adenylate cyclase 5 782 +/- 43 764 +/- 28 636 +/- 14 627 +/- 29 -0.000126 -0.727758 -0.795005 0.7575292 0.1320195ADCY7 adenylate cyclase 7 154 +/- 16 183 +/- 20 122 +/- 11 111 +/- 9 -0.002811 0.2882067 -0.444627 0.0573021 0.8758977ADCY8 adenylate cyclase 8 (brain) 842 +/- 32 772 +/- 62 492 +/- 39 485 +/- 16 -1.27E-05 -0.346282 -0.874863 0.1549163 0.6633748ADD1 adducin 1 (alpha) 4262 +/- 135 3716 +/- 140 3921 +/- 116 3527 +/- 163 -0.000231 -0.018613 -0.086088 0.0313122 0.2337141ADH5 alcohol dehydrogenase 5 (class III), chi polypeptide 2880 +/- 119 2714 +/- 250 2505 +/- 94 2725 +/- 150 -0.001489 -0.566182 0.253363 0.0822124 0.7457064ADIPOR2 adiponectin receptor 2 2814 +/- 343 3544 +/- 400 1735 +/- 118 2083 +/- 155 -0.001503 0.197116 0.112243 0.1105974 0.3560335ADPRH ADP-ribosylarginine hydrolase 189 +/- 23 309 +/- 20 168 +/- 16 281 +/- 20 -0.015382 0.0030101 0.00234 0.0028139 0.0090525ADSS adenylosuccinate synthase 1086 +/- 45 1042 +/- 80 888 +/- 50 878 +/- 45 -8.9E-05 -0.637651 -0.884415 0.8606578 0.6521034ADSSL1 adenylosuccinate synthase like 1 613 +/- 114 708 +/- 114 483 +/- 48 459 +/- 46 -0.015538 0.5705081 -0.719204 0.1866972 0.7457888AEBP1 AE binding protein 1 344 +/- 61 279 +/- 23 185 +/- 45 234 +/- 26 -0.008481 -0.357009 0.381106 0.1734807 0.6822614AFAP actin filament associated protein 2123 +/- 453 1801 +/- 181 675 +/- 94 685 +/- 54 -0.00094 -0.531267 0.926429 0.3430637 0.9160407AGA aspartylglucosaminidase 134 +/- 12 153 +/- 15 116 +/- 11 120 +/- 16 -0.019452 0.3560886 0.827171 0.1060341 0.6355566AGXT2L1 alanine-glyoxylate aminotransferase 2-like 1 3918 +/- 414 5586 +/- 247 3574 +/- 289 4607 +/- 398 -0.017396 0.0082839 0.070131 0.0534143 0.1478785AHSA1 AHA1, activator of heat shock 90kDa protein ATPase homolog 1 (yeast) 3672 +/- 96 3351 +/- 98 3165 +/- 122 3121 +/- 103 -0.010338 -0.04181 -0.788981 0.0745863 0.7081707AIF1 allograft inflammatory factor 1 304 +/- 36 332 +/- 38 246 +/- 22 256 +/- 20 -0.032217 0.6062468 0.740217 0.2232582 0.5621515AIM1 absent in melanoma 1 368 +/- 97 238 +/- 44 114 +/- 15 175 +/- 22 -0.04556 -0.265509 0.050898 0.4169037 0.3555645AKNA AT-hook transcription factor 176 +/- 8 199 +/- 22 114 +/- 11 139 +/- 9 -0.000767 0.3725376 0.100771 0.3327064 0.0792742AKR1A1 aldo-keto reductase family 1, member A1 (aldehyde reductase) 1965 +/- 241 2348 +/- 190 1513 +/- 61 1657 +/- 96 -0.002833 0.2414578 0.246697 0.3894574 0.8508787AKR1C1 aldo-keto reductase family 1, member C1 (dihydrodiol dehydrogenase 1; 20-alpha (3-alph 5920 +/- 823 6993 +/- 469 3173 +/- 424 3822 +/- 213 -7.24E-06 0.29023 0.212276 0.2995837 0.2755385AKR7A2 aldo-keto reductase family 7, member A2 (aflatoxin aldehyde reductase) 1175 +/- 77 1379 +/- 69 853 +/- 46 1153 +/- 50 -0.000463 0.0781494 0.001841 0.3070654 0.0892846AKT3 V-akt murine thymoma viral oncogene homolog 3 (protein kinase B, gamma) 4120 +/- 100 3342 +/- 250 3311 +/- 184 3045 +/- 90 -0.019216 -0.025143 -0.234272 0.0121962 0.4146659ALAD aminolevulinate, delta-, dehydratase 192 +/- 24 250 +/- 23 165 +/- 13 200 +/- 16 -0.045111 0.1145861 0.127988 0.0348568 0.0100427ALAS1 aminolevulinate, delta-, synthase 1 751 +/- 34 738 +/- 30 597 +/- 32 663 +/- 25 -6.43E-05 -0.77894 0.141671 0.399775 0.477872ALCAM activated leukocyte cell adhesion molecule 756 +/- 67 849 +/- 78 726 +/- 67 711 +/- 70 -0.048273 0.3849278 -0.877535 0.0919495 0.4747488ALDH3B1 aldehyde dehydrogenase 3 family, member B1 147 +/- 9 263 +/- 37 91 +/- 15 124 +/- 5 -0.002691 0.024391 0.084644 0.0284083 0.1508073ALG14 asparagine-linked glycosylation 14 homolog (yeast) 546 +/- 44 655 +/- 63 425 +/- 42 588 +/- 69 -0.021244 0.1887698 0.085366 0.0494473 0.0235134ALG2 asparagine-linked glycosylation 2 homolog (S. cerevisiae, alpha-1,3-mannosyltransferase 1345 +/- 98 1121 +/- 59 1178 +/- 47 1022 +/- 125 -0.046497 -0.085638 -0.293861 0.09534 0.0210985ALG5 asparagine-linked glycosylation 5 homolog (S. cerevisiae, dolichyl-phosphate beta-glucos 601 +/- 24 662 +/- 22 529 +/- 14 623 +/- 25 -0.004397 0.089144 0.015616 0.0442575 0.0523303ALG8 asparagine-linked glycosylation 8 homolog (S. cerevisiae, alpha-1,3-glucosyltransferase) 733 +/- 32 698 +/- 33 624 +/- 20 638 +/- 35 -0.010331 -0.457548 0.72987 0.5370396 0.1738882ALK anaplastic lymphoma kinase (Ki-1) 251 +/- 35 294 +/- 23 159 +/- 20 184 +/- 14 -0.001162 0.3377061 0.323848 0.2777344 0.1256262ALKBH7 alkB, alkylation repair homolog 7 (E. coli) 923 +/- 34 1035 +/- 62 775 +/- 18 786 +/- 21 -0.00099 0.1493891 0.696325 0.1490856 0.8886323ALOX5AP arachidonate 5-lipoxygenase-activating protein 396 +/- 54 473 +/- 55 281 +/- 18 331 +/- 24 -0.010084 0.3371905 0.134169 0.3069445 0.6138821ANAPC1 anaphase promoting complex subunit 1 942 +/- 48 810 +/- 32 776 +/- 30 736 +/- 25 -0.002459 -0.048252 -0.328608 0.0962622 0.410849ANAPC11 APC11 anaphase promoting complex subunit 11 homolog (yeast) 1418 +/- 65 1478 +/- 46 1036 +/- 22 1185 +/- 40 -2.42E-05 0.4651226 0.015793 0.9601436 0.2593954ANAPC4 anaphase promoting complex subunit 4 1110 +/- 148 1228 +/- 79 754 +/- 85 767 +/- 42 -0.000294 0.5018834 0.900382 0.6510049 0.7067331ANAPC5 anaphase promoting complex subunit 5 3847 +/- 68 3641 +/- 158 3390 +/- 66 3482 +/- 121 -0.033691 -0.27225 0.527117 0.6152763 0.1928984ANGEL1 angel homolog 1 (Drosophila) 990 +/- 89 1199 +/- 141 815 +/- 92 911 +/- 143 -0.010072 0.2428381 0.589213 0.5379547 0.5706761ANKIB1 ankyrin repeat and IBR domain containing 1 1928 +/- 106 2973 +/- 269 1694 +/- 82 1917 +/- 65 -0.007949 0.009743 0.063334 9E-05 0.0839082
S2-genes differentially expressed across region.xls Page 37

Symbol Description Young CA Aged CA Young DG Aged DG CA v DG CA Y v A DG Y v A CA to PMI DG to PMIANKRD12 ankyrin repeat domain 12 1799 +/- 76 1732 +/- 62 1476 +/- 41 1446 +/- 52 -2.63E-05 -0.51388 -0.66722 0.8296338 0.9189295ANKRD13 ankyrin repeat domain 13 961 +/- 84 1099 +/- 32 779 +/- 24 905 +/- 49 -0.007945 0.1730586 0.062163 0.0705879 0.524255ANKRD15 ankyrin repeat domain 15 2043 +/- 338 2719 +/- 167 1931 +/- 248 2257 +/- 101 -0.038817 0.1137291 0.265351 0.1394026 0.4901454ANKRD20Aankyrin repeat domain 20 family, member A1 143 +/- 19 247 +/- 40 57 +/- 20 106 +/- 21 -0.004106 0.0508737 0.130608 0.0214372 0.1929429ANKRD25 ankyrin repeat domain 25 477 +/- 50 637 +/- 71 372 +/- 41 460 +/- 26 -0.013238 0.1001724 0.106964 0.0382709 0.1581043ANKRD28 ankyrin repeat domain 28 3418 +/- 127 3600 +/- 239 3181 +/- 93 3270 +/- 110 -0.049427 0.5230741 0.55216 0.2240239 0.5540591ANKRD38 ankyrin repeat domain 38 211 +/- 21 250 +/- 30 170 +/- 17 182 +/- 22 -0.007404 0.3189819 0.677062 0.4691072 0.7174673ANKRD46 ankyrin repeat domain 46 4646 +/- 144 4415 +/- 178 4103 +/- 199 4477 +/- 128 -0.031772 -0.336974 0.151229 0.095881 0.5963632ANKRD50 ankyrin repeat domain 50 329 +/- 30 259 +/- 18 225 +/- 20 193 +/- 21 -0.001732 -0.083156 -0.294519 0.0364904 0.8501523ANKS1A ankyrin repeat and sterile alpha motif domain containing 1A 908 +/- 65 891 +/- 68 654 +/- 52 594 +/- 13 -0.0003 -0.863369 -0.310129 0.9891414 0.4643054ANLN anillin, actin binding protein (scraps homolog, Drosophila) 2264 +/- 473 3340 +/- 683 1196 +/- 209 1603 +/- 198 -0.011277 0.2279467 0.190942 0.0433415 0.1516347ANP32B acidic (leucine-rich) nuclear phosphoprotein 32 family, member B 5261 +/- 630 6605 +/- 629 4342 +/- 135 4863 +/- 137 -0.020829 0.1620245 0.024182 0.065918 0.0327325ANTXR1 anthrax toxin receptor 1 2619 +/- 129 2393 +/- 92 2291 +/- 97 2213 +/- 85 -0.01722 -0.189885 -0.560737 0.3574363 0.5253278AP1S1 adaptor-related protein complex 1, sigma 1 subunit 4669 +/- 306 3964 +/- 224 3161 +/- 69 3298 +/- 116 -0.001375 -0.095771 0.347447 0.0284608 0.9469582AP2B1 adaptor-related protein complex 2, beta 1 subunit 7691 +/- 354 5572 +/- 446 5527 +/- 121 4060 +/- 189 -0.000127 -0.004297 -0.000323 0.0287975 0.0273872AP3M1 adaptor-related protein complex 3, mu 1 subunit 345 +/- 25 382 +/- 27 290 +/- 26 296 +/- 12 -0.014847 0.3293828 0.864174 0.0762015 0.8386735AP3S1 adaptor-related protein complex 3, sigma 1 subunit 4609 +/- 211 3959 +/- 235 3561 +/- 127 3309 +/- 187 -0.000858 -0.067063 -0.299324 0.1956016 0.916877APEH N-acylaminoacyl-peptide hydrolase 560 +/- 15 620 +/- 32 491 +/- 29 540 +/- 23 -0.009036 0.1320897 0.211972 0.7321269 0.5195361APH1B anterior pharynx defective 1 homolog B (C. elegans) 308 +/- 18 294 +/- 22 231 +/- 11 272 +/- 18 -0.013807 -0.63656 0.089354 0.5775505 0.217942APOA1BP apolipoprotein A-I binding protein 3444 +/- 146 3736 +/- 191 2627 +/- 74 3301 +/- 117 -0.000886 0.2539505 0.001861 0.2150369 0.0332909APOD apolipoprotein D 1694 +/- 156 2698 +/- 413 1143 +/- 60 1879 +/- 176 -0.002071 0.0605189 0.011046 0.0199683 0.0099519APOLD1 apolipoprotein L domain containing 1 405 +/- 51 331 +/- 34 309 +/- 40 287 +/- 19 -0.016736 -0.252973 -0.645961 0.6881354 0.6652725APPBP2 amyloid beta precursor protein (cytoplasmic tail) binding protein 2 427 +/- 29 490 +/- 39 329 +/- 19 367 +/- 33 -0.003508 0.2249044 0.368394 0.114124 0.2279848AQP11 aquaporin 11 454 +/- 20 431 +/- 34 389 +/- 9 423 +/- 26 -0.039894 -0.581801 0.275537 0.3538998 0.5710959ARCN1 archain 1 3733 +/- 117 3567 +/- 79 3444 +/- 82 3322 +/- 114 -0.003342 -0.273316 -0.409748 0.6610527 0.9570511ARG2 arginase, type II 521 +/- 31 499 +/- 51 443 +/- 30 455 +/- 21 -0.035714 -0.725526 0.752874 0.2416734 0.6399468ARHGAP23Rho GTPase activating protein 23 2054 +/- 218 2294 +/- 232 1799 +/- 51 1763 +/- 76 -0.043482 0.468632 -0.704243 0.2860338 0.5431348ARHGAP24Rho GTPase activating protein 24 136 +/- 12 186 +/- 20 108 +/- 10 127 +/- 11 -0.005389 0.0660111 0.233288 0.0346964 0.6347949ARHGDIB Rho GDP dissociation inhibitor (GDI) beta 407 +/- 55 462 +/- 38 316 +/- 20 364 +/- 32 -0.030199 0.4306757 0.246602 0.4508659 0.3548889ARHGEF7 Rho guanine nucleotide exchange factor (GEF) 7 3467 +/- 223 2866 +/- 102 2911 +/- 102 2790 +/- 61 -0.02838 -0.043674 -0.336368 0.0223283 0.410873ARIH2 ariadne homolog 2 (Drosophila) 1295 +/- 30 1073 +/- 49 1029 +/- 41 1044 +/- 54 -0.015864 -0.004513 0.829441 0.1147651 0.7756638ARL2 ADP-ribosylation factor-like 2 3128 +/- 228 3731 +/- 217 2370 +/- 109 2961 +/- 240 -0.000183 0.0849026 0.068544 0.0152728 0.0087737ARL6IP4 ADP-ribosylation-like factor 6 interacting protein 4 4648 +/- 382 4150 +/- 266 3223 +/- 149 3173 +/- 184 -0.000148 -0.312604 -0.838356 0.4210307 0.576805ARL9 ADP-ribosylation factor-like 9 194 +/- 38 201 +/- 22 130 +/- 19 133 +/- 11 -0.000764 0.8672757 0.882188 0.8031975 0.8307795ARMCX3 armadillo repeat containing, X-linked 3 6123 +/- 136 5991 +/- 95 5672 +/- 212 5450 +/- 148 -0.017872 -0.446391 -0.41396 0.2480136 0.7252492ARMET arginine-rich, mutated in early stage tumors 2227 +/- 120 1976 +/- 100 1929 +/- 85 1785 +/- 58 -0.037439 -0.141053 -0.195524 0.2220125 0.5383648ARPC1A actin related protein 2/3 complex, subunit 1A, 41kDa 4084 +/- 587 3175 +/- 168 2942 +/- 129 2844 +/- 144 -0.047181 -0.188913 -0.625167 0.1674972 0.7157558ARPC1B actin related protein 2/3 complex, subunit 1B, 41kDa 265 +/- 16 338 +/- 19 206 +/- 20 235 +/- 20 -0.001183 0.0141484 0.321994 0.0021732 0.7072972ARPP-19 cyclic AMP phosphoprotein, 19 kD 4176 +/- 221 3910 +/- 221 3613 +/- 90 3636 +/- 130 -0.032804 -0.414751 0.890752 0.4210115 0.8026563ARRDC2 arrestin domain containing 2 560 +/- 89 753 +/- 112 291 +/- 23 365 +/- 29 -0.000987 0.2086178 0.077614 0.0897362 0.0283749ARSA arylsulfatase A 195 +/- 14 195 +/- 15 130 +/- 5 163 +/- 23 -0.001969 -0.998645 0.237997 0.6336815 0.2168226ARVCF armadillo repeat gene deletes in velocardiofacial syndrome 824 +/- 112 914 +/- 35 724 +/- 56 724 +/- 24 -0.029073 0.4775261 -0.991083 0.4394348 0.5878608ASAH1 N-acylsphingosine amidohydrolase (acid ceramidase) 1 8879 +/- 1417 7399 +/- 331 5610 +/- 412 6304 +/- 502 -0.03534 -0.351536 0.315616 0.3754098 0.3166588ASL argininosuccinate lyase 747 +/- 41 753 +/- 44 589 +/- 18 598 +/- 23 -0.000201 0.9296472 0.759648 0.5641495 0.7326546ASPA aspartoacylase (Canavan disease) 1618 +/- 355 1441 +/- 348 645 +/- 98 601 +/- 82 -0.004613 -0.729741 -0.743485 0.7211329 0.8423832
S2-genes differentially expressed across region.xls Page 38

Symbol Description Young CA Aged CA Young DG Aged DG CA v DG CA Y v A DG Y v A CA to PMI DG to PMIATG16L2 ATG16 autophagy related 16-like 2 (S. cerevisiae) 298 +/- 56 283 +/- 28 167 +/- 12 132 +/- 11 -0.001216 -0.818568 -0.067976 0.6174556 0.2098369ATIC 5-aminoimidazole-4-carboxamide ribonucleotide formyltransferase/IMP cyclohydrolase 1046 +/- 49 1113 +/- 28 796 +/- 52 837 +/- 52 -3.01E-05 0.2687251 0.581846 0.3786463 0.748156ATP13A1 ATPase type 13A1 883 +/- 41 842 +/- 30 811 +/- 30 756 +/- 20 -0.016005 -0.43696 -0.167854 0.1642851 0.3632495ATP2C1 ATPase, Ca++ transporting, type 2C, member 1 2029 +/- 118 1514 +/- 111 1497 +/- 112 1332 +/- 42 -0.003401 -0.009807 -0.213381 0.0042259 0.2469229ATP5G1 ATP synthase, H+ transporting, mitochondrial F0 complex, subunit C1 (subunit 9) 4666 +/- 306 4340 +/- 232 3791 +/- 109 4046 +/- 110 -0.01373 -0.417367 0.132922 0.1087628 0.4153918ATP6V0D1ATPase, H+ transporting, lysosomal 38kDa, V0 subunit d1 4894 +/- 273 4556 +/- 302 3696 +/- 199 4137 +/- 252 -0.005661 -0.424763 0.206387 0.1078222 0.4488251ATXN7L3 ataxin 7-like 3 4182 +/- 141 3742 +/- 124 3753 +/- 122 3589 +/- 83 -0.010413 -0.041159 -0.297757 0.0055341 0.7757953AURKA aurora kinase A 143 +/- 8 167 +/- 14 108 +/- 7 135 +/- 5 -0.003063 0.1749027 0.017575 0.0328976 0.0511261AVPI1 arginine vasopressin-induced 1 540 +/- 39 555 +/- 37 400 +/- 23 385 +/- 13 -4.8E-05 0.7886688 -0.567339 0.7794425 0.5393363AXL AXL receptor tyrosine kinase 951 +/- 51 1108 +/- 50 906 +/- 51 754 +/- 67 -0.01455 0.054106 -0.110761 0.2028006 0.0169621AZIN1 antizyme inhibitor 1 4030 +/- 142 3939 +/- 206 3743 +/- 98 3601 +/- 141 -0.013634 -0.725887 -0.431721 0.2744238 0.1158331B2M beta-2-microglobulin 7946 +/- 519 10622 +/- 678 6616 +/- 572 9837 +/- 646 -0.020796 0.0114966 0.005147 0.0423626 0.1051803B3GAT1 beta-1,3-glucuronyltransferase 1 (glucuronosyltransferase P) 11398 +/- 1244 9768 +/- 502 8896 +/- 432 8482 +/- 230 -0.02284 -0.266114 -0.423017 0.2414764 0.5132703B4GALT3 UDP-Gal:betaGlcNAc beta 1,4- galactosyltransferase, polypeptide 3 1509 +/- 46 1313 +/- 50 1304 +/- 35 1196 +/- 29 -0.000177 -0.016366 -0.043079 0.0059715 0.0109205B4GALT5 UDP-Gal:betaGlcNAc beta 1,4- galactosyltransferase, polypeptide 5 2214 +/- 209 1568 +/- 99 1896 +/- 165 1568 +/- 81 -0.03683 -0.026376 -0.117469 0.0216119 0.1666359BACE1 beta-site APP-cleaving enzyme 1 1499 +/- 72 1712 +/- 169 1121 +/- 69 1178 +/- 52 -0.001965 0.2870571 0.527948 0.0910948 0.5494259BACE2 beta-site APP-cleaving enzyme 2 198 +/- 25 171 +/- 23 102 +/- 20 105 +/- 33 -0.000431 -0.452204 0.934003 0.9347589 0.4622899BACH1 BTB and CNC homology 1, basic leucine zipper transcription factor 1 336 +/- 28 426 +/- 45 246 +/- 26 251 +/- 6 -0.001069 0.1255322 0.865043 0.1031752 0.9669212BAD BCL2-antagonist of cell death 209 +/- 15 173 +/- 10 175 +/- 14 142 +/- 18 -0.047761 -0.079261 -0.191143 0.0926671 0.276239BANF1 barrier to autointegration factor 1 5619 +/- 213 5422 +/- 81 4635 +/- 123 4511 +/- 76 -5.86E-06 -0.420581 -0.413525 0.5468054 0.5294386BANP BTG3 associated nuclear protein 1318 +/- 96 1164 +/- 71 966 +/- 97 745 +/- 38 -0.00035 -0.226622 -0.074958 0.354293 0.3534149BAT4 HLA-B associated transcript 4 923 +/- 45 833 +/- 59 747 +/- 20 734 +/- 39 -0.000314 -0.25476 -0.775151 0.2757341 0.9190475BAX BCL2-associated X protein 831 +/- 23 877 +/- 24 728 +/- 13 807 +/- 21 -0.000268 0.188443 0.01614 0.3452937 0.1605293BAZ1A bromodomain adjacent to zinc finger domain, 1A 183 +/- 22 197 +/- 23 162 +/- 16 140 +/- 6 -0.025496 0.6640051 -0.252279 0.232456 0.4963289BAZ2B bromodomain adjacent to zinc finger domain, 2B 1194 +/- 122 1319 +/- 64 1005 +/- 31 954 +/- 29 -0.006499 0.3904675 -0.267764 0.2309764 0.1062429BBX bobby sox homolog (Drosophila) 1408 +/- 90 1558 +/- 89 1131 +/- 18 1251 +/- 43 -0.00139 0.2635379 0.045523 0.1257724 0.0998663BCAP31 B-cell receptor-associated protein 31 1029 +/- 88 1543 +/- 54 860 +/- 54 1436 +/- 92 -0.001081 0.0009896 0.001211 0.004477 0.0133562BCAS3 breast carcinoma amplified sequence 3 899 +/- 50 839 +/- 42 779 +/- 9 787 +/- 23 -0.02314 -0.381883 0.776341 0.1978594 0.3531261BCL11A B-cell CLL/lymphoma 11A (zinc finger protein) 2186 +/- 49 1964 +/- 100 1929 +/- 97 1818 +/- 115 -0.042392 -0.084824 -0.480451 0.0366434 0.8290018BCOR BCL6 co-repressor 280 +/- 31 258 +/- 25 197 +/- 8 205 +/- 19 -0.005537 -0.595716 0.71134 0.8097029 0.3866545BCS1L BCS1-like (yeast) 1146 +/- 51 1199 +/- 38 1019 +/- 31 1085 +/- 57 -0.018167 0.4268623 0.350435 0.8144832 0.5808784BEAN brain expressed, associated with Nedd4 306 +/- 16 345 +/- 12 264 +/- 11 295 +/- 13 -0.009825 0.0835698 0.109426 0.0355509 0.3352152BHLHB2 basic helix-loop-helix domain containing, class B, 2 2284 +/- 239 2096 +/- 126 1184 +/- 103 1186 +/- 80 -1.48E-05 -0.50647 0.986727 0.3977209 0.9228881BLCAP bladder cancer associated protein 6297 +/- 214 5807 +/- 369 5335 +/- 115 5220 +/- 151 -0.008169 -0.284221 -0.562069 0.1410327 0.2993708BLM Bloom syndrome 527 +/- 29 536 +/- 16 468 +/- 19 432 +/- 17 -0.000325 0.790032 -0.184989 0.4078555 0.5534124BLNK B-cell linker 342 +/- 38 401 +/- 43 216 +/- 10 229 +/- 18 -0.001881 0.3333053 0.546194 0.0542291 0.7412732BLVRA biliverdin reductase A 536 +/- 46 610 +/- 47 458 +/- 22 468 +/- 22 -0.008009 0.286536 0.760519 0.3998478 0.6820022BLVRB biliverdin reductase B (flavin reductase (NADPH)) 746 +/- 102 869 +/- 57 633 +/- 61 674 +/- 9 -0.007411 0.3219592 0.541909 0.1971174 0.4492661BM88 BM88 antigen 2949 +/- 174 2888 +/- 181 2570 +/- 119 2243 +/- 114 -0.009952 -0.812992 -0.079298 0.7135657 0.2239279BMP6 bone morphogenetic protein 6 200 +/- 47 173 +/- 21 143 +/- 25 157 +/- 13 -0.045627 -0.614211 0.63084 0.2322577 0.7160686BMPR2 bone morphogenetic protein receptor, type II (serine/threonine kinase) 2903 +/- 165 2526 +/- 226 2520 +/- 106 2489 +/- 125 -0.002045 -0.209677 -0.85298 0.0531943 0.3307733BNC2 Basonuclin 2 207 +/- 14 162 +/- 19 153 +/- 22 111 +/- 28 -0.001657 -0.086503 -0.274122 0.1780284 0.393502BNIP3L BCL2/adenovirus E1B 19kDa interacting protein 3-like 6405 +/- 246 5854 +/- 216 5448 +/- 168 5621 +/- 257 -0.007864 -0.123451 0.590037 0.0800667 0.9906479BOK BCL2-related ovarian killer 1816 +/- 298 2272 +/- 392 1063 +/- 118 1258 +/- 73 -0.00669 0.3784022 0.19611 0.1724041 0.1438707BOLA2 bolA-like 2 (E. coli) 1548 +/- 67 1349 +/- 88 1261 +/- 65 1171 +/- 33 -0.000927 -0.103608 -0.255983 0.2832108 0.3709337
S2-genes differentially expressed across region.xls Page 39

Symbol Description Young CA Aged CA Young DG Aged DG CA v DG CA Y v A DG Y v A CA to PMI DG to PMIBRAP BRCA1 associated protein 215 +/- 22 232 +/- 30 202 +/- 14 227 +/- 18 -0.049544 0.6733937 0.304641 0.9341578 0.6183887BRCC2 BRCC2 260 +/- 26 370 +/- 35 220 +/- 11 242 +/- 10 -0.012762 0.0323446 0.172532 0.0087585 0.3163604BRMS1 breast cancer metastasis suppressor 1 627 +/- 26 624 +/- 17 522 +/- 14 538 +/- 60 -0.00909 -0.909345 0.811949 0.935505 0.2866148BST2 bone marrow stromal cell antigen 2 1075 +/- 131 1405 +/- 112 750 +/- 66 988 +/- 93 -0.000978 0.0849869 0.072007 0.1305267 0.2453014BTAF1 BTAF1 RNA polymerase II, B-TFIID transcription factor-associated, 170kDa (Mot1 homolo 1066 +/- 31 1095 +/- 61 962 +/- 29 964 +/- 54 -0.001328 0.6917603 0.970487 0.194634 0.4782109BTBD1 BTB (POZ) domain containing 1 3234 +/- 190 2975 +/- 162 2851 +/- 56 2663 +/- 63 -0.039695 -0.323669 -0.055108 0.4454523 0.2622056BTD biotinidase 593 +/- 44 613 +/- 50 409 +/- 25 423 +/- 15 -5.51E-05 0.7736425 0.65985 0.3200071 0.6100478BUB3 BUB3 budding uninhibited by benzimidazoles 3 homolog (yeast) 4140 +/- 127 3656 +/- 142 3469 +/- 169 3052 +/- 117 -0.000718 -0.02942 -0.074618 0.2495534 0.1460212BVES blood vessel epicardial substance 293 +/- 14 378 +/- 50 191 +/- 15 204 +/- 17 -0.001771 0.1550702 0.562175 0.0738602 0.6090485BZRP benzodiazapine receptor (peripheral) 565 +/- 74 798 +/- 62 374 +/- 21 504 +/- 36 -0.003355 0.0377401 0.018487 0.0214934 0.1014083BZW1 basic leucine zipper and W2 domains 1 5216 +/- 116 4624 +/- 192 4100 +/- 120 3941 +/- 258 -0.000248 -0.028896 -0.596853 0.0047402 0.2150581BZW2 basic leucine zipper and W2 domains 2 1355 +/- 81 1222 +/- 78 1031 +/- 49 1064 +/- 33 -0.000724 -0.26247 0.592032 0.7478192 0.2736955C1QC complement component 1, q subcomponent, C chain 541 +/- 44 951 +/- 109 482 +/- 52 755 +/- 55 -0.028928 0.0110178 0.006202 0.0003612 0.0024066C1QDC1 C1q domain containing 1 3407 +/- 154 3237 +/- 192 2541 +/- 134 2572 +/- 35 -0.000177 -0.506771 0.827597 0.5153574 0.7032083C1QL1 complement component 1, q subcomponent-like 1 982 +/- 98 1014 +/- 72 913 +/- 62 825 +/- 30 -0.019822 0.8037602 -0.237101 0.7257115 0.4072478C3 complement component 3 2677 +/- 238 3668 +/- 587 1655 +/- 154 2039 +/- 196 -0.003793 0.1642487 0.161879 0.0141031 0.1501054C5AR1 complement component 5a receptor 1 398 +/- 25 396 +/- 23 297 +/- 14 281 +/- 16 -0.000586 -0.959126 -0.477977 0.3903895 0.4704312CA2 carbonic anhydrase II 2992 +/- 303 2711 +/- 398 1124 +/- 92 1449 +/- 133 -0.000157 -0.586672 0.081113 0.6653623 0.0914077CAB39 calcium binding protein 39 3226 +/- 177 2875 +/- 16 2822 +/- 86 2809 +/- 43 -0.008929 -0.104914 -0.89456 0.2203009 0.9880869CACNA1F calcium channel, voltage-dependent, alpha 1F subunit 242 +/- 23 237 +/- 21 158 +/- 10 154 +/- 14 -0.00017 -0.862851 -0.817354 0.6575548 0.2681175CACNA1G calcium channel, voltage-dependent, alpha 1G subunit 204 +/- 42 154 +/- 12 115 +/- 22 79 +/- 20 -0.006792 -0.294413 -0.249143 0.3128674 0.3876326CACYBP calcyclin binding protein 6654 +/- 415 5565 +/- 323 5426 +/- 190 5114 +/- 281 -0.026934 -0.06666 -0.387609 0.1515321 0.8317044CAMK1G calcium/calmodulin-dependent protein kinase IG 454 +/- 102 321 +/- 31 169 +/- 32 170 +/- 33 -0.008988 -0.259042 0.979103 0.1581339 0.905078CAMK2D calcium/calmodulin-dependent protein kinase (CaM kinase) II delta 7913 +/- 785 7412 +/- 778 3163 +/- 483 2842 +/- 481 -2.02E-06 -0.659473 -0.649178 0.5348365 0.8320903CAMKK2 calcium/calmodulin-dependent protein kinase kinase 2, beta 2835 +/- 306 2109 +/- 116 2217 +/- 96 1716 +/- 125 -0.024082 -0.065712 -0.012947 0.0168465 0.0277705CAMSAP1 calmodulin regulated spectrin-associated protein 1 1864 +/- 55 1556 +/- 68 1653 +/- 70 1442 +/- 53 -0.000838 -0.005929 -0.039507 0.036372 0.1589263CAP1 CAP, adenylate cyclase-associated protein 1 (yeast) 437 +/- 32 364 +/- 31 413 +/- 25 321 +/- 36 -0.018914 -0.131829 -0.069778 0.0678381 0.0342027CAPN2 calpain 2, (m/II) large subunit 2440 +/- 204 3016 +/- 132 1931 +/- 137 2492 +/- 70 -0.000223 0.0430506 0.00757 0.0562623 0.0767471CAPN3 calpain 3, (p94) 177 +/- 35 220 +/- 35 119 +/- 12 147 +/- 20 -0.014529 0.3989082 0.26792 0.1054587 0.0254313CAPZB capping protein (actin filament) muscle Z-line, beta 8247 +/- 582 6857 +/- 252 6783 +/- 248 5959 +/- 245 -0.006127 -0.065542 -0.0425 0.1260651 0.0938284CARS cysteinyl-tRNA synthetase 3163 +/- 246 2735 +/- 215 2432 +/- 118 2385 +/- 187 -0.001372 -0.220874 -0.836701 0.1018267 0.3585534CASC3 cancer susceptibility candidate 3 2989 +/- 158 3141 +/- 57 2732 +/- 87 2752 +/- 48 -0.015715 0.3985361 0.847341 0.3257599 0.6690413CASK calcium/calmodulin-dependent serine protein kinase (MAGUK family) 3089 +/- 307 2784 +/- 194 2506 +/- 182 2384 +/- 113 -0.004652 -0.424256 -0.583175 0.1497415 0.2021971CAST calpastatin 990 +/- 127 1424 +/- 112 822 +/- 41 1048 +/- 19 -0.011634 0.0287645 0.00158 0.0161794 0.0076301CAT catalase 380 +/- 36 472 +/- 86 228 +/- 22 286 +/- 38 -0.011889 0.3587229 0.226379 0.1374508 0.9282353CBARA1 calcium binding atopy-related autoantigen 1 1698 +/- 52 1549 +/- 37 1445 +/- 72 1507 +/- 58 -0.017109 -0.04407 0.517737 0.1406721 0.701145CBLN4 cerebellin 4 precursor 948 +/- 233 1015 +/- 167 575 +/- 35 436 +/- 67 -0.009931 0.8185865 -0.113187 0.826758 0.2379308CCDC107 coiled-coil domain containing 107 1204 +/- 147 1523 +/- 190 1038 +/- 49 1091 +/- 74 -0.035455 0.2155086 0.56166 0.3113471 0.9487094CCDC109Bcoiled-coil domain containing 109B 702 +/- 55 757 +/- 79 580 +/- 14 634 +/- 21 -0.016021 0.5775461 0.068799 0.2820263 0.1115963CCDC12 coiled-coil domain containing 12 919 +/- 95 799 +/- 33 800 +/- 58 743 +/- 42 -0.035269 -0.275869 -0.455314 0.0976448 0.3226566CCDC23 coiled-coil domain containing 23 911 +/- 80 793 +/- 55 707 +/- 57 776 +/- 17 -0.033896 -0.25815 0.291538 0.3115724 0.4504873CCDC24 coiled-coil domain containing 24 288 +/- 17 305 +/- 25 196 +/- 18 201 +/- 21 -3.26E-05 0.5859979 0.858713 0.168644 0.3917022CCDC4 coiled-coil domain containing 4 385 +/- 33 305 +/- 35 274 +/- 28 271 +/- 9 -0.04259 -0.121359 -0.919138 0.0865921 0.8461716CCDC44 coiled-coil domain containing 44 792 +/- 36 669 +/- 27 578 +/- 22 598 +/- 31 -0.00364 -0.021618 0.607391 0.0106531 0.7380396CCDC45 coiled-coil domain containing 45 450 +/- 18 407 +/- 16 364 +/- 15 322 +/- 20 -3.42E-06 -0.100746 -0.13213 0.20171 0.0710755
S2-genes differentially expressed across region.xls Page 40

Symbol Description Young CA Aged CA Young DG Aged DG CA v DG CA Y v A DG Y v A CA to PMI DG to PMICCDC50 coiled-coil domain containing 50 1250 +/- 119 1491 +/- 184 898 +/- 27 932 +/- 26 -0.001154 0.3021422 0.391477 0.1723793 0.3883138CCDC72 coiled-coil domain containing 72 4579 +/- 407 4039 +/- 229 3214 +/- 212 2593 +/- 139 -0.000493 -0.281026 -0.038621 0.5045182 0.0746598CCDC77 coiled-coil domain containing 77 406 +/- 21 425 +/- 41 352 +/- 10 375 +/- 51 -0.001461 0.6976125 0.677344 0.7048333 0.5447284CCDC84 coiled-coil domain containing 84 574 +/- 64 492 +/- 41 476 +/- 29 359 +/- 41 -0.004905 -0.311384 -0.049202 0.5339314 0.2964875CCDC98 coiled-coil domain containing 98 121 +/- 10 163 +/- 15 95 +/- 14 126 +/- 13 -0.036337 0.0442752 0.141438 0.0179696 0.319486CCDC99 Coiled-coil domain containing 99 843 +/- 108 1220 +/- 192 518 +/- 27 688 +/- 24 -0.003641 0.1255292 0.001168 0.0422772 0.0247073CCM2 cerebral cavernous malformation 2 1736 +/- 55 1623 +/- 72 1383 +/- 47 1386 +/- 25 -0.00015 -0.239711 0.952121 0.0843132 0.7609951CCNA1 cyclin A1 165 +/- 10 276 +/- 37 154 +/- 14 177 +/- 31 -0.03939 0.0301126 0.505994 0.0100349 0.5542809CCNDBP1 cyclin D-type binding-protein 1 1466 +/- 70 1579 +/- 106 1288 +/- 57 1562 +/- 89 -0.009416 0.3968733 0.035355 0.750233 0.1385804CCR1 chemokine (C-C motif) receptor 1 508 +/- 66 686 +/- 92 422 +/- 42 439 +/- 49 -0.011561 0.1485346 0.79297 0.0482147 0.6272116CCT3 chaperonin containing TCP1, subunit 3 (gamma) 2068 +/- 138 2872 +/- 102 1999 +/- 97 2727 +/- 72 -0.051148 0.0010854 0.000218 0.0758965 0.0618846CCT4 chaperonin containing TCP1, subunit 4 (delta) 7126 +/- 125 6542 +/- 349 6285 +/- 206 6033 +/- 201 -0.003184 -0.164119 -0.403413 0.0336816 0.1625099CD1D CD1d molecule 135 +/- 21 161 +/- 8 104 +/- 12 124 +/- 12 -0.01181 0.2834532 0.248772 0.1866177 0.3856134CD200 CD200 molecule 10117 +/- 348 9051 +/- 463 8280 +/- 173 8089 +/- 224 -0.000309 -0.097653 -0.518914 0.0088964 0.0639654CD2BP2 CD2 (cytoplasmic tail) binding protein 2 434 +/- 27 533 +/- 24 382 +/- 9 508 +/- 28 -0.052734 0.0224622 0.007719 0.1918141 0.0223613CD320 CD320 molecule 549 +/- 24 584 +/- 28 467 +/- 29 468 +/- 31 -0.003082 0.3709861 0.970382 0.3795205 0.5724715CD37 CD37 molecule 340 +/- 29 391 +/- 47 266 +/- 7 287 +/- 28 -0.016525 0.3776994 0.484042 0.0576715 0.7448742CD48 CD48 molecule 394 +/- 43 577 +/- 75 274 +/- 24 387 +/- 42 -0.003904 0.0660649 0.055195 0.0056324 0.040375CD52 CD52 molecule 303 +/- 58 621 +/- 52 251 +/- 51 388 +/- 37 -0.01515 0.0023325 0.057454 0.0100072 0.2205889CD55 CD55 molecule, decay accelerating factor for complement (Cromer blood group) 367 +/- 42 394 +/- 80 265 +/- 26 278 +/- 29 -0.047118 0.7764513 0.750849 0.2936239 0.627126CD58 CD58 molecule 179 +/- 17 277 +/- 45 140 +/- 9 195 +/- 13 -0.021073 0.0842023 0.010655 0.0174593 0.0055731CD63 CD63 molecule 3961 +/- 565 4903 +/- 297 3173 +/- 139 3664 +/- 165 -0.011074 0.1803626 0.050996 0.198092 0.4036024CD74 CD74 molecule, major histocompatibility complex, class II invariant chain 1810 +/- 283 3714 +/- 547 1215 +/- 171 2317 +/- 340 -0.016033 0.016153 0.027629 0.0079133 0.1049361CD83 CD83 molecule 590 +/- 71 654 +/- 44 464 +/- 30 474 +/- 42 -0.007547 0.4713149 0.855211 0.3224844 0.5411394CD86 CD86 molecule 127 +/- 14 208 +/- 39 86 +/- 6 132 +/- 24 -0.011942 0.0945678 0.123421 0.0061986 0.1125134CD93 CD93 molecule 186 +/- 7 162 +/- 12 144 +/- 15 142 +/- 6 -0.001551 -0.123185 -0.920462 0.041405 0.7045664CDC14B CDC14 cell division cycle 14 homolog B (S. cerevisiae) 236 +/- 22 203 +/- 22 176 +/- 21 160 +/- 15 -0.000214 -0.304794 -0.544328 0.4365035 0.6022839CDC16 CDC16 cell division cycle 16 homolog (S. cerevisiae) 1071 +/- 33 1180 +/- 23 991 +/- 39 1063 +/- 17 -8.94E-05 0.0248663 0.13443 0.1310045 0.324503CDC20 CDC20 cell division cycle 20 homolog (S. cerevisiae) 139 +/- 14 153 +/- 23 66 +/- 17 82 +/- 6 -0.00066 0.6150645 0.398175 0.287569 0.4926364CDC25A cell division cycle 25A 235 +/- 35 330 +/- 18 224 +/- 25 264 +/- 25 -0.041807 0.0419309 0.285905 0.2069823 0.6622406CDC26 cell division cycle 26 1490 +/- 41 1571 +/- 73 1266 +/- 44 1267 +/- 31 -0.000221 0.360711 0.978095 0.0845525 0.9835508CDC42EP2CDC42 effector protein (Rho GTPase binding) 2 110 +/- 12 153 +/- 20 83 +/- 10 110 +/- 10 -0.033348 0.0956561 0.086805 0.0222289 0.0497078CDC91L1 CDC91 cell division cycle 91-like 1 (S. cerevisiae) 598 +/- 28 647 +/- 38 522 +/- 14 512 +/- 19 -0.00171 0.3203868 -0.682265 0.0518592 0.8244477CDCA7L cell division cycle associated 7-like 440 +/- 76 615 +/- 92 252 +/- 19 331 +/- 31 -0.001117 0.1753182 0.065602 0.0350888 0.0044514CDH4 cadherin 4, type 1, R-cadherin (retinal) 468 +/- 43 438 +/- 52 352 +/- 33 387 +/- 31 -0.045426 -0.666822 0.445024 0.7600655 0.2423994CDH5 cadherin 5, type 2, VE-cadherin (vascular epithelium) 209 +/- 8 206 +/- 15 146 +/- 9 153 +/- 21 -0.000349 -0.887945 0.768577 0.628134 0.4073582CDK4 cyclin-dependent kinase 4 845 +/- 25 921 +/- 62 765 +/- 26 811 +/- 30 -0.022109 0.2970694 0.275314 0.0747921 0.3169219CDK5R2 cyclin-dependent kinase 5, regulatory subunit 2 (p39) 6071 +/- 411 5283 +/- 483 4217 +/- 165 4091 +/- 295 -0.004431 -0.24351 -0.721818 0.1226054 0.8391592CDKN1B cyclin-dependent kinase inhibitor 1B (p27, Kip1) 1769 +/- 133 2136 +/- 160 1637 +/- 58 1549 +/- 26 -0.017152 0.1083299 -0.20917 0.0565452 0.1360662CDKN1C Cyclin-dependent kinase inhibitor 1C (p57, Kip2) 1939 +/- 365 2891 +/- 608 950 +/- 126 1077 +/- 10 -0.004385 0.215247 0.360802 0.1337689 0.3626213CDKN3 cyclin-dependent kinase inhibitor 3 (CDK2-associated dual specificity phosphatase) 120 +/- 8 133 +/- 6 95 +/- 3 93 +/- 5 -0.000273 0.2385591 -0.763096 0.6773918 0.8901373CDS1 CDP-diacylglycerol synthase (phosphatidate cytidylyltransferase) 1 2137 +/- 201 1588 +/- 146 1255 +/- 83 1183 +/- 110 -0.001244 -0.054361 -0.618529 0.0098995 0.1633426CDYL chromodomain protein, Y-like 526 +/- 22 496 +/- 36 434 +/- 27 374 +/- 26 -0.000757 -0.499769 -0.147671 0.8702822 0.327993CEBPG CCAAT/enhancer binding protein (C/EBP), gamma 1085 +/- 18 1141 +/- 43 915 +/- 21 949 +/- 30 -7.44E-08 0.267795 0.380616 0.3376512 0.4576828CEP110 centrosomal protein 110kDa 305 +/- 21 344 +/- 33 256 +/- 16 276 +/- 17 -0.018392 0.3395418 0.424021 0.2373612 0.5721337
S2-genes differentially expressed across region.xls Page 41

Symbol Description Young CA Aged CA Young DG Aged DG CA v DG CA Y v A DG Y v A CA to PMI DG to PMICFC1 cripto, FRL-1, cryptic family 1 204 +/- 53 194 +/- 25 132 +/- 21 136 +/- 19 -0.029513 -0.871633 0.88259 0.8342035 0.9226345CFD complement factor D (adipsin) 636 +/- 37 806 +/- 68 459 +/- 49 496 +/- 23 -0.001454 0.0607964 0.513996 0.0158211 0.7474582CGI-38 brain specific protein 1185 +/- 160 1693 +/- 328 699 +/- 44 901 +/- 69 -0.01281 0.2043037 0.04339 0.1728503 0.1358712CGNL1 cingulin-like 1 570 +/- 49 495 +/- 29 369 +/- 22 353 +/- 15 -1.12E-05 -0.227407 -0.552722 0.2423364 0.498816CHCHD1 coiled-coil-helix-coiled-coil-helix domain containing 1 1511 +/- 99 1473 +/- 61 1365 +/- 29 1298 +/- 41 -0.011043 -0.753117 -0.222667 0.3291322 0.1596994CHCHD4 coiled-coil-helix-coiled-coil-helix domain containing 4 566 +/- 39 497 +/- 32 476 +/- 27 398 +/- 11 -9.49E-05 -0.201579 -0.032704 0.2495831 0.0645877CHFR checkpoint with forkhead and ring finger domains 1732 +/- 127 1777 +/- 97 1255 +/- 74 1243 +/- 79 -0.000117 0.7849809 -0.915752 0.646859 0.8979464ChGn Chondroitin beta1,4 N-acetylgalactosaminyltransferase 117 +/- 12 160 +/- 11 80 +/- 9 120 +/- 16 -0.010554 0.0304215 0.074225 0.0509525 0.0348366CHKB choline kinase beta 1172 +/- 97 1316 +/- 106 1019 +/- 71 1088 +/- 72 -0.022472 0.3394214 0.513408 0.768875 0.7856563CHL1 cell adhesion molecule with homology to L1CAM (close homolog of L1) 5666 +/- 319 6673 +/- 332 5043 +/- 360 5085 +/- 214 -0.004389 0.0537679 0.922984 0.26906 0.9666862CHMP2A chromatin modifying protein 2A 2413 +/- 67 2208 +/- 90 1884 +/- 39 1919 +/- 60 -0.000236 -0.099905 0.639603 0.1340368 0.6911937CHMP4B chromatin modifying protein 4B 7492 +/- 280 6828 +/- 181 6337 +/- 187 6537 +/- 75 -0.005706 -0.079052 0.355853 0.0342813 0.2974919CHMP6 chromatin modifying protein 6 455 +/- 12 534 +/- 45 403 +/- 23 454 +/- 21 -0.005973 0.1429622 0.140388 0.2109581 0.8072828CHMP7 CHMP family, member 7 1152 +/- 54 1137 +/- 37 941 +/- 27 1028 +/- 35 -0.001275 -0.823906 0.084549 0.6461979 0.0676543CHODL chondrolectin 272 +/- 39 306 +/- 35 185 +/- 15 209 +/- 24 -0.003126 0.5266179 0.429431 0.2657017 0.094144CHRNB1 cholinergic receptor, nicotinic, beta 1 (muscle) 429 +/- 39 368 +/- 32 303 +/- 12 356 +/- 34 -0.021022 -0.255701 0.204894 0.3749951 0.3565374CHST3 carbohydrate (chondroitin 6) sulfotransferase 3 639 +/- 84 773 +/- 125 385 +/- 5 482 +/- 26 -0.005146 0.3983593 0.019465 0.1758969 0.0445424CHST8 carbohydrate (N-acetylgalactosamine 4-0) sulfotransferase 8 856 +/- 116 664 +/- 49 471 +/- 61 480 +/- 37 -0.009209 -0.172908 0.900243 0.1233535 0.949405CHURC1 churchill domain containing 1 2879 +/- 78 3384 +/- 118 2472 +/- 75 2873 +/- 90 -0.000854 0.006514 0.008507 0.0013983 0.0100486CIB1 calcium and integrin binding 1 (calmyrin) 763 +/- 61 776 +/- 44 577 +/- 33 613 +/- 27 -0.00194 0.8647032 0.421586 0.7861799 0.8221939CITED4 Cbp/p300-interacting transactivator, with Glu/Asp-rich carboxy-terminal domain, 4 176 +/- 20 190 +/- 15 131 +/- 7 133 +/- 6 -0.00089 0.6001236 0.814855 0.9260024 0.6290701CKLF chemokine-like factor 686 +/- 32 579 +/- 45 611 +/- 22 492 +/- 40 -0.011824 -0.086706 -0.037465 0.2042547 0.0197104CKMT1B creatine kinase, mitochondrial 1B 6947 +/- 213 5592 +/- 354 5522 +/- 246 4526 +/- 212 -0.00021 -0.010828 -0.013362 0.013891 0.1270608CKS1B CDC28 protein kinase regulatory subunit 1B 822 +/- 24 945 +/- 35 686 +/- 28 763 +/- 14 -0.000153 0.0180419 0.041455 0.0451127 0.2475416CLCA1 chloride channel, calcium activated, family member 1 154 +/- 63 323 +/- 100 56 +/- 17 112 +/- 21 -0.021548 0.1890092 0.064658 0.0077885 0.0043554CLCC1 chloride channel CLIC-like 1 332 +/- 29 441 +/- 25 310 +/- 14 395 +/- 5 -0.051789 0.0179946 0.001145 0.066525 0.011344CLDN15 claudin 15 352 +/- 48 618 +/- 92 272 +/- 21 393 +/- 56 -0.005536 0.0355177 0.099515 0.0144859 0.0386216CLDND1 claudin domain containing 1 8178 +/- 1113 11194 +/- 1739 4771 +/- 507 6760 +/- 758 -0.008637 0.1799766 0.064248 0.0538869 0.1418948CLIC1 chloride intracellular channel 1 450 +/- 32 468 +/- 12 341 +/- 23 402 +/- 15 -3.93E-05 0.605477 0.058328 0.7900033 0.4782277CLK1 CDC-like kinase 1 4770 +/- 372 4554 +/- 254 4356 +/- 206 3850 +/- 108 -0.037174 -0.642794 -0.064031 0.9239291 0.1542996CLK4 CDC-like kinase 4 2680 +/- 52 2262 +/- 87 2336 +/- 119 1847 +/- 72 -1.37E-05 -0.003237 -0.00787 0.0890823 0.0935707CLMN calmin (calponin-like, transmembrane) 580 +/- 69 728 +/- 158 301 +/- 52 394 +/- 61 -0.008414 0.419897 0.279282 0.1286718 0.3338183CLN5 ceroid-lipofuscinosis, neuronal 5 617 +/- 55 568 +/- 41 522 +/- 35 439 +/- 19 -0.010704 -0.49019 -0.075743 0.9144284 0.0715605CLPTM1 cleft lip and palate associated transmembrane protein 1 3386 +/- 62 3647 +/- 150 3115 +/- 57 3343 +/- 158 -0.000817 0.155692 0.231743 0.7635097 0.4392052CLU clusterin 3878 +/- 541 3451 +/- 377 2851 +/- 426 2733 +/- 149 -0.020096 -0.533241 -0.802516 0.8002128 0.7249083CMTM2 CKLF-like MARVEL transmembrane domain containing 2 150 +/- 19 128 +/- 11 109 +/- 19 96 +/- 14 -0.016372 -0.347331 -0.59341 0.5361555 0.9939926CMTM3 CKLF-like MARVEL transmembrane domain containing 3 684 +/- 73 783 +/- 21 553 +/- 20 645 +/- 18 -0.004933 0.2413487 0.007506 0.1880707 0.0672783CMTM5 CKLF-like MARVEL transmembrane domain containing 5 2631 +/- 293 3487 +/- 483 1346 +/- 59 1861 +/- 191 -0.000853 0.1669512 0.051693 0.069623 0.0709191CMTM7 CKLF-like MARVEL transmembrane domain containing 7 335 +/- 14 306 +/- 20 275 +/- 21 276 +/- 21 -0.016541 -0.254926 0.964587 0.0929472 0.460033CNDP1 carnosine dipeptidase 1 (metallopeptidase M20 family) 1872 +/- 548 3446 +/- 569 974 +/- 183 2032 +/- 172 -0.014765 0.0742997 0.002279 0.0431478 0.006867CNDP2 CNDP dipeptidase 2 (metallopeptidase M20 family) 4336 +/- 335 4565 +/- 314 3112 +/- 53 3220 +/- 84 -0.000241 0.6286596 0.310143 0.552157 0.8870322CNFN cornifelin 249 +/- 35 281 +/- 22 219 +/- 15 214 +/- 12 -0.048069 0.4703657 -0.808291 0.8704765 0.5061143CNP 2',3'-cyclic nucleotide 3' phosphodiesterase 8116 +/- 1232 11141 +/- 2317 4506 +/- 307 5837 +/- 379 -0.0058 0.2839787 0.025495 0.0954527 0.0080065CNTN2 contactin 2 (axonal) 1460 +/- 297 1616 +/- 311 695 +/- 83 672 +/- 63 -0.005522 0.7247294 -0.827563 0.4145266 0.7630422CNTN3 contactin 3 (plasmacytoma associated) 447 +/- 20 399 +/- 15 388 +/- 29 293 +/- 34 -0.003086 -0.091245 -0.064052 0.0416454 0.2389211
S2-genes differentially expressed across region.xls Page 42

Symbol Description Young CA Aged CA Young DG Aged DG CA v DG CA Y v A DG Y v A CA to PMI DG to PMICNTNAP5 contactin associated protein-like 5 325 +/- 36 243 +/- 23 184 +/- 13 158 +/- 9 -0.000282 -0.086368 -0.149139 0.0457127 0.2825933COASY Coenzyme A synthase 627 +/- 42 567 +/- 29 486 +/- 23 439 +/- 20 -0.001244 -0.270332 -0.157179 0.3994476 0.5245985COG5 component of oligomeric golgi complex 5 690 +/- 66 715 +/- 31 579 +/- 32 577 +/- 21 -0.002405 0.7426074 -0.959618 0.5414251 0.7348352COG6 component of oligomeric golgi complex 6 1115 +/- 85 1119 +/- 39 1026 +/- 28 1056 +/- 44 -0.027176 0.9737657 0.577801 0.9369848 0.5411019COL5A2 collagen, type V, alpha 2 370 +/- 33 376 +/- 27 313 +/- 22 284 +/- 16 -0.005388 0.8926962 -0.317904 0.7735424 0.1832831COL8A1 Collagen, type VIII, alpha 1 97 +/- 13 150 +/- 14 69 +/- 14 113 +/- 15 -0.023159 0.0164826 0.061623 0.0556603 0.0055949COL9A2 collagen, type IX, alpha 2 2080 +/- 276 2457 +/- 345 1452 +/- 77 1666 +/- 161 -0.018675 0.4141915 0.277935 0.3059566 0.7099132COMMD4 COMM domain containing 4 1930 +/- 147 2000 +/- 71 1418 +/- 76 1580 +/- 67 -2.9E-05 0.6792306 0.145219 0.5970648 0.4660706COP1 caspase-1 dominant-negative inhibitor pseudo-ICE 118 +/- 12 144 +/- 28 95 +/- 6 76 +/- 10 -0.033682 0.4210082 -0.145496 0.0687351 0.321298COPZ2 coatomer protein complex, subunit zeta 2 410 +/- 43 502 +/- 44 289 +/- 23 302 +/- 21 -0.000483 0.1649153 0.67809 0.0992265 0.9260088COQ5 coenzyme Q5 homolog, methyltransferase (S. cerevisiae) 581 +/- 71 553 +/- 56 486 +/- 54 495 +/- 30 -0.003981 -0.762039 0.891731 0.9596295 0.8906728CORO1A coronin, actin binding protein, 1A 1257 +/- 114 1020 +/- 57 834 +/- 46 816 +/- 54 -0.004675 -0.102708 -0.80123 0.1541214 0.8940173CORO1B coronin, actin binding protein, 1B 452 +/- 65 514 +/- 58 344 +/- 20 331 +/- 13 -0.013343 0.4981705 -0.610323 0.4446883 0.4003394CORO1C coronin, actin binding protein, 1C 1945 +/- 199 1698 +/- 55 1268 +/- 64 1244 +/- 86 -0.00105 -0.27734 -0.826591 0.3309357 0.9284348CORO2A Coronin, actin binding protein, 2A 276 +/- 74 283 +/- 50 195 +/- 23 169 +/- 14 -0.041583 0.9356185 -0.360214 0.8854581 0.5596585COX5B cytochrome c oxidase subunit Vb 6825 +/- 788 9221 +/- 528 4736 +/- 885 7292 +/- 122 -3.18E-05 0.0331089 0.03388 0.0665571 0.0655704COX6A1 cytochrome c oxidase subunit VIa polypeptide 1 2380 +/- 151 2589 +/- 131 2121 +/- 157 2189 +/- 96 -0.004083 0.3191634 0.721927 0.7688196 0.8338715COX6C cytochrome c oxidase subunit VIc 7080 +/- 300 8976 +/- 497 6419 +/- 237 8142 +/- 260 -0.027156 0.0110211 0.000959 0.2042941 0.0616353COX7A1 cytochrome c oxidase subunit VIIa polypeptide 1 (muscle) 2121 +/- 162 2252 +/- 141 1510 +/- 121 1727 +/- 103 -0.000127 0.555656 0.204574 0.282774 0.1505355COX7A2 cytochrome c oxidase subunit VIIa polypeptide 2 (liver) 15324 +/- 717 14542 +/- 939 12731 +/- 389 12708 +/- 852 -0.000599 -0.523988 -0.981198 0.1169768 0.1868283COX7A2L cytochrome c oxidase subunit VIIa polypeptide 2 like 868 +/- 27 853 +/- 24 800 +/- 29 748 +/- 33 -0.004685 -0.693418 -0.270303 0.6377515 0.2469298COX7C cytochrome c oxidase subunit VIIc 10606 +/- 617 9242 +/- 390 8355 +/- 280 8437 +/- 325 -0.002098 -0.096629 0.852578 0.039567 0.8537689CP110 CP110 protein 316 +/- 38 427 +/- 84 266 +/- 35 341 +/- 42 -0.045713 0.268209 0.204427 0.0148117 0.0252812CPAMD8 C3 and PZP-like, alpha-2-macroglobulin domain containing 8 404 +/- 74 343 +/- 32 271 +/- 35 193 +/- 14 -0.000728 -0.471263 -0.084415 0.3925015 0.1122125CPLX3 complexin 3 825 +/- 307 690 +/- 172 272 +/- 42 188 +/- 27 -0.005969 -0.711267 -0.127072 0.7480225 0.2834839CPM carboxypeptidase M 510 +/- 36 719 +/- 162 320 +/- 31 381 +/- 32 -0.010773 0.2575553 0.203373 0.0179931 0.1028616CPSF3 cleavage and polyadenylation specific factor 3, 73kDa 1455 +/- 65 1526 +/- 71 1228 +/- 39 1231 +/- 37 -0.002023 0.4757292 0.956525 0.3320076 0.8323454CPSF4 cleavage and polyadenylation specific factor 4, 30kDa 1388 +/- 119 1359 +/- 42 1127 +/- 55 1148 +/- 45 -0.006904 -0.829127 0.778144 0.7054476 0.5413253CRAMP1L Crm, cramped-like (Drosophila) 799 +/- 22 1083 +/- 81 759 +/- 43 853 +/- 75 -0.02985 0.0158006 0.319566 0.109389 0.8164495CRBN cereblon 4636 +/- 161 4288 +/- 215 3986 +/- 132 3919 +/- 238 -0.000982 -0.225906 -0.812653 0.0080603 0.1939425CREB3L1 cAMP responsive element binding protein 3-like 1 189 +/- 18 180 +/- 11 129 +/- 16 153 +/- 14 -0.007422 -0.68332 0.286968 0.2869703 0.5171331CREB5 cAMP responsive element binding protein 5 345 +/- 71 521 +/- 109 181 +/- 16 223 +/- 14 -0.005129 0.2097603 0.080698 0.0473383 0.0667082CREBL1 cAMP responsive element binding protein-like 1 522 +/- 42 565 +/- 23 446 +/- 18 460 +/- 29 -0.010171 0.3931707 0.70253 0.3685313 0.3114359CREG1 cellular repressor of E1A-stimulated genes 1 1583 +/- 121 1899 +/- 179 1341 +/- 149 1470 +/- 146 -0.004148 0.1776922 0.551809 0.0098578 0.30433CREM cAMP responsive element modulator 740 +/- 125 542 +/- 24 499 +/- 31 481 +/- 19 -0.023758 -0.175598 -0.635624 0.1193692 0.4861042CRIM1 cysteine rich transmembrane BMP regulator 1 (chordin-like) 4775 +/- 419 3704 +/- 278 2971 +/- 172 2522 +/- 262 -0.001812 -0.063243 -0.195364 0.1499319 0.3960486CRKL v-crk sarcoma virus CT10 oncogene homolog (avian)-like 1767 +/- 44 1717 +/- 67 1489 +/- 11 1401 +/- 15 -2.12E-05 -0.547481 -0.001865 0.9929446 0.0092549CRR9 cisplatin resistance related protein CRR9p 2783 +/- 165 2725 +/- 158 2109 +/- 71 2119 +/- 54 -0.000669 -0.805264 0.911848 0.8654179 0.2676213CRYAB crystallin, alpha B 11364 +/- 1007 13433 +/- 1482 8015 +/- 574 9478 +/- 561 -0.006287 0.2787117 0.101862 0.0900014 0.1000622CRYM crystallin, mu 9716 +/- 788 8920 +/- 1069 5034 +/- 526 5665 +/- 360 -9.96E-05 -0.563728 0.349823 0.2800552 0.8508624CSE1L CSE1 chromosome segregation 1-like (yeast) 3286 +/- 73 3432 +/- 127 2679 +/- 80 2915 +/- 76 -2.47E-06 0.350729 0.061084 0.5774952 0.2957668CSF2RB colony stimulating factor 2 receptor, beta, low-affinity (granulocyte-macrophage) 151 +/- 7 191 +/- 15 133 +/- 12 133 +/- 8 -0.007943 0.0451243 -0.994117 0.0008691 0.7750291CSNK2A2 casein kinase 2, alpha prime polypeptide 549 +/- 14 523 +/- 29 468 +/- 15 484 +/- 16 -0.014569 -0.460198 0.483988 0.6746479 0.6557905CSNK2B casein kinase 2, beta polypeptide 5331 +/- 209 5162 +/- 171 4911 +/- 68 4721 +/- 101 -0.001806 -0.544323 -0.160066 0.6968934 0.8700755CSRP1 cysteine and glycine-rich protein 1 10474 +/- 785 12051 +/- 791 7739 +/- 205 8522 +/- 429 -0.000707 0.1872883 0.153005 0.053743 0.6262066
S2-genes differentially expressed across region.xls Page 43

Symbol Description Young CA Aged CA Young DG Aged DG CA v DG CA Y v A DG Y v A CA to PMI DG to PMICSRP2 cysteine and glycine-rich protein 2 211 +/- 30 185 +/- 24 159 +/- 19 145 +/- 11 -0.033657 -0.531955 -0.553877 0.4985332 0.4271501CSTB cystatin B (stefin B) 6756 +/- 454 7724 +/- 450 6112 +/- 199 7133 +/- 147 -0.030487 0.1610221 0.002746 0.2614149 0.0407972CSTF2T cleavage stimulation factor, 3' pre-RNA, subunit 2, 64kDa, tau variant 319 +/- 30 389 +/- 19 279 +/- 22 321 +/- 19 -0.000598 0.0810061 0.184758 0.1481679 0.4097779CSTF3 cleavage stimulation factor, 3' pre-RNA, subunit 3, 77kDa 591 +/- 22 545 +/- 19 524 +/- 22 521 +/- 21 -0.043912 -0.140529 -0.922226 0.2859229 0.7890716CTAGE5 CTAGE family, member 5 542 +/- 50 613 +/- 67 463 +/- 22 425 +/- 40 -0.008101 0.4224351 -0.427376 0.0632479 0.8484196CTDSP2 CTD (carboxy-terminal domain, RNA polymerase II, polypeptide A) small phosphatase 2 2715 +/- 105 2657 +/- 150 2420 +/- 54 2153 +/- 92 -0.000546 -0.758013 -0.04211 0.7117736 0.1471537CTGF connective tissue growth factor 756 +/- 161 908 +/- 140 271 +/- 40 368 +/- 55 -0.000694 0.4949783 0.193561 0.7186414 0.288553CTHRC1 collagen triple helix repeat containing 1 391 +/- 48 395 +/- 20 283 +/- 50 300 +/- 42 -0.00317 0.9371471 0.806473 0.8716606 0.7262983CTNNA1 catenin (cadherin-associated protein), alpha 1, 102kDa 1297 +/- 102 1593 +/- 116 1048 +/- 44 1115 +/- 39 -0.002255 0.0843797 0.278267 0.0385138 0.8219737CTNND1 catenin (cadherin-associated protein), delta 1 637 +/- 49 718 +/- 21 604 +/- 44 615 +/- 22 -0.035106 0.1772398 0.829645 0.2934047 0.6295722CTNND2 catenin (cadherin-associated protein), delta 2 (neural plakophilin-related arm-repeat prote 3584 +/- 180 3514 +/- 224 2908 +/- 77 2899 +/- 72 -0.002084 -0.811785 -0.931461 0.9720678 0.6668659CUEDC2 CUE domain containing 2 3749 +/- 117 3595 +/- 94 3133 +/- 60 3081 +/- 20 -2.08E-05 -0.330031 -0.437773 0.0988349 0.4121574CUL3 cullin 3 487 +/- 49 505 +/- 47 409 +/- 29 416 +/- 14 -0.003313 0.7940857 0.8386 0.4797853 0.7534171CUTA cutA divalent cation tolerance homolog (E. coli) 2675 +/- 120 2832 +/- 174 2482 +/- 147 2291 +/- 125 -0.02037 0.4764614 -0.348924 0.7129541 0.2539292CUTC cutC copper transporter homolog (E. coli) 578 +/- 24 592 +/- 54 494 +/- 25 497 +/- 38 -0.001325 0.8313859 0.94994 0.5048611 0.5248844CWF19L2 CWF19-like 2, cell cycle control (S. pombe) 477 +/- 43 740 +/- 86 434 +/- 31 541 +/- 30 -0.053544 0.0270477 0.035306 0.0017024 0.0346302CX3CR1 chemokine (C-X3-C motif) receptor 1 2269 +/- 226 2075 +/- 194 1738 +/- 136 1511 +/- 55 -0.001111 -0.52976 -0.168501 0.9434528 0.3390027CXXC4 CXXC finger 4 336 +/- 31 432 +/- 16 266 +/- 21 359 +/- 24 -0.004324 0.0253939 0.01767 0.098273 0.053262CYBA cytochrome b-245, alpha polypeptide 1308 +/- 102 1275 +/- 108 1067 +/- 80 888 +/- 62 -0.00236 -0.824324 -0.110376 0.3275515 0.6007482CYBASC3 cytochrome b, ascorbate dependent 3 572 +/- 34 531 +/- 34 467 +/- 13 426 +/- 18 -0.001906 -0.40351 -0.098372 0.8280679 0.0418748CYC1 cytochrome c-1 5184 +/- 150 4730 +/- 241 4549 +/- 119 4491 +/- 199 -0.018168 -0.14693 -0.810564 0.0092214 0.350359CYLD Cylindromatosis (turban tumor syndrome) 1476 +/- 58 1288 +/- 84 1067 +/- 33 1026 +/- 43 -0.000225 -0.098503 -0.470961 0.1327949 0.4715388CYLN2 cytoplasmic linker 2 1723 +/- 167 2123 +/- 197 1484 +/- 103 1612 +/- 63 -0.018909 0.1533753 0.317208 0.082689 0.3058558CYP2U1 cytochrome P450, family 2, subfamily U, polypeptide 1 588 +/- 29 675 +/- 23 522 +/- 14 543 +/- 13 -0.000203 0.0432777 0.29925 0.0939982 0.3473348D21S2056EDNA segment on chromosome 21 (unique) 2056 expressed sequence 941 +/- 105 1138 +/- 59 786 +/- 44 1023 +/- 84 -0.012674 0.1404877 0.04602 0.2599288 0.1698107D4ST1 dermatan 4 sulfotransferase 1 165 +/- 15 183 +/- 6 123 +/- 12 154 +/- 8 -0.008236 0.3041757 0.071265 0.3077858 0.2574387DAB2 disabled homolog 2, mitogen-responsive phosphoprotein (Drosophila) 692 +/- 53 525 +/- 58 501 +/- 39 504 +/- 29 -0.001653 -0.060277 0.954667 0.0111378 0.5244314DAD1 defender against cell death 1 3547 +/- 95 3727 +/- 84 2771 +/- 49 2933 +/- 86 -2.75E-06 0.187388 0.14759 0.0493468 0.3702756DAG1 dystroglycan 1 (dystrophin-associated glycoprotein 1) 859 +/- 104 790 +/- 88 686 +/- 53 604 +/- 48 -0.025635 -0.621655 -0.28306 0.3804186 0.0757875DAPK3 death-associated protein kinase 3 980 +/- 115 863 +/- 89 684 +/- 82 729 +/- 47 -0.032469 -0.439015 0.64705 0.6875479 0.3427059DAZAP2 DAZ associated protein 2 7917 +/- 569 8723 +/- 596 6161 +/- 477 6980 +/- 181 -0.000448 0.3510831 0.156523 0.117269 0.1919636DBNDD1 dysbindin (dystrobrevin binding protein 1) domain containing 1 776 +/- 68 823 +/- 44 553 +/- 56 608 +/- 27 -0.004054 0.5761059 0.398768 0.9969725 0.2159216DBNDD2 dysbindin (dystrobrevin binding protein 1) domain containing 2 6719 +/- 435 8157 +/- 929 5664 +/- 297 6675 +/- 313 -0.029077 0.2029886 0.044247 0.0499254 0.0076164DBP D site of albumin promoter (albumin D-box) binding protein 129 +/- 20 148 +/- 14 98 +/- 17 89 +/- 10 -0.006967 0.4707602 -0.668048 0.2058911 0.4015884DCHS1 dachsous 1 (Drosophila) 1010 +/- 114 1167 +/- 88 680 +/- 60 676 +/- 32 -0.000191 0.303339 -0.950341 0.2219554 0.9214016DCLRE1B DNA cross-link repair 1B (PSO2 homolog, S. cerevisiae) 229 +/- 11 243 +/- 15 186 +/- 10 186 +/- 8 -6.52E-05 0.4581383 -0.966724 0.5370239 0.826896DCLRE1C DNA cross-link repair 1C (PSO2 homolog, S. cerevisiae) 235 +/- 32 211 +/- 25 150 +/- 3 165 +/- 11 -0.012651 -0.569095 0.24421 0.6780514 0.029606DCTN2 dynactin 2 (p50) 4947 +/- 147 5280 +/- 167 4616 +/- 118 4855 +/- 82 -0.000893 0.165316 0.1329 0.4185021 0.217952DCUN1D1 DCN1, defective in cullin neddylation 1, domain containing 1 (S. cerevisiae) 2306 +/- 41 1936 +/- 62 1971 +/- 52 1884 +/- 74 -0.002173 -0.00083 -0.365085 0.000397 0.2125893DCUN1D4 DCN1, defective in cullin neddylation 1, domain containing 4 (S. cerevisiae) 2977 +/- 334 2547 +/- 104 2316 +/- 83 2194 +/- 32 -0.031937 -0.265294 -0.214331 0.1588636 0.2847437DDEF1 development and differentiation enhancing factor 1 1813 +/- 134 1564 +/- 105 1341 +/- 50 1340 +/- 19 -0.000433 -0.174365 -0.981809 0.0909203 0.8257003DDHD1 DDHD domain containing 1 1480 +/- 235 2265 +/- 180 1320 +/- 221 1767 +/- 178 -0.001847 0.0253805 0.151224 0.1292407 0.5710365DDT D-dopachrome tautomerase 2124 +/- 184 2217 +/- 150 1583 +/- 129 1578 +/- 167 -9.51E-05 0.7020827 -0.97974 0.395433 0.3868208DDX17 DEAD (Asp-Glu-Ala-Asp) box polypeptide 17 13896 +/- 610 13170 +/- 307 11855 +/- 464 11561 +/- 356 -0.004932 -0.321979 -0.627664 0.4803163 0.4090845DDX18 DEAD (Asp-Glu-Ala-Asp) box polypeptide 18 1466 +/- 69 1407 +/- 49 1320 +/- 58 1244 +/- 43 -0.000321 -0.508073 -0.318355 0.7927342 0.4294238
S2-genes differentially expressed across region.xls Page 44

Symbol Description Young CA Aged CA Young DG Aged DG CA v DG CA Y v A DG Y v A CA to PMI DG to PMIDDX20 DEAD (Asp-Glu-Ala-Asp) box polypeptide 20 301 +/- 9 270 +/- 19 250 +/- 11 221 +/- 23 -0.002308 -0.172629 -0.313421 0.2619663 0.0979476DDX26B DEAD/H (Asp-Glu-Ala-Asp/His) box polypeptide 26B 381 +/- 10 396 +/- 28 356 +/- 9 341 +/- 13 -0.032645 0.6437637 -0.378567 0.6163309 0.9539329DDX39 DEAD (Asp-Glu-Ala-Asp) box polypeptide 39 637 +/- 63 757 +/- 41 507 +/- 25 534 +/- 21 -0.000558 0.1479424 0.432373 0.0660562 0.324358DDX47 DEAD (Asp-Glu-Ala-Asp) box polypeptide 47 1524 +/- 140 1488 +/- 103 1368 +/- 52 1162 +/- 115 -0.004655 -0.841536 -0.156106 0.5780658 0.6302275DDX48 DEAD (Asp-Glu-Ala-Asp) box polypeptide 48 1505 +/- 88 1696 +/- 45 1343 +/- 72 1561 +/- 54 -0.030789 0.0917214 0.038878 0.0217036 0.228826DDX54 DEAD (Asp-Glu-Ala-Asp) box polypeptide 54 855 +/- 63 781 +/- 56 489 +/- 51 613 +/- 71 -0.000903 -0.397416 0.199961 0.4375784 0.4773648DENND1C DENN/MADD domain containing 1C 279 +/- 20 236 +/- 9 241 +/- 20 176 +/- 16 -0.018819 -0.089721 -0.034211 0.1710881 0.0882096DGAT2 diacylglycerol O-acyltransferase homolog 2 (mouse) 316 +/- 31 292 +/- 17 253 +/- 10 245 +/- 18 -0.013727 -0.521246 -0.722393 0.1535305 0.3606466DHCR24 24-dehydrocholesterol reductase 1795 +/- 223 2736 +/- 414 1447 +/- 100 1797 +/- 163 -0.02642 0.0817219 0.110005 0.1142132 0.4341585DHDH dihydrodiol dehydrogenase (dimeric) 173 +/- 11 172 +/- 17 134 +/- 12 116 +/- 5 -0.005216 -0.973499 -0.214215 0.5929071 0.3594928DHPS deoxyhypusine synthase 796 +/- 30 755 +/- 26 696 +/- 34 641 +/- 23 -0.001098 -0.318859 -0.215239 0.1309789 0.0656294DHRS1 dehydrogenase/reductase (SDR family) member 1 1266 +/- 69 1336 +/- 38 943 +/- 15 1002 +/- 24 -8.11E-06 0.4008152 0.07182 0.8469828 0.3190888DHRS7 dehydrogenase/reductase (SDR family) member 7 1300 +/- 138 1424 +/- 161 907 +/- 67 960 +/- 73 -0.002539 0.5728443 0.604809 0.4569128 0.9039066DHRS7B dehydrogenase/reductase (SDR family) member 7B 172 +/- 9 177 +/- 8 144 +/- 9 155 +/- 7 -0.010726 0.69642 0.387969 0.8531804 0.4989443DHX16 DEAH (Asp-Glu-Ala-His) box polypeptide 16 670 +/- 35 550 +/- 12 568 +/- 33 500 +/- 24 -0.001543 -0.01723 -0.127297 0.0113765 0.3034065DHX36 DEAH (Asp-Glu-Ala-His) box polypeptide 36 2428 +/- 119 3034 +/- 236 2322 +/- 107 2271 +/- 112 -0.0288 0.0537281 -0.750334 0.0091283 0.7833466DHX37 DEAH (Asp-Glu-Ala-His) box polypeptide 37 343 +/- 17 390 +/- 25 286 +/- 22 339 +/- 28 -0.017602 0.1549653 0.170284 0.5727511 0.9543945DHX40 DEAH (Asp-Glu-Ala-His) box polypeptide 40 1324 +/- 109 1371 +/- 9 1120 +/- 41 1114 +/- 44 -0.012507 0.6848303 -0.921147 0.4351592 0.5953142DIABLO diablo homolog (Drosophila) 2692 +/- 59 2562 +/- 90 2300 +/- 58 2345 +/- 69 -0.001534 -0.258468 0.635741 0.0479766 0.5912605DICER1 Dicer1, Dcr-1 homolog (Drosophila) 2501 +/- 90 2771 +/- 167 2261 +/- 38 2111 +/- 62 -0.00265 0.19297 -0.080482 0.0266581 0.1142624DIP2B DIP2 disco-interacting protein 2 homolog B (Drosophila) 2784 +/- 338 3487 +/- 476 1923 +/- 60 2046 +/- 83 -0.003664 0.2595343 0.264269 0.0745389 0.0935278DIRAS2 DIRAS family, GTP-binding RAS-like 2 6727 +/- 443 6285 +/- 413 5082 +/- 391 4626 +/- 149 -0.000105 -0.482539 -0.314331 0.3823621 0.5292168DKFZp451ADKFZp451A211 protein 109 +/- 14 123 +/- 6 88 +/- 9 96 +/- 5 -0.003852 0.388696 0.481791 0.1317141 0.3447215DKFZP564 DKFZP564O0823 protein 374 +/- 32 310 +/- 31 137 +/- 28 130 +/- 15 -2.07E-05 -0.182308 -0.842571 0.5191514 0.8937024DKFZP779 PRO0845 1349 +/- 59 1055 +/- 62 1202 +/- 31 955 +/- 46 -0.002435 -0.006254 -0.002851 0.1175901 0.0847625DLD dihydrolipoamide dehydrogenase 2403 +/- 100 2013 +/- 175 2063 +/- 44 1934 +/- 103 -0.003551 -0.08897 -0.295369 0.0580228 0.4884774DLEU8 deleted in lymphocytic leukemia 8 330 +/- 44 467 +/- 42 228 +/- 18 277 +/- 20 -0.002854 0.0495718 0.100475 0.0142841 0.0960935DLGAP4 discs, large (Drosophila) homolog-associated protein 4 5343 +/- 423 4150 +/- 339 3362 +/- 229 2932 +/- 190 -0.000264 -0.053687 -0.182775 0.0176151 0.2355429DLST dihydrolipoamide S-succinyltransferase (E2 component of 2-oxo-glutarate complex) 1089 +/- 65 1029 +/- 44 1007 +/- 49 935 +/- 25 -0.045492 -0.466363 -0.222515 0.2419215 0.1016999DMAP1 DNA methyltransferase 1 associated protein 1 978 +/- 46 900 +/- 26 880 +/- 30 790 +/- 45 -0.010705 -0.174236 -0.140291 0.2209929 0.483699DMN desmuslin 3032 +/- 226 3515 +/- 237 2383 +/- 127 2365 +/- 123 -0.001143 0.1710849 -0.921298 0.1816787 0.502669DMTF1 cyclin D binding myb-like transcription factor 1 2324 +/- 160 2497 +/- 93 2237 +/- 55 2007 +/- 60 -0.025523 0.3743629 -0.021051 0.1431864 0.1538993DNAH5 dynein, axonemal, heavy polypeptide 5 218 +/- 23 235 +/- 36 149 +/- 12 150 +/- 13 -0.010029 0.6957083 0.968096 0.9822735 0.8734867DNAJA3 DnaJ (Hsp40) homolog, subfamily A, member 3 1490 +/- 50 1569 +/- 35 1346 +/- 61 1437 +/- 60 -0.019569 0.230657 0.311202 0.3766572 0.0410861DNAJA5 DnaJ homology subfamily A member 5 145 +/- 11 219 +/- 23 120 +/- 15 134 +/- 16 -0.006805 0.0223379 0.546184 0.0218671 0.9701908DNAJB1 DnaJ (Hsp40) homolog, subfamily B, member 1 3851 +/- 133 3442 +/- 136 3301 +/- 213 2897 +/- 45 -0.000198 -0.057154 -0.117919 0.2855382 0.2374256DNAJB13 DnaJ (Hsp40) related, subfamily B, member 13 744 +/- 100 526 +/- 79 333 +/- 38 239 +/- 29 -2.18E-05 -0.119807 -0.082037 0.0456375 0.0794843DNAJC14 DnaJ (Hsp40) homolog, subfamily C, member 14 968 +/- 18 1049 +/- 43 861 +/- 26 907 +/- 32 -0.000111 0.1261939 0.300634 0.1240299 0.9314316DNAJC4 DnaJ (Hsp40) homolog, subfamily C, member 4 1453 +/- 70 1283 +/- 73 1081 +/- 44 1026 +/- 60 -9.32E-05 -0.123533 -0.488926 0.0211991 0.2608965DNAJC8 DnaJ (Hsp40) homolog, subfamily C, member 8 3047 +/- 260 3518 +/- 99 2399 +/- 188 2856 +/- 98 -9.07E-06 0.1390022 0.065946 0.1667775 0.2228931DNHD2 dynein heavy chain domain 2 285 +/- 75 175 +/- 59 78 +/- 18 100 +/- 29 -0.043756 -0.274975 0.53757 0.4125895 0.9290702DNM2 dynamin 2 623 +/- 66 744 +/- 63 541 +/- 14 626 +/- 29 -0.040153 0.2143312 0.04064 0.1455557 0.0790072DNMT1 DNA (cytosine-5-)-methyltransferase 1 1492 +/- 85 1567 +/- 21 1284 +/- 33 1244 +/- 71 -0.00143 0.4265879 -0.62086 0.2778813 0.5980369DNTTIP2 deoxynucleotidyltransferase, terminal, interacting protein 2 1533 +/- 85 1584 +/- 47 1354 +/- 52 1492 +/- 56 -0.030032 0.609282 0.106363 0.7105215 0.5099277DOCK5 dedicator of cytokinesis 5 1225 +/- 213 1548 +/- 310 535 +/- 70 703 +/- 41 -0.002714 0.4123773 0.071828 0.0751143 0.0425816
S2-genes differentially expressed across region.xls Page 45

Symbol Description Young CA Aged CA Young DG Aged DG CA v DG CA Y v A DG Y v A CA to PMI DG to PMIDOCK9 Dedicator of cytokinesis 9 389 +/- 64 597 +/- 76 312 +/- 34 320 +/- 24 -0.02219 0.0639086 0.852778 0.1116284 0.8583269DOLPP1 dolichyl pyrophosphate phosphatase 1 772 +/- 47 737 +/- 45 605 +/- 24 586 +/- 22 -0.003056 -0.607208 -0.583696 0.8155 0.7798358DPF2 D4, zinc and double PHD fingers family 2 1230 +/- 66 1314 +/- 49 971 +/- 34 1002 +/- 17 -2E-05 0.3341748 0.433913 0.2052562 0.4839399DPM2 dolichyl-phosphate mannosyltransferase polypeptide 2, regulatory subunit 870 +/- 18 1041 +/- 46 787 +/- 41 847 +/- 24 -0.004586 0.0119429 0.24205 0.0784903 0.3300363DPM3 dolichyl-phosphate mannosyltransferase polypeptide 3 1718 +/- 70 1725 +/- 73 1331 +/- 29 1338 +/- 40 -2.16E-05 0.9448201 0.896672 0.6603977 0.5281242DPP10 dipeptidyl-peptidase 10 989 +/- 85 984 +/- 123 752 +/- 50 645 +/- 13 -0.000366 -0.971908 -0.08378 0.7460663 0.1391857DPY19L1 Dpy-19-like 1 (C. elegans) 219 +/- 36 292 +/- 34 155 +/- 20 190 +/- 14 -0.002063 0.1710724 0.192253 0.3076372 0.6063187DPYSL2 Dihydropyrimidinase-like 2 414 +/- 28 507 +/- 33 403 +/- 15 391 +/- 41 -0.045935 0.0561399 -0.800796 0.0131823 0.4995106DPYSL3 dihydropyrimidinase-like 3 1885 +/- 168 1922 +/- 214 1785 +/- 129 1607 +/- 189 -0.040995 0.894956 -0.460967 0.5263917 0.1380595DPYSL5 dihydropyrimidinase-like 5 1113 +/- 109 1309 +/- 190 792 +/- 74 853 +/- 89 -0.003269 0.3973008 0.61627 0.5385025 0.98366DRB1 developmentally regulated RNA-binding protein 1 747 +/- 41 661 +/- 33 647 +/- 19 614 +/- 19 -0.011181 -0.138338 -0.255377 0.0215398 0.0512189DSCR2 Down syndrome critical region gene 2 3952 +/- 261 3478 +/- 155 3473 +/- 186 3068 +/- 211 -0.004602 -0.156197 -0.186055 0.3187667 0.4886926DSCR3 Down syndrome critical region gene 3 1323 +/- 44 1391 +/- 71 1203 +/- 58 1299 +/- 61 -0.049855 0.4389988 0.28768 0.148534 0.1880045DTX4 deltex 4 homolog (Drosophila) 1525 +/- 190 1311 +/- 103 1153 +/- 66 1016 +/- 47 -0.009416 -0.352117 -0.126487 0.5262212 0.212902DUS1L dihydrouridine synthase 1-like (S. cerevisiae) 768 +/- 39 693 +/- 25 667 +/- 18 617 +/- 17 -0.022908 -0.139694 -0.079211 0.150679 0.1869882DUS3L dihydrouridine synthase 3-like (S. cerevisiae) 283 +/- 16 306 +/- 11 221 +/- 15 291 +/- 20 -0.028388 0.273665 0.024862 0.3718957 0.1447019DUSP10 dual specificity phosphatase 10 486 +/- 31 534 +/- 74 279 +/- 33 309 +/- 31 -0.001295 0.5715769 0.518575 0.162983 0.3068365DUSP2 dual specificity phosphatase 2 190 +/- 25 154 +/- 19 120 +/- 11 97 +/- 5 -0.000336 -0.286294 -0.094397 0.2792268 0.2159902DUSP6 dual specificity phosphatase 6 2476 +/- 370 1560 +/- 213 892 +/- 95 753 +/- 79 -0.001338 -0.064093 -0.290109 0.047101 0.4572996DYM dymeclin 885 +/- 42 957 +/- 31 771 +/- 20 925 +/- 49 -0.025964 0.2012926 0.030225 0.5115503 0.0192984DYNC1I2 dynein, cytoplasmic 1, intermediate chain 2 4419 +/- 229 4611 +/- 192 4024 +/- 127 3996 +/- 104 -0.006478 0.535568 -0.867919 0.2159818 0.6268196DYNLRB2 dynein, light chain, roadblock-type 2 969 +/- 64 781 +/- 110 554 +/- 38 592 +/- 44 -0.007029 -0.175743 0.539316 0.347415 0.168933DYNLT1 dynein, light chain, Tctex-type 1 1590 +/- 66 1613 +/- 65 1166 +/- 53 1304 +/- 33 -7.63E-06 0.804566 0.056801 0.6298356 0.3548616E2F6 E2F transcription factor 6 309 +/- 33 341 +/- 23 267 +/- 21 274 +/- 15 -0.010235 0.4441386 0.791645 0.2302235 0.4433692ECHDC1 enoyl Coenzyme A hydratase domain containing 1 1796 +/- 60 1599 +/- 72 1651 +/- 62 1404 +/- 53 -0.003041 -0.061427 -0.013714 0.6316257 0.1433039EDG2 endothelial differentiation, lysophosphatidic acid G-protein-coupled receptor, 2 5091 +/- 735 6481 +/- 945 2992 +/- 289 3972 +/- 198 -0.006517 0.2741158 0.022002 0.0528127 0.027661EEF1B2 eukaryotic translation elongation factor 1 beta 2 9038 +/- 382 8490 +/- 383 7693 +/- 269 6940 +/- 280 -0.000118 -0.335255 -0.085368 0.409393 0.2383939EFCBP2 EF-hand calcium binding protein 2 1044 +/- 125 1270 +/- 149 793 +/- 79 1021 +/- 182 -0.002932 0.2726921 0.297385 0.909308 0.9838533EFEMP2 EGF-containing fibulin-like extracellular matrix protein 2 739 +/- 71 813 +/- 81 569 +/- 39 613 +/- 41 -0.001685 0.5041821 0.464647 0.7450947 0.5355539EFHA1 EF-hand domain family, member A1 1315 +/- 242 1782 +/- 116 1171 +/- 184 1429 +/- 96 -0.00604 0.1247375 0.252362 0.1382484 0.314598EFHC1 EF-hand domain (C-terminal) containing 1 279 +/- 33 220 +/- 25 192 +/- 36 182 +/- 19 -0.025251 -0.1813 -0.806439 0.147156 0.3939764EFHC2 EF-hand domain (C-terminal) containing 2 234 +/- 19 266 +/- 17 174 +/- 10 237 +/- 7 -0.003752 0.235678 0.000755 0.3789393 0.0642173EFNB2 ephrin-B2 1795 +/- 111 1406 +/- 118 910 +/- 113 742 +/- 59 -4.69E-06 -0.03715 -0.223194 0.0464358 0.3631596EFTUD2 elongation factor Tu GTP binding domain containing 2 2058 +/- 62 1919 +/- 84 1721 +/- 40 1758 +/- 52 -0.000176 -0.214433 0.593615 0.0260732 0.6172757EGFL8 EGF-like-domain, multiple 8 530 +/- 42 549 +/- 24 458 +/- 24 437 +/- 20 -0.000779 0.7138991 -0.513479 0.7533771 0.3828939EHBP1L1 EH domain binding protein 1-like 1 249 +/- 15 220 +/- 27 194 +/- 17 189 +/- 14 -0.009938 -0.363253 -0.83033 0.3097291 0.5929391EIF2AK3 eukaryotic translation initiation factor 2-alpha kinase 3 394 +/- 45 400 +/- 39 300 +/- 14 292 +/- 9 -0.002919 0.9153484 -0.67177 0.8461236 0.7087189EIF2AK4 eukaryotic translation initiation factor 2 alpha kinase 4 413 +/- 20 484 +/- 18 343 +/- 27 326 +/- 8 -0.000295 0.0263662 -0.570408 0.0087158 0.5093347EIF2C2 Eukaryotic translation initiation factor 2C, 2 189 +/- 5 239 +/- 22 172 +/- 9 153 +/- 13 -0.003365 0.0782655 -0.278046 0.0180835 0.5226322EIF2S2 eukaryotic translation initiation factor 2, subunit 2 beta, 38kDa 892 +/- 48 779 +/- 24 742 +/- 37 686 +/- 37 -0.001173 -0.071512 -0.310929 0.1751001 0.1187861EIF3S1 eukaryotic translation initiation factor 3, subunit 1 alpha, 35kDa 392 +/- 26 392 +/- 22 361 +/- 14 341 +/- 13 -0.044319 0.9876901 -0.324347 0.6518479 0.1609296EIF3S3 eukaryotic translation initiation factor 3, subunit 3 gamma, 40kDa 3085 +/- 253 2946 +/- 180 2120 +/- 137 2247 +/- 52 -5.85E-05 -0.665212 0.417685 0.4929001 0.6263351EIF3S7 eukaryotic translation initiation factor 3, subunit 7 zeta, 66/67kDa 2662 +/- 54 2791 +/- 67 2401 +/- 59 2691 +/- 31 -0.004037 0.1657818 0.002838 0.2860517 0.0059068EIF3S8 eukaryotic translation initiation factor 3, subunit 8, 110kDa 3667 +/- 317 3087 +/- 171 3009 +/- 145 2951 +/- 106 -0.035598 -0.147343 -0.753654 0.1408421 0.9077313EIF4EBP1 eukaryotic translation initiation factor 4E binding protein 1 362 +/- 23 361 +/- 37 292 +/- 13 256 +/- 28 -0.001076 -0.977605 -0.294307 0.7704956 0.6527003
S2-genes differentially expressed across region.xls Page 46

Symbol Description Young CA Aged CA Young DG Aged DG CA v DG CA Y v A DG Y v A CA to PMI DG to PMIEIF5 eukaryotic translation initiation factor 5 8827 +/- 251 9331 +/- 262 7941 +/- 139 8250 +/- 152 -0.000234 0.1949471 0.169831 0.1857902 0.2000823ELMO2 engulfment and cell motility 2 1952 +/- 114 1744 +/- 64 1412 +/- 137 1391 +/- 139 -0.001477 -0.150189 -0.914956 0.1107665 0.6343618ELOVL1 elongation of very long chain fatty acids (FEN1/Elo2, SUR4/Elo3, yeast)-like 1 1213 +/- 157 1604 +/- 287 748 +/- 28 884 +/- 79 -0.006513 0.2668783 0.164108 0.0513098 0.1862667ELTD1 EGF, latrophilin and seven transmembrane domain containing 1 216 +/- 15 319 +/- 20 190 +/- 19 228 +/- 17 -0.026701 0.0022995 0.16525 0.0005254 0.2394358EMG1 EMG1 nucleolar protein homolog (S. cerevisiae) 1710 +/- 78 1487 +/- 91 1238 +/- 49 1195 +/- 60 -0.000154 -0.094425 -0.593953 0.0175036 0.2306062EMP3 epithelial membrane protein 3 385 +/- 23 473 +/- 25 311 +/- 21 374 +/- 24 -0.001739 0.0295194 0.081156 0.0951945 0.7970266ENDOD1 endonuclease domain containing 1 204 +/- 20 244 +/- 25 170 +/- 13 174 +/- 6 -0.01548 0.2535616 0.753639 0.2457314 0.9603205ENO1 enolase 1, (alpha) 7846 +/- 333 9198 +/- 336 6480 +/- 135 7880 +/- 253 -0.000391 0.0169672 0.00252 0.0783902 0.0568711ENPP2 ectonucleotide pyrophosphatase/phosphodiesterase 2 (autotaxin) 3043 +/- 553 3566 +/- 683 1105 +/- 243 1628 +/- 295 -0.000988 0.5654331 0.207101 0.1712243 0.3085393ENPP6 ectonucleotide pyrophosphatase/phosphodiesterase 6 311 +/- 73 377 +/- 55 171 +/- 24 208 +/- 13 -0.001622 0.4908494 0.227004 0.7249054 0.7951349ENY2 enhancer of yellow 2 homolog (Drosophila) 1695 +/- 57 1761 +/- 66 1537 +/- 41 1584 +/- 40 -0.003072 0.4696526 0.440732 0.810821 0.9320109EPAS1 endothelial PAS domain protein 1 3071 +/- 166 2921 +/- 93 2305 +/- 183 2256 +/- 84 -3.57E-06 -0.452943 -0.813512 0.3579985 0.5246164EPB41L2 erythrocyte membrane protein band 4.1-like 2 5330 +/- 488 6169 +/- 576 3765 +/- 111 3975 +/- 44 -0.000887 0.2930551 0.125517 0.1425261 0.1745448EPB41L4A erythrocyte membrane protein band 4.1 like 4A 703 +/- 69 644 +/- 118 350 +/- 37 298 +/- 18 -0.001169 -0.673735 -0.2491 0.5566313 0.5821436EPC2 enhancer of polycomb homolog 2 (Drosophila) 1863 +/- 112 1971 +/- 30 1637 +/- 86 1711 +/- 73 -0.012254 0.3905076 0.525919 0.2103227 0.6519041EPHA3 EPH receptor A3 372 +/- 55 421 +/- 110 240 +/- 49 185 +/- 18 -0.005647 0.7000492 -0.333694 0.7532884 0.53131EPM2A epilepsy, progressive myoclonus type 2A, Lafora disease (laforin) 318 +/- 20 349 +/- 36 278 +/- 19 264 +/- 51 -0.012415 0.47148 -0.804046 0.8968049 0.3139062EPS8 epidermal growth factor receptor pathway substrate 8 1375 +/- 55 1537 +/- 28 1326 +/- 75 1257 +/- 47 -0.015856 0.0333534 -0.451632 0.0403725 0.1494764ERCC1 excision repair cross-complementing rodent repair deficiency, complementation group 1 (i 682 +/- 32 831 +/- 69 597 +/- 41 631 +/- 29 -0.015277 0.0885035 0.525301 0.0875 0.9902521ERGIC3 ERGIC and golgi 3 2303 +/- 107 2433 +/- 73 2054 +/- 51 2319 +/- 42 -0.015545 0.3425289 0.003142 0.8177734 0.1119695ERICH1 glutamate-rich 1 931 +/- 135 1265 +/- 111 765 +/- 145 1023 +/- 52 -0.0202 0.086356 0.142185 0.1052947 0.309919ERO1LB ERO1-like beta (S. cerevisiae) 947 +/- 63 1073 +/- 83 814 +/- 79 937 +/- 65 -0.000811 0.2579165 0.261626 0.7228308 0.4841156ERRFI1 ERBB receptor feedback inhibitor 1 1173 +/- 57 1147 +/- 41 1073 +/- 44 978 +/- 42 -0.038692 -0.717351 -0.152492 0.8919617 0.123803ESRRG estrogen-related receptor gamma 778 +/- 68 735 +/- 84 490 +/- 33 480 +/- 19 -0.000272 -0.699539 -0.799959 0.3359832 0.8692106ETFB electron-transfer-flavoprotein, beta polypeptide 2760 +/- 279 2855 +/- 163 1875 +/- 76 1935 +/- 94 -0.000253 0.775005 0.636571 0.799702 0.8054761ETFDH electron-transferring-flavoprotein dehydrogenase 382 +/- 17 463 +/- 16 356 +/- 16 395 +/- 22 -0.011825 0.0066056 0.190975 0.1096217 0.4593126ETV1 ets variant gene 1 702 +/- 128 593 +/- 43 429 +/- 50 390 +/- 33 -0.001468 -0.446172 -0.528891 0.3821082 0.3714505EXOC2 exocyst complex component 2 1154 +/- 52 1250 +/- 52 1015 +/- 35 1145 +/- 65 -0.000258 0.223044 0.127503 0.7022921 0.7702248EXOC4 exocyst complex component 4 1061 +/- 58 1164 +/- 55 820 +/- 38 927 +/- 36 -0.000573 0.2207805 0.070249 0.3513183 0.3638676EXOSC10 exosome component 10 957 +/- 62 1170 +/- 42 800 +/- 35 895 +/- 36 -0.000661 0.0202287 0.092599 0.0296892 0.1904323EXOSC4 exosome component 4 371 +/- 25 410 +/- 33 338 +/- 9 340 +/- 28 -0.031187 0.3674989 0.964598 0.0795553 0.8005771EXOSC5 exosome component 5 648 +/- 33 544 +/- 16 532 +/- 31 483 +/- 14 -0.008 -0.025109 -0.20146 0.0251747 0.4908932EXT2 exostoses (multiple) 2 970 +/- 52 841 +/- 25 802 +/- 22 759 +/- 47 -0.003722 -0.058591 -0.431526 0.3594458 0.7883677EXTL3 exostoses (multiple)-like 3 1197 +/- 60 1026 +/- 64 936 +/- 42 954 +/- 43 -0.0339 -0.080422 0.769533 0.1122746 0.5792303F2RL1 coagulation factor II (thrombin) receptor-like 1 106 +/- 24 135 +/- 20 79 +/- 12 92 +/- 20 -0.045948 0.3883311 0.615583 0.2548334 0.8407825FA2H fatty acid 2-hydroxylase 1088 +/- 162 1680 +/- 349 622 +/- 81 901 +/- 73 -0.012014 0.1668608 0.030927 0.0274475 0.011596FANCC Fanconi anemia, complementation group C 492 +/- 43 461 +/- 26 405 +/- 25 393 +/- 26 -0.008609 -0.550951 -0.756556 0.4950782 0.253809FARP1 FERM, RhoGEF (ARHGEF) and pleckstrin domain protein 1 (chondrocyte-derived) 387 +/- 68 1140 +/- 179 336 +/- 59 910 +/- 114 -0.005662 0.0066696 0.004169 0.1398067 0.0912823FARSLA phenylalanine-tRNA synthetase-like, alpha subunit 925 +/- 38 978 +/- 40 762 +/- 42 831 +/- 36 -0.000165 0.3620869 0.244758 0.8171697 0.6987873FASTK Fas-activated serine/threonine kinase 625 +/- 37 797 +/- 40 549 +/- 14 706 +/- 35 -0.014604 0.010554 0.0082 0.048923 0.0043773FAU Finkel-Biskis-Reilly murine sarcoma virus (FBR-MuSV) ubiquitously expressed (fox derive 11577 +/- 613 11037 +/- 270 10727 +/- 416 10809 +/- 332 -0.030234 -0.446954 0.881039 0.4328387 0.9805711FBL fibrillarin 2698 +/- 192 2717 +/- 152 2118 +/- 63 1971 +/- 56 -0.000539 0.9414396 -0.117263 0.8262261 0.2396561FBXL15 F-box and leucine-rich repeat protein 15 628 +/- 23 580 +/- 19 529 +/- 24 562 +/- 22 -0.047834 -0.142194 0.337817 0.0947749 0.6588446FBXL20 F-box and leucine-rich repeat protein 20 390 +/- 20 371 +/- 24 331 +/- 14 297 +/- 26 -0.003937 -0.56614 -0.304651 0.8984593 0.4724749FBXL7 F-box and leucine-rich repeat protein 7 683 +/- 62 618 +/- 28 534 +/- 37 503 +/- 13 -0.000802 -0.374871 -0.457287 0.6892061 0.4546082
S2-genes differentially expressed across region.xls Page 47

Symbol Description Young CA Aged CA Young DG Aged DG CA v DG CA Y v A DG Y v A CA to PMI DG to PMIFBXW7 F-box and WD-40 domain protein 7 (archipelago homolog, Drosophila) 10339 +/- 647 9502 +/- 444 7207 +/- 268 6594 +/- 413 -6.67E-05 -0.314329 -0.252229 0.2752317 0.7455432FCER1G Fc fragment of IgE, high affinity I, receptor for; gamma polypeptide 283 +/- 30 393 +/- 40 195 +/- 12 277 +/- 15 -0.002161 0.0544574 0.002516 0.0320568 0.0074183FCGR1A Fc fragment of IgG, high affinity Ia, receptor (CD64) 228 +/- 21 288 +/- 27 185 +/- 20 221 +/- 14 -0.020592 0.1104118 0.177116 0.0384468 0.1607987FCGR3B Fc fragment of IgG, low affinity IIIb, receptor (CD16b) 158 +/- 14 222 +/- 21 125 +/- 11 167 +/- 20 -0.001601 0.0307221 0.112317 0.0083523 0.0039974FCGRT Fc fragment of IgG, receptor, transporter, alpha 1436 +/- 82 1462 +/- 100 1118 +/- 52 1110 +/- 100 -6.95E-07 0.842287 -0.942242 0.8073778 0.3493553FCHSD2 FCH and double SH3 domains 2 602 +/- 50 541 +/- 45 432 +/- 23 355 +/- 19 -0.000261 -0.3862 -0.031367 0.7664457 0.1745995FCN3 ficolin (collagen/fibrinogen domain containing) 3 (Hakata antigen) 773 +/- 82 612 +/- 38 616 +/- 53 473 +/- 26 -0.007798 -0.119355 -0.044076 0.2732374 0.2516669FEZ1 fasciculation and elongation protein zeta 1 (zygin I) 8114 +/- 604 9755 +/- 837 6969 +/- 218 8397 +/- 232 -0.032367 0.1460565 0.001635 0.0511895 0.0020014FGFRL1 fibroblast growth factor receptor-like 1 394 +/- 27 446 +/- 32 345 +/- 19 370 +/- 11 -0.003687 0.2475898 0.28718 0.3559833 0.1768308FHOD1 formin homology 2 domain containing 1 217 +/- 23 209 +/- 14 174 +/- 6 170 +/- 11 -0.010597 -0.748054 -0.757478 0.4553819 0.8876134FHOD3 formin homology 2 domain containing 3 907 +/- 38 718 +/- 69 579 +/- 57 434 +/- 53 -1.2E-05 -0.043636 -0.096171 0.0103365 0.3282478FIBP fibroblast growth factor (acidic) intracellular binding protein 1480 +/- 33 1419 +/- 89 1251 +/- 30 1310 +/- 73 -0.003098 -0.537754 0.486959 0.2505944 0.9064475FIGN Fidgetin 193 +/- 22 240 +/- 26 159 +/- 11 150 +/- 19 -0.00165 0.1886099 -0.717939 0.0824478 0.700346FIS1 fission 1 (mitochondrial outer membrane) homolog (S. cerevisiae) 3880 +/- 232 4094 +/- 258 2895 +/- 34 3141 +/- 186 -0.002259 0.5502331 0.257717 0.5529002 0.471051FKBP1A FK506 binding protein 1A, 12kDa 97 +/- 8 145 +/- 24 74 +/- 11 99 +/- 19 -0.010683 0.0996453 0.287728 0.0226258 0.0704455FKBP2 FK506 binding protein 2, 13kDa 4114 +/- 176 3978 +/- 228 3006 +/- 59 3192 +/- 134 -0.000312 -0.647115 0.253838 0.289261 0.5309577FLAD1 FAD1 flavin adenine dinucleotide synthetase homolog (S. cerevisiae) 480 +/- 17 507 +/- 18 423 +/- 22 406 +/- 19 -0.007278 0.2981438 -0.573008 0.0756129 0.7571344FLII flightless I homolog (Drosophila) 1073 +/- 71 1217 +/- 48 871 +/- 23 1050 +/- 35 -0.002118 0.1284841 0.003355 0.1624965 0.0318487FLJ10292 mago-nashi homolog 1261 +/- 70 1368 +/- 139 1084 +/- 60 1073 +/- 111 -0.007505 0.5131335 -0.933414 0.1717963 0.2933406FLJ20160 FLJ20160 protein 2368 +/- 78 2623 +/- 149 1983 +/- 98 2097 +/- 64 -0.001853 0.1707144 0.357235 0.027552 0.3568701FLJ22624 FLJ22624 protein 104 +/- 8 113 +/- 10 91 +/- 5 95 +/- 11 -0.021867 0.4694018 0.791768 0.6780549 0.6409617FLJ25084 Skin ASpartic Protease 244 +/- 31 304 +/- 25 191 +/- 22 211 +/- 10 -0.00665 0.1606849 0.41894 0.0755458 0.2275585FLJ25530 hepatocyte cell adhesion molecule 4362 +/- 359 5227 +/- 460 3822 +/- 130 4496 +/- 91 -0.014625 0.171006 0.002411 0.064663 0.003096FLJ44968 FLJ44968 protein 1611 +/- 160 1591 +/- 166 1194 +/- 70 1303 +/- 48 -0.01069 -0.93357 0.23285 0.9789572 0.4866205FLNC filamin C, gamma (actin binding protein 280) 423 +/- 64 485 +/- 58 196 +/- 21 278 +/- 15 -0.000385 0.4850993 0.012306 0.4644705 0.0496698FLRT2 fibronectin leucine rich transmembrane protein 2 402 +/- 68 350 +/- 52 276 +/- 38 272 +/- 34 -0.024393 -0.557496 -0.941913 0.2671411 0.7750184FLT3 fms-related tyrosine kinase 3 200 +/- 23 262 +/- 27 110 +/- 9 165 +/- 6 -0.000328 0.1216677 0.000867 0.1610886 0.0425169FMNL3 formin-like 3 460 +/- 48 539 +/- 26 364 +/- 20 416 +/- 26 -0.005429 0.1812658 0.156208 0.1578796 0.2393277FN1 fibronectin 1 1193 +/- 123 1012 +/- 110 905 +/- 96 749 +/- 48 -0.001069 -0.298974 -0.189998 0.0287898 0.0711712FNBP1 Formin binding protein 1 2180 +/- 284 2827 +/- 398 1337 +/- 59 1373 +/- 54 -0.001667 0.2188058 0.666709 0.0506931 0.2454356FNBP1L formin binding protein 1-like 1518 +/- 234 1397 +/- 114 1153 +/- 107 925 +/- 84 -0.013429 -0.655786 -0.127988 0.476082 0.251493FNDC4 fibronectin type III domain containing 4 1758 +/- 59 1586 +/- 117 1365 +/- 57 1386 +/- 52 -0.001788 -0.232663 0.7921 0.040767 0.7491224FOLH1 folate hydrolase (prostate-specific membrane antigen) 1 917 +/- 152 1069 +/- 251 549 +/- 87 598 +/- 99 -0.023544 0.6166617 0.717415 0.2241539 0.684578FOXJ2 forkhead box J2 2189 +/- 117 1920 +/- 77 1475 +/- 92 1318 +/- 68 -4.45E-05 -0.089255 -0.204781 0.1117535 0.361873FOXO3A Forkhead box O3A 331 +/- 35 512 +/- 68 283 +/- 27 375 +/- 22 -0.005025 0.0486744 0.026861 0.0574577 0.0218273FOXP1 forkhead box P1 285 +/- 29 214 +/- 23 213 +/- 24 144 +/- 16 -0.006384 -0.086046 -0.043082 0.7429002 0.2205373FOXRED1 FAD-dependent oxidoreductase domain containing 1 1473 +/- 29 1404 +/- 61 1245 +/- 56 1342 +/- 70 -0.02516 -0.334044 0.304842 0.1366828 0.7227087FRAS1 Fraser syndrome 1 977 +/- 53 821 +/- 113 575 +/- 71 461 +/- 23 -6.08E-05 -0.252111 -0.177067 0.1438506 0.5209527FRMD4A FERM domain containing 4A 926 +/- 37 796 +/- 36 829 +/- 20 663 +/- 39 -0.002359 -0.030713 -0.008665 0.1317086 0.0397146FRYL furry homolog-like (Drosophila) 557 +/- 54 763 +/- 84 509 +/- 27 455 +/- 20 -0.037007 0.0703112 -0.140128 0.0077 0.4955705FSD1 fibronectin type III and SPRY domain containing 1 920 +/- 35 816 +/- 42 802 +/- 30 741 +/- 32 -0.026155 -0.087406 -0.206386 0.0074091 0.2822247FSTL1 follistatin-like 1 1444 +/- 104 1350 +/- 62 956 +/- 42 1093 +/- 20 -0.000477 -0.458445 0.021569 0.493828 0.1436632FTL ferritin, light polypeptide 16238 +/- 1033 18500 +/- 704 14150 +/- 408 17258 +/- 618 -0.026136 0.1045271 0.00385 0.1129855 0.1026607FTS fused toes homolog (mouse) 5169 +/- 308 4766 +/- 212 3873 +/- 239 4259 +/- 174 -0.014268 -0.309813 0.225314 0.3223975 0.3513101FTSJ1 FtsJ homolog 1 (E. coli) 785 +/- 66 718 +/- 44 602 +/- 26 589 +/- 38 -0.003276 -0.41955 -0.785941 0.5435209 0.6997935
S2-genes differentially expressed across region.xls Page 48

Symbol Description Young CA Aged CA Young DG Aged DG CA v DG CA Y v A DG Y v A CA to PMI DG to PMIFTSJ2 FtsJ homolog 2 (E. coli) 498 +/- 18 476 +/- 31 406 +/- 8 463 +/- 17 -0.012851 -0.548167 0.02704 0.1548927 0.031354FTSJ3 FtsJ homolog 3 (E. coli) 505 +/- 43 529 +/- 18 404 +/- 14 474 +/- 29 -0.018588 0.6174046 0.076046 0.3370954 0.2169031FZD4 frizzled homolog 4 (Drosophila) 592 +/- 53 458 +/- 30 398 +/- 15 384 +/- 24 -0.007693 -0.059875 -0.621091 0.0270553 0.970464FZD6 frizzled homolog 6 (Drosophila) 299 +/- 32 257 +/- 11 211 +/- 22 207 +/- 19 -0.005079 -0.254938 -0.901009 0.4751081 0.423233GAB2 GRB2-associated binding protein 2 1847 +/- 344 2157 +/- 306 982 +/- 34 1092 +/- 59 -0.001689 0.5161619 0.155237 0.2224056 0.0012169GABARAP GABA(A) receptor-associated protein 11702 +/- 341 11960 +/- 190 10752 +/- 157 11400 +/- 130 -0.00177 0.5282196 0.011299 0.5584819 0.0638276GABRA1 gamma-aminobutyric acid (GABA) A receptor, alpha 1 2907 +/- 336 3256 +/- 506 2181 +/- 178 2201 +/- 74 -0.003368 0.5803607 0.920507 0.9151562 0.7572503GADD45B growth arrest and DNA-damage-inducible, beta 730 +/- 33 660 +/- 48 590 +/- 40 509 +/- 21 -0.00445 -0.260921 -0.110977 0.7345771 0.2523531GAL3ST1 galactose-3-O-sulfotransferase 1 482 +/- 85 597 +/- 117 232 +/- 22 269 +/- 14 -0.003121 0.4435998 0.185218 0.1979505 0.4341002GALNT1 UDP-N-acetyl-alpha-D-galactosamine:polypeptide N-acetylgalactosaminyltransferase 1 (G 1487 +/- 76 1307 +/- 95 1286 +/- 57 1262 +/- 72 -0.043484 -0.171201 -0.803101 0.1872101 0.5941416GALNT12 UDP-N-acetyl-alpha-D-galactosamine:polypeptide N-acetylgalactosaminyltransferase 12 ( 638 +/- 84 773 +/- 57 529 +/- 34 592 +/- 21 -0.014652 0.2167411 0.152624 0.2460076 0.3731398GALNT4 UDP-N-acetyl-alpha-D-galactosamine:polypeptide N-acetylgalactosaminyltransferase 4 (G 171 +/- 20 168 +/- 14 132 +/- 15 111 +/- 11 -0.000411 -0.886065 -0.299838 0.7395903 0.1659209GALNT6 UDP-N-acetyl-alpha-D-galactosamine:polypeptide N-acetylgalactosaminyltransferase 6 (G 309 +/- 90 416 +/- 84 144 +/- 13 201 +/- 31 -0.007189 0.406547 0.145237 0.262658 0.0822429GALNT7 UDP-N-acetyl-alpha-D-galactosamine:polypeptide N-acetylgalactosaminyltransferase 7 (G 507 +/- 38 593 +/- 37 358 +/- 16 368 +/- 28 -0.000144 0.1347164 0.751859 0.3556087 0.7982724GALNTL2 UDP-N-acetyl-alpha-D-galactosamine:polypeptide N-acetylgalactosaminyltransferase-like 448 +/- 45 296 +/- 38 272 +/- 18 235 +/- 32 -0.010103 -0.026776 -0.343099 0.0897514 0.3666745GANC glucosidase, alpha; neutral C 451 +/- 60 883 +/- 120 322 +/- 16 530 +/- 33 -0.013584 0.0135516 0.001369 0.0051561 0.0059706GAP43 growth associated protein 43 3187 +/- 286 3188 +/- 320 2477 +/- 133 2184 +/- 65 -0.001472 0.9973364 -0.086847 0.7035552 0.267515GARNL1 GTPase activating Rap/RanGAP domain-like 1 683 +/- 64 626 +/- 46 579 +/- 30 462 +/- 37 -0.012651 -0.48589 -0.040099 0.9233998 0.0687345GARS glycyl-tRNA synthetase 2928 +/- 135 2668 +/- 137 2369 +/- 60 2385 +/- 60 -0.002177 -0.207385 0.855197 0.0731511 0.8854352GAS1 growth arrest-specific 1 1332 +/- 48 1196 +/- 95 1232 +/- 73 1064 +/- 38 -0.026022 -0.236095 -0.07768 0.9419286 0.3216515GAS7 growth arrest-specific 7 9122 +/- 492 10812 +/- 463 7341 +/- 461 8180 +/- 533 -0.000193 0.0313393 0.265978 0.1668645 0.1972682GBA glucosidase, beta; acid (includes glucosylceramidase) 340 +/- 28 340 +/- 24 273 +/- 19 283 +/- 17 -0.001428 0.9846466 0.704739 0.472304 0.3603423GCDH glutaryl-Coenzyme A dehydrogenase 441 +/- 27 371 +/- 17 418 +/- 24 317 +/- 19 -0.043161 -0.058952 -0.009162 0.0303135 0.0002663GCN1L1 GCN1 general control of amino-acid synthesis 1-like 1 (yeast) 678 +/- 63 753 +/- 36 547 +/- 13 570 +/- 22 -0.002305 0.3249385 0.398553 0.235447 0.2281114Gcom1 GRINL1A combined protein 380 +/- 75 485 +/- 91 188 +/- 12 195 +/- 15 -0.001506 0.3935844 0.717825 0.4131573 0.7146714GDAP2 ganglioside induced differentiation associated protein 2 573 +/- 31 663 +/- 36 534 +/- 33 563 +/- 34 -0.016399 0.08683 0.559845 0.1251724 0.5865968GDI2 GDP dissociation inhibitor 2 5306 +/- 108 5016 +/- 127 4579 +/- 86 4402 +/- 99 -0.000136 -0.113474 -0.212161 0.232678 0.6120108GDPD3 glycerophosphodiester phosphodiesterase domain containing 3 119 +/- 19 128 +/- 13 89 +/- 16 101 +/- 11 -0.040643 0.715043 0.556802 0.3444737 0.856881GFRA2 GDNF family receptor alpha 2 784 +/- 107 694 +/- 41 624 +/- 53 523 +/- 42 -0.044649 -0.463273 -0.1683 0.3268422 0.0943996GGA3 golgi associated, gamma adaptin ear containing, ARF binding protein 3 2318 +/- 194 2668 +/- 92 2042 +/- 88 2005 +/- 68 -0.00245 0.1463827 -0.749114 0.4001113 0.983511GGTLA4 gamma-glutamyltransferase-like activity 4 155 +/- 2 188 +/- 13 139 +/- 10 162 +/- 8 -0.043682 0.0487262 0.12909 0.0644891 0.1799802GIT2 G protein-coupled receptor kinase interactor 2 2774 +/- 76 3131 +/- 101 2423 +/- 103 2775 +/- 131 -0.004492 0.0196676 0.067079 0.1746952 0.0318407GJA12 gap junction protein, alpha 12, 47kDa 683 +/- 86 921 +/- 117 493 +/- 44 660 +/- 35 -0.026775 0.1357396 0.015548 0.0902397 0.1246776GJA7 gap junction protein, alpha 7, 45kDa (connexin 45) 242 +/- 25 209 +/- 20 154 +/- 14 145 +/- 13 -0.002071 -0.322531 -0.635095 0.4175594 0.6979369GLA galactosidase, alpha 400 +/- 19 475 +/- 12 357 +/- 11 391 +/- 12 -0.005319 0.0101419 0.061628 0.0135964 0.3486946GLDC glycine dehydrogenase (decarboxylating) 661 +/- 136 491 +/- 38 332 +/- 12 295 +/- 16 -0.008112 -0.273915 -0.107303 0.2292532 0.083932GLT25D2 glycosyltransferase 25 domain containing 2 714 +/- 57 732 +/- 52 438 +/- 21 422 +/- 28 -3.91E-06 0.8198134 -0.659207 0.7293567 0.9968209GLTP glycolipid transfer protein 651 +/- 53 840 +/- 92 531 +/- 50 675 +/- 51 -0.004488 0.1131156 0.076299 0.0379876 0.0466051GMFG glia maturation factor, gamma 412 +/- 31 565 +/- 21 316 +/- 21 420 +/- 14 -1.16E-05 0.0027447 0.002888 0.0042369 0.048963GMPPA GDP-mannose pyrophosphorylase A 538 +/- 19 566 +/- 20 479 +/- 14 495 +/- 22 -0.00092 0.3286272 0.562579 0.8454384 0.5011415GMPS guanine monphosphate synthetase 570 +/- 45 619 +/- 27 438 +/- 20 530 +/- 21 -0.001525 0.3776871 0.011127 0.4369728 0.0406228GNAI1 guanine nucleotide binding protein (G protein), alpha inhibiting activity polypeptide 1 3885 +/- 382 4376 +/- 455 2314 +/- 243 2600 +/- 342 -0.001308 0.4289106 0.516613 0.277299 0.6153514GNAI3 guanine nucleotide binding protein (G protein), alpha inhibiting activity polypeptide 3 2053 +/- 166 2183 +/- 82 1828 +/- 79 1864 +/- 49 -0.014175 0.5051208 0.711206 0.735016 0.6806788GNG12 guanine nucleotide binding protein (G protein), gamma 12 2154 +/- 146 2439 +/- 165 1842 +/- 112 1621 +/- 52 -0.001139 0.2243651 -0.116575 0.1638139 0.2867848GNG5 guanine nucleotide binding protein (G protein), gamma 5 1170 +/- 71 1069 +/- 100 919 +/- 44 998 +/- 61 -0.034156 -0.434271 0.329067 0.1440744 0.819154
S2-genes differentially expressed across region.xls Page 49

Symbol Description Young CA Aged CA Young DG Aged DG CA v DG CA Y v A DG Y v A CA to PMI DG to PMIGOLGA7 golgi autoantigen, golgin subfamily a, 7 9156 +/- 727 11245 +/- 1212 6208 +/- 390 7268 +/- 419 -0.002789 0.1770344 0.098229 0.0400406 0.1986683GOLGB1 golgi autoantigen, golgin subfamily b, macrogolgin (with transmembrane signal), 1 1330 +/- 86 1392 +/- 33 1182 +/- 53 1174 +/- 30 -0.00163 0.5238144 -0.902338 0.5692584 0.783573GOT2 glutamic-oxaloacetic transaminase 2, mitochondrial (aspartate aminotransferase 2) 5041 +/- 112 4879 +/- 319 3831 +/- 214 3914 +/- 71 -1.26E-05 -0.646713 0.725853 0.2427372 0.9803293GPAA1 glycosylphosphatidylinositol anchor attachment protein 1 homolog (yeast) 1271 +/- 55 1395 +/- 75 1093 +/- 43 1152 +/- 77 -0.007848 0.2139451 0.52516 0.196772 0.9134345GPAM glycerol-3-phosphate acyltransferase, mitochondrial 1282 +/- 69 1560 +/- 140 1174 +/- 80 1164 +/- 58 -0.007966 0.1168151 -0.924631 0.1758006 0.8861056GPATC3 G patch domain containing 3 320 +/- 15 340 +/- 17 286 +/- 13 290 +/- 20 -0.011772 0.4061917 0.87391 0.2922303 0.9308755GPBP1 GC-rich promoter binding protein 1 3119 +/- 38 3284 +/- 79 2948 +/- 59 2947 +/- 102 -0.008832 0.1007156 -0.997791 0.1681871 0.276958GPD1L glycerol-3-phosphate dehydrogenase 1-like 2350 +/- 255 2199 +/- 106 1785 +/- 106 1855 +/- 97 -0.009423 -0.601597 0.636576 0.3477899 0.780757GPI glucose phosphate isomerase 6760 +/- 187 7193 +/- 293 6165 +/- 134 6432 +/- 171 -0.004869 0.2453242 0.253767 0.6267276 0.1627335GPR108 G protein-coupled receptor 108 588 +/- 34 683 +/- 48 453 +/- 18 551 +/- 40 -0.002268 0.1420679 0.071056 0.1203747 0.4435396GPR123 G protein-coupled receptor 123 901 +/- 107 822 +/- 84 415 +/- 43 466 +/- 54 -2.03E-05 -0.574612 0.483517 0.2096511 0.4761395GPR161 G protein-coupled receptor 161 343 +/- 64 227 +/- 15 188 +/- 10 151 +/- 20 -0.014845 -0.130879 -0.146649 0.1539986 0.3639722GPR17 G protein-coupled receptor 17 224 +/- 28 272 +/- 34 167 +/- 11 176 +/- 16 -0.011206 0.3069854 0.652405 0.1464185 0.6509733GPR177 G protein-coupled receptor 177 880 +/- 63 834 +/- 57 708 +/- 32 751 +/- 48 -0.008557 -0.607869 0.480375 0.7237345 0.6418846GPR178 G protein-coupled receptor 178 1121 +/- 79 1008 +/- 36 995 +/- 38 980 +/- 56 -0.04548 -0.23516 -0.835181 0.2763983 0.7669644GPR30 G protein-coupled receptor 30 152 +/- 12 174 +/- 14 119 +/- 12 130 +/- 11 -0.000254 0.2687788 0.509656 0.2010264 0.3384045GPR44 G protein-coupled receptor 44 233 +/- 18 202 +/- 21 190 +/- 13 171 +/- 16 -0.049682 -0.292564 -0.379645 0.9611111 0.8004753GPR92 G protein-coupled receptor 92 317 +/- 25 375 +/- 36 247 +/- 23 253 +/- 17 -0.004923 0.2163604 0.827466 0.0131433 0.9423623GPRASP1 G protein-coupled receptor associated sorting protein 1 4611 +/- 221 4291 +/- 243 3914 +/- 135 3833 +/- 188 -0.006149 -0.353383 -0.736575 0.1285376 0.9705996GPRASP2 G protein-coupled receptor associated sorting protein 2 5341 +/- 141 5103 +/- 227 4677 +/- 122 4541 +/- 125 -0.00044 -0.399976 -0.453759 0.1456033 0.6818846GPRC5C G protein-coupled receptor, family C, group 5, member C 245 +/- 13 255 +/- 16 183 +/- 9 174 +/- 13 -2.72E-06 0.6432329 -0.568755 0.9438822 0.8840864GPX1 glutathione peroxidase 1 2291 +/- 139 2315 +/- 137 1356 +/- 129 1223 +/- 80 -1.64E-07 0.9061546 -0.406245 0.9327754 0.9553075GPX4 glutathione peroxidase 4 (phospholipid hydroperoxidase) 7963 +/- 464 8464 +/- 561 6679 +/- 145 7234 +/- 220 -0.004326 0.507451 0.071994 0.3572032 0.2390889GRASP GRP1 (general receptor for phosphoinositides 1)-associated scaffold protein 1081 +/- 146 848 +/- 57 840 +/- 85 627 +/- 53 -0.002364 -0.183818 -0.065668 0.1136651 0.1946781GRB14 growth factor receptor-bound protein 14 789 +/- 225 1157 +/- 257 347 +/- 87 346 +/- 64 -0.002449 0.306788 -0.987917 0.297082 0.5684402GRIK1 glutamate receptor, ionotropic, kainate 1 107 +/- 11 355 +/- 42 65 +/- 9 194 +/- 15 -0.005795 0.0015561 0.000176 0.0077755 0.005943GRINL1A glutamate receptor, ionotropic, N-methyl D-aspartate-like 1A 108 +/- 11 145 +/- 23 83 +/- 9 91 +/- 7 -0.018665 0.1861878 0.486197 0.0767677 0.282887GRM3 glutamate receptor, metabotropic 3 6089 +/- 758 6114 +/- 726 3163 +/- 219 2897 +/- 273 -0.000172 0.9814705 -0.46892 0.7541802 0.8651269GRM5 Glutamate receptor, metabotropic 5 4099 +/- 219 3135 +/- 171 3523 +/- 175 2644 +/- 98 -0.054363 -0.006511 -0.00259 0.0064815 0.0858297GRN granulin 1767 +/- 125 1735 +/- 78 1562 +/- 33 1507 +/- 52 -0.011714 -0.830231 -0.402746 0.4755725 0.154468GRPEL1 GrpE-like 1, mitochondrial (E. coli) 854 +/- 38 802 +/- 45 690 +/- 34 640 +/- 41 -3.37E-06 -0.400589 -0.374876 0.5356235 0.4308289GSN gelsolin (amyloidosis, Finnish type) 4180 +/- 541 5269 +/- 560 2845 +/- 206 3577 +/- 214 -0.001124 0.1927344 0.03637 0.2336001 0.1320149GSTK1 glutathione S-transferase kappa 1 1331 +/- 123 1341 +/- 79 1107 +/- 49 1135 +/- 32 -0.004846 0.9516599 0.641679 0.6371197 0.6072014GSTO1 glutathione S-transferase omega 1 2518 +/- 351 3310 +/- 538 1226 +/- 48 1372 +/- 69 -0.000434 0.2501203 0.123916 0.4686214 0.3728452GSTO2 glutathione S-transferase omega 2 193 +/- 11 168 +/- 15 152 +/- 11 142 +/- 5 -0.015265 -0.225592 -0.426157 0.2815143 0.6030164GSTZ1 glutathione transferase zeta 1 (maleylacetoacetate isomerase) 532 +/- 57 415 +/- 37 407 +/- 38 321 +/- 36 -0.013776 -0.116965 -0.132144 0.1604297 0.5070547GTF2B general transcription factor IIB 2008 +/- 33 1910 +/- 69 1609 +/- 31 1665 +/- 27 -2.09E-05 -0.23827 0.213192 0.1330927 0.4786923GTF2H5 general transcription factor IIH, polypeptide 5 1686 +/- 106 1502 +/- 113 1400 +/- 61 1199 +/- 50 -0.002828 -0.260413 -0.030987 0.2897615 0.0226314GTPBP2 GTP binding protein 2 666 +/- 34 654 +/- 10 583 +/- 19 591 +/- 25 -0.017656 -0.747301 0.805625 0.8757073 0.8779331GUF1 GUF1 GTPase homolog (S. cerevisiae) 391 +/- 29 526 +/- 32 365 +/- 39 430 +/- 27 -0.017923 0.0116682 0.209153 0.0437322 0.3849475GUK1 guanylate kinase 1 4058 +/- 348 3405 +/- 159 3210 +/- 51 3114 +/- 124 -0.040578 -0.132199 -0.503028 0.0666274 0.1528928GUP1 GUP1 glycerol uptake/transporter homolog (S. cerevisiae) 602 +/- 64 1060 +/- 102 467 +/- 55 753 +/- 60 -0.00411 0.0046362 0.006826 0.0049883 0.0567797H1F0 H1 histone family, member 0 1586 +/- 121 1504 +/- 164 1458 +/- 52 1178 +/- 25 -0.030654 -0.696287 -0.001738 0.4357901 0.0087921H3F3B H3 histone, family 3B (H3.3B) 8142 +/- 343 8900 +/- 497 7212 +/- 297 7453 +/- 107 -0.004344 0.2417335 0.472215 0.1061159 0.4509122HADH2 hydroxyacyl-Coenzyme A dehydrogenase, type II 2567 +/- 64 2333 +/- 98 2257 +/- 48 2004 +/- 54 -4.57E-05 -0.078236 -0.007019 0.1175237 0.0859568
S2-genes differentially expressed across region.xls Page 50

Symbol Description Young CA Aged CA Young DG Aged DG CA v DG CA Y v A DG Y v A CA to PMI DG to PMIHADHA hydroxyacyl-Coenzyme A dehydrogenase/3-ketoacyl-Coenzyme A thiolase/enoyl-Coenzy 1139 +/- 62 1306 +/- 61 887 +/- 37 962 +/- 44 -0.000355 0.0832165 0.22687 0.0639413 0.2434309HADHB hydroxyacyl-Coenzyme A dehydrogenase/3-ketoacyl-Coenzyme A thiolase/enoyl-Coenzy 914 +/- 38 909 +/- 85 750 +/- 24 687 +/- 61 -0.000128 -0.951326 -0.378431 0.7439664 0.237353HADHSC L-3-hydroxyacyl-Coenzyme A dehydrogenase, short chain 894 +/- 53 981 +/- 44 674 +/- 30 650 +/- 26 -6.88E-05 0.2413289 -0.562883 0.0747124 0.8072174HAGH hydroxyacylglutathione hydrolase 3456 +/- 243 2690 +/- 123 2867 +/- 137 2258 +/- 72 -0.000327 -0.024497 -0.005119 0.0301329 0.0219011HAGHL hydroxyacylglutathione hydrolase-like 559 +/- 53 491 +/- 35 436 +/- 21 337 +/- 5 -0.000591 -0.315099 -0.004581 0.402573 0.0145572HAPLN2 hyaluronan and proteoglycan link protein 2 1664 +/- 368 1772 +/- 329 879 +/- 126 1005 +/- 169 -0.010789 0.8324099 0.565409 0.2947258 0.3034251HARSL histidyl-tRNA synthetase-like 1101 +/- 27 1110 +/- 50 988 +/- 28 1016 +/- 22 -0.0213 0.8816235 0.468098 0.8722715 0.7578004HBA1 hemoglobin, alpha 1 1624 +/- 541 843 +/- 154 896 +/- 326 696 +/- 162 -0.005345 -0.216078 -0.598393 0.1440203 0.7479856HBB hemoglobin, beta 8460 +/- 2004 4805 +/- 635 4797 +/- 1700 4794 +/- 780 -0.016388 -0.132731 -0.998774 0.0507226 0.8826689HBLD1 HESB like domain containing 1 2165 +/- 133 1995 +/- 80 1700 +/- 67 1797 +/- 92 -0.007551 -0.302842 0.417565 0.0987163 0.8563894HBP1 HMG-box transcription factor 1 1383 +/- 97 1536 +/- 117 1161 +/- 36 1145 +/- 18 -0.00361 0.3376842 -0.695255 0.112367 0.4011065HBXIP hepatitis B virus x interacting protein 3411 +/- 160 3370 +/- 81 3108 +/- 187 3119 +/- 85 -0.016891 -0.825863 0.958879 0.7114329 0.4852797HCG12 HLA complex group 12 719 +/- 49 705 +/- 36 557 +/- 26 547 +/- 20 -0.000694 -0.828325 -0.782796 0.7842467 0.782299HCN1 Hyperpolarization activated cyclic nucleotide-gated potassium channel 1 1694 +/- 66 1549 +/- 133 1568 +/- 145 1286 +/- 110 -0.035824 -0.358955 -0.157183 0.205571 0.2183205HCN3 hyperpolarization activated cyclic nucleotide-gated potassium channel 3 278 +/- 57 310 +/- 28 222 +/- 23 216 +/- 17 -0.01641 0.6280701 -0.833617 0.7440994 0.8733552HDAC11 Histone deacetylase 11 3200 +/- 431 3729 +/- 400 2319 +/- 144 2838 +/- 131 -0.009873 0.3894085 0.025646 0.2581662 0.0703184HDAC5 histone deacetylase 5 2528 +/- 173 2311 +/- 152 1656 +/- 111 1578 +/- 91 -0.000166 -0.368913 -0.597727 0.4153134 0.8951227HDAC6 histone deacetylase 6 858 +/- 46 1082 +/- 96 763 +/- 14 907 +/- 33 -0.011085 0.0726796 0.008625 0.2408406 0.0768492HDGF hepatoma-derived growth factor (high-mobility group protein 1-like) 2905 +/- 89 2801 +/- 95 2676 +/- 61 2604 +/- 36 -0.044063 -0.44341 -0.340901 0.3588285 0.7199556HDHD2 haloacid dehalogenase-like hydrolase domain containing 2 2281 +/- 128 1872 +/- 156 1738 +/- 57 1691 +/- 117 -0.000657 -0.071 -0.729736 0.0663882 0.5656462HDHD3 haloacid dehalogenase-like hydrolase domain containing 3 439 +/- 18 424 +/- 24 392 +/- 23 384 +/- 14 -0.003649 -0.620855 -0.760103 0.85028 0.6597599HECA headcase homolog (Drosophila) 2099 +/- 164 2042 +/- 81 1592 +/- 64 1621 +/- 85 -0.002568 -0.766018 0.787575 0.3553691 0.6875549HECW2 HECT, C2 and WW domain containing E3 ubiquitin protein ligase 2 1877 +/- 76 1823 +/- 130 1536 +/- 76 1304 +/- 73 -0.000251 -0.727012 -0.055461 0.6126667 0.4919653HERC1 hect (homologous to the E6-AP (UBE3A) carboxyl terminus) domain and RCC1 (CHC1)-li 3490 +/- 87 3209 +/- 99 3290 +/- 56 3128 +/- 37 -0.051693 -0.059808 -0.04215 0.0071283 0.1525603HEXB hexosaminidase B (beta polypeptide) 1326 +/- 143 1620 +/- 123 1084 +/- 68 1192 +/- 38 -0.015061 0.1511077 0.204955 0.0606865 0.2903156HEXIM1 hexamethylene bis-acetamide inducible 1 1258 +/- 39 1102 +/- 16 1185 +/- 37 1098 +/- 42 -0.018271 -0.008471 -0.155924 0.0188297 0.4940762HIAT1 hippocampus abundant transcript 1 1360 +/- 11 1519 +/- 98 1331 +/- 70 1217 +/- 57 -0.032754 0.1661196 -0.237759 0.1032789 0.435948HIATL1 hippocampus abundant transcript-like 1 1573 +/- 61 1591 +/- 95 1428 +/- 72 1495 +/- 67 -0.044455 0.8767334 0.511956 0.516753 0.5507297HIGD1B HIG1 domain family, member 1B 225 +/- 13 268 +/- 11 154 +/- 8 203 +/- 12 -2.08E-05 0.0303291 0.009653 0.0324301 0.0572933HILS1 histone linker H1 domain, spermatid-specific 1 238 +/- 37 334 +/- 64 129 +/- 13 173 +/- 19 -0.006373 0.2273874 0.101731 0.0512947 0.1278626HINT2 histidine triad nucleotide binding protein 2 2798 +/- 188 2811 +/- 104 2613 +/- 87 2583 +/- 74 -0.036827 0.9506599 -0.7998 0.8338289 0.9433845HIP1 Huntingtin interacting protein 1 758 +/- 66 935 +/- 101 589 +/- 42 657 +/- 62 -0.013073 0.1785935 0.391061 0.0841524 0.3668913HIPK2 Homeodomain interacting protein kinase 2 13628 +/- 1528 17700 +/- 1910 8772 +/- 365 10920 +/- 395 -0.001574 0.1284122 0.003367 0.0120334 0.0028744HIRIP3 HIRA interacting protein 3 668 +/- 45 749 +/- 24 617 +/- 19 655 +/- 27 -0.022473 0.1529568 0.28509 0.4466955 0.8692679HIST1H1C histone 1, H1c 322 +/- 49 360 +/- 48 220 +/- 18 248 +/- 23 -0.009955 0.5931834 0.366453 0.39816 0.5588052HIST1H2BKhistone 1, H2bk 852 +/- 177 597 +/- 60 514 +/- 33 446 +/- 26 -0.047255 -0.22033 -0.139105 0.2745184 0.215615HKR1 GLI-Kruppel family member HKR1 894 +/- 40 852 +/- 49 803 +/- 44 787 +/- 25 -0.011724 -0.521806 -0.756728 0.8266141 0.746866HLA-B major histocompatibility complex, class I, B 759 +/- 175 595 +/- 95 510 +/- 116 308 +/- 96 -0.012743 -0.433495 -0.210947 0.6054086 0.6482547HLA-DMA major histocompatibility complex, class II, DM alpha 100 +/- 12 213 +/- 26 81 +/- 17 132 +/- 17 -0.03817 0.0051739 0.062295 0.0063115 0.1378359HLA-DPA1 major histocompatibility complex, class II, DP alpha 1 242 +/- 37 469 +/- 34 224 +/- 35 351 +/- 66 -0.052627 0.0011439 0.139667 0.0230307 0.3222405HLA-DPB1 major histocompatibility complex, class II, DP beta 1 275 +/- 55 485 +/- 42 153 +/- 53 409 +/- 56 -0.000767 0.0138141 0.009355 0.1031803 0.0248301HLA-DRA major histocompatibility complex, class II, DR alpha 537 +/- 59 893 +/- 114 350 +/- 59 668 +/- 140 -0.022781 0.0254037 0.086285 0.0282195 0.3021055HLA-E major histocompatibility complex, class I, E 238 +/- 18 323 +/- 43 214 +/- 28 187 +/- 13 -0.018308 0.113861 -0.403342 0.3376283 0.5193864HMG20B high-mobility group 20B 388 +/- 20 405 +/- 23 354 +/- 12 336 +/- 14 -0.008641 0.6006965 -0.3566 0.4152061 0.4636145HMHA1 histocompatibility (minor) HA-1 162 +/- 13 218 +/- 28 125 +/- 10 148 +/- 16 -0.005266 0.114584 0.271131 0.2578326 0.8287283
S2-genes differentially expressed across region.xls Page 51

Symbol Description Young CA Aged CA Young DG Aged DG CA v DG CA Y v A DG Y v A CA to PMI DG to PMIHMOX2 heme oxygenase (decycling) 2 2412 +/- 178 2381 +/- 115 1831 +/- 94 2040 +/- 110 -0.00308 -0.888603 0.18397 0.9739114 0.3922139HNT neurotrimin 2284 +/- 104 2116 +/- 86 1684 +/- 71 1696 +/- 67 -0.000178 -0.242383 0.906694 0.2118724 0.8818579HOMER1 homer homolog 1 (Drosophila) 2901 +/- 169 2385 +/- 132 2363 +/- 91 2257 +/- 80 -0.023078 -0.038188 -0.408436 0.0448595 0.3022804HOOK2 hook homolog 2 (Drosophila) 223 +/- 21 209 +/- 15 179 +/- 17 169 +/- 16 -0.003135 -0.616496 -0.673025 0.7207212 0.7091053HRASLS3 HRAS-like suppressor 3 3691 +/- 429 4571 +/- 653 2117 +/- 93 2770 +/- 179 -0.001697 0.290076 0.017368 0.1218947 0.0152259HS1BP3 HS1-binding protein 3 323 +/- 18 374 +/- 24 190 +/- 32 362 +/- 29 -0.023458 0.1289462 0.0032 0.3309578 0.0331526HS3ST1 heparan sulfate (glucosamine) 3-O-sulfotransferase 1 585 +/- 86 446 +/- 58 300 +/- 44 255 +/- 23 -0.000237 -0.2158 -0.394184 0.121015 0.6786008HS3ST2 heparan sulfate (glucosamine) 3-O-sulfotransferase 2 330 +/- 58 411 +/- 74 170 +/- 26 146 +/- 16 -0.001058 0.4034336 -0.456095 0.5273847 0.672396HS6ST3 heparan sulfate 6-O-sulfotransferase 3 2846 +/- 592 1913 +/- 169 1347 +/- 145 1363 +/- 47 -0.022947 -0.182153 0.918908 0.0997798 0.9199959HSBP1 heat shock factor binding protein 1 4920 +/- 366 5203 +/- 167 4384 +/- 209 4328 +/- 203 -0.004956 0.5048028 -0.851416 0.2356832 0.7514638HSD11B1 hydroxysteroid (11-beta) dehydrogenase 1 182 +/- 39 214 +/- 25 78 +/- 15 136 +/- 13 -0.009558 0.5032791 0.015016 0.5861892 0.0606506HSD17B6 hydroxysteroid (17-beta) dehydrogenase 6 3312 +/- 301 2181 +/- 99 2842 +/- 167 1796 +/- 97 -0.003708 -0.011557 -0.00067 0.0240631 0.0116791HSD17B8 hydroxysteroid (17-beta) dehydrogenase 8 953 +/- 84 856 +/- 49 744 +/- 42 752 +/- 43 -0.006774 -0.351849 0.903909 0.5702645 0.8827309HSP90AB1heat shock protein 90kDa alpha (cytosolic), class B member 1 11071 +/- 195 13271 +/- 831 9909 +/- 375 10714 +/- 222 -0.006433 0.0450899 0.102338 0.1705916 0.0942842HSPA12B heat shock 70kD protein 12B 255 +/- 35 232 +/- 14 172 +/- 6 171 +/- 17 -0.006819 -0.550858 -0.952264 0.8933895 0.614376HSPB1 heat shock 27kDa protein 1 3278 +/- 248 3121 +/- 237 2296 +/- 145 2560 +/- 172 -0.002544 -0.656623 0.2722 0.8494225 0.4187507HSPB8 heat shock 22kDa protein 8 2202 +/- 213 3231 +/- 299 2037 +/- 225 2797 +/- 223 -0.014424 0.0205075 0.040316 0.0801769 0.3845944HSPBP1 hsp70-interacting protein 2962 +/- 168 2490 +/- 168 2343 +/- 76 2141 +/- 114 -0.003381 -0.074945 -0.183278 0.0120651 0.2457536HSPC142 HSPC142 protein 2272 +/- 130 2255 +/- 86 1858 +/- 67 1924 +/- 27 -0.000137 -0.916832 0.390418 0.8570846 0.2506358HSPC171 HSPC171 protein 1285 +/- 10 1228 +/- 28 1081 +/- 40 1118 +/- 47 -0.000576 -0.102422 0.565018 0.0043881 0.8704792HSPE1 heat shock 10kDa protein 1 (chaperonin 10) 3558 +/- 135 3064 +/- 138 3300 +/- 90 2930 +/- 94 -0.054454 -0.028255 -0.019469 0.0466405 0.0305899HTLF human T-cell leukemia virus enhancer factor 3074 +/- 294 3758 +/- 466 2275 +/- 114 2457 +/- 173 -0.010047 0.2475937 0.406503 0.0371805 0.4634845HVCN1 hydrogen voltage-gated channel 1 468 +/- 71 398 +/- 35 317 +/- 23 306 +/- 29 -0.030419 -0.403404 -0.773217 0.8073495 0.452806HYLS1 hydrolethalus syndrome 1 748 +/- 26 632 +/- 33 635 +/- 12 572 +/- 47 -0.002791 -0.020014 -0.253758 0.0580063 0.9635505HYPK Huntingtin interacting protein K 2194 +/- 146 2010 +/- 57 1779 +/- 84 1712 +/- 99 -0.002484 -0.282399 -0.620898 0.4431515 0.927486IAPP Islet amyloid polypeptide 535 +/- 38 484 +/- 41 411 +/- 29 428 +/- 44 -0.001318 -0.373448 0.763409 0.1390971 0.8839214ICAM3 intercellular adhesion molecule 3 168 +/- 7 185 +/- 9 159 +/- 13 159 +/- 12 -0.019841 0.1685375 0.979403 0.070669 0.5196951ID1 inhibitor of DNA binding 1, dominant negative helix-loop-helix protein 394 +/- 73 443 +/- 59 308 +/- 32 282 +/- 20 -0.002975 0.6127017 -0.500074 0.8671656 0.3788378IDE insulin-degrading enzyme 665 +/- 21 696 +/- 35 558 +/- 17 572 +/- 22 -0.000173 0.4716953 0.608086 0.1372707 0.522891IDH3B isocitrate dehydrogenase 3 (NAD+) beta 1428 +/- 48 1204 +/- 29 1103 +/- 38 1036 +/- 36 -0.00011 -0.003798 -0.233414 0.0286207 0.7010248IDH3G isocitrate dehydrogenase 3 (NAD+) gamma 2628 +/- 270 2453 +/- 134 1997 +/- 71 2177 +/- 82 -0.029348 -0.580233 0.133656 0.3381091 0.5473444IER2 immediate early response 2 599 +/- 65 576 +/- 35 507 +/- 24 470 +/- 25 -0.024213 -0.768513 -0.320357 0.7803853 0.4800627IFI16 interferon, gamma-inducible protein 16 330 +/- 19 339 +/- 20 237 +/- 14 240 +/- 21 -0.000715 0.7261972 0.890853 0.2966608 0.7748373IFI44 interferon-induced protein 44 261 +/- 30 265 +/- 25 175 +/- 21 215 +/- 19 -0.001606 0.9087625 0.194834 0.3857896 0.2358217IFIT3 interferon-induced protein with tetratricopeptide repeats 3 309 +/- 18 383 +/- 25 287 +/- 18 321 +/- 15 -0.051765 0.0397857 0.17307 0.0204367 0.3699558IFITM1 interferon induced transmembrane protein 1 (9-27) 833 +/- 79 879 +/- 83 590 +/- 60 753 +/- 89 -0.000503 0.6952804 0.17386 0.755764 0.0403564IFITM2 interferon induced transmembrane protein 2 (1-8D) 839 +/- 59 783 +/- 114 679 +/- 81 657 +/- 78 -0.00023 -0.675757 -0.850529 0.6366633 0.9723548IFNAR1 interferon (alpha, beta and omega) receptor 1 514 +/- 18 825 +/- 71 497 +/- 23 630 +/- 59 -0.027489 0.0063634 0.088126 0.0011211 0.1302925IFNGR1 interferon gamma receptor 1 1775 +/- 52 2011 +/- 102 1350 +/- 54 1527 +/- 56 -0.000166 0.0756206 0.049648 0.0313991 0.0954485IFP38 IFP38 3530 +/- 175 3705 +/- 99 3217 +/- 84 3297 +/- 106 -0.001233 0.411997 0.569433 0.6136826 0.7105462IGBP1 immunoglobulin (CD79A) binding protein 1 1965 +/- 47 2506 +/- 69 1885 +/- 71 1954 +/- 88 -0.021218 0.0001316 0.556128 0.0088608 0.3758762IGFBP4 insulin-like growth factor binding protein 4 517 +/- 34 422 +/- 31 372 +/- 29 376 +/- 25 -0.01523 -0.065764 0.918885 0.0142596 0.4116001IGFBP6 insulin-like growth factor binding protein 6 795 +/- 47 804 +/- 66 655 +/- 38 750 +/- 54 -0.0153 0.9125309 0.191107 0.255318 0.8540409IGFBP7 insulin-like growth factor binding protein 7 1047 +/- 88 816 +/- 52 766 +/- 62 678 +/- 70 -0.001545 -0.078309 -0.372074 0.0422431 0.4657143IGKC immunoglobulin kappa constant 214 +/- 51 211 +/- 12 144 +/- 11 165 +/- 19 -0.034349 -0.964313 0.372452 0.8438192 0.1970326
S2-genes differentially expressed across region.xls Page 52

Symbol Description Young CA Aged CA Young DG Aged DG CA v DG CA Y v A DG Y v A CA to PMI DG to PMIIGSF11 immunoglobulin superfamily, member 11 1835 +/- 127 2330 +/- 191 1702 +/- 60 1916 +/- 70 -0.044071 0.0602246 0.048375 0.0127626 0.0923113IGSF21 immunoglobin superfamily, member 21 2589 +/- 227 2116 +/- 77 1428 +/- 26 1159 +/- 124 -6.95E-05 -0.094198 -0.095985 0.0461055 0.0281133IGSF4 immunoglobulin superfamily, member 4 2000 +/- 94 2276 +/- 143 1619 +/- 80 1666 +/- 98 -4.65E-05 0.1427333 0.72063 0.0269001 0.4254562IKBKAP inhibitor of kappa light polypeptide gene enhancer in B-cells, kinase complex-associated p 3512 +/- 159 3207 +/- 197 3071 +/- 108 2708 +/- 98 -0.000191 -0.257208 -0.034273 0.9879113 0.3691163IL10RA interleukin 10 receptor, alpha 173 +/- 20 220 +/- 18 140 +/- 11 160 +/- 8 -0.0117 0.1100806 0.176611 0.1045609 0.2012281ILKAP integrin-linked kinase-associated serine/threonine phosphatase 2C 587 +/- 52 550 +/- 29 427 +/- 29 451 +/- 37 -0.005466 -0.552223 0.624437 0.7625935 0.5441965IMP3 IMP3, U3 small nucleolar ribonucleoprotein, homolog (yeast) 1494 +/- 106 1345 +/- 112 1151 +/- 48 1116 +/- 91 -0.00046 -0.356686 -0.744279 0.2216162 0.1764377IMP4 IMP4, U3 small nucleolar ribonucleoprotein, homolog (yeast) 525 +/- 30 464 +/- 18 434 +/- 20 444 +/- 32 -0.018635 -0.120641 0.805872 0.0058275 0.3863858INPP5F inositol polyphosphate-5-phosphatase F 7316 +/- 853 6772 +/- 702 4777 +/- 305 4323 +/- 133 -0.000705 -0.633408 -0.216146 0.5046604 0.3041385INTS4 integrator complex subunit 4 572 +/- 27 670 +/- 75 472 +/- 18 543 +/- 33 -0.005617 0.2655561 0.104248 0.0175688 0.0102469INTS8 integrator complex subunit 8 550 +/- 35 533 +/- 17 506 +/- 26 471 +/- 20 -0.01725 -0.680762 -0.319143 0.6574837 0.5907708IQGAP1 IQ motif containing GTPase activating protein 1 930 +/- 56 1158 +/- 88 871 +/- 23 882 +/- 53 -0.035868 0.0582734 0.850847 0.1777142 0.7626615IRF8 interferon regulatory factor 8 319 +/- 24 330 +/- 47 252 +/- 22 217 +/- 19 -0.006048 0.8430084 -0.25384 0.2365138 0.5420586IRS2 insulin receptor substrate 2 5710 +/- 303 5168 +/- 167 4725 +/- 171 4676 +/- 173 -0.011047 -0.156353 -0.843904 0.0887965 0.945802ISG15 ISG15 ubiquitin-like modifier 312 +/- 25 375 +/- 30 216 +/- 17 298 +/- 16 -0.001794 0.1427383 0.007132 0.1085195 0.2043022ISGF3G interferon-stimulated transcription factor 3, gamma 48kDa 643 +/- 47 741 +/- 40 580 +/- 32 592 +/- 32 -0.022285 0.1460074 0.785364 0.0443342 0.95397ISOC2 isochorismatase domain containing 2 245 +/- 16 247 +/- 20 230 +/- 13 201 +/- 10 -0.032999 0.9599469 -0.124688 0.5387185 0.1182203ITFG1 Integrin alpha FG-GAP repeat containing 1 7600 +/- 215 6251 +/- 221 6538 +/- 483 6093 +/- 241 -0.020899 -0.001403 -0.437198 0.0083954 0.6222976ITGA9 integrin, alpha 9 349 +/- 37 250 +/- 36 173 +/- 17 170 +/- 14 -7.19E-05 -0.086134 -0.900995 0.048457 0.7015164ITGB4BP integrin beta 4 binding protein 1162 +/- 72 1267 +/- 32 1073 +/- 45 1031 +/- 73 -0.007018 0.2212276 -0.641713 0.03942 0.5366645IVNS1ABP influenza virus NS1A binding protein 993 +/- 80 1097 +/- 80 745 +/- 17 848 +/- 36 -0.000147 0.3783459 0.043123 0.2703699 0.0029402JMJD1A jumonji domain containing 1A 959 +/- 56 908 +/- 41 794 +/- 33 787 +/- 38 -0.000306 -0.476108 -0.896091 0.5363759 0.7586733JMJD1B jumonji domain containing 1B 1494 +/- 105 1603 +/- 48 1306 +/- 121 1285 +/- 64 -0.000322 0.3740458 -0.883392 0.6168754 0.4767708JOSD1 Josephin domain containing 1 2148 +/- 113 1993 +/- 62 1909 +/- 91 1796 +/- 58 -0.007044 -0.265239 -0.326716 0.3934449 0.6376179JTB jumping translocation breakpoint 5670 +/- 182 5899 +/- 212 5330 +/- 174 5451 +/- 225 -0.000163 0.433297 0.682823 0.1347663 0.3245097JTV1 JTV1 gene 1612 +/- 83 1452 +/- 88 1310 +/- 38 1223 +/- 42 -9.22E-05 -0.215755 -0.160704 0.2667909 0.1489044KBTBD3 kelch repeat and BTB (POZ) domain containing 3 245 +/- 17 231 +/- 14 224 +/- 11 186 +/- 9 -0.00714 -0.559314 -0.027498 0.8803297 0.0445753KCNF1 potassium voltage-gated channel, subfamily F, member 1 1301 +/- 149 1157 +/- 130 914 +/- 59 867 +/- 82 -0.004603 -0.482317 -0.651226 0.1991061 0.6935352KCNK9 CDNA FLJ37082 fis, clone BRACE2016465 443 +/- 74 291 +/- 34 131 +/- 23 109 +/- 16 -0.000195 -0.103079 -0.451343 0.0532054 0.4321239KEAP1 kelch-like ECH-associated protein 1 1142 +/- 76 1174 +/- 47 1028 +/- 40 969 +/- 25 -0.008321 0.7272021 -0.244847 0.7175914 0.4381657KHDRBS1 KH domain containing, RNA binding, signal transduction associated 1 434 +/- 12 512 +/- 23 424 +/- 28 401 +/- 15 -0.035547 0.0168749 -0.478305 0.3175819 0.3900469KHDRBS2 KH domain containing, RNA binding, signal transduction associated 2 174 +/- 28 148 +/- 14 118 +/- 18 128 +/- 8 -0.001609 -0.442173 0.634274 0.2318912 0.6807588KIDINS220Kinase D-interacting substance of 220 kDa 221 +/- 98 520 +/- 82 208 +/- 72 376 +/- 75 -0.033925 0.0420293 0.142025 0.1127798 0.3116226KIF13B kinesin family member 13B 1459 +/- 204 1815 +/- 246 960 +/- 78 1028 +/- 71 -0.00386 0.2921502 0.536881 0.083335 0.1896473KIF1B kinesin family member 1B 9860 +/- 467 9016 +/- 271 9037 +/- 492 8493 +/- 275 -0.039808 -0.156672 -0.364326 0.4949853 0.4732774KIF3C kinesin family member 3C 5625 +/- 458 4054 +/- 161 4195 +/- 251 3767 +/- 99 -0.012429 -0.016957 -0.16042 0.0051181 0.2302338KIF5A kinesin family member 5A 2488 +/- 627 4967 +/- 527 2216 +/- 519 3839 +/- 250 -0.025483 0.0131554 0.025515 0.0698021 0.1681597KIF5C kinesin family member 5C 16153 +/- 387 17048 +/- 555 15496 +/- 754 15176 +/- 641 -0.028021 0.2185443 -0.753928 0.2349383 0.7855717KIF6 kinesin family member 6 175 +/- 12 141 +/- 19 112 +/- 8 115 +/- 10 -0.020904 -0.161401 0.824485 0.9758413 0.2624701KLC4 kinesin light chain 4 771 +/- 46 694 +/- 18 672 +/- 36 597 +/- 40 -0.002145 -0.168056 -0.195756 0.1193463 0.0819752KLF5 Kruppel-like factor 5 (intestinal) 174 +/- 48 201 +/- 58 98 +/- 21 95 +/- 20 -0.016261 0.7232551 -0.928849 0.7592427 0.7340477KLHDC2 kelch domain containing 2 4166 +/- 301 4530 +/- 181 3483 +/- 181 3652 +/- 131 -0.0002 0.3289498 0.471012 0.2628451 0.2056535KLHDC3 kelch domain containing 3 8738 +/- 505 7977 +/- 393 6742 +/- 137 6563 +/- 102 -0.000354 -0.263576 -0.321858 0.0438481 0.2491643KLHL13 kelch-like 13 (Drosophila) 604 +/- 100 498 +/- 54 385 +/- 35 394 +/- 25 -0.025034 -0.376511 0.8452 0.3114399 0.8925399KLHL17 kelch-like 17 (Drosophila) 368 +/- 27 349 +/- 13 321 +/- 16 298 +/- 17 -0.013291 -0.528632 -0.354492 0.303531 0.1302696
S2-genes differentially expressed across region.xls Page 53

Symbol Description Young CA Aged CA Young DG Aged DG CA v DG CA Y v A DG Y v A CA to PMI DG to PMIKLHL21 kelch-like 21 (Drosophila) 1952 +/- 122 1902 +/- 103 1702 +/- 32 1533 +/- 45 -0.00605 -0.762969 -0.016513 0.7908324 0.0086259KLK6 kallikrein 6 (neurosin, zyme) 1030 +/- 190 1991 +/- 422 602 +/- 104 823 +/- 47 -0.014244 0.07681 0.094055 0.0120377 0.0600326KRT17 keratin 17 472 +/- 164 400 +/- 85 125 +/- 17 128 +/- 10 -0.004346 -0.707531 0.894511 0.810175 0.9343139Kua ubiquitin-conjugating enzyme variant Kua 968 +/- 77 876 +/- 70 858 +/- 38 702 +/- 42 -0.020679 -0.400916 -0.022812 0.6755094 0.0203844LAMP1 lysosomal-associated membrane protein 1 4569 +/- 324 5261 +/- 423 3749 +/- 165 4315 +/- 199 -0.019346 0.225437 0.059178 0.1044209 0.2230529LAMP2 lysosomal-associated membrane protein 2 1002 +/- 127 1448 +/- 245 598 +/- 83 745 +/- 47 -0.00608 0.1463506 0.164417 0.0226136 0.1815686LANCL1 LanC lantibiotic synthetase component C-like 1 (bacterial) 3537 +/- 248 3724 +/- 361 2526 +/- 76 3336 +/- 364 -0.034458 0.6797791 0.089243 0.2045664 0.1855416LANCL2 LanC lantibiotic synthetase component C-like 2 (bacterial) 2838 +/- 540 2166 +/- 175 1623 +/- 103 1597 +/- 88 -0.017856 -0.280338 -0.854056 0.2394972 0.5946485LARP5 La ribonucleoprotein domain family, member 5 1526 +/- 96 1282 +/- 61 1338 +/- 49 1181 +/- 56 -0.042165 -0.062159 -0.065877 0.2175997 0.4722559LARP6 La ribonucleoprotein domain family, member 6 1822 +/- 122 1949 +/- 164 1462 +/- 121 1546 +/- 147 -0.033311 0.5508393 0.668272 0.2070976 0.6854497LASS2 LAG1 longevity assurance homolog 2 (S. cerevisiae) 1543 +/- 159 2019 +/- 247 1012 +/- 58 1354 +/- 79 -0.005517 0.1417419 0.008589 0.0146985 0.0166976LAYN layilin 174 +/- 39 137 +/- 9 89 +/- 5 120 +/- 9 -0.030574 -0.392233 0.018567 0.164778 0.2289666LCP2 lymphocyte cytosolic protein 2 (SH2 domain containing leukocyte protein of 76kDa) 200 +/- 23 250 +/- 30 148 +/- 13 171 +/- 24 -0.000379 0.2152897 0.44138 0.050337 0.1261438LDB3 LIM domain binding 3 241 +/- 39 397 +/- 60 173 +/- 29 191 +/- 12 -0.014245 0.0600527 0.571194 0.0353184 0.922557LDHA lactate dehydrogenase A 7428 +/- 363 7503 +/- 464 5839 +/- 323 6507 +/- 427 -7.99E-06 0.9005206 0.248174 0.3634801 0.9661517LDHB lactate dehydrogenase B 21336 +/- 581 20009 +/- 863 18771 +/- 407 19615 +/- 1000 -0.048622 -0.234781 0.467554 0.0687089 0.8661576LDOC1L leucine zipper, down-regulated in cancer 1-like 2517 +/- 82 2439 +/- 61 2312 +/- 80 2272 +/- 68 -0.000218 -0.463737 -0.713159 0.3506474 0.9529308LGALS1 lectin, galactoside-binding, soluble, 1 (galectin 1) 1561 +/- 151 2182 +/- 457 1000 +/- 65 1126 +/- 127 -0.001133 0.2440003 0.41052 0.5646307 0.8880205LGI3 leucine-rich repeat LGI family, member 3 1933 +/- 374 2190 +/- 318 1012 +/- 99 1060 +/- 37 -0.001907 0.6124157 0.665252 0.4292039 0.4346088LGTN ligatin 798 +/- 26 801 +/- 41 551 +/- 26 581 +/- 26 -7.4E-06 0.9444288 0.417883 0.8889981 0.5572322LHFPL3 lipoma HMGIC fusion partner-like 3 1093 +/- 129 955 +/- 73 793 +/- 54 630 +/- 52 -0.002826 -0.380638 -0.058136 0.8018992 0.119491LHPP phospholysine phosphohistidine inorganic pyrophosphate phosphatase 1897 +/- 163 2175 +/- 138 1606 +/- 105 1935 +/- 93 -0.035074 0.2232212 0.043902 0.1423172 0.2170396LIFR leukemia inhibitory factor receptor alpha 2392 +/- 272 3256 +/- 164 2200 +/- 139 2374 +/- 110 -0.023868 0.025646 0.350575 0.0182029 0.8117387LIMS1 LIM and senescent cell antigen-like domains 1 815 +/- 63 1059 +/- 110 676 +/- 38 871 +/- 66 -0.017507 0.0901478 0.040073 0.0174023 0.0048156LIN28B lin-28 homolog B (C. elegans) 158 +/- 30 129 +/- 16 60 +/- 14 54 +/- 5 -7.78E-05 -0.417165 -0.687115 0.566961 0.5086811LIN7B lin-7 homolog B (C. elegans) 1185 +/- 89 1059 +/- 44 994 +/- 42 1035 +/- 52 -0.037835 -0.246077 0.558555 0.1378564 0.6800087LIPE lipase, hormone-sensitive 641 +/- 74 906 +/- 109 439 +/- 29 475 +/- 22 -0.004068 0.0768589 0.355349 0.022113 0.3041516LITAF lipopolysaccharide-induced TNF factor 1951 +/- 250 2975 +/- 472 1460 +/- 69 1769 +/- 112 -0.014996 0.0932603 0.052765 0.0133063 0.013689LMAN2L lectin, mannose-binding 2-like 532 +/- 54 623 +/- 35 497 +/- 50 581 +/- 22 -0.047312 0.1923099 0.169516 0.1113651 0.2193227LMCD1 LIM and cysteine-rich domains 1 535 +/- 76 697 +/- 87 307 +/- 25 374 +/- 28 -0.001364 0.189184 0.10736 0.1164308 0.4521707LMO3 LIM domain only 3 (rhombotin-like 2) 9466 +/- 961 9899 +/- 747 7430 +/- 667 7767 +/- 555 -0.028017 0.7296423 0.706493 0.9104439 0.5982932LOC129285smooth muscle myosin heavy chain 11 isoform SM1-like 2168 +/- 172 2422 +/- 230 1473 +/- 60 1606 +/- 80 -0.000487 0.3998912 0.221625 0.2429813 0.021305LOC153222adult retina protein 3642 +/- 199 3900 +/- 259 3038 +/- 147 3074 +/- 77 -0.000141 0.4486248 0.831885 0.4802418 0.6970846LOC285442mitochondrial translational release factor 1-like pseudogene 834 +/- 74 851 +/- 65 706 +/- 59 744 +/- 66 -0.000782 0.8668399 0.677212 0.7024378 0.862232LOC338328high density lipoprotein-binding protein 121 +/- 14 120 +/- 25 78 +/- 6 95 +/- 15 -0.00164 -0.994323 0.341684 0.8770398 0.2069446LOC401152HCV F-transactivated protein 1 1726 +/- 109 1938 +/- 113 1345 +/- 93 1558 +/- 63 -0.000176 0.2078518 0.092326 0.2490615 0.3522363LOC84661 dpy-30-like protein 1971 +/- 93 1783 +/- 56 1614 +/- 43 1602 +/- 77 -0.000169 -0.119618 -0.897007 0.1204572 0.8002153LONRF1 LON peptidase N-terminal domain and ring finger 1 1782 +/- 86 1651 +/- 145 1231 +/- 68 1230 +/- 61 -5.1E-05 -0.458125 -0.990484 0.3359009 0.7337757LPAAT-TH lysophosphatidic acid acyltransferase theta 238 +/- 53 232 +/- 51 114 +/- 24 108 +/- 16 -0.00153 -0.939118 -0.83364 0.8852671 0.8686009LPHN3 latrophilin 3 1577 +/- 209 1274 +/- 54 1121 +/- 48 1025 +/- 80 -0.0177 -0.213786 -0.339531 0.3249337 0.7274178LRP4 low density lipoprotein receptor-related protein 4 2654 +/- 217 2898 +/- 123 2313 +/- 52 2144 +/- 59 -0.004045 0.3572511 -0.063176 0.3310908 0.0511113LRP6 low density lipoprotein receptor-related protein 6 1780 +/- 105 1710 +/- 106 1436 +/- 55 1341 +/- 57 -0.002563 -0.65083 -0.261352 0.6444996 0.1469601LRPAP1 low density lipoprotein receptor-related protein associated protein 1 2078 +/- 142 1823 +/- 50 1654 +/- 103 1679 +/- 49 -0.009176 -0.140406 0.836413 0.1308419 0.8635857LRRC1 leucine rich repeat containing 1 137 +/- 19 178 +/- 20 100 +/- 6 121 +/- 14 -0.014943 0.175425 0.219422 0.1256817 0.6373534LRRC20 leucine rich repeat containing 20 662 +/- 29 640 +/- 23 578 +/- 22 536 +/- 14 -0.001795 -0.565524 -0.150319 0.5329298 0.1103759
S2-genes differentially expressed across region.xls Page 54

Symbol Description Young CA Aged CA Young DG Aged DG CA v DG CA Y v A DG Y v A CA to PMI DG to PMILRRC32 leucine rich repeat containing 32 129 +/- 13 156 +/- 8 93 +/- 6 108 +/- 13 -0.000726 0.1021982 0.353141 0.2486034 0.3838753LRRC47 leucine rich repeat containing 47 2563 +/- 274 2433 +/- 179 2180 +/- 53 2020 +/- 78 -0.038199 -0.701014 -0.131984 0.4837557 0.0121734LRRC54 leucine rich repeat containing 54 154 +/- 32 174 +/- 20 97 +/- 17 124 +/- 11 -0.016741 0.6045747 0.214596 0.8435089 0.4677715LRRC8B leucine rich repeat containing 8 family, member B 165 +/- 19 124 +/- 18 104 +/- 13 95 +/- 16 -0.014938 -0.154948 -0.668965 0.5064695 0.5853261LRRC8C Leucine rich repeat containing 8 family, member C 232 +/- 33 400 +/- 51 193 +/- 36 225 +/- 20 -0.039294 0.0233036 0.464991 0.0011553 0.528369LRRK2 leucine-rich repeat kinase 2 281 +/- 21 330 +/- 23 245 +/- 15 258 +/- 13 -0.007971 0.1495882 0.529988 0.0860688 0.3099626LRRTM2 leucine rich repeat transmembrane neuronal 2 2543 +/- 91 2640 +/- 129 2308 +/- 69 2200 +/- 88 -0.000245 0.556089 -0.360835 0.5470758 0.7243256LSM1 LSM1 homolog, U6 small nuclear RNA associated (S. cerevisiae) 1866 +/- 40 1812 +/- 65 1690 +/- 49 1703 +/- 77 -0.008504 -0.504871 0.889677 0.1254078 0.796149LSM10 LSM10, U7 small nuclear RNA associated 1379 +/- 69 1430 +/- 27 1268 +/- 42 1360 +/- 21 -0.006979 0.5221094 0.08598 0.8484129 0.349762LSM7 LSM7 homolog, U6 small nuclear RNA associated (S. cerevisiae) 1460 +/- 112 1295 +/- 74 952 +/- 37 920 +/- 33 -3.08E-05 -0.252411 -0.545703 0.4674008 0.8706011LTB lymphotoxin beta (TNF superfamily, member 3) 150 +/- 32 249 +/- 30 143 +/- 12 161 +/- 19 -0.05276 0.0471031 0.446585 0.0280837 0.4278686LTB4DH leukotriene B4 12-hydroxydehydrogenase 163 +/- 30 136 +/- 16 81 +/- 15 87 +/- 11 -0.000898 -0.445351 0.763637 0.321739 0.8510308LTC4S leukotriene C4 synthase 236 +/- 25 314 +/- 22 201 +/- 17 191 +/- 16 -0.013328 0.0419076 -0.662254 0.0265734 0.2643918LTV1 LTV1 homolog (S. cerevisiae) 825 +/- 67 855 +/- 48 722 +/- 39 741 +/- 17 -0.029719 0.7280491 0.6765 0.8758578 0.7599985LUZP2 Leucine zipper protein 2 148 +/- 21 101 +/- 16 116 +/- 17 69 +/- 8 -0.002594 -0.10366 -0.035562 0.0774908 0.0654404LXN latexin 599 +/- 97 409 +/- 66 350 +/- 98 211 +/- 10 -0.012741 -0.141497 -0.216458 0.1632218 0.2473691LYZ lysozyme (renal amyloidosis) 354 +/- 21 541 +/- 71 247 +/- 38 330 +/- 29 -0.002236 0.045574 0.117092 0.0080013 0.1612533MAD2L1BPMAD2L1 binding protein 801 +/- 48 804 +/- 14 744 +/- 14 700 +/- 10 -0.014653 0.9520305 -0.030987 0.8433146 0.1503947MAF1 MAF1 homolog (S. cerevisiae) 1795 +/- 125 1939 +/- 131 1613 +/- 29 1593 +/- 37 -0.025973 0.4467837 -0.679652 0.4519663 0.5465594MAFB v-maf musculoaponeurotic fibrosarcoma oncogene homolog B (avian) 407 +/- 19 391 +/- 12 309 +/- 17 288 +/- 20 -9.97E-05 -0.463725 -0.456781 0.9044338 0.9732484MAN1A1 Mannosidase, alpha, class 1A, member 1 4011 +/- 616 2920 +/- 214 2376 +/- 276 2392 +/- 134 -0.037782 -0.143866 0.960428 0.1492796 0.8338358MAN2A1 Mannosidase, alpha, class 2A, member 1 1559 +/- 217 2028 +/- 286 855 +/- 94 1116 +/- 57 -0.000591 0.2219283 0.044273 0.1878816 0.1437013MAN2B1 mannosidase, alpha, class 2B, member 1 373 +/- 23 415 +/- 33 331 +/- 18 351 +/- 25 -0.005078 0.3287767 0.514351 0.4867223 0.9270466MAN2B2 mannosidase, alpha, class 2B, member 2 622 +/- 44 583 +/- 25 586 +/- 54 558 +/- 29 -0.037604 -0.453454 -0.67163 0.3663965 0.5735695MANEAL mannosidase, endo-alpha-like 2351 +/- 85 2004 +/- 64 2117 +/- 72 1985 +/- 75 -0.041567 -0.009304 -0.239499 0.0043888 0.1250339MAOA monoamine oxidase A 1504 +/- 108 1546 +/- 51 1232 +/- 100 1314 +/- 125 -0.002127 0.7371193 0.622807 0.6924609 0.6597459MAP1LC3Bmicrotubule-associated protein 1 light chain 3 beta 4795 +/- 243 5232 +/- 261 4483 +/- 110 4532 +/- 142 -0.011572 0.2487294 0.792139 0.2662723 0.9466995MAP2K5 mitogen-activated protein kinase kinase 5 569 +/- 16 605 +/- 36 481 +/- 12 468 +/- 17 -0.001265 0.3924884 -0.5345 0.2242973 0.3052941MAP3K13 Mitogen-activated protein kinase kinase kinase 13 655 +/- 36 806 +/- 40 539 +/- 37 736 +/- 36 -0.003978 0.0192338 0.004278 0.1930077 0.0880737MAP3K6 mitogen-activated protein kinase kinase kinase 6 292 +/- 47 544 +/- 98 200 +/- 27 272 +/- 34 -0.006841 0.0514709 0.136153 0.0664212 0.0156765MAP3K7IP mitogen-activated protein kinase kinase kinase 7 interacting protein 2 2168 +/- 80 2360 +/- 68 2014 +/- 52 1942 +/- 32 -0.002022 0.0969371 -0.274435 0.0601452 0.1897326MAP4 microtubule-associated protein 4 1385 +/- 222 1637 +/- 169 1048 +/- 61 1256 +/- 99 -0.047768 0.3892734 0.119411 0.4555047 0.2092243MAP4K4 mitogen-activated protein kinase kinase kinase kinase 4 1103 +/- 94 1434 +/- 119 899 +/- 30 954 +/- 55 -0.002764 0.0546811 0.40866 0.0191518 0.1934536MAP6D1 MAP6 domain containing 1 975 +/- 44 1056 +/- 109 825 +/- 77 876 +/- 64 -0.042112 0.5100763 0.617977 0.1256705 0.7458617MAPBPIP mitogen-activated protein-binding protein-interacting protein 1203 +/- 34 1132 +/- 25 984 +/- 45 1014 +/- 9 -0.002263 -0.12357 0.539067 0.0444964 0.502111MAPK6 mitogen-activated protein kinase 6 3225 +/- 189 3472 +/- 168 2883 +/- 80 3049 +/- 106 -0.024034 0.3531164 0.247569 0.4862643 0.3953045MAPRE1 microtubule-associated protein, RP/EB family, member 1 1826 +/- 135 2236 +/- 182 1327 +/- 73 1595 +/- 31 -0.000328 0.1033306 0.012844 0.0227255 0.0289238MARCH3 membrane-associated ring finger (C3HC4) 3 241 +/- 17 273 +/- 16 191 +/- 8 193 +/- 5 -0.00087 0.2060585 0.910708 0.123276 0.3711175MARCH6 membrane-associated ring finger (C3HC4) 6 1489 +/- 19 1154 +/- 34 1345 +/- 50 1122 +/- 25 -0.028684 -2.87E-05 -0.004757 0.0050401 0.0443174MARCH8 membrane-associated ring finger (C3HC4) 8 1386 +/- 109 1563 +/- 162 1150 +/- 65 1225 +/- 86 -0.031534 0.3894667 0.51011 0.2367577 0.6708436MARCKSL MARCKS-like 1 6758 +/- 771 8650 +/- 1092 4059 +/- 216 4873 +/- 366 -0.001131 0.190565 0.09974 0.1156372 0.3063554MASA E-1 enzyme 3744 +/- 190 3956 +/- 117 3375 +/- 91 3432 +/- 96 -0.005682 0.3700109 0.678661 0.4517469 0.5713322MAWBP MAWD binding protein 1195 +/- 55 1390 +/- 158 1024 +/- 61 1009 +/- 69 -0.003381 0.2860165 -0.868038 0.0310123 0.4493709MBD5 methyl-CpG binding domain protein 5 1291 +/- 137 1781 +/- 99 1091 +/- 72 1304 +/- 87 -0.00565 0.0174222 0.094876 0.0314458 0.2979001MBP myelin basic protein 267 +/- 30 382 +/- 30 198 +/- 26 233 +/- 24 -0.002067 0.0221518 0.35689 0.1632095 0.6588283
S2-genes differentially expressed across region.xls Page 55

Symbol Description Young CA Aged CA Young DG Aged DG CA v DG CA Y v A DG Y v A CA to PMI DG to PMIMCAM melanoma cell adhesion molecule 1170 +/- 212 1662 +/- 293 589 +/- 48 817 +/- 61 -0.004321 0.2075345 0.018798 0.0884724 0.0316572MCM6 MCM6 minichromosome maintenance deficient 6 (MIS5 homolog, S. pombe) (S. cerevisia 573 +/- 51 487 +/- 39 454 +/- 18 431 +/- 31 -0.002683 -0.212274 -0.542778 0.2214485 0.9865348MCOLN1 mucolipin 1 869 +/- 34 752 +/- 20 733 +/- 41 707 +/- 21 -0.001182 -0.019151 -0.582762 0.1177468 0.6944621MDH1 malate dehydrogenase 1, NAD (soluble) 16855 +/- 421 16112 +/- 725 14018 +/- 537 15178 +/- 746 -0.002053 -0.401764 0.244125 0.0795962 0.7230242MDH1B malate dehydrogenase 1B, NAD (soluble) 438 +/- 14 356 +/- 17 295 +/- 17 277 +/- 4 -0.000321 -0.004634 -0.33135 0.064732 0.4103282MDS032 uncharacterized hematopoietic stem/progenitor cells protein MDS032 676 +/- 40 751 +/- 22 602 +/- 16 590 +/- 19 -0.001719 0.1423633 -0.639749 0.1893594 0.4052906MED10 mediator of RNA polymerase II transcription, subunit 10 homolog (NUT2, S. cerevisiae) 798 +/- 37 769 +/- 26 608 +/- 25 637 +/- 42 -0.000222 -0.540207 0.565305 0.2684865 0.6725126MED11 mediator of RNA polymerase II transcription, subunit 11 homolog (S. cerevisiae) 413 +/- 31 455 +/- 22 346 +/- 14 349 +/- 16 -0.006952 0.3035423 0.908648 0.1470224 0.8164084MED19 mediator of RNA polymerase II transcription, subunit 19 homolog (S. cerevisiae) 1426 +/- 32 1306 +/- 36 1307 +/- 44 1177 +/- 45 -0.003276 -0.032648 -0.069495 0.2870689 0.2965897MED31 mediator of RNA polymerase II transcription, subunit 31 homolog (S. cerevisiae) 3069 +/- 150 2753 +/- 153 2514 +/- 53 2339 +/- 71 -0.002892 -0.171528 -0.084412 0.1931007 0.4984009MEGF10 multiple EGF-like-domains 10 775 +/- 88 1122 +/- 99 648 +/- 44 768 +/- 24 -0.025721 0.0259818 0.045696 0.0129927 0.2333869MEIS1 Meis1, myeloid ecotropic viral integration site 1 homolog (mouse) 163 +/- 28 218 +/- 24 108 +/- 10 122 +/- 11 -0.000967 0.1680677 0.371723 0.4255201 0.7907528METT10D methyltransferase 10 domain containing 191 +/- 20 242 +/- 24 146 +/- 12 174 +/- 17 -0.001511 0.1315229 0.219259 0.4735469 0.4689051MFAP1 microfibrillar-associated protein 1 1476 +/- 22 1315 +/- 35 1367 +/- 41 1252 +/- 27 -0.012697 -0.004145 -0.047852 0.0023246 0.0629694MGAT2 mannosyl (alpha-1,6-)-glycoprotein beta-1,2-N-acetylglucosaminyltransferase 777 +/- 36 680 +/- 33 664 +/- 33 568 +/- 47 -0.006424 -0.073247 -0.135121 0.3775768 0.3160081MGAT4A mannosyl (alpha-1,3-)-glycoprotein beta-1,4-N-acetylglucosaminyltransferase, isozyme A 718 +/- 63 625 +/- 39 627 +/- 15 498 +/- 51 -0.021769 -0.242402 -0.064397 0.2104359 0.055879MGC13379HSPC244 461 +/- 26 516 +/- 20 376 +/- 14 391 +/- 8 -9.49E-05 0.1287207 0.377785 0.0913592 0.7322016MGC16372CG10958-like 283 +/- 27 218 +/- 22 163 +/- 14 194 +/- 34 -0.040009 -0.096923 0.434247 0.2029161 0.3777589MGC16824esophageal cancer associated protein 765 +/- 47 860 +/- 57 683 +/- 33 683 +/- 31 -0.016935 0.2298522 0.988077 0.0974879 0.7414654MGC17330HGFL gene 1002 +/- 83 1116 +/- 59 773 +/- 36 806 +/- 48 -0.000192 0.2917969 0.600396 0.5687043 0.5161542MGC4172 short-chain dehydrogenase/reductase 870 +/- 42 789 +/- 23 813 +/- 49 709 +/- 40 -0.013958 -0.132823 -0.132952 0.2279703 0.4509919MGST2 microsomal glutathione S-transferase 2 775 +/- 83 727 +/- 54 528 +/- 50 467 +/- 19 -0.000188 -0.63898 -0.293942 0.6565622 0.6880658MICAL2 microtubule associated monoxygenase, calponin and LIM domain containing 2 3255 +/- 512 2565 +/- 156 2176 +/- 140 2192 +/- 134 -0.01536 -0.245748 0.933089 0.0991871 0.8330273MIF macrophage migration inhibitory factor (glycosylation-inhibiting factor) 7449 +/- 286 6942 +/- 382 5425 +/- 93 5531 +/- 146 -5.35E-06 -0.314916 0.557763 0.2591961 0.8384949MIF4GD MIF4G domain containing 691 +/- 34 723 +/- 49 622 +/- 29 586 +/- 34 -0.001584 0.6089853 -0.43925 0.2283763 0.9183326mimitin Myc-induced mitochondria protein 964 +/- 50 955 +/- 68 819 +/- 53 831 +/- 32 -0.008033 -0.920226 0.852593 0.7613019 0.9948019MIR16 membrane interacting protein of RGS16 117 +/- 15 140 +/- 23 72 +/- 9 98 +/- 13 -0.026688 0.4205332 0.138912 0.2024455 0.4829234MLH1 mutL homolog 1, colon cancer, nonpolyposis type 2 (E. coli) 569 +/- 45 480 +/- 41 470 +/- 32 363 +/- 16 -0.005193 -0.174971 -0.019893 0.7383671 0.0561074MNDA myeloid cell nuclear differentiation antigen 320 +/- 40 372 +/- 36 226 +/- 32 250 +/- 57 -0.008323 0.3491494 0.728875 0.1296748 0.9467625MOBP myelin-associated oligodendrocyte basic protein 3329 +/- 750 6661 +/- 1634 1660 +/- 465 3347 +/- 458 -0.029555 0.106168 0.029747 0.0163244 0.0573451MOG myelin oligodendrocyte glycoprotein 4168 +/- 662 5730 +/- 1129 2440 +/- 425 3331 +/- 467 -0.022341 0.2665493 0.193074 0.0701614 0.2461795MON2 MON2 homolog (S. cerevisiae) 810 +/- 21 895 +/- 63 735 +/- 54 696 +/- 25 -0.009129 0.2463985 -0.532529 0.0622108 0.3918161MORC4 MORC family CW-type zinc finger 4 242 +/- 15 260 +/- 30 191 +/- 15 194 +/- 13 -0.042593 0.6242526 0.850643 0.1401842 0.9475274MOSPD2 motile sperm domain containing 2 378 +/- 37 537 +/- 58 304 +/- 24 339 +/- 26 -0.01698 0.0480053 0.356208 0.001366 0.4828524MPDU1 mannose-P-dolichol utilization defect 1 988 +/- 28 918 +/- 26 917 +/- 34 890 +/- 35 -0.032858 -0.09339 -0.602937 0.0758011 0.3786318MPDZ multiple PDZ domain protein 1604 +/- 47 1759 +/- 193 1514 +/- 42 1411 +/- 75 -0.045356 0.46568 -0.272578 0.1459382 0.399132MPEG1 macrophage expressed gene 1 612 +/- 60 826 +/- 70 399 +/- 27 583 +/- 25 -0.001424 0.0432552 0.000738 0.0122355 0.0359659MPPED1 metallophosphoesterase domain containing 1 1301 +/- 175 1135 +/- 79 413 +/- 60 397 +/- 75 -1.47E-05 -0.417146 -0.866829 0.2065673 0.7765558M-RIP myosin phosphatase-Rho interacting protein 3617 +/- 157 3133 +/- 138 3127 +/- 109 2889 +/- 119 -0.019774 -0.043121 -0.177579 0.0014899 0.3564228MRPL20 mitochondrial ribosomal protein L20 2020 +/- 172 2410 +/- 102 1610 +/- 52 1867 +/- 59 -0.000857 0.0863428 0.010571 0.1739134 0.0151383MRPL22 mitochondrial ribosomal protein L22 706 +/- 20 652 +/- 26 641 +/- 17 556 +/- 21 -0.001229 -0.128265 -0.014089 0.2421444 0.2526271MRPL28 mitochondrial ribosomal protein L28 661 +/- 39 642 +/- 27 526 +/- 24 554 +/- 24 -0.002908 -0.696383 0.443053 0.2747998 0.4539893MRPL36 mitochondrial ribosomal protein L36 1273 +/- 70 1234 +/- 49 1013 +/- 33 1108 +/- 45 -0.003656 -0.661187 0.134003 0.9730805 0.2057185MRPL37 mitochondrial ribosomal protein L37 3196 +/- 166 3187 +/- 166 2627 +/- 101 2901 +/- 86 -0.003272 -0.970737 0.06926 0.2821168 0.2189765MRPL41 mitochondrial ribosomal protein L41 1938 +/- 120 1693 +/- 157 1481 +/- 38 1408 +/- 131 -0.000726 -0.245092 -0.616474 0.5279377 0.6660583
S2-genes differentially expressed across region.xls Page 56

Symbol Description Young CA Aged CA Young DG Aged DG CA v DG CA Y v A DG Y v A CA to PMI DG to PMIMRPL51 mitochondrial ribosomal protein L51 1329 +/- 87 1194 +/- 51 1081 +/- 82 1052 +/- 32 -0.000206 -0.218219 -0.755498 0.3402625 0.8628368MRPL53 mitochondrial ribosomal protein L53 2757 +/- 48 2752 +/- 123 1973 +/- 79 2085 +/- 134 -2.19E-06 -0.969825 0.49531 0.5118797 0.9462023MRPL55 mitochondrial ribosomal protein L55 1219 +/- 64 1369 +/- 79 1087 +/- 53 1194 +/- 51 -0.022585 0.1695806 0.177039 0.60038 0.4932739MRPS16 mitochondrial ribosomal protein S16 1490 +/- 80 1323 +/- 48 1292 +/- 51 1273 +/- 113 -0.041131 -0.109823 -0.880767 0.0446191 0.5076385MRPS18A mitochondrial ribosomal protein S18A 633 +/- 57 659 +/- 22 556 +/- 25 527 +/- 16 -0.010532 0.6912774 -0.356718 0.9171512 0.887213MRPS18B mitochondrial ribosomal protein S18B 1315 +/- 77 1289 +/- 70 1145 +/- 25 1180 +/- 45 -0.011096 -0.809417 0.525139 0.5904777 0.6973735MRPS26 mitochondrial ribosomal protein S26 2291 +/- 233 2175 +/- 122 1963 +/- 161 1726 +/- 114 -0.002832 -0.67152 -0.260489 0.732496 0.1979787MRPS27 mitochondrial ribosomal protein S27 1613 +/- 60 1618 +/- 99 1404 +/- 37 1535 +/- 77 -0.000628 0.9687653 0.178043 0.3215298 0.5521987MRPS28 mitochondrial ribosomal protein S28 473 +/- 28 481 +/- 26 355 +/- 22 380 +/- 13 -0.000228 0.8415485 0.350608 0.9097605 0.9486482MRPS33 mitochondrial ribosomal protein S33 2981 +/- 265 3013 +/- 172 2248 +/- 110 2590 +/- 162 -0.008836 0.9208983 0.12259 0.5991618 0.4506278MRRF mitochondrial ribosome recycling factor 420 +/- 20 360 +/- 12 352 +/- 20 323 +/- 20 -0.019024 -0.032655 -0.331146 0.0505642 0.376247MSRB2 methionine sulfoxide reductase B2 1907 +/- 249 1687 +/- 94 1639 +/- 202 1464 +/- 110 -0.002533 -0.43782 -0.47151 0.5855485 0.8323144MST150 MSTP150 529 +/- 45 464 +/- 15 467 +/- 24 407 +/- 18 -0.014356 -0.218812 -0.076499 0.404919 0.0667702MT1X metallothionein 1X 5805 +/- 490 4035 +/- 332 4142 +/- 463 3622 +/- 294 -0.003586 -0.015631 -0.370711 0.0501186 0.8429125MTG1 mitochondrial GTPase 1 homolog (S. cerevisiae) 1704 +/- 61 1474 +/- 43 1403 +/- 55 1356 +/- 42 -0.00047 -0.01262 -0.51801 0.0267037 0.549807MTHFD1L methylenetetrahydrofolate dehydrogenase (NADP+ dependent) 1-like 788 +/- 33 696 +/- 40 551 +/- 23 558 +/- 41 -0.000149 -0.107829 0.885582 0.0188315 0.8514756MTIF2 mitochondrial translational initiation factor 2 1457 +/- 95 1709 +/- 108 1346 +/- 64 1482 +/- 33 -0.025055 0.1114125 0.098167 0.1213455 0.2730887MTM1 myotubularin 1 350 +/- 14 409 +/- 32 325 +/- 20 353 +/- 7 -0.035518 0.1366969 0.248263 0.0559788 0.3139205MTMR10 myotubularin related protein 10 2416 +/- 317 2968 +/- 315 1639 +/- 68 1599 +/- 104 -0.002336 0.2449853 -0.753464 0.0741602 0.1464852MTO1 mitochondrial translation optimization 1 homolog (S. cerevisiae) 2273 +/- 147 2075 +/- 221 2012 +/- 80 2126 +/- 137 -0.030063 -0.476916 0.498153 0.2177795 0.9670432MTRR 5-methyltetrahydrofolate-homocysteine methyltransferase reductase 1842 +/- 159 1672 +/- 213 1452 +/- 108 1499 +/- 180 -0.001705 -0.538157 0.831739 0.2474989 0.6712217MTUS1 mitochondrial tumor suppressor 1 1480 +/- 263 2124 +/- 342 1103 +/- 78 1358 +/- 89 -0.031927 0.168812 0.060021 0.0389657 0.1914933MXD1 MAX dimerization protein 1 648 +/- 28 589 +/- 27 530 +/- 21 515 +/- 29 -0.00672 -0.151254 -0.700638 0.0949698 0.9202084MXI1 MAX interactor 1 6342 +/- 614 7312 +/- 652 4531 +/- 138 5071 +/- 166 -0.000504 0.3040709 0.036293 0.11012 0.0351373MYD88 myeloid differentiation primary response gene (88) 210 +/- 31 284 +/- 16 174 +/- 17 212 +/- 13 -0.010976 0.0693878 0.107125 0.0648871 0.6070201MYEOV2 myeloma overexpressed 2 11575 +/- 867 12859 +/- 629 9590 +/- 539 11808 +/- 395 -0.019511 0.2608522 0.009414 0.3886535 0.0341309MYL6 myosin, light polypeptide 6, alkali, smooth muscle and non-muscle 5381 +/- 175 5499 +/- 158 4330 +/- 103 4685 +/- 116 -1.69E-05 0.6286577 0.048931 0.9036789 0.209868MYL6B myosin, light polypeptide 6B, alkali, smooth muscle and non-muscle 3763 +/- 200 3536 +/- 211 2745 +/- 13 2729 +/- 79 -0.000354 -0.453449 -0.855573 0.3938505 0.7475447MYLIP myosin regulatory light chain interacting protein 1437 +/- 163 1322 +/- 140 795 +/- 51 733 +/- 36 -0.000221 -0.604428 -0.34735 0.8347581 0.8685184MYLK myosin, light polypeptide kinase 2425 +/- 309 3340 +/- 241 1446 +/- 132 2443 +/- 131 -0.000588 0.043083 0.000478 0.1166348 0.0693647MYO15A myosin XVA 221 +/- 48 214 +/- 41 111 +/- 19 93 +/- 23 -0.000348 -0.903975 -0.564122 0.9883616 0.8142285MYO1B myosin IB 240 +/- 40 180 +/- 30 189 +/- 25 121 +/- 13 -0.019778 -0.250919 -0.045613 0.4635443 0.0741961MYO1D myosin ID 361 +/- 48 454 +/- 93 229 +/- 32 255 +/- 22 -0.008251 0.4045427 0.519761 0.1871262 0.2287992MYO5A myosin VA (heavy polypeptide 12, myoxin) 9504 +/- 824 10302 +/- 557 8508 +/- 469 8961 +/- 216 -0.007725 0.4437191 0.409427 0.7794412 0.3378118MYO9B myosin IXB 669 +/- 94 844 +/- 90 446 +/- 24 519 +/- 35 -0.001818 0.2050871 0.131864 0.1292527 0.2400304NADSYN1 NAD synthetase 1 338 +/- 32 449 +/- 39 242 +/- 20 262 +/- 19 -0.000626 0.054237 0.498735 0.0355291 0.7809915NAGK N-acetylglucosamine kinase 848 +/- 43 849 +/- 36 683 +/- 26 643 +/- 4 -0.000131 0.9812932 -0.188269 0.6721995 0.3228093NAGPA N-acetylglucosamine-1-phosphodiester alpha-N-acetylglucosaminidase 1060 +/- 107 1025 +/- 54 924 +/- 50 826 +/- 63 -0.010452 -0.777136 -0.254905 0.3837368 0.2362316NANS N-acetylneuraminic acid synthase (sialic acid synthase) 699 +/- 66 712 +/- 64 591 +/- 15 563 +/- 25 -0.040496 0.8932018 -0.368414 0.8032002 0.8005137NAP1L1 nucleosome assembly protein 1-like 1 1463 +/- 33 1829 +/- 95 1400 +/- 79 1475 +/- 74 -0.038209 0.0102 0.499868 0.0008993 0.2561711NAP5 Nck-associated protein 5 211 +/- 31 212 +/- 27 162 +/- 11 123 +/- 8 -0.011994 0.97362 -0.021145 0.6593897 0.1115944NARF nuclear prelamin A recognition factor 560 +/- 39 505 +/- 31 498 +/- 33 455 +/- 17 -0.039852 -0.294264 -0.281931 0.1873588 0.3532489NARS asparaginyl-tRNA synthetase 6379 +/- 455 5602 +/- 434 5379 +/- 327 5287 +/- 291 -0.016749 -0.244769 -0.839001 0.0345688 0.2870676NAT12 N-acetyltransferase 12 1754 +/- 40 1710 +/- 10 1674 +/- 29 1650 +/- 39 -0.024339 -0.329531 -0.62656 0.3497704 0.5388663NCAM1 neural cell adhesion molecule 1 374 +/- 80 1218 +/- 237 262 +/- 43 746 +/- 266 -0.031607 0.014441 0.142824 0.0932677 0.5633117
S2-genes differentially expressed across region.xls Page 57

Symbol Description Young CA Aged CA Young DG Aged DG CA v DG CA Y v A DG Y v A CA to PMI DG to PMINCBP2 nuclear cap binding protein subunit 2, 20kDa 5839 +/- 503 5405 +/- 196 4023 +/- 235 4471 +/- 238 -0.000535 -0.449293 0.212522 0.493286 0.0810031NCKAP1L NCK-associated protein 1-like 212 +/- 13 256 +/- 26 173 +/- 11 197 +/- 12 -0.025597 0.1723018 0.19137 0.0092334 0.1482138NDRG1 N-myc downstream regulated gene 1 6429 +/- 896 7904 +/- 978 4264 +/- 354 5467 +/- 340 -0.011262 0.2923671 0.036858 0.1415015 0.025735NDST3 N-deacetylase/N-sulfotransferase (heparan glucosaminyl) 3 409 +/- 45 412 +/- 44 278 +/- 41 254 +/- 28 -0.001514 0.9639593 -0.648075 0.8836409 0.9246601NDST4 N-deacetylase/N-sulfotransferase (heparan glucosaminyl) 4 338 +/- 57 277 +/- 56 197 +/- 42 121 +/- 18 -0.002682 -0.463618 -0.144953 0.5303195 0.2435026NDUFA11 NADH dehydrogenase (ubiquinone) 1 alpha subcomplex, 11, 14.7kDa 1903 +/- 101 1767 +/- 114 1531 +/- 70 1620 +/- 99 -0.007971 -0.395734 0.485658 0.0912642 0.8701878NDUFA12 NADH dehydrogenase (ubiquinone) 1 alpha subcomplex, 12 6412 +/- 235 6443 +/- 448 5561 +/- 145 5666 +/- 168 -0.003403 0.9531605 0.648569 0.8220009 0.7731163NDUFA13 NADH dehydrogenase (ubiquinone) 1 alpha subcomplex, 13 8687 +/- 338 8344 +/- 348 7000 +/- 229 7571 +/- 199 -0.000509 -0.496204 0.092413 0.2781405 0.0417498NDUFA2 NADH dehydrogenase (ubiquinone) 1 alpha subcomplex, 2, 8kDa 5025 +/- 150 4531 +/- 197 4426 +/- 159 4245 +/- 198 -0.013638 -0.076187 -0.496555 0.2323814 0.2933485NDUFA3 NADH dehydrogenase (ubiquinone) 1 alpha subcomplex, 3, 9kDa 5433 +/- 483 5143 +/- 186 4163 +/- 321 4578 +/- 116 -0.013126 -0.594536 0.268405 0.58759 0.3382084NDUFA4 NADH dehydrogenase (ubiquinone) 1 alpha subcomplex, 4, 9kDa 16552 +/- 763 15922 +/- 532 13801 +/- 258 14573 +/- 339 -0.003205 -0.515137 0.10814 0.4871307 0.0164315NDUFA6 NADH dehydrogenase (ubiquinone) 1 alpha subcomplex, 6, 14kDa 1534 +/- 35 1471 +/- 53 1392 +/- 49 1332 +/- 34 -0.002868 -0.349464 -0.340639 0.2262425 0.2648731NDUFA7 NADH dehydrogenase (ubiquinone) 1 alpha subcomplex, 7, 14.5kDa 3451 +/- 140 3160 +/- 177 2509 +/- 49 2371 +/- 80 -2.53E-06 -0.227536 -0.186505 0.4181364 0.7692729NDUFB11 NADH dehydrogenase (ubiquinone) 1 beta subcomplex, 11, 17.3kDa 2865 +/- 96 2764 +/- 142 2466 +/- 71 2532 +/- 62 -0.000995 -0.567567 0.498781 0.2392619 0.6299135NDUFB2 NADH dehydrogenase (ubiquinone) 1 beta subcomplex, 2, 8kDa 2656 +/- 38 2528 +/- 107 2217 +/- 39 2426 +/- 38 -0.003763 -0.300337 0.003892 0.0102589 0.1145787NDUFB3 NADH dehydrogenase (ubiquinone) 1 beta subcomplex, 3, 12kDa 1376 +/- 67 1340 +/- 15 1233 +/- 19 1274 +/- 68 -0.044877 -0.624109 0.58888 0.7791277 0.8279813NDUFB5 NADH dehydrogenase (ubiquinone) 1 beta subcomplex, 5, 16kDa 5548 +/- 466 4759 +/- 317 4733 +/- 226 4438 +/- 426 -0.035636 -0.195699 -0.563035 0.0982054 0.160601NDUFB6 NADH dehydrogenase (ubiquinone) 1 beta subcomplex, 6, 17kDa 491 +/- 69 658 +/- 114 377 +/- 32 443 +/- 68 -0.01034 0.2446562 0.408038 0.029816 0.0384755NDUFB8 NADH dehydrogenase (ubiquinone) 1 beta subcomplex, 8, 19kDa 11769 +/- 658 13321 +/- 391 9711 +/- 250 12186 +/- 194 -0.00071 0.0763743 2.97E-05 0.311303 0.0182935NDUFB9 NADH dehydrogenase (ubiquinone) 1 beta subcomplex, 9, 22kDa 9059 +/- 465 9283 +/- 437 7901 +/- 152 8430 +/- 229 -0.004473 0.7333913 0.095287 0.9207544 0.1624003NDUFC2 NADH dehydrogenase (ubiquinone) 1, subcomplex unknown, 2, 14.5kDa 3438 +/- 105 3558 +/- 205 2851 +/- 67 3170 +/- 189 -1.17E-06 0.6167435 0.171232 0.6876896 0.5572069NDUFS4 NADH dehydrogenase (ubiquinone) Fe-S protein 4, 18kDa (NADH-coenzyme Q reductas 4066 +/- 55 3938 +/- 133 3675 +/- 70 3676 +/- 75 -0.011756 -0.401939 0.994261 0.224438 0.5738107NDUFV1 NADH dehydrogenase (ubiquinone) flavoprotein 1, 51kDa 2923 +/- 155 2506 +/- 143 2595 +/- 65 2288 +/- 108 -0.051091 -0.076226 -0.045771 0.1271505 0.2553183NECAP2 NECAP endocytosis associated 2 1224 +/- 129 1647 +/- 142 993 +/- 53 1204 +/- 15 -0.006308 0.0523344 0.009162 0.0413594 0.0504406NEDD9 neural precursor cell expressed, developmentally down-regulated 9 171 +/- 24 264 +/- 31 142 +/- 23 201 +/- 20 -0.016703 0.0430915 0.08859 0.0470127 0.0403083NEFH neurofilament, heavy polypeptide 200kDa 2571 +/- 416 2682 +/- 404 1722 +/- 165 1952 +/- 101 -0.018098 0.8512098 0.268276 0.8129419 0.298178NEK3 NIMA (never in mitosis gene a)-related kinase 3 167 +/- 28 217 +/- 6 148 +/- 21 158 +/- 9 -0.002126 0.1358206 0.658683 0.0690078 0.6219159NEK7 NIMA (never in mitosis gene a)-related kinase 7 2990 +/- 247 3754 +/- 214 2291 +/- 122 2919 +/- 48 -0.000365 0.0420786 0.002479 0.0245299 0.0114918NENF neuron derived neurotrophic factor 194 +/- 26 226 +/- 18 170 +/- 12 166 +/- 16 -0.019878 0.3457196 -0.821354 0.1771557 0.9232304NES nestin 445 +/- 71 622 +/- 83 293 +/- 42 359 +/- 34 -0.001403 0.1375265 0.25166 0.0984884 0.4228017NET1 neuroepithelial cell transforming gene 1 818 +/- 40 947 +/- 56 737 +/- 38 793 +/- 20 -0.022346 0.0953697 0.238802 0.0424955 0.1892177NETO2 neuropilin (NRP) and tolloid (TLL)-like 2 2261 +/- 64 1727 +/- 92 1797 +/- 68 1378 +/- 100 -1.76E-05 -0.001018 -0.009544 0.0059959 0.0224438NFE2L2 nuclear factor (erythroid-derived 2)-like 2 2479 +/- 133 3346 +/- 356 1953 +/- 113 2015 +/- 87 -0.004502 0.0599949 0.671825 0.0028749 0.622519NFE2L3 nuclear factor (erythroid-derived 2)-like 3 294 +/- 94 236 +/- 49 127 +/- 23 123 +/- 30 -0.044697 -0.598639 -0.920379 0.5087678 0.7486646NFKBIZ Nuclear factor of kappa light polypeptide gene enhancer in B-cells inhibitor, zeta 167 +/- 11 264 +/- 26 150 +/- 6 206 +/- 14 -0.035425 0.0112849 0.01217 0.0001388 0.0254422NGRN neugrin, neurite outgrowth associated 8356 +/- 531 7815 +/- 373 6974 +/- 247 6978 +/- 271 -0.019283 -0.426917 0.99351 0.3639453 0.9910679NIBP NIK and IKK{beta} binding protein 744 +/- 67 889 +/- 46 598 +/- 42 755 +/- 42 -0.019114 0.1096693 0.026365 0.160192 0.1644102NIFUN NifU-like N-terminal domain containing 10519 +/- 373 10858 +/- 390 9520 +/- 257 10727 +/- 229 -0.01697 0.5434208 0.00664 0.7958581 0.0285253NINJ2 ninjurin 2 672 +/- 49 990 +/- 158 361 +/- 35 494 +/- 25 -0.002231 0.1042603 0.014367 0.0107827 0.03445NIT1 nitrilase 1 692 +/- 54 611 +/- 14 607 +/- 33 558 +/- 26 -0.02054 -0.199232 -0.276493 0.2430751 0.2577545NIT2 nitrilase family, member 2 1354 +/- 75 1495 +/- 47 1151 +/- 35 1286 +/- 75 -0.00068 0.1455497 0.155469 0.0787604 0.2018773NKRF NF-kappaB repressing factor 1178 +/- 77 1360 +/- 69 1124 +/- 61 1084 +/- 52 -0.019362 0.1076942 -0.62943 0.0731064 0.9080355NKX2-2 NK2 transcription factor related, locus 2 (Drosophila) 1239 +/- 183 1408 +/- 216 872 +/- 56 902 +/- 35 -0.01107 0.5666356 0.668881 0.3541144 0.3494846NME2 non-metastatic cells 2, protein (NM23B) expressed in 9915 +/- 392 9618 +/- 216 8873 +/- 225 9524 +/- 210 -0.040218 -0.526307 0.063238 0.3844042 0.1183607NME3 non-metastatic cells 3, protein expressed in 1224 +/- 85 1346 +/- 148 1100 +/- 107 1153 +/- 204 -0.004854 0.4960717 0.8285 0.9106562 0.5549015
S2-genes differentially expressed across region.xls Page 58

Symbol Description Young CA Aged CA Young DG Aged DG CA v DG CA Y v A DG Y v A CA to PMI DG to PMINMI N-myc (and STAT) interactor 480 +/- 56 429 +/- 54 345 +/- 21 313 +/- 43 -0.01103 -0.524033 -0.530292 0.6894528 0.985168NMRAL1 NmrA-like family domain containing 1 1470 +/- 75 1003 +/- 79 1214 +/- 54 797 +/- 29 -0.000141 -0.00164 -0.000186 0.0303439 0.0085358NOLA1 nucleolar protein family A, member 1 (H/ACA small nucleolar RNPs) 834 +/- 97 901 +/- 60 761 +/- 55 717 +/- 46 -0.044875 0.5685022 -0.552782 0.3386188 0.9459478NOPE likely ortholog of mouse neighbor of Punc E11 1990 +/- 160 1901 +/- 105 1805 +/- 130 1684 +/- 49 -0.047746 -0.655182 -0.413241 0.9018591 0.7427891NOSTRIN nitric oxide synthase trafficker 107 +/- 8 126 +/- 9 91 +/- 8 86 +/- 4 -0.020274 0.1428083 -0.632002 0.0395262 0.4937208NPAT nuclear protein, ataxia-telangiectasia locus 490 +/- 15 619 +/- 32 435 +/- 15 535 +/- 41 -0.001088 0.0079427 0.071889 0.0227281 0.1146014NPC1 Niemann-Pick disease, type C1 1631 +/- 195 2450 +/- 429 909 +/- 54 1244 +/- 72 -0.003597 0.1255651 0.006001 0.0150477 0.004993NPC2 Niemann-Pick disease, type C2 3019 +/- 294 3544 +/- 283 2140 +/- 161 2387 +/- 146 -0.001404 0.2267512 0.284005 0.1434239 0.6376006NR4A1 nuclear receptor subfamily 4, group A, member 1 363 +/- 65 247 +/- 46 154 +/- 38 115 +/- 20 -8.74E-05 -0.180247 -0.38616 0.1178416 0.6747038NR4A2 nuclear receptor subfamily 4, group A, member 2 769 +/- 158 560 +/- 84 472 +/- 79 451 +/- 48 -0.047099 -0.278426 -0.826346 0.4680283 0.8414883NRF1 nuclear respiratory factor 1 180 +/- 11 223 +/- 12 164 +/- 5 186 +/- 16 -0.006482 0.0251685 0.246261 0.0249377 0.1096532NRIP1 nuclear receptor interacting protein 1 2778 +/- 469 2228 +/- 121 1966 +/- 107 1869 +/- 103 -0.038244 -0.301729 -0.529434 0.2950315 0.7692809NSD1 nuclear receptor binding SET domain protein 1 901 +/- 32 858 +/- 45 828 +/- 18 773 +/- 42 -0.027473 -0.462006 -0.278625 0.6850018 0.6727283NSMCE1 non-SMC element 1 homolog (S. cerevisiae) 1331 +/- 123 1415 +/- 177 876 +/- 51 895 +/- 122 -0.00015 0.7033895 0.888826 0.9469581 0.5854921NT5C3L 5'-nucleotidase, cytosolic III-like 1161 +/- 46 1096 +/- 101 948 +/- 60 945 +/- 59 -0.005893 -0.579072 -0.970947 0.0620936 0.5538538NTHL1 nth endonuclease III-like 1 (E. coli) 389 +/- 30 390 +/- 16 334 +/- 23 333 +/- 14 -0.013727 0.9681059 -0.996248 0.6648193 0.8282208NUAK1 NUAK family, SNF1-like kinase, 1 3806 +/- 657 4343 +/- 436 2886 +/- 286 2918 +/- 140 -0.018164 0.5135212 0.921418 0.4925862 0.5538532NUBP1 nucleotide binding protein 1 (MinD homolog, E. coli) 679 +/- 25 548 +/- 12 607 +/- 21 506 +/- 19 -0.004407 -0.002201 -0.006862 0.0254274 0.0773208NUCB1 nucleobindin 1 1411 +/- 89 1393 +/- 56 1288 +/- 74 1371 +/- 50 -0.015575 -0.872065 0.378212 0.5716614 0.5769925NUDT1 nudix (nucleoside diphosphate linked moiety X)-type motif 1 660 +/- 103 577 +/- 62 543 +/- 105 480 +/- 75 -0.01441 -0.511029 -0.636428 0.5019372 0.4903507NUDT14 nudix (nucleoside diphosphate linked moiety X)-type motif 14 619 +/- 49 467 +/- 78 535 +/- 52 434 +/- 91 -0.018479 -0.133543 -0.367287 0.051609 0.1362729NUDT16L1nudix (nucleoside diphosphate linked moiety X)-type motif 16-like 1 1200 +/- 60 1085 +/- 44 949 +/- 40 960 +/- 27 -0.001393 -0.154984 0.820666 0.2076926 0.6732427NUDT5 nudix (nucleoside diphosphate linked moiety X)-type motif 5 884 +/- 75 1105 +/- 67 672 +/- 11 954 +/- 63 -0.003564 0.0533906 0.010161 0.0942105 0.1224147NUDT9P1 nudix (nucleoside diphosphate linked moiety X)-type motif 9 pseudogene 1 172 +/- 13 232 +/- 27 116 +/- 12 148 +/- 23 -0.003603 0.0846632 0.270128 0.1281903 0.3168278NUP205 nucleoporin 205kDa 445 +/- 17 522 +/- 39 400 +/- 9 414 +/- 19 -0.01357 0.1141584 0.503183 0.1107064 0.2926634NUP98 nucleoporin 98kDa 569 +/- 31 670 +/- 43 499 +/- 29 570 +/- 13 -0.012462 0.0905121 0.060159 0.0900318 0.0618543NXPH3 neurexophilin 3 182 +/- 77 246 +/- 74 68 +/- 14 43 +/- 11 -0.009881 0.5556689 -0.201123 0.7609458 0.3045937NYREN18 NEDD8 ultimate buster-1 1202 +/- 131 1359 +/- 62 1083 +/- 43 1143 +/- 33 -0.049319 0.3153611 0.294697 0.1584412 0.0800793OACT2 O-acyltransferase (membrane bound) domain containing 2 2382 +/- 161 2359 +/- 217 1902 +/- 68 1895 +/- 91 -0.00383 -0.933936 -0.950505 0.6345297 0.7856182OAT ornithine aminotransferase (gyrate atrophy) 7034 +/- 153 7241 +/- 109 6462 +/- 50 6686 +/- 368 -0.002156 0.2995915 0.577277 0.5914579 0.7549995OBFC1 oligonucleotide/oligosaccharide-binding fold containing 1 224 +/- 12 220 +/- 22 169 +/- 11 211 +/- 12 -0.012381 -0.891075 0.028949 0.4253951 0.3264349OCA2 oculocutaneous albinism II (pink-eye dilution homolog, mouse) 224 +/- 39 164 +/- 22 175 +/- 18 148 +/- 22 -0.033424 -0.21941 -0.373784 0.1253069 0.1681369OCIAD2 OCIA domain containing 2 1106 +/- 94 912 +/- 89 801 +/- 93 910 +/- 93 -0.045137 -0.165999 0.430209 0.0451204 0.6888983OFD1 oral-facial-digital syndrome 1 747 +/- 52 782 +/- 43 690 +/- 41 664 +/- 24 -0.009098 0.6165589 -0.5857 0.362779 0.9056248OGDH oxoglutarate (alpha-ketoglutarate) dehydrogenase (lipoamide) 1659 +/- 60 1455 +/- 67 1434 +/- 34 1400 +/- 37 -0.010026 -0.045988 -0.523984 0.0404441 0.3839513OLFM3 olfactomedin 3 567 +/- 99 458 +/- 41 221 +/- 45 166 +/- 25 -0.000122 -0.343362 -0.319771 0.2686437 0.3295441OLFML2A olfactomedin-like 2A 225 +/- 17 206 +/- 13 153 +/- 12 173 +/- 12 -0.006244 -0.390797 0.261728 0.4884851 0.676613OLFML2B olfactomedin-like 2B 198 +/- 18 198 +/- 17 152 +/- 6 158 +/- 9 -0.006676 0.9872658 0.565581 0.6675167 0.3278659OLFML3 olfactomedin-like 3 953 +/- 74 970 +/- 68 745 +/- 45 686 +/- 18 -0.000902 0.8654499 -0.263746 0.5878086 0.3127015OLIG1 oligodendrocyte transcription factor 1 10505 +/- 1321 11917 +/- 1508 6389 +/- 320 7664 +/- 455 -0.002276 0.4974144 0.053366 0.2657782 0.0402461OPLAH 5-oxoprolinase (ATP-hydrolysing) 727 +/- 84 771 +/- 88 617 +/- 45 553 +/- 51 -0.010416 0.7250965 -0.37351 0.5829988 0.4664037OPRK1 opioid receptor, kappa 1 246 +/- 37 227 +/- 34 78 +/- 8 108 +/- 13 -0.000554 -0.710685 0.100116 0.3842987 0.2003617ORMDL2 ORM1-like 2 (S. cerevisiae) 365 +/- 22 344 +/- 25 270 +/- 9 290 +/- 26 -0.001703 -0.552489 0.5135 0.7526918 0.8789357OSBPL11 oxysterol binding protein-like 11 1537 +/- 69 1374 +/- 41 1376 +/- 35 1266 +/- 31 -0.011451 -0.075652 -0.044285 0.0694511 0.0146336OSBPL1A oxysterol binding protein-like 1A 5228 +/- 458 5797 +/- 389 3578 +/- 80 4173 +/- 148 -0.000969 0.3665203 0.011533 0.3098806 0.0059963
S2-genes differentially expressed across region.xls Page 59

Symbol Description Young CA Aged CA Young DG Aged DG CA v DG CA Y v A DG Y v A CA to PMI DG to PMIOSBPL3 oxysterol binding protein-like 3 336 +/- 79 263 +/- 48 202 +/- 35 165 +/- 14 -0.004859 -0.453522 -0.368408 0.5264513 0.3601188OSBPL9 oxysterol binding protein-like 9 1350 +/- 86 1500 +/- 155 981 +/- 36 1019 +/- 37 -0.000603 0.4223128 0.482898 0.3558818 0.6831957OSGEP O-sialoglycoprotein endopeptidase 459 +/- 30 536 +/- 32 410 +/- 14 486 +/- 23 -0.0199 0.11213 0.027453 0.4425687 0.0759765OSTF1 osteoclast stimulating factor 1 992 +/- 75 1259 +/- 157 723 +/- 75 891 +/- 79 -0.008483 0.1667636 0.158565 0.0311753 0.3869694OVOL2 ovo-like 2 (Drosophila) 222 +/- 74 242 +/- 63 89 +/- 11 109 +/- 27 -0.003771 0.8452813 0.522729 0.9832937 0.655419OXA1L oxidase (cytochrome c) assembly 1-like 1415 +/- 12 1313 +/- 88 1244 +/- 45 1227 +/- 46 -0.002782 -0.302886 -0.800921 0.1264329 0.8381491OXR1 oxidation resistance 1 6372 +/- 469 5445 +/- 539 4933 +/- 406 3985 +/- 371 -0.002007 -0.223875 -0.118585 0.148656 0.2086449OXSM 3-oxoacyl-ACP synthase, mitochondrial 285 +/- 30 283 +/- 19 233 +/- 24 248 +/- 15 -0.018663 -0.970132 0.625145 0.5006826 0.7032857P2RY12 purinergic receptor P2Y, G-protein coupled, 12 1248 +/- 88 1177 +/- 79 1077 +/- 48 848 +/- 66 -0.011588 -0.565026 -0.023701 0.9972657 0.0388881P8 p8 protein (candidate of metastasis 1) 397 +/- 62 578 +/- 55 378 +/- 56 493 +/- 36 -0.036934 0.0539708 0.12096 0.0367176 0.1038003PACRG PARK2 co-regulated 1071 +/- 37 1394 +/- 73 893 +/- 44 1132 +/- 74 -0.000382 0.0049231 0.028089 0.0005899 0.0063267PACSIN3 protein kinase C and casein kinase substrate in neurons 3 165 +/- 24 204 +/- 22 134 +/- 13 146 +/- 19 -0.042943 0.2563319 0.605792 0.3097612 0.4678509PAIP2 poly(A) binding protein interacting protein 2 6014 +/- 283 6884 +/- 216 5284 +/- 145 5886 +/- 240 -0.001414 0.0363882 0.070781 0.0951697 0.28479PAM peptidylglycine alpha-amidating monooxygenase 9384 +/- 821 7664 +/- 510 6095 +/- 300 5478 +/- 570 -0.000307 -0.111477 -0.374081 0.0420264 0.7853194PAOX polyamine oxidase (exo-N4-amino) 424 +/- 48 456 +/- 37 383 +/- 30 376 +/- 20 -0.035244 0.6145202 -0.847774 0.7240013 0.5500314PAPSS2 3'-phosphoadenosine 5'-phosphosulfate synthase 2 312 +/- 32 396 +/- 30 220 +/- 17 217 +/- 10 -0.000418 0.0823627 -0.874406 0.1284375 0.4088238PARP12 poly (ADP-ribose) polymerase family, member 12 112 +/- 11 143 +/- 10 92 +/- 10 84 +/- 8 -0.002556 0.0689912 -0.54295 0.0237215 0.4426224PARP14 poly (ADP-ribose) polymerase family, member 14 113 +/- 11 138 +/- 13 97 +/- 7 109 +/- 7 -0.014107 0.1627839 0.227367 0.5921469 0.707575PBX1 Pre-B-cell leukemia transcription factor 1 1716 +/- 118 2769 +/- 217 1455 +/- 111 2238 +/- 91 -0.003412 0.0029746 0.000413 0.0044114 0.0061288PCAF p300/CBP-associated factor 2476 +/- 204 3098 +/- 223 2140 +/- 50 2124 +/- 43 -0.00566 0.0667669 -0.819142 0.0062563 0.9549231PCDH10 protocadherin 10 956 +/- 148 1051 +/- 135 653 +/- 82 380 +/- 31 -0.000867 0.6474616 -0.019473 0.7187845 0.0700467PCDHA9 protocadherin alpha 9 3547 +/- 76 3268 +/- 189 3072 +/- 119 3035 +/- 114 -0.036055 -0.2163 -0.827638 0.0443213 0.679443PCDHGB6 protocadherin gamma subfamily B, 6 4504 +/- 348 5671 +/- 569 2978 +/- 131 3473 +/- 103 -0.000517 0.1168144 0.016108 0.0748677 0.0446749PCID2 PCI domain containing 2 422 +/- 26 371 +/- 24 406 +/- 11 289 +/- 11 -0.037605 -0.183262 -4.09E-05 0.0833054 0.0063696PCNP PEST proteolytic signal containing nuclear protein 4478 +/- 358 5960 +/- 334 4068 +/- 199 4741 +/- 246 -0.010461 0.0127892 0.065491 0.0062998 0.2290232PCP4L1 Purkinje cell protein 4 like 1 1327 +/- 152 1335 +/- 258 726 +/- 175 514 +/- 83 -0.000481 0.979951 -0.309747 0.5903336 0.6198512PCSK1 proprotein convertase subtilisin/kexin type 1 2563 +/- 313 2492 +/- 184 1441 +/- 236 1764 +/- 250 -0.002163 -0.850131 0.372176 0.8146939 0.4633285PCSK2 proprotein convertase subtilisin/kexin type 2 3146 +/- 220 2328 +/- 198 2601 +/- 119 2049 +/- 105 -0.013546 -0.020418 -0.006951 0.0123245 0.060491PDCD10 programmed cell death 10 2306 +/- 97 2498 +/- 84 2142 +/- 43 2106 +/- 115 -0.024685 0.1668987 -0.782766 0.1896822 0.0991738PDCD11 programmed cell death 11 478 +/- 26 501 +/- 23 398 +/- 17 429 +/- 19 -3.85E-05 0.513203 0.250095 0.714708 0.7772868PDCD8 programmed cell death 8 (apoptosis-inducing factor) 568 +/- 20 580 +/- 30 482 +/- 21 531 +/- 26 -0.032765 0.7374145 0.184882 0.8803758 0.6851928PDE4B phosphodiesterase 4B, cAMP-specific (phosphodiesterase E4 dunce homolog, Drosophila 146 +/- 33 186 +/- 30 95 +/- 9 117 +/- 10 -0.007024 0.3911785 0.137745 0.1904672 0.0449681PDE8A Phosphodiesterase 8A 844 +/- 229 1285 +/- 192 545 +/- 66 690 +/- 45 -0.010516 0.1714711 0.103609 0.0417375 0.0495444PDE9A phosphodiesterase 9A 625 +/- 72 588 +/- 32 503 +/- 39 431 +/- 16 -0.008911 -0.646916 -0.136198 0.5876266 0.4216819PDF peptide deformylase (mitochondrial) 1600 +/- 78 1639 +/- 99 1424 +/- 100 1346 +/- 26 -0.015368 0.7644762 -0.479925 0.9176751 0.8806535PDHA1 pyruvate dehydrogenase (lipoamide) alpha 1 2108 +/- 81 2051 +/- 151 1831 +/- 52 1761 +/- 167 -0.016965 -0.746885 -0.707375 0.1758669 0.2540294PDLIM2 PDZ and LIM domain 2 (mystique) 370 +/- 20 395 +/- 31 313 +/- 4 310 +/- 25 -0.001546 0.5144343 -0.893563 0.5010098 0.4315887PDRG1 p53 and DNA damage regulated 1 1527 +/- 55 1634 +/- 56 1412 +/- 56 1486 +/- 25 -0.000572 0.2006981 0.267419 0.2814875 0.3144108PDZD11 PDZ domain containing 11 2816 +/- 76 2619 +/- 92 2358 +/- 67 2227 +/- 79 -0.000108 -0.131682 -0.24046 0.1497944 0.3299025PDZRN4 PDZ domain containing RING finger 4 961 +/- 82 934 +/- 58 831 +/- 30 732 +/- 22 -0.021366 -0.790399 -0.028345 0.5257061 0.0958787PEBP4 phosphatidylethanolamine-binding protein 4 169 +/- 29 121 +/- 16 68 +/- 11 89 +/- 16 -0.005699 -0.190034 0.29898 0.0347136 0.4226273PECAM1 Platelet/endothelial cell adhesion molecule (CD31 antigen) 362 +/- 44 381 +/- 13 279 +/- 26 306 +/- 20 -0.016358 0.7042854 0.439124 0.6837403 0.6043239PECI peroxisomal D3,D2-enoyl-CoA isomerase 1599 +/- 178 1627 +/- 109 1420 +/- 126 1470 +/- 74 -0.028385 0.8957688 0.740328 0.6469807 0.7405449PEX16 peroxisomal biogenesis factor 16 681 +/- 46 699 +/- 17 620 +/- 21 649 +/- 36 -0.031751 0.7290861 0.517346 0.8018593 0.5021918PFDN1 prefoldin subunit 1 3757 +/- 69 3495 +/- 74 3517 +/- 72 3281 +/- 42 -0.02002 -0.026758 -0.022375 0.003462 0.1034135
S2-genes differentially expressed across region.xls Page 60

Symbol Description Young CA Aged CA Young DG Aged DG CA v DG CA Y v A DG Y v A CA to PMI DG to PMIPFDN2 prefoldin subunit 2 2401 +/- 84 2442 +/- 73 1814 +/- 33 1910 +/- 40 -9.22E-07 0.718541 0.101826 0.5324639 0.0593668PFDN5 prefoldin subunit 5 3533 +/- 418 4256 +/- 249 3196 +/- 420 3430 +/- 126 -0.015965 0.1746728 0.613775 0.2705479 0.9476383PFDN6 prefoldin subunit 6 2309 +/- 119 2019 +/- 59 1875 +/- 44 1786 +/- 69 -0.002889 -0.06373 -0.311792 0.1052694 0.968735PFKFB2 6-phosphofructo-2-kinase/fructose-2,6-biphosphatase 2 531 +/- 38 759 +/- 35 440 +/- 25 533 +/- 18 -0.00079 0.0013335 0.014641 0.005562 0.0135006PGAM1 phosphoglycerate mutase 1 (brain) 11785 +/- 417 13568 +/- 474 10224 +/- 320 12402 +/- 471 -0.001479 0.0183042 0.006018 0.1469321 0.0390915PGAP1 GPI deacylase 4359 +/- 249 3952 +/- 304 3230 +/- 165 2950 +/- 203 -0.000126 -0.325559 -0.315204 0.2164275 0.3399198PGRMC2 progesterone receptor membrane component 2 1541 +/- 44 1588 +/- 101 1223 +/- 49 1264 +/- 53 -0.000474 0.6787798 0.581483 0.7613088 0.9359732PHACTR3 phosphatase and actin regulator 3 1160 +/- 77 1317 +/- 94 980 +/- 47 1072 +/- 52 -0.017441 0.2261748 0.224925 0.147136 0.3561551PHB prohibitin 649 +/- 61 637 +/- 42 571 +/- 12 542 +/- 22 -0.034471 -0.871404 -0.30262 0.8334379 0.0325261PHC1 polyhomeotic-like 1 (Drosophila) 853 +/- 33 913 +/- 40 797 +/- 21 763 +/- 22 -0.013407 0.2725264 -0.297689 0.3228185 0.3129029PHCA phytoceramidase, alkaline 897 +/- 115 1163 +/- 106 725 +/- 49 780 +/- 36 -0.011577 0.119908 0.39205 0.0552162 0.570056PHF13 PHD finger protein 13 758 +/- 20 767 +/- 20 684 +/- 16 705 +/- 22 -0.000285 0.7433085 0.458934 0.6379738 0.3248581PHGDH phosphoglycerate dehydrogenase 2919 +/- 250 3311 +/- 176 2445 +/- 152 2384 +/- 122 -0.001847 0.231559 -0.761753 0.1052867 0.5845992PHKA1 Phosphorylase kinase, alpha 1 (muscle) 995 +/- 57 1071 +/- 4 849 +/- 59 924 +/- 42 -0.01196 0.2419015 0.327334 0.5001502 0.6329023PHLDA3 pleckstrin homology-like domain, family A, member 3 372 +/- 32 407 +/- 35 321 +/- 16 317 +/- 27 -0.005693 0.4766902 -0.893488 0.2156886 0.6595865PHLDB1 pleckstrin homology-like domain, family B, member 1 246 +/- 32 207 +/- 20 159 +/- 23 156 +/- 37 -0.039867 -0.339027 -0.963218 0.616177 0.5000766PHPT1 phosphohistidine phosphatase 1 2789 +/- 69 3031 +/- 99 2586 +/- 107 2786 +/- 69 -0.002696 0.0753768 0.15298 0.208543 0.6048488PHYHIPL phytanoyl-CoA 2-hydroxylase interacting protein-like 4278 +/- 428 4666 +/- 474 3197 +/- 254 3741 +/- 221 -0.00608 0.5572128 0.140476 0.7375028 0.4988666PI4K2B phosphatidylinositol 4-kinase type 2 beta 120 +/- 13 146 +/- 13 102 +/- 4 116 +/- 8 -0.006752 0.1855562 0.171197 0.0602943 0.1328526PIAS3 protein inhibitor of activated STAT, 3 677 +/- 60 752 +/- 37 547 +/- 51 545 +/- 31 -0.005598 0.3124513 -0.983924 0.2760691 0.9400962PIAS4 protein inhibitor of activated STAT, 4 424 +/- 32 442 +/- 27 370 +/- 26 349 +/- 39 -0.003322 0.6808359 -0.67535 0.5078991 0.9813771PICK1 protein interacting with PRKCA 1 578 +/- 46 694 +/- 80 480 +/- 26 562 +/- 28 -0.023275 0.2439404 0.063743 0.3895662 0.2224386PIGF phosphatidylinositol glycan, class F 1304 +/- 20 1281 +/- 57 1162 +/- 26 1211 +/- 43 -0.025344 -0.718521 0.364852 0.7980427 0.8485982PIK3AP1 phosphoinositide-3-kinase adaptor protein 1 176 +/- 27 213 +/- 17 122 +/- 10 136 +/- 16 -0.004491 0.2772138 0.508031 0.3272904 0.7934704PIK3C2A Phosphoinositide-3-kinase, class 2, alpha polypeptide 1130 +/- 44 1263 +/- 40 1085 +/- 33 1109 +/- 30 -0.003738 0.0481159 0.603829 0.0485674 0.7559619PIK3C2B phosphoinositide-3-kinase, class 2, beta polypeptide 885 +/- 57 911 +/- 93 569 +/- 31 622 +/- 33 -0.000412 0.8193608 0.270407 0.3787876 0.0631785PIK3R1 phosphoinositide-3-kinase, regulatory subunit 1 (p85 alpha) 2940 +/- 204 3517 +/- 224 2478 +/- 130 2184 +/- 153 -0.000846 0.0865263 -0.179755 0.0258247 0.4474323PIK3R3 phosphoinositide-3-kinase, regulatory subunit 3 (p55, gamma) 618 +/- 41 536 +/- 20 397 +/- 29 423 +/- 20 -0.000455 -0.112294 0.481118 0.049276 0.5690352PIK4CB phosphatidylinositol 4-kinase, catalytic, beta polypeptide 1465 +/- 48 1509 +/- 75 1268 +/- 27 1411 +/- 57 -0.033406 0.6297321 0.067029 0.2652995 0.4574089PIP5K1B phosphatidylinositol-4-phosphate 5-kinase, type I, beta 1195 +/- 134 787 +/- 70 608 +/- 59 541 +/- 13 -0.001939 -0.028873 -0.314437 0.0181839 0.2623352PIP5K3 phosphatidylinositol-3-phosphate/phosphatidylinositol 5-kinase, type III 1685 +/- 66 1442 +/- 57 1387 +/- 56 1232 +/- 71 -0.000187 -0.020366 -0.126116 0.1793597 0.222708PITPNA phosphatidylinositol transfer protein, alpha 1944 +/- 110 1824 +/- 34 1554 +/- 72 1700 +/- 62 -0.009003 -0.336495 0.157894 0.2482591 0.3897361PITPNB phosphatidylinositol transfer protein, beta 4243 +/- 114 4008 +/- 152 3325 +/- 75 3545 +/- 134 -0.000116 -0.246936 0.199195 0.0155593 0.4378877PITRM1 Pitrilysin metallopeptidase 1 1006 +/- 168 1405 +/- 240 721 +/- 69 801 +/- 48 -0.010961 0.2066023 0.364492 0.0254679 0.115179PKN1 protein kinase N1 1025 +/- 87 1327 +/- 101 952 +/- 42 1034 +/- 60 -0.051585 0.0479771 0.299131 0.1114371 0.5076743PLAC8 placenta-specific 8 299 +/- 25 311 +/- 73 160 +/- 9 212 +/- 42 -0.008282 0.8776749 0.281755 0.2507321 0.1082357PLAC9 placenta-specific 9 1835 +/- 282 1130 +/- 254 1524 +/- 212 916 +/- 172 -0.023748 -0.093037 -0.053552 0.4320796 0.3136659PLCH1 phospholipase C, eta 1 327 +/- 12 405 +/- 32 217 +/- 23 304 +/- 19 -3.84E-05 0.0581358 0.016981 0.1075869 0.099588PLCXD3 phosphatidylinositol-specific phospholipase C, X domain containing 3 1405 +/- 285 1244 +/- 206 979 +/- 108 964 +/- 202 -0.026609 -0.656499 -0.950889 0.4886636 0.3441277PLD1 phospholipase D1, phosphatidylcholine-specific 225 +/- 35 314 +/- 48 141 +/- 17 181 +/- 14 -0.008504 0.1694986 0.103033 0.0679803 0.400129PLEKHA7 pleckstrin homology domain containing, family A member 7 234 +/- 8 229 +/- 17 183 +/- 6 141 +/- 17 -0.00092 -0.774243 -0.072415 0.9105697 0.0003622PLEKHB1 pleckstrin homology domain containing, family B (evectins) member 1 6842 +/- 885 9643 +/- 1345 4705 +/- 239 6453 +/- 287 -0.01047 0.1174381 0.001452 0.0255133 0.0059289PLEKHF1 pleckstrin homology domain containing, family F (with FYVE domain) member 1 337 +/- 32 429 +/- 38 283 +/- 22 270 +/- 18 -0.003912 0.0953419 -0.667729 0.0669687 0.9679047PLEKHG1 pleckstrin homology domain containing, family G (with RhoGef domain) member 1 324 +/- 38 374 +/- 35 261 +/- 21 300 +/- 31 -0.01809 0.3621849 0.328418 0.9659273 0.9676069PLEKHH1 pleckstrin homology domain containing, family H (with MyTH4 domain) member 1 5498 +/- 891 7056 +/- 1244 2329 +/- 184 3044 +/- 221 -0.001295 0.3350938 0.037095 0.1269824 0.055862
S2-genes differentially expressed across region.xls Page 61

Symbol Description Young CA Aged CA Young DG Aged DG CA v DG CA Y v A DG Y v A CA to PMI DG to PMIPLEKHH2 pleckstrin homology domain containing, family H (with MyTH4 domain) member 2 148 +/- 20 195 +/- 19 84 +/- 7 103 +/- 7 -0.000229 0.1251707 0.093024 0.0298257 0.0670013PLEKHM2 pleckstrin homology domain containing, family M (with RUN domain) member 2 1209 +/- 132 1445 +/- 88 1020 +/- 44 987 +/- 49 -0.005401 0.172739 -0.630274 0.2787292 0.9036257PLK1 polo-like kinase 1 (Drosophila) 21403 +/- 877 23680 +/- 475 19863 +/- 1093 22695 +/- 710 -0.047931 0.0530814 0.060486 0.3501264 0.3189812PLK4 polo-like kinase 4 (Drosophila) 159 +/- 9 169 +/- 20 141 +/- 15 123 +/- 14 -0.021462 0.667746 -0.413566 0.5529981 0.4850564PLLP plasma membrane proteolipid (plasmolipin) 5475 +/- 1056 7693 +/- 1468 2458 +/- 331 3460 +/- 405 -0.004559 0.2510121 0.09102 0.0579541 0.0697138PLS3 plastin 3 (T isoform) 3006 +/- 316 3435 +/- 348 1917 +/- 119 2025 +/- 109 -0.001069 0.3829981 0.521281 0.1263417 0.4713675PLXNB3 plexin B3 457 +/- 56 453 +/- 43 384 +/- 19 316 +/- 15 -0.015855 -0.953366 -0.019454 0.6546227 0.0750267PLXNC1 plexin C1 1648 +/- 174 1573 +/- 93 1087 +/- 85 1061 +/- 49 -2.66E-05 -0.713422 -0.803315 0.7716299 0.668172PMM2 phosphomannomutase 2 886 +/- 41 829 +/- 26 670 +/- 33 687 +/- 24 -0.000342 -0.277974 0.694491 0.1618448 0.9125394PMP2 peripheral myelin protein 2 1246 +/- 290 2589 +/- 684 671 +/- 122 1112 +/- 259 -0.000848 0.1153266 0.176269 0.2347837 0.7818775PMP22 Peripheral myelin protein 22 414 +/- 67 541 +/- 45 286 +/- 24 316 +/- 42 -0.00316 0.1519767 0.563274 0.1115839 0.9803347PMPCB peptidase (mitochondrial processing) beta 2214 +/- 95 2048 +/- 139 1994 +/- 49 1865 +/- 81 -0.017456 -0.351055 -0.213294 0.4222111 0.3842492PMVK phosphomevalonate kinase 1142 +/- 76 1074 +/- 69 930 +/- 42 963 +/- 63 -0.012257 -0.517031 0.681947 0.2293754 0.9979378PNKD paroxysmal nonkinesiogenic dyskinesia 1868 +/- 146 1953 +/- 60 1610 +/- 94 1532 +/- 64 -0.013647 0.6093361 -0.507682 0.9564998 0.4677922PNMA3 paraneoplastic antigen MA3 683 +/- 71 695 +/- 53 532 +/- 44 566 +/- 30 -0.002264 0.8926914 0.542634 0.6848308 0.4307017PNOC prepronociceptin 565 +/- 80 656 +/- 158 457 +/- 42 393 +/- 33 -0.036304 0.6197071 -0.260369 0.7072795 0.4112155POLA polymerase (DNA directed), alpha 420 +/- 30 480 +/- 34 376 +/- 13 382 +/- 11 -0.008573 0.2145296 0.736805 0.045781 0.4126258POLE4 polymerase (DNA-directed), epsilon 4 (p12 subunit) 2611 +/- 103 2205 +/- 69 2073 +/- 57 2027 +/- 37 -0.004837 -0.009911 -0.52405 0.0030335 0.945593POLR2G polymerase (RNA) II (DNA directed) polypeptide G 1501 +/- 46 1883 +/- 158 1045 +/- 54 1288 +/- 36 -0.000348 0.0603422 0.005367 0.0213566 0.0389687POLR2I polymerase (RNA) II (DNA directed) polypeptide I, 14.5kDa 4116 +/- 295 4115 +/- 205 3411 +/- 135 3674 +/- 92 -0.001498 -0.998633 0.143612 0.883904 0.1430231POLR2L polymerase (RNA) II (DNA directed) polypeptide L, 7.6kDa 2034 +/- 162 1876 +/- 118 1448 +/- 68 1615 +/- 80 -0.003944 -0.453163 0.150771 0.5519555 0.1040439POMGNT1 protein O-linked mannose beta1,2-N-acetylglucosaminyltransferase 1662 +/- 85 1667 +/- 87 1300 +/- 31 1268 +/- 36 -2.09E-05 0.9681029 -0.516174 0.5687295 0.7351611POP5 processing of precursor 5, ribonuclease P/MRP subunit (S. cerevisiae) 1675 +/- 44 1502 +/- 87 1357 +/- 28 1271 +/- 48 -0.000971 -0.116937 -0.175332 0.0366651 0.1180031POU3F1 POU domain, class 3, transcription factor 1 5136 +/- 1055 4008 +/- 595 1167 +/- 451 1031 +/- 340 -0.000846 -0.379267 -0.815739 0.3774895 0.8810302PPA1 pyrophosphatase (inorganic) 1 225 +/- 22 258 +/- 18 214 +/- 15 177 +/- 24 -0.020726 0.2716038 -0.229216 0.2539245 0.5310344PPAP2B phosphatidic acid phosphatase type 2B 2720 +/- 167 3718 +/- 213 2634 +/- 127 2728 +/- 239 -0.040275 0.0045712 0.74131 0.0631569 0.390909PPAP2C phosphatidic acid phosphatase type 2C 847 +/- 150 1265 +/- 223 430 +/- 69 630 +/- 61 -0.006536 0.154889 0.057659 0.091321 0.1818752PPIB peptidylprolyl isomerase B (cyclophilin B) 2898 +/- 79 2835 +/- 89 2361 +/- 89 2393 +/- 73 -0.000109 -0.613527 0.788278 0.7390331 0.6261293PPIL3 peptidylprolyl isomerase (cyclophilin)-like 3 1204 +/- 34 1212 +/- 75 1026 +/- 46 1101 +/- 64 -0.015401 0.9220126 0.367322 0.5921788 0.7064592PPM1A protein phosphatase 1A (formerly 2C), magnesium-dependent, alpha isoform 2547 +/- 67 2757 +/- 109 2340 +/- 81 2452 +/- 119 -0.009462 0.1379245 0.459524 0.4371068 0.6589125PPM1B protein phosphatase 1B (formerly 2C), magnesium-dependent, beta isoform 2968 +/- 253 3629 +/- 258 2741 +/- 80 2996 +/- 47 -0.046699 0.0972619 0.02543 0.0367724 0.0098338PPM1K protein phosphatase 1K (PP2C domain containing) 4521 +/- 377 5333 +/- 379 3697 +/- 191 3990 +/- 155 -0.001511 0.1593614 0.26444 0.0447384 0.3057373PPM1M protein phosphatase 1M (PP2C domain containing) 291 +/- 33 281 +/- 13 182 +/- 6 226 +/- 25 -0.006166 -0.795166 0.161232 0.6497394 0.2206157PPME1 protein phosphatase methylesterase 1 2999 +/- 69 2959 +/- 132 2515 +/- 61 2564 +/- 44 -0.00063 -0.79469 0.539665 0.1788383 0.4715651PPP1R14Aprotein phosphatase 1, regulatory (inhibitor) subunit 14A 6747 +/- 1060 8514 +/- 1392 3565 +/- 165 5136 +/- 704 -0.006314 0.3377909 0.088662 0.138628 0.1075956PPP2R1B protein phosphatase 2 (formerly 2A), regulatory subunit A (PR 65), beta isoform 287 +/- 19 260 +/- 12 100 +/- 26 121 +/- 16 -1.07E-05 -0.24549 0.515692 0.3272793 0.2972862PPP2R2C protein phosphatase 2 (formerly 2A), regulatory subunit B (PR 52), gamma isoform 1920 +/- 87 1787 +/- 75 1505 +/- 116 1415 +/- 120 -0.000321 -0.275206 -0.604954 0.1711659 0.7534965PPP2R2D protein phosphatase 2, regulatory subunit B, delta isoform 1244 +/- 31 1237 +/- 39 1121 +/- 49 1173 +/- 32 -0.004433 -0.892091 0.403892 0.9857067 0.3778994PPP2R3A protein phosphatase 2 (formerly 2A), regulatory subunit B'', alpha 964 +/- 135 1257 +/- 136 776 +/- 33 834 +/- 46 -0.009557 0.1567783 0.332014 0.0381379 0.5770586PPP2R5C protein phosphatase 2, regulatory subunit B (B56), gamma isoform 1380 +/- 94 967 +/- 75 1220 +/- 33 860 +/- 51 -0.02482 -0.006726 -0.000553 0.1080542 0.0232061PPP3CB protein phosphatase 3 (formerly 2B), catalytic subunit, beta isoform (calcineurin A beta) 15152 +/- 1195 12631 +/- 714 12302 +/- 318 11683 +/- 323 -0.038687 -0.106985 -0.205682 0.0930427 0.2706447PPP4R1 protein phosphatase 4, regulatory subunit 1 635 +/- 45 605 +/- 39 538 +/- 21 525 +/- 28 -0.006451 -0.618645 -0.718113 0.7170786 0.655908PPP6C protein phosphatase 6, catalytic subunit 1759 +/- 55 1718 +/- 73 1502 +/- 42 1527 +/- 77 -0.001254 -0.662141 0.789272 0.9256708 0.2989036PQLC3 PQ loop repeat containing 3 422 +/- 15 400 +/- 47 254 +/- 11 298 +/- 12 -0.000134 -0.674626 0.023289 0.696103 0.3334257PRDX4 peroxiredoxin 4 801 +/- 39 830 +/- 38 686 +/- 17 724 +/- 27 -0.000375 0.5977847 0.260903 0.2923476 0.1129491
S2-genes differentially expressed across region.xls Page 62

Symbol Description Young CA Aged CA Young DG Aged DG CA v DG CA Y v A DG Y v A CA to PMI DG to PMIPRDX5 peroxiredoxin 5 3941 +/- 95 3412 +/- 66 3326 +/- 71 3314 +/- 37 -0.008912 -0.0014 -0.885484 0.0020949 0.9175833PRG1 proteoglycan 1, secretory granule 1662 +/- 87 2134 +/- 206 1240 +/- 135 1457 +/- 182 -0.002262 0.0739621 0.368565 0.0304929 0.4925677PRIMA1 proline rich membrane anchor 1 564 +/- 83 750 +/- 125 309 +/- 30 390 +/- 40 -0.004927 0.2483317 0.147625 0.1831599 0.4877595PRKACB protein kinase, cAMP-dependent, catalytic, beta 495 +/- 144 444 +/- 88 237 +/- 41 214 +/- 32 -0.006964 -0.76968 -0.658152 0.8831969 0.8845366PRKCB1 Protein kinase C, beta 1 2174 +/- 618 1285 +/- 104 803 +/- 83 774 +/- 98 -0.016372 -0.211927 -0.824718 0.1741265 0.972401PRKCH protein kinase C, eta 181 +/- 18 255 +/- 18 129 +/- 12 131 +/- 19 -0.000728 0.0168632 0.943452 0.1302874 0.8546068PRKCQ protein kinase C, theta 608 +/- 116 724 +/- 105 467 +/- 37 538 +/- 25 -0.031235 0.4760915 0.149647 0.1796332 0.0166771PRKCSH protein kinase C substrate 80K-H 919 +/- 125 1252 +/- 183 631 +/- 105 794 +/- 20 -0.001559 0.1684318 0.18489 0.1086474 0.1416255PRKCZ protein kinase C, zeta 5442 +/- 328 5041 +/- 226 4396 +/- 91 4519 +/- 86 -0.007149 -0.340031 0.35279 0.1430127 0.2503548PRMT3 protein arginine methyltransferase 3 829 +/- 57 689 +/- 73 680 +/- 25 559 +/- 59 -0.002615 -0.163433 -0.11103 0.5221687 0.2510679PRMT5 protein arginine methyltransferase 5 1041 +/- 31 1003 +/- 41 873 +/- 16 910 +/- 28 -0.000445 -0.485184 0.297004 0.1595882 0.8973365PRMT8 protein arginine methyltransferase 8 282 +/- 50 232 +/- 24 142 +/- 18 151 +/- 19 -0.002489 -0.396408 0.7377 0.1623122 0.9718183PROM1 prominin 1 550 +/- 67 570 +/- 64 325 +/- 23 328 +/- 33 -0.000107 0.8312817 0.934858 0.2893773 0.3443635PROS1 protein S (alpha) 774 +/- 108 426 +/- 28 473 +/- 63 375 +/- 23 -0.044059 -0.022169 -0.190453 0.0335408 0.2462449PRPF4 PRP4 pre-mRNA processing factor 4 homolog (yeast) 512 +/- 6 550 +/- 18 463 +/- 9 479 +/- 12 -0.001825 0.0967279 0.301007 0.4445516 0.733277PRPF8 PRP8 pre-mRNA processing factor 8 homolog (S. cerevisiae) 3050 +/- 162 3083 +/- 68 2898 +/- 94 2801 +/- 62 -0.020731 0.8538068 -0.410641 0.8894511 0.671097PRPS2 phosphoribosyl pyrophosphate synthetase 2 1966 +/- 106 1443 +/- 29 1604 +/- 58 1369 +/- 46 -0.02071 -0.003525 -0.011978 0.0015139 0.084104PRR13 proline rich 13 3251 +/- 117 3856 +/- 164 2723 +/- 24 3074 +/- 150 -0.000652 0.0147229 0.079234 0.0860497 0.1849899PRRG1 proline rich Gla (G-carboxyglutamic acid) 1 909 +/- 109 1222 +/- 166 601 +/- 15 713 +/- 29 -0.004497 0.149903 0.01455 0.0265939 0.0612018PRSS15 protease, serine, 15 878 +/- 21 844 +/- 21 741 +/- 29 658 +/- 38 -0.000308 -0.288104 -0.118514 0.1803022 0.404888PSCD1 pleckstrin homology, Sec7 and coiled-coil domains 1(cytohesin 1) 542 +/- 28 648 +/- 46 410 +/- 24 447 +/- 23 -0.000233 0.0876713 0.282194 0.0474065 0.1952757PSCD4 pleckstrin homology, Sec7 and coiled-coil domains 4 213 +/- 21 291 +/- 13 199 +/- 18 202 +/- 16 -0.035829 0.012288 0.924077 0.0949477 0.4844499PSEN2 presenilin 2 (Alzheimer disease 4) 1262 +/- 63 1124 +/- 22 865 +/- 40 903 +/- 38 -0.000224 -0.083931 0.506342 0.1731793 0.5550119PSENEN presenilin enhancer 2 homolog (C. elegans) 1358 +/- 137 1479 +/- 87 974 +/- 44 1110 +/- 105 -0.000912 0.4784512 0.281797 0.2749988 0.0857524PSMA2 proteasome (prosome, macropain) subunit, alpha type, 2 1231 +/- 39 1139 +/- 46 1017 +/- 44 912 +/- 20 -5.25E-05 -0.15732 -0.068328 0.524044 0.3395444PSMA7 proteasome (prosome, macropain) subunit, alpha type, 7 11663 +/- 491 10451 +/- 417 10379 +/- 187 9857 +/- 468 -0.033198 -0.09008 -0.344795 0.2060846 0.6007155PSMB10 proteasome (prosome, macropain) subunit, beta type, 10 568 +/- 63 536 +/- 23 443 +/- 82 399 +/- 28 -0.000222 -0.652532 -0.632334 0.3580461 0.3530405PSMB4 proteasome (prosome, macropain) subunit, beta type, 4 3705 +/- 115 3631 +/- 124 3280 +/- 73 3573 +/- 83 -0.020303 -0.669068 0.027907 0.9954379 0.0416578PSMB9 proteasome (prosome, macropain) subunit, beta type, 9 (large multifunctional peptidase 2 262 +/- 10 349 +/- 12 233 +/- 6 295 +/- 8 -0.001327 0.0002752 0.000367 0.0088962 0.033051PSMC3 proteasome (prosome, macropain) 26S subunit, ATPase, 3 1589 +/- 109 1605 +/- 70 1331 +/- 76 1442 +/- 85 -0.00218 0.9051648 0.357346 0.5546138 0.4551318PSMD4 proteasome (prosome, macropain) 26S subunit, non-ATPase, 4 2476 +/- 113 2897 +/- 73 2016 +/- 75 2132 +/- 95 -1.49E-05 0.0127068 0.364098 0.0997047 0.5086628PSMD7 proteasome (prosome, macropain) 26S subunit, non-ATPase, 7 (Mov34 homolog) 2889 +/- 47 2710 +/- 85 2591 +/- 69 2534 +/- 58 -0.006381 -0.101669 -0.545845 0.1067665 0.9168746PSME1 proteasome (prosome, macropain) activator subunit 1 (PA28 alpha) 1517 +/- 84 1712 +/- 77 1341 +/- 45 1539 +/- 108 -0.005046 0.1185632 0.147611 0.4206797 0.8360293PSME4 proteasome (prosome, macropain) activator subunit 4 639 +/- 35 600 +/- 46 499 +/- 11 506 +/- 27 -0.00095 -0.520907 0.818529 0.7408671 0.7653912PSPC1 paraspeckle component 1 4137 +/- 535 3110 +/- 267 3353 +/- 193 2357 +/- 289 -0.016884 -0.127704 -0.023391 0.5110806 0.1583018PSTPIP1 proline-serine-threonine phosphatase interacting protein 1 194 +/- 23 195 +/- 15 156 +/- 13 126 +/- 14 -0.009109 0.9586673 -0.140863 0.8420173 0.5030265PTBP1 polypyrimidine tract binding protein 1 992 +/- 109 1105 +/- 62 800 +/- 34 778 +/- 23 -0.002971 0.3957911 -0.60763 0.1908457 0.6374071PTD008 PTD008 protein 3390 +/- 189 3387 +/- 145 2765 +/- 160 2918 +/- 72 -2.04E-05 -0.989725 0.413223 0.7063254 0.4441046PTDSR phosphatidylserine receptor 654 +/- 24 621 +/- 28 512 +/- 21 470 +/- 15 -1.87E-05 -0.393163 -0.140472 0.8405425 0.3571908PTGDS prostaglandin D2 synthase 21kDa (brain) 22511 +/- 2273 24357 +/- 1112 18690 +/- 1056 21104 +/- 809 -0.006496 0.4885458 0.103668 0.6344669 0.5541901PTGFRN prostaglandin F2 receptor negative regulator 649 +/- 71 794 +/- 81 506 +/- 45 509 +/- 18 -0.003843 0.2064427 0.962011 0.1855553 0.9433773PTK9 PTK9 protein tyrosine kinase 9 2570 +/- 54 2776 +/- 132 2429 +/- 75 2488 +/- 79 -0.006942 0.1926692 0.597621 0.0710839 0.4014532PTPDC1 protein tyrosine phosphatase domain containing 1 715 +/- 75 923 +/- 154 399 +/- 37 491 +/- 31 -0.003478 0.2621752 0.088951 0.0680314 0.1366069PTPLAD2 protein tyrosine phosphatase-like A domain containing 2 114 +/- 22 191 +/- 25 74 +/- 9 99 +/- 11 -0.003222 0.0418422 0.112482 0.0235631 0.4311144PTPN18 protein tyrosine phosphatase, non-receptor type 18 (brain-derived) 1028 +/- 71 941 +/- 68 849 +/- 67 853 +/- 46 -0.009359 -0.396585 0.9586 0.2677889 0.8432134
S2-genes differentially expressed across region.xls Page 63

Symbol Description Young CA Aged CA Young DG Aged DG CA v DG CA Y v A DG Y v A CA to PMI DG to PMIPTPRB protein tyrosine phosphatase, receptor type, B 193 +/- 17 229 +/- 15 142 +/- 9 176 +/- 12 -0.000313 0.1467456 0.053789 0.1643753 0.1592827PTPRD Protein tyrosine phosphatase, receptor type, D 3412 +/- 455 4494 +/- 451 2387 +/- 204 2839 +/- 148 -0.000604 0.1221485 0.107674 0.0948477 0.1160613PTPRR protein tyrosine phosphatase, receptor type, R 696 +/- 106 733 +/- 94 607 +/- 43 552 +/- 47 -0.039739 0.799284 -0.416032 0.7429474 0.1852475PVALB parvalbumin 391 +/- 24 469 +/- 50 287 +/- 22 418 +/- 28 -0.020259 0.1995472 0.005842 0.5771577 0.0334362PXDN peroxidasin homolog (Drosophila) 225 +/- 13 204 +/- 15 193 +/- 18 161 +/- 10 -0.011688 -0.313093 -0.155814 0.1028608 0.0343556PXMP2 peroxisomal membrane protein 2, 22kDa 919 +/- 52 996 +/- 33 853 +/- 37 825 +/- 30 -0.020738 0.2433881 -0.565953 0.276982 0.2095274PYGB phosphorylase, glycogen; brain 3155 +/- 246 3198 +/- 255 2648 +/- 110 2428 +/- 67 -0.004464 0.9060542 -0.125182 0.8293315 0.1089386PYGL phosphorylase, glycogen; liver (Hers disease, glycogen storage disease type VI) 160 +/- 29 223 +/- 46 112 +/- 15 126 +/- 25 -0.005056 0.2807569 0.648166 0.0228758 0.0863138PYGM phosphorylase, glycogen; muscle (McArdle syndrome, glycogen storage disease type V) 1609 +/- 210 1777 +/- 111 1318 +/- 107 1540 +/- 79 -0.011448 0.5008947 0.129767 0.6130123 0.3472768PYGO2 pygopus homolog 2 (Drosophila) 1108 +/- 143 1141 +/- 41 936 +/- 75 841 +/- 25 -0.015185 0.8329628 -0.274444 0.7454591 0.4034806QARS glutaminyl-tRNA synthetase 1311 +/- 57 1292 +/- 43 950 +/- 17 929 +/- 22 -1.44E-06 -0.801316 -0.458587 0.7941832 0.5468403R3HDM2 R3H domain containing 2 3854 +/- 202 3846 +/- 224 3526 +/- 89 3218 +/- 156 -0.020388 -0.980525 -0.134115 0.8413577 0.7046981RAB11FIP4RAB11 family interacting protein 4 (class II) 4018 +/- 291 4087 +/- 199 3007 +/- 99 3075 +/- 162 -6.13E-05 0.8497989 0.730535 0.9145243 0.2969427RAB1A RAB1A, member RAS oncogene family 992 +/- 40 1101 +/- 51 862 +/- 26 897 +/- 34 -0.003979 0.1281371 0.44462 0.0674852 0.7252461RAB27B RAB27B, member RAS oncogene family 2145 +/- 133 1839 +/- 265 1389 +/- 162 1287 +/- 126 -0.000315 -0.334554 -0.632606 0.0790225 0.6702685RAB32 RAB32, member RAS oncogene family 198 +/- 18 242 +/- 23 137 +/- 8 201 +/- 18 -0.000716 0.1654716 0.020572 0.1703733 0.1214088RAB35 RAB35, member RAS oncogene family 778 +/- 29 811 +/- 19 718 +/- 14 670 +/- 5 -0.001143 0.3674905 -0.015566 0.5906463 0.0883262RAB3GAP2RAB3 GTPase activating protein subunit 2 (non-catalytic) 2868 +/- 148 3105 +/- 104 2399 +/- 77 2721 +/- 85 -0.000532 0.2241835 0.020968 0.4857475 0.0543959RAB6IP1 RAB6 interacting protein 1 1889 +/- 88 1974 +/- 155 1281 +/- 66 1285 +/- 52 -9.7E-05 0.6473273 0.961317 0.3121541 0.6522225RAB7 RAB7, member RAS oncogene family 9341 +/- 493 9851 +/- 264 7242 +/- 277 8105 +/- 249 -1.27E-05 0.3893238 0.045658 0.7249005 0.2878582RAB8A RAB8A, member RAS oncogene family 660 +/- 25 807 +/- 25 552 +/- 11 656 +/- 19 -6.22E-05 0.0021892 0.002421 0.0048684 0.0003511RABAC1 Rab acceptor 1 (prenylated) 3817 +/- 159 3921 +/- 206 2935 +/- 80 3016 +/- 129 -0.000103 0.6989125 0.608635 0.853502 0.7374481RABEP1 rabaptin, RAB GTPase binding effector protein 1 2142 +/- 134 2463 +/- 95 1858 +/- 114 2298 +/- 159 -0.046629 0.0823083 0.056551 0.1709026 0.2422783RABEP2 rabaptin, RAB GTPase binding effector protein 2 275 +/- 8 281 +/- 16 254 +/- 9 247 +/- 10 -0.011503 0.7313138 -0.63573 0.1656135 0.760974RABIF RAB interacting factor 534 +/- 29 645 +/- 54 468 +/- 14 555 +/- 44 -0.000249 0.1105411 0.119867 0.0505082 0.0027574RABL4 RAB, member of RAS oncogene family-like 4 740 +/- 95 1128 +/- 110 549 +/- 56 835 +/- 106 -0.000823 0.0238958 0.054058 0.0768268 0.3212915RAD21 RAD21 homolog (S. pombe) 5571 +/- 207 5762 +/- 93 5413 +/- 165 4952 +/- 247 -0.038491 0.4288964 -0.163859 0.2137327 0.2571036RAG1AP1 recombination activating gene 1 activating protein 1 962 +/- 79 843 +/- 84 777 +/- 37 656 +/- 48 -0.004419 -0.325465 -0.082613 0.2431811 0.0455059RALA v-ral simian leukemia viral oncogene homolog A (ras related) 2306 +/- 161 2038 +/- 111 1849 +/- 56 1803 +/- 66 -0.006592 -0.204021 -0.611925 0.4712526 0.7060513RALBP1 ralA binding protein 1 887 +/- 38 1005 +/- 43 826 +/- 18 837 +/- 56 -0.047193 0.0657419 0.850109 0.2570634 0.2129839RALGDS ral guanine nucleotide dissociation stimulator 1650 +/- 149 1792 +/- 196 970 +/- 61 1034 +/- 81 -0.000114 0.5789536 0.546252 0.1317755 0.2657105RALY RNA binding protein, autoantigenic (hnRNP-associated with lethal yellow homolog (mouse 932 +/- 71 1060 +/- 64 771 +/- 41 809 +/- 23 -0.00125 0.2122587 0.443477 0.2176908 0.5794756RAN RAN, member RAS oncogene family 5585 +/- 337 5166 +/- 255 4667 +/- 225 5138 +/- 283 -0.020597 -0.346163 0.228518 0.0649918 0.8079327RANGNRF RAN guanine nucleotide release factor 425 +/- 34 318 +/- 15 318 +/- 17 272 +/- 27 -0.003175 -0.024131 -0.192118 0.0152892 0.0205336RAP1A RAP1A, member of RAS oncogene family 2755 +/- 114 3035 +/- 157 2475 +/- 162 2521 +/- 63 -0.021004 0.1829802 0.797143 0.050363 0.9605492RAP2A RAP2A, member of RAS oncogene family 4457 +/- 62 4234 +/- 325 3871 +/- 217 3497 +/- 172 -0.001575 -0.527556 -0.210754 0.9815063 0.4888205RAP80 receptor associated protein 80 1079 +/- 80 1269 +/- 127 891 +/- 21 956 +/- 15 -0.005113 0.2402403 0.033389 0.3779647 0.1303282RASA4 RAS p21 protein activator 4 383 +/- 36 354 +/- 23 326 +/- 24 258 +/- 21 -0.010923 -0.514392 -0.05755 0.2802148 0.0195089RASD1 RAS, dexamethasone-induced 1 3412 +/- 336 3284 +/- 187 2240 +/- 175 2565 +/- 111 -0.002513 -0.748457 0.155101 0.3967154 0.1805933RASL11B RAS-like, family 11, member B 525 +/- 73 390 +/- 82 142 +/- 22 130 +/- 19 -0.000195 -0.249543 -0.689563 0.3792793 0.8186812RASSF2 Ras association (RalGDS/AF-6) domain family 2 2060 +/- 315 2292 +/- 384 1182 +/- 82 1158 +/- 79 -0.002153 0.6506082 -0.841192 0.1590444 0.7698049RASSF3 Ras association (RalGDS/AF-6) domain family 3 1493 +/- 99 1586 +/- 78 1343 +/- 33 1259 +/- 24 -0.004242 0.4811135 -0.06658 0.2075246 0.332505RASSF4 Ras association (RalGDS/AF-6) domain family 4 725 +/- 66 756 +/- 50 647 +/- 40 670 +/- 16 -0.019642 0.7176493 0.615234 0.3135811 0.1488019RASSF8 Ras association (RalGDS/AF-6) domain family 8 637 +/- 74 677 +/- 35 597 +/- 48 552 +/- 33 -0.036735 0.639533 -0.457421 0.8227437 0.1629416RAVER2 ribonucleoprotein, PTB-binding 2 873 +/- 37 787 +/- 47 763 +/- 38 650 +/- 44 -0.009749 -0.185052 -0.083126 0.1142858 0.0794836
S2-genes differentially expressed across region.xls Page 64

Symbol Description Young CA Aged CA Young DG Aged DG CA v DG CA Y v A DG Y v A CA to PMI DG to PMIRB1CC1 RB1-inducible coiled-coil 1 1324 +/- 75 1490 +/- 80 1157 +/- 82 1036 +/- 31 -0.001613 0.1595626 -0.213576 0.0719652 0.6426079RBBP8 retinoblastoma binding protein 8 127 +/- 15 122 +/- 10 91 +/- 12 96 +/- 17 -0.022267 -0.790124 0.808943 0.6856397 0.15006RBJ Ras-associated protein Rap1 1529 +/- 36 1613 +/- 61 1371 +/- 54 1460 +/- 62 -0.002764 0.2657031 0.306639 0.7448603 0.2482896RBKS ribokinase 159 +/- 20 146 +/- 10 130 +/- 9 110 +/- 6 -0.036763 -0.570289 -0.093368 0.719304 0.2386031RBM14 RNA binding motif protein 14 1342 +/- 61 1512 +/- 53 1256 +/- 76 1219 +/- 78 -0.046067 0.0637591 -0.744553 0.1004658 0.5667873RBM19 RNA binding motif protein 19 727 +/- 55 514 +/- 46 537 +/- 38 381 +/- 60 -0.002644 -0.014212 -0.062673 0.07568 0.1984864RBM22 RNA binding motif protein 22 1765 +/- 139 2069 +/- 109 1394 +/- 57 1420 +/- 24 -0.000323 0.1182209 0.694776 0.0939271 0.4587915RBMS1 RNA binding motif, single stranded interacting protein 1 195 +/- 15 138 +/- 12 149 +/- 8 122 +/- 10 -0.023495 -0.016158 -0.059221 0.0416093 0.2834169RBPSUH recombining binding protein suppressor of hairless (Drosophila) 2981 +/- 267 3106 +/- 262 2221 +/- 120 2238 +/- 74 -0.001207 0.7461259 0.907723 0.4020175 0.5302816RCC2 regulator of chromosome condensation 2 1128 +/- 61 1061 +/- 38 1027 +/- 60 1015 +/- 31 -0.045894 -0.373532 -0.867703 0.4987412 0.7242669RCCD1 RCC1 domain containing 1 175 +/- 24 201 +/- 26 144 +/- 11 168 +/- 12 -0.033671 0.4739111 0.179508 0.2022238 0.2077872RCN2 reticulocalbin 2, EF-hand calcium binding domain 5726 +/- 226 5999 +/- 126 5453 +/- 322 5211 +/- 80 -0.015756 0.3238108 -0.496805 0.5153718 0.364355RCOR2 REST corepressor 2 369 +/- 19 382 +/- 29 333 +/- 13 302 +/- 18 -0.01718 0.7200743 -0.210434 0.6945482 0.4149349RDBP RD RNA binding protein 1187 +/- 21 1219 +/- 110 913 +/- 25 937 +/- 43 -0.003231 0.7847859 0.649046 0.6433342 0.945711RDH12 retinol dehydrogenase 12 (all-trans/9-cis/11-cis) 452 +/- 34 392 +/- 47 340 +/- 21 351 +/- 59 -0.017986 -0.336189 0.85896 0.0945357 0.9739087RDX radixin 340 +/- 45 357 +/- 31 213 +/- 7 219 +/- 10 -0.000887 0.7630346 0.612992 0.8472482 0.7219133REEP1 receptor accessory protein 1 3525 +/- 94 2995 +/- 201 2782 +/- 183 2618 +/- 100 -0.00511 -0.048147 -0.455031 0.0133104 0.8612964RER1 RER1 retention in endoplasmic reticulum 1 homolog (S. cerevisiae) 2397 +/- 128 2043 +/- 116 1810 +/- 67 1911 +/- 139 -0.000969 -0.067708 0.535953 0.1050865 0.8214577RFC1 replication factor C (activator 1) 1, 145kDa 456 +/- 21 417 +/- 17 412 +/- 18 386 +/- 26 -0.035333 -0.183259 -0.431201 0.0218956 0.1886658RFP ret finger protein 1377 +/- 107 1242 +/- 62 1191 +/- 44 1033 +/- 76 -0.033781 -0.306975 -0.117652 0.3543826 0.1006262RFXANK regulatory factor X-associated ankyrin-containing protein 382 +/- 19 443 +/- 19 312 +/- 22 350 +/- 23 -0.000451 0.0455876 0.256114 0.0324922 0.0503628RGC32 response gene to complement 32 6859 +/- 127 8305 +/- 653 5556 +/- 183 6802 +/- 669 -0.000298 0.0779701 0.13729 0.3430082 0.646021RGL1 ral guanine nucleotide dissociation stimulator-like 1 2405 +/- 65 2230 +/- 58 1949 +/- 71 1953 +/- 77 -2.77E-05 -0.07391 0.969413 0.1153387 0.4356903RGS4 regulator of G-protein signalling 4 1494 +/- 470 1745 +/- 400 548 +/- 133 512 +/- 149 -0.00077 0.6930025 -0.858951 0.9349628 0.8882524RGS5 regulator of G-protein signalling 5 2558 +/- 229 3114 +/- 232 2237 +/- 166 2519 +/- 210 -0.007642 0.118181 0.322261 0.1959147 0.3067307RHBDF1 rhomboid 5 homolog 1 (Drosophila) 290 +/- 21 331 +/- 17 256 +/- 15 270 +/- 13 -0.007655 0.1643482 0.492793 0.1366439 0.5157773RHBDL2 rhomboid, veinlet-like 2 (Drosophila) 159 +/- 38 241 +/- 53 91 +/- 15 121 +/- 8 -0.017273 0.2358206 0.107435 0.0888637 0.2288532RHEBL1 Ras homolog enriched in brain like 1 228 +/- 26 221 +/- 29 176 +/- 10 154 +/- 10 -0.004442 -0.864525 -0.176486 0.7092064 0.1938841RHOBTB1 Rho-related BTB domain containing 1 303 +/- 17 310 +/- 25 217 +/- 23 215 +/- 14 -0.001526 0.8045995 -0.948916 0.8143246 0.9841809RHOQ ras homolog gene family, member Q 1652 +/- 187 2322 +/- 252 1510 +/- 132 2021 +/- 227 -0.025698 0.0605443 0.094703 0.0802522 0.2605742RHOU ras homolog gene family, member U 2390 +/- 265 3326 +/- 556 1311 +/- 72 1705 +/- 52 -0.001259 0.1711621 0.00185 0.0287121 0.0028013RHPN2 rhophilin, Rho GTPase binding protein 2 1152 +/- 182 1102 +/- 155 788 +/- 76 715 +/- 84 -0.003049 -0.839588 -0.538191 0.8055805 0.5809222RICTOR rapamycin-insensitive companion of mTOR 2415 +/- 271 3115 +/- 219 2053 +/- 54 2477 +/- 109 -0.018334 0.073289 0.013266 0.0617395 0.0030748RIF1 RAP1 interacting factor homolog (yeast) 637 +/- 107 956 +/- 124 515 +/- 28 671 +/- 28 -0.040163 0.080335 0.003329 0.0156319 0.0176562RIPK2 receptor-interacting serine-threonine kinase 2 475 +/- 23 551 +/- 22 420 +/- 19 435 +/- 19 -0.000169 0.040023 0.590228 0.2592377 0.9694159RNASE1 ribonuclease, RNase A family, 1 (pancreatic) 2782 +/- 213 3018 +/- 344 1769 +/- 96 1909 +/- 98 -8.04E-05 0.5745971 0.334639 0.3801282 0.1111012RNASE4 ribonuclease, RNase A family, 4 204 +/- 17 250 +/- 22 133 +/- 12 240 +/- 28 -0.003533 0.1324862 0.015739 0.2850226 0.0024759RNASE6 ribonuclease, RNase A family, k6 397 +/- 35 654 +/- 73 255 +/- 16 436 +/- 47 -0.003229 0.0149096 0.014506 0.0062424 0.0746811RNASEH2Aribonuclease H2, large subunit 227 +/- 15 280 +/- 16 209 +/- 14 224 +/- 16 -0.051719 0.0374968 0.500722 0.1277155 0.7681737RND2 Rho family GTPase 2 570 +/- 97 667 +/- 106 381 +/- 30 457 +/- 41 -0.008905 0.5131604 0.171732 0.3752886 0.3217803RNF13 ring finger protein 13 3691 +/- 205 4662 +/- 821 2704 +/- 169 3107 +/- 143 -0.004602 0.2979435 0.101574 0.1364455 0.2439547RNF130 ring finger protein 130 2915 +/- 322 3688 +/- 372 2157 +/- 119 2608 +/- 105 -0.00724 0.1481042 0.019517 0.0619848 0.0806561RNF150 ring finger protein 150 1265 +/- 67 1161 +/- 47 727 +/- 55 825 +/- 45 -1.7E-05 -0.23155 0.199869 0.1043199 0.1848287RNF169 ring finger protein 169 832 +/- 65 876 +/- 28 722 +/- 30 699 +/- 25 -0.018221 0.5556799 -0.565262 0.379811 0.9933702RNF187 ring finger protein 187 4466 +/- 174 4113 +/- 168 4156 +/- 120 3630 +/- 66 -0.038965 -0.175609 -0.005496 0.0383765 0.0309644
S2-genes differentially expressed across region.xls Page 65

Symbol Description Young CA Aged CA Young DG Aged DG CA v DG CA Y v A DG Y v A CA to PMI DG to PMIRNF31 ring finger protein 31 560 +/- 30 585 +/- 27 518 +/- 44 504 +/- 30 -0.014446 0.5524084 -0.791178 0.4145564 0.6720362RNF4 ring finger protein 4 3001 +/- 120 2944 +/- 147 2498 +/- 80 2543 +/- 127 -0.000177 -0.771791 0.769723 0.1662269 0.5217967RNF5 ring finger protein 5 2066 +/- 79 2018 +/- 85 1672 +/- 90 1720 +/- 58 -0.001377 -0.689741 0.667614 0.2508549 0.9852024RNF8 ring finger protein 8 1471 +/- 47 1414 +/- 41 1327 +/- 58 1342 +/- 35 -0.038975 -0.375303 0.821652 0.1086006 0.9210567RNPC1 RNA-binding region (RNP1, RRM) containing 1 456 +/- 27 478 +/- 42 379 +/- 20 416 +/- 24 -0.021848 0.669057 0.27006 0.2154478 0.0728935ROBO2 roundabout, axon guidance receptor, homolog 2 (Drosophila) 1844 +/- 48 1630 +/- 69 1649 +/- 73 1537 +/- 82 -0.030465 -0.032174 -0.337925 0.001026 0.6461609RP11-217Himplantation-associated protein 540 +/- 57 800 +/- 92 433 +/- 35 574 +/- 40 -0.025838 0.0414708 0.027973 0.004277 0.1483887RP11-529I deleted in a mouse model of primary ciliary dyskinesia 1563 +/- 158 1588 +/- 71 1256 +/- 136 1535 +/- 70 -0.027485 0.8908397 0.108769 0.7478505 0.3240476RP11-82K1kynurenine aminotransferase III 1081 +/- 48 1236 +/- 69 926 +/- 68 993 +/- 30 -0.003627 0.0977327 0.397431 0.0530337 0.3786187RPL10A ribosomal protein L10a 8674 +/- 630 9506 +/- 500 7539 +/- 549 8750 +/- 404 -0.001703 0.3264763 0.11057 0.3804491 0.1314289RPL12 ribosomal protein L12 9430 +/- 547 8804 +/- 725 7866 +/- 527 7907 +/- 590 -1.14E-05 -0.50805 0.959344 0.3907329 0.8422057RPL13 ribosomal protein L13 3331 +/- 242 4584 +/- 286 2546 +/- 122 3520 +/- 104 -9.29E-05 0.0076985 0.000189 0.0087231 0.0059545RPL13A ribosomal protein L13a 17473 +/- 716 18114 +/- 433 15464 +/- 747 17201 +/- 373 -0.000835 0.4649311 0.074644 0.6891465 0.198273RPL18 ribosomal protein L18 10779 +/- 411 11534 +/- 392 8934 +/- 293 9623 +/- 357 -8.83E-07 0.2127203 0.173178 0.5068458 0.4955911RPL19 ribosomal protein L19 9357 +/- 185 10005 +/- 306 8787 +/- 293 9412 +/- 306 -0.002193 0.1062607 0.174019 0.0809968 0.0496284RPL24 ribosomal protein L24 6992 +/- 211 7638 +/- 185 6738 +/- 313 6697 +/- 239 -0.021558 0.0444177 -0.919546 0.1335962 0.5753282RPL26L1 ribosomal protein L26-like 1 2945 +/- 149 2782 +/- 137 2548 +/- 62 2607 +/- 60 -0.024552 -0.438809 0.509001 0.0937983 0.8778367RPL27 ribosomal protein L27 13413 +/- 461 13705 +/- 419 10512 +/- 356 11855 +/- 499 -2.71E-05 0.6494446 0.061547 0.8221047 0.0243609RPL35 ribosomal protein L35 10578 +/- 573 10858 +/- 301 8520 +/- 386 8832 +/- 240 -7.58E-07 0.6766814 0.510725 0.7943887 0.567852RPL9 ribosomal protein L9 12030 +/- 543 14358 +/- 285 10191 +/- 563 9811 +/- 1825 -0.000122 0.0062042 -0.850374 0.0454903 0.908068RPLP1 ribosomal protein, large, P1 17390 +/- 565 17107 +/- 538 15240 +/- 465 16379 +/- 611 -0.012218 -0.724215 0.17693 0.7472193 0.2154918RPN1 ribophorin I 3214 +/- 165 3122 +/- 98 2919 +/- 210 3018 +/- 46 -0.025388 -0.64072 0.663249 0.4883486 0.6726586RPN2 ribophorin II 3882 +/- 259 3547 +/- 134 3085 +/- 71 2861 +/- 98 -0.000779 -0.285888 -0.102355 0.4366176 0.093173RPP21 ribonuclease P 21kDa subunit 734 +/- 18 738 +/- 38 594 +/- 26 589 +/- 26 -0.000119 0.9279823 -0.900898 0.6494391 0.3300117RPS12 ribosomal protein S12 4329 +/- 211 3150 +/- 239 3422 +/- 186 2508 +/- 191 -0.000234 -0.004219 -0.007636 0.0932139 0.1503967RPS13 ribosomal protein S13 16142 +/- 483 16738 +/- 421 14590 +/- 129 15112 +/- 432 -0.00047 0.3746461 0.302058 0.4992474 0.6660365RPS15 ribosomal protein S15 10399 +/- 364 11238 +/- 397 8679 +/- 352 9306 +/- 297 -1.3E-05 0.149955 0.206866 0.1198067 0.0973583RPS15A ribosomal protein S15a 14626 +/- 477 16659 +/- 556 11527 +/- 341 13684 +/- 211 -3.97E-06 0.019978 0.000642 0.0187529 0.0088016RPS16 ribosomal protein S16 6925 +/- 336 6071 +/- 172 5467 +/- 306 4710 +/- 188 -1.69E-06 -0.055727 -0.067967 0.1166208 0.2461751RPS17 ribosomal protein S17 15133 +/- 550 14659 +/- 548 12410 +/- 409 12221 +/- 313 -2.6E-05 -0.555233 -0.722046 0.6327906 0.9831168RPS18 ribosomal protein S18 16692 +/- 562 16817 +/- 293 14381 +/- 399 14595 +/- 334 -2.53E-06 0.8488996 0.689688 0.8384108 0.8751669RPS19 ribosomal protein S19 13041 +/- 438 13747 +/- 408 10634 +/- 404 11010 +/- 220 -1.67E-06 0.2654267 0.438195 0.1167424 0.3878737RPS19BP1ribosomal protein S19 binding protein 1 1321 +/- 154 1432 +/- 192 1046 +/- 59 1038 +/- 73 -0.010934 0.6605775 -0.932222 0.8738857 0.5374471RPS20 ribosomal protein S20 14369 +/- 692 16473 +/- 680 11954 +/- 708 13764 +/- 510 -5.35E-05 0.0551395 0.069241 0.079733 0.1577603RPS26 ribosomal protein S26 13524 +/- 616 13145 +/- 731 11557 +/- 620 11245 +/- 406 -1.66E-06 -0.699809 -0.684406 0.8656369 0.9429498RPS3 ribosomal protein S3 17172 +/- 407 17830 +/- 319 15180 +/- 725 16590 +/- 466 -0.006142 0.2338888 0.139541 0.4730761 0.2048544RPS3A ribosomal protein S3A 18537 +/- 735 19266 +/- 623 16671 +/- 703 16606 +/- 768 -6.23E-05 0.4669776 -0.952102 0.4531818 0.7517223RPS4X ribosomal protein S4, X-linked 9260 +/- 677 10466 +/- 375 7253 +/- 542 8406 +/- 347 -0.002163 0.1586952 0.109686 0.1959557 0.1845735RPS6KA2 ribosomal protein S6 kinase, 90kDa, polypeptide 2 2685 +/- 589 3697 +/- 536 1477 +/- 86 1670 +/- 72 -0.002546 0.2332351 0.119535 0.247605 0.1223245RPS6KL1 ribosomal protein S6 kinase-like 1 1701 +/- 59 1554 +/- 51 1265 +/- 36 1177 +/- 44 -9.84E-06 -0.088499 -0.155107 0.0267874 0.1540367RPS8 ribosomal protein S8 7154 +/- 320 7698 +/- 258 6230 +/- 225 6609 +/- 223 -0.000455 0.2167886 0.261404 0.329606 0.1804054RQCD1 RCD1 required for cell differentiation1 homolog (S. pombe) 501 +/- 35 445 +/- 17 432 +/- 30 405 +/- 21 -0.018195 -0.189014 -0.486167 0.1893383 0.360913RRAGC Ras-related GTP binding C 2912 +/- 161 3207 +/- 157 2579 +/- 91 2330 +/- 56 -0.000557 0.2207537 -0.047748 0.4301719 0.0631591RRP22 RAS-related on chromosome 22 2248 +/- 321 1726 +/- 119 1139 +/- 106 977 +/- 76 -0.000973 -0.175486 -0.246375 0.1208223 0.7171852RSNL2 restin-like 2 1784 +/- 121 1614 +/- 119 1325 +/- 39 1200 +/- 54 -0.000334 -0.341303 -0.100024 0.9270609 0.1793657
S2-genes differentially expressed across region.xls Page 66

Symbol Description Young CA Aged CA Young DG Aged DG CA v DG CA Y v A DG Y v A CA to PMI DG to PMIRSPO2 R-spondin 2 homolog (Xenopus laevis) 596 +/- 111 506 +/- 102 399 +/- 67 387 +/- 44 -0.023991 -0.562046 -0.87551 0.3345013 0.952499RSPRY1 ring finger and SPRY domain containing 1 2028 +/- 269 2432 +/- 220 1462 +/- 115 1593 +/- 128 -0.001896 0.2720152 0.467212 0.2797266 0.4121253RTKN rhotekin 1246 +/- 231 1567 +/- 284 660 +/- 62 696 +/- 58 -0.004647 0.4011988 0.68267 0.1203308 0.3029594RWDD2 RWD domain containing 2 370 +/- 11 338 +/- 12 325 +/- 8 330 +/- 13 -0.008486 -0.080304 0.726507 0.0406136 0.9149342RXFP1 relaxin/insulin-like family peptide receptor 1 591 +/- 226 702 +/- 201 175 +/- 61 122 +/- 31 -0.002859 0.7223694 -0.4598 0.7890036 0.5376481S100A13 S100 calcium binding protein A13 1569 +/- 113 1603 +/- 85 1364 +/- 110 1346 +/- 39 -0.001511 0.8122238 -0.882788 0.6478642 0.6144458S100A6 S100 calcium binding protein A6 (calcyclin) 923 +/- 64 1156 +/- 72 682 +/- 81 1085 +/- 58 -0.00207 0.0359624 0.003149 0.2202466 0.1084609SAMSN1 SAM domain, SH3 domain and nuclear localisation signals, 1 178 +/- 18 168 +/- 12 131 +/- 17 151 +/- 9 -0.033264 -0.655748 0.337741 0.8102787 0.6358359SAP130 Sin3A-associated protein, 130kDa 1623 +/- 42 1504 +/- 24 1469 +/- 39 1472 +/- 40 -0.005698 -0.03916 0.964552 0.0232187 0.486987SAP18 Sin3A-associated protein, 18kDa 2878 +/- 140 4280 +/- 172 2600 +/- 139 3721 +/- 168 -0.020479 0.0001016 0.000789 9.322E-05 0.0050428SAR1B SAR1 gene homolog B (S. cerevisiae) 378 +/- 14 408 +/- 29 334 +/- 20 328 +/- 7 -0.005747 0.3659433 -0.78977 0.1761479 0.8803547SART1 squamous cell carcinoma antigen recognised by T cells 480 +/- 21 534 +/- 37 435 +/- 30 422 +/- 17 -0.019021 0.2315699 -0.715831 0.2269534 0.8099678SAT2 spermidine/spermine N1-acetyltransferase 2 2339 +/- 140 2895 +/- 304 2086 +/- 161 2480 +/- 236 -0.01743 0.1407012 0.208904 0.3660211 0.547859SCAND1 SCAN domain containing 1 1972 +/- 139 1711 +/- 96 1540 +/- 65 1425 +/- 30 -0.000341 -0.157718 -0.14949 0.2564767 0.1738159SCAP1 src family associated phosphoprotein 1 230 +/- 42 137 +/- 25 48 +/- 22 45 +/- 9 -0.000443 -0.092402 -0.906312 0.1152447 0.9464595SCARB2 scavenger receptor class B, member 2 223 +/- 19 306 +/- 41 195 +/- 9 222 +/- 13 -0.032468 0.111617 0.144392 0.0329419 0.0354211SCRG1 scrapie responsive protein 1 2376 +/- 217 2095 +/- 125 1932 +/- 160 1732 +/- 278 -0.04466 -0.295179 -0.5549 0.2679309 0.7386949SCRIB scribbled homolog (Drosophila) 1091 +/- 125 1365 +/- 127 994 +/- 50 944 +/- 48 -0.043245 0.155152 -0.488183 0.1363655 0.5885018SCRN1 secernin 1 9838 +/- 238 10891 +/- 605 8473 +/- 141 10001 +/- 220 -0.003911 0.152799 0.000635 0.8102889 0.0171262SDCCAG10serologically defined colon cancer antigen 10 894 +/- 29 887 +/- 42 836 +/- 34 773 +/- 18 -0.044456 -0.889559 -0.139259 0.4090283 0.1312519SDF4 stromal cell derived factor 4 3206 +/- 87 3305 +/- 145 2800 +/- 67 2975 +/- 51 -0.003943 0.5759365 0.067073 0.4892865 0.2434686SDHC succinate dehydrogenase complex, subunit C, integral membrane protein, 15kDa 1763 +/- 91 1634 +/- 45 1610 +/- 52 1461 +/- 35 -0.000608 -0.242924 -0.043667 0.2746808 0.025762SDK2 sidekick homolog 2 (chicken) 931 +/- 129 836 +/- 94 667 +/- 46 527 +/- 27 -0.009243 -0.563399 -0.030214 0.5199325 0.0915624SEC23B Sec23 homolog B (S. cerevisiae) 1038 +/- 61 1069 +/- 58 923 +/- 23 1057 +/- 33 -0.045226 0.7178976 0.0106 0.7702871 0.0156109SELI selenoprotein I 1692 +/- 39 1602 +/- 60 1526 +/- 45 1504 +/- 69 -0.001468 -0.24377 -0.795643 0.0630807 0.2380834SELK selenoprotein K 3585 +/- 88 3497 +/- 51 3262 +/- 116 3310 +/- 125 -0.002919 -0.417087 0.786128 0.3954927 0.9427398SELPLG selectin P ligand 660 +/- 60 886 +/- 79 469 +/- 46 573 +/- 50 -0.001155 0.047568 0.159001 0.0551214 0.3252283SELS selenoprotein S 2984 +/- 127 2979 +/- 209 2303 +/- 53 2615 +/- 85 -0.002081 -0.98617 0.017136 0.7899292 0.0790283SEMA6A Sema domain, transmembrane domain (TM), and cytoplasmic domain, (semaphorin) 6A 212 +/- 31 323 +/- 46 169 +/- 22 220 +/- 19 -0.017338 0.0755396 0.108891 0.0161403 0.2971259SEMA6D sema domain, transmembrane domain (TM), and cytoplasmic domain, (semaphorin) 6D 2458 +/- 259 2944 +/- 376 1878 +/- 109 1873 +/- 110 -0.004932 0.3152062 -0.977008 0.1669905 0.6277085SENP2 SUMO1/sentrin/SMT3 specific peptidase 2 1325 +/- 60 1350 +/- 58 1227 +/- 36 1342 +/- 55 -0.033713 0.762104 0.121099 0.4703381 0.4481699SENP5 SUMO1/sentrin specific peptidase 5 2276 +/- 80 2148 +/- 38 2131 +/- 52 2107 +/- 34 -0.049266 -0.189824 -0.704969 0.1497195 0.6790794SEP15 15 kDa selenoprotein 5824 +/- 161 6027 +/- 301 5348 +/- 180 5501 +/- 151 -0.009826 0.5706167 0.53304 0.1874084 0.7205999SEPHS2 selenophosphate synthetase 2 1665 +/- 90 1673 +/- 73 1356 +/- 51 1441 +/- 41 -0.004414 0.9464308 0.229268 0.8042592 0.5104553SEPT10 septin 10 585 +/- 55 750 +/- 93 369 +/- 49 487 +/- 43 -0.004941 0.1630644 0.102702 0.035267 0.2214484SEPT2 septin 2 9480 +/- 477 10693 +/- 414 8162 +/- 297 8305 +/- 230 -0.001421 0.0843496 0.712153 0.0353315 0.6665899SEPT4 septin 4 2139 +/- 390 3276 +/- 670 986 +/- 142 1503 +/- 193 -0.00558 0.1800351 0.064105 0.0298758 0.054253SEPT6 septin 6 119 +/- 9 143 +/- 8 83 +/- 7 98 +/- 6 -6.08E-05 0.0760879 0.174252 0.301611 0.4387799SEPT8 septin 8 2774 +/- 489 5315 +/- 965 1763 +/- 94 3266 +/- 249 -0.02563 0.0491891 0.002205 0.0143031 0.0038959SERF2 Small EDRK-rich factor 2 471 +/- 44 530 +/- 28 389 +/- 17 433 +/- 17 -0.025532 0.2905828 0.105805 0.0933809 0.3224705SERINC5 Serine incorporator 5 1915 +/- 212 2175 +/- 321 1061 +/- 102 977 +/- 33 -0.001017 0.5177342 -0.461578 0.1427016 0.5419836SERP1 stress-associated endoplasmic reticulum protein 1 1318 +/- 69 1146 +/- 64 1052 +/- 40 1059 +/- 58 -0.002948 -0.099627 0.930534 0.5212441 0.4222426SERPINF1 serpin peptidase inhibitor, clade F (alpha-2 antiplasmin, pigment epithelium derived factor 508 +/- 96 868 +/- 124 280 +/- 49 579 +/- 121 -0.001876 0.0462446 0.067889 0.2048228 0.1776994SERPINI1 serpin peptidase inhibitor, clade I (neuroserpin), member 1 4281 +/- 494 4810 +/- 769 2709 +/- 429 2006 +/- 287 -0.00065 0.5775638 -0.20904 0.5307427 0.6041588SESN3 sestrin 3 200 +/- 26 188 +/- 12 153 +/- 7 151 +/- 16 -0.00382 -0.682553 -0.924363 0.5468163 0.634063
S2-genes differentially expressed across region.xls Page 67

Symbol Description Young CA Aged CA Young DG Aged DG CA v DG CA Y v A DG Y v A CA to PMI DG to PMISESTD1 SEC14 and spectrin domains 1 1606 +/- 83 1779 +/- 95 1506 +/- 58 1574 +/- 53 -0.039507 0.2005865 0.41066 0.2309524 0.464126SF3A3 Splicing factor 3a, subunit 3, 60kDa 3426 +/- 274 2814 +/- 133 2964 +/- 63 2412 +/- 70 -0.010701 -0.082988 -0.000278 0.0193853 0.0052495SF3B5 splicing factor 3b, subunit 5, 10kDa 2837 +/- 201 2672 +/- 214 2213 +/- 144 2343 +/- 106 -0.000564 -0.585189 0.484432 0.5448035 0.6522958SFRP1 secreted frizzled-related protein 1 378 +/- 122 475 +/- 148 162 +/- 54 156 +/- 36 -0.010604 0.623064 -0.927847 0.2028574 0.6036077SFXN1 sideroflexin 1 947 +/- 84 649 +/- 46 800 +/- 33 630 +/- 29 -0.014836 -0.014754 -0.004025 0.0228448 0.0559987SGK serum/glucocorticoid regulated kinase 1969 +/- 150 2626 +/- 225 1220 +/- 179 1632 +/- 102 -0.000539 0.0390527 0.08161 0.0471041 0.2118836SGPP1 sphingosine-1-phosphate phosphatase 1 1758 +/- 95 1914 +/- 54 1672 +/- 50 1726 +/- 58 -0.046787 0.191944 0.49523 0.2417377 0.7470477SH3BP4 SH3-domain binding protein 4 814 +/- 96 1038 +/- 89 566 +/- 21 669 +/- 39 -0.000986 0.11864 0.056439 0.0759538 0.0418179SH3GLB1 SH3-domain GRB2-like endophilin B1 567 +/- 50 626 +/- 33 510 +/- 25 528 +/- 24 -0.032648 0.3511974 0.616778 0.3175337 0.6337238SH3KBP1 SH3-domain kinase binding protein 1 986 +/- 71 824 +/- 87 753 +/- 42 615 +/- 74 -0.00691 -0.181956 -0.153524 0.5901198 0.4450613SH3MD4 SH3 multiple domains 4 1732 +/- 142 1583 +/- 171 1400 +/- 71 1205 +/- 43 -0.003383 -0.518297 -0.047787 0.9282667 0.2591898SH3PX3 SH3 and PX domain containing 3 243 +/- 24 325 +/- 26 209 +/- 22 227 +/- 14 -0.015925 0.0443613 0.515619 0.0464582 0.7937885SH3YL1 SH3 domain containing, Ysc84-like 1 (S. cerevisiae) 293 +/- 15 244 +/- 29 225 +/- 18 220 +/- 33 -0.006978 -0.172553 -0.896661 0.1078019 0.5187248SHC1 SHC (Src homology 2 domain containing) transforming protein 1 1132 +/- 63 1127 +/- 51 787 +/- 49 779 +/- 16 -1.05E-07 -0.953187 -0.879671 0.4632275 0.6804978SHC4 SHC (Src homology 2 domain containing) family, member 4 124 +/- 15 167 +/- 22 90 +/- 8 111 +/- 5 -0.010218 0.1410114 0.058293 0.0459135 0.0739981SHE Src homology 2 domain containing E 156 +/- 17 142 +/- 16 93 +/- 18 115 +/- 11 -0.009505 -0.579007 0.333889 0.6488268 0.3167174SHKBP1 SH3KBP1 binding protein 1 410 +/- 53 488 +/- 37 264 +/- 16 289 +/- 20 -0.000591 0.2601923 0.373108 0.4243334 0.575259SIAHBP1 fuse-binding protein-interacting repressor 4107 +/- 169 3884 +/- 157 3813 +/- 111 3601 +/- 140 -0.02899 -0.356573 -0.269114 0.2963646 0.4423939SIL1 SIL1 homolog, endoplasmic reticulum chaperone (S. cerevisiae) 661 +/- 37 651 +/- 43 520 +/- 24 516 +/- 26 -0.005778 -0.858568 -0.892754 0.7061563 0.4682069SITPEC signaling intermediate in Toll pathway, evolutionarily conserved 863 +/- 62 845 +/- 22 736 +/- 29 761 +/- 22 -0.013172 -0.799523 0.505429 0.5759923 0.7518272SIVA CD27-binding (Siva) protein 668 +/- 39 649 +/- 86 405 +/- 38 508 +/- 38 -0.000339 -0.845799 0.085813 0.3055674 0.7244419SLC12A2 solute carrier family 12 (sodium/potassium/chloride transporters), member 2 528 +/- 75 635 +/- 104 328 +/- 46 433 +/- 45 -0.005046 0.4271903 0.138724 0.2139427 0.2095361SLC12A7 solute carrier family 12 (potassium/chloride transporters), member 7 242 +/- 22 238 +/- 20 199 +/- 16 171 +/- 18 -0.01019 -0.90519 -0.269562 0.4645587 0.7554538SLC15A3 solute carrier family 15, member 3 255 +/- 27 313 +/- 19 234 +/- 7 271 +/- 8 -0.020326 0.1124988 0.005854 0.1031174 0.0062236SLC16A1 solute carrier family 16 (monocarboxylic acid transporters), member 1 180 +/- 12 227 +/- 25 163 +/- 14 144 +/- 13 -0.030079 0.1247604 -0.341952 0.0204312 0.5040037SLC1A4 solute carrier family 1 (glutamate/neutral amino acid transporter), member 4 3466 +/- 213 3097 +/- 143 3093 +/- 119 2554 +/- 111 -0.007805 -0.185181 -0.009141 0.0994061 0.0194672SLC22A15 solute carrier family 22 (organic cation transporter), member 15 462 +/- 24 483 +/- 46 394 +/- 24 391 +/- 22 -0.009614 0.7010988 -0.928356 0.5040354 0.8838533SLC22A18 solute carrier family 22 (organic cation transporter), member 18 269 +/- 23 400 +/- 39 191 +/- 11 317 +/- 21 -0.002158 0.0198389 0.00162 0.1136965 0.0449552SLC25A10 solute carrier family 25 (mitochondrial carrier; dicarboxylate transporter), member 10 192 +/- 8 212 +/- 12 175 +/- 14 177 +/- 12 -0.041889 0.1817923 0.91544 0.1332509 0.4288061SLC25A12 solute carrier family 25 (mitochondrial carrier, Aralar), member 12 623 +/- 45 584 +/- 47 551 +/- 47 553 +/- 39 -0.026332 -0.555544 0.975908 0.201819 0.4583938SLC25A26 solute carrier family 25, member 26 945 +/- 55 958 +/- 43 853 +/- 42 773 +/- 58 -0.025582 0.8486563 -0.298285 0.3796062 0.5763735SLC25A27 solute carrier family 25, member 27 2459 +/- 165 2633 +/- 172 2360 +/- 76 2160 +/- 127 -0.04084 0.4840725 -0.221118 0.4522667 0.4764481SLC25A36 Solute carrier family 25, member 36 2741 +/- 70 2971 +/- 126 2298 +/- 105 2441 +/- 54 -8.67E-05 0.1500621 0.26298 0.5027017 0.7056145SLC27A5 solute carrier family 27 (fatty acid transporter), member 5 151 +/- 19 178 +/- 11 114 +/- 5 141 +/- 13 -0.001421 0.2585592 0.09764 0.3084692 0.007251SLC29A1 solute carrier family 29 (nucleoside transporters), member 1 289 +/- 31 319 +/- 33 213 +/- 10 240 +/- 16 -0.001194 0.524223 0.189616 0.9310837 0.094163SLC30A1 Solute carrier family 30 (zinc transporter), member 1 1715 +/- 48 1708 +/- 50 1238 +/- 51 1294 +/- 16 -3.34E-07 -0.927111 0.337576 0.8248866 0.3439634SLC30A9 solute carrier family 30 (zinc transporter), member 9 2587 +/- 153 2562 +/- 105 2326 +/- 46 2421 +/- 128 -0.018456 -0.896299 0.512071 0.7667366 0.6676872SLC32A1 solute carrier family 32 (GABA vesicular transporter), member 1 1003 +/- 65 920 +/- 118 863 +/- 64 859 +/- 29 -0.049537 -0.552654 -0.957181 0.1885677 0.9633984SLC35A1 solute carrier family 35 (CMP-sialic acid transporter), member A1 2716 +/- 151 2471 +/- 132 2296 +/- 72 2051 +/- 114 -0.003963 -0.249954 -0.11229 0.4729585 0.2116098SLC35F1 solute carrier family 35, member F1 3034 +/- 284 2519 +/- 280 1601 +/- 180 1193 +/- 132 -2.85E-05 -0.224771 -0.101401 0.2302804 0.4519835SLC36A1 solute carrier family 36 (proton/amino acid symporter), member 1 489 +/- 32 475 +/- 38 407 +/- 37 431 +/- 40 -0.036443 -0.784179 0.672771 0.3847319 0.975655SLC38A3 solute carrier family 38, member 3 745 +/- 45 672 +/- 64 609 +/- 29 564 +/- 43 -0.012786 -0.372483 -0.419096 0.7895595 0.6099201SLC38A6 solute carrier family 38, member 6 241 +/- 14 266 +/- 14 203 +/- 15 222 +/- 9 -0.018292 0.2465405 0.308043 0.4574683 0.3006164SLC39A9 solute carrier family 39 (zinc transporter), member 9 1773 +/- 64 1724 +/- 49 1546 +/- 30 1624 +/- 34 -0.003627 -0.558111 0.120269 0.5466566 0.2848608SLC44A1 solute carrier family 44, member 1 1861 +/- 227 2331 +/- 464 1230 +/- 177 1377 +/- 94 -0.018005 0.3917113 0.486105 0.0649311 0.2689055
S2-genes differentially expressed across region.xls Page 68

Symbol Description Young CA Aged CA Young DG Aged DG CA v DG CA Y v A DG Y v A CA to PMI DG to PMISLC44A3 solute carrier family 44, member 3 321 +/- 39 318 +/- 17 284 +/- 18 283 +/- 13 -0.024975 -0.951476 -0.972706 0.8818561 0.8996318SLC45A3 solute carrier family 45, member 3 194 +/- 24 304 +/- 46 108 +/- 28 201 +/- 22 -0.005552 0.0675492 0.027744 0.0448504 0.0220202SLC4A1APsolute carrier family 4 (anion exchanger), member 1, adaptor protein 1272 +/- 54 1197 +/- 48 1085 +/- 48 1152 +/- 31 -0.030609 -0.322699 0.280839 0.1058573 0.4778692SLC4A2 solute carrier family 4, anion exchanger, member 2 (erythrocyte membrane protein band 3 882 +/- 184 733 +/- 68 510 +/- 10 535 +/- 34 -0.01687 -0.473852 0.504634 0.8536538 0.2047179SLC4A8 solute carrier family 4, sodium bicarbonate cotransporter, member 8 334 +/- 22 396 +/- 44 270 +/- 15 324 +/- 20 -0.015693 0.2468422 0.069122 0.0192412 0.0744722SLC5A11 solute carrier family 5 (sodium/glucose cotransporter), member 11 675 +/- 128 1122 +/- 169 389 +/- 31 607 +/- 40 -0.006695 0.063233 0.002558 0.0506597 0.0129141SLC5A6 solute carrier family 5 (sodium-dependent vitamin transporter), member 6 537 +/- 27 477 +/- 33 374 +/- 28 342 +/- 21 -0.00115 -0.189725 -0.39002 0.1713593 0.3949025SLC7A9 solute carrier family 7 (cationic amino acid transporter, y+ system), member 9 985 +/- 116 1241 +/- 290 513 +/- 53 577 +/- 51 -0.001799 0.4417194 0.405934 0.1343201 0.1256434SLC8A1 solute carrier family 8 (sodium/calcium exchanger), member 1 687 +/- 85 552 +/- 40 481 +/- 78 461 +/- 44 -0.04709 -0.192116 -0.826151 0.0618767 0.7463658SLC8A3 Solute carrier family 8 (sodium-calcium exchanger), member 3 119 +/- 26 152 +/- 25 84 +/- 8 75 +/- 13 -0.003391 0.3761061 -0.57588 0.1920385 0.708155SLCO1C1 solute carrier organic anion transporter family, member 1C1 525 +/- 72 446 +/- 45 404 +/- 18 280 +/- 27 -0.008426 -0.380552 -0.006315 0.5831536 0.0395767SLCO3A1 solute carrier organic anion transporter family, member 3A1 1006 +/- 122 1086 +/- 66 881 +/- 69 914 +/- 56 -0.035836 0.5790633 0.721966 0.3956251 0.7333596SLTM SAFB-like, transcription modulator 1522 +/- 138 1552 +/- 40 1300 +/- 34 1309 +/- 40 -0.005845 0.8397678 0.866296 0.6270067 0.5689292SMAD2 SMAD, mothers against DPP homolog 2 (Drosophila) 215 +/- 25 236 +/- 12 154 +/- 11 179 +/- 13 -0.00502 0.4716141 0.177536 0.3326621 0.5184842SMAP1 stromal membrane-associated protein 1 1839 +/- 57 1785 +/- 100 1664 +/- 91 1630 +/- 56 -0.009411 -0.653278 -0.758078 0.196703 0.443799SMAP1L stromal membrane-associated protein 1-like 3627 +/- 234 3974 +/- 202 3163 +/- 165 3575 +/- 309 -0.008983 0.2880253 0.282115 0.3261457 0.1099691SMARCD3 SWI/SNF related, matrix associated, actin dependent regulator of chromatin, subfamily d, 2372 +/- 277 2462 +/- 119 2130 +/- 163 2183 +/- 151 -0.040129 0.7756842 0.817176 0.7342855 0.9321508SMTN smoothelin 114 +/- 10 129 +/- 10 91 +/- 7 86 +/- 7 -0.005809 0.3001178 -0.637821 0.037805 0.5812242SNAPAP SNAP-associated protein 2027 +/- 47 2062 +/- 110 1747 +/- 37 1758 +/- 101 -0.001517 0.7746385 0.917984 0.244101 0.9701145SNF1LK SNF1-like kinase 448 +/- 53 272 +/- 52 268 +/- 49 172 +/- 19 -0.002689 -0.038141 -0.114625 0.0501826 0.2906952SNF1LK2 SNF1-like kinase 2 558 +/- 25 484 +/- 38 392 +/- 21 359 +/- 26 -0.000225 -0.140076 -0.347504 0.3704946 0.2727385SNORA24 Small nucleolar RNA, H/ACA box 24 4609 +/- 197 5659 +/- 543 3508 +/- 255 4534 +/- 188 -0.00027 0.1169872 0.010709 0.2964168 0.0667392SNRPA small nuclear ribonucleoprotein polypeptide A 911 +/- 13 1003 +/- 42 800 +/- 43 792 +/- 37 -0.00124 0.0801748 -0.900706 0.0167262 0.7913614SNRPC small nuclear ribonucleoprotein polypeptide C 2169 +/- 169 2013 +/- 122 1712 +/- 77 1620 +/- 72 -0.001356 -0.475964 -0.410965 0.4789804 0.3509827SNRPD2 small nuclear ribonucleoprotein D2 polypeptide 16.5kDa 5044 +/- 192 5118 +/- 280 4200 +/- 80 4327 +/- 97 -0.000411 0.8318711 0.339606 0.8300159 0.3711196SNRPE small nuclear ribonucleoprotein polypeptide E 2808 +/- 54 2931 +/- 100 2631 +/- 81 2805 +/- 26 -0.028664 0.3104969 0.087745 0.7075338 0.0803164SNX10 sorting nexin 10 2827 +/- 121 2812 +/- 104 2703 +/- 159 2491 +/- 109 -0.024538 -0.927785 -0.299942 0.8574633 0.4587122SNX11 sorting nexin 11 881 +/- 30 952 +/- 31 830 +/- 30 882 +/- 25 -0.007082 0.1267566 0.215322 0.5910406 0.8996539SNX15 sorting nexin 15 663 +/- 53 776 +/- 37 621 +/- 28 587 +/- 40 -0.026805 0.1151833 -0.501619 0.0903526 0.5747247SNX17 sorting nexin 17 2369 +/- 40 2361 +/- 64 1963 +/- 54 2132 +/- 51 -1.88E-05 -0.920823 0.050425 0.208648 0.3840665SNX27 sorting nexin family member 27 2232 +/- 103 2045 +/- 65 2055 +/- 71 1925 +/- 38 -0.004032 -0.162788 -0.146211 0.108063 0.094232SNX30 sorting nexin family member 30 880 +/- 79 1048 +/- 104 795 +/- 47 857 +/- 33 -0.038655 0.2296862 0.315384 0.1273127 0.2177501SNX6 sorting nexin 6 2150 +/- 178 2464 +/- 218 1646 +/- 80 1831 +/- 137 -0.003101 0.2911647 0.284639 0.1116551 0.4438647SOD1 superoxide dismutase 1, soluble (amyotrophic lateral sclerosis 1 (adult)) 15028 +/- 667 14469 +/- 400 13419 +/- 438 14140 +/- 462 -0.045138 -0.492015 0.286938 0.3010988 0.7549947SON SON DNA binding protein 2932 +/- 117 3228 +/- 54 2710 +/- 123 2947 +/- 45 -0.042723 0.0552217 0.119386 0.0395948 0.3818334SORCS3 sortilin-related VPS10 domain containing receptor 3 635 +/- 81 577 +/- 90 436 +/- 27 409 +/- 29 -0.000868 -0.638102 -0.509089 0.4266451 0.3580386SOSTDC1 sclerostin domain containing 1 136 +/- 46 171 +/- 40 63 +/- 9 50 +/- 10 -0.010743 0.5788926 -0.373539 0.3541955 0.3901666SOX10 SRY (sex determining region Y)-box 10 1512 +/- 231 1765 +/- 300 1072 +/- 119 1226 +/- 105 -0.036581 0.5194585 0.357787 0.2775658 0.2698654SOX11 SRY (sex determining region Y)-box 11 664 +/- 52 459 +/- 46 303 +/- 32 221 +/- 13 -9.38E-06 -0.014598 -0.048754 0.0117623 0.0555967SOX8 SRY (sex determining region Y)-box 8 4560 +/- 534 5166 +/- 601 3026 +/- 177 3084 +/- 58 -0.000776 0.4684656 0.76591 0.184624 0.3038223SPAG4 sperm associated antigen 4 127 +/- 23 141 +/- 18 93 +/- 13 97 +/- 6 -0.003243 0.6240954 0.756983 0.9201044 0.7807081SPAG7 sperm associated antigen 7 821 +/- 34 775 +/- 17 722 +/- 42 731 +/- 25 -0.01507 -0.268687 0.86817 0.2739969 0.7802959SPAG9 sperm associated antigen 9 477 +/- 60 705 +/- 50 407 +/- 40 498 +/- 44 -0.007115 0.0161276 0.158938 0.0151246 0.0335196SPARC secreted protein, acidic, cysteine-rich (osteonectin) 8905 +/- 463 8242 +/- 567 7668 +/- 633 7800 +/- 553 -0.024834 -0.387006 0.8783 0.0628968 0.6293729SPARCL1 SPARC-like 1 (mast9, hevin) 20455 +/- 810 21245 +/- 1040 19170 +/- 136 20139 +/- 549 -0.025195 0.5630312 0.154543 0.8203254 0.2140363
S2-genes differentially expressed across region.xls Page 69

Symbol Description Young CA Aged CA Young DG Aged DG CA v DG CA Y v A DG Y v A CA to PMI DG to PMISPCS1 signal peptidase complex subunit 1 homolog (S. cerevisiae) 6159 +/- 178 6206 +/- 222 5341 +/- 222 6203 +/- 226 -0.008114 0.8729474 0.023845 0.565696 0.2051347SPFH2 SPFH domain family, member 2 1304 +/- 91 1526 +/- 47 1181 +/- 79 1298 +/- 53 -0.04899 0.0630554 0.248438 0.0451804 0.4763109SPG21 spastic paraplegia 21 (autosomal recessive, Mast syndrome) 2258 +/- 168 2325 +/- 93 1675 +/- 47 1917 +/- 25 -0.000469 0.7353056 0.002344 0.9724206 0.0643185SPIN1 spinster 704 +/- 30 692 +/- 15 625 +/- 19 591 +/- 17 -0.001482 -0.727428 -0.215797 0.995689 0.1087393SPON1 spondin 1, extracellular matrix protein 3932 +/- 216 3444 +/- 271 2878 +/- 136 2785 +/- 177 -0.000402 -0.190823 -0.689139 0.0690268 0.2612625SPOP speckle-type POZ protein 592 +/- 40 555 +/- 12 517 +/- 14 508 +/- 19 -0.011957 -0.414847 -0.722522 0.618913 0.7034069SPRY4 sprouty homolog 4 (Drosophila) 610 +/- 57 510 +/- 59 368 +/- 27 339 +/- 21 -0.000288 -0.249621 -0.427974 0.2459985 0.7111496SPSB1 splA/ryanodine receptor domain and SOCS box containing 1 459 +/- 70 573 +/- 96 232 +/- 15 269 +/- 25 -0.001037 0.3611914 0.257303 0.3080036 0.2377916SPTLC1 serine palmitoyltransferase, long chain base subunit 1 2170 +/- 85 2440 +/- 104 1815 +/- 58 2111 +/- 70 -0.000449 0.0739814 0.010986 0.0123306 0.0526412SPTLC2 serine palmitoyltransferase, long chain base subunit 2 254 +/- 29 289 +/- 42 162 +/- 20 230 +/- 28 -0.007986 0.5073701 0.088952 0.3263208 0.2920906SQRDL sulfide quinone reductase-like (yeast) 544 +/- 35 567 +/- 50 379 +/- 39 373 +/- 14 -0.000394 0.7194467 -0.895267 0.9785462 0.5774806SRA1 steroid receptor RNA activator 1 1111 +/- 39 1011 +/- 42 978 +/- 40 910 +/- 29 -0.012648 -0.113964 -0.202639 0.214092 0.719729SREBF1 sterol regulatory element binding transcription factor 1 2104 +/- 259 2329 +/- 174 1764 +/- 82 1893 +/- 76 -0.036204 0.489834 0.279554 0.6932232 0.6517139SRGAP1 SLIT-ROBO Rho GTPase activating protein 1 181 +/- 23 118 +/- 19 124 +/- 13 113 +/- 17 -0.028159 -0.060887 -0.612146 0.3001269 0.8563141SRL sarcalumenin 199 +/- 11 222 +/- 15 157 +/- 11 153 +/- 14 -0.000216 0.2497416 -0.830879 0.1203476 0.6111236SRP72 signal recognition particle 72kDa 2192 +/- 106 2030 +/- 131 2025 +/- 105 1927 +/- 137 -0.009117 -0.360844 -0.583591 0.9166134 0.8367181SRPK1 SFRS protein kinase 1 1817 +/- 59 1693 +/- 67 1666 +/- 51 1568 +/- 49 -0.011348 -0.193987 -0.196262 0.1972328 0.1463466SRPR signal recognition particle receptor ('docking protein') 1844 +/- 37 1767 +/- 54 1683 +/- 24 1662 +/- 48 -0.000453 -0.263969 -0.721713 0.1509418 0.2228499SSBP2 Single-stranded DNA binding protein 2 148 +/- 42 473 +/- 63 131 +/- 36 339 +/- 32 -0.014338 0.0021597 0.00188 0.0049527 0.0027213SSFA2 sperm specific antigen 2 1940 +/- 120 2218 +/- 179 1740 +/- 78 1949 +/- 103 -0.038664 0.2304902 0.144994 0.094111 0.3561498SSH2 slingshot homolog 2 (Drosophila) 1235 +/- 80 1447 +/- 79 906 +/- 29 970 +/- 16 -0.000163 0.0884523 0.089311 0.0592516 0.1922352SSR2 signal sequence receptor, beta (translocon-associated protein beta) 2068 +/- 137 1585 +/- 78 1623 +/- 93 1483 +/- 68 -0.002111 -0.01556 -0.256528 0.0048081 0.1498578SSTR2 somatostatin receptor 2 181 +/- 26 94 +/- 7 135 +/- 18 66 +/- 7 -0.029494 -0.018012 -0.010197 0.0054803 0.0554253SSU72 SSU72 RNA polymerase II CTD phosphatase homolog (S. cerevisiae) 2015 +/- 93 2625 +/- 115 1716 +/- 93 2050 +/- 54 -0.001308 0.0022663 0.015168 0.1119429 0.0672956ST3GAL1 ST3 beta-galactoside alpha-2,3-sialyltransferase 1 171 +/- 22 151 +/- 13 123 +/- 12 105 +/- 10 -0.005419 -0.445923 -0.275251 0.3136454 0.1756918ST3GAL5 ST3 beta-galactoside alpha-2,3-sialyltransferase 5 3502 +/- 17 3278 +/- 141 3218 +/- 158 3058 +/- 84 -0.037835 -0.174871 -0.396941 0.2127487 0.7734036ST8SIA2 ST8 alpha-N-acetyl-neuraminide alpha-2,8-sialyltransferase 2 339 +/- 35 212 +/- 17 124 +/- 23 93 +/- 11 -6.27E-05 -0.013714 -0.261209 0.0369402 0.6086224STAC SH3 and cysteine rich domain 182 +/- 43 116 +/- 21 79 +/- 12 55 +/- 14 -0.003166 -0.218293 -0.22891 0.3123598 0.1344703STAC2 SH3 and cysteine rich domain 2 655 +/- 79 726 +/- 61 585 +/- 47 555 +/- 28 -0.014899 0.4969834 -0.601054 0.8221281 0.4048439STAP2 signal-transducing adaptor protein-2 238 +/- 28 216 +/- 22 195 +/- 19 172 +/- 16 -0.0264 -0.554155 -0.394298 0.3342414 0.4568618STARD3NLSTARD3 N-terminal like 1387 +/- 85 942 +/- 16 1203 +/- 86 834 +/- 52 -0.044391 -0.003026 -0.006158 0.0077875 0.0443081STAT4 signal transducer and activator of transcription 4 499 +/- 51 426 +/- 51 244 +/- 24 260 +/- 16 -0.000459 -0.342349 0.581356 0.1921317 0.4811733STAT5B signal transducer and activator of transcription 5B 521 +/- 41 647 +/- 33 390 +/- 30 402 +/- 19 -0.000162 0.0378386 0.730509 0.0959601 0.5692423STATIP1 signal transducer and activator of transcription 3 interacting protein 1 192 +/- 9 200 +/- 11 175 +/- 7 172 +/- 5 -0.014039 0.5761851 -0.73477 0.0715561 0.5751141STAU2 staufen, RNA binding protein, homolog 2 (Drosophila) 1544 +/- 68 1433 +/- 75 1177 +/- 94 1092 +/- 26 -0.000151 -0.299679 -0.419622 0.1505723 0.5924159STK16 serine/threonine kinase 16 1003 +/- 75 934 +/- 33 792 +/- 43 811 +/- 28 -0.002567 -0.429383 0.715518 0.1620612 0.8047645STK3 serine/threonine kinase 3 (STE20 homolog, yeast) 306 +/- 31 350 +/- 30 248 +/- 29 215 +/- 9 -0.004177 0.3258765 -0.319178 0.1444463 0.401753STK33 serine/threonine kinase 33 108 +/- 13 123 +/- 10 84 +/- 9 90 +/- 10 -0.016125 0.3829272 0.639826 0.1991779 0.8902341STK39 serine threonine kinase 39 (STE20/SPS1 homolog, yeast) 1847 +/- 187 1846 +/- 170 1220 +/- 71 1109 +/- 21 -0.000252 -0.999279 -0.184001 0.7830289 0.486802STK40 serine/threonine kinase 40 854 +/- 48 733 +/- 38 741 +/- 24 677 +/- 27 -0.017463 -0.080274 -0.10879 0.0890168 0.4602821STMN4 stathmin-like 4 6297 +/- 736 7226 +/- 726 4568 +/- 192 5124 +/- 228 -0.003472 0.3896738 0.097795 0.2333729 0.1045957STRBP spermatid perinuclear RNA binding protein 926 +/- 84 754 +/- 29 785 +/- 30 663 +/- 42 -0.037528 -0.098304 -0.049348 0.2126192 0.2508432STS steroid sulfatase (microsomal), arylsulfatase C, isozyme S 522 +/- 29 428 +/- 25 424 +/- 42 346 +/- 14 -0.021387 -0.033391 -0.124594 0.0267615 0.1852603STT3A STT3, subunit of the oligosaccharyltransferase complex, homolog A (S. cerevisiae) 1088 +/- 54 1052 +/- 27 935 +/- 47 988 +/- 32 -0.000417 -0.563674 0.378733 0.7024884 0.6669422STX12 syntaxin 12 3568 +/- 232 3187 +/- 252 2719 +/- 109 2730 +/- 137 -0.003187 -0.291729 0.951933 0.6026275 0.9246573
S2-genes differentially expressed across region.xls Page 70

Symbol Description Young CA Aged CA Young DG Aged DG CA v DG CA Y v A DG Y v A CA to PMI DG to PMISTX3 syntaxin 3 659 +/- 36 631 +/- 34 561 +/- 32 501 +/- 27 -0.001138 -0.577329 -0.18856 0.3676607 0.5598432STX4 syntaxin 4 970 +/- 42 831 +/- 53 729 +/- 27 675 +/- 33 -0.000123 -0.071429 -0.238852 0.3496419 0.8957216STYK1 serine/threonine/tyrosine kinase 1 1663 +/- 206 1301 +/- 132 1062 +/- 95 973 +/- 54 -0.014018 -0.174975 -0.43961 0.182045 0.7661065SUCLG1 succinate-CoA ligase, GDP-forming, alpha subunit 4090 +/- 140 3799 +/- 126 3291 +/- 62 3434 +/- 113 -0.000816 -0.153623 0.309941 0.0769856 0.6830995SURB7 SRB7 suppressor of RNA polymerase B homolog (yeast) 1618 +/- 167 2473 +/- 241 1436 +/- 158 2200 +/- 169 -0.002882 0.0173654 0.00959 0.0264854 0.0236746SURF1 surfeit 1 1906 +/- 52 2026 +/- 101 1667 +/- 86 1959 +/- 45 -0.001352 0.3240518 0.018135 0.7308047 0.0332671SURF4 surfeit 4 844 +/- 29 730 +/- 19 751 +/- 33 661 +/- 21 -0.005552 -0.010483 -0.048623 0.1021851 0.242073SURF5 surfeit 5 671 +/- 35 675 +/- 39 628 +/- 21 630 +/- 33 -0.019229 0.9353535 0.953853 0.4694861 0.6321273SUSD3 sushi domain containing 3 133 +/- 11 158 +/- 15 100 +/- 8 115 +/- 15 -0.001208 0.1963738 0.440701 0.0574398 0.2270891SUSD5 sushi domain containing 5 152 +/- 16 179 +/- 26 105 +/- 8 101 +/- 4 -0.004127 0.4100232 -0.696263 0.5696639 0.8611905SYBL1 synaptobrevin-like 1 2257 +/- 120 2398 +/- 173 1670 +/- 98 1902 +/- 111 -0.001637 0.5221661 0.154011 0.3264443 0.3403463SYNGR4 synaptogyrin 4 345 +/- 36 312 +/- 23 289 +/- 21 221 +/- 22 -0.008731 -0.459799 -0.054898 0.6978628 0.2609005SYNJ2 synaptojanin 2 2864 +/- 243 3440 +/- 265 2046 +/- 167 2454 +/- 148 -0.001217 0.1405879 0.099777 0.0299966 0.0826187SYNPO2L synaptopodin 2-like 274 +/- 17 355 +/- 22 261 +/- 23 265 +/- 16 -0.049675 0.0168779 0.89537 0.025081 0.8519871SYPL1 synaptophysin-like 1 3583 +/- 248 4205 +/- 292 3124 +/- 126 3310 +/- 50 -0.01368 0.1367387 0.212215 0.0555698 0.3792294SYT12 synaptotagmin XII 471 +/- 30 454 +/- 15 393 +/- 27 397 +/- 23 -5.47E-05 -0.624515 0.920903 0.5148692 0.8999209SYTL2 synaptotagmin-like 2 300 +/- 78 429 +/- 112 148 +/- 20 94 +/- 10 -0.006273 0.368996 -0.048362 0.4373566 0.1563739TAF12 TAF12 RNA polymerase II, TATA box binding protein (TBP)-associated factor, 20kDa 416 +/- 22 447 +/- 37 368 +/- 21 391 +/- 23 -0.047488 0.4921011 0.483023 0.1033617 0.3812812TAF6L TAF6-like RNA polymerase II, p300/CBP-associated factor (PCAF)-associated factor, 65k 170 +/- 28 231 +/- 29 131 +/- 18 158 +/- 11 -0.047624 0.1559957 0.222118 0.1285349 0.4286729TAF7 TAF7 RNA polymerase II, TATA box binding protein (TBP)-associated factor, 55kDa 4918 +/- 290 4864 +/- 249 4071 +/- 222 4314 +/- 212 -0.000604 -0.88971 0.44943 0.5876385 0.7835555TAGLN3 transgelin 3 8773 +/- 613 8568 +/- 590 7683 +/- 413 7384 +/- 319 -0.006774 -0.814278 -0.582208 0.3759476 0.7040371TA-NFKBHT-cell activation NFKB-like protein 182 +/- 21 157 +/- 19 149 +/- 10 111 +/- 16 -0.029674 -0.401066 -0.0836 0.3718951 0.2907645TAOK3 TAO kinase 3 1375 +/- 110 1436 +/- 84 1229 +/- 51 1163 +/- 64 -0.008837 0.6672215 -0.445797 0.6944222 0.8765451TAPBPL TAP binding protein-like 238 +/- 24 255 +/- 19 179 +/- 19 203 +/- 33 -0.014745 0.5928527 0.535816 0.3622389 0.531331TARDBP TAR DNA binding protein 6008 +/- 205 5570 +/- 111 4929 +/- 296 4904 +/- 111 -0.006981 -0.099176 -0.937517 0.0959205 0.9070113TAX1BP1 Tax1 (human T-cell leukemia virus type I) binding protein 1 2220 +/- 188 2772 +/- 275 1866 +/- 123 2493 +/- 268 -0.003659 0.1320265 0.080473 0.8374351 0.5951673TAX1BP3 Tax1 (human T-cell leukemia virus type I) binding protein 3 495 +/- 43 525 +/- 26 448 +/- 18 457 +/- 11 -0.047121 0.5539292 0.679951 0.6454881 0.6205134TBC1D12 TBC1 domain family, member 12 234 +/- 17 302 +/- 27 195 +/- 16 232 +/- 18 -0.039962 0.0609842 0.148761 0.0670071 0.8452444TBC1D14 TBC1 domain family, member 14 2125 +/- 84 1815 +/- 92 1795 +/- 52 1639 +/- 43 -0.001141 -0.031696 -0.047245 0.2222672 0.2088684TBC1D17 TBC1 domain family, member 17 1262 +/- 103 1539 +/- 80 1047 +/- 42 1261 +/- 39 -0.007657 0.0615205 0.004927 0.0854102 0.0422091TBC1D2 TBC1 domain family, member 2 166 +/- 23 136 +/- 14 98 +/- 11 126 +/- 12 -0.036608 -0.300716 0.119388 0.8193561 0.3301407TBC1D22ATBC1 domain family, member 22A 694 +/- 57 800 +/- 64 615 +/- 56 657 +/- 64 -0.032761 0.241692 0.62996 0.3037399 0.6998126TBC1D23 TBC1 domain family, member 23 1555 +/- 45 1653 +/- 46 1421 +/- 46 1451 +/- 35 -6.02E-05 0.1545906 0.60528 0.0545596 0.8447142TBC1D7 TBC1 domain family, member 7 696 +/- 65 587 +/- 30 597 +/- 40 556 +/- 8 -0.011985 -0.168953 -0.350739 0.2128575 0.3705893TBC1D9 TBC1 domain family, member 9 5875 +/- 79 5392 +/- 40 4902 +/- 118 5160 +/- 124 -0.000105 -0.000793 0.165632 0.0006887 0.6018428TBL1XR1 transducin (beta)-like 1X-linked receptor 1 6054 +/- 153 5768 +/- 138 5573 +/- 194 5567 +/- 116 -0.044855 -0.19556 -0.97936 0.3577985 0.4670105TCEB2 transcription elongation factor B (SIII), polypeptide 2 (18kDa, elongin B) 9094 +/- 408 8720 +/- 388 7768 +/- 202 7944 +/- 151 -0.000905 -0.521378 0.504044 0.522319 0.4461638TCERG1L transcription elongation regulator 1-like 650 +/- 61 622 +/- 60 279 +/- 31 220 +/- 30 -5.05E-07 -0.754584 -0.200959 0.4588186 0.662007TCF12 transcription factor 12 (HTF4, helix-loop-helix transcription factors 4) 3252 +/- 190 3452 +/- 144 2724 +/- 157 2755 +/- 41 -0.000681 0.4222045 0.856976 0.2320191 0.8009612TCF7L2 transcription factor 7-like 2 (T-cell specific, HMG-box) 1721 +/- 95 2204 +/- 120 1530 +/- 109 1712 +/- 113 -0.004094 0.0109185 0.276317 0.0005919 0.481373TETRAN tetracycline transporter-like protein 1502 +/- 79 1665 +/- 55 1324 +/- 116 1477 +/- 58 -0.017747 0.1251175 0.274168 0.170974 0.3951985TEX2 testis expressed sequence 2 2858 +/- 124 2844 +/- 75 2621 +/- 70 2533 +/- 74 -0.029018 -0.929672 -0.412529 0.8184058 0.4540058TF transferrin 7019 +/- 1463 9974 +/- 1622 4189 +/- 354 6128 +/- 572 -0.012445 0.2061852 0.024171 0.1130597 0.0107645TFG TRK-fused gene 5280 +/- 199 4443 +/- 99 4815 +/- 94 4186 +/- 147 -0.008725 -0.006472 -0.008783 0.00884 0.2431836TFPI tissue factor pathway inhibitor (lipoprotein-associated coagulation inhibitor) 202 +/- 14 337 +/- 20 145 +/- 11 265 +/- 18 -0.000333 0.0003604 0.001002 0.0062585 0.0073557
S2-genes differentially expressed across region.xls Page 71

Symbol Description Young CA Aged CA Young DG Aged DG CA v DG CA Y v A DG Y v A CA to PMI DG to PMITFPT TCF3 (E2A) fusion partner (in childhood Leukemia) 369 +/- 36 499 +/- 34 283 +/- 25 365 +/- 25 -0.000916 0.0243374 0.04248 0.0484472 0.0114551TGFBI transforming growth factor, beta-induced, 68kDa 198 +/- 33 110 +/- 12 75 +/- 20 58 +/- 9 -0.01942 -0.067467 -0.466341 0.0597685 0.586412TGFBR1 transforming growth factor, beta receptor I (activin A receptor type II-like kinase, 53kDa) 1158 +/- 54 1250 +/- 84 1057 +/- 37 1019 +/- 39 -0.015771 0.3799338 -0.498251 0.0579136 0.7932237TGIF TGFB-induced factor (TALE family homeobox) 415 +/- 35 516 +/- 83 285 +/- 28 358 +/- 24 -0.016122 0.2967985 0.075203 0.0427712 0.0772841THOC5 THO complex 5 765 +/- 46 710 +/- 24 612 +/- 40 546 +/- 21 -6.06E-07 -0.313424 -0.181253 0.5831286 0.4904124THSD1 thrombospondin, type I, domain containing 1 225 +/- 19 241 +/- 13 201 +/- 12 230 +/- 16 -0.024703 0.528681 0.179766 0.7732635 0.5771873THUMPD2 THUMP domain containing 2 297 +/- 26 340 +/- 13 273 +/- 23 267 +/- 20 -0.031588 0.1817258 -0.841428 0.1403765 0.9750369TIMM10 translocase of inner mitochondrial membrane 10 homolog (yeast) 1629 +/- 120 1047 +/- 77 1208 +/- 47 967 +/- 68 -0.01987 -0.003153 -0.021238 0.0054885 0.1440759TIMM13 translocase of inner mitochondrial membrane 13 homolog (yeast) 2117 +/- 135 2107 +/- 61 1853 +/- 52 1848 +/- 82 -0.005034 -0.948966 -0.964 0.5007031 0.6750839TM4SF18 Transmembrane 4 L six family member 18 153 +/- 13 142 +/- 18 132 +/- 13 99 +/- 14 -0.021488 -0.616619 -0.114351 0.9690264 0.2755219TM6SF1 transmembrane 6 superfamily member 1 983 +/- 82 1128 +/- 151 621 +/- 46 758 +/- 56 -0.002232 0.4238201 0.093395 0.8476168 0.3604281TM7SF2 transmembrane 7 superfamily member 2 1226 +/- 65 1455 +/- 59 1141 +/- 34 1258 +/- 73 -0.037433 0.0261398 0.201389 0.0392401 0.5412888TMBIM1 transmembrane BAX inhibitor motif containing 1 2080 +/- 216 2514 +/- 203 1362 +/- 54 1608 +/- 56 -0.000612 0.1734264 0.012063 0.0932183 0.1379688TMC6 transmembrane channel-like 6 289 +/- 73 451 +/- 67 233 +/- 44 287 +/- 28 -0.037 0.1341396 0.330175 0.0777583 0.23139TMC7 transmembrane channel-like 7 489 +/- 91 732 +/- 166 265 +/- 40 317 +/- 24 -0.009612 0.2355944 0.299908 0.0671777 0.0984577TMED10 transmembrane emp24-like trafficking protein 10 (yeast) 2096 +/- 68 2382 +/- 217 1504 +/- 99 1726 +/- 109 -0.001198 0.2557307 0.166505 0.1263812 0.4455591TMED4 transmembrane emp24 protein transport domain containing 4 1134 +/- 55 1431 +/- 104 1087 +/- 50 1361 +/- 59 -0.045916 0.0364997 0.007201 0.0773 0.0247357TMEFF1 transmembrane protein with EGF-like and two follistatin-like domains 1 2516 +/- 241 2897 +/- 346 2173 +/- 125 1935 +/- 86 -0.01485 0.3899269 -0.152192 0.1217905 0.5016522TMEM10 transmembrane protein 10 3669 +/- 618 5332 +/- 1409 1617 +/- 278 2033 +/- 179 -0.005902 0.3161815 0.24258 0.0447156 0.0692211TMEM100 transmembrane protein 100 1126 +/- 85 764 +/- 92 810 +/- 93 482 +/- 73 -8.87E-06 -0.016282 -0.021697 0.0020981 0.0122112TMEM11 transmembrane protein 11 845 +/- 33 981 +/- 25 769 +/- 31 945 +/- 37 -0.003105 0.0089299 0.006195 0.1398978 0.1068125TMEM111 transmembrane protein 111 1589 +/- 60 1468 +/- 57 1300 +/- 50 1373 +/- 62 -0.003408 -0.173349 0.384283 0.2954679 0.2599387TMEM116 transmembrane protein 116 119 +/- 13 198 +/- 25 90 +/- 10 142 +/- 15 -0.009295 0.0227208 0.023266 0.0091373 0.0654129TMEM117 transmembrane protein 117 156 +/- 17 204 +/- 36 131 +/- 14 163 +/- 23 -0.032149 0.2611902 0.282804 0.1336358 0.0299912TMEM123 transmembrane protein 123 1006 +/- 86 1324 +/- 185 668 +/- 53 697 +/- 24 -0.001602 0.1612782 0.632965 0.020275 0.7832746TMEM125 transmembrane protein 125 1877 +/- 348 2703 +/- 395 920 +/- 69 1320 +/- 139 -0.003931 0.1481536 0.042879 0.0392519 0.0982602TMEM126Atransmembrane protein 126A 3507 +/- 125 3122 +/- 143 3119 +/- 73 3024 +/- 134 -0.027968 -0.069902 -0.555831 0.0561418 0.4291045TMEM132Btransmembrane protein 132B 1274 +/- 123 930 +/- 71 1051 +/- 67 730 +/- 54 -0.001972 -0.041705 -0.004742 0.2404027 0.1566965TMEM132Ctransmembrane protein 132C 685 +/- 65 666 +/- 31 466 +/- 32 418 +/- 32 -0.00016 -0.798761 -0.318844 0.6632678 0.6726583TMEM134 transmembrane protein 134 869 +/- 72 1058 +/- 55 744 +/- 31 792 +/- 58 -0.002805 0.0660617 0.490246 0.0720144 0.2240706TMEM141 transmembrane protein 141 1178 +/- 93 1179 +/- 170 822 +/- 36 803 +/- 73 -0.001507 0.9947763 -0.823851 0.4254468 0.2983975TMEM144 transmembrane protein 144 2319 +/- 434 3785 +/- 835 1023 +/- 194 1521 +/- 159 -0.004677 0.1600789 0.078679 0.049251 0.1244338TMEM14A transmembrane protein 14A 5032 +/- 299 5119 +/- 141 4337 +/- 262 4685 +/- 423 -0.002904 0.7990582 0.507207 0.8458168 0.4591046TMEM16D transmembrane protein 16D 287 +/- 24 220 +/- 14 135 +/- 14 141 +/- 14 -2.12E-05 -0.043747 0.778349 0.0263544 0.8800053TMEM16K transmembrane protein 16K 684 +/- 69 633 +/- 20 439 +/- 19 451 +/- 16 -0.000255 -0.506042 0.633738 0.2597513 0.2615007TMEM23 transmembrane protein 23 637 +/- 52 624 +/- 26 513 +/- 52 478 +/- 15 -0.010821 -0.827126 -0.537566 0.6479802 0.4806171TMEM31 transmembrane protein 31 169 +/- 17 201 +/- 30 131 +/- 9 124 +/- 10 -0.012336 0.3774421 -0.630391 0.1461281 0.7377884TMEM32 transmembrane protein 32 1686 +/- 64 1704 +/- 35 1536 +/- 43 1602 +/- 60 -0.01792 0.8108688 0.400605 0.5529983 0.8330296TMEM41A Transmembrane protein 41A 242 +/- 11 261 +/- 18 213 +/- 6 231 +/- 9 -0.019711 0.3929711 0.155152 0.2823279 0.0867396TMEM42 transmembrane protein 42 1365 +/- 45 1466 +/- 33 1244 +/- 38 1458 +/- 62 -0.040193 0.1013395 0.022844 0.3727597 0.1865494TMEM49 transmembrane protein 49 2310 +/- 181 2124 +/- 109 1915 +/- 64 2005 +/- 98 -0.015649 -0.402536 0.463548 0.109979 0.9583833TMEM5 transmembrane protein 5 1006 +/- 53 1106 +/- 58 882 +/- 59 912 +/- 32 -0.000983 0.2340156 0.669264 0.3283794 0.9878123TMEM50B transmembrane protein 50B 10086 +/- 744 7418 +/- 951 7691 +/- 435 6249 +/- 882 -0.010509 -0.053133 -0.193944 0.0045491 0.0299147TMEM51 transmembrane protein 51 459 +/- 34 555 +/- 15 354 +/- 21 396 +/- 28 -0.000141 0.0384605 0.277148 0.1356155 0.5956454TMEM62 transmembrane protein 62 272 +/- 20 338 +/- 21 254 +/- 9 273 +/- 20 -0.024941 0.0504131 0.433539 0.0665573 0.7988088
S2-genes differentially expressed across region.xls Page 72

Symbol Description Young CA Aged CA Young DG Aged DG CA v DG CA Y v A DG Y v A CA to PMI DG to PMITMEM77 transmembrane protein 77 1008 +/- 35 1082 +/- 86 902 +/- 22 909 +/- 42 -0.008777 0.4508496 0.894352 0.0741051 0.2304578TMEM80 transmembrane protein 80 995 +/- 50 1270 +/- 42 785 +/- 32 942 +/- 27 -1.15E-05 0.0019743 0.00455 0.0025206 0.0233829TMEM91 transmembrane protein 91 837 +/- 63 517 +/- 43 501 +/- 26 438 +/- 36 -0.003916 -0.00249 -0.196617 0.0104634 0.54782TMEM95 transmembrane protein 95 431 +/- 78 521 +/- 65 295 +/- 13 314 +/- 39 -0.01145 0.3948066 0.668059 0.3866796 0.6229672TMEM97 transmembrane protein 97 1042 +/- 36 1322 +/- 88 914 +/- 45 1135 +/- 30 -0.00711 0.0231497 0.003205 0.0174164 0.0196386TMEM98 transmembrane protein 98 1104 +/- 116 1292 +/- 184 606 +/- 45 748 +/- 70 -0.001678 0.4120835 0.133539 0.072057 0.2145276TMEM99 transmembrane protein 99 1082 +/- 48 1094 +/- 40 875 +/- 47 942 +/- 20 -1.72E-05 0.855035 0.230958 0.9665876 0.5153736TMSB10 thymosin, beta 10 19055 +/- 1135 17143 +/- 1661 14060 +/- 1235 13713 +/- 1031 -0.000416 -0.367193 -0.834313 0.1867661 0.5824763TMTC2 transmembrane and tetratricopeptide repeat containing 2 1180 +/- 126 1475 +/- 241 798 +/- 46 811 +/- 49 -0.007281 0.3120659 0.85678 0.1139305 0.8947591TMTC4 transmembrane and tetratricopeptide repeat containing 4 1389 +/- 212 2022 +/- 276 751 +/- 81 984 +/- 63 -0.000888 0.1009476 0.049565 0.1159551 0.1834717TNFAIP1 tumor necrosis factor, alpha-induced protein 1 (endothelial) 1266 +/- 56 1364 +/- 79 1097 +/- 69 1144 +/- 42 -0.004513 0.3408433 0.584352 0.7164751 0.8064452TNFAIP6 tumor necrosis factor, alpha-induced protein 6 258 +/- 31 467 +/- 111 161 +/- 13 251 +/- 29 -0.02623 0.1228848 0.031792 0.012802 0.0430429TNFRSF1Atumor necrosis factor receptor superfamily, member 1A 690 +/- 39 724 +/- 15 639 +/- 33 674 +/- 26 -0.032037 0.4472086 0.410385 0.9337673 0.9435001TNFSF13 tumor necrosis factor (ligand) superfamily, member 13 626 +/- 50 900 +/- 75 508 +/- 50 663 +/- 50 -0.023771 0.0144421 0.056884 0.006527 0.1341425TNIP3 TNFAIP3 interacting protein 3 241 +/- 75 259 +/- 63 129 +/- 12 129 +/- 24 -0.017255 0.8575564 0.994032 0.7621026 0.2182326TNNT1 troponin T type 1 (skeletal, slow) 480 +/- 67 379 +/- 49 279 +/- 10 282 +/- 13 -0.004255 -0.256996 0.888727 0.1533947 0.7468215TNRC8 trinucleotide repeat containing 8 1197 +/- 27 1075 +/- 90 1008 +/- 34 991 +/- 92 -0.026475 -0.239098 -0.869522 0.0416345 0.1696799TNS3 tensin 3 5926 +/- 520 7061 +/- 361 4964 +/- 174 6047 +/- 403 -0.002609 0.1067943 0.052473 0.3937513 0.3502093TNXA tenascin XA pseudogene 497 +/- 80 915 +/- 160 295 +/- 39 476 +/- 26 -0.012749 0.0506152 0.004207 0.0098381 0.0079701TOMM7 translocase of outer mitochondrial membrane 7 homolog (yeast) 17105 +/- 620 17063 +/- 697 14743 +/- 300 16384 +/- 704 -0.031531 -0.965458 0.080481 0.955107 0.0384624TOX thymus high mobility group box protein TOX 193 +/- 43 267 +/- 53 97 +/- 33 86 +/- 18 -0.002 0.3044172 -0.781925 0.4045686 0.9984712TP53I3 tumor protein p53 inducible protein 3 233 +/- 21 323 +/- 39 196 +/- 27 222 +/- 19 -0.005994 0.0761319 0.457613 0.371556 0.9136729TP53INP2 tumor protein p53 inducible nuclear protein 2 4502 +/- 647 5735 +/- 906 2898 +/- 254 3656 +/- 275 -0.015201 0.2963812 0.074433 0.0962711 0.0598894TPBG trophoblast glycoprotein 425 +/- 74 290 +/- 22 280 +/- 32 252 +/- 29 -0.046539 -0.130069 -0.532739 0.187662 0.73036TPD52L1 tumor protein D52-like 1 1678 +/- 239 1486 +/- 175 1145 +/- 36 1308 +/- 167 -0.024544 -0.533223 0.390696 0.8205144 0.1585684TPD52L2 tumor protein D52-like 2 2130 +/- 101 2242 +/- 40 1785 +/- 74 1860 +/- 60 -0.001347 0.3376215 0.453274 0.3109445 0.4664876TPRKB TP53RK binding protein 296 +/- 6 269 +/- 11 275 +/- 21 229 +/- 14 -0.04136 -0.05871 -0.100795 0.0451972 0.4756008TPST2 tyrosylprotein sulfotransferase 2 1104 +/- 39 1008 +/- 50 1000 +/- 42 925 +/- 54 -0.018596 -0.16616 -0.307659 0.3258407 0.3255292TRAF5 TNF receptor-associated factor 5 706 +/- 45 663 +/- 42 592 +/- 28 554 +/- 14 -0.036503 -0.49623 -0.269719 0.440349 0.8873457TRAFD1 TRAF-type zinc finger domain containing 1 1185 +/- 77 1021 +/- 41 913 +/- 16 812 +/- 32 -0.000443 -0.098765 -0.028756 0.2705776 0.0476544TRAK2 trafficking protein, kinesin binding 2 2695 +/- 155 3432 +/- 218 2515 +/- 153 2941 +/- 67 -0.029831 0.0224005 0.039325 0.0113992 0.044261TRAM1 translocation associated membrane protein 1 2897 +/- 113 3090 +/- 156 2217 +/- 59 2441 +/- 84 -8.54E-05 0.3432087 0.063704 0.1270406 0.1480807TRAM1L1 translocation associated membrane protein 1-like 1 638 +/- 47 545 +/- 37 569 +/- 36 527 +/- 17 -0.049402 -0.154149 -0.325713 0.3797812 0.6716263TRAPPC3 trafficking protein particle complex 3 2640 +/- 113 2794 +/- 149 2242 +/- 126 2315 +/- 154 -0.002761 0.429548 0.720252 0.50484 0.5742297TRAPPC4 trafficking protein particle complex 4 2721 +/- 85 2573 +/- 45 2301 +/- 33 2311 +/- 111 -0.000458 -0.161868 0.936534 0.2485648 0.8590408TREML1 triggering receptor expressed on myeloid cells-like 1 204 +/- 19 240 +/- 14 170 +/- 10 186 +/- 17 -0.011396 0.1658589 0.443808 0.0938203 0.7478014TRIM22 tripartite motif-containing 22 782 +/- 58 916 +/- 73 631 +/- 35 721 +/- 51 -0.002919 0.1823005 0.186117 0.0369424 0.0455313TRIM26 tripartite motif-containing 26 633 +/- 65 690 +/- 74 540 +/- 34 483 +/- 19 -0.020513 0.5745436 -0.191967 0.3058803 0.2343582TRIM45 tripartite motif-containing 45 174 +/- 14 187 +/- 15 127 +/- 7 171 +/- 24 -0.007586 0.5376546 0.141252 0.9981157 0.6189933TRIM62 tripartite motif-containing 62 489 +/- 22 467 +/- 74 386 +/- 26 340 +/- 23 -0.013178 -0.781925 -0.215636 0.5740182 0.4832981TRIM66 tripartite motif-containing 66 399 +/- 62 451 +/- 53 306 +/- 13 323 +/- 17 -0.008839 0.5397541 0.449346 0.9670394 0.9394052TRIM8 tripartite motif-containing 8 2072 +/- 134 1995 +/- 107 1703 +/- 42 1583 +/- 45 -0.001021 -0.663793 -0.083724 0.5942171 0.0992646TRIP6 thyroid hormone receptor interactor 6 448 +/- 39 566 +/- 21 435 +/- 17 459 +/- 14 -0.045033 0.0308227 0.305349 0.1291424 0.8550607TSEN34 tRNA splicing endonuclease 34 homolog (S. cerevisiae) 991 +/- 52 1198 +/- 77 784 +/- 49 985 +/- 39 -0.00045 0.0529505 0.010934 0.3530183 0.0224772TSGA10 testis specific, 10 320 +/- 34 273 +/- 35 216 +/- 16 205 +/- 6 -0.003369 -0.355906 -0.56521 0.6339427 0.9859942
S2-genes differentially expressed across region.xls Page 73

Symbol Description Young CA Aged CA Young DG Aged DG CA v DG CA Y v A DG Y v A CA to PMI DG to PMITSHZ2 Teashirt family zinc finger 2 295 +/- 104 395 +/- 118 168 +/- 50 148 +/- 28 -0.016645 0.5416636 -0.723938 0.8433482 0.9433977TSPAN5 tetraspanin 5 7109 +/- 792 6252 +/- 373 3724 +/- 226 4003 +/- 207 -0.000629 -0.359568 0.386669 0.3452767 0.5477652TTBK2 Tau tubulin kinase 2 1287 +/- 128 1604 +/- 88 1035 +/- 99 1388 +/- 79 -8.85E-05 0.0719335 0.02098 0.0493838 0.0120741TTC1 tetratricopeptide repeat domain 1 3073 +/- 161 3032 +/- 98 2309 +/- 92 2550 +/- 73 -5.53E-05 -0.835261 0.071231 0.6220168 0.2547885TTC23 tetratricopeptide repeat domain 23 257 +/- 18 216 +/- 9 216 +/- 15 210 +/- 19 -0.021089 -0.079969 -0.830796 0.0918539 0.4283755TTL tubulin tyrosine ligase 814 +/- 54 875 +/- 68 691 +/- 38 714 +/- 29 -0.00844 0.5024002 0.639894 0.4407879 0.7570256TTLL4 tubulin tyrosine ligase-like family, member 4 380 +/- 22 458 +/- 23 287 +/- 14 309 +/- 11 -0.000194 0.0373522 0.234891 0.0031157 0.3031171TUBB2B tubulin, beta 2B 3672 +/- 237 3414 +/- 308 3355 +/- 175 2679 +/- 191 -0.021638 -0.521948 -0.029004 0.7455158 0.0914478TUBB2C tubulin, beta 2C 6113 +/- 306 5607 +/- 320 5167 +/- 184 4784 +/- 104 -0.005635 -0.28004 -0.109006 0.4483524 0.350733TUBB6 tubulin, beta 6 258 +/- 62 139 +/- 14 221 +/- 66 111 +/- 10 -0.024856 -0.113924 -0.152978 0.0931711 0.2290146TUBGCP3 tubulin, gamma complex associated protein 3 912 +/- 58 972 +/- 37 839 +/- 21 801 +/- 22 -0.00633 0.4046451 -0.247261 0.2318623 0.6549196TUFT1 tuftelin 1 796 +/- 100 1318 +/- 115 650 +/- 8 921 +/- 37 -0.01834 0.0067359 0.001405 0.0112191 0.03166TUG1 taurine upregulated gene 1 4033 +/- 292 4761 +/- 163 3178 +/- 178 3449 +/- 128 -1.29E-05 0.0617943 0.247537 0.0605662 0.3851874TXNDC11 thioredoxin domain containing 11 412 +/- 9 411 +/- 25 352 +/- 31 366 +/- 15 -0.019628 -0.986322 0.70255 0.4615681 0.908829TXNDC4 thioredoxin domain containing 4 (endoplasmic reticulum) 1246 +/- 67 1050 +/- 62 1153 +/- 88 920 +/- 29 -0.037892 -0.057809 -0.044765 0.3896292 0.2612776TXNDC5 thioredoxin domain containing 5 1374 +/- 68 1288 +/- 61 1186 +/- 38 1210 +/- 40 -0.010084 -0.37212 0.675468 0.1387274 0.6543168TXNIP thioredoxin interacting protein 5289 +/- 536 5717 +/- 204 3799 +/- 467 4165 +/- 165 -2.27E-05 0.4813546 0.486203 0.5074603 0.8279049TYMS thymidylate synthetase 239 +/- 53 386 +/- 88 103 +/- 7 138 +/- 26 -0.011587 0.1915353 0.255007 0.0685544 0.8354915TYROBP TYRO protein tyrosine kinase binding protein 1055 +/- 57 1424 +/- 146 717 +/- 24 899 +/- 63 -0.00327 0.0533008 0.041326 0.0060139 0.1496422U2AF1L2 U2 small nuclear RNA auxiliary factor 1-like 2 387 +/- 36 332 +/- 19 298 +/- 20 292 +/- 23 -0.005164 -0.21513 -0.862584 0.4774695 0.7373872UBA52 ubiquitin A-52 residue ribosomal protein fusion product 1 10074 +/- 469 10094 +/- 459 7804 +/- 222 7562 +/- 358 -1.15E-05 0.9764199 -0.583322 0.7630909 0.6502829UBAP2L ubiquitin associated protein 2-like 1045 +/- 48 1221 +/- 34 950 +/- 19 1068 +/- 43 -0.002699 0.0145306 0.047736 0.033027 0.2012221UBE1L ubiquitin-activating enzyme E1-like 415 +/- 26 418 +/- 20 349 +/- 22 313 +/- 14 -0.00034 0.9134008 -0.198316 0.6839851 0.2172874UBE2G1 ubiquitin-conjugating enzyme E2G 1 (UBC7 homolog, yeast) 643 +/- 51 771 +/- 63 502 +/- 12 695 +/- 17 -0.021358 0.150032 2.34E-05 0.3163649 0.0032084UBE2V1 ubiquitin-conjugating enzyme E2 variant 1 5462 +/- 163 4988 +/- 212 4639 +/- 86 4820 +/- 111 -0.010593 -0.108694 0.233362 0.074307 0.581624UBE3A ubiquitin protein ligase E3A (human papilloma virus E6-associated protein, Angelman syn 6737 +/- 339 5705 +/- 371 5837 +/- 154 5224 +/- 81 -0.046238 -0.067394 -0.008728 0.1696783 0.0658193UBE4A ubiquitination factor E4A (UFD2 homolog, yeast) 3607 +/- 89 3639 +/- 134 3135 +/- 59 3280 +/- 92 -0.002075 0.845674 0.228291 0.7030251 0.5943389UBL7 ubiquitin-like 7 (bone marrow stromal cell-derived) 1773 +/- 45 1687 +/- 70 1665 +/- 96 1631 +/- 70 -0.027501 -0.328403 -0.779048 0.058029 0.4958572UBOX5 U-box domain containing 5 532 +/- 29 614 +/- 41 430 +/- 21 481 +/- 13 -0.000849 0.1380396 0.070685 0.0691841 0.0095445UBP1 upstream binding protein 1 (LBP-1a) 5553 +/- 347 5901 +/- 351 4548 +/- 161 4656 +/- 108 -0.002056 0.4959916 0.592553 0.1544972 0.2652676UBQLN4 ubiquilin 4 2237 +/- 158 2044 +/- 65 1764 +/- 124 1670 +/- 82 -0.000358 -0.297369 -0.543512 0.3034843 0.9766542UCK1 uridine-cytidine kinase 1 1401 +/- 163 1218 +/- 106 1046 +/- 54 836 +/- 69 -0.004824 -0.371207 -0.04278 0.4779683 0.0327209UFC1 ubiquitin-fold modifier conjugating enzyme 1 3552 +/- 80 3489 +/- 180 3025 +/- 89 3035 +/- 152 -0.001756 -0.760268 0.95442 0.7869309 0.1523464UNC50 unc-50 homolog (C. elegans) 2544 +/- 110 2493 +/- 78 2077 +/- 115 2257 +/- 132 -0.000436 -0.713524 0.334193 0.448593 0.8387599UNC5B unc-5 homolog B (C. elegans) 1063 +/- 172 1437 +/- 225 776 +/- 87 783 +/- 33 -0.014097 0.2183388 0.946934 0.0788974 0.9331042UNQ338 LGLL338 161 +/- 17 147 +/- 13 122 +/- 13 125 +/- 22 -0.049749 -0.544891 0.895831 0.5642408 0.2403051UQCRQ ubiquinol-cytochrome c reductase, complex III subunit VII, 9.5kDa 9854 +/- 493 9051 +/- 586 7551 +/- 253 7899 +/- 364 -0.002507 -0.319624 0.456759 0.2468119 0.3634864UROD uroporphyrinogen decarboxylase 853 +/- 28 837 +/- 32 731 +/- 30 753 +/- 17 -6.12E-06 -0.703895 0.54355 0.5836733 0.3061872USMG5 upregulated during skeletal muscle growth 5 homolog (mouse) 6103 +/- 231 5953 +/- 295 5136 +/- 309 5013 +/- 98 -0.004019 -0.698373 -0.718204 0.5407318 0.9485892USP16 ubiquitin specific peptidase 16 2644 +/- 41 2740 +/- 45 2363 +/- 11 2432 +/- 39 -2.1E-05 0.1466757 0.155418 0.1155372 0.4144073USP24 ubiquitin specific peptidase 24 1423 +/- 41 1339 +/- 35 1236 +/- 71 1134 +/- 33 -0.000486 -0.15288 -0.235263 0.0665959 0.1237188USP25 ubiquitin specific peptidase 25 1181 +/- 100 1073 +/- 45 895 +/- 37 944 +/- 33 -0.007661 -0.357436 0.342985 0.2096952 0.1333635USP30 Ubiquitin specific peptidase 30 1266 +/- 52 1470 +/- 81 1076 +/- 43 1124 +/- 27 -0.000896 0.06356 0.374687 0.0663158 0.3657258USP35 ubiquitin specific peptidase 35 723 +/- 79 654 +/- 78 550 +/- 28 547 +/- 89 -0.004771 -0.548233 -0.980309 0.2181016 0.3237613USP40 Ubiquitin specific peptidase 40 406 +/- 43 522 +/- 47 286 +/- 12 340 +/- 21 -0.001279 0.0982792 0.060868 0.106011 0.3948635
S2-genes differentially expressed across region.xls Page 74

Symbol Description Young CA Aged CA Young DG Aged DG CA v DG CA Y v A DG Y v A CA to PMI DG to PMIUSP46 ubiquitin specific peptidase 46 4376 +/- 301 3749 +/- 289 3148 +/- 96 3106 +/- 71 -0.001148 -0.164097 -0.735468 0.3955782 0.9640516USP9X ubiquitin specific peptidase 9, X-linked 1393 +/- 46 1365 +/- 39 1118 +/- 44 1092 +/- 22 -3.98E-05 -0.648364 -0.612075 0.6927944 0.5020402UTRN utrophin (homologous to dystrophin) 778 +/- 80 836 +/- 96 535 +/- 37 528 +/- 26 -9.39E-05 0.6497611 -0.874117 0.8270791 0.517505UVRAG UV radiation resistance associated gene 689 +/- 38 661 +/- 28 603 +/- 8 596 +/- 17 -0.003463 -0.56975 -0.742658 0.8084487 0.8823588VAPA VAMP (vesicle-associated membrane protein)-associated protein A, 33kDa 11082 +/- 381 9798 +/- 151 10132 +/- 197 8992 +/- 317 -0.01107 -0.018084 -0.018774 0.1149009 0.004102VARSL valyl-tRNA synthetase like 979 +/- 65 917 +/- 38 794 +/- 39 773 +/- 44 -8.67E-05 -0.437222 -0.736868 0.7868086 0.8304472VAV3 vav 3 oncogene 260 +/- 51 241 +/- 33 180 +/- 15 148 +/- 16 -0.020055 -0.766793 -0.187852 0.3567513 0.1630713VCP valosin-containing protein 1102 +/- 39 1144 +/- 45 966 +/- 36 1049 +/- 44 -0.01094 0.4980118 0.1826 0.5609657 0.1624896VDAC1 voltage-dependent anion channel 1 10509 +/- 219 9821 +/- 619 8704 +/- 233 9278 +/- 468 -0.002867 -0.333655 0.314765 0.0726371 0.8313087VDAC2 voltage-dependent anion channel 2 7034 +/- 244 6827 +/- 253 6349 +/- 197 6691 +/- 271 -0.013633 -0.569095 0.338771 0.181822 0.7730682VGLL4 vestigial like 4 (Drosophila) 1518 +/- 61 1412 +/- 70 1161 +/- 30 1109 +/- 28 -7.3E-06 -0.278628 -0.235746 0.6525835 0.5326966VLDLR very low density lipoprotein receptor 1209 +/- 73 1269 +/- 119 837 +/- 53 801 +/- 52 -0.00028 0.6795589 -0.646197 0.4324676 0.6755647VMO1 vitelline membrane outer layer 1 homolog (chicken) 691 +/- 50 1261 +/- 202 543 +/- 79 843 +/- 117 -0.002328 0.0360849 0.069831 0.0180857 0.022593VPS11 vacuolar protein sorting 11 (yeast) 1606 +/- 43 1717 +/- 54 1384 +/- 37 1499 +/- 37 -1.44E-05 0.1392299 0.056107 0.6825803 0.3694175VPS25 vacuolar protein sorting 25 homolog (S. cerevisiae) 1301 +/- 19 1308 +/- 32 1166 +/- 20 1194 +/- 29 -5.53E-05 0.8506718 0.464655 0.8720726 0.839856VPS26A vacuolar protein sorting 26 homolog A (yeast) 4021 +/- 256 4122 +/- 132 3598 +/- 103 3581 +/- 174 -0.001178 0.7367235 -0.934864 0.8993346 0.8660691VPS4B vacuolar protein sorting 4 homolog B (S. cerevisiae) 1185 +/- 93 1276 +/- 45 1112 +/- 58 1113 +/- 43 -0.007193 0.4046993 0.98919 0.1550663 0.4698651VWA1 von Willebrand factor A domain containing 1 657 +/- 93 816 +/- 108 494 +/- 41 588 +/- 30 -0.021513 0.2897269 0.095404 0.2826215 0.0372321WAC WW domain containing adaptor with coiled-coil 3946 +/- 99 4045 +/- 77 3700 +/- 73 4022 +/- 31 -0.008381 0.4501341 0.005534 0.3428936 0.03231WARS tryptophanyl-tRNA synthetase 1334 +/- 60 1422 +/- 80 1043 +/- 43 1162 +/- 34 -1.83E-05 0.398165 0.059022 0.7965628 0.1886048WASPIP Wiskott-Aldrich syndrome protein interacting protein 453 +/- 53 836 +/- 159 339 +/- 48 483 +/- 31 -0.031369 0.0615464 0.036627 0.0056073 0.0362281WDFY1 WD repeat and FYVE domain containing 1 1082 +/- 175 808 +/- 190 857 +/- 69 579 +/- 68 -0.015588 -0.316252 -0.018632 0.8156256 0.2181605WDR13 WD repeat domain 13 912 +/- 48 932 +/- 53 761 +/- 28 826 +/- 29 -0.019993 0.7807711 0.140289 0.8884983 0.0187858WDR16 WD repeat domain 16 352 +/- 58 263 +/- 42 200 +/- 26 166 +/- 33 -0.030829 -0.240965 -0.440948 0.255448 0.463629WDR18 WD repeat domain 18 291 +/- 13 310 +/- 30 259 +/- 18 250 +/- 8 -0.033086 0.5805064 -0.640415 0.2445521 0.8073076WDR20 WD repeat domain 20 126 +/- 15 179 +/- 17 107 +/- 16 129 +/- 10 -0.02678 0.039402 0.281023 0.0059351 0.4156628WDR24 WD repeat domain 24 361 +/- 20 312 +/- 15 308 +/- 8 282 +/- 18 -0.001215 -0.075995 -0.24858 0.0422095 0.0070221WDR26 WD repeat domain 26 1894 +/- 85 1730 +/- 89 1521 +/- 83 1535 +/- 51 -0.000592 -0.214324 0.890893 0.5491414 0.9420649WDR51B WD repeat domain 51B 654 +/- 107 685 +/- 65 551 +/- 48 463 +/- 25 -0.02057 0.809955 -0.138971 0.5816266 0.4971565WDR54 WD repeat domain 54 1339 +/- 70 1280 +/- 65 1149 +/- 26 1125 +/- 59 -0.003338 -0.552485 -0.727311 0.7934557 0.9598929WDR71 WD repeat domain 71 1094 +/- 63 1355 +/- 56 978 +/- 43 1086 +/- 116 -0.007047 0.0110987 0.422752 0.0963653 0.7656435WDR74 WD repeat domain 74 744 +/- 14 687 +/- 26 664 +/- 37 566 +/- 24 -0.004433 -0.095725 -0.05306 0.2019727 0.1043173WIBG within bgcn homolog (Drosophila) 453 +/- 36 532 +/- 22 420 +/- 46 462 +/- 43 -0.019784 0.0950643 0.515238 0.3446929 0.9162314WIPI2 WD repeat domain, phosphoinositide interacting 2 4733 +/- 242 4270 +/- 138 3716 +/- 142 3609 +/- 94 -0.000211 -0.134098 -0.547963 0.1833678 0.9265282WNK1 WNK lysine deficient protein kinase 1 169 +/- 12 233 +/- 22 147 +/- 11 191 +/- 17 -0.025793 0.0311083 0.069392 0.0020538 0.0029629WWC1 WW, C2 and coiled-coil domain containing 1 1143 +/- 78 964 +/- 43 793 +/- 33 836 +/- 38 -0.003458 -0.082054 0.42034 0.0337062 0.6989543WWOX WW domain containing oxidoreductase 524 +/- 32 696 +/- 66 457 +/- 17 483 +/- 57 -0.018561 0.0511504 0.684042 0.0066884 0.8592822WWP1 WW domain containing E3 ubiquitin protein ligase 1 1658 +/- 161 2181 +/- 165 1410 +/- 176 1562 +/- 24 -0.003309 0.0466357 0.43057 0.0263697 0.3583863XRCC5 X-ray repair complementing defective repair in Chinese hamster cells 5 (double-strand-bre 1545 +/- 90 1864 +/- 59 1424 +/- 33 1774 +/- 97 -0.034978 0.0164915 0.019361 0.2486474 0.11865YIF1A Yip1 interacting factor homolog A (S. cerevisiae) 1268 +/- 101 1457 +/- 104 804 +/- 64 1043 +/- 52 -0.000185 0.2207861 0.017631 0.1303022 0.2988299YIPF1 Yip1 domain family, member 1 1334 +/- 99 1431 +/- 121 950 +/- 44 1022 +/- 35 -0.000469 0.5488273 0.238303 0.4843735 0.4709888YIPF6 Yip1 domain family, member 6 3308 +/- 117 3207 +/- 46 3070 +/- 67 2974 +/- 54 -0.006007 -0.451895 -0.290677 0.649032 0.1455605YPEL2 Yippee-like 2 (Drosophila) 365 +/- 62 481 +/- 70 257 +/- 19 243 +/- 15 -0.005996 0.2427428 -0.588208 0.0808224 0.373383ZA20D1 Zinc finger, A20 domain containing 1 797 +/- 84 1133 +/- 185 517 +/- 38 609 +/- 38 -0.00383 0.1419004 0.125868 0.0364418 0.0617364ZA20D2 zinc finger, A20 domain containing 2 11645 +/- 435 10719 +/- 480 10212 +/- 434 9777 +/- 415 -0.012691 -0.183482 -0.48745 0.127798 0.7192585
S2-genes differentially expressed across region.xls Page 75

Symbol Description Young CA Aged CA Young DG Aged DG CA v DG CA Y v A DG Y v A CA to PMI DG to PMIZBTB3 zinc finger and BTB domain containing 3 584 +/- 48 622 +/- 34 503 +/- 31 546 +/- 14 -0.029169 0.5292432 0.246727 0.1762176 0.2991777ZBTB5 zinc finger and BTB domain containing 5 695 +/- 27 675 +/- 14 639 +/- 23 595 +/- 12 -0.023594 -0.524185 -0.126431 0.56804 0.3206235ZC3H13 Zinc finger CCCH-type containing 13 2082 +/- 90 1605 +/- 162 1861 +/- 75 1362 +/- 193 -0.012616 -0.0334 -0.05896 0.0151073 0.0145363ZC3H5 zinc finger CCCH-type containing 5 511 +/- 50 651 +/- 39 464 +/- 35 503 +/- 41 -0.035672 0.0536802 0.490227 0.1864741 0.5588391ZDHHC14 zinc finger, DHHC-type containing 14 2530 +/- 306 2466 +/- 164 1723 +/- 79 1804 +/- 73 -0.003016 -0.858581 0.468934 0.9226812 0.293288ZDHHC20 zinc finger, DHHC-type containing 20 838 +/- 63 1262 +/- 183 760 +/- 30 734 +/- 39 -0.035345 0.0697697 -0.604544 0.0126002 0.9743389ZDHHC4 zinc finger, DHHC-type containing 4 469 +/- 18 399 +/- 36 377 +/- 25 354 +/- 10 -0.009186 -0.127043 -0.409293 0.2066598 0.5654692ZDHHC6 zinc finger, DHHC-type containing 6 2052 +/- 177 1740 +/- 44 1711 +/- 38 1629 +/- 53 -0.03551 -0.140014 -0.247338 0.1097199 0.1083696ZDHHC9 zinc finger, DHHC-type containing 9 653 +/- 64 929 +/- 196 443 +/- 58 569 +/- 38 -0.020696 0.2288252 0.106911 0.0322781 0.1316479ZFAND1 zinc finger, AN1-type domain 1 806 +/- 46 867 +/- 25 708 +/- 51 802 +/- 26 -0.044217 0.2822837 0.144424 0.7932191 0.5636639ZFAND2A zinc finger, AN1-type domain 2A 1098 +/- 80 990 +/- 53 911 +/- 72 884 +/- 28 -0.001556 -0.291699 -0.733123 0.6018191 0.955744ZFAND2B zinc finger, AN1-type domain 2B 916 +/- 53 963 +/- 40 801 +/- 19 841 +/- 33 -0.013467 0.4962933 0.331667 0.5859159 0.0196032ZFAND3 zinc finger, AN1-type domain 3 2097 +/- 52 2250 +/- 65 1871 +/- 52 1949 +/- 73 -0.00022 0.0989892 0.410971 0.2255063 0.8483913ZFHX1B Zinc finger homeobox 1b 1252 +/- 143 1470 +/- 218 1060 +/- 90 1093 +/- 95 -0.009753 0.426942 0.807767 0.177423 0.5339198ZFYVE16 zinc finger, FYVE domain containing 16 246 +/- 40 362 +/- 35 189 +/- 22 192 +/- 20 -0.005063 0.0558115 0.915161 0.0155606 0.1767158ZFYVE21 zinc finger, FYVE domain containing 21 3246 +/- 159 3737 +/- 247 2783 +/- 44 3064 +/- 118 -0.0075 0.1303818 0.074415 0.0568761 0.0938414ZKSCAN1 zinc finger with KRAB and SCAN domains 1 1152 +/- 95 1766 +/- 191 984 +/- 18 1287 +/- 34 -0.037284 0.0226658 0.000206 0.0075827 0.0004425ZNF134 zinc finger protein 134 (clone pHZ-15) 473 +/- 12 593 +/- 38 437 +/- 27 544 +/- 37 -0.049071 0.0233991 0.04835 0.0086541 0.3033516ZNF148 zinc finger protein 148 (pHZ-52) 3030 +/- 203 3016 +/- 105 2838 +/- 165 2665 +/- 78 -0.047642 -0.952843 -0.375087 0.750964 0.5023352ZNF161 zinc finger protein 161 1955 +/- 205 2188 +/- 214 1741 +/- 43 1557 +/- 39 -0.029816 0.4513335 -0.01118 0.120171 0.0720792ZNF211 zinc finger protein 211 881 +/- 58 788 +/- 34 705 +/- 45 678 +/- 28 -0.001422 -0.202526 -0.619466 0.303169 0.9279066ZNF217 zinc finger protein 217 147 +/- 16 150 +/- 10 132 +/- 17 106 +/- 14 -0.018115 0.8693352 -0.283582 0.7367072 0.4735861ZNF22 zinc finger protein 22 (KOX 15) 1474 +/- 69 1454 +/- 59 1350 +/- 37 1277 +/- 19 -0.007635 -0.826142 -0.122989 0.6502111 0.1876815ZNF281 Zinc finger protein 281 3309 +/- 170 2979 +/- 275 2498 +/- 75 2219 +/- 101 -0.000654 -0.336235 -0.058241 0.9813794 0.382401ZNF289 zinc finger protein 289, ID1 regulated 2314 +/- 152 2528 +/- 129 1889 +/- 71 1863 +/- 86 -0.001893 0.3076602 -0.818247 0.2238748 0.5133445ZNF300 zinc finger protein 300 835 +/- 75 879 +/- 60 595 +/- 19 581 +/- 5 -0.000192 0.6565088 -0.510905 0.5564632 0.2056708ZNF313 zinc finger protein 313 694 +/- 43 845 +/- 53 607 +/- 21 631 +/- 16 -0.006952 0.0520928 0.396094 0.033531 0.7041382ZNF336 zinc finger protein 336 1688 +/- 83 1861 +/- 80 1511 +/- 33 1629 +/- 15 -0.001594 0.1653536 0.013896 0.0909008 0.1093542ZNF337 zinc finger protein 337 717 +/- 131 465 +/- 26 573 +/- 81 445 +/- 36 -0.042234 -0.113773 -0.193152 0.3612534 0.6307567ZNF407 zinc finger protein 407 796 +/- 53 855 +/- 36 646 +/- 25 714 +/- 22 -0.004197 0.3899288 0.070591 0.6391975 0.4100433ZNF426 zinc finger protein 426 477 +/- 14 603 +/- 52 419 +/- 16 393 +/- 44 -0.001146 0.0609532 -0.606598 0.1545061 0.1516937ZNF443 zinc finger protein 443 305 +/- 12 327 +/- 14 278 +/- 12 250 +/- 10 -0.005324 0.2674538 -0.100752 0.2907618 0.0591832ZNF469 zinc finger protein 469 394 +/- 35 350 +/- 17 320 +/- 12 250 +/- 18 -0.002244 -0.294886 -0.015176 0.2768855 0.1902113ZNF488 zinc finger protein 488 981 +/- 105 851 +/- 94 602 +/- 64 629 +/- 23 -0.000462 -0.378014 0.69765 0.6099653 0.5675187ZNF533 zinc finger protein 533 789 +/- 59 829 +/- 51 608 +/- 84 643 +/- 77 -0.008702 0.6176858 0.765257 0.5260967 0.9135945ZNF536 zinc finger protein 536 1336 +/- 254 1954 +/- 342 1012 +/- 67 1119 +/- 56 -0.030434 0.1800763 0.250432 0.044143 0.1020454ZNF545 zinc finger protein 545 438 +/- 16 501 +/- 24 393 +/- 16 427 +/- 31 -0.002633 0.0550814 0.36234 0.0035827 0.1350272ZNF561 zinc finger protein 561 444 +/- 41 512 +/- 38 329 +/- 24 397 +/- 16 -0.001359 0.2492244 0.046431 0.617956 0.0441045ZNF565 zinc finger protein 565 993 +/- 165 973 +/- 84 880 +/- 111 771 +/- 40 -0.041348 -0.916358 -0.386275 0.5250892 0.8649062ZNF571 zinc finger protein 571 216 +/- 9 212 +/- 8 197 +/- 16 180 +/- 13 -0.020566 -0.769492 -0.441984 0.9857831 0.2785937ZNF576 zinc finger protein 576 565 +/- 15 524 +/- 23 520 +/- 16 472 +/- 34 -0.015052 -0.164166 -0.247143 0.0162655 0.1097252ZNF622 zinc finger protein 622 946 +/- 28 1045 +/- 22 741 +/- 18 848 +/- 18 -1.86E-05 0.0219261 0.002302 0.0210693 0.0499573ZNF641 zinc finger protein 641 882 +/- 68 828 +/- 35 690 +/- 34 686 +/- 43 -0.003444 -0.505211 -0.950144 0.8445956 0.3360656ZNF671 zinc finger protein 671 730 +/- 18 711 +/- 28 695 +/- 19 663 +/- 27 -0.047893 -0.569133 -0.363161 0.1577803 0.0269636ZNF692 zinc finger protein 692 586 +/- 28 567 +/- 43 502 +/- 20 514 +/- 36 -0.000916 -0.711215 0.781328 0.7696669 0.3736862
S2-genes differentially expressed across region.xls Page 76

Symbol Description Young CA Aged CA Young DG Aged DG CA v DG CA Y v A DG Y v A CA to PMI DG to PMIZNF697 zinc finger protein 697 458 +/- 22 383 +/- 9 394 +/- 27 303 +/- 1 -0.000306 -0.018619 -0.020789 0.0263098 0.033517ZNF703 zinc finger protein 703 395 +/- 42 381 +/- 50 311 +/- 25 268 +/- 13 -0.021177 -0.837298 -0.16919 0.6603022 0.2147872ZNF710 zinc finger protein 710 610 +/- 19 561 +/- 21 545 +/- 17 515 +/- 13 -0.012112 -0.118339 -0.205276 0.0168475 0.7738473ZNF9 zinc finger protein 9 6431 +/- 219 5316 +/- 196 5728 +/- 139 4867 +/- 76 -0.000164 -0.00362 -0.000742 0.0312627 0.0114342ZNFX1 zinc finger, NFX1-type containing 1 1163 +/- 84 1153 +/- 33 968 +/- 25 1002 +/- 18 -0.004144 -0.916447 0.310451 0.8141582 0.4752647ZNHIT1 zinc finger, HIT type 1 2326 +/- 104 2521 +/- 87 1892 +/- 10 1858 +/- 27 -0.000186 0.1816358 -0.289607 0.3176995 0.2491168ZSWIM6 zinc finger, SWIM-type containing 6 3973 +/- 250 3673 +/- 404 2866 +/- 104 2695 +/- 171 -0.00067 -0.544998 -0.422074 0.7667326 0.7222284
S2-genes differentially expressed across region.xls Page 77

Young vs AgedSymbol Description Young CA Aged CA Young DG Aged DG CA v DG in CA in DGUp in Both Rat and Rhesus AgingAcacb acetyl-Coenzyme A carboxylase beta 124 +/- 17 175 +/- 13 138 +/- 12 164 +/- 12 0.9431665 0.0376355 0.1522192Adam10 ADAM metallopeptidase domain 10 1557 +/- 99 1808 +/- 84 1420 +/- 70 1612 +/- 46 -0.0535771 0.0837127 0.0491171Akr7a2 aldo-keto reductase family 7, member A2 (aflatoxin aldehyde reductase) 1175 +/- 77 1379 +/- 69 853 +/- 46 1153 +/- 50 -0.0004630 0.0781494 0.0018406Akr7a3 aldo-keto reductase family 7, member A3 (aflatoxin aldehyde reductase) 722 +/- 43 917 +/- 15 718 +/- 9 959 +/- 30 0.6341318 0.0049548 0.0007634Anp32b acidic (leucine-rich) nuclear phosphoprotein 32 family, member B 5261 +/- 630 6605 +/- 629 4342 +/- 135 4863 +/- 137 -0.0208286 0.1620245 0.0241818Apod apolipoprotein D 1694 +/- 156 2698 +/- 413 1143 +/- 60 1879 +/- 176 -0.0020709 0.0605189 0.0110462Arpc1b actin related protein 2/3 complex, subunit 1B, 41kDa 265 +/- 16 338 +/- 19 206 +/- 20 235 +/- 20 -0.0011827 0.0141484 0.3219935B2m beta-2-microglobulin 7946 +/- 519 10622 +/- 678 6616 +/- 572 9837 +/- 646 -0.0207958 0.0114966 0.0051473Bzrp benzodiazapine receptor (peripheral) 565 +/- 74 798 +/- 62 374 +/- 21 504 +/- 36 -0.0033553 0.0377401 0.0184873Capn2 calpain 2, (m/II) large subunit 2440 +/- 204 3016 +/- 132 1931 +/- 137 2492 +/- 70 -0.0002235 0.0430506 0.0075702Cast calpastatin 990 +/- 127 1424 +/- 112 822 +/- 41 1048 +/- 19 -0.0116342 0.0287645 0.0015796Cd44 CD44 molecule (Indian blood group) 390 +/- 49 579 +/- 97 642 +/- 74 919 +/- 44 0.0005290 0.1243777 0.0129636Cd74 CD74 molecule, major histocompatibility complex, class II invariant chain 1810 +/- 283 3714 +/- 547 1215 +/- 171 2317 +/- 340 -0.0160328 0.0161530 0.0276289Cd81 CD81 molecule 13811 +/- 551 15425 +/- 255 12732 +/- 477 14927 +/- 743 -0.0999738 0.0323751 0.0418025Ctsl cathepsin L 1295 +/- 116 1543 +/- 70 1117 +/- 86 1413 +/- 26 -0.1059453 0.1024043 0.0172698Ctss cathepsin S 157 +/- 19 238 +/- 20 157 +/- 21 194 +/- 33 -0.2573411 0.0137798 0.3711978Dnm2 dynamin 2 623 +/- 66 744 +/- 63 541 +/- 14 626 +/- 29 -0.0401533 0.2143312 0.0406403Edg2 endothelial differentiation, lysophosphatidic acid G-protein-coupled receptor, 5091 +/- 735 6481 +/- 945 2992 +/- 289 3972 +/- 198 -0.0065174 0.2741158 0.0220017Eef1a1 eukaryotic translation elongation factor 1 alpha 1 11705 +/- 649 13512 +/- 606 11114 +/- 370 12852 +/- 588 -0.1952757 0.0694277 0.0412874Eltd1 EGF, latrophilin and seven transmembrane domain containing 1 216 +/- 15 319 +/- 20 190 +/- 19 228 +/- 17 -0.0267015 0.0022995 0.1652497Emp3 epithelial membrane protein 3 385 +/- 23 473 +/- 25 311 +/- 21 374 +/- 24 -0.0017385 0.0295194 0.0811556Faim Fas apoptotic inhibitory molecule 608 +/- 41 920 +/- 63 711 +/- 51 974 +/- 37 0.1126147 0.0027375 0.0024603Gabarap GABA(A) receptor-associated protein 11702 +/- 341 11960 +/- 190 10752 +/- 157 11400 +/- 130 -0.0017698 0.5282196 0.0112989Grik1 glutamate receptor, ionotropic, kainate 1 107 +/- 11 355 +/- 42 65 +/- 9 194 +/- 15 -0.0057951 0.0015561 0.0001762Gsn gelsolin (amyloidosis, Finnish type) 4180 +/- 541 5269 +/- 560 2845 +/- 206 3577 +/- 214 -0.0011239 0.1927344 0.0363701Hmgn2 high-mobility group nucleosomal binding domain 2 197 +/- 23 265 +/- 10 221 +/- 5 255 +/- 33 0.5194376 0.0313723 0.3765625Hrasls3 HRAS-like suppressor 3 3691 +/- 429 4571 +/- 653 2117 +/- 93 2770 +/- 179 -0.0016972 0.2900760 0.0173676Igf1r Insulin-like growth factor 1 receptor 545 +/- 60 811 +/- 50 668 +/- 61 725 +/- 86 0.4020595 0.0071628 0.6081189Insig1 insulin induced gene 1 1796 +/- 160 2510 +/- 276 2251 +/- 175 2909 +/- 224 0.1445151 0.0554641 0.0492649Lgmn legumain 2017 +/- 149 2333 +/- 156 1847 +/- 52 2339 +/- 106 -0.1475833 0.1751615 0.0060751Lyz lysozyme (renal amyloidosis) 354 +/- 21 541 +/- 71 247 +/- 38 330 +/- 29 -0.0022358 0.0455740 0.1170922Mobp myelin-associated oligodendrocyte basic protein 3329 +/- 750 6661 +/- 1634 1660 +/- 465 3347 +/- 458 -0.0295547 0.1061680 0.0297469Mpeg1 macrophage expressed gene 1 612 +/- 60 826 +/- 70 399 +/- 27 583 +/- 25 -0.0014237 0.0432552 0.0007380Nap1l1 nucleosome assembly protein 1-like 1 1463 +/- 33 1829 +/- 95 1400 +/- 79 1475 +/- 74 -0.0382093 0.0102000 0.4998684Ninj2 ninjurin 2 672 +/- 49 990 +/- 158 361 +/- 35 494 +/- 25 -0.0022306 0.1042603 0.0143672Pabpc1 Poly(A) binding protein, cytoplasmic 1 183 +/- 21 254 +/- 18 240 +/- 24 272 +/- 26 0.0738248 0.0283996 0.4009303Pex11a Peroxisomal biogenesis factor 11A 115 +/- 9 142 +/- 7 134 +/- 13 144 +/- 10 0.2226551 0.0408075 0.5452803Pkn1 protein kinase N1 1025 +/- 87 1327 +/- 101 952 +/- 42 1034 +/- 60 -0.0515847 0.0479771 0.2991313Plekhb1 pleckstrin homology domain containing, family B (evectins) member 1 6842 +/- 885 9643 +/- 1345 4705 +/- 239 6453 +/- 287 -0.0104695 0.1174381 0.0014521Ppap2b phosphatidic acid phosphatase type 2B 2720 +/- 167 3718 +/- 213 2634 +/- 127 2728 +/- 239 -0.0402748 0.0045712 0.7413099Prkch protein kinase C, eta 181 +/- 18 255 +/- 18 129 +/- 12 131 +/- 19 -0.0007280 0.0168632 0.9434525Psmb9 proteasome (prosome, macropain) subunit, beta type, 9 262 +/- 10 349 +/- 12 233 +/- 6 295 +/- 8 -0.0013274 0.0002752 0.0003673Psme2 proteasome (prosome, macropain) activator subunit 2 (PA28 beta) 821 +/- 80 977 +/- 77 784 +/- 43 921 +/- 39 -0.6965119 0.1883069 0.0424353Rab7 RAB7, member RAS oncogene family 9341 +/- 493 9851 +/- 264 7242 +/- 277 8105 +/- 249 -0.0000127 0.3893238 0.0456579Rnase4 ribonuclease, RNase A family, 4 204 +/- 17 250 +/- 22 133 +/- 12 240 +/- 28 -0.0035331 0.1324862 0.0157391S100a6 S100 calcium binding protein A6 (calcyclin) 923 +/- 64 1156 +/- 72 682 +/- 81 1085 +/- 58 -0.0020704 0.0359624 0.0031494Sds serine dehydratase 467 +/- 22 597 +/- 50 542 +/- 35 590 +/- 52 0.1669323 0.0486479 0.4692068Serpina1 serpin peptidase inhibitor, clade A (alpha-1 antiproteinase, antitrypsin), mem 442 +/- 80 836 +/- 138 331 +/- 29 562 +/- 91 -0.0572560 0.0392633 0.0620666Sgk serum/glucocorticoid regulated kinase 1969 +/- 150 2626 +/- 225 1220 +/- 179 1632 +/- 102 -0.0005393 0.0390527 0.0816104Slc15a3 solute carrier family 15, member 3 255 +/- 27 313 +/- 19 234 +/- 7 271 +/- 8 -0.0203261 0.1124988 0.0058542Slc2a5 solute carrier family 2 (facilitated glucose/fructose transporter), member 5 534 +/- 45 707 +/- 82 446 +/- 26 613 +/- 49 -0.1667049 0.1022042 0.0238476Snx1 Sorting nexin 1 172 +/- 19 261 +/- 27 175 +/- 13 234 +/- 16 -0.7803549 0.0242684 0.0202648Ssr3 signal sequence receptor, gamma (translocon-associated protein gamma) 1416 +/- 40 1776 +/- 112 1570 +/- 46 1920 +/- 158 0.0821917 0.0221610 0.0903644Tap1 transporter 1, ATP-binding cassette, sub-family B (MDR/TAP) 270 +/- 14 334 +/- 23 295 +/- 13 305 +/- 17 -0.8615634 0.0462617 0.6676726Tf transferrin 7019 +/- 1463 9974 +/- 1622 4189 +/- 354 6128 +/- 572 -0.0124450 0.2061852 0.0241712Tjp2 tight junction protein 2 (zona occludens 2) 2291 +/- 204 3125 +/- 237 2144 +/- 139 2859 +/- 124 -0.1469352 0.0240802 0.0040534Tnxa tenascin XA pseudogene 497 +/- 80 915 +/- 160 295 +/- 39 476 +/- 26 -0.0127490 0.0506152 0.0042067Tyrobp TYRO protein tyrosine kinase binding protein 1055 +/- 57 1424 +/- 146 717 +/- 24 899 +/- 63 -0.0032704 0.0533008 0.0413257Waspip Wiskott-Aldrich syndrome protein interacting protein 453 +/- 53 836 +/- 159 339 +/- 48 483 +/- 31 -0.0313687 0.0615464 0.0366266
S3- Aging related genes in rhesus and rat.xls Page 1

Young vs AgedSymbol Description Young CA Aged CA Young DG Aged DG CA v DG in CA in DGXrcc5 X-ray repair complementing defective repair in Chinese hamster cells 5 1545 +/- 90 1864 +/- 59 1424 +/- 33 1774 +/- 97 -0.0349779 0.0164915 0.0193613Down in Both Rat and Rhesus Aging StudiesAbtb2 Ankyrin repeat and BTB (POZ) domain containing 2 654 +/- 122 485 +/- 39 505 +/- 32 342 +/- 18 -0.0301841 -0.2365310 -0.0022652Acat1 acetyl-Coenzyme A acetyltransferase 1 (acetoacetyl Coenzyme A thiolase) 4099 +/- 188 3515 +/- 106 3250 +/- 137 3238 +/- 137 -0.0074670 -0.0270457 -0.9542733Accn1 amiloride-sensitive cation channel 1, neuronal (degenerin) 1925 +/- 136 1421 +/- 164 1179 +/- 59 900 +/- 42 -0.0002544 -0.0406562 -0.0043916Add1 adducin 1 (alpha) 4262 +/- 135 3716 +/- 140 3921 +/- 116 3527 +/- 163 -0.0002315 -0.0186129 -0.0860880Ap2b1 adaptor-related protein complex 2, beta 1 subunit 7691 +/- 354 5572 +/- 446 5527 +/- 121 4060 +/- 189 -0.0001268 -0.0042974 -0.0003231Atp2c1 ATPase, Ca++ transporting, type 2C, member 1 2029 +/- 118 1514 +/- 111 1497 +/- 112 1332 +/- 42 -0.0034015 -0.0098068 -0.2133815Bcl10 B-cell CLL/lymphoma 10 367 +/- 32 332 +/- 22 459 +/- 20 380 +/- 15 0.0102893 -0.3959548 -0.0114145Capns1 calpain, small subunit 1 7708 +/- 486 6177 +/- 323 7211 +/- 399 6252 +/- 282 -0.3532394 -0.0283825 -0.0828269Capzb capping protein (actin filament) muscle Z-line, beta 8247 +/- 582 6857 +/- 252 6783 +/- 248 5959 +/- 245 -0.0061274 -0.0655422 -0.0425001Chka choline kinase alpha 607 +/- 41 586 +/- 44 764 +/- 36 646 +/- 32 0.0304713 -0.7389491 -0.0352925Fxyd7 FXYD domain containing ion transport regulator 7 3435 +/- 178 2940 +/- 109 4078 +/- 119 3624 +/- 147 0.0008447 -0.0440768 -0.0424292Fyn FYN oncogene related to SRC, FGR, YES 243 +/- 42 94 +/- 25 298 +/- 27 175 +/- 27 0.0193077 -0.0148174 -0.0109022Ggh gamma-glutamyl hydrolase (conjugase, folylpolygammaglutamyl hydrolase) 1157 +/- 71 923 +/- 51 1159 +/- 47 1032 +/- 52 0.2146496 -0.0247358 -0.1036536Gnmt glycine N-methyltransferase 171 +/- 11 138 +/- 16 174 +/- 20 111 +/- 11 -0.3479966 -0.1268625 -0.0244554Gsk3a glycogen synthase kinase 3 alpha 4199 +/- 213 3357 +/- 277 4155 +/- 242 3593 +/- 133 0.7848632 -0.0381389 -0.0784960H1f0 H1 histone family, member 0 1586 +/- 121 1504 +/- 164 1458 +/- 52 1178 +/- 25 -0.0306539 -0.6962873 -0.0017378Hagh hydroxyacylglutathione hydrolase 3456 +/- 243 2690 +/- 123 2867 +/- 137 2258 +/- 72 -0.0003267 -0.0244967 -0.0051190Hnmt histamine N-methyltransferase 396 +/- 32 235 +/- 22 494 +/- 59 338 +/- 17 0.0066641 -0.0025243 -0.0449354Homer1 homer homolog 1 (Drosophila) 2901 +/- 169 2385 +/- 132 2363 +/- 91 2257 +/- 80 -0.0230777 -0.0381883 -0.4084363Kif3c kinesin family member 3C 5625 +/- 458 4054 +/- 161 4195 +/- 251 3767 +/- 99 -0.0124291 -0.0169574 -0.1604198Lphn1 latrophilin 1 3273 +/- 149 2840 +/- 165 3901 +/- 181 3300 +/- 124 0.0011972 -0.0802788 -0.0239780Map1lc3a microtubule-associated protein 1 light chain 3 alpha 3967 +/- 274 2363 +/- 245 4800 +/- 253 2961 +/- 404 0.0000747 -0.0014419 -0.0063656Mapk9 Mitogen-activated protein kinase 9 4733 +/- 223 3991 +/- 177 4745 +/- 208 4279 +/- 155 0.3865928 -0.0270888 -0.1070479Nudt4 nudix (nucleoside diphosphate linked moiety X)-type motif 4 341 +/- 23 281 +/- 33 505 +/- 25 364 +/- 47 0.0001215 -0.1679549 -0.0362152Pak3 P21 (CDKN1A)-activated kinase 3 227 +/- 18 167 +/- 19 271 +/- 16 203 +/- 14 0.0520762 -0.0482017 -0.0104975Pkia Protein kinase (cAMP-dependent, catalytic) inhibitor alpha 252 +/- 9 223 +/- 13 277 +/- 14 229 +/- 14 0.1021183 -0.0941440 -0.0411478Prdx5 peroxiredoxin 5 3941 +/- 95 3412 +/- 66 3326 +/- 71 3314 +/- 37 -0.0089121 -0.0013997 -0.8854836Ptprn2 protein tyrosine phosphatase, receptor type, N polypeptide 2 6494 +/- 194 5488 +/- 322 6194 +/- 400 5533 +/- 188 -0.5663775 -0.0274318 -0.1780531Rasgrf1 Ras protein-specific guanine nucleotide-releasing factor 1 125 +/- 16 76 +/- 11 145 +/- 12 104 +/- 10 0.0770149 -0.0314711 -0.0251922Ryr1 ryanodine receptor 1 (skeletal) 1032 +/- 27 722 +/- 33 993 +/- 101 590 +/- 54 -0.2123464 -0.0000308 -0.0085973Sema6b sema domain, transmembrane domain (TM), and cytoplasmic domain, 6B 2141 +/- 281 1472 +/- 204 2572 +/- 104 2191 +/- 53 0.0023509 -0.0859556 -0.0130934Sfxn3 sideroflexin 3 918 +/- 58 841 +/- 34 1028 +/- 50 787 +/- 44 0.5966323 -0.2905131 -0.0054915Slc31a1 solute carrier family 31 (copper transporters), member 1 325 +/- 19 228 +/- 24 334 +/- 28 277 +/- 30 0.2290539 -0.0117825 -0.1987807Slco1c1 solute carrier organic anion transporter family, member 1C1 525 +/- 72 446 +/- 45 404 +/- 18 280 +/- 27 -0.0084258 -0.3805519 -0.0063149Ssb Sjogren syndrome antigen B (autoantigen La) 2114 +/- 118 1777 +/- 99 2359 +/- 70 1882 +/- 138 0.0632167 -0.0546976 -0.0216278Sstr2 somatostatin receptor 2 181 +/- 26 94 +/- 7 135 +/- 18 66 +/- 7 -0.0294941 -0.0180115 -0.0101966Ssx2ip synovial sarcoma, X breakpoint 2 interacting protein 256 +/- 17 190 +/- 21 218 +/- 7 166 +/- 12 -0.0858889 -0.0364965 -0.0076264Stmn2 stathmin-like 2 15575 +/- 785 11635 +/- 678 13350 +/- 985 11673 +/- 910 -0.1115448 -0.0036256 -0.2426939Thy1 Thy-1 cell surface antigen 9156 +/- 962 5509 +/- 551 8393 +/- 478 6379 +/- 427 0.9248060 -0.0110921 -0.0119199Ugcg UDP-glucose ceramide glucosyltransferase 1454 +/- 63 1024 +/- 64 1638 +/- 69 1487 +/- 121 0.0160627 -0.0007334 -0.3182540Xpnpep1 X-prolyl aminopeptidase (aminopeptidase P) 1, soluble 1226 +/- 73 1063 +/- 32 1269 +/- 56 1109 +/- 24 0.3377216 -0.0807381 -0.0356985Up in Rhesus Aging Studies OnlyQtrt1 queuine tRNA-ribosyltransferase 1 (tRNA-guanine transglycosylase) 256 +/- 22 498 +/- 21 323 +/- 31 587 +/- 36 0.0208109 0.0000148 0.0004756Rab28 RAB28, member RAS oncogene family 757 +/- 67 1355 +/- 52 860 +/- 38 1404 +/- 71 0.1109075 0.0000472 0.0004438Igbp1 immunoglobulin (CD79A) binding protein 1 1965 +/- 47 2506 +/- 69 1885 +/- 71 1954 +/- 88 -0.0212182 0.0001316 0.5561280Sgce sarcoglycan, epsilon 754 +/- 60 1219 +/- 49 868 +/- 51 1204 +/- 28 0.2318045 0.0001575 0.0004831Rpl13 ribosomal protein L13 3331 +/- 242 4584 +/- 286 2546 +/- 122 3520 +/- 104 -0.0000929 0.0076985 0.0001885Cct3 chaperonin containing TCP1, subunit 3 (gamma) 2068 +/- 138 2872 +/- 102 1999 +/- 97 2727 +/- 72 -0.0511476 0.0010854 0.0002178Tfpi tissue factor pathway inhibitor (lipoprotein-associated coagulation inhibitor) 202 +/- 14 337 +/- 20 145 +/- 11 265 +/- 18 -0.0003335 0.0003604 0.0010016Gpm6B glycoprotein M6B 5149 +/- 133 6879 +/- 254 6195 +/- 386 7340 +/- 323 0.0268381 0.0003929 0.0492732Rps15A ribosomal protein S15a 14626 +/- 477 16659 +/- 556 11527 +/- 341 13684 +/- 211 -0.0000040 0.0199780 0.0006419Nasp Nuclear autoantigenic sperm protein (histone-binding) 466 +/- 56 813 +/- 84 458 +/- 42 736 +/- 35 -0.0708711 0.0078378 0.0006624Rbm3 RNA binding motif (RNP1, RRM) protein 3 669 +/- 111 1358 +/- 95 805 +/- 127 1331 +/- 55 0.3776472 0.0008674 0.0071442Cox6C cytochrome c oxidase subunit VIc 7080 +/- 300 8976 +/- 497 6419 +/- 237 8142 +/- 260 -0.0271562 0.0110211 0.0009592Nup62 nucleoporin 62kDa 885 +/- 11 1158 +/- 43 1053 +/- 49 1241 +/- 35 0.0141701 0.0009882 0.0126909Rps6Kb1 ribosomal protein S6 kinase, 70kDa, polypeptide 1 1507 +/- 66 2010 +/- 89 1589 +/- 57 1912 +/- 83 -0.8305136 0.0013009 0.0138070Pfkfb2 6-phosphofructo-2-kinase/fructose-2,6-biphosphatase 2 531 +/- 38 759 +/- 35 440 +/- 25 533 +/- 18 -0.0007897 0.0013335 0.0146411Slc11A2 solute carrier family 11 (proton-coupled divalent metal ion transporters), mem 475 +/- 88 1020 +/- 94 461 +/- 69 952 +/- 81 -0.3381127 0.0017448 0.0015062
S3- Aging related genes in rhesus and rat.xls Page 2

Young vs AgedSymbol Description Young CA Aged CA Young DG Aged DG CA v DG in CA in DGMybbp1A MYB binding protein (P160) 1a 227 +/- 13 300 +/- 10 267 +/- 21 271 +/- 13 0.7416572 0.0015408 0.8770270Slc22A18 solute carrier family 22 (organic cation transporter), member 18 269 +/- 23 400 +/- 39 191 +/- 11 317 +/- 21 -0.0021577 0.0198389 0.0016195Pa2G4 proliferation-associated 2G4, 38kDa 712 +/- 69 939 +/- 45 885 +/- 51 1182 +/- 44 0.0003316 0.0231989 0.0017518Cbr4 Carbonyl reductase 4 86 +/- 10 138 +/- 8 105 +/- 19 109 +/- 10 -0.8829589 0.0021832 0.8718192Rab8A RAB8A, member RAS oncogene family 660 +/- 25 807 +/- 25 552 +/- 11 656 +/- 19 -0.0000622 0.0021892 0.0024208Cd52 CD52 molecule 303 +/- 58 621 +/- 52 251 +/- 51 388 +/- 37 -0.0151501 0.0023325 0.0574541Psma3 proteasome (prosome, macropain) subunit, alpha type, 3 1537 +/- 38 1871 +/- 67 1481 +/- 61 1913 +/- 144 -0.6547428 0.0025823 0.0363393Cstb cystatin B (stefin B) 6756 +/- 454 7724 +/- 450 6112 +/- 199 7133 +/- 147 -0.0304870 0.1610221 0.0027462Icam1 intercellular adhesion molecule 1 (CD54), human rhinovirus receptor 120 +/- 10 185 +/- 13 126 +/- 9 167 +/- 8 -0.5099021 0.0027757 0.0079736Eif3S7 eukaryotic translation initiation factor 3, subunit 7 zeta, 66/67kDa 2662 +/- 54 2791 +/- 67 2401 +/- 59 2691 +/- 31 -0.0040374 0.1657818 0.0028384Wbp1 WW domain binding protein 1 1823 +/- 116 2506 +/- 129 1839 +/- 149 2251 +/- 134 -0.1118393 0.0028595 0.0697452Foxo1A forkhead box O1A (rhabdomyosarcoma) 720 +/- 44 1108 +/- 81 1000 +/- 116 1225 +/- 114 0.0467044 0.0031203 0.1999455Comt catechol-O-methyltransferase 2761 +/- 143 3402 +/- 147 2879 +/- 124 3569 +/- 121 0.3771375 0.0106563 0.0031852Hnrpl heterogeneous nuclear ribonucleoprotein L 5232 +/- 292 6250 +/- 170 6161 +/- 225 7259 +/- 144 0.0006335 0.0167305 0.0032344Kif3A kinesin family member 3A 6022 +/- 351 7526 +/- 490 5756 +/- 353 7952 +/- 415 0.9322618 0.0338848 0.0034460Gclm glutamate-cysteine ligase, modifier subunit 771 +/- 36 943 +/- 26 851 +/- 27 1048 +/- 44 0.0142308 0.0036647 0.0072509Crnkl1 Crn, crooked neck-like 1 (Drosophila) 267 +/- 89 512 +/- 56 270 +/- 68 595 +/- 45 0.4404922 0.0464274 0.0036829Coq3 coenzyme Q3 homolog, methyltransferase (S. cerevisiae) 962 +/- 18 1137 +/- 65 967 +/- 22 1098 +/- 25 -0.8171245 0.0430001 0.0038244Tas2R14 Taste receptor, type 2, member 14 101 +/- 20 203 +/- 19 104 +/- 21 230 +/- 27 0.3959057 0.0044384 0.0059735Pigs phosphatidylinositol glycan, class S 2823 +/- 73 3263 +/- 183 2696 +/- 71 3307 +/- 125 -0.8260991 0.0625930 0.0044961Golga2 golgi autoantigen, golgin subfamily a, 2 80 +/- 6 112 +/- 6 118 +/- 19 140 +/- 9 0.0095632 0.0047140 0.3287570Pdk3 Pyruvate dehydrogenase kinase, isozyme 3 704 +/- 98 960 +/- 111 993 +/- 129 1593 +/- 94 0.0004963 0.1138820 0.0047699Exoc7 exocyst complex component 7 228 +/- 32 391 +/- 33 285 +/- 12 351 +/- 36 0.5131319 0.0049690 0.1443382Slc12A9 solute carrier family 12 (potassium/chloride transporters), member 9 1093 +/- 101 1413 +/- 80 1023 +/- 47 1257 +/- 43 -0.0694043 0.0331331 0.0050508Hla-Dma major histocompatibility complex, class II, DM alpha 100 +/- 12 213 +/- 26 81 +/- 17 132 +/- 17 -0.0381701 0.0051739 0.0622950Ptk2 PTK2 protein tyrosine kinase 2 352 +/- 24 487 +/- 29 419 +/- 31 528 +/- 44 0.0914861 0.0053450 0.0810219Pvalb parvalbumin 391 +/- 24 469 +/- 50 287 +/- 22 418 +/- 28 -0.0202594 0.1995472 0.0058419Pgam1 phosphoglycerate mutase 1 (brain) 11785 +/- 417 13568 +/- 474 10224 +/- 320 12402 +/- 471 -0.0014795 0.0183042 0.0060177Glg1 golgi apparatus protein 1 4000 +/- 666 6938 +/- 706 3906 +/- 536 6715 +/- 578 -0.6644467 0.0127739 0.0064554Ctnnb1 Catenin (cadherin-associated protein), beta 1, 88kDa 80 +/- 20 240 +/- 38 98 +/- 21 283 +/- 59 0.2020876 0.0064958 0.0312557Etfdh electron-transferring-flavoprotein dehydrogenase 382 +/- 17 463 +/- 16 356 +/- 16 395 +/- 22 -0.0118249 0.0066056 0.1909748Prkaa1 protein kinase, AMP-activated, alpha 1 catalytic subunit 294 +/- 22 397 +/- 21 287 +/- 16 334 +/- 20 -0.0730364 0.0066895 0.1038060Prkab2 protein kinase, AMP-activated, beta 2 non-catalytic subunit 697 +/- 64 885 +/- 68 772 +/- 23 952 +/- 40 0.0795326 0.0722526 0.0067765Gstt1 Glutathione S-transferase theta 1 180 +/- 17 259 +/- 19 171 +/- 15 240 +/- 13 -0.6973574 0.0126606 0.0074401Aldh3A1 aldehyde dehydrogenase 3 family, memberA1 99 +/- 11 267 +/- 57 115 +/- 22 357 +/- 54 0.1926285 0.0317146 0.0081362Rtcd1 RNA terminal phosphate cyclase domain 1 145 +/- 9 194 +/- 12 137 +/- 5 174 +/- 10 -0.1042368 0.0082334 0.0170400Hdac6 histone deacetylase 6 858 +/- 46 1082 +/- 96 763 +/- 14 907 +/- 33 -0.0110853 0.0726796 0.0086251Ppia peptidylprolyl isomerase A (cyclophilin A) 281 +/- 45 463 +/- 32 349 +/- 57 440 +/- 15 0.1857574 0.0089627 0.1748525Fbp1 fructose-1,6-bisphosphatase 1 89 +/- 10 125 +/- 32 81 +/- 8 136 +/- 13 0.7590811 0.3232018 0.0091964Scfd1 sec1 family domain containing 1 83 +/- 2 121 +/- 10 105 +/- 6 109 +/- 8 0.7154337 0.0094376 0.7336046Acaa2 acetyl-Coenzyme A acyltransferase 2 (mitochondrial 3-oxoacyl-Coenzyme A 589 +/- 56 854 +/- 62 529 +/- 31 645 +/- 33 -0.0389698 0.0097889 0.0301529Rps24 ribosomal protein S24 19440 +/- 754 21550 +/- 931 17416 +/- 712 21538 +/- 983 -0.0889793 0.1101938 0.0101360Nudt5 nudix (nucleoside diphosphate linked moiety X)-type motif 5 884 +/- 75 1105 +/- 67 672 +/- 11 954 +/- 63 -0.0035642 0.0533906 0.0101613Cycs cytochrome c, somatic 1114 +/- 69 1523 +/- 105 1124 +/- 93 1485 +/- 52 -0.9949297 0.0103416 0.0101909Nrp2 neuropilin 2 178 +/- 27 256 +/- 23 279 +/- 17 347 +/- 12 0.0018426 0.0546684 0.0102310Gja1 gap junction protein, alpha 1, 43kDa (connexin 43) 11658 +/- 328 13350 +/- 420 12800 +/- 751 13085 +/- 225 0.3273443 0.0106693 0.7288143Sfxn5 Sideroflexin 5 157 +/- 8 208 +/- 14 190 +/- 13 226 +/- 9 0.0109338 0.0109709 0.0519195Emp2 epithelial membrane protein 2 131 +/- 20 209 +/- 17 138 +/- 17 214 +/- 16 0.4980607 0.0133384 0.0112681Smyd2 SET and MYND domain containing 2 109 +/- 17 181 +/- 16 144 +/- 19 192 +/- 26 0.0151438 0.0113553 0.1804340Gnb2L1 guanine nucleotide binding protein (G protein), beta polypeptide 2-like 1 8227 +/- 314 9584 +/- 311 7947 +/- 439 9269 +/- 228 -0.1775069 0.0118215 0.0303457Tgoln2 trans-golgi network protein 2 6539 +/- 384 7975 +/- 222 6466 +/- 326 7084 +/- 273 -0.1784386 0.0119243 0.1799392Dpm2 dolichyl-phosphate mannosyltransferase polypeptide 2, regulatory subunit 870 +/- 18 1041 +/- 46 787 +/- 41 847 +/- 24 -0.0045859 0.0119429 0.2420499Psmd4 proteasome (prosome, macropain) 26S subunit, non-ATPase, 4 2476 +/- 113 2897 +/- 73 2016 +/- 75 2132 +/- 95 -0.0000149 0.0127068 0.3640977Nr3C1 Nuclear receptor subfamily 3, group C, member 1 (glucocorticoid receptor) 263 +/- 52 681 +/- 115 326 +/- 52 464 +/- 66 -0.2665340 0.0127770 0.1384024Mapre1 microtubule-associated protein, RP/EB family, member 1 1826 +/- 135 2236 +/- 182 1327 +/- 73 1595 +/- 31 -0.0003278 0.1033306 0.0128438Kif5A kinesin family member 5A 2488 +/- 627 4967 +/- 527 2216 +/- 519 3839 +/- 250 -0.0254831 0.0131554 0.0255153Ptpn21 Protein tyrosine phosphatase, non-receptor type 21 156 +/- 37 305 +/- 48 153 +/- 15 276 +/- 31 -0.1743656 0.0360460 0.0133489Cugbp2 CUG triplet repeat, RNA binding protein 2 1263 +/- 229 2289 +/- 319 1772 +/- 270 3161 +/- 347 0.0089862 0.0280230 0.0134923Itgb4 integrin, beta 4 433 +/- 101 626 +/- 98 854 +/- 90 1205 +/- 70 0.0000403 0.1993225 0.0136368Ncam1 neural cell adhesion molecule 1 374 +/- 80 1218 +/- 237 262 +/- 43 746 +/- 266 -0.0316066 0.0144410 0.1428245
S3- Aging related genes in rhesus and rat.xls Page 3

Young vs AgedSymbol Description Young CA Aged CA Young DG Aged DG CA v DG in CA in DGThedc1 thioesterase domain containing 1 35 +/- 9 287 +/- 70 65 +/- 11 160 +/- 25 -0.2943253 0.0152784 0.0148744Cntn1 contactin 1 1106 +/- 69 1435 +/- 87 1088 +/- 58 1302 +/- 69 -0.2678585 0.0149104 0.0435794Hsd11B1 hydroxysteroid (11-beta) dehydrogenase 1 182 +/- 39 214 +/- 25 78 +/- 15 136 +/- 13 -0.0095581 0.5032791 0.0150164Rchy1 ring finger and CHY zinc finger domain containing 1 986 +/- 103 1349 +/- 54 982 +/- 90 1245 +/- 17 -0.3680508 0.0152129 0.0317875Slc4A7 solute carrier family 4, sodium bicarbonate cotransporter, member 7 1387 +/- 232 3599 +/- 647 1815 +/- 290 4114 +/- 614 0.0968112 0.0171541 0.0156976Bax BCL2-associated X protein 831 +/- 23 877 +/- 24 728 +/- 13 807 +/- 21 -0.0002679 0.1884430 0.0161400Ptp4A2 protein tyrosine phosphatase type IVA, member 2 6286 +/- 287 7210 +/- 518 5634 +/- 234 7240 +/- 434 -0.3881091 0.1580916 0.0164181Atf1 Activating transcription factor 1 660 +/- 47 833 +/- 36 824 +/- 43 894 +/- 69 0.0855870 0.0165201 0.4139316Itgam integrin, alpha M (complement component 3 receptor 3 subunit) 332 +/- 23 412 +/- 12 323 +/- 26 348 +/- 34 -0.1719967 0.0167668 0.5845841Ufd1L ubiquitin fusion degradation 1 like (yeast) 1115 +/- 186 1832 +/- 170 1206 +/- 182 1617 +/- 52 -0.8846977 0.0175615 0.0738794Cxxc4 CXXC finger 4 336 +/- 31 432 +/- 16 266 +/- 21 359 +/- 24 -0.0043239 0.0253939 0.0176697Mfn2 mitofusin 2 4230 +/- 255 4976 +/- 285 3779 +/- 52 4823 +/- 275 -0.1321544 0.0800305 0.0179208Surf1 surfeit 1 1906 +/- 52 2026 +/- 101 1667 +/- 86 1959 +/- 45 -0.0013522 0.3240518 0.0181346Mcam melanoma cell adhesion molecule 1170 +/- 212 1662 +/- 293 589 +/- 48 817 +/- 61 -0.0043207 0.2075345 0.0187982Cdk5Rap3 CDK5 regulatory subunit associated protein 3 2040 +/- 139 2326 +/- 68 1983 +/- 100 2344 +/- 76 -0.9127573 0.1059012 0.0188578Prss21 protease, serine, 21 (testisin) 154 +/- 18 182 +/- 13 167 +/- 4 246 +/- 21 0.0202638 0.2276938 0.0191110Chst3 carbohydrate (chondroitin 6) sulfotransferase 3 639 +/- 84 773 +/- 125 385 +/- 5 482 +/- 26 -0.0051464 0.3983593 0.0194651Usp14 ubiquitin specific peptidase 14 (tRNA-guanine transglycosylase) 1553 +/- 103 1788 +/- 135 1582 +/- 72 1981 +/- 114 0.4919039 0.1987562 0.0210156Mbp myelin basic protein 267 +/- 30 382 +/- 30 198 +/- 26 233 +/- 24 -0.0020672 0.0221518 0.3568898Mrps15 mitochondrial ribosomal protein S15 1027 +/- 36 1142 +/- 68 917 +/- 42 1056 +/- 29 -0.0564321 0.1731679 0.0239796Pgam2 phosphoglycerate mutase 2 (muscle) 175 +/- 19 219 +/- 19 163 +/- 19 222 +/- 6 -0.9459678 0.1251703 0.0241524Tfpt TCF3 (E2A) fusion partner (in childhood Leukemia) 369 +/- 36 499 +/- 34 283 +/- 25 365 +/- 25 -0.0009157 0.0243374 0.0424801Cald1 caldesmon 1 84 +/- 6 130 +/- 15 132 +/- 8 136 +/- 6 0.0056260 0.0251705 0.7102261Lifr leukemia inhibitory factor receptor alpha 2392 +/- 272 3256 +/- 164 2200 +/- 139 2374 +/- 110 -0.0238676 0.0256460 0.3505753Megf10 multiple EGF-like-domains 10 775 +/- 88 1122 +/- 99 648 +/- 44 768 +/- 24 -0.0257209 0.0259818 0.0456957Znf384 zinc finger protein 384 657 +/- 34 714 +/- 19 682 +/- 19 758 +/- 21 0.1644873 0.1755146 0.0262426Emd emerin (Emery-Dreifuss muscular dystrophy) 883 +/- 36 950 +/- 27 898 +/- 19 978 +/- 23 0.5449752 0.1708619 0.0266424Cul5 cullin 5 2810 +/- 145 3330 +/- 140 3029 +/- 94 3332 +/- 99 0.3701530 0.0273875 0.0549282Timm17A translocase of inner mitochondrial membrane 17 homolog A (yeast) 4599 +/- 193 5229 +/- 399 4545 +/- 37 5734 +/- 354 0.2577344 0.1964322 0.0279685Plxna3 plexin A3 205 +/- 22 318 +/- 36 319 +/- 36 416 +/- 24 0.0173357 0.0281193 0.0548365Tjp1 tight junction protein 1 (zona occludens 1) 881 +/- 94 1108 +/- 148 851 +/- 67 1056 +/- 37 -0.3393285 0.2295937 0.0297285Snap91 synaptosomal-associated protein, 91kDa homolog (mouse) 10224 +/- 579 10352 +/- 809 10870 +/- 483 12419 +/- 359 0.0166552 0.9003596 0.0307305Cox5B cytochrome c oxidase subunit Vb 6825 +/- 788 9221 +/- 528 4736 +/- 885 7292 +/- 122 -0.0000318 0.0331089 0.0338796Ada adenosine deaminase 265 +/- 19 352 +/- 29 341 +/- 51 373 +/- 25 0.1306048 0.0331452 0.5933048Yme1L1 YME1-like 1 (S. cerevisiae) 3560 +/- 193 4334 +/- 244 3653 +/- 205 4168 +/- 128 -0.8001904 0.0331531 0.0657470Pfkl phosphofructokinase, liver 1784 +/- 148 1890 +/- 147 1627 +/- 63 1907 +/- 88 -0.8612850 0.6198749 0.0337229Wnt5A wingless-type MMTV integration site family, member 5A 485 +/- 51 763 +/- 107 574 +/- 90 877 +/- 81 0.2343027 0.0504035 0.0341374Uqcrc1 ubiquinol-cytochrome c reductase core protein I 5480 +/- 38 5588 +/- 258 5191 +/- 86 5734 +/- 178 -0.4680811 0.6955350 0.0344393Txnl1 thioredoxin-like 1 2413 +/- 328 2952 +/- 186 3020 +/- 129 3692 +/- 218 0.0116165 0.1909979 0.0344896Lnpep leucyl/cystinyl aminopeptidase 2120 +/- 127 2540 +/- 116 2687 +/- 122 2808 +/- 110 0.0035853 0.0351572 0.4785739Chm choroideremia (Rab escort protein 1) 1904 +/- 130 2177 +/- 95 1862 +/- 132 2272 +/- 98 0.9895516 0.1232673 0.0354721Pdgfa platelet-derived growth factor alpha polypeptide 71 +/- 16 134 +/- 20 87 +/- 13 170 +/- 42 0.2924605 0.0358641 0.1192919Mxi1 MAX interactor 1 6342 +/- 614 7312 +/- 652 4531 +/- 138 5071 +/- 166 -0.0005043 0.3040709 0.0362927Eif5B eukaryotic translation initiation factor 5B 746 +/- 19 848 +/- 36 734 +/- 20 791 +/- 15 -0.2524863 0.0371269 0.0522234Stat5B signal transducer and activator of transcription 5B 521 +/- 41 647 +/- 33 390 +/- 30 402 +/- 19 -0.0001616 0.0378386 0.7305091Lyk5 protein kinase LYK5 1182 +/- 41 1209 +/- 34 1201 +/- 21 1266 +/- 17 0.3933912 0.6225568 0.0388311Ogg1 8-oxoguanine DNA glycosylase 301 +/- 28 351 +/- 24 298 +/- 15 364 +/- 22 0.7001058 0.2095177 0.0394676Dbt dihydrolipoamide branched chain transacylase E2 462 +/- 33 608 +/- 51 504 +/- 30 557 +/- 59 -0.4121075 0.0398338 0.4561002Serpinb6 serpin peptidase inhibitor, clade B (ovalbumin), member 6 139 +/- 16 197 +/- 19 232 +/- 20 249 +/- 10 0.0035434 0.0405549 0.4693888Mkln1 muskelin 1, intracellular mediator containing kelch motifs 727 +/- 42 901 +/- 60 770 +/- 27 780 +/- 19 -0.5074141 0.0406878 0.7599058Cdc25A cell division cycle 25A 235 +/- 35 330 +/- 18 224 +/- 25 264 +/- 25 -0.0418073 0.0419309 0.2859052Kidins220 Kinase D-interacting substance of 220 kDa 221 +/- 98 520 +/- 82 208 +/- 72 376 +/- 75 -0.0339253 0.0420293 0.1420246Arrb1 arrestin, beta 1 380 +/- 17 456 +/- 27 349 +/- 27 389 +/- 28 -0.1563952 0.0424103 0.3310625Rpl30 ribosomal protein L30 15248 +/- 656 16050 +/- 750 15243 +/- 600 17322 +/- 644 0.2488685 0.4397322 0.0433302Nupl1 nucleoporin like 1 80 +/- 12 133 +/- 19 138 +/- 7 175 +/- 24 0.0003569 0.0436761 0.2121140Apbb1 amyloid beta (A4) precursor protein-binding, family B, member 1 (Fe65) 5027 +/- 303 5203 +/- 381 4570 +/- 115 4883 +/- 59 -0.1535392 0.7245922 0.0441443Man2A1 Mannosidase, alpha, class 2A, member 1 1559 +/- 217 2028 +/- 286 855 +/- 94 1116 +/- 57 -0.0005909 0.2219283 0.0442734Edg7 Endothelial differentiation, lysophosphatidic acid G-protein-coupled receptor, 906 +/- 85 1108 +/- 56 920 +/- 115 1256 +/- 85 0.2705779 0.0789611 0.0446720Srd5A1 steroid-5-alpha-reductase, alpha polypeptide 1 (3-oxo-5 alpha-steroid delta 4 264 +/- 147 539 +/- 62 255 +/- 133 609 +/- 56 0.5887142 0.1303820 0.0447201Taldo1 transaldolase 1 955 +/- 59 1652 +/- 264 1013 +/- 64 1727 +/- 292 0.6311775 0.0454565 0.0696408
S3- Aging related genes in rhesus and rat.xls Page 4

Young vs AgedSymbol Description Young CA Aged CA Young DG Aged DG CA v DG in CA in DGSlc26A2 solute carrier family 26 (sulfate transporter), member 2 87 +/- 10 217 +/- 49 135 +/- 50 223 +/- 61 0.4187154 0.0457219 0.2943412Serpinf1 serpin peptidase inhibitor, clade F (alpha-2 antiplasmin, pigment epithelium d 508 +/- 96 868 +/- 124 280 +/- 49 579 +/- 121 -0.0018758 0.0462446 0.0678895Nisch nischarin 262 +/- 23 343 +/- 27 377 +/- 20 423 +/- 44 0.0084632 0.0475203 0.3831798Acy1 aminoacylase 1 493 +/- 28 523 +/- 20 435 +/- 30 520 +/- 22 -0.0727130 0.3972113 0.0487243Down in Rhesus Aging Studies OnlyStrbp spermatid perinuclear RNA binding protein 926 +/- 84 754 +/- 29 785 +/- 30 663 +/- 42 -0.0375280 -0.0983040 -0.0493482Rasgrf2 Ras protein-specific guanine nucleotide-releasing factor 2 335 +/- 22 273 +/- 17 423 +/- 53 365 +/- 12 0.0152537 -0.0481425 -0.3336087Ubc ubiquitin C 6672 +/- 739 5772 +/- 426 7116 +/- 734 5191 +/- 278 -0.8565367 -0.3216693 -0.0472473Gnb5 guanine nucleotide binding protein (G protein), beta 5 2978 +/- 211 2392 +/- 140 2607 +/- 211 2224 +/- 172 -0.1263201 -0.0465412 -0.1926185Rac1 ras-related C3 botulinum toxin substrate 1 (rho family, small GTP binding pro 4505 +/- 188 3402 +/- 520 4425 +/- 250 3002 +/- 507 -0.6489174 -0.0910153 -0.0459855Myo1B myosin IB 240 +/- 40 180 +/- 30 189 +/- 25 121 +/- 13 -0.0197776 -0.2509192 -0.0456126Syt11 synaptotagmin XI 2979 +/- 924 523 +/- 91 2747 +/- 804 738 +/- 96 -0.7192157 -0.0449002 -0.0544050Ggtl3 gamma-glutamyltransferase-like 3 2529 +/- 133 2114 +/- 121 2837 +/- 156 2630 +/- 103 0.0017072 -0.0442082 -0.2981175Arhgef7 Rho guanine nucleotide exchange factor (GEF) 7 3467 +/- 223 2866 +/- 102 2911 +/- 102 2790 +/- 61 -0.0283798 -0.0436735 -0.3363678Sdhc succinate dehydrogenase complex, subunit C, integral membrane protein, 15 1763 +/- 91 1634 +/- 45 1610 +/- 52 1461 +/- 35 -0.0006076 -0.2429239 -0.0436667Kcnh2 potassium voltage-gated channel, subfamily H (eag-related), member 2 579 +/- 45 458 +/- 18 529 +/- 26 467 +/- 29 -0.6410461 -0.0431321 -0.1478153Phlda1 pleckstrin homology-like domain, family A, member 1 421 +/- 36 319 +/- 24 453 +/- 52 320 +/- 63 0.7121824 -0.0430721 -0.1408083Pdgfb platelet-derived growth factor beta polypeptide (simian sarcoma viral (v-sis) o 468 +/- 21 394 +/- 23 454 +/- 37 444 +/- 37 0.7005402 -0.0429013 -0.8469609Atp5D ATP synthase, H+ transporting, mitochondrial F1 complex, delta subunit 1719 +/- 90 1425 +/- 89 2012 +/- 103 1836 +/- 84 0.0005180 -0.0426828 -0.2155545Gorasp2 golgi reassembly stacking protein 2, 55kDa 1888 +/- 69 1700 +/- 21 1893 +/- 58 1861 +/- 71 0.1220173 -0.0407395 -0.7377233Casp6 Caspase 6, apoptosis-related cysteine peptidase 345 +/- 21 260 +/- 29 301 +/- 24 283 +/- 18 -0.2331043 -0.0403679 -0.5666451Coro7 coronin 7 1060 +/- 57 830 +/- 78 1137 +/- 43 970 +/- 97 0.0534742 -0.0402191 -0.1709090Garnl1 GTPase activating Rap/RanGAP domain-like 1 683 +/- 64 626 +/- 46 579 +/- 30 462 +/- 37 -0.0126510 -0.4858900 -0.0400986Plk2 polo-like kinase 2 (Drosophila) 4576 +/- 519 3141 +/- 223 3989 +/- 267 3502 +/- 175 -0.7938381 -0.0397434 -0.1639475Col11A2 collagen, type XI, alpha 2 262 +/- 34 231 +/- 38 308 +/- 19 229 +/- 25 0.5000081 -0.5567156 -0.0383340Snf1Lk SNF1-like kinase 448 +/- 53 272 +/- 52 268 +/- 49 172 +/- 19 -0.0026891 -0.0381415 -0.1146252Aplp2 Amyloid beta (A4) precursor-like protein 2 397 +/- 24 319 +/- 21 448 +/- 28 403 +/- 22 0.0107720 -0.0373294 -0.2404392Pdcd6Ip programmed cell death 6 interacting protein 1108 +/- 45 997 +/- 36 1209 +/- 22 1087 +/- 41 0.0058318 -0.0841336 -0.0372195Slc25A25 solute carrier family 25 (mitochondrial carrier; phosphate carrier), member 25 1121 +/- 61 974 +/- 52 1300 +/- 67 1101 +/- 43 0.0285995 -0.0967483 -0.0367214Grina glutamate receptor, ionotropic, N-methyl D-asparate-associated protein 1 (gl 5549 +/- 298 4625 +/- 234 6955 +/- 300 6870 +/- 234 0.0000245 -0.0360443 -0.8289728Itga8 integrin, alpha 8 101 +/- 17 101 +/- 14 126 +/- 12 92 +/- 3 0.1331249 -0.9822653 -0.0359952Hmgcs2 3-hydroxy-3-methylglutaryl-Coenzyme A synthase 2 (mitochondrial) 244 +/- 51 182 +/- 18 480 +/- 52 240 +/- 77 0.0158673 -0.2926355 -0.0352664Pparg Peroxisome proliferative activated receptor, gamma 118 +/- 5 118 +/- 16 156 +/- 13 117 +/- 8 0.1182899 -0.9774051 -0.0350082Ikbkap inhibitor of kappa light polypeptide gene enhancer in B-cells, kinase complex 3512 +/- 159 3207 +/- 197 3071 +/- 108 2708 +/- 98 -0.0001912 -0.2572085 -0.0342733Pex14 peroxisomal biogenesis factor 14 1046 +/- 74 925 +/- 41 1172 +/- 79 945 +/- 26 0.2574630 -0.1903719 -0.0341549Cd5 CD5 molecule 143 +/- 6 90 +/- 18 125 +/- 19 122 +/- 17 0.7027175 -0.0340309 -0.9064233Dctn4 dynactin 4 (p62) 2167 +/- 114 1786 +/- 115 2057 +/- 72 1769 +/- 87 -0.2351288 -0.0395917 -0.0338534Pex6 peroxisomal biogenesis factor 6 1024 +/- 62 855 +/- 43 1081 +/- 68 886 +/- 19 0.2627287 -0.0513789 -0.0336719Kcnip1 Kv channel interacting protein 1 233 +/- 13 189 +/- 12 243 +/- 17 208 +/- 14 0.4977055 -0.0334199 -0.1487670Timm8A translocase of inner mitochondrial membrane 8 homolog A (yeast) 203 +/- 12 163 +/- 10 217 +/- 9 201 +/- 18 0.1477676 -0.0326712 -0.4626918Htr3A 5-hydroxytryptamine (serotonin) receptor 3A 166 +/- 21 103 +/- 13 182 +/- 25 126 +/- 12 0.0452838 -0.0323096 -0.0784015Tm9Sf2 transmembrane 9 superfamily member 2 1860 +/- 104 971 +/- 362 1861 +/- 69 746 +/- 349 -0.7211977 -0.0573688 -0.0315880Egln1 egl nine homolog 1 (C. elegans) 599 +/- 67 426 +/- 24 799 +/- 81 561 +/- 31 0.0132782 -0.0500585 -0.0314922Trpm7 transient receptor potential cation channel, subfamily M, member 7 356 +/- 40 334 +/- 21 378 +/- 30 285 +/- 20 -0.8708571 -0.6291703 -0.0314346Acp1 acid phosphatase 1, soluble 2644 +/- 165 2074 +/- 157 2357 +/- 91 2031 +/- 147 -0.0852981 -0.0313063 -0.1018205Dffa DNA fragmentation factor, 45kDa, alpha polypeptide 632 +/- 34 537 +/- 27 694 +/- 27 593 +/- 28 0.0281539 -0.0543054 -0.0312074Kpna1 karyopherin alpha 1 (importin alpha 5) 2311 +/- 102 1982 +/- 79 2132 +/- 68 2092 +/- 86 -0.3460581 -0.0303221 -0.7251541Tmf1 TATA element modulatory factor 1 2030 +/- 133 1560 +/- 130 2148 +/- 200 1684 +/- 181 0.2471757 -0.0295354 -0.1188377Bzw1 basic leucine zipper and W2 domains 1 5216 +/- 116 4624 +/- 192 4100 +/- 120 3941 +/- 258 -0.0002480 -0.0288959 -0.5968530Tcf4 transcription factor 4 4852 +/- 158 4083 +/- 243 6014 +/- 463 4769 +/- 717 0.0342518 -0.0276142 -0.1877160Pnck pregnancy upregulated non-ubiquitously expressed CaM kinase 583 +/- 36 459 +/- 43 769 +/- 37 629 +/- 37 0.0005653 -0.0520961 -0.0263864Crebbp CREB binding protein (Rubinstein-Taybi syndrome) 1537 +/- 76 1340 +/- 29 1670 +/- 25 1368 +/- 90 0.0746315 -0.0477222 -0.0261380Kcnq2 potassium voltage-gated channel, KQT-like subfamily, member 2 279 +/- 12 234 +/- 12 261 +/- 17 237 +/- 14 -0.7567866 -0.0255233 -0.2864954P2Rx5 purinergic receptor P2X, ligand-gated ion channel, 5 1338 +/- 74 1083 +/- 93 1528 +/- 87 1238 +/- 63 0.0259930 -0.0581722 -0.0255109Akt3 V-akt murine thymoma viral oncogene homolog 3 (protein kinase B, gamma) 4120 +/- 100 3342 +/- 250 3311 +/- 184 3045 +/- 90 -0.0192162 -0.0251429 -0.2342718Fndc5 fibronectin type III domain containing 5 519 +/- 27 422 +/- 25 470 +/- 26 433 +/- 42 -0.6271012 -0.0247525 -0.4894345Ptbp2 polypyrimidine tract binding protein 2 2307 +/- 103 1782 +/- 161 2298 +/- 39 1811 +/- 152 0.9890389 -0.0238185 -0.0308303Acvr1B activin A receptor, type IB 1767 +/- 140 1532 +/- 52 1675 +/- 66 1338 +/- 98 -0.1179970 -0.1633812 -0.0237609Arhgef11 Rho guanine nucleotide exchange factor (GEF) 11 658 +/- 70 564 +/- 45 969 +/- 43 769 +/- 57 0.0005791 -0.2902121 -0.0236981Doc2B double C2-like domains, beta 258 +/- 27 166 +/- 20 253 +/- 19 182 +/- 20 0.9949891 -0.0235749 -0.0301955
S3- Aging related genes in rhesus and rat.xls Page 5

Young vs AgedSymbol Description Young CA Aged CA Young DG Aged DG CA v DG in CA in DGKcnk2 potassium channel, subfamily K, member 2 130 +/- 38 100 +/- 18 109 +/- 11 75 +/- 3 -0.2321199 -0.4837929 -0.0227702Cryba2 crystallin, beta A2 197 +/- 9 153 +/- 13 189 +/- 23 170 +/- 6 0.9023736 -0.0227566 -0.4580255Ogt O-linked N-acetylglucosamine (GlcNAc) transferase (UDP-N-acetylglucosam 1094 +/- 60 899 +/- 25 1800 +/- 83 1694 +/- 67 0.0000004 -0.0221208 -0.3487604Cacnb1 calcium channel, voltage-dependent, beta 1 subunit 1084 +/- 79 825 +/- 44 1214 +/- 70 1044 +/- 36 0.0095231 -0.0219788 -0.0658955Smu1 Smu-1 suppressor of mec-8 and unc-52 homolog (C. elegans) 1021 +/- 44 845 +/- 49 1000 +/- 21 892 +/- 31 0.7566227 -0.0241009 -0.0215579Myadm myeloid-associated differentiation marker 444 +/- 27 337 +/- 28 548 +/- 77 393 +/- 23 0.0648073 -0.0207015 -0.1044596Mlh1 mutL homolog 1, colon cancer, nonpolyposis type 2 (E. coli) 569 +/- 45 480 +/- 41 470 +/- 32 363 +/- 16 -0.0051932 -0.1749710 -0.0198928Max MYC associated factor X 1031 +/- 87 779 +/- 39 1103 +/- 54 911 +/- 39 0.0983481 -0.0342138 -0.0195643Hspe1 heat shock 10kDa protein 1 (chaperonin 10) 3558 +/- 135 3064 +/- 138 3300 +/- 90 2930 +/- 94 -0.0544537 -0.0282547 -0.0194695Nrxn1 neurexin 1 10862 +/- 245 9499 +/- 402 10764 +/- 142 9886 +/- 287 0.7704651 -0.0193078 -0.0339303Wdfy1 WD repeat and FYVE domain containing 1 1082 +/- 175 808 +/- 190 857 +/- 69 579 +/- 68 -0.0155882 -0.3162518 -0.0186316Vapa VAMP (vesicle-associated membrane protein)-associated protein A, 33kDa 11082 +/- 381 9798 +/- 151 10132 +/- 197 8992 +/- 317 -0.0110698 -0.0180844 -0.0187738Ucn urocortin 399 +/- 28 387 +/- 22 380 +/- 17 317 +/- 13 -0.1100041 -0.7410435 -0.0179206Pik3R2 phosphoinositide-3-kinase, regulatory subunit 2 (p85 beta) 5364 +/- 460 3833 +/- 348 4458 +/- 93 3892 +/- 156 -0.3389194 -0.0256077 -0.0177811Hes5 hairy and enhancer of split 5 (Drosophila) 714 +/- 104 558 +/- 31 840 +/- 53 603 +/- 61 0.1479058 -0.2015184 -0.0177293Rheb Ras homolog enriched in brain 7133 +/- 176 6424 +/- 174 6526 +/- 211 6223 +/- 272 -0.0979010 -0.0167407 -0.4047302Fat3 FAT tumor suppressor homolog 3 (Drosophila) 802 +/- 78 532 +/- 31 691 +/- 50 625 +/- 62 -0.8582295 -0.0163774 -0.4303413Sox11 SRY (sex determining region Y)-box 11 664 +/- 52 459 +/- 46 303 +/- 32 221 +/- 13 -0.0000094 -0.0145985 -0.0487541Sec61A1 Sec61 alpha 1 subunit (S. cerevisiae) 320 +/- 43 269 +/- 28 351 +/- 21 276 +/- 12 0.6510648 -0.3404193 -0.0145461Bicd2 bicaudal D homolog 2 (Drosophila) 1123 +/- 23 818 +/- 85 1051 +/- 110 902 +/- 129 0.0566063 -0.0144352 -0.4047251Ptms parathymosin 564 +/- 27 451 +/- 59 772 +/- 43 611 +/- 28 0.0017468 -0.1244597 -0.0131330Camkk2 calcium/calmodulin-dependent protein kinase kinase 2, beta 2835 +/- 306 2109 +/- 116 2217 +/- 96 1716 +/- 125 -0.0240822 -0.0657120 -0.0129466Cttnbp2 cortactin binding protein 2 537 +/- 51 438 +/- 37 539 +/- 47 360 +/- 32 -0.3629991 -0.1546185 -0.0124030Mapre3 microtubule-associated protein, RP/EB family, member 3 3330 +/- 90 2945 +/- 89 3841 +/- 102 3654 +/- 41 0.0000079 -0.0122431 -0.1344417Nog Noggin 599 +/- 81 458 +/- 67 733 +/- 50 542 +/- 33 0.0513269 -0.2089942 -0.0119141Skiv2L superkiller viralicidic activity 2-like (S. cerevisiae) 624 +/- 40 474 +/- 21 631 +/- 36 490 +/- 27 0.5380196 -0.0113638 -0.0121907Pnma1 paraneoplastic antigen MA1 10959 +/- 391 9451 +/- 261 10858 +/- 318 10579 +/- 360 0.2885476 -0.0112107 -0.5770706Baalc brain and acute leukemia, cytoplasmic 5677 +/- 195 4724 +/- 234 5418 +/- 180 4924 +/- 267 -0.9717174 -0.0110503 -0.1674274Fads3 fatty acid desaturase 3 1186 +/- 74 995 +/- 86 1240 +/- 69 944 +/- 62 0.7204854 -0.1234827 -0.0109791Scye1 small inducible cytokine subfamily E, member 1 (endothelial monocyte-activa 1313 +/- 43 1283 +/- 31 1364 +/- 27 1259 +/- 16 0.5242370 -0.5850455 -0.0098649Prelp proline/arginine-rich end leucine-rich repeat protein 1546 +/- 52 1157 +/- 104 1515 +/- 84 1157 +/- 70 -0.6850686 -0.0116289 -0.0098213Rapgef1 Rap guanine nucleotide exchange factor (GEF) 1 616 +/- 50 396 +/- 101 775 +/- 26 416 +/- 82 0.0433485 -0.0915843 -0.0095002Zwint ZW10 interactor 592 +/- 49 356 +/- 55 462 +/- 44 332 +/- 21 -0.1055223 -0.0093248 -0.0321759Suox sulfite oxidase 266 +/- 15 222 +/- 19 301 +/- 8 220 +/- 19 0.2424594 -0.1004053 -0.0088787Cdipt CDP-diacylglycerol--inositol 3-phosphatidyltransferase (phosphatidylinositol 3358 +/- 206 3149 +/- 168 3343 +/- 117 2839 +/- 95 -0.4056603 -0.4511265 -0.0087776Psma6 proteasome (prosome, macropain) subunit, alpha type, 6 5154 +/- 216 4141 +/- 221 4713 +/- 143 4252 +/- 182 -0.3569863 -0.0083183 -0.0815815Hes1 hairy and enhancer of split 1, (Drosophila) 395 +/- 33 353 +/- 23 461 +/- 26 352 +/- 18 0.1136724 -0.3270469 -0.0080258Pcsk2 proprotein convertase subtilisin/kexin type 2 3146 +/- 220 2328 +/- 198 2601 +/- 119 2049 +/- 105 -0.0135462 -0.0204179 -0.0069513Mark2 MAP/microtubule affinity-regulating kinase 2 823 +/- 33 702 +/- 30 941 +/- 40 765 +/- 25 0.0225006 -0.0230355 -0.0057067Cacna1A calcium channel, voltage-dependent, P/Q type, alpha 1A subunit 961 +/- 89 664 +/- 44 1617 +/- 110 993 +/- 119 0.0001939 -0.0186447 -0.0041932Idh3B isocitrate dehydrogenase 3 (NAD+) beta 1428 +/- 48 1204 +/- 29 1103 +/- 38 1036 +/- 36 -0.0001105 -0.0037977 -0.2334142Prps2 phosphoribosyl pyrophosphate synthetase 2 1966 +/- 106 1443 +/- 29 1604 +/- 58 1369 +/- 46 -0.0207095 -0.0035250 -0.0119785Brd2 bromodomain containing 2 683 +/- 52 469 +/- 53 945 +/- 41 572 +/- 72 0.0046808 -0.0165249 -0.0034740Mgll monoglyceride lipase 886 +/- 65 790 +/- 40 920 +/- 52 666 +/- 35 -0.4728268 -0.2405204 -0.0033626Mcf2L MCF.2 cell line derived transforming sequence-like 169 +/- 11 113 +/- 10 232 +/- 24 135 +/- 8 0.0084632 -0.0033328 -0.0076132Snap25 Synaptosomal-associated protein, 25kDa 583 +/- 70 304 +/- 41 826 +/- 34 518 +/- 59 0.0011821 -0.0084664 -0.0032100Timm10 translocase of inner mitochondrial membrane 10 homolog (yeast) 1629 +/- 120 1047 +/- 77 1208 +/- 47 967 +/- 68 -0.0198704 -0.0031533 -0.0212383Usp15 ubiquitin specific peptidase 15 2158 +/- 53 1639 +/- 107 2009 +/- 51 1697 +/- 92 -0.2965901 -0.0031348 -0.0232526Plaa phospholipase A2-activating protein 952 +/- 29 788 +/- 29 921 +/- 43 883 +/- 20 0.5396908 -0.0023769 -0.4435661Gpm6A glycoprotein M6A 20299 +/- 453 16530 +/- 744 18774 +/- 263 16875 +/- 764 -0.1436309 -0.0023422 -0.0660502Kcna5 potassium voltage-gated channel, shaker-related subfamily, member 5 160 +/- 33 140 +/- 13 180 +/- 11 124 +/- 7 0.9269433 -0.5818771 -0.0023091Set SET translocation (myeloid leukemia-associated) 698 +/- 22 583 +/- 14 1015 +/- 52 866 +/- 35 0.0000002 -0.0021928 -0.0424203Socs1 suppressor of cytokine signaling 1 193 +/- 12 114 +/- 15 214 +/- 14 159 +/- 18 0.0011964 -0.0021482 -0.0385425Rtn3 reticulon 3 21006 +/- 1230 13544 +/- 1159 20556 +/- 206 13859 +/- 1090 -0.8308618 -0.0013140 -0.0029463Gchfr GTP cyclohydrolase I feedback regulator 417 +/- 27 263 +/- 11 403 +/- 32 315 +/- 18 0.4719246 -0.0012334 -0.0441217Gabrg3 gamma-aminobutyric acid (GABA) A receptor, gamma 3 83 +/- 11 74 +/- 14 144 +/- 6 100 +/- 6 0.0009088 -0.5968885 -0.0007611Ltbp1 latent transforming growth factor beta binding protein 1 361 +/- 17 236 +/- 20 447 +/- 38 218 +/- 28 0.1951325 -0.0007146 -0.0009587Pum2 pumilio homolog 2 (Drosophila) 2633 +/- 77 1935 +/- 111 2753 +/- 131 1997 +/- 141 0.4111452 -0.0006045 -0.0036483Shank2 SH3 and multiple ankyrin repeat domains 2 3124 +/- 137 2183 +/- 63 2942 +/- 130 2120 +/- 154 -0.4032327 -0.0004179 -0.0032766Lrrn3 leucine rich repeat neuronal 3 1738 +/- 84 1547 +/- 86 1796 +/- 57 1379 +/- 50 -0.8735055 -0.1422784 -0.0003750
S3- Aging related genes in rhesus and rat.xls Page 6

Young vs AgedSymbol Description Young CA Aged CA Young DG Aged DG CA v DG in CA in DGZnrd1 zinc ribbon domain containing 1 926 +/- 41 625 +/- 37 853 +/- 26 720 +/- 30 0.9403265 -0.0002687 -0.0099077Up in Rat Aging Studies OnlyEbp emopamil binding protein (sterol isomerase) 1051 +/- 62 1024 +/- 49 1079 +/- 36 1062 +/- 60 0.6436479 -0.7417843 -0.8184843Aspa aspartoacylase (Canavan disease) 1618 +/- 355 1441 +/- 348 645 +/- 98 601 +/- 82 -0.0046134 -0.7297413 -0.7434847Atp1A2 ATPase, Na+/K+ transporting, alpha 2 (+) polypeptide 13537 +/- 634 13224 +/- 524 13312 +/- 436 13206 +/- 529 -0.9963926 -0.7118095 -0.8808246Bet1L blocked early in transport 1 homolog (S. cerevisiae)-like 621 +/- 54 586 +/- 65 668 +/- 65 667 +/- 22 0.2985623 -0.6887562 -0.9926211Rps26 ribosomal protein S26 13524 +/- 616 13145 +/- 731 11557 +/- 620 11245 +/- 406 -0.0000017 -0.6998089 -0.6844055Prdx1 peroxiredoxin 1 107 +/- 8 101 +/- 8 113 +/- 12 106 +/- 9 0.6589474 -0.6361815 -0.6725031Eef2K eukaryotic elongation factor-2 kinase 1581 +/- 177 1477 +/- 98 1721 +/- 108 1635 +/- 117 0.2001932 -0.6232192 -0.6018169Igsf1 immunoglobulin superfamily, member 1 781 +/- 111 761 +/- 66 793 +/- 81 738 +/- 55 -0.8841248 -0.8824478 -0.5864280Sort1 sortilin 1 796 +/- 70 720 +/- 113 917 +/- 106 914 +/- 77 0.2273917 -0.5817462 -0.9862295Gfap glial fibrillary acidic protein 93 +/- 19 92 +/- 11 120 +/- 16 104 +/- 24 0.3535950 -0.9686178 -0.5813068Ache acetylcholinesterase (Yt blood group) 247 +/- 28 246 +/- 21 390 +/- 22 370 +/- 26 0.0002706 -0.9668567 -0.5719788Galc galactosylceramidase 844 +/- 48 808 +/- 51 817 +/- 49 750 +/- 95 -0.3583847 -0.6187456 -0.5570988Rps17 ribosomal protein S17 15133 +/- 550 14659 +/- 548 12410 +/- 409 12221 +/- 313 -0.0000260 -0.5552325 -0.7220457Clu clusterin 3878 +/- 541 3451 +/- 377 2851 +/- 426 2733 +/- 149 -0.0200961 -0.5332410 -0.8025165Zfp36 zinc finger protein 36, C3H type, homolog (mouse) 562 +/- 20 558 +/- 20 562 +/- 13 533 +/- 37 -0.4668616 -0.8898812 -0.4906276Dbnl drebrin-like 1945 +/- 80 1865 +/- 71 1998 +/- 76 1957 +/- 55 0.1274646 -0.4733026 -0.6765954Epas1 endothelial PAS domain protein 1 3071 +/- 166 2921 +/- 93 2305 +/- 183 2256 +/- 84 -0.0000036 -0.4529431 -0.8135122Grn granulin 1767 +/- 125 1735 +/- 78 1562 +/- 33 1507 +/- 52 -0.0117135 -0.8302307 -0.4027456Cplx2 complexin 2 10282 +/- 1444 8795 +/- 869 9830 +/- 852 9803 +/- 400 0.5932191 -0.4025333 -0.9779180Hadhb hydroxyacyl-Coenzyme A dehydrogenase/3-ketoacyl-Coenzyme A thiolase/e 914 +/- 38 909 +/- 85 750 +/- 24 687 +/- 61 -0.0001281 -0.9513261 -0.3784315Dnajc5 DnaJ (Hsp40) homolog, subfamily C, member 5 2366 +/- 278 2055 +/- 187 3214 +/- 219 2977 +/- 149 0.0000445 -0.3771709 -0.3959412Aadat aminoadipate aminotransferase 271 +/- 29 237 +/- 19 145 +/- 17 143 +/- 19 -0.0003348 -0.3705286 -0.9598542Rab31 RAB31, member RAS oncogene family 3868 +/- 294 3537 +/- 160 3341 +/- 297 3197 +/- 162 -0.0596723 -0.3544097 -0.6818644Gng8 guanine nucleotide binding protein (G protein), gamma 8 409 +/- 52 397 +/- 57 518 +/- 45 467 +/- 27 0.0071224 -0.8821712 -0.3536938Bcas1 breast carcinoma amplified sequence 1 2055 +/- 301 1589 +/- 364 1783 +/- 208 1588 +/- 181 -0.4604672 -0.3476227 -0.4960115Phldb1 pleckstrin homology-like domain, family B, member 1 246 +/- 32 207 +/- 20 159 +/- 23 156 +/- 37 -0.0398668 -0.3390269 -0.9632182Cxcl12 chemokine (C-X-C motif) ligand 12 (stromal cell-derived factor 1) 703 +/- 160 527 +/- 166 1328 +/- 203 1073 +/- 141 0.0097847 -0.4640184 -0.3318161Fhl1 four and a half LIM domains 1 4434 +/- 296 3835 +/- 494 6047 +/- 320 5973 +/- 158 0.0001980 -0.3280146 -0.8413964Acsl3 acyl-CoA synthetase long-chain family member 3 2056 +/- 491 1593 +/- 214 2104 +/- 482 1547 +/- 203 0.8668591 -0.4158419 -0.3237906Neurod1 neurogenic differentiation 1 3513 +/- 1010 2385 +/- 631 4285 +/- 253 3926 +/- 228 0.0490227 -0.3701073 -0.3204471Synj1 synaptojanin 1 7756 +/- 393 7178 +/- 387 7982 +/- 449 7838 +/- 286 0.1676523 -0.3188251 -0.7931439Acvr1C activin A receptor, type IC 504 +/- 117 394 +/- 115 1153 +/- 118 1015 +/- 47 0.0000267 -0.5174737 -0.3121776Fbxl20 F-box and leucine-rich repeat protein 20 390 +/- 20 371 +/- 24 331 +/- 14 297 +/- 26 -0.0039374 -0.5661398 -0.3046508Mapk12 mitogen-activated protein kinase 12 426 +/- 42 393 +/- 25 440 +/- 29 395 +/- 28 0.6847311 -0.5192586 -0.2947657Eif4Ebp1 eukaryotic translation initiation factor 4E binding protein 1 362 +/- 23 361 +/- 37 292 +/- 13 256 +/- 28 -0.0010758 -0.9776054 -0.2943072Galm galactose mutarotase (aldose 1-epimerase) 270 +/- 41 220 +/- 17 203 +/- 49 190 +/- 43 -0.1138736 -0.2938327 -0.8409153Blcap bladder cancer associated protein 6297 +/- 214 5807 +/- 369 5335 +/- 115 5220 +/- 151 -0.0081694 -0.2842212 -0.5620694Cited2 Cbp/p300-interacting transactivator, with Glu/Asp-rich carboxy-terminal doma 371 +/- 56 291 +/- 43 432 +/- 47 407 +/- 51 0.1240745 -0.2829936 -0.7214939Ak2 adenylate kinase 2 232 +/- 19 205 +/- 13 283 +/- 15 268 +/- 21 0.0012047 -0.2587292 -0.5733950Ptma prothymosin, alpha (gene sequence 28) 2337 +/- 132 2228 +/- 259 2180 +/- 138 1932 +/- 148 -0.2410777 -0.7196411 -0.2511091Podxl podocalyxin-like 1966 +/- 277 1641 +/- 107 1601 +/- 72 1461 +/- 87 -0.1040655 -0.3132247 -0.2484971Sfrs5 splicing factor, arginine/serine-rich 5 233 +/- 46 174 +/- 13 258 +/- 29 215 +/- 18 0.1853768 -0.2657320 -0.2479777Mpg N-methylpurine-DNA glycosylase 722 +/- 51 636 +/- 45 644 +/- 33 607 +/- 22 -0.0783427 -0.2341435 -0.3733852Nr1H2 nuclear receptor subfamily 1, group H, member 2 848 +/- 64 838 +/- 63 795 +/- 32 722 +/- 43 -0.1682361 -0.9116841 -0.2114146Sdc3 syndecan 3 (N-syndecan) 3986 +/- 175 3565 +/- 247 3931 +/- 74 3858 +/- 235 0.2787272 -0.1972956 -0.7802691Rpl41 Ribosomal protein L41 2686 +/- 132 2481 +/- 156 2471 +/- 52 2345 +/- 71 -0.1651898 -0.3422815 -0.1940890Fn1 fibronectin 1 1193 +/- 123 1012 +/- 110 905 +/- 96 749 +/- 48 -0.0010688 -0.2989742 -0.1899981Rapgef3 Rap guanine nucleotide exchange factor (GEF) 3 432 +/- 74 415 +/- 48 358 +/- 20 326 +/- 10 -0.0979008 -0.8546773 -0.1801893Il6St Interleukin 6 signal transducer (gp130, oncostatin M receptor) 119 +/- 7 94 +/- 15 122 +/- 13 90 +/- 23 0.9931486 -0.1751611 -0.2737672Dck deoxycytidine kinase 498 +/- 49 406 +/- 39 523 +/- 24 507 +/- 25 0.1616639 -0.1712138 -0.6588035Galnt1 UDP-N-acetyl-alpha-D-galactosamine:polypeptide N-acetylgalactosaminyltra 1487 +/- 76 1307 +/- 95 1286 +/- 57 1262 +/- 72 -0.0434836 -0.1712013 -0.8031009Tpmt thiopurine S-methyltransferase 634 +/- 112 427 +/- 68 643 +/- 125 460 +/- 55 0.3263324 -0.1533641 -0.2212500Pdp2 Pyruvate dehydrogenase phosphatase isoenzyme 2 929 +/- 58 889 +/- 19 897 +/- 35 820 +/- 34 -0.1380455 -0.5325371 -0.1495255Fst follistatin 144 +/- 19 122 +/- 15 243 +/- 50 155 +/- 19 0.0244298 -0.3908552 -0.1477706Nppa natriuretic peptide precursor A 1453 +/- 633 764 +/- 148 557 +/- 90 356 +/- 83 -0.1076100 -0.3333928 -0.1357757Uxs1 UDP-glucuronate decarboxylase 1 801 +/- 71 662 +/- 61 974 +/- 34 857 +/- 59 0.0017190 -0.1702266 -0.1338492Scp2 Sterol carrier protein 2 687 +/- 54 604 +/- 26 740 +/- 39 654 +/- 35 0.3488124 -0.2108697 -0.1329085Hbb hemoglobin, beta 8460 +/- 2004 4805 +/- 635 4797 +/- 1700 4794 +/- 780 -0.0163883 -0.1327314 -0.9987740
S3- Aging related genes in rhesus and rat.xls Page 7

Young vs AgedSymbol Description Young CA Aged CA Young DG Aged DG CA v DG in CA in DGHerpud1 homocysteine-inducible, endoplasmic reticulum stress-inducible, ubiquitin-lik 3426 +/- 201 3045 +/- 102 3151 +/- 116 3068 +/- 66 -0.2347543 -0.1318209 -0.5535816Egfr Epidermal growth factor receptor (erythroblastic leukemia viral (v-erb-b) onco 196 +/- 15 157 +/- 18 185 +/- 16 155 +/- 12 -0.6933144 -0.1296721 -0.1567750Homer3 homer homolog 3 (Drosophila) 250 +/- 55 168 +/- 32 356 +/- 16 267 +/- 46 0.0429181 -0.2357537 -0.1271272Csda cold shock domain protein A 681 +/- 100 532 +/- 69 518 +/- 36 450 +/- 14 -0.1019928 -0.2538941 -0.1266500Mapk1 mitogen-activated protein kinase 1 10274 +/- 704 8702 +/- 613 10851 +/- 475 10382 +/- 169 0.0274736 -0.1235692 -0.3873025Slc38A2 Solute carrier family 38, member 2 139 +/- 18 127 +/- 8 166 +/- 24 119 +/- 9 0.6003279 -0.5704620 -0.1224705Pcna proliferating cell nuclear antigen 1009 +/- 49 887 +/- 53 1030 +/- 12 998 +/- 73 0.2257035 -0.1209201 -0.6891272Pscd2 pleckstrin homology, Sec7 and coiled-coil domains 2 (cytohesin-2) 1012 +/- 49 896 +/- 46 1070 +/- 31 1034 +/- 25 0.0145388 -0.1157200 -0.4026028Kcnn1 potassium intermediate/small conductance calcium-activated channel, subfa 1284 +/- 146 953 +/- 120 1350 +/- 85 1296 +/- 62 0.0797488 -0.1117496 -0.6188773Pam peptidylglycine alpha-amidating monooxygenase 9384 +/- 821 7664 +/- 510 6095 +/- 300 5478 +/- 570 -0.0003074 -0.1114771 -0.3740806Cyba cytochrome b-245, alpha polypeptide 1308 +/- 102 1275 +/- 108 1067 +/- 80 888 +/- 62 -0.0023596 -0.8243239 -0.1103755Slc9A3 Solute carrier family 9 (sodium/hydrogen exchanger), member 3 215 +/- 18 177 +/- 1 195 +/- 21 176 +/- 16 -0.3643239 -0.0940914 -0.4928612Ensa endosulfine alpha 8616 +/- 458 6910 +/- 758 8136 +/- 370 6992 +/- 536 -0.6244127 -0.0891463 -0.1204346Ednrb endothelin receptor type B 673 +/- 94 582 +/- 62 937 +/- 97 716 +/- 58 0.0078100 -0.4398319 -0.0872201Mertk c-mer proto-oncogene tyrosine kinase 700 +/- 45 687 +/- 47 695 +/- 34 609 +/- 27 -0.6064318 -0.8486662 -0.0837144Nfix nuclear factor I/X (CCAAT-binding transcription factor) 215 +/- 16 195 +/- 13 347 +/- 26 287 +/- 15 0.0002591 -0.3584218 -0.0833231Mapt microtubule-associated protein tau 6978 +/- 252 6298 +/- 237 7144 +/- 345 6697 +/- 249 0.2188318 -0.0781682 -0.3222767Prkab1 protein kinase, AMP-activated, beta 1 non-catalytic subunit 182 +/- 22 157 +/- 14 201 +/- 9 161 +/- 17 0.5403512 -0.3502186 -0.0746359Tob1 transducer of ERBB2, 1 172 +/- 34 132 +/- 24 260 +/- 18 168 +/- 38 0.0347507 -0.3564328 -0.0745297Rod1 ROD1 regulator of differentiation 1 (S. pombe) 1784 +/- 98 1541 +/- 71 1943 +/- 113 1743 +/- 34 0.0110373 -0.0740837 -0.1424573Cdh2 cadherin 2, type 1, N-cadherin (neuronal) 810 +/- 57 761 +/- 34 909 +/- 44 800 +/- 28 0.0426973 -0.4805146 -0.0675224Tgfbi transforming growth factor, beta-induced, 68kDa 198 +/- 33 110 +/- 12 75 +/- 20 58 +/- 9 -0.0194205 -0.0674671 -0.4663408Adra2C adrenergic, alpha-2C-, receptor 433 +/- 40 332 +/- 23 364 +/- 33 304 +/- 35 -0.2371924 -0.0599996 -0.2482227Lasp1 LIM and SH3 protein 1 3715 +/- 152 3291 +/- 108 3992 +/- 179 3563 +/- 143 0.1229790 -0.0486642 -0.0948552Slc12A5 solute carrier family 12, (potassium-chloride transporter) member 5 9260 +/- 395 7923 +/- 381 8510 +/- 287 7677 +/- 214 -0.1625091 -0.0351655 -0.0457884Sts steroid sulfatase (microsomal), arylsulfatase C, isozyme S 522 +/- 29 428 +/- 25 424 +/- 42 346 +/- 14 -0.0213875 -0.0333906 -0.1245938Rpl31 ribosomal protein L31 232 +/- 31 172 +/- 17 275 +/- 9 198 +/- 25 0.0482206 -0.1283849 -0.0329356Nfil3 nuclear factor, interleukin 3 regulated 495 +/- 40 462 +/- 38 822 +/- 51 669 +/- 29 0.0007822 -0.5628783 -0.0322917Robo2 roundabout, axon guidance receptor, homolog 2 (Drosophila) 1844 +/- 48 1630 +/- 69 1649 +/- 73 1537 +/- 82 -0.0304645 -0.0321743 -0.3379253Csnk1D casein kinase 1, delta 809 +/- 36 702 +/- 20 866 +/- 60 764 +/- 92 0.2643752 -0.0313341 -0.3867637Tpt1 tumor protein, translationally-controlled 1 440 +/- 33 330 +/- 27 527 +/- 42 469 +/- 48 0.0017671 -0.0285349 -0.3851388Tgm2 transglutaminase 2 (C polypeptide, protein-glutamine-gamma-glutamyltransf 141 +/- 8 82 +/- 19 137 +/- 20 132 +/- 28 0.2640993 -0.0261351 -0.9007881Fut1 Fucosyltransferase 1 (galactoside 2-alpha-L-fucosyltransferase, H blood gro 147 +/- 13 121 +/- 9 139 +/- 12 91 +/- 13 -0.1229487 -0.1360864 -0.0250978Tgfb3 transforming growth factor, beta 3 505 +/- 61 393 +/- 48 651 +/- 37 486 +/- 46 0.0012308 -0.1826780 -0.0228507Pros1 protein S (alpha) 774 +/- 108 426 +/- 28 473 +/- 63 375 +/- 23 -0.0440593 -0.0221690 -0.1904530Rpl6 ribosomal protein L6 10615 +/- 183 9845 +/- 191 10876 +/- 273 9843 +/- 437 0.3850185 -0.0155943 -0.0857000Echdc1 enoyl Coenzyme A hydratase domain containing 1 1796 +/- 60 1599 +/- 72 1651 +/- 62 1404 +/- 53 -0.0030410 -0.0614275 -0.0137135Masp1 mannan-binding lectin serine peptidase 1 (C4/C2 activating component of Ra 248 +/- 14 181 +/- 18 233 +/- 11 210 +/- 10 0.4003435 -0.0136085 -0.1571761Acadl acyl-Coenzyme A dehydrogenase, long chain 234 +/- 12 184 +/- 12 226 +/- 9 179 +/- 19 -0.3592968 -0.0135989 -0.0654766Csnk1G2 casein kinase 1, gamma 2 464 +/- 48 332 +/- 27 622 +/- 27 496 +/- 28 0.0018629 -0.0446968 -0.0104091Cd47 CD47 molecule 2438 +/- 231 1877 +/- 56 2572 +/- 107 2131 +/- 78 0.0686341 -0.0595074 -0.0091856Matr3 matrin 3 18535 +/- 672 15789 +/- 403 18512 +/- 661 16674 +/- 807 0.5064254 -0.0077536 -0.1152625Rad50 RAD50 homolog (S. cerevisiae) 416 +/- 27 289 +/- 24 390 +/- 21 293 +/- 18 -0.3483701 -0.0053463 -0.0068159Rpl15 Ribosomal protein L15 201 +/- 25 146 +/- 14 188 +/- 13 126 +/- 10 -0.2369957 -0.0919435 -0.0051823Rps12 ribosomal protein S12 4329 +/- 211 3150 +/- 239 3422 +/- 186 2508 +/- 191 -0.0002343 -0.0042185 -0.0076363Spa17 sperm autoantigenic protein 17 537 +/- 65 330 +/- 45 443 +/- 23 329 +/- 17 -0.5063023 -0.0275973 -0.0033444Grm5 Glutamate receptor, metabotropic 5 4099 +/- 219 3135 +/- 171 3523 +/- 175 2644 +/- 98 -0.0543625 -0.0065106 -0.0025904Vegf vascular endothelial growth factor 2713 +/- 90 2084 +/- 104 2439 +/- 134 2150 +/- 54 -0.4078724 -0.0010854 -0.0888537Cd63 CD63 molecule 3961 +/- 565 4903 +/- 297 3173 +/- 139 3664 +/- 165 -0.0110740 0.1803626 0.0509958Litaf lipopolysaccharide-induced TNF factor 1951 +/- 250 2975 +/- 472 1460 +/- 69 1769 +/- 112 -0.0149956 0.0932603 0.0527648Renbp renin binding protein 106 +/- 14 148 +/- 12 134 +/- 15 152 +/- 8 0.0184974 0.0531180 0.3339102Olig1 oligodendrocyte transcription factor 1 10505 +/- 1321 11917 +/- 1508 6389 +/- 320 7664 +/- 455 -0.0022764 0.4974144 0.0533656Cspg2 chondroitin sulfate proteoglycan 2 (versican) 919 +/- 73 1111 +/- 44 1113 +/- 87 1200 +/- 59 0.1012591 0.0537952 0.4315227Bin1 bridging integrator 1 3287 +/- 261 3907 +/- 355 3154 +/- 108 3522 +/- 125 -0.2615745 0.1924902 0.0547158Cd48 CD48 molecule 394 +/- 43 577 +/- 75 274 +/- 24 387 +/- 42 -0.0039038 0.0660649 0.0551950Ppap2C phosphatidic acid phosphatase type 2C 847 +/- 150 1265 +/- 223 430 +/- 69 630 +/- 61 -0.0065357 0.1548890 0.0576590Clic1 chloride intracellular channel 1 450 +/- 32 468 +/- 12 341 +/- 23 402 +/- 15 -0.0000393 0.6054770 0.0583284Lamp1 lysosomal-associated membrane protein 1 4569 +/- 324 5261 +/- 423 3749 +/- 165 4315 +/- 199 -0.0193457 0.2254370 0.0591777Nfe2L2 nuclear factor (erythroid-derived 2)-like 2 2479 +/- 133 3346 +/- 356 1953 +/- 113 2015 +/- 87 -0.0045017 0.0599949 0.6718247Rps9 Ribosomal protein S9 2793 +/- 217 3319 +/- 103 2565 +/- 81 2814 +/- 257 -0.0861802 0.0638984 0.3998186
S3- Aging related genes in rhesus and rat.xls Page 8

Young vs AgedSymbol Description Young CA Aged CA Young DG Aged DG CA v DG in CA in DGS100A4 S100 calcium binding protein A4 (calcium protein, calvasculin, metastasin, m 129 +/- 16 182 +/- 19 118 +/- 9 146 +/- 18 -0.0505237 0.0651834 0.1981630Msn moesin 2073 +/- 132 2454 +/- 128 2123 +/- 63 2318 +/- 72 -0.6835327 0.0657167 0.0749129Ctsd cathepsin D (lysosomal aspartyl peptidase) 96 +/- 9 129 +/- 13 113 +/- 15 163 +/- 20 0.0372739 0.0665338 0.0760518Sh3Bp5 SH3-domain binding protein 5 (BTK-associated) 884 +/- 60 1084 +/- 77 999 +/- 36 1050 +/- 39 0.3357869 0.0690928 0.3628986Gpx4 glutathione peroxidase 4 (phospholipid hydroperoxidase) 7963 +/- 464 8464 +/- 561 6679 +/- 145 7234 +/- 220 -0.0043258 0.5074510 0.0719936Ncoa3 Nuclear receptor coactivator 3 89 +/- 15 124 +/- 9 166 +/- 12 180 +/- 18 0.0002706 0.0723115 0.5283242Gpsm3 G-protein signalling modulator 3 (AGS3-like, C. elegans) 184 +/- 13 220 +/- 15 181 +/- 7 221 +/- 17 -0.8190921 0.1028015 0.0724839Map1B microtubule-associated protein 1B 23091 +/- 887 25213 +/- 565 23220 +/- 887 24935 +/- 1214 -0.9070223 0.0763942 0.2886424Klk6 kallikrein 6 (neurosin, zyme) 1030 +/- 190 1991 +/- 422 602 +/- 104 823 +/- 47 -0.0142445 0.0768100 0.0940555Lipe lipase, hormone-sensitive 641 +/- 74 906 +/- 109 439 +/- 29 475 +/- 22 -0.0040681 0.0768589 0.3553490Ntrk2 neurotrophic tyrosine kinase, receptor, type 2 10935 +/- 281 12204 +/- 576 11020 +/- 667 11737 +/- 475 -0.3476670 0.0868529 0.4047357Dpp7 Dipeptidyl-peptidase 7 609 +/- 22 921 +/- 147 597 +/- 21 848 +/- 117 -0.0688070 0.0870566 0.0989640Rhoa ras homolog gene family, member A 6057 +/- 234 6889 +/- 365 6013 +/- 192 6545 +/- 208 -0.3131028 0.0889958 0.0942288Ptprf protein tyrosine phosphatase, receptor type, F 1938 +/- 116 2391 +/- 203 2131 +/- 38 2379 +/- 181 0.0671870 0.0891860 0.2479416Prdx6 peroxiredoxin 6 5355 +/- 529 6504 +/- 257 6108 +/- 398 7058 +/- 298 0.0362312 0.0905172 0.0892078Gpd1 glycerol-3-phosphate dehydrogenase 1 (soluble) 451 +/- 61 597 +/- 65 607 +/- 50 773 +/- 69 0.0458656 0.1314136 0.0894053Pde11A phosphodiesterase 11A 104 +/- 10 172 +/- 32 86 +/- 7 103 +/- 21 -0.0648692 0.0932092 0.4813220Ptpn6 protein tyrosine phosphatase, non-receptor type 6 277 +/- 7 305 +/- 17 299 +/- 11 327 +/- 10 0.0690073 0.1710919 0.0943146Cd86 CD86 molecule 127 +/- 14 208 +/- 39 86 +/- 6 132 +/- 24 -0.0119421 0.0945678 0.1234214Asrgl1 asparaginase like 1 1405 +/- 86 1591 +/- 49 1479 +/- 54 1618 +/- 167 0.6547981 0.0980042 0.4685318Cryab crystallin, alpha B 11364 +/- 1007 13433 +/- 1482 8015 +/- 574 9478 +/- 561 -0.0062872 0.2787117 0.1018619Pld1 phospholipase D1, phosphatidylcholine-specific 225 +/- 35 314 +/- 48 141 +/- 17 181 +/- 14 -0.0085037 0.1694986 0.1030327Pde8A Phosphodiesterase 8A 844 +/- 229 1285 +/- 192 545 +/- 66 690 +/- 45 -0.0105159 0.1714711 0.1036090Ptgds prostaglandin D2 synthase 21kDa (brain) 22511 +/- 2273 24357 +/- 1112 18690 +/- 1056 21104 +/- 809 -0.0064959 0.4885458 0.1036685Eef1D Eukaryotic translation elongation factor 1 delta (guanine nucleotide exchange 115 +/- 11 148 +/- 15 119 +/- 12 134 +/- 12 -0.5641078 0.1041495 0.4202773Rpl19 ribosomal protein L19 9357 +/- 185 10005 +/- 306 8787 +/- 293 9412 +/- 306 -0.0021929 0.1062607 0.1740191Rab13 RAB13, member RAS oncogene family 906 +/- 66 1051 +/- 48 935 +/- 61 1071 +/- 50 0.5919567 0.1084248 0.1152042Bet1 BET1 homolog (S. cerevisiae) 629 +/- 39 713 +/- 26 683 +/- 35 689 +/- 9 0.6592954 0.1100186 0.8740623Aldh6A1 aldehyde dehydrogenase 6 family, member A1 582 +/- 117 835 +/- 107 602 +/- 74 747 +/- 28 -0.7825405 0.1423545 0.1115908Jag2 jagged 2 536 +/- 24 626 +/- 44 662 +/- 54 716 +/- 70 0.0159436 0.1127483 0.5633403Alad aminolevulinate, delta-, dehydratase 192 +/- 24 250 +/- 23 165 +/- 13 200 +/- 16 -0.0451113 0.1145861 0.1279879Psme1 proteasome (prosome, macropain) activator subunit 1 (PA28 alpha) 1517 +/- 84 1712 +/- 77 1341 +/- 45 1539 +/- 108 -0.0050461 0.1185632 0.1476109Tgfa transforming growth factor, alpha 114 +/- 13 154 +/- 25 140 +/- 23 188 +/- 15 0.2370484 0.1921067 0.1213186Itpkb inositol 1,4,5-trisphosphate 3-kinase B 15463 +/- 1359 18302 +/- 973 16204 +/- 924 16683 +/- 494 -0.9729089 0.1234325 0.6603844Nfkb1 nuclear factor of kappa light polypeptide gene enhancer in B-cells 1 (p105) 175 +/- 8 201 +/- 13 206 +/- 6 207 +/- 7 0.0387886 0.1254885 0.9269295Ctsc cathepsin C 128 +/- 11 141 +/- 20 95 +/- 7 122 +/- 14 -0.0847890 0.5889993 0.1301646Myo9B myosin IXB 669 +/- 94 844 +/- 90 446 +/- 24 519 +/- 35 -0.0018177 0.2050871 0.1318636Alox5Ap arachidonate 5-lipoxygenase-activating protein 396 +/- 54 473 +/- 55 281 +/- 18 331 +/- 24 -0.0100841 0.3371905 0.1341690Galnt7 UDP-N-acetyl-alpha-D-galactosamine:polypeptide N-acetylgalactosaminyltra 507 +/- 38 593 +/- 37 358 +/- 16 368 +/- 28 -0.0001438 0.1347164 0.7518594Slc12A2 solute carrier family 12 (sodium/potassium/chloride transporters), member 2 528 +/- 75 635 +/- 104 328 +/- 46 433 +/- 45 -0.0050464 0.4271903 0.1387237Jund jun D proto-oncogene 679 +/- 56 787 +/- 57 912 +/- 63 1118 +/- 106 0.0008301 0.2023003 0.1403335S100B S100 calcium binding protein, beta (neural) 123 +/- 20 174 +/- 25 143 +/- 22 179 +/- 40 0.6902436 0.1405708 0.4532374Kctd10 potassium channel tetramerisation domain containing 10 234 +/- 64 309 +/- 28 239 +/- 54 348 +/- 40 0.2546901 0.3205415 0.1407388Pbef1 pre-B-cell colony enhancing factor 1 1321 +/- 53 1436 +/- 49 1222 +/- 45 1355 +/- 80 -0.2117934 0.1443293 0.1926653Lamp2 lysosomal-associated membrane protein 2 1002 +/- 127 1448 +/- 245 598 +/- 83 745 +/- 47 -0.0060799 0.1463506 0.1644174Stxbp3 syntaxin binding protein 3 208 +/- 28 329 +/- 69 213 +/- 18 301 +/- 69 -0.8802035 0.1495316 0.2825708Dnase2 deoxyribonuclease II, lysosomal 327 +/- 64 457 +/- 53 308 +/- 33 407 +/- 51 -0.2965691 0.1496835 0.1502204Rps15 ribosomal protein S15 10399 +/- 364 11238 +/- 397 8679 +/- 352 9306 +/- 297 -0.0000130 0.1499550 0.2068656Pmp22 Peripheral myelin protein 22 414 +/- 67 541 +/- 45 286 +/- 24 316 +/- 42 -0.0031605 0.1519767 0.5632738Csrp1 cysteine and glycine-rich protein 1 10474 +/- 785 12051 +/- 791 7739 +/- 205 8522 +/- 429 -0.0007075 0.1872883 0.1530052Sparcl1 SPARC-like 1 (mast9, hevin) 20455 +/- 810 21245 +/- 1040 19170 +/- 136 20139 +/- 549 -0.0251948 0.5630312 0.1545429Laptm5 lysosomal associated multispanning membrane protein 5 499 +/- 54 666 +/- 93 552 +/- 59 639 +/- 82 0.9792278 0.1587406 0.4184732Cirbp cold inducible RNA binding protein 1972 +/- 371 2621 +/- 206 1719 +/- 180 2040 +/- 99 -0.0910952 0.1661094 0.1593236St18 suppression of tumorigenicity 18 (breast carcinoma) (zinc finger protein) 1703 +/- 277 2524 +/- 453 1389 +/- 126 1471 +/- 154 -0.0729390 0.1595393 0.6898929Gatm glycine amidinotransferase (L-arginine:glycine amidinotransferase) 3776 +/- 286 4611 +/- 460 3996 +/- 251 4390 +/- 166 -0.8133916 0.1606008 0.2256984C3 complement component 3 2677 +/- 238 3668 +/- 587 1655 +/- 154 2039 +/- 196 -0.0037930 0.1642487 0.1618787Pcm1 pericentriolar material 1 276 +/- 35 351 +/- 37 376 +/- 43 381 +/- 24 0.0827748 0.1671968 0.9247813Eif5 eukaryotic translation initiation factor 5 8827 +/- 251 9331 +/- 262 7941 +/- 139 8250 +/- 152 -0.0002345 0.1949471 0.1698313Rpl18 ribosomal protein L18 10779 +/- 411 11534 +/- 392 8934 +/- 293 9623 +/- 357 -0.0000009 0.2127203 0.1731781Psmb8 proteasome (prosome, macropain) subunit, beta type, 8 (large multifunctiona 94 +/- 14 121 +/- 11 98 +/- 7 120 +/- 15 0.8999676 0.1734383 0.2419583
S3- Aging related genes in rhesus and rat.xls Page 9
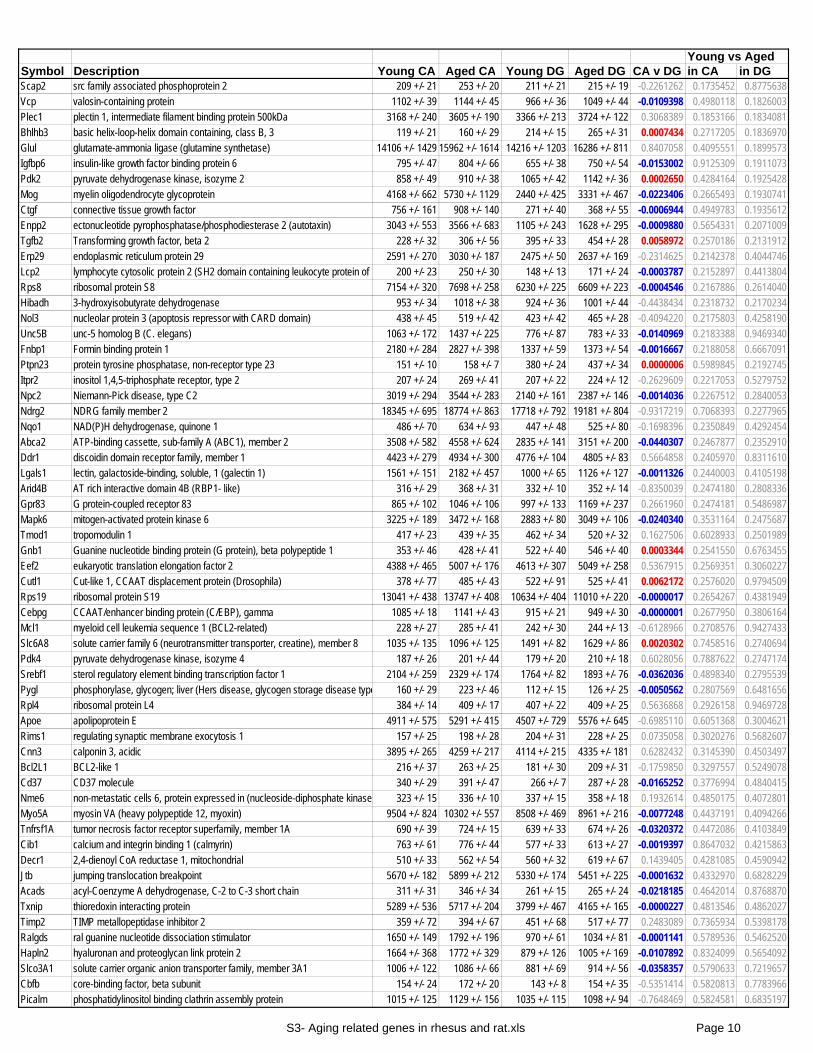
Young vs AgedSymbol Description Young CA Aged CA Young DG Aged DG CA v DG in CA in DGScap2 src family associated phosphoprotein 2 209 +/- 21 253 +/- 20 211 +/- 21 215 +/- 19 -0.2261262 0.1735452 0.8775638Vcp valosin-containing protein 1102 +/- 39 1144 +/- 45 966 +/- 36 1049 +/- 44 -0.0109398 0.4980118 0.1826003Plec1 plectin 1, intermediate filament binding protein 500kDa 3168 +/- 240 3605 +/- 190 3366 +/- 213 3724 +/- 122 0.3068389 0.1853166 0.1834081Bhlhb3 basic helix-loop-helix domain containing, class B, 3 119 +/- 21 160 +/- 29 214 +/- 15 265 +/- 31 0.0007434 0.2717205 0.1836970Glul glutamate-ammonia ligase (glutamine synthetase) 14106 +/- 1429 15962 +/- 1614 14216 +/- 1203 16286 +/- 811 0.8407058 0.4095551 0.1899573Igfbp6 insulin-like growth factor binding protein 6 795 +/- 47 804 +/- 66 655 +/- 38 750 +/- 54 -0.0153002 0.9125309 0.1911073Pdk2 pyruvate dehydrogenase kinase, isozyme 2 858 +/- 49 910 +/- 38 1065 +/- 42 1142 +/- 36 0.0002650 0.4284164 0.1925428Mog myelin oligodendrocyte glycoprotein 4168 +/- 662 5730 +/- 1129 2440 +/- 425 3331 +/- 467 -0.0223406 0.2665493 0.1930741Ctgf connective tissue growth factor 756 +/- 161 908 +/- 140 271 +/- 40 368 +/- 55 -0.0006944 0.4949783 0.1935612Enpp2 ectonucleotide pyrophosphatase/phosphodiesterase 2 (autotaxin) 3043 +/- 553 3566 +/- 683 1105 +/- 243 1628 +/- 295 -0.0009880 0.5654331 0.2071009Tgfb2 Transforming growth factor, beta 2 228 +/- 32 306 +/- 56 395 +/- 33 454 +/- 28 0.0058972 0.2570186 0.2131912Erp29 endoplasmic reticulum protein 29 2591 +/- 270 3030 +/- 187 2475 +/- 50 2637 +/- 169 -0.2314625 0.2142378 0.4044746Lcp2 lymphocyte cytosolic protein 2 (SH2 domain containing leukocyte protein of 7 200 +/- 23 250 +/- 30 148 +/- 13 171 +/- 24 -0.0003787 0.2152897 0.4413804Rps8 ribosomal protein S8 7154 +/- 320 7698 +/- 258 6230 +/- 225 6609 +/- 223 -0.0004546 0.2167886 0.2614040Hibadh 3-hydroxyisobutyrate dehydrogenase 953 +/- 34 1018 +/- 38 924 +/- 36 1001 +/- 44 -0.4438434 0.2318732 0.2170234Nol3 nucleolar protein 3 (apoptosis repressor with CARD domain) 438 +/- 45 519 +/- 42 423 +/- 42 465 +/- 28 -0.4094220 0.2175803 0.4258190Unc5B unc-5 homolog B (C. elegans) 1063 +/- 172 1437 +/- 225 776 +/- 87 783 +/- 33 -0.0140969 0.2183388 0.9469340Fnbp1 Formin binding protein 1 2180 +/- 284 2827 +/- 398 1337 +/- 59 1373 +/- 54 -0.0016667 0.2188058 0.6667091Ptpn23 protein tyrosine phosphatase, non-receptor type 23 151 +/- 10 158 +/- 7 380 +/- 24 437 +/- 34 0.0000006 0.5989845 0.2192745Itpr2 inositol 1,4,5-triphosphate receptor, type 2 207 +/- 24 269 +/- 41 207 +/- 22 224 +/- 12 -0.2629609 0.2217053 0.5279752Npc2 Niemann-Pick disease, type C2 3019 +/- 294 3544 +/- 283 2140 +/- 161 2387 +/- 146 -0.0014036 0.2267512 0.2840053Ndrg2 NDRG family member 2 18345 +/- 695 18774 +/- 863 17718 +/- 792 19181 +/- 804 -0.9317219 0.7068393 0.2277965Nqo1 NAD(P)H dehydrogenase, quinone 1 486 +/- 70 634 +/- 93 447 +/- 48 525 +/- 80 -0.1698396 0.2350849 0.4292454Abca2 ATP-binding cassette, sub-family A (ABC1), member 2 3508 +/- 582 4558 +/- 624 2835 +/- 141 3151 +/- 200 -0.0440307 0.2467877 0.2352910Ddr1 discoidin domain receptor family, member 1 4423 +/- 279 4934 +/- 300 4776 +/- 104 4805 +/- 83 0.5664858 0.2405970 0.8311610Lgals1 lectin, galactoside-binding, soluble, 1 (galectin 1) 1561 +/- 151 2182 +/- 457 1000 +/- 65 1126 +/- 127 -0.0011326 0.2440003 0.4105198Arid4B AT rich interactive domain 4B (RBP1- like) 316 +/- 29 368 +/- 31 332 +/- 10 352 +/- 14 -0.8350039 0.2474180 0.2808336Gpr83 G protein-coupled receptor 83 865 +/- 102 1046 +/- 106 997 +/- 133 1169 +/- 237 0.2661960 0.2474181 0.5486987Mapk6 mitogen-activated protein kinase 6 3225 +/- 189 3472 +/- 168 2883 +/- 80 3049 +/- 106 -0.0240340 0.3531164 0.2475687Tmod1 tropomodulin 1 417 +/- 23 439 +/- 35 462 +/- 34 520 +/- 32 0.1627506 0.6028933 0.2501989Gnb1 Guanine nucleotide binding protein (G protein), beta polypeptide 1 353 +/- 46 428 +/- 41 522 +/- 40 546 +/- 40 0.0003344 0.2541550 0.6763455Eef2 eukaryotic translation elongation factor 2 4388 +/- 465 5007 +/- 176 4613 +/- 307 5049 +/- 258 0.5367915 0.2569351 0.3060227Cutl1 Cut-like 1, CCAAT displacement protein (Drosophila) 378 +/- 77 485 +/- 43 522 +/- 91 525 +/- 41 0.0062172 0.2576020 0.9794509Rps19 ribosomal protein S19 13041 +/- 438 13747 +/- 408 10634 +/- 404 11010 +/- 220 -0.0000017 0.2654267 0.4381949Cebpg CCAAT/enhancer binding protein (C/EBP), gamma 1085 +/- 18 1141 +/- 43 915 +/- 21 949 +/- 30 -0.0000001 0.2677950 0.3806164Mcl1 myeloid cell leukemia sequence 1 (BCL2-related) 228 +/- 27 285 +/- 41 242 +/- 30 244 +/- 13 -0.6128966 0.2708576 0.9427433Slc6A8 solute carrier family 6 (neurotransmitter transporter, creatine), member 8 1035 +/- 135 1096 +/- 125 1491 +/- 82 1629 +/- 86 0.0020302 0.7458516 0.2740694Pdk4 pyruvate dehydrogenase kinase, isozyme 4 187 +/- 26 201 +/- 44 179 +/- 20 210 +/- 18 0.6028056 0.7887622 0.2747174Srebf1 sterol regulatory element binding transcription factor 1 2104 +/- 259 2329 +/- 174 1764 +/- 82 1893 +/- 76 -0.0362036 0.4898340 0.2795539Pygl phosphorylase, glycogen; liver (Hers disease, glycogen storage disease type 160 +/- 29 223 +/- 46 112 +/- 15 126 +/- 25 -0.0050562 0.2807569 0.6481656Rpl4 ribosomal protein L4 384 +/- 14 409 +/- 17 407 +/- 22 409 +/- 25 0.5636868 0.2926158 0.9469728Apoe apolipoprotein E 4911 +/- 575 5291 +/- 415 4507 +/- 729 5576 +/- 645 -0.6985110 0.6051368 0.3004621Rims1 regulating synaptic membrane exocytosis 1 157 +/- 25 198 +/- 28 204 +/- 31 228 +/- 25 0.0735058 0.3020276 0.5682607Cnn3 calponin 3, acidic 3895 +/- 265 4259 +/- 217 4114 +/- 215 4335 +/- 181 0.6282432 0.3145390 0.4503497Bcl2L1 BCL2-like 1 216 +/- 37 263 +/- 25 181 +/- 30 209 +/- 31 -0.1759850 0.3297557 0.5249078Cd37 CD37 molecule 340 +/- 29 391 +/- 47 266 +/- 7 287 +/- 28 -0.0165252 0.3776994 0.4840415Nme6 non-metastatic cells 6, protein expressed in (nucleoside-diphosphate kinase) 323 +/- 15 336 +/- 10 337 +/- 15 358 +/- 18 0.1932614 0.4850175 0.4072801Myo5A myosin VA (heavy polypeptide 12, myoxin) 9504 +/- 824 10302 +/- 557 8508 +/- 469 8961 +/- 216 -0.0077248 0.4437191 0.4094266Tnfrsf1A tumor necrosis factor receptor superfamily, member 1A 690 +/- 39 724 +/- 15 639 +/- 33 674 +/- 26 -0.0320372 0.4472086 0.4103849Cib1 calcium and integrin binding 1 (calmyrin) 763 +/- 61 776 +/- 44 577 +/- 33 613 +/- 27 -0.0019397 0.8647032 0.4215863Decr1 2,4-dienoyl CoA reductase 1, mitochondrial 510 +/- 33 562 +/- 54 560 +/- 32 619 +/- 67 0.1439405 0.4281085 0.4590942Jtb jumping translocation breakpoint 5670 +/- 182 5899 +/- 212 5330 +/- 174 5451 +/- 225 -0.0001632 0.4332970 0.6828229Acads acyl-Coenzyme A dehydrogenase, C-2 to C-3 short chain 311 +/- 31 346 +/- 34 261 +/- 15 265 +/- 24 -0.0218185 0.4642014 0.8768870Txnip thioredoxin interacting protein 5289 +/- 536 5717 +/- 204 3799 +/- 467 4165 +/- 165 -0.0000227 0.4813546 0.4862027Timp2 TIMP metallopeptidase inhibitor 2 359 +/- 72 394 +/- 67 451 +/- 68 517 +/- 77 0.2483089 0.7365934 0.5398178Ralgds ral guanine nucleotide dissociation stimulator 1650 +/- 149 1792 +/- 196 970 +/- 61 1034 +/- 81 -0.0001141 0.5789536 0.5462520Hapln2 hyaluronan and proteoglycan link protein 2 1664 +/- 368 1772 +/- 329 879 +/- 126 1005 +/- 169 -0.0107892 0.8324099 0.5654092Slco3A1 solute carrier organic anion transporter family, member 3A1 1006 +/- 122 1086 +/- 66 881 +/- 69 914 +/- 56 -0.0358357 0.5790633 0.7219657Cbfb core-binding factor, beta subunit 154 +/- 24 172 +/- 20 143 +/- 8 154 +/- 35 -0.5351414 0.5820813 0.7783966Picalm phosphatidylinositol binding clathrin assembly protein 1015 +/- 125 1129 +/- 156 1035 +/- 115 1098 +/- 94 -0.7648469 0.5824581 0.6835197
S3- Aging related genes in rhesus and rat.xls Page 10

Young vs AgedSymbol Description Young CA Aged CA Young DG Aged DG CA v DG in CA in DGIfitm3 interferon induced transmembrane protein 3 (1-8U) 119 +/- 10 128 +/- 25 116 +/- 8 127 +/- 17 -0.4017021 0.7627126 0.5886238Aif1 allograft inflammatory factor 1 304 +/- 36 332 +/- 38 246 +/- 22 256 +/- 20 -0.0322170 0.6062468 0.7402166Padi2 peptidyl arginine deiminase, type II 143 +/- 36 169 +/- 46 201 +/- 24 202 +/- 38 0.3076244 0.6628414 0.9901754Cspg5 chondroitin sulfate proteoglycan 5 (neuroglycan C) 645 +/- 130 684 +/- 71 783 +/- 137 842 +/- 34 0.0433197 0.7995659 0.6894908Anxa3 annexin A3 179 +/- 17 187 +/- 12 172 +/- 13 182 +/- 25 -0.6010575 0.7090863 0.7229061Gnai2 guanine nucleotide binding protein (G protein), alpha inhibiting activity polype 1209 +/- 75 1245 +/- 68 1205 +/- 42 1240 +/- 80 -0.7659332 0.7239160 0.7134297Dll1 delta-like 1 (Drosophila) 166 +/- 14 173 +/- 22 203 +/- 21 212 +/- 15 0.1269054 0.7917236 0.7487577Adamts1 ADAM metallopeptidase with thrombospondin type 1 motif, 1 128 +/- 24 137 +/- 31 104 +/- 14 105 +/- 24 -0.1352877 0.8083947 0.9766611Fxyd1 FXYD domain containing ion transport regulator 1 (phospholemman) 4254 +/- 282 4317 +/- 263 4481 +/- 302 4511 +/- 256 0.2722129 0.8731544 0.9418538Stxbp2 syntaxin binding protein 2 135 +/- 12 137 +/- 13 118 +/- 9 119 +/- 12 -0.0961304 0.9066216 0.9766021Down in Rat Aging Studies OnlySlc17A6 solute carrier family 17 (sodium-dependent inorganic phosphate cotransporte 902 +/- 242 895 +/- 168 1208 +/- 91 1179 +/- 134 0.1764563 -0.9835658 -0.8599302Btg2 BTG family, member 2 122 +/- 14 118 +/- 16 140 +/- 13 135 +/- 10 0.1399547 -0.8669667 -0.7861833Adcy5 adenylate cyclase 5 782 +/- 43 764 +/- 28 636 +/- 14 627 +/- 29 -0.0001256 -0.7277576 -0.7950049Col11A1 Collagen, type XI, alpha 1 242 +/- 36 233 +/- 53 334 +/- 77 299 +/- 25 0.0083434 -0.8907137 -0.6830708Madd MAP-kinase activating death domain 2078 +/- 156 1974 +/- 159 2452 +/- 135 2445 +/- 162 0.0000992 -0.6518347 -0.9712544Camk2D calcium/calmodulin-dependent protein kinase (CaM kinase) II delta 7913 +/- 785 7412 +/- 778 3163 +/- 483 2842 +/- 481 -0.0000020 -0.6594735 -0.6491775Adrbk1 adrenergic, beta, receptor kinase 1 285 +/- 27 268 +/- 21 265 +/- 30 256 +/- 42 -0.6075008 -0.6300619 -0.8680339Ca4 carbonic anhydrase IV 614 +/- 77 577 +/- 69 979 +/- 67 927 +/- 74 0.0003622 -0.7276679 -0.6169736Csrp2 cysteine and glycine-rich protein 2 211 +/- 30 185 +/- 24 159 +/- 19 145 +/- 11 -0.0336570 -0.5319547 -0.5538771Ppm1G protein phosphatase 1G (formerly 2C), magnesium-dependent, gamma isofo 878 +/- 33 852 +/- 20 906 +/- 20 891 +/- 11 0.0226414 -0.5198417 -0.5370966Ppm2C protein phosphatase 2C, magnesium-dependent, catalytic subunit 3113 +/- 189 2927 +/- 234 2699 +/- 186 2556 +/- 48 -0.0874371 -0.5491130 -0.4882572Igfbp2 insulin-like growth factor binding protein 2, 36kDa 370 +/- 44 326 +/- 37 652 +/- 87 579 +/- 101 0.0008725 -0.4851884 -0.5982331Ppfia4 protein tyrosine phosphatase, receptor type, f polypeptide (PTPRF), interacti 1441 +/- 132 1292 +/- 155 2032 +/- 145 1947 +/- 101 0.0003794 -0.4842730 -0.6450353Kcnf1 potassium voltage-gated channel, subfamily F, member 1 1301 +/- 149 1157 +/- 130 914 +/- 59 867 +/- 82 -0.0046032 -0.4823173 -0.6512262Myh6 myosin, heavy polypeptide 6, cardiac muscle, alpha (cardiomyopathy, hypert 278 +/- 33 245 +/- 30 327 +/- 31 321 +/- 22 0.0660676 -0.4771881 -0.8794734Cacnb2 calcium channel, voltage-dependent, beta 2 subunit 715 +/- 48 653 +/- 54 799 +/- 59 786 +/- 48 0.0299949 -0.4160334 -0.8665600Hspa4 Heat shock 70kDa protein 4 3762 +/- 367 3378 +/- 245 3542 +/- 138 3432 +/- 190 -0.5041630 -0.4072292 -0.6521646Prkar1A protein kinase, cAMP-dependent, regulatory, type I, alpha (tissue specific ex 3090 +/- 443 2621 +/- 285 2802 +/- 285 2785 +/- 336 -0.5545442 -0.3975163 -0.9706189Dpysl4 dihydropyrimidinase-like 4 1199 +/- 32 1102 +/- 101 1215 +/- 55 1206 +/- 80 0.1187996 -0.3963646 -0.9275164Kit v-kit Hardy-Zuckerman 4 feline sarcoma viral oncogene homolog 4667 +/- 898 3619 +/- 752 5985 +/- 275 5401 +/- 655 0.0100688 -0.3927923 -0.4458483Pou3F1 POU domain, class 3, transcription factor 1 5136 +/- 1055 4008 +/- 595 1167 +/- 451 1031 +/- 340 -0.0008464 -0.3792670 -0.8157391Rgs14 regulator of G-protein signalling 14 298 +/- 89 208 +/- 22 207 +/- 5 204 +/- 13 -0.3689393 -0.3672639 -0.8628189Tmsb10 thymosin, beta 10 19055 +/- 1135 17143 +/- 1661 14060 +/- 1235 13713 +/- 1031 -0.0004159 -0.3671934 -0.8343127Cacna1B calcium channel, voltage-dependent, L type, alpha 1B subunit 1982 +/- 101 1808 +/- 172 2242 +/- 49 2084 +/- 149 0.0298995 -0.4076252 -0.3622133Nxf1 nuclear RNA export factor 1 3265 +/- 226 3157 +/- 115 3275 +/- 143 3118 +/- 75 -0.8600065 -0.6841242 -0.3605383Gprasp1 G protein-coupled receptor associated sorting protein 1 4611 +/- 221 4291 +/- 243 3914 +/- 135 3833 +/- 188 -0.0061492 -0.3533829 -0.7365751Eif4E eukaryotic translation initiation factor 4E 3169 +/- 170 2943 +/- 156 2890 +/- 146 2731 +/- 85 -0.1546955 -0.3497306 -0.3739587Adcy8 adenylate cyclase 8 (brain) 842 +/- 32 772 +/- 62 492 +/- 39 485 +/- 16 -0.0000127 -0.3462817 -0.8748631Hdgf hepatoma-derived growth factor (high-mobility group protein 1-like) 2905 +/- 89 2801 +/- 95 2676 +/- 61 2604 +/- 36 -0.0440635 -0.4434101 -0.3409014Wrnip1 Werner helicase interacting protein 1 2354 +/- 101 2186 +/- 134 3033 +/- 152 2971 +/- 26 0.0000426 -0.3406765 -0.6986370Neu1 sialidase 1 (lysosomal sialidase) 678 +/- 30 616 +/- 53 647 +/- 52 590 +/- 48 -0.1012240 -0.3384211 -0.4384886Gabrd gamma-aminobutyric acid (GABA) A receptor, delta 701 +/- 68 649 +/- 83 1003 +/- 85 887 +/- 75 0.0269858 -0.6363141 -0.3336106Rab4B RAB4B, member RAS oncogene family 2461 +/- 101 2309 +/- 109 2161 +/- 63 2153 +/- 84 -0.0665174 -0.3305738 -0.9368148Olfm3 olfactomedin 3 567 +/- 99 458 +/- 41 221 +/- 45 166 +/- 25 -0.0001225 -0.3433617 -0.3197715Ctbp1 C-terminal binding protein 1 2888 +/- 204 2604 +/- 172 3515 +/- 93 3484 +/- 319 0.0000783 -0.3112263 -0.9302968Flot2 flotillin 2 1471 +/- 66 1362 +/- 76 1778 +/- 32 1705 +/- 72 0.0000211 -0.3066409 -0.3914526Myo5B myosin VB 327 +/- 86 237 +/- 59 476 +/- 56 404 +/- 35 0.0231608 -0.4061175 -0.3063663Kcnip4 Kv channel interacting protein 4 1579 +/- 121 1440 +/- 183 1673 +/- 153 1407 +/- 182 0.9504456 -0.5431295 -0.2952709Scrg1 scrapie responsive protein 1 2376 +/- 217 2095 +/- 125 1932 +/- 160 1732 +/- 278 -0.0446596 -0.2951793 -0.5548998Gnas GNAS complex locus 3449 +/- 199 3168 +/- 250 4315 +/- 161 3991 +/- 231 0.0000165 -0.4015160 -0.2849155Ttr transthyretin (prealbumin, amyloidosis type I) 435 +/- 177 190 +/- 60 458 +/- 177 269 +/- 112 0.4852815 -0.2844008 -0.3918960Nr4A2 nuclear receptor subfamily 4, group A, member 2 769 +/- 158 560 +/- 84 472 +/- 79 451 +/- 48 -0.0470992 -0.2784260 -0.8263460Ppp2R2C protein phosphatase 2 (formerly 2A), regulatory subunit B (PR 52), gamma is 1920 +/- 87 1787 +/- 75 1505 +/- 116 1415 +/- 120 -0.0003213 -0.2752064 -0.6049540Dio2 deiodinase, iodothyronine, type II 167 +/- 41 112 +/- 21 144 +/- 10 139 +/- 15 0.8484750 -0.2702075 -0.7862242Impa1 inositol(myo)-1(or 4)-monophosphatase 1 1283 +/- 103 1184 +/- 46 1257 +/- 31 1171 +/- 63 -0.6882145 -0.4122801 -0.2658341Synpr synaptoporin 7801 +/- 1027 6762 +/- 1198 12700 +/- 298 11939 +/- 542 0.0000549 -0.5256297 -0.2624811Actn1 actinin, alpha 1 3839 +/- 279 3397 +/- 240 4211 +/- 216 4122 +/- 276 0.0325171 -0.2588756 -0.8047270Aacs acetoacetyl-CoA synthetase 1751 +/- 102 1591 +/- 86 1523 +/- 75 1481 +/- 49 -0.0162333 -0.2587777 -0.6488343Tubb3 tubulin, beta 3 2758 +/- 164 2409 +/- 237 2608 +/- 109 2390 +/- 172 -0.4130377 -0.2577232 -0.3201985
S3- Aging related genes in rhesus and rat.xls Page 11

Young vs AgedSymbol Description Young CA Aged CA Young DG Aged DG CA v DG in CA in DGArl1 ADP-ribosylation factor-like 1 1349 +/- 146 1142 +/- 86 1453 +/- 83 1392 +/- 83 0.1329023 -0.2575022 -0.6179959Jun v-jun sarcoma virus 17 oncogene homolog (avian) 700 +/- 55 634 +/- 49 1304 +/- 111 1155 +/- 39 0.0000594 -0.3917051 -0.2506023Syt4 synaptotagmin IV 9719 +/- 546 8818 +/- 490 10923 +/- 459 10364 +/- 486 0.0046699 -0.2473968 -0.4249406Ap3M2 Adaptor-related protein complex 3, mu 2 subunit 112 +/- 11 103 +/- 9 132 +/- 10 114 +/- 11 0.1997690 -0.5198280 -0.2427328Grin1 glutamate receptor, ionotropic, N-methyl D-aspartate 1 3870 +/- 384 3282 +/- 267 4398 +/- 321 3934 +/- 220 0.0025778 -0.2399177 -0.2644958Rabggta Rab geranylgeranyltransferase, alpha subunit 889 +/- 42 857 +/- 33 884 +/- 23 832 +/- 32 -0.3489373 -0.5593272 -0.2178008Prkcb1 Protein kinase C, beta 1 2174 +/- 618 1285 +/- 104 803 +/- 83 774 +/- 98 -0.0163718 -0.2119266 -0.8247185Sumo2 SMT3 suppressor of mif two 3 homolog 2 (S. cerevisiae) 12943 +/- 496 11884 +/- 615 16502 +/- 609 16284 +/- 549 0.0000299 -0.2112664 -0.7961450Rgs7 regulator of G-protein signalling 7 794 +/- 71 668 +/- 60 873 +/- 57 791 +/- 27 0.1398040 -0.2035436 -0.2346507Pctk1 PCTAIRE protein kinase 1 623 +/- 24 568 +/- 32 793 +/- 32 758 +/- 34 0.0000250 -0.1954851 -0.4715217Lum lumican 437 +/- 84 293 +/- 58 385 +/- 107 363 +/- 44 0.8125121 -0.1935834 -0.8558000Ndufv2 NADH dehydrogenase (ubiquinone) flavoprotein 2, 24kDa 3532 +/- 76 3362 +/- 94 3553 +/- 80 3385 +/- 134 0.9152323 -0.1916097 -0.3198443Kcnmb4 potassium large conductance calcium-activated channel, subfamily M, beta m 4385 +/- 214 3933 +/- 241 3832 +/- 305 3761 +/- 273 -0.1854436 -0.1912233 -0.8661861Spon1 spondin 1, extracellular matrix protein 3932 +/- 216 3444 +/- 271 2878 +/- 136 2785 +/- 177 -0.0004018 -0.1908226 -0.6891389Prkar2B protein kinase, cAMP-dependent, regulatory, type II, beta 3106 +/- 228 2727 +/- 129 2921 +/- 117 2710 +/- 127 -0.1774722 -0.1856242 -0.2551475Stk39 serine threonine kinase 39 (STE20/SPS1 homolog, yeast) 1847 +/- 187 1846 +/- 170 1220 +/- 71 1109 +/- 21 -0.0002523 -0.9992789 -0.1840012Cntnap1 contactin associated protein 1 3407 +/- 281 3364 +/- 250 3245 +/- 211 2852 +/- 171 -0.1115418 -0.9116809 -0.1815519Smpd3 sphingomyelin phosphodiesterase 3, neutral membrane (neutral sphingomye 1229 +/- 172 973 +/- 155 1527 +/- 73 1365 +/- 83 0.0041741 -0.2945442 -0.1788589Dnm1L dynamin 1-like 1354 +/- 93 1195 +/- 43 1395 +/- 78 1327 +/- 68 0.1464051 -0.1650452 -0.5281813Atp2A2 ATPase, Ca++ transporting, cardiac muscle, slow twitch 2 6511 +/- 315 5809 +/- 343 6375 +/- 208 6016 +/- 283 0.6808326 -0.1625754 -0.3379554B4Galt6 UDP-Gal:betaGlcNAc beta 1,4- galactosyltransferase, polypeptide 6 3702 +/- 250 3117 +/- 295 4186 +/- 123 4025 +/- 189 0.0020351 -0.1612396 -0.4982988Irs2 insulin receptor substrate 2 5710 +/- 303 5168 +/- 167 4725 +/- 171 4676 +/- 173 -0.0110467 -0.1563534 -0.8439038Maged2 melanoma antigen family D, 2 161 +/- 23 129 +/- 8 157 +/- 25 114 +/- 10 -0.6241616 -0.2262033 -0.1555367Sh3Kbp1 SH3-domain kinase binding protein 1 986 +/- 71 824 +/- 87 753 +/- 42 615 +/- 74 -0.0069100 -0.1819558 -0.1535237Hfe hemochromatosis 171 +/- 34 112 +/- 14 205 +/- 34 169 +/- 21 0.0139458 -0.1497135 -0.3845483Calu calumenin 1229 +/- 91 1066 +/- 40 1331 +/- 57 1230 +/- 23 0.0103953 -0.1466325 -0.1459970Lxn latexin 599 +/- 97 409 +/- 66 350 +/- 98 211 +/- 10 -0.0127412 -0.1414969 -0.2164585Drb1 developmentally regulated RNA-binding protein 1 747 +/- 41 661 +/- 33 647 +/- 19 614 +/- 19 -0.0111814 -0.1383381 -0.2553773Sip1 survival of motor neuron protein interacting protein 1 279 +/- 20 215 +/- 33 293 +/- 33 255 +/- 15 0.5654550 -0.1364447 -0.3295476Mmp16 matrix metallopeptidase 16 (membrane-inserted) 267 +/- 38 205 +/- 20 387 +/- 31 308 +/- 36 0.0005269 -0.1916111 -0.1358128Tnc Tenascin C (hexabrachion) 123 +/- 12 95 +/- 12 170 +/- 14 135 +/- 16 0.0056985 -0.1348806 -0.1368609Sstr1 somatostatin receptor 1 707 +/- 107 496 +/- 68 698 +/- 72 588 +/- 72 0.6642807 -0.1342815 -0.3076193Dscam Down syndrome cell adhesion molecule 513 +/- 35 438 +/- 30 494 +/- 29 472 +/- 28 0.7994537 -0.1335554 -0.5953409Mtpn myotrophin 9221 +/- 411 8161 +/- 473 9817 +/- 285 9520 +/- 335 0.0177722 -0.1223914 -0.5176720Cacna1D calcium channel, voltage-dependent, L type, alpha 1D subunit 275 +/- 14 241 +/- 31 393 +/- 22 346 +/- 16 0.0004820 -0.3451331 -0.1207091Atxn10 ataxin 10 7387 +/- 309 6658 +/- 277 7155 +/- 165 6860 +/- 168 -0.9533112 -0.1104730 -0.2435040Mpzl1 myelin protein zero-like 1 127 +/- 19 119 +/- 8 157 +/- 17 122 +/- 9 0.3689070 -0.7005603 -0.1100686Ppp3Cb protein phosphatase 3 (formerly 2B), catalytic subunit, beta isoform (calcineu 15152 +/- 1195 12631 +/- 714 12302 +/- 318 11683 +/- 323 -0.0386873 -0.1069854 -0.2056822Syt5 synaptotagmin V 1590 +/- 119 1315 +/- 96 2095 +/- 145 1945 +/- 55 0.0000329 -0.1048000 -0.3679430Coro1A coronin, actin binding protein, 1A 1257 +/- 114 1020 +/- 57 834 +/- 46 816 +/- 54 -0.0046753 -0.1027082 -0.8012305Egr1 early growth response 1 233 +/- 29 173 +/- 15 205 +/- 13 168 +/- 15 -0.2665383 -0.1072100 -0.1011808Safb scaffold attachment factor B 1532 +/- 134 1300 +/- 132 1486 +/- 73 1283 +/- 80 -0.2585838 -0.2445264 -0.0954789Gpd2 glycerol-3-phosphate dehydrogenase 2 (mitochondrial) 2261 +/- 127 1979 +/- 148 2578 +/- 83 2297 +/- 121 0.0108904 -0.1789762 -0.0953327Rab2 RAB2, member RAS oncogene family 867 +/- 89 668 +/- 49 784 +/- 73 643 +/- 71 -0.1457303 -0.0885972 -0.2017205Scn2B sodium channel, voltage-gated, type II, beta 5113 +/- 69 4612 +/- 234 4913 +/- 202 4910 +/- 177 0.9080094 -0.0871552 -0.9904250Syt7 synaptotagmin VII 114 +/- 17 89 +/- 14 257 +/- 20 201 +/- 21 0.0000281 -0.2873830 -0.0865606Tacr1 tachykinin receptor 1 118 +/- 3 103 +/- 12 193 +/- 23 142 +/- 11 0.0023689 -0.2599580 -0.0856042Bckdhb branched chain keto acid dehydrogenase E1, beta polypeptide (maple syrup 919 +/- 59 784 +/- 36 912 +/- 32 883 +/- 55 0.3338507 -0.0842831 -0.6679067Tcp1 t-complex 1 3494 +/- 291 2853 +/- 122 3105 +/- 55 2928 +/- 107 -0.4544495 -0.0837687 -0.1900724Psma1 proteasome (prosome, macropain) subunit, alpha type, 1 2881 +/- 149 2517 +/- 112 3221 +/- 146 2822 +/- 191 0.0494849 -0.0819812 -0.1355033Dcamkl1 Doublecortin and CaM kinase-like 1 6154 +/- 315 5802 +/- 319 6877 +/- 374 5921 +/- 307 0.1320771 -0.4504813 -0.0795961Bad BCL2-antagonist of cell death 209 +/- 15 173 +/- 10 175 +/- 14 142 +/- 18 -0.0477613 -0.0792615 -0.1911432Nell1 NEL-like 1 (chicken) 2297 +/- 225 1832 +/- 209 3169 +/- 220 2599 +/- 185 0.0000152 -0.1603789 -0.0787580Gnaz guanine nucleotide binding protein (G protein), alpha z polypeptide 1857 +/- 101 1699 +/- 201 1760 +/- 110 1480 +/- 88 -0.3190603 -0.5036353 -0.0777622Kcnv1 potassium channel, subfamily V, member 1 194 +/- 32 123 +/- 8 173 +/- 25 145 +/- 18 0.9129403 -0.0768855 -0.3933686Npy neuropeptide Y 2431 +/- 393 2354 +/- 346 2387 +/- 348 1610 +/- 96 -0.1608260 -0.8851595 -0.0767649Nudc nuclear distribution gene C homolog (A. nidulans) 416 +/- 31 398 +/- 27 405 +/- 31 328 +/- 20 -0.1185474 -0.6608070 -0.0736951Camk2A calcium/calmodulin-dependent protein kinase (CaM kinase) II alpha 1142 +/- 306 753 +/- 139 2093 +/- 147 1714 +/- 114 0.0027982 -0.2858937 -0.0726365Nr4A3 nuclear receptor subfamily 4, group A, member 3 1621 +/- 76 1285 +/- 140 1691 +/- 80 1403 +/- 136 0.1507312 -0.0695149 -0.1127868Pacs1 phosphofurin acidic cluster sorting protein 1 1143 +/- 107 979 +/- 113 1099 +/- 53 969 +/- 31 -0.9045245 -0.3178664 -0.0687470
S3- Aging related genes in rhesus and rat.xls Page 12

Young vs AgedSymbol Description Young CA Aged CA Young DG Aged DG CA v DG in CA in DGPtpro protein tyrosine phosphatase, receptor type, O 182 +/- 28 154 +/- 7 190 +/- 7 136 +/- 22 -0.9613774 -0.3692253 -0.0680233Robo1 Roundabout, axon guidance receptor, homolog 1 (Drosophila) 342 +/- 33 264 +/- 31 489 +/- 6 390 +/- 40 0.0003866 -0.1103317 -0.0663500Dusp6 dual specificity phosphatase 6 2476 +/- 370 1560 +/- 213 892 +/- 95 753 +/- 79 -0.0013380 -0.0640929 -0.2901094Fkbp4 FK506 binding protein 4, 59kDa 2670 +/- 102 2376 +/- 106 2656 +/- 93 2428 +/- 45 0.7423512 -0.0730113 -0.0621010Slc7A10 solute carrier family 7, (neutral amino acid transporter, y+ system) member 1 357 +/- 22 330 +/- 22 416 +/- 20 346 +/- 25 0.0389038 -0.3933736 -0.0605756Scamp1 Secretory carrier membrane protein 1 2137 +/- 86 1819 +/- 119 2099 +/- 116 1898 +/- 94 0.8043134 -0.0579743 -0.2100475Mark1 MAP/microtubule affinity-regulating kinase 1 803 +/- 91 576 +/- 38 699 +/- 67 547 +/- 62 -0.1761843 -0.0571661 -0.1322871Hmgcr 3-hydroxy-3-methylglutaryl-Coenzyme A reductase 1890 +/- 172 1539 +/- 69 2130 +/- 95 1817 +/- 102 0.0473670 -0.1019236 -0.0526806Ube2G1 ubiquitin-conjugating enzyme E2G 1 (UBC7 homolog, yeast) 643 +/- 51 771 +/- 63 502 +/- 12 695 +/- 17 -0.0213582 0.1500320 0.0000234Vdp vesicle docking protein p115 333 +/- 23 487 +/- 24 387 +/- 27 440 +/- 22 0.4782452 0.0008437 0.1629648Pld2 phospholipase D2 201 +/- 20 312 +/- 13 231 +/- 27 280 +/- 18 -0.8057218 0.0013884 0.1656428Fez1 fasciculation and elongation protein zeta 1 (zygin I) 8114 +/- 604 9755 +/- 837 6969 +/- 218 8397 +/- 232 -0.0323666 0.1460565 0.0016351Adprh ADP-ribosylarginine hydrolase 189 +/- 23 309 +/- 20 168 +/- 16 281 +/- 20 -0.0153821 0.0030101 0.0023404Eno1 enolase 1, (alpha) 7846 +/- 333 9198 +/- 336 6480 +/- 135 7880 +/- 253 -0.0003912 0.0169672 0.0025195Bpnt1 3'(2'), 5'-bisphosphate nucleotidase 1 161 +/- 18 269 +/- 23 210 +/- 23 267 +/- 28 0.1584836 0.0048843 0.1565358Slc15A4 Solute carrier family 15, member 4 630 +/- 46 885 +/- 55 671 +/- 24 756 +/- 14 -0.4346732 0.0053372 0.0149817Polr2G polymerase (RNA) II (DNA directed) polypeptide G 1501 +/- 46 1883 +/- 158 1045 +/- 54 1288 +/- 36 -0.0003485 0.0603422 0.0053670Pak2 p21 (CDKN1A)-activated kinase 2 335 +/- 25 481 +/- 33 362 +/- 10 410 +/- 22 -0.4680143 0.0059192 0.0965466Gamt guanidinoacetate N-methyltransferase 1022 +/- 43 1199 +/- 29 1147 +/- 61 1359 +/- 156 0.0431660 0.0094010 0.2610730Sc4Mol sterol-C4-methyl oxidase-like 5593 +/- 587 6927 +/- 418 5526 +/- 348 7175 +/- 378 0.8695356 0.0972138 0.0112460Nme1 Non-metastatic cells 1, protein (NM23A) expressed in 1207 +/- 74 1482 +/- 34 1218 +/- 92 1399 +/- 47 -0.4883093 0.0116430 0.1198986Slc14A1 Solute carrier family 14 (urea transporter), member 1 (Kidd blood group) 669 +/- 53 1000 +/- 92 657 +/- 68 883 +/- 90 -0.4189439 0.0141667 0.0795725Psmb7 Proteasome (prosome, macropain) subunit, beta type, 7 371 +/- 27 515 +/- 39 467 +/- 43 650 +/- 85 0.0079241 0.0143763 0.1031129Tpm1 Tropomyosin 1 (alpha) 396 +/- 71 679 +/- 70 626 +/- 100 856 +/- 98 0.0007556 0.0180423 0.1358359Nr2F1 Nuclear receptor subfamily 2, group F, member 1 3880 +/- 234 4227 +/- 278 4775 +/- 257 5717 +/- 210 0.0012320 0.3628789 0.0197335Rab12 RAB12, member RAS oncogene family 321 +/- 25 439 +/- 34 442 +/- 78 498 +/- 58 0.0349318 0.0211394 0.5815494Ppm1B protein phosphatase 1B (formerly 2C), magnesium-dependent, beta isoform 2968 +/- 253 3629 +/- 258 2741 +/- 80 2996 +/- 47 -0.0466994 0.0972619 0.0254303Gas7 growth arrest-specific 7 9122 +/- 492 10812 +/- 463 7341 +/- 461 8180 +/- 533 -0.0001930 0.0313393 0.2659777Itgb1 integrin, beta 1 (fibronectin receptor, beta polypeptide, antigen CD29 include 657 +/- 64 790 +/- 95 641 +/- 35 744 +/- 25 -0.3751664 0.2811003 0.0411422Slc37A4 solute carrier family 37 (glycerol-6-phosphate transporter), member 4 195 +/- 20 266 +/- 23 170 +/- 18 236 +/- 25 -0.0929626 0.0446113 0.0680649Nef3 neurofilament 3 (150kDa medium) 3259 +/- 240 3569 +/- 242 3410 +/- 281 4209 +/- 212 0.1287468 0.3830351 0.0501556Sepw1 selenoprotein W, 1 585 +/- 50 738 +/- 47 595 +/- 42 690 +/- 37 -0.7112477 0.0506265 0.1253401Hbld2 HESB like domain containing 2 5203 +/- 248 5912 +/- 354 5130 +/- 262 6496 +/- 509 0.1457051 0.1351919 0.0540074Sh3Bp4 SH3-domain binding protein 4 814 +/- 96 1038 +/- 89 566 +/- 21 669 +/- 39 -0.0009859 0.1186400 0.0564387Elovl6 ELOVL family member 6, elongation of long chain fatty acids (FEN1/Elo2, SU 896 +/- 196 1262 +/- 163 882 +/- 155 1274 +/- 98 -0.4382912 0.1833837 0.0640144Rhoj ras homolog gene family, member J 171 +/- 12 208 +/- 13 156 +/- 11 198 +/- 20 -0.0888798 0.0693867 0.1148322Rfng radical fringe homolog (Drosophila) 490 +/- 18 545 +/- 21 583 +/- 19 626 +/- 14 0.0001991 0.0700264 0.1095614Snx16 sorting nexin 16 190 +/- 19 284 +/- 41 202 +/- 16 253 +/- 45 -0.8547074 0.0750360 0.3336320Rgc32 response gene to complement 32 6859 +/- 127 8305 +/- 653 5556 +/- 183 6802 +/- 669 -0.0002985 0.0779701 0.1372903Acox1 acyl-Coenzyme A oxidase 1, palmitoyl 1306 +/- 106 1447 +/- 58 1243 +/- 59 1393 +/- 50 -0.1515180 0.2791040 0.0829987Hadha hydroxyacyl-Coenzyme A dehydrogenase/3-ketoacyl-Coenzyme A thiolase/e 1139 +/- 62 1306 +/- 61 887 +/- 37 962 +/- 44 -0.0003546 0.0832165 0.2268701Fgfr1 fibroblast growth factor receptor 1 (fms-related tyrosine kinase 2, Pfeiffer syn 853 +/- 44 977 +/- 70 915 +/- 29 1117 +/- 91 0.0866015 0.1705280 0.0912459Agpat4 1-acylglycerol-3-phosphate O-acyltransferase 4 (lysophosphatidic acid acyltr 616 +/- 22 811 +/- 94 644 +/- 36 696 +/- 57 -0.2965638 0.0931535 0.4606310Nfasc neurofascin homolog (chicken) 243 +/- 22 331 +/- 47 283 +/- 36 357 +/- 13 0.5310021 0.1326910 0.1024117Lpl lipoprotein lipase 464 +/- 38 692 +/- 112 1711 +/- 182 1760 +/- 102 0.0000017 0.1031246 0.8195307Npepps aminopeptidase puromycin sensitive 2463 +/- 200 2784 +/- 133 2444 +/- 84 2716 +/- 120 -0.8204139 0.2157397 0.1032154Ptpra Protein tyrosine phosphatase, receptor type, A 220 +/- 35 297 +/- 25 242 +/- 29 292 +/- 22 0.5180175 0.1062726 0.2034382Epn2 epsin 2 1356 +/- 42 1515 +/- 77 1289 +/- 42 1368 +/- 29 -0.1358640 0.1071461 0.1617644Ptprd Protein tyrosine phosphatase, receptor type, D 3412 +/- 455 4494 +/- 451 2387 +/- 204 2839 +/- 148 -0.0006036 0.1221485 0.1076744Idi1 Isopentenyl-diphosphate delta isomerase 1 482 +/- 34 583 +/- 47 553 +/- 44 604 +/- 44 0.0981726 0.1174262 0.4330849Itgae Integrin, alpha E (antigen CD103, human mucosal lymphocyte antigen 1; alp 525 +/- 30 582 +/- 15 548 +/- 16 556 +/- 35 -0.9820220 0.1239934 0.8355691Mir16 membrane interacting protein of RGS16 117 +/- 15 140 +/- 23 72 +/- 9 98 +/- 13 -0.0266885 0.4205332 0.1389118Dad1 defender against cell death 1 3547 +/- 95 3727 +/- 84 2771 +/- 49 2933 +/- 86 -0.0000027 0.1873880 0.1475904Cacng2 calcium channel, voltage-dependent, gamma subunit 2 437 +/- 87 573 +/- 89 862 +/- 54 1025 +/- 88 0.0000341 0.3000925 0.1581798Gucy1A3 Guanylate cyclase 1, soluble, alpha 3 1920 +/- 323 2521 +/- 220 2846 +/- 165 3163 +/- 421 0.0130197 0.1585896 0.5125459Slit3 slit homolog 3 (Drosophila) 168 +/- 14 215 +/- 28 281 +/- 24 327 +/- 30 0.0015119 0.1668762 0.2641627Gls2 glutaminase 2 (liver, mitochondrial) 82 +/- 12 93 +/- 9 102 +/- 9 138 +/- 21 0.0307679 0.4757278 0.1799443Pdcd8 programmed cell death 8 (apoptosis-inducing factor) 568 +/- 20 580 +/- 30 482 +/- 21 531 +/- 26 -0.0327650 0.7374145 0.1848819Per3 Period homolog 3 (Drosophila) 83 +/- 10 104 +/- 11 142 +/- 17 152 +/- 16 0.0057826 0.1891970 0.6897589Slc7A3 solute carrier family 7 (cationic amino acid transporter, y+ system), member 224 +/- 20 260 +/- 16 268 +/- 16 274 +/- 24 0.0251458 0.2035323 0.8592245
S3- Aging related genes in rhesus and rat.xls Page 13

Young vs AgedSymbol Description Young CA Aged CA Young DG Aged DG CA v DG in CA in DGDhcr7 7-dehydrocholesterol reductase 440 +/- 49 518 +/- 33 575 +/- 44 595 +/- 31 0.0115535 0.2184644 0.7135665Akr1A1 aldo-keto reductase family 1, member A1 (aldehyde reductase) 1965 +/- 241 2348 +/- 190 1513 +/- 61 1657 +/- 96 -0.0028328 0.2414578 0.2466969Marcks myristoylated alanine-rich protein kinase C substrate 1275 +/- 140 1506 +/- 125 1333 +/- 57 1365 +/- 179 -0.5733369 0.2463850 0.8707877Ldha lactate dehydrogenase A 7428 +/- 363 7503 +/- 464 5839 +/- 323 6507 +/- 427 -0.0000080 0.9005206 0.2481737Map1Lc3B microtubule-associated protein 1 light chain 3 beta 4795 +/- 243 5232 +/- 261 4483 +/- 110 4532 +/- 142 -0.0115719 0.2487294 0.7921388Ddit4L DNA-damage-inducible transcript 4-like 666 +/- 84 706 +/- 167 657 +/- 67 817 +/- 109 0.3280657 0.8386068 0.2511702Psat1 phosphoserine aminotransferase 1 2409 +/- 427 2762 +/- 312 2094 +/- 132 2385 +/- 197 -0.1609960 0.5214536 0.2570118Cs citrate synthase 5441 +/- 289 5701 +/- 369 5162 +/- 218 5594 +/- 286 -0.1627454 0.5927286 0.2644793Atic 5-aminoimidazole-4-carboxamide ribonucleotide formyltransferase/IMP cyclo 1046 +/- 49 1113 +/- 28 796 +/- 52 837 +/- 52 -0.0000301 0.2687251 0.5818458Timm23 translocase of inner mitochondrial membrane 23 homolog (yeast) 1175 +/- 101 1254 +/- 124 1269 +/- 46 1511 +/- 186 0.0670528 0.6322535 0.2687911Efcbp2 EF-hand calcium binding protein 2 1044 +/- 125 1270 +/- 149 793 +/- 79 1021 +/- 182 -0.0029319 0.2726921 0.2973846Metap2 methionyl aminopeptidase 2 2709 +/- 177 2941 +/- 165 2681 +/- 192 2974 +/- 167 0.8169028 0.3592035 0.2797346P2Rxl1 purinergic receptor P2X-like 1, orphan receptor 117 +/- 15 144 +/- 19 144 +/- 14 162 +/- 11 0.2658228 0.2878104 0.3242321Cgref1 cell growth regulator with EF-hand domain 1 862 +/- 130 980 +/- 56 884 +/- 55 1011 +/- 95 0.7796138 0.4323290 0.2906128Rps13 ribosomal protein S13 16142 +/- 483 16738 +/- 421 14590 +/- 129 15112 +/- 432 -0.0004701 0.3746461 0.3020581Snrpn small nuclear ribonucleoprotein polypeptide N 132 +/- 14 163 +/- 31 176 +/- 10 237 +/- 52 0.0177708 0.3858409 0.3183962Faah fatty acid amide hydrolase 921 +/- 103 1040 +/- 105 1172 +/- 52 1240 +/- 41 0.0008427 0.4358339 0.3273894Lss lanosterol synthase (2,3-oxidosqualene-lanosterol cyclase) 109 +/- 28 144 +/- 20 177 +/- 34 182 +/- 28 0.0320322 0.3303026 0.9065936Sfpq splicing factor proline/glutamine-rich (polypyrimidine tract binding protein ass 2328 +/- 109 2456 +/- 58 2770 +/- 74 2832 +/- 78 0.0002077 0.3319386 0.5785214Copb2 Coatomer protein complex, subunit beta 2 (beta prime) 536 +/- 116 636 +/- 54 557 +/- 96 662 +/- 43 0.4268643 0.4608351 0.3504571Glra2 glycine receptor, alpha 2 147 +/- 22 148 +/- 32 169 +/- 18 224 +/- 52 0.1182836 0.9751751 0.3611267Ppil3 peptidylprolyl isomerase (cyclophilin)-like 3 1204 +/- 34 1212 +/- 75 1026 +/- 46 1101 +/- 64 -0.0154008 0.9220126 0.3673219Acbd3 acyl-Coenzyme A binding domain containing 3 163 +/- 16 175 +/- 26 154 +/- 14 178 +/- 21 -0.3586347 0.7225161 0.3782118Slco1A2 solute carrier organic anion transporter family, member 1A2 187 +/- 36 249 +/- 56 150 +/- 32 164 +/- 21 -0.0974812 0.3788965 0.7230962Rab8B RAB8B, member RAS oncogene family 397 +/- 38 402 +/- 36 545 +/- 46 601 +/- 43 0.0019020 0.9257873 0.4027558Mgp matrix Gla protein 741 +/- 134 793 +/- 310 706 +/- 150 900 +/- 180 0.9552698 0.8817384 0.4311350Plcb4 phospholipase C, beta 4 168 +/- 17 177 +/- 16 198 +/- 6 207 +/- 9 0.0179458 0.7101964 0.4393276Bsg basigin (Ok blood group) 3168 +/- 363 3280 +/- 262 3443 +/- 131 3625 +/- 188 0.1582191 0.8073385 0.4529086Grp gastrin-releasing peptide 586 +/- 219 844 +/- 288 2051 +/- 268 2392 +/- 358 0.0015348 0.4937027 0.4688006Ide insulin-degrading enzyme 665 +/- 21 696 +/- 35 558 +/- 17 572 +/- 22 -0.0001730 0.4716953 0.6080864Lrp3 low density lipoprotein receptor-related protein 3 1738 +/- 85 1898 +/- 194 1955 +/- 148 2034 +/- 76 0.0495001 0.4749156 0.6468481Tcf8 transcription factor 8 (represses interleukin 2 expression) 267 +/- 31 295 +/- 33 315 +/- 40 330 +/- 11 0.1234885 0.5466381 0.7237962Tdg thymine-DNA glycosylase 603 +/- 39 632 +/- 23 612 +/- 15 623 +/- 17 0.8499448 0.5495705 0.6447162Xrcc1 X-ray repair complementing defective repair in Chinese hamster cells 1 584 +/- 68 627 +/- 18 631 +/- 21 651 +/- 31 0.3635712 0.5666546 0.6009106Negr1 neuronal growth regulator 1 1940 +/- 226 2083 +/- 141 2266 +/- 136 2279 +/- 43 0.0530881 0.6065945 0.9293982Folh1 folate hydrolase (prostate-specific membrane antigen) 1 917 +/- 152 1069 +/- 251 549 +/- 87 598 +/- 99 -0.0235439 0.6166617 0.7174146Lmo3 LIM domain only 3 (rhombotin-like 2) 9466 +/- 961 9899 +/- 747 7430 +/- 667 7767 +/- 555 -0.0280167 0.7296423 0.7064928
S3- Aging related genes in rhesus and rat.xls Page 14

Young vs Aged MSI CorrelationsSymbol Description Young CA Aged CA Young DG Aged DG in CA in DG in CA in DGUpregulated with Age and Correlated with MSI in Both RegionsAASDH 2-aminoadipic 6-semialdehyde dehydrogenase 587 +/- 19 771 +/- 21 501 +/- 29 664 +/- 26 8.64385E-05 0.002318093 0.004617508 0.034790591ADPRH ADP-ribosylarginine hydrolase 189 +/- 23 309 +/- 20 168 +/- 16 281 +/- 20 0.003010058 0.002340409 0.002813904 0.009052543AFF3 AF4/FMR2 family, member 3 128 +/- 17 237 +/- 14 224 +/- 20 358 +/- 44 0.000735865 0.034612996 0.001377619 0.000307055AKR7A3 aldo-keto reductase family 7, member A3 (aflatoxin aldehyde reductase) 722 +/- 43 917 +/- 15 718 +/- 9 959 +/- 30 0.004954826 0.000763437 0.008846722 0.007598488ATG4B ATG4 autophagy related 4 homolog B (S. cerevisiae) 489 +/- 25 632 +/- 27 517 +/- 23 734 +/- 11 0.00307991 5.64218E-05 0.043959343 0.006532486ATPBD1B ATP binding domain 1 family, member B 517 +/- 51 773 +/- 37 492 +/- 40 837 +/- 27 0.002910916 7.10449E-05 0.012451055 0.02304461ATXN2 ataxin 2 1690 +/- 104 2226 +/- 102 1668 +/- 61 2193 +/- 86 0.004376062 0.0013222 0.039174792 0.019668653BCAP31 B-cell receptor-associated protein 31 1029 +/- 88 1543 +/- 54 860 +/- 54 1436 +/- 92 0.000989636 0.001211166 0.00447701 0.013356191BIRC6 baculoviral IAP repeat-containing 6 (apollon) 348 +/- 15 458 +/- 21 431 +/- 7 524 +/- 30 0.002066661 0.034165633 0.000871983 0.018599474C1QC complement component 1, q subcomponent, C chain 541 +/- 44 951 +/- 109 482 +/- 52 755 +/- 55 0.011017819 0.006202431 0.000361247 0.002406633CAST calpastatin 990 +/- 127 1424 +/- 112 822 +/- 41 1048 +/- 19 0.028764479 0.001579583 0.016179368 0.007630135CD99 CD99 molecule 895 +/- 110 1907 +/- 171 1138 +/- 143 2051 +/- 28 0.000900323 0.001141378 0.000860348 0.017907846CHURC1 churchill domain containing 1 2879 +/- 78 3384 +/- 118 2472 +/- 75 2873 +/- 90 0.006513968 0.008506553 0.00139831 0.010048628CNNM3 Cyclin M3 133 +/- 9 173 +/- 11 136 +/- 17 194 +/- 15 0.015712283 0.030455353 0.012433498 0.047658064COMT catechol-O-methyltransferase 2761 +/- 143 3402 +/- 147 2879 +/- 124 3569 +/- 121 0.010656279 0.003185201 0.005039179 0.02559968CTNNB1 Catenin (cadherin-associated protein), beta 1, 88kDa 80 +/- 20 240 +/- 38 98 +/- 21 283 +/- 59 0.006495803 0.031255701 0.010394166 0.001233394CWF19L2 CWF19-like 2, cell cycle control (S. pombe) 477 +/- 43 740 +/- 86 434 +/- 31 541 +/- 30 0.027047664 0.035306206 0.001702426 0.034630212DBF4B DBF4 homolog B (S. cerevisiae) 88 +/- 14 172 +/- 19 93 +/- 13 170 +/- 27 0.006619257 0.043190765 0.043322784 0.006960112ELAC1 elaC homolog 1 (E. coli) 257 +/- 16 328 +/- 22 295 +/- 19 351 +/- 12 0.027760918 0.037583255 0.003573192 0.014227477EMP2 epithelial membrane protein 2 131 +/- 20 209 +/- 17 138 +/- 17 214 +/- 16 0.01333844 0.011268119 0.020778594 0.015911054FAIM Fas apoptotic inhibitory molecule 608 +/- 41 920 +/- 63 711 +/- 51 974 +/- 37 0.002737517 0.002460271 0.003273115 0.029247671FASTK Fas-activated serine/threonine kinase 625 +/- 37 797 +/- 40 549 +/- 14 706 +/- 35 0.010554027 0.00819985 0.048923014 0.00437731GANC glucosidase, alpha; neutral C 451 +/- 60 883 +/- 120 322 +/- 16 530 +/- 33 0.013551627 0.001369076 0.005156133 0.005970585GCLM glutamate-cysteine ligase, modifier subunit 771 +/- 36 943 +/- 26 851 +/- 27 1048 +/- 44 0.003664727 0.007250878 0.022972602 0.013004282GLG1 golgi apparatus protein 1 4000 +/- 666 6938 +/- 706 3906 +/- 536 6715 +/- 578 0.012773863 0.006455356 0.02005048 0.006021599GMFG glia maturation factor, gamma 412 +/- 31 565 +/- 21 316 +/- 21 420 +/- 14 0.002744673 0.002887507 0.0042369 0.048962988GRIK1 glutamate receptor, ionotropic, kainate 1 107 +/- 11 355 +/- 42 65 +/- 9 194 +/- 15 0.001556135 0.000176201 0.007775472 0.005943036GSTT1 Glutathione S-transferase theta 1 180 +/- 17 259 +/- 19 171 +/- 15 240 +/- 13 0.012660553 0.007440094 0.003355471 0.046202777HNRPA0 Heterogeneous nuclear ribonucleoprotein A0 336 +/- 12 561 +/- 28 394 +/- 18 576 +/- 23 0.000198937 0.000241532 0.009480719 0.019250485IARS2 isoleucine-tRNA synthetase 2, mitochondrial 656 +/- 36 831 +/- 33 634 +/- 50 784 +/- 31 0.004644977 0.03303207 0.000374872 0.005812832ICA1L islet cell autoantigen 1,69kDa-like 791 +/- 58 1295 +/- 113 876 +/- 42 1345 +/- 82 0.004674354 0.002172857 0.046687598 0.017191168LETMD1 LETM1 domain containing 1 392 +/- 31 684 +/- 39 420 +/- 19 632 +/- 54 0.00020745 0.013535878 0.000410661 0.003563626LYPLAL1 Lysophospholipase-like 1 1724 +/- 216 2920 +/- 69 2065 +/- 232 3308 +/- 85 0.00184455 0.002086311 0.011325788 0.034221821MAT2B methionine adenosyltransferase II, beta 1924 +/- 121 3545 +/- 199 2623 +/- 156 3789 +/- 141 9.94444E-05 0.000359742 0.007379867 0.004130652MPEG1 macrophage expressed gene 1 612 +/- 60 826 +/- 70 399 +/- 27 583 +/- 25 0.043255164 0.000737961 0.012235515 0.035965855MUM1 melanoma associated antigen (mutated) 1 419 +/- 34 814 +/- 85 436 +/- 18 624 +/- 61 0.004201204 0.035077496 0.006394319 0.002899171NASP Nuclear autoantigenic sperm protein (histone-binding) 466 +/- 56 813 +/- 84 458 +/- 42 736 +/- 35 0.007837765 0.000662374 0.006005902 0.001006533NEK7 NIMA (never in mitosis gene a)-related kinase 7 2990 +/- 247 3754 +/- 214 2291 +/- 122 2919 +/- 48 0.042078561 0.002479374 0.024529863 0.011491773NFKBIZ Nuclear factor of kappa light polypeptide gene enhancer in B-cells inhibitor, zeta 167 +/- 11 264 +/- 26 150 +/- 6 206 +/- 14 0.011284895 0.012170385 0.000138843 0.025442153NHP2L1 NHP2 non-histone chromosome protein 2-like 1 (S. cerevisiae) 59 +/- 14 219 +/- 15 65 +/- 8 167 +/- 16 1.60482E-05 0.001334391 8.78855E-05 0.045871821PA2G4 proliferation-associated 2G4, 38kDa 712 +/- 69 939 +/- 45 885 +/- 51 1182 +/- 44 0.023198878 0.001751756 0.029756135 0.00043482PACRG PARK2 co-regulated 1071 +/- 37 1394 +/- 73 893 +/- 44 1132 +/- 74 0.004923138 0.028089353 0.000589869 0.00632666PAPD1 PAP associated domain containing 1 886 +/- 44 1400 +/- 87 1045 +/- 67 1422 +/- 80 0.000963235 0.006476203 0.002257992 0.002326517
S4- MSI correlated and non-correlated ARGs.xls Page 1

Young vs Aged MSI CorrelationsSymbol Description Young CA Aged CA Young DG Aged DG in CA in DG in CA in DGPBX1 Pre-B-cell leukemia transcription factor 1 1716 +/- 118 2769 +/- 217 1455 +/- 111 2238 +/- 91 0.002974631 0.000413004 0.004411418 0.006128792PFKFB2 6-phosphofructo-2-kinase/fructose-2,6-biphosphatase 2 531 +/- 38 759 +/- 35 440 +/- 25 533 +/- 18 0.001333503 0.014641099 0.00556195 0.013500595PHOSPHO2 phosphatase, orphan 2 671 +/- 78 1066 +/- 59 648 +/- 36 1124 +/- 54 0.002665896 0.000135035 0.030363144 0.006634282PSMB9 proteasome (prosome, macropain) subunit, beta type, 9 (large multifunctional peptidase 2) 262 +/- 10 349 +/- 12 233 +/- 6 295 +/- 8 0.000275211 0.000367261 0.008896198 0.033050982QTRT1 queuine tRNA-ribosyltransferase 1 (tRNA-guanine transglycosylase) 256 +/- 22 498 +/- 21 323 +/- 31 587 +/- 36 1.48171E-05 0.0004756 0.005966107 0.001649222RAB28 RAB28, member RAS oncogene family 757 +/- 67 1355 +/- 52 860 +/- 38 1404 +/- 71 4.71678E-05 0.000443803 0.005323197 0.009386422RAB8A RAB8A, member RAS oncogene family 660 +/- 25 807 +/- 25 552 +/- 11 656 +/- 19 0.002189185 0.002420763 0.004868392 0.000351065RBM3 RNA binding motif (RNP1, RRM) protein 3 669 +/- 111 1358 +/- 95 805 +/- 127 1331 +/- 55 0.000867397 0.007144176 0.021397593 0.0454136RBM5 RNA binding motif protein 5 1495 +/- 88 1813 +/- 55 1547 +/- 80 1848 +/- 62 0.014794842 0.016372199 0.02800611 0.025389931RPL13 ribosomal protein L13 3331 +/- 242 4584 +/- 286 2546 +/- 122 3520 +/- 104 0.007698486 0.000188507 0.008723084 0.005954513RPS15A ribosomal protein S15a 14626 +/- 477 16659 +/- 556 11527 +/- 341 13684 +/- 211 0.019978008 0.000641867 0.018752943 0.008801629RRBP1 ribosome binding protein 1 homolog 180kDa (dog) 119 +/- 18 186 +/- 24 125 +/- 7 169 +/- 11 0.049489585 0.010814197 0.018622373 0.01476604RTCD1 RNA terminal phosphate cyclase domain 1 145 +/- 9 194 +/- 12 137 +/- 5 174 +/- 10 0.008233371 0.017040036 0.012001762 0.000556839SAP18 Sin3A-associated protein, 18kDa 2878 +/- 140 4280 +/- 172 2600 +/- 139 3721 +/- 168 0.000101626 0.000789111 9.32216E-05 0.005042798SEC23IP SEC23 interacting protein 945 +/- 34 1092 +/- 23 868 +/- 39 1118 +/- 42 0.006532663 0.001978948 0.017475982 0.036360421SEPT8 septin 8 2774 +/- 489 5315 +/- 965 1763 +/- 94 3266 +/- 249 0.049189087 0.002204603 0.014303119 0.003895876SGCE sarcoglycan, epsilon 754 +/- 60 1219 +/- 49 868 +/- 51 1204 +/- 28 0.000157526 0.000483119 0.003289368 0.006452203SLC11A2 solute carrier family 11 (proton-coupled divalent metal ion transporters), member 2 475 +/- 88 1020 +/- 94 461 +/- 69 952 +/- 81 0.00174478 0.001506198 0.009127034 0.010460024SLC15A4 Solute carrier family 15, member 4 630 +/- 46 885 +/- 55 671 +/- 24 756 +/- 14 0.005337203 0.014981656 0.01299924 0.036015026SLC4A7 solute carrier family 4, sodium bicarbonate cotransporter, member 7 1387 +/- 232 3599 +/- 647 1815 +/- 290 4114 +/- 614 0.017154071 0.015697579 0.028831018 0.01155934SSBP2 Single-stranded DNA binding protein 2 148 +/- 42 473 +/- 63 131 +/- 36 339 +/- 32 0.002159678 0.001879609 0.004952731 0.00272126SURB7 SRB7 suppressor of RNA polymerase B homolog (yeast) 1618 +/- 167 2473 +/- 241 1436 +/- 158 2200 +/- 169 0.017365446 0.009589969 0.026485383 0.023674629TFPI tissue factor pathway inhibitor (lipoprotein-associated coagulation inhibitor) 202 +/- 14 337 +/- 20 145 +/- 11 265 +/- 18 0.000360429 0.001001625 0.006258452 0.007355722TFPT TCF3 (E2A) fusion partner (in childhood Leukemia) 369 +/- 36 499 +/- 34 283 +/- 25 365 +/- 25 0.024337442 0.042480101 0.048447198 0.011455106THEDC1 thioesterase domain containing 1 35 +/- 9 287 +/- 70 65 +/- 11 160 +/- 25 0.015278438 0.014874365 0.000760961 0.013168188TMEM80 transmembrane protein 80 995 +/- 50 1270 +/- 42 785 +/- 32 942 +/- 27 0.001974292 0.004549828 0.002520586 0.023382926TMEM97 transmembrane protein 97 1042 +/- 36 1322 +/- 88 914 +/- 45 1135 +/- 30 0.023149686 0.003205269 0.017416421 0.01963856TP53RK TP53 regulating kinase 189 +/- 12 227 +/- 11 170 +/- 2 221 +/- 13 0.037550082 0.014506803 0.009844555 5.07202E-06TRAK2 trafficking protein, kinesin binding 2 2695 +/- 155 3432 +/- 218 2515 +/- 153 2941 +/- 67 0.022400534 0.039325312 0.01139918 0.04426098TRAPPC2 trafficking protein particle complex 2 1738 +/- 51 1929 +/- 62 1792 +/- 47 1967 +/- 42 0.038920327 0.020945528 0.044279379 0.036832665TUFT1 tuftelin 1 796 +/- 100 1318 +/- 115 650 +/- 8 921 +/- 37 0.006735938 0.001405156 0.011219071 0.031659984UBE2L6 ubiquitin-conjugating enzyme E2L 6 690 +/- 43 965 +/- 37 708 +/- 47 941 +/- 37 0.000689307 0.003762354 0.004088708 0.005934586ZKSCAN1 zinc finger with KRAB and SCAN domains 1 1152 +/- 95 1766 +/- 191 984 +/- 18 1287 +/- 34 0.022665788 0.000206109 0.007582694 0.000442514ZNF596 zinc finger protein 596 360 +/- 12 434 +/- 25 392 +/- 8 446 +/- 11 0.029173479 0.004145729 0.003779054 0.001302882ZNF622 zinc finger protein 622 946 +/- 28 1045 +/- 22 741 +/- 18 848 +/- 18 0.021926133 0.002301878 0.021069267 0.049957309ZNF83 zinc finger protein 83 385 +/- 25 545 +/- 35 388 +/- 21 477 +/- 31 0.004679458 0.046906063 0.000678943 0.044284686Downregulated with Age and Correlated with MSI in Both RegionsACCN1 amiloride-sensitive cation channel 1, neuronal (degenerin) 1925 +/- 136 1421 +/- 164 1179 +/- 59 900 +/- 42 -0.040656154 -0.004391613 0.027325315 0.012148097AP2B1 adaptor-related protein complex 2, beta 1 subunit 7691 +/- 354 5572 +/- 446 5527 +/- 121 4060 +/- 189 -0.004297353 -0.000323074 0.028797532 0.027387172AP4S1 adaptor-related protein complex 4, sigma 1 subunit 336 +/- 50 195 +/- 7 440 +/- 40 279 +/- 34 -0.035594454 -0.012957804 0.022347191 0.047586785B4GALT3 UDP-Gal:betaGlcNAc beta 1,4- galactosyltransferase, polypeptide 3 1509 +/- 46 1313 +/- 50 1304 +/- 35 1196 +/- 29 -0.016365607 -0.043078845 0.005971498 0.010920506CCL27 chemokine (C-C motif) ligand 27 350 +/- 36 242 +/- 23 335 +/- 21 227 +/- 16 -0.034546636 -0.002895241 0.036856456 0.003753417CSNK1G2 casein kinase 1, gamma 2 464 +/- 48 332 +/- 27 622 +/- 27 496 +/- 28 -0.044696832 -0.010409097 0.03554518 0.006842157DNAJB5 DnaJ (Hsp40) homolog, subfamily B, member 5 1205 +/- 78 888 +/- 41 1163 +/- 41 974 +/- 62 -0.007384671 -0.038186221 0.002989718 0.044401411
S4- MSI correlated and non-correlated ARGs.xls Page 2

Young vs Aged MSI CorrelationsSymbol Description Young CA Aged CA Young DG Aged DG in CA in DG in CA in DGDOC2B double C2-like domains, beta 258 +/- 27 166 +/- 20 253 +/- 19 182 +/- 20 -0.023574925 -0.030195503 0.007181465 0.020460639DOK6 docking protein 6 1184 +/- 243 182 +/- 52 1228 +/- 38 204 +/- 68 -0.008389508 -6.71455E-06 0.021924741 0.016210785ELAVL3 ELAV (embryonic lethal, abnormal vision, Drosophila)-like 3 (Hu antigen C) 189 +/- 16 110 +/- 15 287 +/- 18 170 +/- 21 -0.005033619 -0.002435542 0.013616025 0.031892021FYN FYN oncogene related to SRC, FGR, YES 243 +/- 42 94 +/- 25 298 +/- 27 175 +/- 27 -0.01481736 -0.010902184 0.008592589 0.007593408GNG2 guanine nucleotide binding protein (G protein), gamma 2 7405 +/- 371 5485 +/- 393 7908 +/- 317 6914 +/- 174 -0.005280976 -0.026402451 0.01485687 0.038332353GNPTG N-acetylglucosamine-1-phosphate transferase, gamma subunit 1259 +/- 45 970 +/- 51 1269 +/- 41 946 +/- 36 -0.001691422 -0.000241697 0.038246233 0.016103241GOLT1B golgi transport 1 homolog B (S. cerevisiae) 971 +/- 73 734 +/- 56 960 +/- 48 651 +/- 52 -0.029642906 -0.002021516 0.037834422 0.005539233GPATC2 G patch domain containing 2 364 +/- 9 306 +/- 7 390 +/- 22 307 +/- 16 -0.000614856 -0.014567746 0.015153675 0.003991556HAGH hydroxyacylglutathione hydrolase 3456 +/- 243 2690 +/- 123 2867 +/- 137 2258 +/- 72 -0.024496714 -0.00511899 0.03013287 0.021901063HAX1 HCLS1 associated protein X-1 2262 +/- 81 1987 +/- 38 2212 +/- 35 1989 +/- 78 -0.017283174 -0.042094235 0.03294257 0.017801407HSD17B6 hydroxysteroid (17-beta) dehydrogenase 6 3312 +/- 301 2181 +/- 99 2842 +/- 167 1796 +/- 97 -0.011556512 -0.000670105 0.024063117 0.011679094HSPE1 heat shock 10kDa protein 1 (chaperonin 10) 3558 +/- 135 3064 +/- 138 3300 +/- 90 2930 +/- 94 -0.028254719 -0.019469481 0.046640491 0.030589904KPNA3 karyopherin alpha 3 (importin alpha 4) 2725 +/- 82 2246 +/- 35 2709 +/- 42 2343 +/- 59 -0.001186814 -0.001241669 0.006676681 0.031217584MARCH6 membrane-associated ring finger (C3HC4) 6 1489 +/- 19 1154 +/- 34 1345 +/- 50 1122 +/- 25 -2.87307E-05 -0.004756709 0.00504008 0.044317409NETO2 neuropilin (NRP) and tolloid (TLL)-like 2 2261 +/- 64 1727 +/- 92 1797 +/- 68 1378 +/- 100 -0.00101761 -0.00954415 0.005995911 0.022443801NMRAL1 NmrA-like family domain containing 1 1470 +/- 75 1003 +/- 79 1214 +/- 54 797 +/- 29 -0.001640265 -0.000185534 0.030343869 0.008535776NOL8 nucleolar protein 8 1828 +/- 50 1420 +/- 66 1771 +/- 73 1225 +/- 62 -0.00076339 -0.000309776 0.01342445 0.007196184OSTalpha organic solute transporter alpha 185 +/- 40 66 +/- 8 151 +/- 24 54 +/- 13 -0.028624227 -0.007413788 0.017158669 0.046107008PAIP1 poly(A) binding protein interacting protein 1 2718 +/- 182 2080 +/- 74 3154 +/- 104 2326 +/- 67 -0.015323642 -0.000135552 0.031098988 0.014158099PCGF2 polycomb group ring finger 2 253 +/- 17 158 +/- 15 362 +/- 10 234 +/- 26 -0.001817183 -0.005282196 0.043885923 0.03964353PDXP pyridoxal (pyridoxine, vitamin B6) phosphatase 5584 +/- 267 4404 +/- 240 5656 +/- 156 4968 +/- 141 -0.00838954 -0.009630668 0.000424707 0.014743271PRELP proline/arginine-rich end leucine-rich repeat protein 1546 +/- 52 1157 +/- 104 1515 +/- 84 1157 +/- 70 -0.011628872 -0.009821272 0.014033141 0.004110821PYCR1 pyrroline-5-carboxylate reductase 1 547 +/- 59 391 +/- 22 506 +/- 30 365 +/- 21 -0.04501709 -0.004591689 0.037461291 0.046361606RAD50 RAD50 homolog (S. cerevisiae) 416 +/- 27 289 +/- 24 390 +/- 21 293 +/- 18 -0.005346262 -0.006815895 0.017455681 0.006224269RTN3 reticulon 3 21006 +/- 1230 13544 +/- 1159 20556 +/- 206 13859 +/- 1090 -0.001314002 -0.002946323 0.04701055 0.044878675RYR1 ryanodine receptor 1 (skeletal) 1032 +/- 27 722 +/- 33 993 +/- 101 590 +/- 54 -3.07963E-05 -0.008597255 0.000352985 0.025259361SKIV2L superkiller viralicidic activity 2-like (S. cerevisiae) 624 +/- 40 474 +/- 21 631 +/- 36 490 +/- 27 -0.011363843 -0.01219067 0.006765284 0.022301374SNAP25 Synaptosomal-associated protein, 25kDa 583 +/- 70 304 +/- 41 826 +/- 34 518 +/- 59 -0.008466436 -0.003209955 0.011288112 0.012330398SOCS1 suppressor of cytokine signaling 1 193 +/- 12 114 +/- 15 214 +/- 14 159 +/- 18 -0.002148166 -0.038542504 0.000649267 0.001437317SORBS1 sorbin and SH3 domain containing 1 688 +/- 45 536 +/- 41 818 +/- 42 620 +/- 39 -0.032043767 -0.007102991 0.044553618 0.004580935SSX2IP synovial sarcoma, X breakpoint 2 interacting protein 256 +/- 17 190 +/- 21 218 +/- 7 166 +/- 12 -0.036496511 -0.007626411 0.032746678 0.009024617STARD3NL STARD3 N-terminal like 1387 +/- 85 942 +/- 16 1203 +/- 86 834 +/- 52 -0.003025776 -0.006157765 0.007787543 0.044308108SUGT1L1 SGT1, suppressor of G2 allele of SKP1 like 1 (S. cerevisiae) 240 +/- 35 130 +/- 4 288 +/- 39 162 +/- 19 -0.024886781 -0.021919699 0.018449494 0.037105756SUPT7L suppressor of Ty 7 (S. cerevisiae)-like 547 +/- 33 403 +/- 23 594 +/- 42 454 +/- 21 -0.005810865 -0.019970004 0.012704977 0.028654792TBCA tubulin-specific chaperone a 3775 +/- 186 3218 +/- 114 3953 +/- 59 3483 +/- 98 -0.033245402 -0.004841134 0.028952345 0.023663811THUMPD3 THUMP domain containing 3 1272 +/- 40 1006 +/- 65 1229 +/- 30 921 +/- 79 -0.007846011 -0.014490502 0.030597041 0.008000834THY1 Thy-1 cell surface antigen 9156 +/- 962 5509 +/- 551 8393 +/- 478 6379 +/- 427 -0.01109214 -0.011919883 0.004873262 0.012529639TMEM100 transmembrane protein 100 1126 +/- 85 764 +/- 92 810 +/- 93 482 +/- 73 -0.016281587 -0.021696694 0.002098092 0.012211156TOR1B torsin family 1, member B (torsin B) 824 +/- 61 605 +/- 42 797 +/- 27 668 +/- 33 -0.015886425 -0.016497061 0.028667108 0.018547922TRAK1 trafficking protein, kinesin binding 1 827 +/- 63 630 +/- 58 1039 +/- 46 885 +/- 23 -0.044995521 -0.01860509 0.016632856 0.012422834UBE1DC1 ubiquitin-activating enzyme E1-domain containing 1 944 +/- 81 433 +/- 60 1060 +/- 122 436 +/- 35 -0.000650153 -0.00297969 0.014896329 0.021042621XKR4 XK, Kell blood group complex subunit-related family, member 4 1695 +/- 77 1381 +/- 64 1756 +/- 52 1344 +/- 38 -0.010927465 -0.000143588 0.006413121 0.007877832ZNF197 zinc finger protein 197 370 +/- 35 200 +/- 10 492 +/- 28 326 +/- 18 -0.003679985 -0.000981967 0.007048488 0.016949976ZNF200 zinc finger protein 200 442 +/- 11 377 +/- 17 482 +/- 19 399 +/- 22 -0.011260571 -0.018821499 0.003000017 0.015180382
S4- MSI correlated and non-correlated ARGs.xls Page 3

Young vs Aged MSI CorrelationsSymbol Description Young CA Aged CA Young DG Aged DG in CA in DG in CA in DGZNF285 zinc finger protein 285 234 +/- 6 184 +/- 8 245 +/- 9 194 +/- 13 -0.000899268 -0.014432968 0.003187189 0.002960055ZNF586 zinc finger protein 586 316 +/- 21 232 +/- 26 438 +/- 20 279 +/- 34 -0.031862631 -0.005803159 0.035304275 0.001748864ZNF626 Zinc finger protein 626 262 +/- 29 140 +/- 14 248 +/- 23 150 +/- 12 -0.006163 -0.00592928 0.036840866 0.041037013ZNF697 zinc finger protein 697 458 +/- 22 383 +/- 9 394 +/- 27 303 +/- 1 -0.018619432 -0.020788817 0.026309799 0.033516951ZNF9 zinc finger protein 9 6431 +/- 219 5316 +/- 196 5728 +/- 139 4867 +/- 76 -0.003619593 -0.000741603 0.031262656 0.011434175ZNHIT3 zinc finger, HIT type 3 1626 +/- 109 1266 +/- 38 1613 +/- 77 1374 +/- 14 -0.019780045 -0.026213431 0.026900181 0.038943782Upregulated with Age and Correlated with MSI in CA RegionACAA2 acetyl-Coenzyme A acyltransferase 2 (mitochondrial 3-oxoacyl-Coenzyme A thiolase) 589 +/- 56 854 +/- 62 529 +/- 31 645 +/- 33 0.009788915 0.03015292 0.000593989 0.107868689ACACB acetyl-Coenzyme A carboxylase beta 124 +/- 17 175 +/- 13 138 +/- 12 164 +/- 12 0.037635496 0.152219196 0.029375417 0.335873349ADA adenosine deaminase 265 +/- 19 352 +/- 29 341 +/- 51 373 +/- 25 0.033145219 0.593304815 0.033036236 0.586496456ADI1 acireductone dioxygenase 1 841 +/- 61 1306 +/- 144 924 +/- 99 1052 +/- 80 0.02136589 0.342331102 0.041146655 0.850211246AGPAT3 1-acylglycerol-3-phosphate O-acyltransferase 3 124 +/- 10 226 +/- 20 169 +/- 8 232 +/- 26 0.002439272 0.066575849 0.007768695 0.08481765ALDH3B1 aldehyde dehydrogenase 3 family, member B1 147 +/- 9 263 +/- 37 91 +/- 15 124 +/- 5 0.024390959 0.084643861 0.028408298 0.150807304ALKBH8 alkB, alkylation repair homolog 8 (E. coli) 473 +/- 41 658 +/- 40 571 +/- 39 657 +/- 38 0.009148021 0.144294944 0.026047021 0.18025115ANAPC10 anaphase promoting complex subunit 10 140 +/- 9 189 +/- 9 212 +/- 8 217 +/- 21 0.003833009 0.804791569 0.00428111 0.167121141ANAPC13 anaphase promoting complex subunit 13 1133 +/- 61 1351 +/- 62 1288 +/- 122 1286 +/- 100 0.031286236 -0.989155712 0.045478348 0.467774274ANGPT1 angiopoietin 1 1046 +/- 93 1388 +/- 95 1366 +/- 231 1407 +/- 71 0.028121722 0.87072691 0.008560379 0.993305479ANKHD1 ankyrin repeat and KH domain containing 1 870 +/- 60 1083 +/- 30 945 +/- 57 1001 +/- 44 0.014560802 0.458340411 0.006079233 0.436999036ANKIB1 ankyrin repeat and IBR domain containing 1 1928 +/- 106 2973 +/- 269 1694 +/- 82 1917 +/- 65 0.009743035 0.063334129 9.00003E-05 0.083908189ANKMY1 ankyrin repeat and MYND domain containing 1 80 +/- 6 123 +/- 12 89 +/- 10 110 +/- 19 0.012491451 0.377353349 0.033130446 0.180486154ANKRD11 ankyrin repeat domain 11 147 +/- 24 240 +/- 28 262 +/- 22 250 +/- 72 0.030712078 -0.879093938 0.013910307 0.339598862ANKS1B ankyrin repeat and sterile alpha motif domain containing 1B 7067 +/- 478 8852 +/- 493 7058 +/- 279 8534 +/- 485 0.026588622 0.035708506 0.007534706 0.11313409APBB1IP amyloid beta (A4) precursor protein-binding, family B, member 1 interacting protein 146 +/- 16 200 +/- 16 146 +/- 13 166 +/- 11 0.035110391 0.285012872 0.014207961 0.667314536API5 apoptosis inhibitor 5 1659 +/- 24 1825 +/- 54 1812 +/- 42 1906 +/- 76 0.026573497 0.322472314 0.01898114 0.055193902AQP4 aquaporin 4 3429 +/- 247 4405 +/- 244 3780 +/- 277 3499 +/- 199 0.018268701 -0.431324868 0.013753143 0.41633609ARPC1B actin related protein 2/3 complex, subunit 1B, 41kDa 265 +/- 16 338 +/- 19 206 +/- 20 235 +/- 20 0.014148443 0.321993503 0.002173212 0.707297159ARRB1 arrestin, beta 1 380 +/- 17 456 +/- 27 349 +/- 27 389 +/- 28 0.042410309 0.331062491 0.040432401 0.682824889ASB8 ankyrin repeat and SOCS box-containing 8 524 +/- 37 698 +/- 46 630 +/- 54 667 +/- 53 0.015617961 0.635975754 0.017202233 0.353438495ATF1 Activating transcription factor 1 660 +/- 47 833 +/- 36 824 +/- 43 894 +/- 69 0.016520112 0.413931617 0.01718043 0.360255937ATG12 ATG12 autophagy related 12 homolog (S. cerevisiae) 1361 +/- 96 1868 +/- 140 1316 +/- 125 1632 +/- 120 0.015757733 0.101921368 0.000609303 0.020707043AZI2 5-azacytidine induced 2 394 +/- 23 458 +/- 16 409 +/- 24 439 +/- 10 0.048244395 0.292642712 0.033614731 0.353042543B2M beta-2-microglobulin 7946 +/- 519 10622 +/- 678 6616 +/- 572 9837 +/- 646 0.011496581 0.005147291 0.04236259 0.105180339bA16L21.2.1 DnaJ-like protein 465 +/- 29 601 +/- 37 472 +/- 48 628 +/- 64 0.016292197 0.086857717 0.007434237 0.021214801BBS10 Bardet-Biedl syndrome 10 654 +/- 36 800 +/- 32 792 +/- 37 735 +/- 48 0.012777651 -0.374215564 0.004116063 0.315339658BPNT1 3'(2'), 5'-bisphosphate nucleotidase 1 161 +/- 18 269 +/- 23 210 +/- 23 267 +/- 28 0.00488431 0.15653575 0.01694033 0.034851874BRCC2 BRCC2 260 +/- 26 370 +/- 35 220 +/- 11 242 +/- 10 0.032344576 0.172531744 0.008758521 0.316360383BRD8 bromodomain containing 8 2792 +/- 155 3452 +/- 144 2758 +/- 92 3162 +/- 229 0.011073619 0.159508247 0.010020377 0.057172994BTF3 basic transcription factor 3 1055 +/- 87 1438 +/- 101 1121 +/- 86 1351 +/- 104 0.01682459 0.126082617 0.001567984 0.030301635BTN2A2 butyrophilin, subfamily 2, member A2 158 +/- 20 239 +/- 24 168 +/- 18 199 +/- 14 0.026219693 0.201096297 0.049364808 0.650402248BZRP benzodiazapine receptor (peripheral) 565 +/- 74 798 +/- 62 374 +/- 21 504 +/- 36 0.037740141 0.018487277 0.021493421 0.101408274CALD1 caldesmon 1 84 +/- 6 130 +/- 15 132 +/- 8 136 +/- 6 0.025170472 0.710226139 0.002200006 0.752042955CAPN7 calpain 7 580 +/- 29 674 +/- 27 693 +/- 37 800 +/- 39 0.039422033 0.081335838 0.046624604 0.26677097CBR4 Carbonyl reductase 4 86 +/- 10 138 +/- 8 105 +/- 19 109 +/- 10 0.002183177 0.871819196 0.000688489 0.901672561CCAR1 Cell division cycle and apoptosis regulator 1 149 +/- 19 225 +/- 17 200 +/- 14 216 +/- 12 0.014320053 0.403648957 0.020249837 0.858094474
S4- MSI correlated and non-correlated ARGs.xls Page 4

Young vs Aged MSI CorrelationsSymbol Description Young CA Aged CA Young DG Aged DG in CA in DG in CA in DGCCDC98 coiled-coil domain containing 98 121 +/- 10 163 +/- 15 95 +/- 14 126 +/- 13 0.044275178 0.141438089 0.017969572 0.319485977CCNA1 cyclin A1 165 +/- 10 276 +/- 37 154 +/- 14 177 +/- 31 0.030112623 0.505994277 0.0100349 0.554280904CD52 CD52 molecule 303 +/- 58 621 +/- 52 251 +/- 51 388 +/- 37 0.002332509 0.057454068 0.010007153 0.220588907CD74 CD74 molecule, major histocompatibility complex, class II invariant chain 1810 +/- 283 3714 +/- 547 1215 +/- 171 2317 +/- 340 0.016152974 0.027628935 0.007913266 0.104936148CENPJ centromere protein J 96 +/- 18 264 +/- 61 97 +/- 12 311 +/- 82 0.040178199 0.05831503 0.007209935 0.004901223CEPT1 choline/ethanolamine phosphotransferase 1 157 +/- 10 233 +/- 10 158 +/- 12 186 +/- 14 0.000353143 0.177277119 0.002778644 0.298488707CES2 carboxylesterase 2 (intestine, liver) 171 +/- 23 239 +/- 16 196 +/- 22 188 +/- 19 0.036610533 -0.781636953 0.006473044 0.995829569CHCHD3 coiled-coil-helix-coiled-coil-helix domain containing 3 2026 +/- 56 2199 +/- 30 2231 +/- 90 2360 +/- 104 0.026341706 0.377635721 0.0127559 0.521936704CKS1B CDC28 protein kinase regulatory subunit 1B 822 +/- 24 945 +/- 35 686 +/- 28 763 +/- 14 0.018041856 0.041455361 0.045112677 0.247541605CLDN15 claudin 15 352 +/- 48 618 +/- 92 272 +/- 21 393 +/- 56 0.03551773 0.099514789 0.014485933 0.038621587CLEC4A C-type lectin domain family 4, member A 101 +/- 9 155 +/- 10 108 +/- 13 131 +/- 18 0.002772838 0.334356874 0.004178483 0.880775886CNTN1 contactin 1 1106 +/- 69 1435 +/- 87 1088 +/- 58 1302 +/- 69 0.014910358 0.04357938 0.008978749 0.206808102CNTNAP4 contactin associated protein-like 4 870 +/- 94 1300 +/- 106 849 +/- 67 946 +/- 93 0.012604945 0.424398341 0.002206251 0.720818022COG2 Component of oligomeric golgi complex 2 120 +/- 4 171 +/- 15 148 +/- 17 181 +/- 22 0.016373405 0.261060342 0.035706992 0.411789933CRI1 CREBBP/EP300 inhibitor 1 2595 +/- 106 2983 +/- 108 2958 +/- 141 2891 +/- 157 0.028134869 -0.757243148 0.025830156 0.984512268CRSP3 cofactor required for Sp1 transcriptional activation, subunit 3, 130kDa 197 +/- 12 461 +/- 85 228 +/- 18 391 +/- 98 0.025739796 0.174307676 0.001970168 0.05375377CSF2RB colony stimulating factor 2 receptor, beta, low-affinity (granulocyte-macrophage) 151 +/- 7 191 +/- 15 133 +/- 12 133 +/- 8 0.045124335 -0.994117337 0.000869122 0.775029089CSPP1 centrosome and spindle pole associated protein 1 281 +/- 13 401 +/- 33 322 +/- 36 395 +/- 48 0.012670568 0.257417295 0.000107694 0.082430289CTSS cathepsin S 157 +/- 19 238 +/- 20 157 +/- 21 194 +/- 33 0.01377976 0.371197789 0.034324596 0.516011545CUL5 cullin 5 2810 +/- 145 3330 +/- 140 3029 +/- 94 3332 +/- 99 0.027387502 0.054928152 0.035552916 0.038643562CWF19L1 CWF19-like 1, cell cycle control (S. pombe) 145 +/- 13 207 +/- 12 192 +/- 13 214 +/- 15 0.006543389 0.297555611 0.010032403 0.985792295DDB2 damage-specific DNA binding protein 2, 48kDa 98 +/- 11 160 +/- 9 88 +/- 9 129 +/- 8 0.001531774 0.005825251 0.002332177 0.056883278DDX58 DEAD (Asp-Glu-Ala-Asp) box polypeptide 58 600 +/- 31 706 +/- 25 583 +/- 35 620 +/- 21 0.025995402 0.387283312 0.00953505 0.521246735DIP2C DIP2 disco-interacting protein 2 homolog C (Drosophila) 336 +/- 30 418 +/- 15 445 +/- 23 481 +/- 54 0.04544593 0.560879845 0.032243888 0.230316573DLEU8 deleted in lymphocytic leukemia 8 330 +/- 44 467 +/- 42 228 +/- 18 277 +/- 20 0.049571778 0.100475198 0.014284086 0.096093547DNAJA5 DnaJ homology subfamily A member 5 145 +/- 11 219 +/- 23 120 +/- 15 134 +/- 16 0.022337942 0.546183961 0.021867055 0.970190834DST dystonin 236 +/- 21 370 +/- 38 341 +/- 33 339 +/- 42 0.015105816 -0.977157999 0.006460389 0.365223341DUSP16 dual specificity phosphatase 16 390 +/- 59 565 +/- 40 382 +/- 19 384 +/- 22 0.038148659 0.953695592 0.03532716 0.884047142EDD1 E3 ubiquitin protein ligase, HECT domain containing, 1 880 +/- 28 980 +/- 21 1000 +/- 50 955 +/- 46 0.017732157 -0.513781775 0.047109262 0.485600238EFCAB2 EF-hand calcium binding domain 2 1046 +/- 47 1331 +/- 56 1121 +/- 95 1272 +/- 82 0.003111712 0.260352779 0.009235402 0.753171891EI24 etoposide induced 2.4 mRNA 1967 +/- 197 2517 +/- 46 2093 +/- 202 2274 +/- 91 0.037471438 0.441746788 0.039190826 0.210107781EIF1AX eukaryotic translation initiation factor 1A, X-linked 237 +/- 22 1333 +/- 96 475 +/- 143 1352 +/- 99 4.71003E-05 0.00082015 0.000225341 0.052504669EIF2AK4 eukaryotic translation initiation factor 2 alpha kinase 4 413 +/- 20 484 +/- 18 343 +/- 27 326 +/- 8 0.026366173 -0.570407514 0.008715799 0.509334725EIF5B eukaryotic translation initiation factor 5B 746 +/- 19 848 +/- 36 734 +/- 20 791 +/- 15 0.037126904 0.052223377 0.002047749 0.055285422ELK3 ELK3, ETS-domain protein (SRF accessory protein 2) 355 +/- 29 436 +/- 19 346 +/- 23 388 +/- 29 0.04211483 0.281534946 0.027550579 0.479047216ELTD1 EGF, latrophilin and seven transmembrane domain containing 1 216 +/- 15 319 +/- 20 190 +/- 19 228 +/- 17 0.002299519 0.165249698 0.000525359 0.239435816EML4 echinoderm microtubule associated protein like 4 276 +/- 12 333 +/- 21 362 +/- 36 401 +/- 18 0.046479179 0.35485968 0.006840896 0.506707698EP400 E1A binding protein p400 812 +/- 48 952 +/- 33 925 +/- 77 961 +/- 76 0.038966412 0.741596791 0.008817697 0.30062797EPB41L5 erythrocyte membrane protein band 4.1 like 5 80 +/- 8 128 +/- 8 94 +/- 11 112 +/- 3 0.002336984 0.173635932 0.001242356 0.363423256EPS8 epidermal growth factor receptor pathway substrate 8 1375 +/- 55 1537 +/- 28 1326 +/- 75 1257 +/- 47 0.033353369 -0.451631986 0.040372544 0.149476439ERBB2IP erbb2 interacting protein 1656 +/- 204 2474 +/- 294 1821 +/- 122 2048 +/- 58 0.048527287 0.13714293 0.005407336 0.231457383EXOSC10 exosome component 10 957 +/- 62 1170 +/- 42 800 +/- 35 895 +/- 36 0.020228702 0.092599271 0.029689182 0.190432265FCGR3B Fc fragment of IgG, low affinity IIIb, receptor (CD16b) 158 +/- 14 222 +/- 21 125 +/- 11 167 +/- 20 0.030722125 0.112317008 0.00835231 0.003997434FCHO2 FCH domain only 2 843 +/- 52 1043 +/- 48 843 +/- 51 914 +/- 52 0.017743407 0.35672621 0.005791581 0.267698896
S4- MSI correlated and non-correlated ARGs.xls Page 5

Young vs Aged MSI CorrelationsSymbol Description Young CA Aged CA Young DG Aged DG in CA in DG in CA in DGFKBP3 FK506 binding protein 3, 25kDa 2550 +/- 62 2815 +/- 70 2687 +/- 106 2837 +/- 134 0.018288248 0.403422708 0.003406601 0.329754084FLJ00038 CXYorf1-related protein 477 +/- 9 660 +/- 29 559 +/- 32 584 +/- 37 0.001017878 0.630895092 0.004518516 0.642275137GAMT guanidinoacetate N-methyltransferase 1022 +/- 43 1199 +/- 29 1147 +/- 61 1359 +/- 156 0.009401011 0.261073021 0.009784573 0.178100618GGPS1 Geranylgeranyl diphosphate synthase 1 96 +/- 10 181 +/- 17 152 +/- 9 155 +/- 10 0.002501562 0.803335947 0.001280019 0.707845942GJA1 gap junction protein, alpha 1, 43kDa (connexin 43) 11658 +/- 328 13350 +/- 420 12800 +/- 751 13085 +/- 225 0.010669343 0.728814328 0.013546253 0.852820526GLA galactosidase, alpha 400 +/- 19 475 +/- 12 357 +/- 11 391 +/- 12 0.010141907 0.061628151 0.013596409 0.348694601GLDN gliomedin 316 +/- 58 508 +/- 25 308 +/- 25 409 +/- 21 0.019579409 0.013554132 0.027041741 0.13033409GNB2L1 guanine nucleotide binding protein (G protein), beta polypeptide 2-like 1 8227 +/- 314 9584 +/- 311 7947 +/- 439 9269 +/- 228 0.011821474 0.030345679 0.037887298 0.095970664GOLGA2 golgi autoantigen, golgin subfamily a, 2 80 +/- 6 112 +/- 6 118 +/- 19 140 +/- 9 0.004714028 0.328757004 0.019105226 0.591558507GOLGA4 golgi autoantigen, golgin subfamily a, 4 158 +/- 20 223 +/- 19 236 +/- 13 257 +/- 20 0.040190229 0.414472874 0.019482734 0.154938894GON4L gon-4-like (C.elegans) 260 +/- 13 344 +/- 16 310 +/- 44 351 +/- 20 0.002339183 0.428238667 0.001184281 0.778380809GPATC1 G patch domain containing 1 206 +/- 10 251 +/- 12 231 +/- 21 230 +/- 9 0.01685538 -0.991300297 0.0059077 0.960845591GPM6B glycoprotein M6B 5149 +/- 133 6879 +/- 254 6195 +/- 386 7340 +/- 323 0.000392904 0.049273197 0.007491822 0.472334046GPR89A G protein-coupled receptor 89A 470 +/- 16 578 +/- 23 474 +/- 20 537 +/- 29 0.004337106 0.112575075 0.013336693 0.381691401GPRC5B G protein-coupled receptor, family C, group 5, member B 2685 +/- 255 3426 +/- 164 2738 +/- 97 2936 +/- 111 0.038614757 0.214412018 0.049592467 0.53631378GPSN2 glycoprotein, synaptic 2 2089 +/- 57 2355 +/- 82 2194 +/- 58 2191 +/- 141 0.026365216 -0.982679638 0.011710413 0.562981612GTF2H2 general transcription factor IIH, polypeptide 2, 44kDa 104 +/- 9 178 +/- 26 133 +/- 21 150 +/- 15 0.033469522 0.540628421 0.025370433 0.898946187GUF1 GUF1 GTPase homolog (S. cerevisiae) 391 +/- 29 526 +/- 32 365 +/- 39 430 +/- 27 0.011668221 0.209153322 0.04373217 0.384947491GUP1 GUP1 glycerol uptake/transporter homolog (S. cerevisiae) 602 +/- 64 1060 +/- 102 467 +/- 55 753 +/- 60 0.004636206 0.006825919 0.00498831 0.056779731H6PD hexose-6-phosphate dehydrogenase (glucose 1-dehydrogenase) 144 +/- 17 242 +/- 29 154 +/- 17 173 +/- 8 0.019765949 0.354234675 0.044519923 0.663460259HEY2 hairy/enhancer-of-split related with YRPW motif 2 500 +/- 20 595 +/- 32 557 +/- 20 531 +/- 30 0.036020309 -0.480894388 0.043666703 0.361208249HIGD1B HIG1 domain family, member 1B 225 +/- 13 268 +/- 11 154 +/- 8 203 +/- 12 0.030329094 0.009652683 0.032430077 0.057293297HLA-DMA major histocompatibility complex, class II, DM alpha 100 +/- 12 213 +/- 26 81 +/- 17 132 +/- 17 0.005173868 0.062294997 0.006311469 0.137835884HLA-DPA1 major histocompatibility complex, class II, DP alpha 1 242 +/- 37 469 +/- 34 224 +/- 35 351 +/- 66 0.001143936 0.139667186 0.023030694 0.322240505HLA-DRA major histocompatibility complex, class II, DR alpha 537 +/- 59 893 +/- 114 350 +/- 59 668 +/- 140 0.025403664 0.086284694 0.028219491 0.302105457HMG2L1 high-mobility group protein 2-like 1 827 +/- 48 1078 +/- 75 788 +/- 50 931 +/- 40 0.020869135 0.052828578 0.005334313 0.098226025HMGN2 high-mobility group nucleosomal binding domain 2 197 +/- 23 265 +/- 10 221 +/- 5 255 +/- 33 0.031372344 0.37656245 0.022221567 0.690025154HNRPH3 heterogeneous nuclear ribonucleoprotein H3 (2H9) 973 +/- 64 1240 +/- 83 1247 +/- 84 1322 +/- 104 0.030355051 0.590177248 0.025170851 0.929882825HSMPP8 M-phase phosphoprotein, mpp8 1015 +/- 35 1210 +/- 68 1054 +/- 61 1091 +/- 69 0.035507417 0.696141378 0.007421117 0.44853766ICAM1 intercellular adhesion molecule 1 (CD54), human rhinovirus receptor 120 +/- 10 185 +/- 13 126 +/- 9 167 +/- 8 0.002775713 0.007973606 0.00122463 0.186165299IFIT3 interferon-induced protein with tetratricopeptide repeats 3 309 +/- 18 383 +/- 25 287 +/- 18 321 +/- 15 0.039785711 0.173070055 0.020436739 0.369955803IFNAR1 interferon (alpha, beta and omega) receptor 1 514 +/- 18 825 +/- 71 497 +/- 23 630 +/- 59 0.006363447 0.088126266 0.001121053 0.130292473IFNAR2 interferon (alpha, beta and omega) receptor 2 189 +/- 22 286 +/- 18 155 +/- 25 256 +/- 36 0.007188099 0.051828412 0.04034989 0.129988797IGBP1 immunoglobulin (CD79A) binding protein 1 1965 +/- 47 2506 +/- 69 1885 +/- 71 1954 +/- 88 0.000131631 0.556127965 0.008860807 0.375876215IGF1R Insulin-like growth factor 1 receptor 545 +/- 60 811 +/- 50 668 +/- 61 725 +/- 86 0.007162799 0.608118893 0.007735132 0.1993183IGFBP5 insulin-like growth factor binding protein 5 174 +/- 19 323 +/- 54 358 +/- 138 309 +/- 76 0.039225587 -0.763077677 0.005648609 0.950195247INADL InaD-like (Drosophila) 87 +/- 10 135 +/- 10 146 +/- 6 143 +/- 14 0.008422647 -0.845083805 0.007027185 0.499255628ITM2A integral membrane protein 2A 1463 +/- 86 1990 +/- 49 1400 +/- 32 1806 +/- 148 0.000728073 0.050000797 0.020938239 0.247782417LEAP-2 liver-expressed antimicrobial peptide 2 142 +/- 15 191 +/- 11 154 +/- 13 150 +/- 10 0.025160872 -0.775805855 0.008765374 0.545107181LIFR leukemia inhibitory factor receptor alpha 2392 +/- 272 3256 +/- 164 2200 +/- 139 2374 +/- 110 0.025645983 0.350575343 0.018202869 0.811738741LRRC8C Leucine rich repeat containing 8 family, member C 232 +/- 33 400 +/- 51 193 +/- 36 225 +/- 20 0.023303555 0.46499139 0.001155341 0.528368969LTB lymphotoxin beta (TNF superfamily, member 3) 150 +/- 32 249 +/- 30 143 +/- 12 161 +/- 19 0.047103117 0.446585021 0.028083697 0.427868642LTC4S leukotriene C4 synthase 236 +/- 25 314 +/- 22 201 +/- 17 191 +/- 16 0.041907623 -0.662253981 0.026573385 0.264391824LYZ lysozyme (renal amyloidosis) 354 +/- 21 541 +/- 71 247 +/- 38 330 +/- 29 0.045574016 0.117092173 0.008001252 0.161253336
S4- MSI correlated and non-correlated ARGs.xls Page 6

Young vs Aged MSI CorrelationsSymbol Description Young CA Aged CA Young DG Aged DG in CA in DG in CA in DGMALAT1 metastasis associated lung adenocarcinoma transcript 1 (non-coding RNA) 999 +/- 139 1887 +/- 224 1230 +/- 192 2019 +/- 444 0.009290459 0.158900801 0.015713805 0.240633665MBD5 methyl-CpG binding domain protein 5 1291 +/- 137 1781 +/- 99 1091 +/- 72 1304 +/- 87 0.017422188 0.094875736 0.031445771 0.297900117MBNL2 Muscleblind-like 2 (Drosophila) 431 +/- 36 550 +/- 27 566 +/- 22 603 +/- 44 0.027528449 0.492125993 0.002682924 0.063390729MCCC1 methylcrotonoyl-Coenzyme A carboxylase 1 (alpha) 588 +/- 18 799 +/- 27 614 +/- 25 820 +/- 25 0.000133926 0.00024902 0.025550241 0.064593462MED6 mediator of RNA polymerase II transcription, subunit 6 homolog (S. cerevisiae) 256 +/- 21 344 +/- 26 281 +/- 19 322 +/- 15 0.025911598 0.12575465 0.014067235 0.100377475MEGF10 multiple EGF-like-domains 10 775 +/- 88 1122 +/- 99 648 +/- 44 768 +/- 24 0.025981771 0.045695659 0.012992723 0.233386867METTL7A methyltransferase like 7A 306 +/- 63 569 +/- 51 420 +/- 87 661 +/- 102 0.009059025 0.10798711 0.009236235 0.072246379MKLN1 muskelin 1, intracellular mediator containing kelch motifs 727 +/- 42 901 +/- 60 770 +/- 27 780 +/- 19 0.040687805 0.759905764 0.024952674 0.99133024MLLT10 Myeloid/lymphoid or mixed-lineage leukemia (trithorax homolog, Drosophila); translocated to, 10 261 +/- 16 374 +/- 37 406 +/- 32 426 +/- 73 0.027366183 0.811362091 0.008731269 0.412478243MOSPD2 motile sperm domain containing 2 378 +/- 37 537 +/- 58 304 +/- 24 339 +/- 26 0.048005258 0.356207525 0.001365979 0.482852394MYBBP1A MYB binding protein (P160) 1a 227 +/- 13 300 +/- 10 267 +/- 21 271 +/- 13 0.001540756 0.877026992 0.007627024 0.895285213N4BP1 Nedd4 binding protein 1 375 +/- 24 511 +/- 28 401 +/- 42 438 +/- 25 0.004569425 0.473764695 0.004723022 0.35225073NAG neuroblastoma-amplified protein 98 +/- 12 158 +/- 21 165 +/- 17 192 +/- 26 0.03855762 0.425888882 0.014356024 0.454265218NAG8 nasopharyngeal carcinoma associated gene protein-8 312 +/- 11 399 +/- 15 334 +/- 33 363 +/- 26 0.001317776 0.517727444 0.005418344 0.419764977NAP1L1 nucleosome assembly protein 1-like 1 1463 +/- 33 1829 +/- 95 1400 +/- 79 1475 +/- 74 0.010200022 0.499868406 0.00089931 0.25617108NBR1 neighbor of BRCA1 gene 1 1100 +/- 31 1283 +/- 49 1205 +/- 34 1320 +/- 16 0.012247868 0.018008543 0.001584926 0.086231024NEDD9 neural precursor cell expressed, developmentally down-regulated 9 171 +/- 24 264 +/- 31 142 +/- 23 201 +/- 20 0.043091499 0.088590079 0.047012718 0.040308284NEU4 sialidase 4 318 +/- 28 531 +/- 71 374 +/- 25 540 +/- 33 0.029472306 0.003914097 0.002864159 0.068256338NFIC nuclear factor I/C (CCAAT-binding transcription factor) 198 +/- 10 244 +/- 11 275 +/- 22 264 +/- 14 0.011185714 -0.689607333 0.004600124 0.894269355NIPBL Nipped-B homolog (Drosophila) 651 +/- 32 814 +/- 41 781 +/- 26 815 +/- 32 0.011197479 0.434143199 0.006646694 0.638793267NMNAT1 nicotinamide nucleotide adenylyltransferase 1 148 +/- 15 217 +/- 22 178 +/- 10 206 +/- 24 0.029165787 0.321266213 0.033943691 0.228857458NPAT nuclear protein, ataxia-telangiectasia locus 490 +/- 15 619 +/- 32 435 +/- 15 535 +/- 41 0.007942717 0.071888741 0.022728098 0.114601362NR3C1 Nuclear receptor subfamily 3, group C, member 1 (glucocorticoid receptor) 263 +/- 52 681 +/- 115 326 +/- 52 464 +/- 66 0.012776954 0.138402367 0.001005749 0.025478445NRF1 nuclear respiratory factor 1 180 +/- 11 223 +/- 12 164 +/- 5 186 +/- 16 0.0251685 0.24626113 0.024937746 0.109653235NUP50 nucleoporin 50kDa 2247 +/- 143 3427 +/- 362 2766 +/- 251 3193 +/- 321 0.020819898 0.325113982 0.0368692 0.442796014NVL nuclear VCP-like 300 +/- 30 444 +/- 43 292 +/- 21 362 +/- 6 0.02316415 0.018625285 0.00138925 0.052693472OLR1 oxidised low density lipoprotein (lectin-like) receptor 1 109 +/- 11 211 +/- 34 91 +/- 17 134 +/- 20 0.027477861 0.137990596 0.000134007 0.39771279PABPC1 Poly(A) binding protein, cytoplasmic 1 183 +/- 21 254 +/- 18 240 +/- 24 272 +/- 26 0.028399619 0.400930331 0.011399941 0.662985494PAK2 p21 (CDKN1A)-activated kinase 2 335 +/- 25 481 +/- 33 362 +/- 10 410 +/- 22 0.005919187 0.096546622 0.001697479 0.502297444PALLD palladin, cytoskeletal associated protein 483 +/- 53 658 +/- 48 529 +/- 39 581 +/- 31 0.035167474 0.314433806 0.013614401 0.577514105PARP3 poly (ADP-ribose) polymerase family, member 3 333 +/- 39 495 +/- 52 342 +/- 27 363 +/- 17 0.034081773 0.517761449 0.029808334 0.835411423PCNP PEST proteolytic signal containing nuclear protein 4478 +/- 358 5960 +/- 334 4068 +/- 199 4741 +/- 246 0.012789221 0.065490967 0.006299784 0.229023219PEA15 phosphoprotein enriched in astrocytes 15 14228 +/- 407 15719 +/- 171 16261 +/- 383 17626 +/- 635 0.012515894 0.110018067 0.01568957 0.349064488PEX11A Peroxisomal biogenesis factor 11A 115 +/- 9 142 +/- 7 134 +/- 13 144 +/- 10 0.040807491 0.545280325 0.021457324 0.610457994PFAAP5 phosphonoformate immuno-associated protein 5 540 +/- 18 663 +/- 31 644 +/- 46 682 +/- 23 0.009352546 0.484302786 0.036097245 0.999289381PHF10 PHD finger protein 10 327 +/- 31 419 +/- 15 380 +/- 14 460 +/- 26 0.032516087 0.03490785 0.038848268 0.108541702PHF21A PHD finger protein 21A 468 +/- 21 547 +/- 29 481 +/- 21 523 +/- 41 0.049419862 0.396797277 0.036087843 0.426568662PHF3 PHD finger protein 3 1737 +/- 78 2049 +/- 109 1967 +/- 66 2013 +/- 122 0.044369987 0.752339308 0.001930597 0.231445138PIGB phosphatidylinositol glycan, class B 477 +/- 19 647 +/- 44 496 +/- 15 519 +/- 26 0.009972818 0.456551497 0.001006657 0.558223664PIK3C2A Phosphoinositide-3-kinase, class 2, alpha polypeptide 1130 +/- 44 1263 +/- 40 1085 +/- 33 1109 +/- 30 0.048115901 0.60382933 0.04856744 0.755961897PLAGL2 pleiomorphic adenoma gene-like 2 189 +/- 12 240 +/- 12 225 +/- 13 207 +/- 23 0.013756967 -0.511906673 0.012805194 0.616393239PLD2 phospholipase D2 201 +/- 20 312 +/- 13 231 +/- 27 280 +/- 18 0.001388392 0.165642833 0.00725353 0.202012138PLEKHA1 pleckstrin homology domain containing, family A (phosphoinositide binding specific) member 1 1885 +/- 104 2268 +/- 98 1949 +/- 90 1867 +/- 107 0.023450906 -0.575563954 0.047760243 0.849442366PLXNA3 plexin A3 205 +/- 22 318 +/- 36 319 +/- 36 416 +/- 24 0.028119323 0.054836451 0.038607059 0.213522033
S4- MSI correlated and non-correlated ARGs.xls Page 7

Young vs Aged MSI CorrelationsSymbol Description Young CA Aged CA Young DG Aged DG in CA in DG in CA in DGPNN pinin, desmosome associated protein 870 +/- 34 1067 +/- 32 937 +/- 58 1028 +/- 61 0.001907097 0.307626496 0.038550779 0.843140151PON2 paraoxonase 2 3263 +/- 296 4425 +/- 150 3317 +/- 229 3671 +/- 180 0.009092168 0.255642437 0.013117144 0.561779824PPIA peptidylprolyl isomerase A (cyclophilin A) 281 +/- 45 463 +/- 32 349 +/- 57 440 +/- 15 0.00896267 0.174852469 0.015372548 0.261194992PPP1R3E Protein phosphatase 1, regulatory (inhibitor) subunit 3E 694 +/- 57 902 +/- 71 992 +/- 47 1125 +/- 45 0.045732845 0.07117127 0.014881135 0.062308501PPP4R2 protein phosphatase 4, regulatory subunit 2 886 +/- 44 1162 +/- 105 1013 +/- 60 1050 +/- 98 0.047172478 0.759742148 0.000298597 0.302120359PPWD1 peptidylprolyl isomerase domain and WD repeat containing 1 248 +/- 10 294 +/- 14 268 +/- 8 252 +/- 15 0.022665211 -0.389624578 0.001342101 0.995511183PRKAA1 protein kinase, AMP-activated, alpha 1 catalytic subunit 294 +/- 22 397 +/- 21 287 +/- 16 334 +/- 20 0.006689526 0.103805992 0.004126483 0.040563675PSMA3 proteasome (prosome, macropain) subunit, alpha type, 3 1537 +/- 38 1871 +/- 67 1481 +/- 61 1913 +/- 144 0.002582344 0.03633931 0.047591605 0.162895805PSMD11 proteasome (prosome, macropain) 26S subunit, non-ATPase, 11 1622 +/- 35 1788 +/- 38 1666 +/- 29 1742 +/- 29 0.009249267 0.094642681 0.005010925 0.225815001PTPLAD2 protein tyrosine phosphatase-like A domain containing 2 114 +/- 22 191 +/- 25 74 +/- 9 99 +/- 11 0.041842202 0.112481777 0.023563093 0.431114428RABGAP1 RAB GTPase activating protein 1 116 +/- 13 189 +/- 11 144 +/- 11 164 +/- 8 0.001623547 0.157810579 0.007450589 0.139733204RANBP6 RAN binding protein 6 782 +/- 58 993 +/- 47 796 +/- 88 1061 +/- 36 0.018602372 0.028990382 0.04712257 0.074729428RBBP6 retinoblastoma binding protein 6 272 +/- 14 345 +/- 18 397 +/- 27 330 +/- 14 0.010178181 -0.06165419 0.010117973 0.10574528RBM25 RNA binding motif protein 25 1188 +/- 33 1453 +/- 33 1540 +/- 42 1830 +/- 101 0.000207634 0.041768993 0.005200005 0.226285734REPS2 RALBP1 associated Eps domain containing 2 1087 +/- 40 1316 +/- 59 1227 +/- 99 1360 +/- 65 0.010674468 0.29518669 0.030018381 0.397531166RFXANK regulatory factor X-associated ankyrin-containing protein 382 +/- 19 443 +/- 19 312 +/- 22 350 +/- 23 0.045587582 0.256114067 0.032492205 0.050362787RGS12 regulator of G-protein signalling 12 350 +/- 21 452 +/- 21 478 +/- 32 437 +/- 24 0.006008656 -0.32488588 0.03311309 0.44511161RNASE6 ribonuclease, RNase A family, k6 397 +/- 35 654 +/- 73 255 +/- 16 436 +/- 47 0.014909564 0.014505765 0.006242408 0.074681061RP11-217H1.1 implantation-associated protein 540 +/- 57 800 +/- 92 433 +/- 35 574 +/- 40 0.041470768 0.027972795 0.00427697 0.14838873RP13-297E16.1 DNA segment on chromosome X and Y (unique) 155 expressed sequence, isoform 1 610 +/- 39 823 +/- 49 675 +/- 31 664 +/- 44 0.00735769 -0.836698813 0.038927463 0.9081344RPL23AP13 ribosomal protein L23a pseudogene 13 491 +/- 25 617 +/- 43 598 +/- 72 594 +/- 30 0.035949828 -0.961361435 0.024524444 0.903890038RPL37 ribosomal protein L37 1311 +/- 97 1831 +/- 155 1601 +/- 107 1229 +/- 57 0.020800471 -0.016960897 0.031384133 0.072104543RPL9 ribosomal protein L9 12030 +/- 543 14358 +/- 285 10191 +/- 563 9811 +/- 1825 0.006204199 -0.850373759 0.045490287 0.908068036RPS6KB1 ribosomal protein S6 kinase, 70kDa, polypeptide 1 1507 +/- 66 2010 +/- 89 1589 +/- 57 1912 +/- 83 0.001300869 0.013806977 0.043269804 0.121311674RUFY3 RUN and FYVE domain containing 3 69 +/- 10 111 +/- 9 114 +/- 13 156 +/- 17 0.009915787 0.096063784 0.013841064 0.016151345SAMD4A sterile alpha motif domain containing 4A 1424 +/- 134 2109 +/- 170 1803 +/- 166 1808 +/- 59 0.010800612 0.978024483 0.024403216 0.982968318SAPS3 SAPS domain family, member 3 485 +/- 34 610 +/- 18 601 +/- 21 616 +/- 32 0.013313502 0.717097335 0.008074361 0.980177182SCFD1 sec1 family domain containing 1 83 +/- 2 121 +/- 10 105 +/- 6 109 +/- 8 0.009437588 0.733604621 0.040812849 0.568056853SCNM1 sodium channel modifier 1 257 +/- 18 318 +/- 18 261 +/- 8 288 +/- 10 0.036437885 0.059945743 0.030557839 0.272591936SERPINA1 serpin peptidase inhibitor, clade A (alpha-1 antiproteinase, antitrypsin), member 1 442 +/- 80 836 +/- 138 331 +/- 29 562 +/- 91 0.03926328 0.062066642 0.005075544 0.064324155SF1 splicing factor 1 140 +/- 11 201 +/- 16 207 +/- 11 256 +/- 26 0.013710008 0.143511892 0.014611534 0.103229039SFRS11 splicing factor, arginine/serine-rich 11 4017 +/- 267 5453 +/- 187 4660 +/- 175 5391 +/- 406 0.001713344 0.153882756 0.00023974 0.017460672SFXN5 Sideroflexin 5 157 +/- 8 208 +/- 14 190 +/- 13 226 +/- 9 0.010970906 0.051919548 0.000275701 0.030631541SGK serum/glucocorticoid regulated kinase 1969 +/- 150 2626 +/- 225 1220 +/- 179 1632 +/- 102 0.039052727 0.081610371 0.047104075 0.211883588SH2B SH2-B homolog 1071 +/- 20 1347 +/- 59 1612 +/- 117 1439 +/- 90 0.004188871 -0.272412738 0.046181013 0.392791129SH3PX3 SH3 and PX domain containing 3 243 +/- 24 325 +/- 26 209 +/- 22 227 +/- 14 0.044361279 0.515619215 0.046458236 0.793788545SLA/LP soluble liver antigen/liver pancreas antigen 90 +/- 8 130 +/- 15 95 +/- 11 94 +/- 4 0.044906005 -0.958315905 0.034252707 0.907477351SLC14A1 Solute carrier family 14 (urea transporter), member 1 (Kidd blood group) 669 +/- 53 1000 +/- 92 657 +/- 68 883 +/- 90 0.014166672 0.079572495 0.002606963 0.125666304SLC30A5 solute carrier family 30 (zinc transporter), member 5 457 +/- 12 540 +/- 14 505 +/- 21 552 +/- 21 0.001169226 0.14546643 0.00418326 0.194415714SMARCC1 SWI/SNF related, matrix associated, actin dependent regulator of chromatin, subfamily c, member 1 482 +/- 28 591 +/- 24 542 +/- 16 570 +/- 13 0.015250901 0.203948393 0.004373823 0.086363732SMCHD1 structural maintenance of chromosomes flexible hinge domain containing 1 694 +/- 40 886 +/- 59 797 +/- 51 844 +/- 38 0.025249329 0.477217409 0.00017432 0.44487734SMYD2 SET and MYND domain containing 2 109 +/- 17 181 +/- 16 144 +/- 19 192 +/- 26 0.011355268 0.180434029 0.003034957 0.015456498SNRPG small nuclear ribonucleoprotein polypeptide G 658 +/- 21 808 +/- 50 678 +/- 26 740 +/- 42 0.027600557 0.25045861 0.000402187 0.100255428SNX1 Sorting nexin 1 172 +/- 19 261 +/- 27 175 +/- 13 234 +/- 16 0.024268377 0.020264833 0.013460226 0.242657218
S4- MSI correlated and non-correlated ARGs.xls Page 8

Young vs Aged MSI CorrelationsSymbol Description Young CA Aged CA Young DG Aged DG in CA in DG in CA in DGSOS2 Son of sevenless homolog 2 (Drosophila) 298 +/- 20 354 +/- 13 311 +/- 25 351 +/- 34 0.039420881 0.369755871 0.032858812 0.445919076SOX2 SRY (sex determining region Y)-box 2 4887 +/- 267 6273 +/- 249 4911 +/- 290 5382 +/- 228 0.003542595 0.233450594 0.009880218 0.65474299SPAG9 sperm associated antigen 9 477 +/- 60 705 +/- 50 407 +/- 40 498 +/- 44 0.016127638 0.158938194 0.015124573 0.033519586SRCAP Snf2-related CBP activator protein 190 +/- 10 242 +/- 8 232 +/- 5 203 +/- 9 0.002225566 -0.025473729 0.012583108 0.036958657SS18 synovial sarcoma translocation, chromosome 18 179 +/- 34 427 +/- 43 209 +/- 34 419 +/- 49 0.00124615 0.00896963 0.00299713 0.062158137ST3GAL6 ST3 beta-galactoside alpha-2,3-sialyltransferase 6 690 +/- 106 1161 +/- 162 768 +/- 42 966 +/- 63 0.039073465 0.033661876 0.012021888 0.074533991SUHW3 suppressor of hairy wing homolog 3 (Drosophila) 164 +/- 8 195 +/- 7 232 +/- 8 239 +/- 11 0.012389407 0.66398156 0.001850589 0.414613197SYNPO2L synaptopodin 2-like 274 +/- 17 355 +/- 22 261 +/- 23 265 +/- 16 0.016877881 0.895370348 0.025080952 0.85198709TACC1 transforming, acidic coiled-coil containing protein 1 1582 +/- 114 2047 +/- 42 1759 +/- 107 2070 +/- 195 0.007784824 0.207245345 0.006509671 0.1016656TAF1A TATA box binding protein (TBP)-associated factor, RNA polymerase I, A, 48kDa 204 +/- 13 258 +/- 14 251 +/- 18 253 +/- 11 0.017362486 0.923977769 0.002490684 0.910610537TAF3 TAF3 RNA polymerase II, TATA box binding protein (TBP)-associated factor, 140kDa 296 +/- 8 367 +/- 26 310 +/- 6 301 +/- 21 0.037240022 -0.710751417 0.00288843 0.317449677TAS2R14 Taste receptor, type 2, member 14 101 +/- 20 203 +/- 19 104 +/- 21 230 +/- 27 0.004438424 0.005973521 0.036893291 0.098243184TBL1X transducin (beta)-like 1X-linked 155 +/- 28 369 +/- 21 212 +/- 17 525 +/- 99 0.000145665 0.033161203 0.003346196 0.073986264TCEAL8 transcription elongation factor A (SII)-like 8 2261 +/- 121 2724 +/- 87 2754 +/- 147 2815 +/- 38 0.012366046 0.698955524 0.014670865 0.606538238TCF7L2 transcription factor 7-like 2 (T-cell specific, HMG-box) 1721 +/- 95 2204 +/- 120 1530 +/- 109 1712 +/- 113 0.010918545 0.276316647 0.000591916 0.481372973TGOLN2 trans-golgi network protein 2 6539 +/- 384 7975 +/- 222 6466 +/- 326 7084 +/- 273 0.011924282 0.179939222 0.00286801 0.143496548TJP2 tight junction protein 2 (zona occludens 2) 2291 +/- 204 3125 +/- 237 2144 +/- 139 2859 +/- 124 0.024080242 0.004053353 0.021048548 0.066068672TLN2 Talin 2 152 +/- 19 223 +/- 17 218 +/- 33 262 +/- 39 0.019410687 0.416036769 0.016274768 0.130618477TM7SF2 transmembrane 7 superfamily member 2 1226 +/- 65 1455 +/- 59 1141 +/- 34 1258 +/- 73 0.026139782 0.201389337 0.039240139 0.541288772TM9SF3 transmembrane 9 superfamily member 3 965 +/- 31 1185 +/- 61 976 +/- 42 1008 +/- 62 0.013583593 0.68360539 3.79723E-05 0.224391729TMCC1 Transmembrane and coiled-coil domain family 1 100 +/- 14 167 +/- 12 175 +/- 18 218 +/- 27 0.004556619 0.232235783 0.002972997 0.63077802TMEM116 transmembrane protein 116 119 +/- 13 198 +/- 25 90 +/- 10 142 +/- 15 0.022720757 0.023265683 0.00913731 0.065412938TMEM153 transmembrane protein 153 685 +/- 27 814 +/- 25 671 +/- 36 814 +/- 70 0.006062299 0.119131963 0.009375259 0.288559006TMEM57 transmembrane protein 57 604 +/- 27 705 +/- 15 723 +/- 33 725 +/- 8 0.012641183 0.94554473 0.024223387 0.898087938TncRNA trophoblast-derived noncoding RNA 1717 +/- 180 2482 +/- 183 1618 +/- 126 1986 +/- 125 0.013765549 0.068035047 0.003484289 0.025187375TNFSF13 tumor necrosis factor (ligand) superfamily, member 13 626 +/- 50 900 +/- 75 508 +/- 50 663 +/- 50 0.014442113 0.056884057 0.006526959 0.134142546TOR1AIP1 torsin A interacting protein 1 848 +/- 70 1089 +/- 39 1211 +/- 42 1195 +/- 20 0.017623227 -0.739001031 0.016424322 0.791880907TPM1 Tropomyosin 1 (alpha) 396 +/- 71 679 +/- 70 626 +/- 100 856 +/- 98 0.018042322 0.135835882 0.017410119 0.076079628TTLL4 tubulin tyrosine ligase-like family, member 4 380 +/- 22 458 +/- 23 287 +/- 14 309 +/- 11 0.037352178 0.234890921 0.003115695 0.303117051TUBGCP2 tubulin, gamma complex associated protein 2 1011 +/- 12 1088 +/- 28 991 +/- 31 1088 +/- 35 0.039627436 0.069900621 0.018753734 0.146028112UBAP2L ubiquitin associated protein 2-like 1045 +/- 48 1221 +/- 34 950 +/- 19 1068 +/- 43 0.014530624 0.047736246 0.03302701 0.201222102UBE2H ubiquitin-conjugating enzyme E2H (UBC8 homolog, yeast) 3587 +/- 143 4508 +/- 50 3408 +/- 125 4376 +/- 229 0.000799338 0.0091898 0.001633609 0.083514757UBR2 ubiquitin protein ligase E3 component n-recognin 2 1287 +/- 52 1516 +/- 35 1269 +/- 37 1337 +/- 21 0.00568159 0.154153867 0.004776029 0.570131441UFD1L ubiquitin fusion degradation 1 like (yeast) 1115 +/- 186 1832 +/- 170 1206 +/- 182 1617 +/- 52 0.017561515 0.073879423 0.024453269 0.133224714UNC93B1 unc-93 homolog B1 (C. elegans) 102 +/- 18 164 +/- 21 91 +/- 9 122 +/- 14 0.049850783 0.105323297 0.026469171 0.089244382VDP vesicle docking protein p115 333 +/- 23 487 +/- 24 387 +/- 27 440 +/- 22 0.000843677 0.162964835 0.000358763 0.068550449VMO1 vitelline membrane outer layer 1 homolog (chicken) 691 +/- 50 1261 +/- 202 543 +/- 79 843 +/- 117 0.036084867 0.069831019 0.018085705 0.022592984VPS13C Vacuolar protein sorting 13 homolog C (S. cerevisiae) 1099 +/- 47 1286 +/- 45 1139 +/- 97 1352 +/- 95 0.017536257 0.149297764 0.03060717 0.540462227VPS39 vacuolar protein sorting 39 (yeast) 1307 +/- 34 1456 +/- 46 1449 +/- 64 1330 +/- 79 0.028284255 -0.273341707 0.031071472 0.549636271VPS53 vacuolar protein sorting 53 (S. cerevisiae) 146 +/- 12 263 +/- 30 186 +/- 19 252 +/- 27 0.008952463 0.084191339 0.015665731 0.132000829WAPAL wings apart-like homolog (Drosophila) 1297 +/- 39 1452 +/- 53 1324 +/- 21 1373 +/- 65 0.042275519 0.509868156 0.042660643 0.619148188WBP1 WW domain binding protein 1 1823 +/- 116 2506 +/- 129 1839 +/- 149 2251 +/- 134 0.002859452 0.069745186 0.01038962 0.144705454WDR20 WD repeat domain 20 126 +/- 15 179 +/- 17 107 +/- 16 129 +/- 10 0.039401975 0.281023215 0.005935076 0.415662845WDR57 WD repeat domain 57 (U5 snRNP specific) 959 +/- 34 1105 +/- 11 958 +/- 17 1063 +/- 49 0.006368898 0.097724694 0.020008128 0.450139251
S4- MSI correlated and non-correlated ARGs.xls Page 9

Young vs Aged MSI CorrelationsSymbol Description Young CA Aged CA Young DG Aged DG in CA in DG in CA in DGWDR73 WD repeat domain 73 236 +/- 7 291 +/- 13 265 +/- 22 258 +/- 15 0.005607061 -0.775932378 0.012479651 0.687412444WHDC1L1 WAS protein homology region 2 domain containing 1-like 1 103 +/- 9 161 +/- 16 133 +/- 14 116 +/- 11 0.014717258 -0.368476558 0.016603301 0.150887091WNK1 WNK lysine deficient protein kinase 1 169 +/- 12 233 +/- 22 147 +/- 11 191 +/- 17 0.031108331 0.069392066 0.002053821 0.002962915WTAP Wilms tumor 1 associated protein 519 +/- 31 710 +/- 21 683 +/- 41 771 +/- 66 0.000644678 0.292143156 0.000364712 0.043361186WWP1 WW domain containing E3 ubiquitin protein ligase 1 1658 +/- 161 2181 +/- 165 1410 +/- 176 1562 +/- 24 0.046635749 0.43056962 0.026369665 0.358386347YIF1B Yip1 interacting factor homolog B (S. cerevisiae) 521 +/- 34 657 +/- 43 514 +/- 32 631 +/- 45 0.031961627 0.067483699 0.012496965 0.00613698YTHDC1 YTH domain containing 1 3734 +/- 134 4179 +/- 118 3676 +/- 128 4478 +/- 290 0.031495913 0.048116818 0.003623977 0.154046625ZBTB26 zinc finger and BTB domain containing 26 380 +/- 28 505 +/- 16 502 +/- 29 427 +/- 37 0.004714113 -0.14891551 0.000943701 0.42790815ZCCHC10 zinc finger, CCHC domain containing 10 274 +/- 13 341 +/- 16 327 +/- 16 328 +/- 20 0.00917033 0.953354453 0.026274897 0.593063344ZCCHC6 zinc finger, CCHC domain containing 6 609 +/- 30 750 +/- 31 578 +/- 31 641 +/- 42 0.008699074 0.260144714 0.00859128 0.189160563ZCCHC7 Zinc finger, CCHC domain containing 7 91 +/- 10 151 +/- 6 114 +/- 11 145 +/- 19 0.000998355 0.20520873 0.032460558 0.937846913ZF HCF-binding transcription factor Zhangfei 481 +/- 22 590 +/- 26 608 +/- 20 692 +/- 20 0.0098783 0.016804892 0.007960292 0.350000711ZNF134 zinc finger protein 134 (clone pHZ-15) 473 +/- 12 593 +/- 38 437 +/- 27 544 +/- 37 0.023399139 0.048350318 0.008654068 0.303351624ZNF154 zinc finger protein 154 (pHZ-92) 164 +/- 17 242 +/- 25 176 +/- 18 248 +/- 31 0.028828358 0.08721744 0.000705013 0.014940208ZNF347 zinc finger protein 347 126 +/- 11 178 +/- 7 162 +/- 16 181 +/- 15 0.004275722 0.409141591 0.016687606 0.832521387ZNF416 zinc finger protein 416 101 +/- 8 139 +/- 8 105 +/- 12 116 +/- 13 0.007995464 0.556996454 0.016925074 0.558136122ZNF435 zinc finger protein 435 110 +/- 9 147 +/- 5 143 +/- 12 160 +/- 5 0.009413535 0.248189252 0.004456147 0.717756639ZNF501 zinc finger protein 501 137 +/- 4 217 +/- 10 206 +/- 8 206 +/- 8 0.000272779 -0.953660065 0.001635579 0.886399947ZNF585A zinc finger protein 585A 327 +/- 14 417 +/- 21 339 +/- 13 322 +/- 21 0.00539514 -0.492896455 0.006654868 0.259685498ZNF624 zinc finger protein 624 203 +/- 12 260 +/- 11 231 +/- 15 261 +/- 14 0.005365871 0.177365678 0.000662409 0.231093838ZNF652 Zinc finger protein 652 479 +/- 32 629 +/- 35 465 +/- 24 532 +/- 28 0.01026129 0.106058264 0.032785032 0.271788859ZNF669 zinc finger protein 669 417 +/- 25 647 +/- 62 504 +/- 23 634 +/- 44 0.011643971 0.038528957 0.017252972 0.059934437ZNF70 Zinc finger protein 70 162 +/- 13 219 +/- 18 207 +/- 13 233 +/- 8 0.028252666 0.141060176 0.044734082 0.502014078ZNF75 zinc finger protein 75 (D8C6) 118 +/- 9 171 +/- 11 232 +/- 23 191 +/- 11 0.003938271 -0.160313807 0.046445619 0.090135826ZNFN1A1 zinc finger protein, subfamily 1A, 1 (Ikaros) 114 +/- 15 175 +/- 22 102 +/- 11 150 +/- 6 0.044945208 0.005622566 0.00837135 0.080888941ZNFN1A5 zinc finger protein, subfamily 1A, 5 579 +/- 151 1239 +/- 161 624 +/- 101 993 +/- 136 0.013638527 0.061688737 0.007545414 0.01299765Downregulated with Age and Correlated with MSI in CA RegionABHD14A abhydrolase domain containing 14A 1760 +/- 56 1515 +/- 91 1973 +/- 103 1818 +/- 29 -0.048823745 -0.200934909 0.037107144 0.326279233ACP1 acid phosphatase 1, soluble 2644 +/- 165 2074 +/- 157 2357 +/- 91 2031 +/- 147 -0.031306264 -0.101820483 0.009087005 0.010682124ACTR1A ARP1 actin-related protein 1 homolog A, centractin alpha (yeast) 3191 +/- 134 2571 +/- 136 2763 +/- 211 2529 +/- 81 -0.008683195 -0.339256057 0.001561701 0.593701263ADD1 adducin 1 (alpha) 4262 +/- 135 3716 +/- 140 3921 +/- 116 3527 +/- 163 -0.018612912 -0.086088044 0.031312199 0.233714098AKT3 V-akt murine thymoma viral oncogene homolog 3 (protein kinase B, gamma) 4120 +/- 100 3342 +/- 250 3311 +/- 184 3045 +/- 90 -0.025142948 -0.234271755 0.012196248 0.414665882ANKRD34 ankyrin repeat domain 34 1681 +/- 72 1443 +/- 63 1781 +/- 88 1714 +/- 34 -0.031915353 -0.501221111 0.002543646 0.87556327APRIN androgen-induced proliferation inhibitor 2075 +/- 34 1723 +/- 57 2125 +/- 61 1961 +/- 40 -0.000694951 -0.054459213 7.07854E-06 0.033862026ARFIP2 ADP-ribosylation factor interacting protein 2 (arfaptin 2) 1246 +/- 34 1120 +/- 36 1244 +/- 43 1245 +/- 60 -0.029165003 0.986525832 0.00717194 0.512156151ARHGEF7 Rho guanine nucleotide exchange factor (GEF) 7 3467 +/- 223 2866 +/- 102 2911 +/- 102 2790 +/- 61 -0.043673508 -0.336367816 0.022328275 0.410873ARMC6 armadillo repeat containing 6 565 +/- 25 466 +/- 18 510 +/- 19 463 +/- 34 -0.009367028 -0.270281502 0.000970391 0.464418551ARPC5L actin related protein 2/3 complex, subunit 5-like 2033 +/- 80 1711 +/- 88 1873 +/- 143 1847 +/- 133 -0.022095698 -0.897100227 0.010421642 0.878847962ATP2C1 ATPase, Ca++ transporting, type 2C, member 1 2029 +/- 118 1514 +/- 111 1497 +/- 112 1332 +/- 42 -0.009806757 -0.213381487 0.004225894 0.246922906ATP6V1D ATPase, H+ transporting, lysosomal 34kDa, V1 subunit D 208 +/- 7 103 +/- 11 218 +/- 21 236 +/- 128 -0.000226418 0.891765597 0.00425807 0.65267287ATP6V1H ATPase, H+ transporting, lysosomal 50/57kDa, V1 subunit H 5128 +/- 416 3241 +/- 499 4550 +/- 162 3067 +/- 564 -0.016199222 -0.056256093 0.012431327 0.055570232ATXN7L3 ataxin 7-like 3 4182 +/- 141 3742 +/- 124 3753 +/- 122 3589 +/- 83 -0.041159247 -0.297756867 0.005534061 0.775795267B3GNTL1 UDP-GlcNAc:betaGal beta-1,3-N-acetylglucosaminyltransferase-like 1 215 +/- 11 174 +/- 8 238 +/- 21 202 +/- 7 -0.011299386 -0.156849415 0.034322098 0.393748663B4GALT5 UDP-Gal:betaGlcNAc beta 1,4- galactosyltransferase, polypeptide 5 2214 +/- 209 1568 +/- 99 1896 +/- 165 1568 +/- 81 -0.026375716 -0.117468677 0.021611884 0.166635882
S4- MSI correlated and non-correlated ARGs.xls Page 10

Young vs Aged MSI CorrelationsSymbol Description Young CA Aged CA Young DG Aged DG in CA in DG in CA in DGBAALC brain and acute leukemia, cytoplasmic 5677 +/- 195 4724 +/- 234 5418 +/- 180 4924 +/- 267 -0.011050277 -0.167427416 0.007071515 0.030302328BZW1 basic leucine zipper and W2 domains 1 5216 +/- 116 4624 +/- 192 4100 +/- 120 3941 +/- 258 -0.028895928 -0.596853048 0.004740205 0.215058141CACNB1 calcium channel, voltage-dependent, beta 1 subunit 1084 +/- 79 825 +/- 44 1214 +/- 70 1044 +/- 36 -0.021978762 -0.065895477 0.005600829 0.145536029CAMSAP1 calmodulin regulated spectrin-associated protein 1 1864 +/- 55 1556 +/- 68 1653 +/- 70 1442 +/- 53 -0.005928848 -0.039506876 0.036371961 0.15892634CAPNS1 calpain, small subunit 1 7708 +/- 486 6177 +/- 323 7211 +/- 399 6252 +/- 282 -0.028382546 -0.082826878 0.012855353 0.156197048CASP6 Caspase 6, apoptosis-related cysteine peptidase 345 +/- 21 260 +/- 29 301 +/- 24 283 +/- 18 -0.040367944 -0.566645121 0.022999897 0.262617761CCDC109A coiled-coil domain containing 109A 569 +/- 44 445 +/- 19 621 +/- 31 560 +/- 29 -0.036177615 -0.189660688 0.029781367 0.12063001CCDC44 coiled-coil domain containing 44 792 +/- 36 669 +/- 27 578 +/- 22 598 +/- 31 -0.021618378 0.607390674 0.010653132 0.738039644CCDC85A coiled-coil domain containing 85A 92 +/- 15 41 +/- 10 189 +/- 13 169 +/- 26 -0.02030043 -0.51673355 0.045054254 0.794482032CCRN4L CCR4 carbon catabolite repression 4-like (S. cerevisiae) 357 +/- 52 222 +/- 9 332 +/- 36 323 +/- 35 -0.048060927 -0.855936884 0.035147379 0.618589201CDK5R1 cyclin-dependent kinase 5, regulatory subunit 1 (p35) 3649 +/- 206 3034 +/- 85 4001 +/- 116 3504 +/- 169 -0.029701932 -0.04397449 0.015793702 0.307385394CDKL1 Cyclin-dependent kinase-like 1 (CDC2-related kinase) 246 +/- 38 126 +/- 18 235 +/- 31 154 +/- 10 -0.024980063 -0.045552325 0.037404744 0.079403962CDKN2D cyclin-dependent kinase inhibitor 2D (p19, inhibits CDK4) 1595 +/- 115 1240 +/- 71 1433 +/- 53 1337 +/- 51 -0.029208008 -0.225029096 0.001639885 0.266898861CDO1 cysteine dioxygenase, type I 3039 +/- 285 2226 +/- 153 2318 +/- 87 2399 +/- 90 -0.037330723 0.537164932 0.016448798 0.914334182CKMT1B creatine kinase, mitochondrial 1B 6947 +/- 213 5592 +/- 354 5522 +/- 246 4526 +/- 212 -0.010827979 -0.013361634 0.013891007 0.127060756CLUAP1 clusterin associated protein 1 364 +/- 28 271 +/- 19 359 +/- 25 394 +/- 15 -0.021404154 0.266992871 0.015051329 0.376842344COL4A3 collagen, type IV, alpha 3 (Goodpasture antigen) 155 +/- 10 113 +/- 13 122 +/- 13 100 +/- 15 -0.027496734 -0.290670075 0.046867863 0.100008503COPS6 COP9 constitutive photomorphogenic homolog subunit 6 (Arabidopsis) 4767 +/- 72 4463 +/- 89 4638 +/- 109 4477 +/- 61 -0.024833446 -0.232491253 0.004839491 0.337771603COPS8 COP9 constitutive photomorphogenic homolog subunit 8 (Arabidopsis) 3844 +/- 259 2904 +/- 248 3403 +/- 232 3169 +/- 263 -0.025701573 -0.521505534 0.003773273 0.195536642CRI2 CREBBP/EP300 inhibitor 2 2677 +/- 69 2462 +/- 64 2961 +/- 148 2988 +/- 133 -0.045566133 0.896076572 0.013415481 0.95609094CRYBA2 crystallin, beta A2 197 +/- 9 153 +/- 13 189 +/- 23 170 +/- 6 -0.022756633 -0.458025517 0.005340474 0.763202712CRYZL1 crystallin, zeta (quinone reductase)-like 1 1205 +/- 66 921 +/- 78 933 +/- 90 851 +/- 78 -0.019966392 -0.505096205 0.004364084 0.458582837CSNK1D casein kinase 1, delta 809 +/- 36 702 +/- 20 866 +/- 60 764 +/- 92 -0.031334104 -0.386763662 0.022109974 0.334433287CTDP1 CTD (carboxy-terminal domain, RNA polymerase II, polypeptide A) phosphatase, subunit 1 433 +/- 12 380 +/- 8 395 +/- 17 398 +/- 24 -0.006233806 0.926064951 0.046369539 0.941872522CYR61 cysteine-rich, angiogenic inducer, 61 179 +/- 15 130 +/- 13 126 +/- 20 128 +/- 12 -0.034656121 0.939443225 0.015025637 0.807506086DAK dihydroxyacetone kinase 2 homolog (S. cerevisiae) 169 +/- 11 116 +/- 13 159 +/- 13 126 +/- 13 -0.009757921 -0.113635004 0.00752697 0.023707166DCUN1D1 DCN1, defective in cullin neddylation 1, domain containing 1 (S. cerevisiae) 2306 +/- 41 1936 +/- 62 1971 +/- 52 1884 +/- 74 -0.000830228 -0.365085383 0.000397026 0.212589261DENR density-regulated protein 231 +/- 38 119 +/- 19 238 +/- 27 245 +/- 52 -0.031447904 0.908312308 0.00898637 0.871063866DHX16 DEAH (Asp-Glu-Ala-His) box polypeptide 16 670 +/- 35 550 +/- 12 568 +/- 33 500 +/- 24 -0.017229993 -0.127296515 0.011376473 0.303406537DLG3 discs, large homolog 3 (neuroendocrine-dlg, Drosophila) 3182 +/- 238 2326 +/- 174 2460 +/- 135 2233 +/- 59 -0.017401287 -0.16781061 0.015618112 0.431419743DMRTC1 DMRT-like family C1 490 +/- 23 258 +/- 25 324 +/- 18 327 +/- 38 -4.47826E-05 0.951773644 0.008628636 0.756719961DNAJC7 DnaJ (Hsp40) homolog, subfamily C, member 7 2338 +/- 63 1862 +/- 122 2348 +/- 84 2059 +/- 107 -0.009345228 -0.065690886 0.034521808 0.381980453DNAPTP6 DNA polymerase-transactivated protein 6 3467 +/- 109 3025 +/- 90 3104 +/- 157 3123 +/- 114 -0.011510724 0.92500822 0.001574129 0.641589374DOK4 docking protein 4 476 +/- 29 384 +/- 21 433 +/- 40 391 +/- 20 -0.03121188 -0.376148114 0.000896279 0.414803325DPF1 D4, zinc and double PHD fingers family 1 1631 +/- 91 1083 +/- 88 1997 +/- 111 1529 +/- 115 -0.001498473 -0.017396385 0.00842478 0.107797752EEF1A2 eukaryotic translation elongation factor 1 alpha 2 12229 +/- 451 10754 +/- 445 11925 +/- 233 11098 +/- 267 -0.042273622 -0.046167272 0.014356403 0.381357782EFNB2 ephrin-B2 1795 +/- 111 1406 +/- 118 910 +/- 113 742 +/- 59 -0.037150485 -0.223194193 0.046435826 0.363159643ELF3 E74-like factor 3 (ets domain transcription factor, epithelial-specific ) 129 +/- 10 68 +/- 11 136 +/- 10 86 +/- 15 -0.002286897 -0.022561321 0.000951718 0.067420213ELOVL4 elongation of very long chain fatty acids (FEN1/Elo2, SUR4/Elo3, yeast)-like 4 1955 +/- 115 1623 +/- 79 1858 +/- 101 1621 +/- 69 -0.042060417 -0.08690869 0.026610083 0.541673854EXOSC5 exosome component 5 648 +/- 33 544 +/- 16 532 +/- 31 483 +/- 14 -0.025108962 -0.201459915 0.025174739 0.490893179FADD Fas (TNFRSF6)-associated via death domain 417 +/- 17 322 +/- 14 411 +/- 35 337 +/- 8 -0.001535015 -0.090736256 0.036494757 0.320630908FAT3 FAT tumor suppressor homolog 3 (Drosophila) 802 +/- 78 532 +/- 31 691 +/- 50 625 +/- 62 -0.016377377 -0.430341337 0.044512833 0.883702755FBXO22 F-box protein 22 180 +/- 15 116 +/- 11 204 +/- 17 146 +/- 19 -0.007921782 -0.047840719 0.043884135 0.074214805FEN1 flap structure-specific endonuclease 1 189 +/- 9 162 +/- 6 178 +/- 12 185 +/- 19 -0.033609122 0.754613555 0.006574422 0.716936333
S4- MSI correlated and non-correlated ARGs.xls Page 11

Young vs Aged MSI CorrelationsSymbol Description Young CA Aged CA Young DG Aged DG in CA in DG in CA in DGFHOD3 formin homology 2 domain containing 3 907 +/- 38 718 +/- 69 579 +/- 57 434 +/- 53 -0.043636352 -0.096170928 0.010336495 0.328247753FKRP fukutin related protein 1114 +/- 40 971 +/- 30 1164 +/- 29 1050 +/- 21 -0.018582598 -0.010989279 0.037392418 0.111899405FLJ35348 FLJ35348 1340 +/- 120 959 +/- 56 1239 +/- 60 1161 +/- 20 -0.023203876 -0.260508865 0.008914682 0.403420109FLJ37035 FLJ37035 protein 344 +/- 33 221 +/- 20 323 +/- 33 207 +/- 33 -0.012535482 -0.035517647 0.041448292 0.106054095FNDC5 fibronectin type III domain containing 5 519 +/- 27 422 +/- 25 470 +/- 26 433 +/- 42 -0.024752494 -0.48943447 0.030532703 0.24227571FXYD7 FXYD domain containing ion transport regulator 7 3435 +/- 178 2940 +/- 109 4078 +/- 119 3624 +/- 147 -0.04407684 -0.042429162 0.00488822 0.483348228GCHFR GTP cyclohydrolase I feedback regulator 417 +/- 27 263 +/- 11 403 +/- 32 315 +/- 18 -0.00123335 -0.044121673 0.003602917 0.26266741GFM2 G elongation factor, mitochondrial 2 1138 +/- 34 958 +/- 37 1177 +/- 64 993 +/- 71 -0.005135292 -0.087733981 0.045076337 0.224179949GGH gamma-glutamyl hydrolase (conjugase, folylpolygammaglutamyl hydrolase) 1157 +/- 71 923 +/- 51 1159 +/- 47 1032 +/- 52 -0.024735773 -0.103653588 0.030684776 0.22737129GPM6A glycoprotein M6A 20299 +/- 453 16530 +/- 744 18774 +/- 263 16875 +/- 764 -0.00234216 -0.066050248 0.024341915 0.325260136GRINA glutamate receptor, ionotropic, N-methyl D-asparate-associated protein 1 (glutamate binding) 5549 +/- 298 4625 +/- 234 6955 +/- 300 6870 +/- 234 -0.036044273 -0.828972803 0.023231701 0.692819426GRLF1 glucocorticoid receptor DNA binding factor 1 2246 +/- 57 1916 +/- 112 2476 +/- 123 2257 +/- 73 -0.031674663 -0.162091497 0.005926068 0.565902829GRM5 Glutamate receptor, metabotropic 5 4099 +/- 219 3135 +/- 171 3523 +/- 175 2644 +/- 98 -0.006510561 -0.002590439 0.006481496 0.085829727GRTP1 Growth hormone regulated TBC protein 1 446 +/- 50 299 +/- 12 412 +/- 52 272 +/- 16 -0.030152815 -0.042958386 0.035210678 0.103772623GSK3A glycogen synthase kinase 3 alpha 4199 +/- 213 3357 +/- 277 4155 +/- 242 3593 +/- 133 -0.038138935 -0.078496021 0.016454623 0.048104055HEXIM1 hexamethylene bis-acetamide inducible 1 1258 +/- 39 1102 +/- 16 1185 +/- 37 1098 +/- 42 -0.008471309 -0.15592394 0.018829727 0.494076237HIGD2A HIG1 domain family, member 2A 3641 +/- 182 2920 +/- 183 3456 +/- 163 2935 +/- 93 -0.019088664 -0.024690915 0.023971733 0.087432337HLF hepatic leukemia factor 3087 +/- 125 2470 +/- 174 3295 +/- 234 3001 +/- 197 -0.017992173 -0.361245248 0.021444218 0.56515568HMBOX1 homeobox containing 1 2019 +/- 129 1029 +/- 14 1858 +/- 133 1219 +/- 270 -0.000547214 -0.078476466 0.002248502 0.011675758HNMT histamine N-methyltransferase 396 +/- 32 235 +/- 22 494 +/- 59 338 +/- 17 -0.002524332 -0.044935424 0.021349226 0.072377414HOMER1 homer homolog 1 (Drosophila) 2901 +/- 169 2385 +/- 132 2363 +/- 91 2257 +/- 80 -0.038188312 -0.408436278 0.044859532 0.302280397HP1BP3 heterochromatin protein 1, binding protein 3 5237 +/- 233 4163 +/- 95 5620 +/- 224 4368 +/- 255 -0.004208435 -0.005506694 0.030837236 0.073044113IDH3B isocitrate dehydrogenase 3 (NAD+) beta 1428 +/- 48 1204 +/- 29 1103 +/- 38 1036 +/- 36 -0.003797664 -0.233414228 0.028620692 0.701024795ITFG1 Integrin alpha FG-GAP repeat containing 1 7600 +/- 215 6251 +/- 221 6538 +/- 483 6093 +/- 241 -0.001403403 -0.437198048 0.008395414 0.622297603ITIH5 inter-alpha (globulin) inhibitor H5 396 +/- 40 251 +/- 36 310 +/- 50 237 +/- 35 -0.023919047 -0.263543278 0.01618079 0.156373512JMJD4 jumonji domain containing 4 451 +/- 27 321 +/- 25 448 +/- 15 402 +/- 26 -0.005768285 -0.172553026 0.011751809 0.3260716KARCA1 kelch/ankyrin repeat containing cyclin A1 interacting protein 2299 +/- 44 1908 +/- 148 2213 +/- 74 1909 +/- 113 -0.045071747 -0.058893396 0.013447787 0.013397673KCTD17 potassium channel tetramerisation domain containing 17 288 +/- 31 189 +/- 16 389 +/- 31 381 +/- 41 -0.022213908 -0.885017111 0.024220279 0.706816049KIF3C kinesin family member 3C 5625 +/- 458 4054 +/- 161 4195 +/- 251 3767 +/- 99 -0.01695736 -0.160419755 0.005118117 0.230233843KPNA1 karyopherin alpha 1 (importin alpha 5) 2311 +/- 102 1982 +/- 79 2132 +/- 68 2092 +/- 86 -0.030322121 -0.725154086 0.042620928 0.972189568LARP1 La ribonucleoprotein domain family, member 1 2654 +/- 61 2210 +/- 101 2989 +/- 126 2762 +/- 90 -0.005348324 -0.178466454 0.004417523 0.176511386LASS5 LAG1 longevity assurance homolog 5 (S. cerevisiae) 1328 +/- 43 993 +/- 51 1277 +/- 72 1037 +/- 33 -0.000565873 -0.01899967 0.000457208 0.127403657LASS6 LAG1 longevity assurance homolog 6 (S. cerevisiae) 241 +/- 14 185 +/- 9 233 +/- 20 237 +/- 21 -0.009062972 0.911094789 0.001828051 0.699286235LNX1 ligand of numb-protein X 1 2480 +/- 118 1905 +/- 184 2474 +/- 174 1901 +/- 108 -0.028569789 -0.022991433 0.002603438 0.156600864LRPPRC leucine-rich PPR-motif containing 4632 +/- 236 3748 +/- 142 4099 +/- 157 3800 +/- 34 -0.011933882 -0.116117512 0.013012111 0.273372239LRRFIP1 leucine rich repeat (in FLII) interacting protein 1 1529 +/- 101 1224 +/- 53 1604 +/- 56 1461 +/- 75 -0.029900488 -0.167583151 0.045979168 0.224863951LRRN5 leucine rich repeat neuronal 5 1461 +/- 68 1120 +/- 25 1554 +/- 45 1289 +/- 57 -0.002903974 -0.006256578 0.007370126 0.064886225LZTR2 Leucine zipper transcription regulator 2 124 +/- 12 87 +/- 9 134 +/- 23 117 +/- 16 -0.033318797 -0.554796942 0.003210529 0.144445843MANEAL mannosidase, endo-alpha-like 2351 +/- 85 2004 +/- 64 2117 +/- 72 1985 +/- 75 -0.009303669 -0.239499435 0.004388795 0.125033905MAP6 microtubule-associated protein 6 1084 +/- 21 874 +/- 23 1109 +/- 50 972 +/- 50 -4.96E-05 -0.084487817 0.003532582 0.320593099MAPK8IP1 mitogen-activated protein kinase 8 interacting protein 1 4276 +/- 133 3711 +/- 134 3607 +/- 165 3762 +/- 73 -0.013644007 0.420129141 0.026394892 0.342453848MAPK9 Mitogen-activated protein kinase 9 4733 +/- 223 3991 +/- 177 4745 +/- 208 4279 +/- 155 -0.02708885 -0.107047938 0.004574689 0.528747969MAPRE3 microtubule-associated protein, RP/EB family, member 3 3330 +/- 90 2945 +/- 89 3841 +/- 102 3654 +/- 41 -0.012243103 -0.134441689 0.024023541 0.333593529MATR3 matrin 3 18535 +/- 672 15789 +/- 403 18512 +/- 661 16674 +/- 807 -0.007753637 -0.115262499 0.03479029 0.212920471
S4- MSI correlated and non-correlated ARGs.xls Page 12

Young vs Aged MSI CorrelationsSymbol Description Young CA Aged CA Young DG Aged DG in CA in DG in CA in DGMCF2L MCF.2 cell line derived transforming sequence-like 169 +/- 11 113 +/- 10 232 +/- 24 135 +/- 8 -0.00333276 -0.007613212 0.033674994 0.067935138MFAP1 microfibrillar-associated protein 1 1476 +/- 22 1315 +/- 35 1367 +/- 41 1252 +/- 27 -0.004145342 -0.047851898 0.002324551 0.062969353M-RIP myosin phosphatase-Rho interacting protein 3617 +/- 157 3133 +/- 138 3127 +/- 109 2889 +/- 119 -0.043121247 -0.177578797 0.001489897 0.356422824MRP63 mitochondrial ribosomal protein 63 1794 +/- 66 1575 +/- 30 1880 +/- 76 1746 +/- 80 -0.019640034 -0.25759186 0.042154311 0.304660353MTG1 mitochondrial GTPase 1 homolog (S. cerevisiae) 1704 +/- 61 1474 +/- 43 1403 +/- 55 1356 +/- 42 -0.012619947 -0.518009595 0.026703714 0.549806975MXRA7 matrix-remodelling associated 7 203 +/- 23 119 +/- 18 218 +/- 27 164 +/- 25 -0.018306801 -0.174309915 0.047168645 0.216235093MYADM myeloid-associated differentiation marker 444 +/- 27 337 +/- 28 548 +/- 77 393 +/- 23 -0.020701463 -0.104459613 0.019736608 0.107923516NAT5 N-acetyltransferase 5 5238 +/- 136 4713 +/- 92 5091 +/- 104 4770 +/- 113 -0.011363897 -0.067794632 0.021574602 0.271896906NDUFA1 NADH dehydrogenase (ubiquinone) 1 alpha subcomplex, 1, 7.5kDa 12545 +/- 378 10794 +/- 469 11641 +/- 107 11222 +/- 234 -0.016287758 -0.157323197 0.003711155 0.013642841NDUFB10 NADH dehydrogenase (ubiquinone) 1 beta subcomplex, 10, 22kDa 397 +/- 30 271 +/- 22 317 +/- 19 301 +/- 26 -0.007124239 -0.622555222 0.00410179 0.242804193NMT2 N-myristoyltransferase 2 443 +/- 35 350 +/- 17 594 +/- 32 534 +/- 28 -0.045268927 -0.185806508 0.034401806 0.203357658NPAS2 neuronal PAS domain protein 2 1237 +/- 69 1027 +/- 36 1162 +/- 50 1055 +/- 32 -0.028195974 -0.104973437 0.005994627 0.381351419NRXN1 neurexin 1 10862 +/- 245 9499 +/- 402 10764 +/- 142 9886 +/- 287 -0.019307751 -0.033930344 0.031491478 0.148727641NUBP1 nucleotide binding protein 1 (MinD homolog, E. coli) 679 +/- 25 548 +/- 12 607 +/- 21 506 +/- 19 -0.002200702 -0.006861505 0.025427377 0.077320833NUDT10 nudix (nucleoside diphosphate linked moiety X)-type motif 10 282 +/- 18 221 +/- 15 266 +/- 20 231 +/- 22 -0.025399755 -0.26581319 0.005550744 0.16394202NUTF2 Nuclear transport factor 2 611 +/- 38 479 +/- 23 607 +/- 22 528 +/- 32 -0.017070133 -0.081000563 0.022600983 0.138572292OCRL oculocerebrorenal syndrome of Lowe 5167 +/- 351 2651 +/- 414 4835 +/- 441 3145 +/- 483 -0.000997411 -0.030467437 0.028945575 0.277285789ODZ4 odz, odd Oz/ten-m homolog 4 (Drosophila) 1909 +/- 94 1463 +/- 108 1647 +/- 86 1434 +/- 117 -0.011218559 -0.179929322 0.004251082 0.064251086OGDH oxoglutarate (alpha-ketoglutarate) dehydrogenase (lipoamide) 1659 +/- 60 1455 +/- 67 1434 +/- 34 1400 +/- 37 -0.045988285 -0.523984078 0.040444081 0.383951287PAPOLG poly(A) polymerase gamma 791 +/- 23 698 +/- 22 821 +/- 24 839 +/- 22 -0.014572723 0.597447164 0.041461965 0.852354691PCBP1 poly(rC) binding protein 1 3493 +/- 69 3140 +/- 89 3412 +/- 103 3322 +/- 114 -0.011417071 -0.572878733 0.007884979 0.49870789PCSK2 proprotein convertase subtilisin/kexin type 2 3146 +/- 220 2328 +/- 198 2601 +/- 119 2049 +/- 105 -0.020417862 -0.006951289 0.01232449 0.060491027PFDN1 prefoldin subunit 1 3757 +/- 69 3495 +/- 74 3517 +/- 72 3281 +/- 42 -0.026757747 -0.0223749 0.003461971 0.103413488PHLDA1 pleckstrin homology-like domain, family A, member 1 421 +/- 36 319 +/- 24 453 +/- 52 320 +/- 63 -0.043072063 -0.140808341 0.014174988 0.121035617PIK3R2 phosphoinositide-3-kinase, regulatory subunit 2 (p85 beta) 5364 +/- 460 3833 +/- 348 4458 +/- 93 3892 +/- 156 -0.025607679 -0.017781087 0.021090149 0.095284858PINK1 PTEN induced putative kinase 1 5970 +/- 290 3813 +/- 313 5732 +/- 418 4288 +/- 150 -0.000503668 -0.016543541 0.005077902 0.11399275PIP5K1B phosphatidylinositol-4-phosphate 5-kinase, type I, beta 1195 +/- 134 787 +/- 70 608 +/- 59 541 +/- 13 -0.028872976 -0.314437372 0.018183945 0.262335204PLA2G12A phospholipase A2, group XIIA 659 +/- 57 425 +/- 65 583 +/- 43 397 +/- 74 -0.021906837 -0.068932929 0.004271189 0.005247377PLAA phospholipase A2-activating protein 952 +/- 29 788 +/- 29 921 +/- 43 883 +/- 20 -0.002376943 -0.443566093 0.010247002 0.871137589PLCXD2 Phosphatidylinositol-specific phospholipase C, X domain containing 2 4569 +/- 505 3022 +/- 283 4069 +/- 225 3379 +/- 431 -0.028738374 -0.204459712 0.025954362 0.405116264PNMA1 paraneoplastic antigen MA1 10959 +/- 391 9451 +/- 261 10858 +/- 318 10579 +/- 360 -0.011210692 -0.577070644 0.005618811 0.487260923POLDIP2 polymerase (DNA-directed), delta interacting protein 2 1060 +/- 90 803 +/- 50 1016 +/- 25 1023 +/- 36 -0.039050768 0.872959524 0.018963059 0.637065539POLE4 polymerase (DNA-directed), epsilon 4 (p12 subunit) 2611 +/- 103 2205 +/- 69 2073 +/- 57 2027 +/- 37 -0.009910754 -0.524049886 0.003033511 0.945593021PPID peptidylprolyl isomerase D (cyclophilin D) 303 +/- 34 207 +/- 13 325 +/- 26 339 +/- 63 -0.03497557 0.847745854 0.031541523 0.278841929PRDX5 peroxiredoxin 5 3941 +/- 95 3412 +/- 66 3326 +/- 71 3314 +/- 37 -0.00139971 -0.885483636 0.002094863 0.917583283PRNPIP prion protein interacting protein 2458 +/- 123 2089 +/- 74 2388 +/- 39 2292 +/- 67 -0.032218204 -0.260049619 0.026413434 0.103059674PROS1 protein S (alpha) 774 +/- 108 426 +/- 28 473 +/- 63 375 +/- 23 -0.022169032 -0.190453 0.033540833 0.246244928PRPS2 phosphoribosyl pyrophosphate synthetase 2 1966 +/- 106 1443 +/- 29 1604 +/- 58 1369 +/- 46 -0.003525035 -0.011978454 0.001513869 0.084104019PRSS22 protease, serine, 22 376 +/- 33 245 +/- 15 364 +/- 29 215 +/- 21 -0.009083568 -0.002358389 0.046989389 0.059613239PSME3 proteasome (prosome, macropain) activator subunit 3 (PA28 gamma; Ki) 1539 +/- 66 1271 +/- 42 1431 +/- 65 1338 +/- 73 -0.008494401 -0.364470977 0.003356471 0.415658339PTHB1 parathyroid hormone-responsive B1 158 +/- 16 111 +/- 9 140 +/- 6 113 +/- 12 -0.03363722 -0.089110273 0.030504403 0.015137249PTPRN2 protein tyrosine phosphatase, receptor type, N polypeptide 2 6494 +/- 194 5488 +/- 322 6194 +/- 400 5533 +/- 188 -0.027431781 -0.178053105 0.00140769 0.31327238RAB6B RAB6B, member RAS oncogene family 1509 +/- 149 954 +/- 120 1616 +/- 206 1444 +/- 168 -0.016509018 -0.532763127 0.011962204 0.524906192RANGNRF RAN guanine nucleotide release factor 425 +/- 34 318 +/- 15 318 +/- 17 272 +/- 27 -0.024130804 -0.192118213 0.015289187 0.020533647
S4- MSI correlated and non-correlated ARGs.xls Page 13

Young vs Aged MSI CorrelationsSymbol Description Young CA Aged CA Young DG Aged DG in CA in DG in CA in DGRASGRF2 Ras protein-specific guanine nucleotide-releasing factor 2 335 +/- 22 273 +/- 17 423 +/- 53 365 +/- 12 -0.048142485 -0.333608722 0.032839332 0.353359145RBM9 RNA binding motif protein 9 5783 +/- 65 4948 +/- 171 5058 +/- 152 4836 +/- 215 -0.003138547 -0.424617309 0.002847488 0.624653344RBMS1 RNA binding motif, single stranded interacting protein 1 195 +/- 15 138 +/- 12 149 +/- 8 122 +/- 10 -0.016158259 -0.05922107 0.041609338 0.283416898REEP1 receptor accessory protein 1 3525 +/- 94 2995 +/- 201 2782 +/- 183 2618 +/- 100 -0.048147325 -0.455031497 0.01331036 0.861296448REXO1 REX1, RNA exonuclease 1 homolog (S. cerevisiae) 655 +/- 28 517 +/- 30 915 +/- 58 744 +/- 67 -0.007208564 -0.087530236 0.001985453 0.243132623RHEB Ras homolog enriched in brain 7133 +/- 176 6424 +/- 174 6526 +/- 211 6223 +/- 272 -0.016740681 -0.404730199 0.001094097 0.224940857RHOBTB2 Rho-related BTB domain containing 2 686 +/- 32 533 +/- 29 663 +/- 45 502 +/- 41 -0.005244694 -0.028313851 0.007948868 0.08870149RNF165 ring finger protein 165 582 +/- 25 444 +/- 19 525 +/- 34 419 +/- 29 -0.001550293 -0.042494447 0.043446064 0.191880592RNF180 ring finger protein 180 252 +/- 11 196 +/- 5 237 +/- 14 213 +/- 19 -0.00212079 -0.336433705 0.010142879 0.258338931ROBO2 roundabout, axon guidance receptor, homolog 2 (Drosophila) 1844 +/- 48 1630 +/- 69 1649 +/- 73 1537 +/- 82 -0.032174321 -0.337925299 0.001025989 0.646160903RPP30 ribonuclease P/MRP 30kDa subunit 391 +/- 15 345 +/- 14 392 +/- 26 360 +/- 9 -0.044503625 -0.284057221 0.014671955 0.422890934RPP40 ribonuclease P 40kDa subunit 814 +/- 28 680 +/- 26 723 +/- 28 663 +/- 58 -0.006008724 -0.38914678 0.001062214 0.352899497RTF1 Rtf1, Paf1/RNA polymerase II complex component, homolog (S. cerevisiae) 1080 +/- 61 889 +/- 52 1157 +/- 39 1177 +/- 28 -0.039211532 0.687223527 0.016679497 0.988203171RUNX1T1 runt-related transcription factor 1; translocated to, 1 (cyclin D-related) 2489 +/- 125 1740 +/- 89 2274 +/- 171 1707 +/- 184 -0.000846719 -0.051017315 0.01645597 0.495650684SAP130 Sin3A-associated protein, 130kDa 1623 +/- 42 1504 +/- 24 1469 +/- 39 1472 +/- 40 -0.039160451 0.964552301 0.023218694 0.486987024SDCCAG1 serologically defined colon cancer antigen 1 388 +/- 20 315 +/- 15 516 +/- 63 441 +/- 28 -0.017002505 -0.314804602 0.003703351 0.196201543SEC22C SEC22 vesicle trafficking protein homolog C (S. cerevisiae) 250 +/- 23 183 +/- 15 231 +/- 16 204 +/- 13 -0.038380002 -0.216114251 0.024485624 0.128538513SEPT3 septin 3 7220 +/- 468 5490 +/- 263 8056 +/- 320 7357 +/- 258 -0.01245062 -0.124099563 0.021360115 0.456052172SET SET translocation (myeloid leukemia-associated) 698 +/- 22 583 +/- 14 1015 +/- 52 866 +/- 35 -0.002192832 -0.042420255 0.020561031 0.052270741SEZ6L2 Seizure related 6 homolog (mouse)-like 2 1565 +/- 18 1244 +/- 115 2230 +/- 72 2186 +/- 114 -0.038027127 -0.756043538 0.043918098 0.930399218SFRS14 splicing factor, arginine/serine-rich 14 2501 +/- 104 2096 +/- 137 2785 +/- 51 2631 +/- 85 -0.041620035 -0.167002444 0.006250063 0.035349435SFXN1 sideroflexin 1 947 +/- 84 649 +/- 46 800 +/- 33 630 +/- 29 -0.014753663 -0.004024948 0.022844764 0.055998664SHANK2 SH3 and multiple ankyrin repeat domains 2 3124 +/- 137 2183 +/- 63 2942 +/- 130 2120 +/- 154 -0.000417935 -0.003276605 0.000954574 0.074945144SHMT2 serine hydroxymethyltransferase 2 (mitochondrial) 193 +/- 15 139 +/- 8 177 +/- 12 147 +/- 8 -0.014906527 -0.071431424 0.031662802 0.10989783SLC12A5 solute carrier family 12, (potassium-chloride transporter) member 5 9260 +/- 395 7923 +/- 381 8510 +/- 287 7677 +/- 214 -0.035165521 -0.045788367 0.015477601 0.202189808SLC31A1 solute carrier family 31 (copper transporters), member 1 325 +/- 19 228 +/- 24 334 +/- 28 277 +/- 30 -0.011782491 -0.198780723 0.033509963 0.56732771SLC35A2 solute carrier family 35 (UDP-galactose transporter), member A2 628 +/- 18 538 +/- 17 657 +/- 30 593 +/- 23 -0.004801971 -0.127267395 0.015822656 0.292141458SLC39A3 solute carrier family 39 (zinc transporter), member 3 529 +/- 35 429 +/- 22 453 +/- 33 436 +/- 14 -0.039489178 -0.651066071 0.007249755 0.505237474SOX11 SRY (sex determining region Y)-box 11 664 +/- 52 459 +/- 46 303 +/- 32 221 +/- 13 -0.014598477 -0.04875412 0.011762268 0.055596693SPTY2D1 SPT2, Suppressor of Ty, domain containing 1 (S. cerevisiae) 213 +/- 23 140 +/- 13 201 +/- 16 189 +/- 22 -0.025218651 -0.667917187 0.045809532 0.230201875SSR2 signal sequence receptor, beta (translocon-associated protein beta) 2068 +/- 137 1585 +/- 78 1623 +/- 93 1483 +/- 68 -0.015559833 -0.256528135 0.004808131 0.149857836SSTR2 somatostatin receptor 2 181 +/- 26 94 +/- 7 135 +/- 18 66 +/- 7 -0.018011504 -0.010196622 0.005480342 0.055425313ST6GALNAC6 ST6 (alpha-N-acetyl-neuraminyl-2,3-beta-galactosyl-1,3)-N-acetylgalactosaminide alpha-2,6-sialyltransferas 422 +/- 12 305 +/- 23 413 +/- 44 385 +/- 11 -0.002102437 -0.562836909 0.009006579 0.865391561ST8SIA2 ST8 alpha-N-acetyl-neuraminide alpha-2,8-sialyltransferase 2 339 +/- 35 212 +/- 17 124 +/- 23 93 +/- 11 -0.013714468 -0.261208901 0.036940154 0.608622387STMN2 stathmin-like 2 15575 +/- 785 11635 +/- 678 13350 +/- 985 11673 +/- 910 -0.003625593 -0.242693872 0.012395585 0.520895886STS steroid sulfatase (microsomal), arylsulfatase C, isozyme S 522 +/- 29 428 +/- 25 424 +/- 42 346 +/- 14 -0.033390554 -0.12459381 0.02676154 0.18526026SUGT1 SGT1, suppressor of G2 allele of SKP1 (S. cerevisiae) 266 +/- 18 181 +/- 12 342 +/- 23 283 +/- 32 -0.003216278 -0.181554741 0.032597684 0.739131261SYT11 synaptotagmin XI 2979 +/- 924 523 +/- 91 2747 +/- 804 738 +/- 96 -0.044900169 -0.05440499 0.045545221 0.091856384TAB3 TAK1-binding protein 3 1451 +/- 63 1273 +/- 30 1302 +/- 27 1272 +/- 19 -0.036764609 -0.391401901 0.027287499 0.371004476TADA3L transcriptional adaptor 3 (NGG1 homolog, yeast)-like 1631 +/- 31 1444 +/- 60 1480 +/- 44 1513 +/- 52 -0.02541244 0.647547172 0.031751945 0.562861226TBC1D16 TBC1 domain family, member 16 132 +/- 15 84 +/- 12 134 +/- 13 147 +/- 12 -0.030784925 0.494537781 0.01661304 0.594546892TBC1D22B TBC1 domain family, member 22B 1294 +/- 39 1120 +/- 36 1174 +/- 53 1149 +/- 18 -0.008401332 -0.662916412 0.004056769 0.872119536TBC1D9 TBC1 domain family, member 9 5875 +/- 79 5392 +/- 40 4902 +/- 118 5160 +/- 124 -0.000792803 0.165631713 0.000688738 0.601842809TBL3 transducin (beta)-like 3 579 +/- 36 464 +/- 23 541 +/- 36 472 +/- 24 -0.024171196 -0.141556092 0.017076025 0.209704541
S4- MSI correlated and non-correlated ARGs.xls Page 14

Young vs Aged MSI CorrelationsSymbol Description Young CA Aged CA Young DG Aged DG in CA in DG in CA in DGTEKT2 tektin 2 (testicular) 171 +/- 8 125 +/- 7 156 +/- 5 133 +/- 14 -0.001606702 -0.191238704 0.029531003 0.670140761TERF2 telomeric repeat binding factor 2 123 +/- 13 83 +/- 8 103 +/- 11 90 +/- 11 -0.027877746 -0.404463565 0.002010455 0.418601379TEX10 testis expressed sequence 10 462 +/- 12 415 +/- 8 455 +/- 18 446 +/- 12 -0.010266707 -0.664460157 0.019684954 0.765926009TFG TRK-fused gene 5280 +/- 199 4443 +/- 99 4815 +/- 94 4186 +/- 147 -0.006471633 -0.008782778 0.008840003 0.243183596THAP11 THAP domain containing 11 1105 +/- 29 934 +/- 18 1207 +/- 52 1091 +/- 55 -0.000838358 -0.16246445 0.018322576 0.064928883TICAM1 toll-like receptor adaptor molecule 1 274 +/- 11 229 +/- 13 241 +/- 16 230 +/- 10 -0.025244948 -0.555689792 0.003575588 0.433435891TIMM10 translocase of inner mitochondrial membrane 10 homolog (yeast) 1629 +/- 120 1047 +/- 77 1208 +/- 47 967 +/- 68 -0.003153302 -0.021238258 0.00548846 0.144075924TIMM17B translocase of inner mitochondrial membrane 17 homolog B (yeast) 797 +/- 21 693 +/- 17 734 +/- 44 746 +/- 42 -0.003377767 0.851200083 0.001345578 0.862495685TMEM14B transmembrane protein 14B 10702 +/- 355 8858 +/- 414 10426 +/- 173 9258 +/- 433 -0.007201764 -0.051728584 0.000494027 0.001648848TMEM16D transmembrane protein 16D 287 +/- 24 220 +/- 14 135 +/- 14 141 +/- 14 -0.043746824 0.7783487 0.02635436 0.880005268TMEM30A transmembrane protein 30A 8163 +/- 210 7246 +/- 252 7449 +/- 446 7041 +/- 398 -0.019401441 -0.51194934 0.028444652 0.921630753TMEM76 transmembrane protein 76 3761 +/- 96 3217 +/- 173 4452 +/- 182 4256 +/- 291 -0.025905248 -0.587721374 0.021569628 0.343968639TMEM91 transmembrane protein 91 837 +/- 63 517 +/- 43 501 +/- 26 438 +/- 36 -0.002489871 -0.196616967 0.010463406 0.547819959TNRC4 trinucleotide repeat containing 4 4534 +/- 210 3677 +/- 260 5558 +/- 185 4760 +/- 252 -0.029148199 -0.035166821 0.010782622 0.125680243TOLLIP toll interacting protein 3373 +/- 197 2715 +/- 128 3379 +/- 182 2936 +/- 92 -0.021607732 -0.065071858 0.007420979 0.124538741TOMM40L translocase of outer mitochondrial membrane 40 homolog-like (yeast) 1176 +/- 55 1011 +/- 26 1124 +/- 72 1062 +/- 68 -0.029640857 -0.549900158 0.012026184 0.935882182TPT1 tumor protein, translationally-controlled 1 440 +/- 33 330 +/- 27 527 +/- 42 469 +/- 48 -0.028534908 -0.385138793 0.031200246 0.417830754TRAPPC5 trafficking protein particle complex 5 2581 +/- 63 2125 +/- 116 2463 +/- 162 2219 +/- 88 -0.009296312 -0.223796618 0.024411641 0.727839766TSGA2 testis specific A2 homolog (mouse) 658 +/- 150 274 +/- 41 370 +/- 40 239 +/- 30 -0.049773829 -0.027797187 0.044111728 0.113750324TSPAN3 tetraspanin 3 4001 +/- 86 3629 +/- 136 3966 +/- 66 3699 +/- 96 -0.047447907 -0.053879539 0.0498443 0.24013768TUBB tubulin, beta 14019 +/- 320 12891 +/- 352 13789 +/- 333 13992 +/- 673 -0.039424516 0.79545786 0.011281322 0.450487648TUBB2A tubulin, beta 2A 32505 +/- 1058 29201 +/- 789 30330 +/- 702 30704 +/- 944 -0.033009461 0.759243251 0.016857205 0.639808342TUSC3 tumor suppressor candidate 3 593 +/- 43 437 +/- 30 743 +/- 35 545 +/- 36 -0.015208368 -0.003574256 0.026811227 0.078995526TUSC4 tumor suppressor candidate 4 680 +/- 15 597 +/- 17 608 +/- 25 633 +/- 24 -0.004189125 0.477031885 0.001727243 0.830559707UBE2J2 ubiquitin-conjugating enzyme E2, J2 (UBC6 homolog, yeast) 433 +/- 20 329 +/- 22 433 +/- 21 410 +/- 38 -0.005391625 -0.608340745 0.032680246 0.946323589UGCG UDP-glucose ceramide glucosyltransferase 1454 +/- 63 1024 +/- 64 1638 +/- 69 1487 +/- 121 -0.000733354 -0.318253979 0.001066394 0.429596549USP4 ubiquitin specific peptidase 4 (proto-oncogene) 2228 +/- 74 1806 +/- 34 2258 +/- 99 1973 +/- 65 -0.001323917 -0.04187396 0.015351275 0.35433655UTP11L UTP11-like, U3 small nucleolar ribonucleoprotein, (yeast) 1063 +/- 52 748 +/- 78 1102 +/- 32 926 +/- 140 -0.009003513 -0.282294484 0.015666919 0.292952341VEGF vascular endothelial growth factor 2713 +/- 90 2084 +/- 104 2439 +/- 134 2150 +/- 54 -0.001085404 -0.088853654 0.00811421 0.144813071VEZT vezatin, adherens junctions transmembrane protein 486 +/- 18 420 +/- 10 474 +/- 38 465 +/- 24 -0.012320014 -0.832441471 0.008056112 0.576774112VPS37A vacuolar protein sorting 37 homolog A (S. cerevisiae) 350 +/- 19 271 +/- 22 344 +/- 18 318 +/- 14 -0.022864292 -0.295474925 0.047238596 0.071244663WBSCR17 Williams-Beuren syndrome chromosome region 17 3846 +/- 222 2759 +/- 329 4476 +/- 273 3946 +/- 239 -0.023532811 -0.178057196 0.009503065 0.539811253WEE1 WEE1 homolog (S. pombe) 156 +/- 15 113 +/- 11 162 +/- 19 156 +/- 13 -0.043432583 -0.792522934 0.027429744 0.31484471YIPF5 Yip1 domain family, member 5 2776 +/- 72 2388 +/- 136 2883 +/- 102 2798 +/- 74 -0.037028446 -0.516929185 0.008488735 0.633725015YRDC yrdC domain containing (E. coli) 396 +/- 15 305 +/- 14 466 +/- 9 394 +/- 30 -0.001409124 -0.075638283 0.00273562 0.423805793ZC3H13 Zinc finger CCCH-type containing 13 2082 +/- 90 1605 +/- 162 1861 +/- 75 1362 +/- 193 -0.033399587 -0.058960157 0.01510726 0.01453634ZNF503 zinc finger protein 503 989 +/- 27 822 +/- 31 1260 +/- 34 1165 +/- 60 -0.002238555 -0.214355025 0.001712092 0.186621246ZNF527 zinc finger protein 527 174 +/- 9 109 +/- 12 181 +/- 11 142 +/- 18 -0.001325718 -0.106890278 0.038710439 0.463509012ZWINT ZW10 interactor 592 +/- 49 356 +/- 55 462 +/- 44 332 +/- 21 -0.009324758 -0.032175899 0.007406112 0.088879118Upregulated with Age and Correlated with MSI in DG RegionANKRD37 ankyrin repeat domain 37 571 +/- 66 630 +/- 24 455 +/- 38 593 +/- 37 0.432741945 0.027995366 0.412894238 0.018785119ANP32B acidic (leucine-rich) nuclear phosphoprotein 32 family, member B 5261 +/- 630 6605 +/- 629 4342 +/- 135 4863 +/- 137 0.162024543 0.024181775 0.065918043 0.032732518APBB1 amyloid beta (A4) precursor protein-binding, family B, member 1 (Fe65) 5027 +/- 303 5203 +/- 381 4570 +/- 115 4883 +/- 59 0.724592165 0.044144337 0.539062016 0.031690336APOA1BP apolipoprotein A-I binding protein 3444 +/- 146 3736 +/- 191 2627 +/- 74 3301 +/- 117 0.25395052 0.001861122 0.215036906 0.033290898
S4- MSI correlated and non-correlated ARGs.xls Page 15

Young vs Aged MSI CorrelationsSymbol Description Young CA Aged CA Young DG Aged DG in CA in DG in CA in DGAPOD apolipoprotein D 1694 +/- 156 2698 +/- 413 1143 +/- 60 1879 +/- 176 0.060518899 0.011046198 0.019968251 0.009951874ARHGEF2 rho/rac guanine nucleotide exchange factor (GEF) 2 667 +/- 82 848 +/- 50 714 +/- 18 958 +/- 49 0.093233964 0.00534307 0.103134121 0.022693676BTG4 B-cell translocation gene 4 106 +/- 9 193 +/- 31 105 +/- 8 196 +/- 11 0.035256012 0.000213402 0.093942226 0.005027946CCDC49 coiled-coil domain containing 49 276 +/- 18 313 +/- 20 246 +/- 12 319 +/- 21 0.202111398 0.01911797 0.097528639 0.047103103CCDC74A coiled-coil domain containing 74A 613 +/- 51 646 +/- 93 640 +/- 36 1150 +/- 118 0.764731904 0.010155303 0.43691184 0.007534103CCDC99 Coiled-coil domain containing 99 843 +/- 108 1220 +/- 192 518 +/- 27 688 +/- 24 0.125529209 0.00116804 0.042277227 0.024707287CD2BP2 CD2 (cytoplasmic tail) binding protein 2 434 +/- 27 533 +/- 24 382 +/- 9 508 +/- 28 0.022462219 0.007719463 0.191814082 0.022361307CD44 CD44 molecule (Indian blood group) 390 +/- 49 579 +/- 97 642 +/- 74 919 +/- 44 0.124377723 0.01296357 0.21306577 0.038642091CD58 CD58 molecule 179 +/- 17 277 +/- 45 140 +/- 9 195 +/- 13 0.084202317 0.010654824 0.017459327 0.005573134CHM choroideremia (Rab escort protein 1) 1904 +/- 130 2177 +/- 95 1862 +/- 132 2272 +/- 98 0.123267318 0.03547205 0.087660304 0.037080165CHST3 carbohydrate (chondroitin 6) sulfotransferase 3 639 +/- 84 773 +/- 125 385 +/- 5 482 +/- 26 0.39835933 0.019465109 0.175896944 0.044542366CLCC1 chloride channel CLIC-like 1 332 +/- 29 441 +/- 25 310 +/- 14 395 +/- 5 0.017994612 0.001144694 0.066524997 0.011344007CNDP1 carnosine dipeptidase 1 (metallopeptidase M20 family) 1872 +/- 548 3446 +/- 569 974 +/- 183 2032 +/- 172 0.074299685 0.002279399 0.043147819 0.006866974CNP 2',3'-cyclic nucleotide 3' phosphodiesterase 8116 +/- 1232 11141 +/- 2317 4506 +/- 307 5837 +/- 379 0.283978684 0.025495228 0.095452694 0.008006476COL1A2 collagen, type I, alpha 2 214 +/- 68 127 +/- 38 73 +/- 10 162 +/- 21 -0.292040139 0.010047955 0.103002646 0.018428844CPSF2 cleavage and polyadenylation specific factor 2, 100kDa 526 +/- 47 668 +/- 60 737 +/- 35 880 +/- 49 0.094333194 0.046656248 0.048092696 0.032414627CSTB cystatin B (stefin B) 6756 +/- 454 7724 +/- 450 6112 +/- 199 7133 +/- 147 0.161022131 0.002746244 0.261414852 0.040797159CUGBP2 CUG triplet repeat, RNA binding protein 2 1263 +/- 229 2289 +/- 319 1772 +/- 270 3161 +/- 347 0.028023032 0.01349226 0.240528635 0.044816364DBNDD2 dysbindin (dystrobrevin binding protein 1) domain containing 2 6719 +/- 435 8157 +/- 929 5664 +/- 297 6675 +/- 313 0.202988558 0.044247121 0.04992539 0.007616374DYM dymeclin 885 +/- 42 957 +/- 31 771 +/- 20 925 +/- 49 0.201292567 0.030224595 0.511550316 0.019298431ECD ecdysoneless homolog (Drosophila) 625 +/- 49 805 +/- 64 622 +/- 29 839 +/- 52 0.05185547 0.009973563 0.008062515 0.024874934EDF1 endothelial differentiation-related factor 1 2924 +/- 89 3195 +/- 140 2664 +/- 103 3111 +/- 63 0.139315885 0.006026401 0.052477922 0.002808541EDG2 endothelial differentiation, lysophosphatidic acid G-protein-coupled receptor, 2 5091 +/- 735 6481 +/- 945 2992 +/- 289 3972 +/- 198 0.274115823 0.022001652 0.052812676 0.027660984EIF3S7 eukaryotic translation initiation factor 3, subunit 7 zeta, 66/67kDa 2662 +/- 54 2791 +/- 67 2401 +/- 59 2691 +/- 31 0.165781836 0.002838447 0.286051699 0.005906782EIF4G3 eukaryotic translation initiation factor 4 gamma, 3 3958 +/- 161 4220 +/- 172 3636 +/- 92 4030 +/- 135 0.29217516 0.045357345 0.468616205 0.001540949FA2H fatty acid 2-hydroxylase 1088 +/- 162 1680 +/- 349 622 +/- 81 901 +/- 73 0.166860843 0.030926943 0.027447452 0.011595959FARP2 FERM, RhoGEF and pleckstrin domain protein 2 207 +/- 32 348 +/- 65 210 +/- 30 315 +/- 16 0.092947123 0.015546132 0.005267419 0.018364588FBLN1 fibulin 1 358 +/- 58 415 +/- 18 289 +/- 15 381 +/- 10 0.381766064 0.000673864 0.224958679 0.011025943FBP1 fructose-1,6-bisphosphatase 1 89 +/- 10 125 +/- 32 81 +/- 8 136 +/- 13 0.323201833 0.009196429 0.811673685 0.014497467FCER1G Fc fragment of IgE, high affinity I, receptor for; gamma polypeptide 283 +/- 30 393 +/- 40 195 +/- 12 277 +/- 15 0.054457432 0.002515946 0.032056759 0.00741832FEZ1 fasciculation and elongation protein zeta 1 (zygin I) 8114 +/- 604 9755 +/- 837 6969 +/- 218 8397 +/- 232 0.146056529 0.00163515 0.051189539 0.002001414FLII flightless I homolog (Drosophila) 1073 +/- 71 1217 +/- 48 871 +/- 23 1050 +/- 35 0.128484081 0.003355357 0.162496521 0.031848714FLJ25530 hepatocyte cell adhesion molecule 4362 +/- 359 5227 +/- 460 3822 +/- 130 4496 +/- 91 0.171005961 0.002411059 0.064663008 0.003095961FLJ41131 FLJ41131 protein 131 +/- 16 159 +/- 16 101 +/- 4 144 +/- 10 0.24715985 0.010711903 0.367893125 0.001668931FLNC filamin C, gamma (actin binding protein 280) 423 +/- 64 485 +/- 58 196 +/- 21 278 +/- 15 0.485099269 0.012306199 0.464470525 0.049669847FLT3 fms-related tyrosine kinase 3 200 +/- 23 262 +/- 27 110 +/- 9 165 +/- 6 0.121667713 0.000867473 0.16108864 0.042516895FOXO3A Forkhead box O3A 331 +/- 35 512 +/- 68 283 +/- 27 375 +/- 22 0.048674426 0.026860825 0.057457718 0.021827275FTSJ2 FtsJ homolog 2 (E. coli) 498 +/- 18 476 +/- 31 406 +/- 8 463 +/- 17 -0.54816672 0.027040346 0.154892688 0.031353995GFM1 G elongation factor, mitochondrial 1 175 +/- 15 233 +/- 22 216 +/- 6 265 +/- 11 0.063729251 0.006751872 0.172655706 0.000637894GMPS guanine monphosphate synthetase 570 +/- 45 619 +/- 27 438 +/- 20 530 +/- 21 0.377687094 0.011126804 0.436972827 0.040622754GOPC golgi associated PDZ and coiled-coil motif containing 462 +/- 34 622 +/- 43 560 +/- 32 730 +/- 26 0.015844249 0.002572784 0.067332845 0.008610876GPKOW G patch domain and KOW motifs 740 +/- 27 793 +/- 31 690 +/- 27 787 +/- 32 0.234900045 0.048299019 0.302033046 0.022966989HECTD2 HECT domain containing 2 1579 +/- 126 2196 +/- 109 1410 +/- 84 1984 +/- 71 0.004135061 0.000568656 0.080773087 0.041573814HEXDC hexosaminidase (glycosyl hydrolase family 20, catalytic domain) containing 148 +/- 17 180 +/- 18 173 +/- 20 274 +/- 24 0.22618189 0.011703808 0.446919739 0.006790846
S4- MSI correlated and non-correlated ARGs.xls Page 16

Young vs Aged MSI CorrelationsSymbol Description Young CA Aged CA Young DG Aged DG in CA in DG in CA in DGHIPK2 Homeodomain interacting protein kinase 2 13628 +/- 1528 17700 +/- 1910 8772 +/- 365 10920 +/- 395 0.12841218 0.003366906 0.012033369 0.002874401HKR2 GLI-Kruppel family member HKR2 186 +/- 15 198 +/- 14 187 +/- 10 237 +/- 13 0.583444126 0.017130869 0.930468698 0.018151489HLA-DPB1 major histocompatibility complex, class II, DP beta 1 275 +/- 55 485 +/- 42 153 +/- 53 409 +/- 56 0.013814114 0.009354973 0.103180322 0.024830136HNRPL heterogeneous nuclear ribonucleoprotein L 5232 +/- 292 6250 +/- 170 6161 +/- 225 7259 +/- 144 0.016730469 0.003234389 0.14241682 0.023284248HRASLS3 HRAS-like suppressor 3 3691 +/- 429 4571 +/- 653 2117 +/- 93 2770 +/- 179 0.290075953 0.017367553 0.12189474 0.015225861HS1BP3 HS1-binding protein 3 323 +/- 18 374 +/- 24 190 +/- 32 362 +/- 29 0.128946178 0.003199753 0.330957831 0.03315259IL13RA1 interleukin 13 receptor, alpha 1 147 +/- 22 136 +/- 18 121 +/- 7 176 +/- 7 -0.703974387 0.000283542 0.737928322 0.045423183IPO9 importin 9 1211 +/- 95 1365 +/- 81 1369 +/- 47 1573 +/- 68 0.243782177 0.042274605 0.274607502 0.003378761IVNS1ABP influenza virus NS1A binding protein 993 +/- 80 1097 +/- 80 745 +/- 17 848 +/- 36 0.378345922 0.043123029 0.270369883 0.002940165LASS2 LAG1 longevity assurance homolog 2 (S. cerevisiae) 1543 +/- 159 2019 +/- 247 1012 +/- 58 1354 +/- 79 0.14174194 0.008588905 0.014698451 0.016697618LIMS1 LIM and senescent cell antigen-like domains 1 815 +/- 63 1059 +/- 110 676 +/- 38 871 +/- 66 0.090147838 0.040072862 0.017402257 0.004815562LSM4 LSM4 homolog, U6 small nuclear RNA associated (S. cerevisiae) 1636 +/- 167 1825 +/- 54 1373 +/- 9 1750 +/- 75 0.320236054 0.007012113 0.495714106 0.003639407MAP4K5 mitogen-activated protein kinase kinase kinase kinase 5 695 +/- 83 1080 +/- 188 670 +/- 51 919 +/- 70 0.103657814 0.021575168 0.009082356 0.003570937MAPRE1 microtubule-associated protein, RP/EB family, member 1 1826 +/- 135 2236 +/- 182 1327 +/- 73 1595 +/- 31 0.103330607 0.012843845 0.022725514 0.028923787MAST4 microtubule associated serine/threonine kinase family member 4 163 +/- 7 143 +/- 21 168 +/- 2 203 +/- 10 -0.408933212 0.022907686 0.214095482 0.001821582MCAM melanoma cell adhesion molecule 1170 +/- 212 1662 +/- 293 589 +/- 48 817 +/- 61 0.207534483 0.018798175 0.088472398 0.031657183MCM3AP MCM3 minichromosome maintenance deficient 3 (S. cerevisiae) associated protein 113 +/- 18 175 +/- 17 138 +/- 12 186 +/- 14 0.034417289 0.029901837 0.139021258 0.017434983MFN2 mitofusin 2 4230 +/- 255 4976 +/- 285 3779 +/- 52 4823 +/- 275 0.080030538 0.017920767 0.228859693 0.015714214MRPL20 mitochondrial ribosomal protein L20 2020 +/- 172 2410 +/- 102 1610 +/- 52 1867 +/- 59 0.086342782 0.010571197 0.173913401 0.015138317MRPL54 mitochondrial ribosomal protein L54 455 +/- 104 726 +/- 46 610 +/- 107 982 +/- 113 0.049291972 0.041065514 0.054501423 0.04139206MRPS22 mitochondrial ribosomal protein S22 836 +/- 43 995 +/- 69 810 +/- 40 988 +/- 24 0.084501056 0.005432205 0.105056253 0.004363638MXI1 MAX interactor 1 6342 +/- 614 7312 +/- 652 4531 +/- 138 5071 +/- 166 0.30407088 0.03629269 0.110119976 0.03513731MYEOV2 myeloma overexpressed 2 11575 +/- 867 12859 +/- 629 9590 +/- 539 11808 +/- 395 0.260852182 0.009414064 0.388653459 0.034130899NCKIPSD NCK interacting protein with SH3 domain 1420 +/- 128 2242 +/- 157 1411 +/- 94 2164 +/- 111 0.002447617 0.000744802 0.093724422 0.031940681NDRG1 N-myc downstream regulated gene 1 6429 +/- 896 7904 +/- 978 4264 +/- 354 5467 +/- 340 0.292367088 0.036858064 0.141501528 0.025734988NDUFB8 NADH dehydrogenase (ubiquinone) 1 beta subcomplex, 8, 19kDa 11769 +/- 658 13321 +/- 391 9711 +/- 250 12186 +/- 194 0.076374256 2.96615E-05 0.311302957 0.018293507NIFUN NifU-like N-terminal domain containing 10519 +/- 373 10858 +/- 390 9520 +/- 257 10727 +/- 229 0.543420828 0.006639926 0.79585811 0.028525289NINJ2 ninjurin 2 672 +/- 49 990 +/- 158 361 +/- 35 494 +/- 25 0.104260321 0.014367225 0.010782712 0.03444998NOP17 NOP17 882 +/- 62 1108 +/- 85 828 +/- 45 1014 +/- 32 0.060040148 0.008849685 0.258957949 0.029022383NPC1 Niemann-Pick disease, type C1 1631 +/- 195 2450 +/- 429 909 +/- 54 1244 +/- 72 0.125565112 0.006001267 0.015047686 0.004993016NR2F1 Nuclear receptor subfamily 2, group F, member 1 3880 +/- 234 4227 +/- 278 4775 +/- 257 5717 +/- 210 0.362878868 0.019733476 0.649312745 0.043826958NRBP2 nuclear receptor binding protein 2 3166 +/- 354 3523 +/- 368 2980 +/- 110 3462 +/- 135 0.500961601 0.023661664 0.355251994 0.011977703NUP62 nucleoporin 62kDa 885 +/- 11 1158 +/- 43 1053 +/- 49 1241 +/- 35 0.000988177 0.012690922 0.069716696 0.04182895OGG1 8-oxoguanine DNA glycosylase 301 +/- 28 351 +/- 24 298 +/- 15 364 +/- 22 0.209517684 0.039467584 0.347236884 0.00046475OGN osteoglycin (osteoinductive factor, mimecan) 1651 +/- 630 839 +/- 341 397 +/- 58 709 +/- 94 -0.290932179 0.029188234 0.085982736 0.001225276OSBPL1A oxysterol binding protein-like 1A 5228 +/- 458 5797 +/- 389 3578 +/- 80 4173 +/- 148 0.366520276 0.011532966 0.309880559 0.005996347PB1 polybromo 1 2458 +/- 285 3086 +/- 101 2471 +/- 95 3125 +/- 70 0.081741937 0.000415029 0.13758296 0.00634582PCDHGB6 protocadherin gamma subfamily B, 6 4504 +/- 348 5671 +/- 569 2978 +/- 131 3473 +/- 103 0.116814424 0.01610839 0.074867716 0.044674878PCGF5 polycomb group ring finger 5 241 +/- 31 382 +/- 71 220 +/- 18 310 +/- 16 0.112898328 0.004382423 0.024573012 0.016707046PGAM1 phosphoglycerate mutase 1 (brain) 11785 +/- 417 13568 +/- 474 10224 +/- 320 12402 +/- 471 0.018304155 0.006017659 0.146932074 0.039091516PGAM2 phosphoglycerate mutase 2 (muscle) 175 +/- 19 219 +/- 19 163 +/- 19 222 +/- 6 0.125170277 0.024152411 0.121442235 0.049178303PIGZ phosphatidylinositol glycan, class Z 644 +/- 33 916 +/- 90 686 +/- 41 941 +/- 35 0.027433302 0.001051162 0.094046979 0.015991583PITPNC1 Phosphatidylinositol transfer protein, cytoplasmic 1 130 +/- 18 150 +/- 13 145 +/- 6 207 +/- 21 0.384142247 0.036598477 0.126519927 0.030402242PLA2G4C phospholipase A2, group IVC (cytosolic, calcium-independent) 321 +/- 37 368 +/- 21 312 +/- 19 375 +/- 20 0.310811668 0.048104443 0.80414807 0.048550323
S4- MSI correlated and non-correlated ARGs.xls Page 17

Young vs Aged MSI CorrelationsSymbol Description Young CA Aged CA Young DG Aged DG in CA in DG in CA in DGPLEKHB1 pleckstrin homology domain containing, family B (evectins) member 1 6842 +/- 885 9643 +/- 1345 4705 +/- 239 6453 +/- 287 0.117438066 0.001452148 0.025513329 0.005928906PLTP phospholipid transfer protein 1127 +/- 38 1268 +/- 54 1124 +/- 55 1435 +/- 28 0.062018148 0.001337345 0.017842124 0.031647432POLR2G polymerase (RNA) II (DNA directed) polypeptide G 1501 +/- 46 1883 +/- 158 1045 +/- 54 1288 +/- 36 0.060342218 0.005367014 0.02135662 0.038968732PPM1B protein phosphatase 1B (formerly 2C), magnesium-dependent, beta isoform 2968 +/- 253 3629 +/- 258 2741 +/- 80 2996 +/- 47 0.097261893 0.025430299 0.036772445 0.00983383PRDM2 PR domain containing 2, with ZNF domain 347 +/- 45 386 +/- 34 436 +/- 22 557 +/- 23 0.510514203 0.00400849 0.540143915 0.004554965PRSS21 protease, serine, 21 (testisin) 154 +/- 18 182 +/- 13 167 +/- 4 246 +/- 21 0.22769378 0.01911103 0.026257987 2.4539E-05PSMB4 proteasome (prosome, macropain) subunit, beta type, 4 3705 +/- 115 3631 +/- 124 3280 +/- 73 3573 +/- 83 -0.669068417 0.027906833 0.995437927 0.041657788PTDSS2 phosphatidylserine synthase 2 563 +/- 47 649 +/- 35 490 +/- 18 620 +/- 48 0.179105234 0.049206921 0.267643085 0.015072598PTPN21 Protein tyrosine phosphatase, non-receptor type 21 156 +/- 37 305 +/- 48 153 +/- 15 276 +/- 31 0.036045999 0.013348896 0.104382719 0.018237476PVALB parvalbumin 391 +/- 24 469 +/- 50 287 +/- 22 418 +/- 28 0.199547166 0.005841855 0.577157677 0.033436226RECQL5 RecQ protein-like 5 88 +/- 21 145 +/- 16 75 +/- 7 129 +/- 9 0.059387086 0.001052589 0.010148919 0.03932201RGS11 regulator of G-protein signalling 11 262 +/- 54 525 +/- 62 397 +/- 50 606 +/- 54 0.009410819 0.019498241 0.076190609 0.026970839RHOU ras homolog gene family, member U 2390 +/- 265 3326 +/- 556 1311 +/- 72 1705 +/- 52 0.171162106 0.001850475 0.02871214 0.002801328RICTOR rapamycin-insensitive companion of mTOR 2415 +/- 271 3115 +/- 219 2053 +/- 54 2477 +/- 109 0.073289041 0.013265709 0.061739465 0.00307475RIF1 RAP1 interacting factor homolog (yeast) 637 +/- 107 956 +/- 124 515 +/- 28 671 +/- 28 0.080334997 0.003329323 0.015631866 0.017656192RNASE4 ribonuclease, RNase A family, 4 204 +/- 17 250 +/- 22 133 +/- 12 240 +/- 28 0.132486179 0.015739107 0.285022576 0.002475872RNASEH1 ribonuclease H1 129 +/- 15 178 +/- 14 148 +/- 7 241 +/- 18 0.041606548 0.00463307 0.229431039 0.032545623RPESP RPE-spondin 216 +/- 36 219 +/- 54 370 +/- 37 509 +/- 43 0.956505713 0.036551267 0.721528508 0.017494422RPL30 ribosomal protein L30 15248 +/- 656 16050 +/- 750 15243 +/- 600 17322 +/- 644 0.439732192 0.043330173 0.616251572 0.023878632SCD5 stearoyl-CoA desaturase 5 15204 +/- 701 15897 +/- 556 13728 +/- 231 15363 +/- 292 0.45778559 0.002264217 0.312980261 0.046254337SCRN1 secernin 1 9838 +/- 238 10891 +/- 605 8473 +/- 141 10001 +/- 220 0.152799039 0.000635404 0.810288859 0.017126232SEC23B Sec23 homolog B (S. cerevisiae) 1038 +/- 61 1069 +/- 58 923 +/- 23 1057 +/- 33 0.717897621 0.010600432 0.77028712 0.015610918SEC61G Sec61 gamma subunit 2171 +/- 111 2251 +/- 109 1907 +/- 76 2224 +/- 48 0.617326901 0.007253404 0.725738304 0.04893153SERPIND1 serpin peptidase inhibitor, clade D (heparin cofactor), member 1 237 +/- 137 92 +/- 52 51 +/- 5 74 +/- 6 -0.356911899 0.023889551 0.129143378 0.030288553SETX senataxin 1154 +/- 76 1267 +/- 18 1110 +/- 19 1244 +/- 44 0.203689114 0.033305531 0.214133904 6.06149E-05SIN3B SIN3 homolog B, transcription regulator (yeast) 1456 +/- 63 1539 +/- 57 1516 +/- 56 1759 +/- 48 0.346477719 0.009402062 0.994184813 0.022693048SLC13A4 solute carrier family 13 (sodium/sulfate symporters), member 4 758 +/- 418 154 +/- 92 35 +/- 8 120 +/- 24 -0.212460871 0.019909476 0.227434885 0.00594441SLC15A3 solute carrier family 15, member 3 255 +/- 27 313 +/- 19 234 +/- 7 271 +/- 8 0.112498835 0.005854163 0.10311742 0.006223589SLC22A18 solute carrier family 22 (organic cation transporter), member 18 269 +/- 23 400 +/- 39 191 +/- 11 317 +/- 21 0.019838905 0.001619511 0.11369647 0.044955166SLC25A18 solute carrier family 25 (mitochondrial carrier), member 18 2127 +/- 291 3200 +/- 170 2193 +/- 184 3259 +/- 127 0.01291412 0.001186179 0.050441623 0.014997487SLC45A3 solute carrier family 45, member 3 194 +/- 24 304 +/- 46 108 +/- 28 201 +/- 22 0.067549211 0.027744422 0.044850369 0.022020153SLC5A11 solute carrier family 5 (sodium/glucose cotransporter), member 11 675 +/- 128 1122 +/- 169 389 +/- 31 607 +/- 40 0.063233045 0.002557526 0.050659734 0.012914146SNX9 sorting nexin 9 1081 +/- 34 1199 +/- 60 1155 +/- 37 1282 +/- 40 0.125106773 0.045267651 0.020086567 0.049494643SOHLH2 spermatogenesis and oogenesis specific basic helix-loop-helix 2 101 +/- 10 163 +/- 15 88 +/- 6 159 +/- 11 0.007052751 0.001346771 0.113962623 0.033681699SPINK2 serine peptidase inhibitor, Kazal type 2 (acrosin-trypsin inhibitor) 187 +/- 45 123 +/- 5 124 +/- 3 177 +/- 17 -0.21418252 0.03742661 0.316945269 0.020681757SRBD1 S1 RNA binding domain 1 122 +/- 36 182 +/- 29 85 +/- 6 173 +/- 17 0.229268598 0.004933397 0.17580218 0.002778312SRP19 signal recognition particle 19kDa 2698 +/- 166 3239 +/- 67 2572 +/- 101 3210 +/- 30 0.021094707 0.001032739 0.112768564 0.012163432ST8SIA3 ST8 alpha-N-acetyl-neuraminide alpha-2,8-sialyltransferase 3 2875 +/- 542 3178 +/- 335 2260 +/- 206 3420 +/- 132 0.6458159 0.001363044 0.860166309 0.034540252SURF1 surfeit 1 1906 +/- 52 2026 +/- 101 1667 +/- 86 1959 +/- 45 0.32405183 0.018134614 0.730804716 0.033267111TAF1B TATA box binding protein (TBP)-associated factor, RNA polymerase I, B, 63kDa 234 +/- 23 246 +/- 38 330 +/- 22 422 +/- 23 0.789191471 0.01950325 0.892131828 0.042500346TBC1D17 TBC1 domain family, member 17 1262 +/- 103 1539 +/- 80 1047 +/- 42 1261 +/- 39 0.061520457 0.004927262 0.085410185 0.042209106TF transferrin 7019 +/- 1463 9974 +/- 1622 4189 +/- 354 6128 +/- 572 0.206185233 0.02417124 0.113059721 0.010764522THNSL1 threonine synthase-like 1 (bacterial) 904 +/- 69 911 +/- 73 1077 +/- 20 1202 +/- 28 0.947204565 0.007607965 0.707473187 0.044875816TMED4 transmembrane emp24 protein transport domain containing 4 1134 +/- 55 1431 +/- 104 1087 +/- 50 1361 +/- 59 0.036499694 0.007200925 0.077299985 0.024735739
S4- MSI correlated and non-correlated ARGs.xls Page 18

Young vs Aged MSI CorrelationsSymbol Description Young CA Aged CA Young DG Aged DG in CA in DG in CA in DGTMEM87B Transmembrane protein 87B 96 +/- 30 190 +/- 26 87 +/- 22 198 +/- 10 0.039793595 0.002630566 0.180729609 0.020908784TNFAIP6 tumor necrosis factor, alpha-induced protein 6 258 +/- 31 467 +/- 111 161 +/- 13 251 +/- 29 0.122884819 0.031791821 0.01280199 0.043042898TNFSF13B tumor necrosis factor (ligand) superfamily, member 13b 429 +/- 38 458 +/- 44 416 +/- 30 552 +/- 32 0.634272516 0.013214316 0.36760737 0.023048356TNIP2 TNFAIP3 interacting protein 2 474 +/- 48 575 +/- 35 439 +/- 19 505 +/- 20 0.124972994 0.04206126 0.317968208 0.042891991TNXA tenascin XA pseudogene 497 +/- 80 915 +/- 160 295 +/- 39 476 +/- 26 0.05061517 0.004206738 0.009838066 0.007970109TSEN34 tRNA splicing endonuclease 34 homolog (S. cerevisiae) 991 +/- 52 1198 +/- 77 784 +/- 49 985 +/- 39 0.052950505 0.010934018 0.353018347 0.022477243TTBK2 Tau tubulin kinase 2 1287 +/- 128 1604 +/- 88 1035 +/- 99 1388 +/- 79 0.071933506 0.020980087 0.049383808 0.01207405UBE2G1 ubiquitin-conjugating enzyme E2G 1 (UBC7 homolog, yeast) 643 +/- 51 771 +/- 63 502 +/- 12 695 +/- 17 0.150032006 2.3432E-05 0.316364933 0.003208418USP14 ubiquitin specific peptidase 14 (tRNA-guanine transglycosylase) 1553 +/- 103 1788 +/- 135 1582 +/- 72 1981 +/- 114 0.198756158 0.021015637 0.28450932 0.001748003VTI1B vesicle transport through interaction with t-SNAREs homolog 1B (yeast) 3503 +/- 235 3273 +/- 106 2823 +/- 159 3297 +/- 104 -0.403886212 0.03646993 0.276102219 0.025734931WAC WW domain containing adaptor with coiled-coil 3946 +/- 99 4045 +/- 77 3700 +/- 73 4022 +/- 31 0.450134062 0.005533709 0.34289359 0.032309994WASPIP Wiskott-Aldrich syndrome protein interacting protein 453 +/- 53 836 +/- 159 339 +/- 48 483 +/- 31 0.061546427 0.036626616 0.005607277 0.036228076WDR25 WD repeat domain 25 360 +/- 15 348 +/- 18 272 +/- 4 365 +/- 15 -0.619300214 0.002078102 0.272477023 0.00340984WNT5A wingless-type MMTV integration site family, member 5A 485 +/- 51 763 +/- 107 574 +/- 90 877 +/- 81 0.050403523 0.03413742 0.005573256 0.017567726XTP3TPA XTP3-transactivated protein A 1242 +/- 57 1263 +/- 36 1182 +/- 54 1352 +/- 33 0.768388513 0.027719462 0.563452935 0.045011376ZNF323 zinc finger protein 323 162 +/- 15 187 +/- 22 236 +/- 13 296 +/- 17 0.368404035 0.023072962 0.684820285 0.023117495ZNF384 zinc finger protein 384 657 +/- 34 714 +/- 19 682 +/- 19 758 +/- 21 0.175514622 0.026242577 0.059700083 0.048969101ZNF561 zinc finger protein 561 444 +/- 41 512 +/- 38 329 +/- 24 397 +/- 16 0.249224449 0.046430515 0.617955954 0.044104515ZNF564 zinc finger protein 564 324 +/- 32 430 +/- 24 307 +/- 19 390 +/- 12 0.02532311 0.006175825 0.087713265 0.046735044ZYG11B Zyg-11 homolog B (C. elegans) 783 +/- 95 1096 +/- 114 916 +/- 54 1329 +/- 49 0.062752735 0.00030351 0.282315169 0.009115068Downregulated with Age and Correlated with MSI in DG RegionACO1 aconitase 1, soluble 964 +/- 82 811 +/- 43 950 +/- 45 803 +/- 46 -0.139533162 -0.048937589 0.118328259 0.028974705ALS2CR7 amyotrophic lateral sclerosis 2 (juvenile) chromosome region, candidate 7 167 +/- 14 134 +/- 8 171 +/- 14 126 +/- 13 -0.070816985 -0.048405733 0.06933312 0.00901095AP4E1 adaptor-related protein complex 4, epsilon 1 subunit 302 +/- 25 267 +/- 10 347 +/- 7 261 +/- 13 -0.231271577 -0.000873394 0.897469271 0.010348028ARHGAP21 Rho GTPase activating protein 21 696 +/- 46 796 +/- 50 840 +/- 34 715 +/- 22 0.175529423 -0.014325633 0.124542423 0.033989336ARHGEF11 Rho guanine nucleotide exchange factor (GEF) 11 658 +/- 70 564 +/- 45 969 +/- 43 769 +/- 57 -0.290212086 -0.023698091 0.254470245 0.049894591ARHGEF12 Rho guanine nucleotide exchange factor (GEF) 12 5718 +/- 162 5133 +/- 235 5709 +/- 82 5041 +/- 202 -0.07092767 -0.025744466 0.01647002 0.000352056ARMC2 armadillo repeat containing 2 247 +/- 26 192 +/- 9 249 +/- 6 220 +/- 6 -0.09735098 -0.008670542 0.110501317 0.002769445ASAHL N-acylsphingosine amidohydrolase (acid ceramidase)-like 157 +/- 9 116 +/- 12 192 +/- 21 128 +/- 16 -0.026696429 -0.03809744 0.059545479 0.032905844ASF1A ASF1 anti-silencing function 1 homolog A (S. cerevisiae) 389 +/- 32 477 +/- 23 500 +/- 19 435 +/- 10 0.053544301 -0.01673303 0.025333342 0.019574443B3GNT1 UDP-GlcNAc:betaGal beta-1,3-N-acetylglucosaminyltransferase 1 7168 +/- 286 6332 +/- 368 7310 +/- 119 6286 +/- 200 -0.105163388 -0.003594559 0.052310393 0.004419268BCL10 B-cell CLL/lymphoma 10 367 +/- 32 332 +/- 22 459 +/- 20 380 +/- 15 -0.39595478 -0.011414456 0.365470865 0.046034833BOP1 block of proliferation 1 292 +/- 18 210 +/- 26 357 +/- 15 258 +/- 9 -0.026404469 -0.000563916 0.093683447 0.002243383BRWD2 bromodomain and WD repeat domain containing 2 564 +/- 69 382 +/- 3 593 +/- 41 404 +/- 22 -0.046177058 -0.004233115 0.137620747 0.03576959BTBD6 BTB (POZ) domain containing 6 118 +/- 4 104 +/- 8 134 +/- 8 104 +/- 6 -0.158310164 -0.01535663 0.060607861 0.014502969BXDC5 brix domain containing 5 1465 +/- 71 1335 +/- 55 1579 +/- 58 1297 +/- 45 -0.179780032 -0.004050566 0.390284423 0.038802183CABYR calcium binding tyrosine-(Y)-phosphorylation regulated (fibrousheathin 2) 307 +/- 34 240 +/- 11 269 +/- 21 207 +/- 8 -0.109651154 -0.032138739 0.104909416 0.017114413CAMKK2 calcium/calmodulin-dependent protein kinase kinase 2, beta 2835 +/- 306 2109 +/- 116 2217 +/- 96 1716 +/- 125 -0.065711977 -0.01294662 0.016846478 0.027770538CAMTA1 calmodulin binding transcription activator 1 3071 +/- 288 2648 +/- 114 3284 +/- 169 2656 +/- 62 -0.218065498 -0.011942988 0.167893933 0.024531737CAST1 CAZ-associated structural protein 3281 +/- 360 2648 +/- 269 4391 +/- 181 3526 +/- 194 -0.191949962 -0.010196399 0.208325984 0.027611856CBL Cas-Br-M (murine) ecotropic retroviral transforming sequence 1129 +/- 118 865 +/- 92 1148 +/- 81 844 +/- 74 -0.109052861 -0.021736039 0.131433734 0.010293181CCDC86 coiled-coil domain containing 86 471 +/- 31 440 +/- 12 478 +/- 9 411 +/- 12 -0.386079118 -0.00223735 0.340722199 0.02763245CCDC95 coiled-coil domain containing 95 936 +/- 37 859 +/- 28 1082 +/- 28 950 +/- 21 -0.126820418 -0.004763446 0.048753731 0.004658878CD47 CD47 molecule 2438 +/- 231 1877 +/- 56 2572 +/- 107 2131 +/- 78 -0.059507365 -0.009185599 0.174884579 0.011047274
S4- MSI correlated and non-correlated ARGs.xls Page 19

Young vs Aged MSI CorrelationsSymbol Description Young CA Aged CA Young DG Aged DG in CA in DG in CA in DGCDH24 cadherin-like 24 969 +/- 98 925 +/- 70 890 +/- 56 690 +/- 25 -0.72626634 -0.014012972 0.643691656 0.00863681CKLF chemokine-like factor 686 +/- 32 579 +/- 45 611 +/- 22 492 +/- 40 -0.086705955 -0.03746472 0.204254667 0.01971039CNOT1 CCR4-NOT transcription complex, subunit 1 385 +/- 33 315 +/- 9 372 +/- 26 289 +/- 15 -0.091372506 -0.022822616 0.166544504 0.043704445CRKL v-crk sarcoma virus CT10 oncogene homolog (avian)-like 1767 +/- 44 1717 +/- 67 1489 +/- 11 1401 +/- 15 -0.547481024 -0.001864775 0.992944647 0.009254949CXADR Coxsackie virus and adenovirus receptor 2582 +/- 321 1752 +/- 139 2109 +/- 65 1507 +/- 97 -0.050205294 -0.001210434 0.044368516 0.013285592DGCR6 DiGeorge syndrome critical region gene 6 979 +/- 27 906 +/- 45 1037 +/- 42 905 +/- 24 -0.196473797 -0.026267963 0.197307323 0.039225271DMRTA2 DMRT-like family A2 171 +/- 21 95 +/- 12 262 +/- 37 117 +/- 11 -0.012484468 -0.009962376 0.053396251 0.020967938DZIP1L DAZ interacting protein 1-like 133 +/- 14 134 +/- 14 213 +/- 16 147 +/- 7 0.975474003 -0.006560686 0.947943297 0.010398451E2F3 E2F transcription factor 3 813 +/- 106 594 +/- 60 697 +/- 22 526 +/- 21 -0.111153911 -0.000358899 0.088442088 0.027741493EDG1 endothelial differentiation, sphingolipid G-protein-coupled receptor, 1 2404 +/- 126 2634 +/- 244 2878 +/- 139 2330 +/- 117 0.429359478 -0.014496804 0.449591648 0.017653786EDG4 endothelial differentiation, lysophosphatidic acid G-protein-coupled receptor, 4 173 +/- 16 166 +/- 12 211 +/- 12 168 +/- 8 -0.730365874 -0.014332489 0.875528657 0.01041439EMX2 empty spiracles homolog 2 (Drosophila) 860 +/- 116 836 +/- 85 1476 +/- 75 1238 +/- 46 -0.874805619 -0.02744569 0.900047991 0.008143109FANCM Fanconi anemia, complementation group M 187 +/- 20 162 +/- 14 232 +/- 6 158 +/- 16 -0.347210725 -0.007508077 0.511435978 0.019788744FBXL14 F-box and leucine-rich repeat protein 14 1117 +/- 114 749 +/- 52 1272 +/- 40 979 +/- 38 -0.022120684 -0.000484356 0.075790002 0.03101781FBXL3 F-box and leucine-rich repeat protein 3 2062 +/- 73 1887 +/- 100 2305 +/- 53 1970 +/- 46 -0.188586335 -0.000995486 0.153869078 0.00554673FRMD4A FERM domain containing 4A 926 +/- 37 796 +/- 36 829 +/- 20 663 +/- 39 -0.03071271 -0.008664546 0.131708592 0.03971463FSTL5 follistatin-like 5 790 +/- 173 669 +/- 70 1194 +/- 114 623 +/- 58 -0.537903012 -0.002692209 0.493975466 0.040086607FUBP3 far upstream element (FUSE) binding protein 3 1363 +/- 127 1472 +/- 64 1328 +/- 43 1188 +/- 31 0.466008088 -0.026881377 0.273425732 0.025197501FUT1 Fucosyltransferase 1 (galactoside 2-alpha-L-fucosyltransferase, H blood group) 147 +/- 13 121 +/- 9 139 +/- 12 91 +/- 13 -0.13608644 -0.025097769 0.047727092 0.046486155GABPA GA binding protein transcription factor, alpha subunit 60kDa 387 +/- 45 419 +/- 22 469 +/- 23 342 +/- 6 0.539252935 -0.001907202 0.438207969 0.026895072GABRG3 gamma-aminobutyric acid (GABA) A receptor, gamma 3 83 +/- 11 74 +/- 14 144 +/- 6 100 +/- 6 -0.596888482 -0.0007611 0.435085853 0.000653098GCAT glycine C-acetyltransferase (2-amino-3-ketobutyrate coenzyme A ligase) 417 +/- 20 365 +/- 15 436 +/- 24 357 +/- 20 -0.071902485 -0.031788882 0.038505465 0.027924141GCDH glutaryl-Coenzyme A dehydrogenase 441 +/- 27 371 +/- 17 418 +/- 24 317 +/- 19 -0.058952003 -0.009161825 0.030313498 0.000266268GLI2 GLI-Kruppel family member GLI2 129 +/- 11 140 +/- 14 176 +/- 10 134 +/- 12 0.529673015 -0.024783634 0.377824723 0.001239906GNMT glycine N-methyltransferase 171 +/- 11 138 +/- 16 174 +/- 20 111 +/- 11 -0.1268625 -0.024455407 0.255939058 0.02820895GPR135 G protein-coupled receptor 135 154 +/- 8 126 +/- 19 203 +/- 9 163 +/- 8 -0.219929893 -0.012068476 0.509664873 0.021092649GPR68 G protein-coupled receptor 68 143 +/- 27 149 +/- 7 197 +/- 12 151 +/- 16 0.844866887 -0.046931273 0.671536238 0.002239928GTF2H5 general transcription factor IIH, polypeptide 5 1686 +/- 106 1502 +/- 113 1400 +/- 61 1199 +/- 50 -0.26041326 -0.030987164 0.28976154 0.022631442H1F0 H1 histone family, member 0 1586 +/- 121 1504 +/- 164 1458 +/- 52 1178 +/- 25 -0.696287292 -0.0017378 0.435790097 0.008792147H3F3A H3 histone, family 3A 1040 +/- 71 1128 +/- 59 1218 +/- 63 874 +/- 46 0.363583244 -0.001899474 0.179446199 0.013289081HAGHL hydroxyacylglutathione hydrolase-like 559 +/- 53 491 +/- 35 436 +/- 21 337 +/- 5 -0.315099027 -0.00458053 0.402572973 0.014557226HERC2P7 hect domain and RLD 2 pseudogene 7 170 +/- 14 126 +/- 21 225 +/- 17 160 +/- 19 -0.114895387 -0.033002361 0.110835988 0.013091111HES1 hairy and enhancer of split 1, (Drosophila) 395 +/- 33 353 +/- 23 461 +/- 26 352 +/- 18 -0.327046892 -0.00802582 0.352841693 0.028114345HES5 hairy and enhancer of split 5 (Drosophila) 714 +/- 104 558 +/- 31 840 +/- 53 603 +/- 61 -0.201518408 -0.017729321 0.181154127 0.010706611HMGCS2 3-hydroxy-3-methylglutaryl-Coenzyme A synthase 2 (mitochondrial) 244 +/- 51 182 +/- 18 480 +/- 52 240 +/- 77 -0.292635533 -0.035266431 0.585195934 0.034101857ITCH itchy homolog E3 ubiquitin protein ligase (mouse) 198 +/- 29 78 +/- 10 178 +/- 21 75 +/- 12 -0.007101125 -0.002594673 0.06165396 0.02277359KBTBD3 kelch repeat and BTB (POZ) domain containing 3 245 +/- 17 231 +/- 14 224 +/- 11 186 +/- 9 -0.559314414 -0.027498256 0.880329743 0.044575316KCNA5 potassium voltage-gated channel, shaker-related subfamily, member 5 160 +/- 33 140 +/- 13 180 +/- 11 124 +/- 7 -0.581877056 -0.00230911 0.975166744 0.032232243KCNK2 potassium channel, subfamily K, member 2 130 +/- 38 100 +/- 18 109 +/- 11 75 +/- 3 -0.483792884 -0.022770232 0.25719599 0.029869355KIAA1559 mouse zinc finger protein 14-like 130 +/- 17 122 +/- 12 158 +/- 9 116 +/- 6 -0.731878664 -0.003437313 0.596634941 0.016257438KIF21A kinesin family member 21A 3821 +/- 217 2757 +/- 229 4422 +/- 302 3119 +/- 95 -0.007042682 -0.006370346 0.063541337 0.033469949KIF21B kinesin family member 21B 3015 +/- 342 2089 +/- 271 2816 +/- 158 2164 +/- 78 -0.060922803 -0.007346141 0.07265647 0.021005535KIF26B kinesin family member 26B 192 +/- 20 165 +/- 9 221 +/- 16 158 +/- 13 -0.24778855 -0.012319096 0.100888922 0.042473042KLHL21 kelch-like 21 (Drosophila) 1952 +/- 122 1902 +/- 103 1702 +/- 32 1533 +/- 45 -0.762969473 -0.016512575 0.790832399 0.008625901
S4- MSI correlated and non-correlated ARGs.xls Page 20

Young vs Aged MSI CorrelationsSymbol Description Young CA Aged CA Young DG Aged DG in CA in DG in CA in DGKua ubiquitin-conjugating enzyme variant Kua 968 +/- 77 876 +/- 70 858 +/- 38 702 +/- 42 -0.400916153 -0.022811901 0.675509359 0.020384394LCN6 lipocalin 6 288 +/- 28 285 +/- 19 344 +/- 14 251 +/- 22 -0.929214387 -0.009156691 0.561889378 0.041143436LENG9 leukocyte receptor cluster (LRC) member 9 234 +/- 30 234 +/- 18 289 +/- 10 218 +/- 13 0.994327856 -0.003088573 0.868656502 0.014513834LRFN5 Leucine rich repeat and fibronectin type III domain containing 5 378 +/- 17 288 +/- 38 451 +/- 36 256 +/- 16 -0.066662424 -0.001745997 0.041556395 0.032559101LRRC37B leucine rich repeat containing 37B 85 +/- 12 114 +/- 6 139 +/- 7 97 +/- 7 0.06336265 -0.002602785 0.15913679 0.019178527LRRN1 leucine rich repeat neuronal 1 2089 +/- 141 1602 +/- 137 2532 +/- 162 1964 +/- 83 -0.032954458 -0.015981412 0.054387151 0.048776003LRRN3 leucine rich repeat neuronal 3 1738 +/- 84 1547 +/- 86 1796 +/- 57 1379 +/- 50 -0.142278448 -0.000374981 0.325883982 0.007219934MAP3K3 mitogen-activated protein kinase kinase kinase 3 365 +/- 26 320 +/- 15 396 +/- 23 317 +/- 17 -0.17909429 -0.021845319 0.13885626 0.045208597MEIS3P1 Meis1 homolog 3 (mouse) pseudogene 1 175 +/- 34 118 +/- 10 239 +/- 25 167 +/- 18 -0.158736701 -0.04382298 0.217601651 0.006329832MGLL monoglyceride lipase 886 +/- 65 790 +/- 40 920 +/- 52 666 +/- 35 -0.240520361 -0.003362636 0.167516032 0.01555855MLL5 myeloid/lymphoid or mixed-lineage leukemia 5 (trithorax homolog, Drosophila) 1973 +/- 306 931 +/- 182 2063 +/- 365 760 +/- 108 -0.018738458 -0.014618871 0.060188689 0.038757976MTHFD2L methylenetetrahydrofolate dehydrogenase (NADP+ dependent) 2-like 641 +/- 53 440 +/- 16 569 +/- 21 415 +/- 23 -0.01097374 -0.000813626 0.082986138 0.023699547NDUFC1 NADH dehydrogenase (ubiquinone) 1, subcomplex unknown, 1, 6kDa 6197 +/- 241 5433 +/- 247 6237 +/- 149 5646 +/- 145 -0.051220242 -0.019430544 0.032925781 0.032652068NDUFS2 NADH dehydrogenase (ubiquinone) Fe-S protein 2, 49kDa (NADH-coenzyme Q reductase) 2696 +/- 97 2386 +/- 111 2750 +/- 69 2421 +/- 74 -0.062112303 -0.010541112 0.022389632 0.012268038NUDT4 nudix (nucleoside diphosphate linked moiety X)-type motif 4 341 +/- 23 281 +/- 33 505 +/- 25 364 +/- 47 -0.167954878 -0.036215189 0.209635105 0.049616983NUPL2 nucleoporin like 2 194 +/- 5 182 +/- 13 206 +/- 12 164 +/- 7 -0.454049599 -0.015258117 0.76688643 0.007473306OR2C1 olfactory receptor, family 2, subfamily C, member 1 141 +/- 10 140 +/- 11 189 +/- 16 125 +/- 15 -0.916288725 -0.01456367 0.843650052 0.024324144OSBPL11 oxysterol binding protein-like 11 1537 +/- 69 1374 +/- 41 1376 +/- 35 1266 +/- 31 -0.075652466 -0.044284612 0.069451149 0.014633575P2RY12 purinergic receptor P2Y, G-protein coupled, 12 1248 +/- 88 1177 +/- 79 1077 +/- 48 848 +/- 66 -0.565026354 -0.023701167 0.997265738 0.03888809PCDH1 protocadherin 1 (cadherin-like 1) 178 +/- 17 162 +/- 12 240 +/- 16 186 +/- 15 -0.439022235 -0.039922414 0.152628129 0.025625709PCDHB14 protocadherin beta 14 224 +/- 13 229 +/- 9 342 +/- 16 269 +/- 6 0.732190254 -0.004446946 0.213537685 0.033346171PCID2 PCI domain containing 2 422 +/- 26 371 +/- 24 406 +/- 11 289 +/- 11 -0.183262368 -4.09472E-05 0.083305397 0.006369602PDDC1 Parkinson disease 7 domain containing 1 828 +/- 44 710 +/- 44 853 +/- 30 700 +/- 27 -0.08489584 -0.003948275 0.165316571 0.006908681PDIA4 protein disulfide isomerase family A, member 4 1106 +/- 38 1038 +/- 64 1073 +/- 53 906 +/- 43 -0.38769338 -0.038212729 0.578389301 0.028982556PGM2L1 phosphoglucomutase 2-like 1 4422 +/- 615 3043 +/- 130 4291 +/- 170 3223 +/- 103 -0.075239597 -0.000673798 0.037639834 0.003504682PLEKHA5 Pleckstrin homology domain containing, family A member 5 566 +/- 51 398 +/- 55 952 +/- 56 599 +/- 55 -0.048982668 -0.001487041 0.094460525 0.045348518PLSCR4 phospholipid scramblase 4 292 +/- 36 311 +/- 25 313 +/- 18 251 +/- 17 0.673124243 -0.032128171 0.34148705 0.020808072PNCK pregnancy upregulated non-ubiquitously expressed CaM kinase 583 +/- 36 459 +/- 43 769 +/- 37 629 +/- 37 -0.052096118 -0.02638636 0.021366191 0.018621328PPARG Peroxisome proliferative activated receptor, gamma 118 +/- 5 118 +/- 16 156 +/- 13 117 +/- 8 -0.977405063 -0.035008151 0.839520124 0.022127059PPP2R5C protein phosphatase 2, regulatory subunit B (B56), gamma isoform 1380 +/- 94 967 +/- 75 1220 +/- 33 860 +/- 51 -0.006726147 -0.000552639 0.108054221 0.023206134PRPF39 PRP39 pre-mRNA processing factor 39 homolog (S. cerevisiae) 398 +/- 54 361 +/- 33 488 +/- 33 340 +/- 41 -0.571760018 -0.023066137 0.945513991 0.017866758PTMS parathymosin 564 +/- 27 451 +/- 59 772 +/- 43 611 +/- 28 -0.124459707 -0.013133005 0.103638104 0.020026595RAB21 RAB21, member RAS oncogene family 670 +/- 41 691 +/- 68 764 +/- 30 643 +/- 32 0.800378023 -0.022052128 0.294700283 0.011332116RAPGEF1 Rap guanine nucleotide exchange factor (GEF) 1 616 +/- 50 396 +/- 101 775 +/- 26 416 +/- 82 -0.091584319 -0.009500164 0.072240963 0.003969325RASGRF1 Ras protein-specific guanine nucleotide-releasing factor 1 125 +/- 16 76 +/- 11 145 +/- 12 104 +/- 10 -0.031471125 -0.025192212 0.075248629 0.025369786RBM8A RNA binding motif protein 8A 1042 +/- 66 948 +/- 45 1249 +/- 91 986 +/- 63 -0.27077218 -0.0428241 0.208288057 0.032911939RCOR3 REST corepressor 3 986 +/- 96 990 +/- 27 1072 +/- 16 989 +/- 23 0.97249016 -0.020621067 0.714510185 0.009122733RECK reversion-inducing-cysteine-rich protein with kazal motifs 328 +/- 29 364 +/- 13 406 +/- 21 327 +/- 12 0.303705244 -0.011967506 0.384147858 0.044990116RFT1 RFT1 homolog (S. cerevisiae) 144 +/- 6 123 +/- 7 159 +/- 9 123 +/- 5 -0.053411546 -0.009489794 0.11623316 0.018399732RNF187 ring finger protein 187 4466 +/- 174 4113 +/- 168 4156 +/- 120 3630 +/- 66 -0.175608613 -0.005496012 0.03837654 0.030964401RNGTT RNA guanylyltransferase and 5'-phosphatase 1248 +/- 42 1197 +/- 32 1228 +/- 26 1129 +/- 20 -0.358665991 -0.015550294 0.217333307 0.025078609RPL15 Ribosomal protein L15 201 +/- 25 146 +/- 14 188 +/- 13 126 +/- 10 -0.091943479 -0.005182342 0.136520664 0.008485474SAMD1 sterile alpha motif domain containing 1 363 +/- 22 312 +/- 35 561 +/- 23 439 +/- 31 -0.249772239 -0.01380424 0.215017343 0.015394941SCYE1 small inducible cytokine subfamily E, member 1 (endothelial monocyte-activating) 1313 +/- 43 1283 +/- 31 1364 +/- 27 1259 +/- 16 -0.585045499 -0.009864912 0.670894991 0.032153635
S4- MSI correlated and non-correlated ARGs.xls Page 21

Young vs Aged MSI CorrelationsSymbol Description Young CA Aged CA Young DG Aged DG in CA in DG in CA in DGSDHC succinate dehydrogenase complex, subunit C, integral membrane protein, 15kDa 1763 +/- 91 1634 +/- 45 1610 +/- 52 1461 +/- 35 -0.24292388 -0.043666702 0.274680792 0.025762003SEC61A1 Sec61 alpha 1 subunit (S. cerevisiae) 320 +/- 43 269 +/- 28 351 +/- 21 276 +/- 12 -0.34041934 -0.01454606 0.389987136 0.008682927SEPT11 Septin 11 2461 +/- 262 1813 +/- 192 2281 +/- 37 1816 +/- 76 -0.076742119 -0.001580166 0.111726301 0.042381075SF3A3 Splicing factor 3a, subunit 3, 60kDa 3426 +/- 274 2814 +/- 133 2964 +/- 63 2412 +/- 70 -0.082987624 -0.000277917 0.019385298 0.005249531SFRS7 splicing factor, arginine/serine-rich 7, 35kDa 2011 +/- 79 1722 +/- 78 1994 +/- 57 1707 +/- 55 -0.026627131 -0.005697307 0.056949117 0.011437644SGEF Src homology 3 domain-containing guanine nucleotide exchange factor 828 +/- 77 772 +/- 31 904 +/- 53 676 +/- 59 -0.51892981 -0.018969929 0.804508372 0.006115158SIRT6 sirtuin (silent mating type information regulation 2 homolog) 6 (S. cerevisiae) 255 +/- 17 215 +/- 16 279 +/- 15 203 +/- 7 -0.116655852 -0.002473305 0.053182402 0.001577501SLC16A14 solute carrier family 16 (monocarboxylic acid transporters), member 14 1075 +/- 41 1004 +/- 75 1195 +/- 34 1038 +/- 52 -0.435971749 -0.039110304 0.488569168 0.029048522SLC1A4 solute carrier family 1 (glutamate/neutral amino acid transporter), member 4 3466 +/- 213 3097 +/- 143 3093 +/- 119 2554 +/- 111 -0.185180746 -0.00914134 0.09940615 0.019467187SLC24A5 Solute carrier family 24, member 5 1183 +/- 81 1115 +/- 57 1455 +/- 56 1211 +/- 48 -0.514492674 -0.008948511 0.359875535 0.003277142SLCO1C1 solute carrier organic anion transporter family, member 1C1 525 +/- 72 446 +/- 45 404 +/- 18 280 +/- 27 -0.380551931 -0.00631492 0.583153647 0.039576717SOX1 SRY (sex determining region Y)-box 1 375 +/- 39 272 +/- 18 455 +/- 28 336 +/- 23 -0.050160547 -0.010004196 0.137008855 0.008571145SPA17 sperm autoantigenic protein 17 537 +/- 65 330 +/- 45 443 +/- 23 329 +/- 17 -0.027597301 -0.0033444 0.094748997 0.03123644SPSB3 splA/ryanodine receptor domain and SOCS box containing 3 474 +/- 49 493 +/- 23 461 +/- 22 396 +/- 17 0.726656483 -0.049145797 0.743619093 0.033496864SRCAP Snf2-related CBP activator protein 190 +/- 10 242 +/- 8 232 +/- 5 203 +/- 9 0.002225566 -0.025473729 0.012583108 0.036958657SYNJ2BP Synaptojanin 2 binding protein 752 +/- 43 787 +/- 33 1031 +/- 19 944 +/- 14 0.539353517 -0.005859176 0.184654643 0.012815765TADA1L transcriptional adaptor 1 (HFI1 homolog, yeast)-like 1627 +/- 54 1500 +/- 42 1705 +/- 66 1508 +/- 31 -0.095763786 -0.030645013 0.385538987 0.048167039TASP1 taspase, threonine aspartase, 1 270 +/- 19 225 +/- 18 323 +/- 12 254 +/- 14 -0.113117972 -0.005654167 0.068073676 0.049418893TBCE tubulin-specific chaperone e 1108 +/- 25 1090 +/- 54 1222 +/- 53 1055 +/- 42 -0.76351252 -0.035533135 0.766784152 0.014240059TCFL5 transcription factor-like 5 (basic helix-loop-helix) 2337 +/- 183 1879 +/- 150 2593 +/- 180 1960 +/- 48 -0.082168467 -0.015833988 0.297969994 0.027309452TLK1 tousled-like kinase 1 109 +/- 15 104 +/- 11 155 +/- 15 108 +/- 11 -0.81754403 -0.029834017 0.496871032 0.04853314TMBIM4 transmembrane BAX inhibitor motif containing 4 1977 +/- 143 2256 +/- 151 2223 +/- 85 1815 +/- 95 0.210502634 -0.011327121 0.092182682 0.040954316TMEM133 transmembrane protein 133 206 +/- 30 171 +/- 21 278 +/- 7 172 +/- 19 -0.363117639 -0.003540306 0.263370834 0.020832555TMEM50A transmembrane protein 50A 3252 +/- 47 2957 +/- 223 4076 +/- 139 3448 +/- 34 -0.248077685 -0.005474556 0.466680172 0.025314031TMEM64 Transmembrane protein 64 338 +/- 27 289 +/- 14 377 +/- 21 301 +/- 16 -0.146266474 -0.020924788 0.294943751 0.007329293TOP1MT topoisomerase (DNA) I, mitochondrial 381 +/- 24 369 +/- 14 378 +/- 17 328 +/- 12 -0.659271799 -0.038397811 0.836729244 0.036522943TOR3A torsin family 3, member A 298 +/- 17 220 +/- 15 308 +/- 11 206 +/- 13 -0.006223971 -0.000302833 0.067683608 0.001767536TRA2A transformer-2 alpha 1956 +/- 84 1639 +/- 102 2458 +/- 104 1919 +/- 80 -0.038510101 -0.002776761 0.316371608 0.022918967TRAF3 TNF receptor-associated factor 3 1143 +/- 89 1002 +/- 66 1473 +/- 46 1224 +/- 60 -0.233135856 -0.011176866 0.193720961 0.047628942TRAFD1 TRAF-type zinc finger domain containing 1 1185 +/- 77 1021 +/- 41 913 +/- 16 812 +/- 32 -0.098765207 -0.028756386 0.270577645 0.047654431TRIM2 tripartite motif-containing 2 134 +/- 28 96 +/- 14 147 +/- 12 92 +/- 9 -0.251682401 -0.005939648 0.392827748 0.023035281TRIM72 tripartite motif-containing 72 123 +/- 14 108 +/- 18 125 +/- 21 67 +/- 8 -0.549455064 -0.039728145 0.856258507 0.046664767TUBGCP5 tubulin, gamma complex associated protein 5 697 +/- 50 478 +/- 121 647 +/- 36 371 +/- 78 -0.139882002 -0.020016876 0.317303354 0.037428091UBE2J1 ubiquitin-conjugating enzyme E2, J1 (UBC6 homolog, yeast) 447 +/- 25 412 +/- 15 587 +/- 24 472 +/- 9 -0.256294667 -0.003565631 0.136324691 0.017011644UBR1 ubiquitin protein ligase E3 component n-recognin 1 655 +/- 48 599 +/- 38 837 +/- 25 692 +/- 31 -0.387825401 -0.00632613 0.393551965 0.006819937UCK1 uridine-cytidine kinase 1 1401 +/- 163 1218 +/- 106 1046 +/- 54 836 +/- 69 -0.371207141 -0.042779758 0.477968251 0.032720888UTP14C UTP14, U3 small nucleolar ribonucleoprotein, homolog C (yeast) 1372 +/- 46 1224 +/- 51 1428 +/- 32 1176 +/- 49 -0.056118622 -0.003609568 0.210345207 0.027890428VAPA VAMP (vesicle-associated membrane protein)-associated protein A, 33kDa 11082 +/- 381 9798 +/- 151 10132 +/- 197 8992 +/- 317 -0.018084373 -0.018773793 0.114900856 0.004102026WAS Wiskott-Aldrich syndrome (eczema-thrombocytopenia) 214 +/- 11 177 +/- 8 239 +/- 10 176 +/- 17 -0.021343083 -0.016448585 0.11705994 0.003993011WDR36 WD repeat domain 36 210 +/- 17 205 +/- 18 260 +/- 9 213 +/- 15 -0.841737844 -0.03709588 0.936279917 0.046643626XPO5 exportin 5 429 +/- 36 342 +/- 18 461 +/- 21 383 +/- 24 -0.066394218 -0.040657039 0.216975537 0.026211771ZNF142 zinc finger protein 142 (clone pHZ-49) 769 +/- 26 723 +/- 22 760 +/- 22 633 +/- 26 -0.217210881 -0.005034118 0.471469704 0.037953722ZNF16 zinc finger protein 16 568 +/- 69 420 +/- 40 479 +/- 21 350 +/- 25 -0.099141249 -0.004058845 0.227598526 0.001339729ZNF304 zinc finger protein 304 417 +/- 19 402 +/- 10 433 +/- 15 375 +/- 12 -0.484142912 -0.014961524 0.39629422 0.004852035
S4- MSI correlated and non-correlated ARGs.xls Page 22

Young vs Aged MSI CorrelationsSymbol Description Young CA Aged CA Young DG Aged DG in CA in DG in CA in DGZNF342 zinc finger protein 342 170 +/- 21 134 +/- 18 176 +/- 17 96 +/- 14 -0.232630509 -0.004719813 0.281206822 0.003070648ZNF436 zinc finger protein 436 845 +/- 77 754 +/- 83 1185 +/- 39 1061 +/- 36 -0.443220789 -0.045876934 0.448246883 0.015784252ZNF529 zinc finger protein 529 1055 +/- 71 885 +/- 61 1009 +/- 20 833 +/- 33 -0.101266016 -0.00309501 0.113981961 0.002419191Upregulated with Age in Both Regions, not MSI CorrelatedACTC actin, alpha, cardiac muscle 84 +/- 15 206 +/- 35 98 +/- 11 212 +/- 35 0.015564453 0.02973628 0.098010841 0.165795281ACTR10 actin-related protein 10 homolog (S. cerevisiae) 6172 +/- 108 6822 +/- 248 6301 +/- 210 7510 +/- 229 0.048300301 0.003988195 0.590192181 0.084527105ADCK4 aarF domain containing kinase 4 430 +/- 24 546 +/- 40 383 +/- 31 503 +/- 38 0.037411918 0.039519137 0.273091814 0.306370996ALDH3A1 aldehyde dehydrogenase 3 family, memberA1 99 +/- 11 267 +/- 57 115 +/- 22 357 +/- 54 0.031714621 0.008136205 0.140583247 0.129873586AMY1A amylase, alpha 1A; salivary 217 +/- 46 706 +/- 123 210 +/- 34 692 +/- 108 0.008648671 0.00879563 0.208529984 0.155361317ANKH ankylosis, progressive homolog (mouse) 2365 +/- 119 2794 +/- 121 2527 +/- 92 2834 +/- 84 0.030335857 0.035777518 0.166489153 0.306504297ARHGAP1 Rho GTPase activating protein 1 2732 +/- 133 3160 +/- 91 2618 +/- 114 2959 +/- 91 0.026130162 0.045361642 0.13775446 0.424521136AURKAIP1 aurora kinase A interacting protein 1 1086 +/- 137 1595 +/- 169 1097 +/- 103 1678 +/- 137 0.042673648 0.009991978 0.163010822 0.071334126CAPN2 calpain 2, (m/II) large subunit 2440 +/- 204 3016 +/- 132 1931 +/- 137 2492 +/- 70 0.043050555 0.007570247 0.056262271 0.076747121CBX3 chromobox homolog 3 (HP1 gamma homolog, Drosophila) 2091 +/- 138 2460 +/- 88 2478 +/- 74 2807 +/- 90 0.052848432 0.02160915 0.09765007 0.057418071CCT3 chaperonin containing TCP1, subunit 3 (gamma) 2068 +/- 138 2872 +/- 102 1999 +/- 97 2727 +/- 72 0.001085379 0.000217763 0.075896541 0.061884585CD81 CD81 molecule 13811 +/- 551 15425 +/- 255 12732 +/- 477 14927 +/- 743 0.032375137 0.041802505 0.194433538 0.42501107COPS7A COP9 constitutive photomorphogenic homolog subunit 7A (Arabidopsis) 2132 +/- 50 2760 +/- 207 2135 +/- 183 2910 +/- 174 0.027680484 0.01351365 0.352985886 0.252014955COQ3 coenzyme Q3 homolog, methyltransferase (S. cerevisiae) 962 +/- 18 1137 +/- 65 967 +/- 22 1098 +/- 25 0.043000068 0.00382441 0.334787333 0.133082872COX5B cytochrome c oxidase subunit Vb 6825 +/- 788 9221 +/- 528 4736 +/- 885 7292 +/- 122 0.033108929 0.03387958 0.066557107 0.06557043COX6C cytochrome c oxidase subunit VIc 7080 +/- 300 8976 +/- 497 6419 +/- 237 8142 +/- 260 0.011021066 0.0009592 0.204294097 0.061635335CRNKL1 Crn, crooked neck-like 1 (Drosophila) 267 +/- 89 512 +/- 56 270 +/- 68 595 +/- 45 0.046427355 0.003682882 0.102437924 0.059562553CYCS cytochrome c, somatic 1114 +/- 69 1523 +/- 105 1124 +/- 93 1485 +/- 52 0.010341606 0.010190902 0.183603931 0.132190411DOCK4 dedicator of cytokinesis 4 83 +/- 24 256 +/- 47 145 +/- 31 379 +/- 38 0.011861311 0.00134105 0.068950788 0.102620985ENO1 enolase 1, (alpha) 7846 +/- 333 9198 +/- 336 6480 +/- 135 7880 +/- 253 0.016967227 0.002519542 0.07839016 0.056871124FARP1 FERM, RhoGEF (ARHGEF) and pleckstrin domain protein 1 (chondrocyte-derived) 387 +/- 68 1140 +/- 179 336 +/- 59 910 +/- 114 0.006669617 0.004168685 0.139806747 0.091282321GINS1 GINS complex subunit 1 (Psf1 homolog) 2077 +/- 122 2623 +/- 181 2094 +/- 32 2596 +/- 160 0.034320522 0.033856266 0.367407227 0.345335418GRHPR glyoxylate reductase/hydroxypyruvate reductase 1359 +/- 124 1733 +/- 104 1291 +/- 74 1730 +/- 83 0.044182681 0.003678999 0.22865394 0.068657893HSPB8 heat shock 22kDa protein 8 2202 +/- 213 3231 +/- 299 2037 +/- 225 2797 +/- 223 0.020507528 0.040315812 0.080176878 0.384594436IBRDC3 IBR domain containing 3 179 +/- 43 292 +/- 22 217 +/- 41 344 +/- 26 0.047629109 0.029838298 0.219191824 0.299550357KIF3A kinesin family member 3A 6022 +/- 351 7526 +/- 490 5756 +/- 353 7952 +/- 415 0.033884807 0.003445953 0.447769441 0.104240769KIF5A kinesin family member 5A 2488 +/- 627 4967 +/- 527 2216 +/- 519 3839 +/- 250 0.013155403 0.025515348 0.069802094 0.168159715KRR1 KRR1, small subunit (SSU) processome component, homolog (yeast) 143 +/- 22 372 +/- 77 168 +/- 37 387 +/- 79 0.030300603 0.048322189 0.282459063 0.327733661MAP3K13 Mitogen-activated protein kinase kinase kinase 13 655 +/- 36 806 +/- 40 539 +/- 37 736 +/- 36 0.019233825 0.004277603 0.193007684 0.08807373METTL5 methyltransferase like 5 537 +/- 35 732 +/- 38 613 +/- 18 740 +/- 26 0.003613606 0.004300567 0.06472819 0.139529211MYLK myosin, light polypeptide kinase 2425 +/- 309 3340 +/- 241 1446 +/- 132 2443 +/- 131 0.043082979 0.000477748 0.11663479 0.069364667NFX1 nuclear transcription factor, X-box binding 1 115 +/- 15 162 +/- 12 126 +/- 3 169 +/- 16 0.039838428 0.047698285 0.119763606 0.078436117NUDT5 nudix (nucleoside diphosphate linked moiety X)-type motif 5 884 +/- 75 1105 +/- 67 672 +/- 11 954 +/- 63 0.053390579 0.010161315 0.094210476 0.12241466PLCH2 phospholipase C, eta 2 370 +/- 51 502 +/- 14 513 +/- 63 801 +/- 59 0.049362678 0.008956677 0.067947152 0.087632183PLEKHA6 pleckstrin homology domain containing, family A member 6 566 +/- 46 738 +/- 53 585 +/- 29 732 +/- 40 0.034289835 0.018921166 0.162664897 0.080752046PMS2 PMS2 postmeiotic segregation increased 2 (S. cerevisiae) 429 +/- 49 1254 +/- 258 530 +/- 58 1843 +/- 341 0.023149503 0.017204806 0.200908195 0.119468895POLD2 Polymerase (DNA directed), delta 2, regulatory subunit 50kDa 88 +/- 13 142 +/- 12 136 +/- 20 197 +/- 12 0.01183106 0.028238118 0.079666315 0.256120179PTP4A3 protein tyrosine phosphatase type IVA, member 3 107 +/- 7 143 +/- 10 103 +/- 8 139 +/- 10 0.013215792 0.023195861 0.197196097 0.071717067RABL4 RAB, member of RAS oncogene family-like 4 740 +/- 95 1128 +/- 110 549 +/- 56 835 +/- 106 0.023895769 0.054057633 0.076826758 0.321291487RANBP5 RAN binding protein 5 936 +/- 51 1233 +/- 94 1110 +/- 54 1359 +/- 44 0.025319009 0.005955687 0.189239579 0.186509537
S4- MSI correlated and non-correlated ARGs.xls Page 23

Young vs Aged MSI CorrelationsSymbol Description Young CA Aged CA Young DG Aged DG in CA in DG in CA in DGS100A6 S100 calcium binding protein A6 (calcyclin) 923 +/- 64 1156 +/- 72 682 +/- 81 1085 +/- 58 0.035962432 0.003149417 0.220246563 0.1084609SERPINB8 serpin peptidase inhibitor, clade B (ovalbumin), member 8 103 +/- 14 142 +/- 10 101 +/- 7 125 +/- 8 0.0451369 0.047732079 0.210402796 0.567889163SLC12A9 solute carrier family 12 (potassium/chloride transporters), member 9 1093 +/- 101 1413 +/- 80 1023 +/- 47 1257 +/- 43 0.033133089 0.005050841 0.144496165 0.152042307SSU72 SSU72 RNA polymerase II CTD phosphatase homolog (S. cerevisiae) 2015 +/- 93 2625 +/- 115 1716 +/- 93 2050 +/- 54 0.002266345 0.015168408 0.111942881 0.067295625STOM stomatin 2053 +/- 253 2990 +/- 261 1953 +/- 163 2755 +/- 171 0.027515679 0.008200839 0.063237653 0.157507683TATDN3 TatD DNase domain containing 3 116 +/- 9 169 +/- 11 138 +/- 16 192 +/- 10 0.0041436 0.02164698 0.07241459 0.055340933TCEAL4 transcription elongation factor A (SII)-like 4 8509 +/- 229 10384 +/- 384 8133 +/- 200 10329 +/- 553 0.00289964 0.013325761 0.097909518 0.138275737TMEM106C transmembrane protein 106C 1970 +/- 98 2345 +/- 128 1940 +/- 209 2804 +/- 219 0.043413259 0.019261834 0.312849989 0.22733026TMEM11 transmembrane protein 11 845 +/- 33 981 +/- 25 769 +/- 31 945 +/- 37 0.00892987 0.006195045 0.139897829 0.106812496TRUB2 TruB pseudouridine (psi) synthase homolog 2 (E. coli) 855 +/- 93 1100 +/- 56 795 +/- 42 1011 +/- 37 0.052142304 0.003952869 0.128420178 0.100419906USP31 ubiquitin specific peptidase 31 360 +/- 19 436 +/- 27 499 +/- 36 687 +/- 45 0.045849929 0.011486388 0.133505683 0.121915743XRCC5 X-ray repair complementing defective repair in Chinese hamster cells 5 (double-strand-break rejoining; Ku a 1545 +/- 90 1864 +/- 59 1424 +/- 33 1774 +/- 97 0.016491456 0.01936134 0.248647388 0.118649987ZNF131 Zinc finger protein 131 (clone pHZ-10) 124 +/- 18 238 +/- 29 160 +/- 22 267 +/- 25 0.010052177 0.011395349 0.126156615 0.066808291ZNF25 zinc finger protein 25 1239 +/- 41 1519 +/- 51 1305 +/- 50 1653 +/- 73 0.001854661 0.005249539 0.085885628 0.065991508ZNF45 zinc finger protein 45 279 +/- 18 336 +/- 17 332 +/- 22 400 +/- 18 0.049501338 0.045353643 0.241044901 0.225942957ZRANB1 zinc finger, RAN-binding domain containing 1 849 +/- 44 1040 +/- 45 887 +/- 57 1073 +/- 52 0.012514974 0.039302018 0.25207767 0.26501462Downregulated with Age in Both Regions, not MSI CorrelatedATP8B2 ATPase, Class I, type 8B, member 2 1260 +/- 36 1102 +/- 43 1508 +/- 74 1279 +/- 39 -0.018717994 -0.027391031 0.071600827 0.129279316BRD2 bromodomain containing 2 683 +/- 52 469 +/- 53 945 +/- 41 572 +/- 72 -0.016524852 -0.003473977 0.280047378 0.097054419CACNA1A calcium channel, voltage-dependent, P/Q type, alpha 1A subunit 961 +/- 89 664 +/- 44 1617 +/- 110 993 +/- 119 -0.018644654 -0.00419325 0.07476412 0.121622277CKAP1 cytoskeleton associated protein 1 1486 +/- 142 1105 +/- 70 1406 +/- 119 962 +/- 130 -0.04564535 -0.033776237 0.283899216 0.20179708CLK4 CDC-like kinase 4 2680 +/- 52 2262 +/- 87 2336 +/- 119 1847 +/- 72 -0.003236721 -0.007870411 0.089082266 0.093570671CREBBP CREB binding protein (Rubinstein-Taybi syndrome) 1537 +/- 76 1340 +/- 29 1670 +/- 25 1368 +/- 90 -0.047722227 -0.026138044 0.218216685 0.238085085DCTN4 dynactin 4 (p62) 2167 +/- 114 1786 +/- 115 2057 +/- 72 1769 +/- 87 -0.03959171 -0.033853445 0.439314547 0.327635314DFFA DNA fragmentation factor, 45kDa, alpha polypeptide 632 +/- 34 537 +/- 27 694 +/- 27 593 +/- 28 -0.054305353 -0.031207415 0.19627277 0.297678699DKFZP779L1PRO0845 1349 +/- 59 1055 +/- 62 1202 +/- 31 955 +/- 46 -0.006254246 -0.002851053 0.117590109 0.084762499GTF2IRD2 GTF2I repeat domain containing 2 310 +/- 18 224 +/- 27 365 +/- 33 210 +/- 55 -0.028055011 -0.047209612 0.482695937 0.339189571KCNK17 potassium channel, subfamily K, member 17 175 +/- 17 111 +/- 10 253 +/- 20 177 +/- 20 -0.011001664 -0.023816161 0.072727066 0.084128799KLF13 Kruppel-like factor 13 1790 +/- 60 1158 +/- 151 2000 +/- 133 1313 +/- 196 -0.006850529 -0.022009748 0.148842536 0.386259152LRP11 low density lipoprotein receptor-related protein 11 4775 +/- 167 4237 +/- 116 4754 +/- 143 4135 +/- 226 -0.026691143 -0.054358382 0.213604269 0.477677495LTBP1 latent transforming growth factor beta binding protein 1 361 +/- 17 236 +/- 20 447 +/- 38 218 +/- 28 -0.00071457 -0.000958711 0.098246847 0.0743978MAP1LC3A microtubule-associated protein 1 light chain 3 alpha 3967 +/- 274 2363 +/- 245 4800 +/- 253 2961 +/- 404 -0.00144192 -0.00636558 0.059834641 0.163614208MARK2 MAP/microtubule affinity-regulating kinase 2 823 +/- 33 702 +/- 30 941 +/- 40 765 +/- 25 -0.023035541 -0.005706683 0.135183632 0.132393049MAX MYC associated factor X 1031 +/- 87 779 +/- 39 1103 +/- 54 911 +/- 39 -0.034213781 -0.019564295 0.067448525 0.207610623MOBKL2B MOB1, Mps One Binder kinase activator-like 2B (yeast) 138 +/- 10 100 +/- 11 127 +/- 7 86 +/- 4 -0.028521632 -0.001403645 0.062958159 0.055919928OSBPL6 oxysterol binding protein-like 6 2412 +/- 155 1905 +/- 45 2468 +/- 135 1963 +/- 75 -0.02064243 -0.012145114 0.093437471 0.227481628PABPC5 poly(A) binding protein, cytoplasmic 5 153 +/- 5 103 +/- 10 160 +/- 15 110 +/- 8 -0.003193097 -0.019984793 0.089753987 0.125170727PNLDC1 poly(A)-specific ribonuclease (PARN)-like domain containing 1 203 +/- 62 42 +/- 1 212 +/- 57 60 +/- 6 -0.047861142 -0.044611804 0.195803754 0.13121375PROCA1 proline-rich cyclin A1-interacting protein 188 +/- 17 132 +/- 6 195 +/- 11 162 +/- 7 -0.01904541 -0.03118106 0.104932479 0.258450261PTBP2 polypyrimidine tract binding protein 2 2307 +/- 103 1782 +/- 161 2298 +/- 39 1811 +/- 152 -0.02381853 -0.030830317 0.438613881 0.216102612PUM2 pumilio homolog 2 (Drosophila) 2633 +/- 77 1935 +/- 111 2753 +/- 131 1997 +/- 141 -0.000604458 -0.003648263 0.05562315 0.081645211RIT2 Ras-like without CAAX 2 609 +/- 31 437 +/- 55 775 +/- 62 568 +/- 48 -0.025575445 -0.027875631 0.077862913 0.062894532RNF10 ring finger protein 10 3235 +/- 192 2478 +/- 121 3155 +/- 83 2677 +/- 130 -0.009517874 -0.017449864 0.082708791 0.409322341RNF40 ring finger protein 40 697 +/- 31 616 +/- 10 876 +/- 27 750 +/- 31 -0.043586854 -0.014864958 0.340172388 0.108042495
S4- MSI correlated and non-correlated ARGs.xls Page 24

Young vs Aged MSI CorrelationsSymbol Description Young CA Aged CA Young DG Aged DG in CA in DG in CA in DGRPS12 ribosomal protein S12 4329 +/- 211 3150 +/- 239 3422 +/- 186 2508 +/- 191 -0.004218543 -0.00763633 0.093213947 0.150396701SEC14L1 SEC14-like 1 (S. cerevisiae) 4771 +/- 153 4085 +/- 221 5018 +/- 284 3990 +/- 299 -0.031449238 -0.03470786 0.459700401 0.261595307SETD6 SET domain containing 6 357 +/- 14 262 +/- 22 362 +/- 8 285 +/- 23 -0.006155276 -0.024760878 0.071339234 0.157550143SGPL1 sphingosine-1-phosphate lyase 1 613 +/- 28 522 +/- 26 640 +/- 24 524 +/- 12 -0.040205869 -0.002866218 0.231950816 0.057885563SMU1 Smu-1 suppressor of mec-8 and unc-52 homolog (C. elegans) 1021 +/- 44 845 +/- 49 1000 +/- 21 892 +/- 31 -0.024100861 -0.021557898 0.061954055 0.167536525SORBS2 Sorbin and SH3 domain containing 2 432 +/- 19 353 +/- 14 405 +/- 14 294 +/- 41 -0.007594933 -0.049321265 0.078440767 0.364208937SRrp35 serine-arginine repressor protein (35 kDa) 851 +/- 61 650 +/- 57 860 +/- 61 692 +/- 42 -0.036873369 -0.05114665 0.063738218 0.19318906SSB Sjogren syndrome antigen B (autoantigen La) 2114 +/- 118 1777 +/- 99 2359 +/- 70 1882 +/- 138 -0.054697646 -0.021627807 0.061261408 0.162029076SUB1 SUB1 homolog (S. cerevisiae) 198 +/- 12 153 +/- 13 233 +/- 7 187 +/- 11 -0.029380853 -0.009334405 0.070572835 0.200849812SURF4 surfeit 4 844 +/- 29 730 +/- 19 751 +/- 33 661 +/- 21 -0.010483129 -0.048622922 0.102185092 0.242072965TBC1D14 TBC1 domain family, member 14 2125 +/- 84 1815 +/- 92 1795 +/- 52 1639 +/- 43 -0.031696434 -0.047244724 0.222267241 0.2088684TMEM132B transmembrane protein 132B 1274 +/- 123 930 +/- 71 1051 +/- 67 730 +/- 54 -0.041704541 -0.004741841 0.240402673 0.156696458TTC19 tetratricopeptide repeat domain 19 2924 +/- 101 1559 +/- 359 3189 +/- 138 1757 +/- 528 -0.011318191 -0.051446777 0.065680723 0.168026491USP15 ubiquitin specific peptidase 15 2158 +/- 53 1639 +/- 107 2009 +/- 51 1697 +/- 92 -0.003134811 -0.023252573 0.058322123 0.324435591YTHDF2 YTH domain family, member 2 2059 +/- 97 1665 +/- 58 2492 +/- 66 2178 +/- 98 -0.007866082 -0.031414013 0.112830832 0.432848963ZBTB24 zinc finger and BTB domain containing 24 626 +/- 63 454 +/- 23 608 +/- 38 435 +/- 38 -0.039583377 -0.01011329 0.187721069 0.150985666ZNF74 zinc finger protein 74 147 +/- 15 91 +/- 13 170 +/- 12 113 +/- 14 -0.018936105 -0.016370007 0.112743819 0.206491307ZNRD1 zinc ribbon domain containing 1 926 +/- 41 625 +/- 37 853 +/- 26 720 +/- 30 -0.000268689 -0.009907701 0.05962573 0.099213787ZXDB zinc finger, X-linked, duplicated B 667 +/- 61 496 +/- 39 665 +/- 46 479 +/- 61 -0.044558801 -0.041047339 0.260164736 0.248674131Upregulated with Age in CA, not MSI CorrelatedACSS1 acyl-CoA synthetase short-chain family member 1 229 +/- 21 311 +/- 28 196 +/- 16 228 +/- 23 0.044219773 0.295382048 0.092173026 0.41519286ACTC actin, alpha, cardiac muscle 84 +/- 15 206 +/- 35 98 +/- 11 212 +/- 35 0.015564453 0.02973628 0.098010841 0.165795281ACTR10 actin-related protein 10 homolog (S. cerevisiae) 6172 +/- 108 6822 +/- 248 6301 +/- 210 7510 +/- 229 0.048300301 0.003988195 0.590192181 0.084527105ADAM15 ADAM metallopeptidase domain 15 (metargidin) 1022 +/- 24 1299 +/- 94 1046 +/- 106 1001 +/- 50 0.030854629 -0.71105561 0.141754929 0.762483649ADCK4 aarF domain containing kinase 4 430 +/- 24 546 +/- 40 383 +/- 31 503 +/- 38 0.037411918 0.039519137 0.273091814 0.306370996AKAP2 A kinase (PRKA) anchor protein 2 119 +/- 16 187 +/- 25 136 +/- 11 180 +/- 30 0.048876962 0.230582964 0.104341568 0.703394196ALDH3A1 aldehyde dehydrogenase 3 family, memberA1 99 +/- 11 267 +/- 57 115 +/- 22 357 +/- 54 0.031714621 0.008136205 0.140583247 0.129873586AMY1A amylase, alpha 1A; salivary 217 +/- 46 706 +/- 123 210 +/- 34 692 +/- 108 0.008648671 0.00879563 0.208529984 0.155361317ANKH ankylosis, progressive homolog (mouse) 2365 +/- 119 2794 +/- 121 2527 +/- 92 2834 +/- 84 0.030335857 0.035777518 0.166489153 0.306504297ARHGAP1 Rho GTPase activating protein 1 2732 +/- 133 3160 +/- 91 2618 +/- 114 2959 +/- 91 0.026130162 0.045361642 0.13775446 0.424521136ARID1B AT rich interactive domain 1B (SWI1-like) 517 +/- 50 742 +/- 58 815 +/- 107 980 +/- 67 0.015336606 0.224649318 0.1181921 0.40132601ARIH1 Ariadne homolog, ubiquitin-conjugating enzyme E2 binding protein, 1 (Drosophila) 340 +/- 7 374 +/- 9 372 +/- 17 385 +/- 27 0.012077729 0.684704776 0.077969394 0.223103894ARSD arylsulfatase D 461 +/- 56 623 +/- 41 464 +/- 64 612 +/- 50 0.043786951 0.101284212 0.102416826 0.156049993ATAD2 ATPase family, AAA domain containing 2 97 +/- 15 148 +/- 7 117 +/- 7 127 +/- 8 0.018121133 0.411450294 0.086430788 0.285110489ATXN7L1 ataxin 7-like 1 462 +/- 25 555 +/- 22 612 +/- 31 626 +/- 34 0.019018807 0.771269241 0.08401584 0.431720954AURKAIP1 aurora kinase A interacting protein 1 1086 +/- 137 1595 +/- 169 1097 +/- 103 1678 +/- 137 0.042673648 0.009991978 0.163010822 0.071334126AXL AXL receptor tyrosine kinase 951 +/- 51 1108 +/- 50 906 +/- 51 754 +/- 67 0.054106048 -0.110760834 0.20280057 0.01696212BAG1 BCL2-associated athanogene 642 +/- 54 817 +/- 54 829 +/- 57 905 +/- 31 0.045918545 0.271392547 0.254928509 0.394042998BTG4 B-cell translocation gene 4 106 +/- 9 193 +/- 31 105 +/- 8 196 +/- 11 0.035256012 0.000213402 0.093942226 0.005027946BTN3A1 butyrophilin, subfamily 3, member A1 194 +/- 23 323 +/- 36 209 +/- 19 260 +/- 29 0.016382779 0.183901688 0.057796542 0.148192434CAPN2 calpain 2, (m/II) large subunit 2440 +/- 204 3016 +/- 132 1931 +/- 137 2492 +/- 70 0.043050555 0.007570247 0.056262271 0.076747121CBX3 chromobox homolog 3 (HP1 gamma homolog, Drosophila) 2091 +/- 138 2460 +/- 88 2478 +/- 74 2807 +/- 90 0.052848432 0.02160915 0.09765007 0.057418071CCT3 chaperonin containing TCP1, subunit 3 (gamma) 2068 +/- 138 2872 +/- 102 1999 +/- 97 2727 +/- 72 0.001085379 0.000217763 0.075896541 0.061884585CD2BP2 CD2 (cytoplasmic tail) binding protein 2 434 +/- 27 533 +/- 24 382 +/- 9 508 +/- 28 0.022462219 0.007719463 0.191814082 0.022361307
S4- MSI correlated and non-correlated ARGs.xls Page 25

Young vs Aged MSI CorrelationsSymbol Description Young CA Aged CA Young DG Aged DG in CA in DG in CA in DGCD81 CD81 molecule 13811 +/- 551 15425 +/- 255 12732 +/- 477 14927 +/- 743 0.032375137 0.041802505 0.194433538 0.42501107CDC16 CDC16 cell division cycle 16 homolog (S. cerevisiae) 1071 +/- 33 1180 +/- 23 991 +/- 39 1063 +/- 17 0.024866349 0.134430028 0.13100448 0.324503036CDC25A cell division cycle 25A 235 +/- 35 330 +/- 18 224 +/- 25 264 +/- 25 0.041930863 0.285905226 0.206982299 0.662240565CHCHD7 coiled-coil-helix-coiled-coil-helix domain containing 7 1443 +/- 50 1660 +/- 71 1485 +/- 74 1658 +/- 34 0.034158169 0.071555797 0.122505083 0.117042564CHL1 cell adhesion molecule with homology to L1CAM (close homolog of L1) 5666 +/- 319 6673 +/- 332 5043 +/- 360 5085 +/- 214 0.053767932 0.922983686 0.26905998 0.966686244CLCC1 chloride channel CLIC-like 1 332 +/- 29 441 +/- 25 310 +/- 14 395 +/- 5 0.017994612 0.001144694 0.066524997 0.011344007CLN3 ceroid-lipofuscinosis, neuronal 3, juvenile (Batten, Spielmeyer-Vogt disease) 69 +/- 19 166 +/- 24 72 +/- 18 167 +/- 36 0.010473862 0.059108282 0.162109144 0.4560878COL8A1 Collagen, type VIII, alpha 1 97 +/- 13 150 +/- 14 69 +/- 14 113 +/- 15 0.016482587 0.061623491 0.055660334 0.005594877COPS7A COP9 constitutive photomorphogenic homolog subunit 7A (Arabidopsis) 2132 +/- 50 2760 +/- 207 2135 +/- 183 2910 +/- 174 0.027680484 0.01351365 0.352985886 0.252014955COQ3 coenzyme Q3 homolog, methyltransferase (S. cerevisiae) 962 +/- 18 1137 +/- 65 967 +/- 22 1098 +/- 25 0.043000068 0.00382441 0.334787333 0.133082872COX5B cytochrome c oxidase subunit Vb 6825 +/- 788 9221 +/- 528 4736 +/- 885 7292 +/- 122 0.033108929 0.03387958 0.066557107 0.06557043COX6C cytochrome c oxidase subunit VIc 7080 +/- 300 8976 +/- 497 6419 +/- 237 8142 +/- 260 0.011021066 0.0009592 0.204294097 0.061635335CRAMP1L Crm, cramped-like (Drosophila) 799 +/- 22 1083 +/- 81 759 +/- 43 853 +/- 75 0.015800607 0.319565521 0.109389 0.816449511CRNKL1 Crn, crooked neck-like 1 (Drosophila) 267 +/- 89 512 +/- 56 270 +/- 68 595 +/- 45 0.046427355 0.003682882 0.102437924 0.059562553CUGBP2 CUG triplet repeat, RNA binding protein 2 1263 +/- 229 2289 +/- 319 1772 +/- 270 3161 +/- 347 0.028023032 0.01349226 0.240528635 0.044816364CXXC4 CXXC finger 4 336 +/- 31 432 +/- 16 266 +/- 21 359 +/- 24 0.025393947 0.017669687 0.098272989 0.053262012CYCS cytochrome c, somatic 1114 +/- 69 1523 +/- 105 1124 +/- 93 1485 +/- 52 0.010341606 0.010190902 0.183603931 0.132190411CYP2U1 cytochrome P450, family 2, subfamily U, polypeptide 1 588 +/- 29 675 +/- 23 522 +/- 14 543 +/- 13 0.043277742 0.299250103 0.093998178 0.347334754DBT dihydrolipoamide branched chain transacylase E2 462 +/- 33 608 +/- 51 504 +/- 30 557 +/- 59 0.039833819 0.456100246 0.162301729 0.969314425DCTN6 dynactin 6 2538 +/- 127 2919 +/- 63 2668 +/- 126 2992 +/- 196 0.029949775 0.207325665 0.240430018 0.790006856DDHD1 DDHD domain containing 1 1480 +/- 235 2265 +/- 180 1320 +/- 221 1767 +/- 178 0.025380526 0.151224371 0.129240723 0.571036542DOCK4 dedicator of cytokinesis 4 83 +/- 24 256 +/- 47 145 +/- 31 379 +/- 38 0.011861311 0.00134105 0.068950788 0.102620985DPM2 dolichyl-phosphate mannosyltransferase polypeptide 2, regulatory subunit 870 +/- 18 1041 +/- 46 787 +/- 41 847 +/- 24 0.011942914 0.242049888 0.078490281 0.330036341DTX3L deltex 3-like (Drosophila) 251 +/- 13 312 +/- 18 280 +/- 11 256 +/- 22 0.024096904 -0.357979389 0.09316433 0.31787349DYNC2H1 dynein, cytoplasmic 2, heavy chain 1 508 +/- 62 728 +/- 72 644 +/- 82 957 +/- 115 0.043945338 0.060176299 0.262692411 0.344315645EMP3 epithelial membrane protein 3 385 +/- 23 473 +/- 25 311 +/- 21 374 +/- 24 0.029519429 0.081155644 0.095194523 0.797026608ENO1 enolase 1, (alpha) 7846 +/- 333 9198 +/- 336 6480 +/- 135 7880 +/- 253 0.016967227 0.002519542 0.07839016 0.056871124ETFDH electron-transferring-flavoprotein dehydrogenase 382 +/- 17 463 +/- 16 356 +/- 16 395 +/- 22 0.006605564 0.190974823 0.109621717 0.459312584EXOC7 exocyst complex component 7 228 +/- 32 391 +/- 33 285 +/- 12 351 +/- 36 0.004969021 0.144338174 0.076115754 0.211317901FARP1 FERM, RhoGEF (ARHGEF) and pleckstrin domain protein 1 (chondrocyte-derived) 387 +/- 68 1140 +/- 179 336 +/- 59 910 +/- 114 0.006669617 0.004168685 0.139806747 0.091282321FBXO17 F-box protein 17 244 +/- 20 351 +/- 30 356 +/- 58 418 +/- 44 0.016664726 0.414234698 0.117558843 0.209040806FBXO38 F-box protein 38 480 +/- 20 548 +/- 23 535 +/- 44 505 +/- 38 0.046100698 -0.619412016 0.30700201 0.439029225FECH ferrochelatase (protoporphyria) 822 +/- 52 1099 +/- 86 820 +/- 77 1136 +/- 119 0.023949084 0.059793298 0.082661233 0.077081569FLCN folliculin 85 +/- 4 102 +/- 4 108 +/- 14 107 +/- 6 0.019232872 -0.937966761 0.082039332 0.384839333FOXO1A forkhead box O1A (rhabdomyosarcoma) 720 +/- 44 1108 +/- 81 1000 +/- 116 1225 +/- 114 0.003120312 0.199945505 0.066269934 0.965805829FOXO3A Forkhead box O3A 331 +/- 35 512 +/- 68 283 +/- 27 375 +/- 22 0.048674426 0.026860825 0.057457718 0.021827275GAS7 growth arrest-specific 7 9122 +/- 492 10812 +/- 463 7341 +/- 461 8180 +/- 533 0.031339332 0.265977748 0.166864454 0.19726818GGTLA4 gamma-glutamyltransferase-like activity 4 155 +/- 2 188 +/- 13 139 +/- 10 162 +/- 8 0.048726219 0.129089576 0.06448907 0.179980162GINS1 GINS complex subunit 1 (Psf1 homolog) 2077 +/- 122 2623 +/- 181 2094 +/- 32 2596 +/- 160 0.034320522 0.033856266 0.367407227 0.345335418GIT2 G protein-coupled receptor kinase interactor 2 2774 +/- 76 3131 +/- 101 2423 +/- 103 2775 +/- 131 0.019667627 0.067079427 0.174695151 0.03184067GOPC golgi associated PDZ and coiled-coil motif containing 462 +/- 34 622 +/- 43 560 +/- 32 730 +/- 26 0.015844249 0.002572784 0.067332845 0.008610876GPHN Gephyrin 468 +/- 36 658 +/- 46 703 +/- 53 656 +/- 40 0.009339756 -0.495338603 0.070878958 0.286419919GRHPR glyoxylate reductase/hydroxypyruvate reductase 1359 +/- 124 1733 +/- 104 1291 +/- 74 1730 +/- 83 0.044182681 0.003678999 0.22865394 0.068657893HBII-276HG HBII-276 host gene 4992 +/- 293 6134 +/- 326 5486 +/- 284 6432 +/- 380 0.02640662 0.082376721 0.079804348 0.216008313
S4- MSI correlated and non-correlated ARGs.xls Page 26

Young vs Aged MSI CorrelationsSymbol Description Young CA Aged CA Young DG Aged DG in CA in DG in CA in DGHBS1L HBS1-like (S. cerevisiae) 1048 +/- 89 1565 +/- 156 1275 +/- 83 1473 +/- 162 0.020628933 0.319037322 0.086345244 0.918312567HECTD2 HECT domain containing 2 1579 +/- 126 2196 +/- 109 1410 +/- 84 1984 +/- 71 0.004135061 0.000568656 0.080773087 0.041573814HLA-DPB1 major histocompatibility complex, class II, DP beta 1 275 +/- 55 485 +/- 42 153 +/- 53 409 +/- 56 0.013814114 0.009354973 0.103180322 0.024830136HNRPD heterogeneous nuclear ribonucleoprotein D (AU-rich element RNA binding protein 1, 37kDa) 1406 +/- 64 1586 +/- 51 1838 +/- 60 1825 +/- 128 0.054211223 -0.927465461 0.210033818 0.967620935HNRPL heterogeneous nuclear ribonucleoprotein L 5232 +/- 292 6250 +/- 170 6161 +/- 225 7259 +/- 144 0.016730469 0.003234389 0.14241682 0.023284248HRH1 Histamine receptor H1 110 +/- 13 169 +/- 16 148 +/- 14 93 +/- 20 0.017877363 -0.05536298 0.074279077 0.026902294HSDL2 hydroxysteroid dehydrogenase like 2 117 +/- 13 171 +/- 18 115 +/- 10 148 +/- 16 0.036775116 0.129426591 0.085526021 0.004988242HSP90AB1 heat shock protein 90kDa alpha (cytosolic), class B member 1 11071 +/- 195 13271 +/- 831 9909 +/- 375 10714 +/- 222 0.045089883 0.102338403 0.170591648 0.094284162HSPB8 heat shock 22kDa protein 8 2202 +/- 213 3231 +/- 299 2037 +/- 225 2797 +/- 223 0.020507528 0.040315812 0.080176878 0.384594436HSPC176 hematopoietic stem/progenitor cells 176 666 +/- 60 863 +/- 48 612 +/- 77 712 +/- 53 0.029019601 0.316878103 0.261860352 0.275118585IBRDC3 IBR domain containing 3 179 +/- 43 292 +/- 22 217 +/- 41 344 +/- 26 0.047629109 0.029838298 0.219191824 0.299550357IFT140 intraflagellar transport 140 homolog (Chlamydomonas) 212 +/- 12 263 +/- 17 244 +/- 23 276 +/- 16 0.037274415 0.272873388 0.071047955 0.342519238IGSF9 immunoglobulin superfamily, member 9 140 +/- 15 213 +/- 22 159 +/- 9 169 +/- 13 0.020987166 0.530615698 0.06245333 0.17190817ITGAM integrin, alpha M (complement component 3 receptor 3 subunit) 332 +/- 23 412 +/- 12 323 +/- 26 348 +/- 34 0.016766774 0.584584094 0.08401445 0.55274916KHDRBS1 KH domain containing, RNA binding, signal transduction associated 1 434 +/- 12 512 +/- 23 424 +/- 28 401 +/- 15 0.016874918 -0.478304553 0.317581896 0.390046933KIDINS220 Kinase D-interacting substance of 220 kDa 221 +/- 98 520 +/- 82 208 +/- 72 376 +/- 75 0.042029308 0.142024625 0.11277976 0.311622623KIF3A kinesin family member 3A 6022 +/- 351 7526 +/- 490 5756 +/- 353 7952 +/- 415 0.033884807 0.003445953 0.447769441 0.104240769KIF5A kinesin family member 5A 2488 +/- 627 4967 +/- 527 2216 +/- 519 3839 +/- 250 0.013155403 0.025515348 0.069802094 0.168159715KLHL8 kelch-like 8 (Drosophila) 1978 +/- 100 2286 +/- 94 2118 +/- 103 2280 +/- 170 0.049228577 0.44249102 0.231789828 0.597146058KRR1 KRR1, small subunit (SSU) processome component, homolog (yeast) 143 +/- 22 372 +/- 77 168 +/- 37 387 +/- 79 0.030300603 0.048322189 0.282459063 0.327733661LIX1L Lix1 homolog (mouse) like 1777 +/- 112 2141 +/- 118 1728 +/- 67 1848 +/- 69 0.049309549 0.244960965 0.08145548 0.44860521LNPEP leucyl/cystinyl aminopeptidase 2120 +/- 127 2540 +/- 116 2687 +/- 122 2808 +/- 110 0.035157226 0.478573904 0.130928933 0.656830166LRIG1 leucine-rich repeats and immunoglobulin-like domains 1 2933 +/- 304 3934 +/- 210 2719 +/- 203 3170 +/- 146 0.024241162 0.105786534 0.079044288 0.603652401LRRC39 leucine rich repeat containing 39 91 +/- 6 115 +/- 9 98 +/- 6 108 +/- 9 0.043875356 0.398741782 0.149198507 0.579822311LYPLA3 lysophospholipase 3 (lysosomal phospholipase A2) 288 +/- 21 365 +/- 24 331 +/- 23 339 +/- 18 0.03444241 0.774488703 0.162530545 0.896713769MAP3K13 Mitogen-activated protein kinase kinase kinase 13 655 +/- 36 806 +/- 40 539 +/- 37 736 +/- 36 0.019233825 0.004277603 0.193007684 0.08807373MAP3K6 mitogen-activated protein kinase kinase kinase 6 292 +/- 47 544 +/- 98 200 +/- 27 272 +/- 34 0.051470939 0.13615307 0.066421173 0.015676532MBP myelin basic protein 267 +/- 30 382 +/- 30 198 +/- 26 233 +/- 24 0.02215176 0.356889779 0.163209489 0.658828331MCM3AP MCM3 minichromosome maintenance deficient 3 (S. cerevisiae) associated protein 113 +/- 18 175 +/- 17 138 +/- 12 186 +/- 14 0.034417289 0.029901837 0.139021258 0.017434983METTL5 methyltransferase like 5 537 +/- 35 732 +/- 38 613 +/- 18 740 +/- 26 0.003613606 0.004300567 0.06472819 0.139529211MIER1 mesoderm induction early response 1 homolog (Xenopus laevis) 445 +/- 23 518 +/- 23 603 +/- 34 526 +/- 34 0.052128599 -0.139560385 0.197188748 0.070325535MORC2 MORC family CW-type zinc finger 2 239 +/- 17 310 +/- 23 255 +/- 14 259 +/- 19 0.033010557 0.84791743 0.144557863 0.549322188MPP5 membrane protein, palmitoylated 5 (MAGUK p55 subfamily member 5) 1226 +/- 50 1391 +/- 42 1232 +/- 32 1396 +/- 65 0.031397285 0.06518596 0.073773107 0.439592422MYLK myosin, light polypeptide kinase 2425 +/- 309 3340 +/- 241 1446 +/- 132 2443 +/- 131 0.043082979 0.000477748 0.11663479 0.069364667MYSM1 myb-like, SWIRM and MPN domains 1 1621 +/- 104 1918 +/- 60 1905 +/- 135 2056 +/- 106 0.038833834 0.400278588 0.099193813 0.198163684MYST1 MYST histone acetyltransferase 1 110 +/- 7 152 +/- 8 123 +/- 16 139 +/- 15 0.003906619 0.48476742 0.091778231 0.448618831NAPB N-ethylmaleimide-sensitive factor attachment protein, beta 177 +/- 26 406 +/- 74 348 +/- 67 475 +/- 68 0.026112425 0.218482251 0.113400699 0.324157845NCAM1 neural cell adhesion molecule 1 374 +/- 80 1218 +/- 237 262 +/- 43 746 +/- 266 0.014440982 0.142824454 0.093267691 0.563311732NCKIPSD NCK interacting protein with SH3 domain 1420 +/- 128 2242 +/- 157 1411 +/- 94 2164 +/- 111 0.002447617 0.000744802 0.093724422 0.031940681NFIA nuclear factor I/A 731 +/- 78 982 +/- 55 989 +/- 53 935 +/- 121 0.026750064 -0.697484863 0.103003403 0.177228163NFX1 nuclear transcription factor, X-box binding 1 115 +/- 15 162 +/- 12 126 +/- 3 169 +/- 16 0.039838428 0.047698285 0.119763606 0.078436117NISCH nischarin 262 +/- 23 343 +/- 27 377 +/- 20 423 +/- 44 0.04752027 0.383179785 0.171937937 0.043230983NME1 Non-metastatic cells 1, protein (NM23A) expressed in 1207 +/- 74 1482 +/- 34 1218 +/- 92 1399 +/- 47 0.011642985 0.119898648 0.111929354 0.336369862NPHP3 nephronophthisis 3 (adolescent) 113 +/- 9 157 +/- 10 147 +/- 18 189 +/- 8 0.008843705 0.070449903 0.06901726 0.136179994
S4- MSI correlated and non-correlated ARGs.xls Page 27

Young vs Aged MSI CorrelationsSymbol Description Young CA Aged CA Young DG Aged DG in CA in DG in CA in DGNPL N-acetylneuraminate pyruvate lyase (dihydrodipicolinate synthase) 229 +/- 29 384 +/- 51 300 +/- 21 335 +/- 41 0.030694664 0.479417912 0.115841389 0.696042526NSUN2 NOL1/NOP2/Sun domain family, member 2 521 +/- 29 653 +/- 50 633 +/- 51 677 +/- 39 0.053407057 0.513679036 0.298447921 0.863715442NUDT5 nudix (nucleoside diphosphate linked moiety X)-type motif 5 884 +/- 75 1105 +/- 67 672 +/- 11 954 +/- 63 0.053390579 0.010161315 0.094210476 0.12241466NUP62 nucleoporin 62kDa 885 +/- 11 1158 +/- 43 1053 +/- 49 1241 +/- 35 0.000988177 0.012690922 0.069716696 0.04182895NUPL1 nucleoporin like 1 80 +/- 12 133 +/- 19 138 +/- 7 175 +/- 24 0.043676096 0.212114005 0.235786247 0.828518206OGFRL1 opioid growth factor receptor-like 1 121 +/- 12 168 +/- 17 211 +/- 16 189 +/- 23 0.054419173 -0.447763356 0.056448241 0.476359997PAIP2 poly(A) binding protein interacting protein 2 6014 +/- 283 6884 +/- 216 5284 +/- 145 5886 +/- 240 0.036388176 0.070780543 0.095169664 0.284790024PAQR8 progestin and adipoQ receptor family member VIII 3877 +/- 236 4674 +/- 31 4024 +/- 144 4047 +/- 240 0.019111631 0.93948212 0.100311337 0.396077656PCF11 PCF11, cleavage and polyadenylation factor subunit, homolog (S. cerevisiae) 929 +/- 93 1221 +/- 73 1180 +/- 136 1270 +/- 151 0.03469835 0.669485315 0.093413738 0.768232263PDGFA platelet-derived growth factor alpha polypeptide 71 +/- 16 134 +/- 20 87 +/- 13 170 +/- 42 0.035864061 0.119291863 0.133664284 0.096099286PDLIM4 PDZ and LIM domain 4 397 +/- 29 502 +/- 35 398 +/- 27 477 +/- 30 0.045611451 0.083153202 0.059789114 0.298752675PGAM1 phosphoglycerate mutase 1 (brain) 11785 +/- 417 13568 +/- 474 10224 +/- 320 12402 +/- 471 0.018304155 0.006017659 0.146932074 0.039091516PHC3 Polyhomeotic like 3 (Drosophila) 83 +/- 5 113 +/- 9 127 +/- 13 127 +/- 17 0.025432255 -0.986452201 0.074767882 0.431370145PIGZ phosphatidylinositol glycan, class Z 644 +/- 33 916 +/- 90 686 +/- 41 941 +/- 35 0.027433302 0.001051162 0.094046979 0.015991583PKN1 protein kinase N1 1025 +/- 87 1327 +/- 101 952 +/- 42 1034 +/- 60 0.047977137 0.299131293 0.111437103 0.507674326PKP4 plakophilin 4 192 +/- 40 356 +/- 46 228 +/- 41 321 +/- 34 0.023207386 0.11621468 0.149577903 0.066711467PLCH2 phospholipase C, eta 2 370 +/- 51 502 +/- 14 513 +/- 63 801 +/- 59 0.049362678 0.008956677 0.067947152 0.087632183PLEKHA6 pleckstrin homology domain containing, family A member 6 566 +/- 46 738 +/- 53 585 +/- 29 732 +/- 40 0.034289835 0.018921166 0.162664897 0.080752046PLK1 polo-like kinase 1 (Drosophila) 21403 +/- 877 23680 +/- 475 19863 +/- 1093 22695 +/- 710 0.053081378 0.060485904 0.350126365 0.318981193PMS2 PMS2 postmeiotic segregation increased 2 (S. cerevisiae) 429 +/- 49 1254 +/- 258 530 +/- 58 1843 +/- 341 0.023149503 0.017204806 0.200908195 0.119468895POLD2 Polymerase (DNA directed), delta 2, regulatory subunit 50kDa 88 +/- 13 142 +/- 12 136 +/- 20 197 +/- 12 0.01183106 0.028238118 0.079666315 0.256120179PPAP2B phosphatidic acid phosphatase type 2B 2720 +/- 167 3718 +/- 213 2634 +/- 127 2728 +/- 239 0.004571231 0.741309938 0.063156923 0.390909034PRKCH protein kinase C, eta 181 +/- 18 255 +/- 18 129 +/- 12 131 +/- 19 0.016863206 0.94345249 0.130287445 0.854606822PRR13 proline rich 13 3251 +/- 117 3856 +/- 164 2723 +/- 24 3074 +/- 150 0.014722864 0.079233542 0.086049672 0.184989891PRRX2 paired related homeobox 2 228 +/- 13 276 +/- 7 263 +/- 27 273 +/- 24 0.012613526 0.791143164 0.119347312 0.78923988PSCD4 pleckstrin homology, Sec7 and coiled-coil domains 4 213 +/- 21 291 +/- 13 199 +/- 18 202 +/- 16 0.01228804 0.924077015 0.094947689 0.484449893PSMB7 Proteasome (prosome, macropain) subunit, beta type, 7 371 +/- 27 515 +/- 39 467 +/- 43 650 +/- 85 0.014376321 0.103112853 0.068983094 0.453466573PSMC5 proteasome (prosome, macropain) 26S subunit, ATPase, 5 4810 +/- 47 5639 +/- 234 4899 +/- 178 5254 +/- 108 0.01560899 0.125387519 0.183499417 0.306443488PSMD4 proteasome (prosome, macropain) 26S subunit, non-ATPase, 4 2476 +/- 113 2897 +/- 73 2016 +/- 75 2132 +/- 95 0.012706839 0.364097738 0.09970474 0.508662756PTK2 PTK2 protein tyrosine kinase 2 352 +/- 24 487 +/- 29 419 +/- 31 528 +/- 44 0.005345001 0.081021869 0.05936811 0.141248224PTP4A3 protein tyrosine phosphatase type IVA, member 3 107 +/- 7 143 +/- 10 103 +/- 8 139 +/- 10 0.013215792 0.023195861 0.197196097 0.071717067PTPN21 Protein tyrosine phosphatase, non-receptor type 21 156 +/- 37 305 +/- 48 153 +/- 15 276 +/- 31 0.036045999 0.013348896 0.104382719 0.018237476RABL4 RAB, member of RAS oncogene family-like 4 740 +/- 95 1128 +/- 110 549 +/- 56 835 +/- 106 0.023895769 0.054057633 0.076826758 0.321291487RANBP5 RAN binding protein 5 936 +/- 51 1233 +/- 94 1110 +/- 54 1359 +/- 44 0.025319009 0.005955687 0.189239579 0.186509537RBM17 RNA binding motif protein 17 269 +/- 33 382 +/- 35 305 +/- 29 360 +/- 17 0.041351699 0.14662783 0.105831814 0.496468875RENBP renin binding protein 106 +/- 14 148 +/- 12 134 +/- 15 152 +/- 8 0.053117985 0.333910173 0.156043251 0.278461581RGS11 regulator of G-protein signalling 11 262 +/- 54 525 +/- 62 397 +/- 50 606 +/- 54 0.009410819 0.019498241 0.076190609 0.026970839RINT1 RAD50 interactor 1 379 +/- 15 428 +/- 6 425 +/- 14 401 +/- 17 0.017524088 -0.303252578 0.091312897 0.075998411RIPK2 receptor-interacting serine-threonine kinase 2 475 +/- 23 551 +/- 22 420 +/- 19 435 +/- 19 0.040022958 0.590227599 0.259237704 0.969415904RNASEH1 ribonuclease H1 129 +/- 15 178 +/- 14 148 +/- 7 241 +/- 18 0.041606548 0.00463307 0.229431039 0.032545623RNASEH2A ribonuclease H2, large subunit 227 +/- 15 280 +/- 16 209 +/- 14 224 +/- 16 0.037496755 0.500722271 0.127715477 0.768173717RNPS1 RNA binding protein S1, serine-rich domain 2748 +/- 78 3124 +/- 133 3034 +/- 149 3248 +/- 132 0.040859818 0.310943278 0.216154106 0.447975573RP2 retinitis pigmentosa 2 (X-linked recessive) 105 +/- 12 148 +/- 15 124 +/- 13 142 +/- 17 0.047085506 0.433553079 0.075616688 0.913039696RPL24 ribosomal protein L24 6992 +/- 211 7638 +/- 185 6738 +/- 313 6697 +/- 239 0.044417687 -0.919545644 0.133596205 0.575328242
S4- MSI correlated and non-correlated ARGs.xls Page 28

Young vs Aged MSI CorrelationsSymbol Description Young CA Aged CA Young DG Aged DG in CA in DG in CA in DGRPL36AL ribosomal protein L36a-like 2981 +/- 70 3410 +/- 137 2856 +/- 113 3117 +/- 174 0.025652764 0.246811545 0.126170814 0.073202304RYBP RING1 and YY1 binding protein 922 +/- 102 1454 +/- 142 927 +/- 96 1306 +/- 164 0.013634466 0.088025095 0.068890175 0.312410297S100A6 S100 calcium binding protein A6 (calcyclin) 923 +/- 64 1156 +/- 72 682 +/- 81 1085 +/- 58 0.035962432 0.003149417 0.220246563 0.1084609SDS serine dehydratase 467 +/- 22 597 +/- 50 542 +/- 35 590 +/- 52 0.048647881 0.469206805 0.31742044 0.68039198SELPLG selectin P ligand 660 +/- 60 886 +/- 79 469 +/- 46 573 +/- 50 0.047568029 0.159000541 0.055121434 0.325228323SERPINB6 serpin peptidase inhibitor, clade B (ovalbumin), member 6 139 +/- 16 197 +/- 19 232 +/- 20 249 +/- 10 0.040554888 0.469388785 0.204045641 0.772834173SERPINB8 serpin peptidase inhibitor, clade B (ovalbumin), member 8 103 +/- 14 142 +/- 10 101 +/- 7 125 +/- 8 0.0451369 0.047732079 0.210402796 0.567889163SERPINF1 serpin peptidase inhibitor, clade F (alpha-2 antiplasmin, pigment epithelium derived factor), member 1 508 +/- 96 868 +/- 124 280 +/- 49 579 +/- 121 0.046244604 0.067889475 0.204822794 0.17769943SLC12A9 solute carrier family 12 (potassium/chloride transporters), member 9 1093 +/- 101 1413 +/- 80 1023 +/- 47 1257 +/- 43 0.033133089 0.005050841 0.144496165 0.152042307SLC22A18 solute carrier family 22 (organic cation transporter), member 18 269 +/- 23 400 +/- 39 191 +/- 11 317 +/- 21 0.019838905 0.001619511 0.11369647 0.044955166SLC26A2 solute carrier family 26 (sulfate transporter), member 2 87 +/- 10 217 +/- 49 135 +/- 50 223 +/- 61 0.045721894 0.294341205 0.128849196 0.252088842SLC37A4 solute carrier family 37 (glycerol-6-phosphate transporter), member 4 195 +/- 20 266 +/- 23 170 +/- 18 236 +/- 25 0.04461133 0.068064874 0.174647238 0.276966572SLC39A4 solute carrier family 39 (zinc transporter), member 4 534 +/- 35 698 +/- 42 516 +/- 28 599 +/- 44 0.014272734 0.152656506 0.216545695 0.061295951SNAPC5 small nuclear RNA activating complex, polypeptide 5, 19kDa 221 +/- 25 289 +/- 15 232 +/- 9 285 +/- 45 0.045724345 0.302886724 0.260286025 0.490432514SOHLH2 spermatogenesis and oogenesis specific basic helix-loop-helix 2 101 +/- 10 163 +/- 15 88 +/- 6 159 +/- 11 0.007052751 0.001346771 0.113962623 0.033681699SRP19 signal recognition particle 19kDa 2698 +/- 166 3239 +/- 67 2572 +/- 101 3210 +/- 30 0.021094707 0.001032739 0.112768564 0.012163432SS18L2 synovial sarcoma translocation gene on chromosome 18-like 2 2273 +/- 100 2573 +/- 55 2299 +/- 38 2484 +/- 84 0.030670736 0.093922649 0.066332766 0.018151952SSR3 signal sequence receptor, gamma (translocon-associated protein gamma) 1416 +/- 40 1776 +/- 112 1570 +/- 46 1920 +/- 158 0.022161034 0.090364437 0.152255232 0.636182123SSU72 SSU72 RNA polymerase II CTD phosphatase homolog (S. cerevisiae) 2015 +/- 93 2625 +/- 115 1716 +/- 93 2050 +/- 54 0.002266345 0.015168408 0.111942881 0.067295625STAT5B signal transducer and activator of transcription 5B 521 +/- 41 647 +/- 33 390 +/- 30 402 +/- 19 0.037838558 0.730509064 0.095960107 0.569242292STOM stomatin 2053 +/- 253 2990 +/- 261 1953 +/- 163 2755 +/- 171 0.027515679 0.008200839 0.063237653 0.157507683TALDO1 transaldolase 1 955 +/- 59 1652 +/- 264 1013 +/- 64 1727 +/- 292 0.045456477 0.069640764 0.071866139 0.051387335TAP1 transporter 1, ATP-binding cassette, sub-family B (MDR/TAP) 270 +/- 14 334 +/- 23 295 +/- 13 305 +/- 17 0.046261676 0.667672576 0.413727731 0.609393915TATDN3 TatD DNase domain containing 3 116 +/- 9 169 +/- 11 138 +/- 16 192 +/- 10 0.0041436 0.02164698 0.07241459 0.055340933TBC1D2B TBC1 domain family, member 2B 261 +/- 20 351 +/- 28 327 +/- 28 322 +/- 34 0.028369212 -0.92466454 0.089305832 0.475598917TCEAL4 transcription elongation factor A (SII)-like 4 8509 +/- 229 10384 +/- 384 8133 +/- 200 10329 +/- 553 0.00289964 0.013325761 0.097909518 0.138275737TMED4 transmembrane emp24 protein transport domain containing 4 1134 +/- 55 1431 +/- 104 1087 +/- 50 1361 +/- 59 0.036499694 0.007200925 0.077299985 0.024735739TMEM106C transmembrane protein 106C 1970 +/- 98 2345 +/- 128 1940 +/- 209 2804 +/- 219 0.043413259 0.019261834 0.312849989 0.22733026TMEM11 transmembrane protein 11 845 +/- 33 981 +/- 25 769 +/- 31 945 +/- 37 0.00892987 0.006195045 0.139897829 0.106812496TMEM51 transmembrane protein 51 459 +/- 34 555 +/- 15 354 +/- 21 396 +/- 28 0.038460501 0.277147916 0.135615529 0.595645431TMEM62 transmembrane protein 62 272 +/- 20 338 +/- 21 254 +/- 9 273 +/- 20 0.050413093 0.433539011 0.06655727 0.798808819TMEM87B Transmembrane protein 87B 96 +/- 30 190 +/- 26 87 +/- 22 198 +/- 10 0.039793595 0.002630566 0.180729609 0.020908784TPD52 tumor protein D52 200 +/- 13 258 +/- 21 346 +/- 17 380 +/- 12 0.047386657 0.132678126 0.15779761 0.243533556TRIO Triple functional domain (PTPRF interacting) 232 +/- 36 388 +/- 49 416 +/- 22 423 +/- 36 0.030345502 0.867578535 0.151460038 0.623949123TRIP6 thyroid hormone receptor interactor 6 448 +/- 39 566 +/- 21 435 +/- 17 459 +/- 14 0.030822702 0.305348649 0.129142373 0.855060689TRMT12 tRNA methyltranferase 12 homolog (S. cerevisiae) 506 +/- 22 617 +/- 34 498 +/- 40 575 +/- 20 0.023410365 0.128590246 0.350543775 0.455650939TRUB2 TruB pseudouridine (psi) synthase homolog 2 (E. coli) 855 +/- 93 1100 +/- 56 795 +/- 42 1011 +/- 37 0.052142304 0.003952869 0.128420178 0.100419906TSC22D2 TSC22 domain family, member 2 2203 +/- 83 2607 +/- 109 2346 +/- 100 2554 +/- 91 0.015867316 0.157062537 0.065162361 0.594418259TSEN34 tRNA splicing endonuclease 34 homolog (S. cerevisiae) 991 +/- 52 1198 +/- 77 784 +/- 49 985 +/- 39 0.052950505 0.010934018 0.353018347 0.022477243TTC27 tetratricopeptide repeat domain 27 442 +/- 31 538 +/- 25 493 +/- 26 422 +/- 31 0.039954075 -0.12036136 0.161221328 0.218502308TTF1 transcription termination factor, RNA polymerase I 700 +/- 25 781 +/- 23 793 +/- 51 789 +/- 50 0.039866804 -0.961344327 0.075517401 0.738303819UNC84A unc-84 homolog A (C. elegans) 302 +/- 15 412 +/- 31 411 +/- 55 383 +/- 30 0.014892189 -0.669886746 0.115425415 0.865350755USP31 ubiquitin specific peptidase 31 360 +/- 19 436 +/- 27 499 +/- 36 687 +/- 45 0.045849929 0.011486388 0.133505683 0.121915743USP53 ubiquitin specific peptidase 53 346 +/- 23 476 +/- 40 443 +/- 44 496 +/- 19 0.022037695 0.304396782 0.149763107 0.639937165
S4- MSI correlated and non-correlated ARGs.xls Page 29

Young vs Aged MSI CorrelationsSymbol Description Young CA Aged CA Young DG Aged DG in CA in DG in CA in DGVASH1 Vasohibin 1 535 +/- 16 744 +/- 63 1011 +/- 90 999 +/- 53 0.019830604 -0.908354959 0.071398018 0.915214345WDR71 WD repeat domain 71 1094 +/- 63 1355 +/- 56 978 +/- 43 1086 +/- 116 0.011098704 0.422751508 0.096365296 0.765643542WHSC1 Wolf-Hirschhorn syndrome candidate 1 291 +/- 18 359 +/- 21 296 +/- 30 337 +/- 23 0.033598182 0.306910115 0.057417704 0.216523417XRCC5 X-ray repair complementing defective repair in Chinese hamster cells 5 (double-strand-break rejoining; Ku a 1545 +/- 90 1864 +/- 59 1424 +/- 33 1774 +/- 97 0.016491456 0.01936134 0.248647388 0.118649987YME1L1 YME1-like 1 (S. cerevisiae) 3560 +/- 193 4334 +/- 244 3653 +/- 205 4168 +/- 128 0.033153059 0.065747004 0.355158898 0.303655244ZC3H5 zinc finger CCCH-type containing 5 511 +/- 50 651 +/- 39 464 +/- 35 503 +/- 41 0.053680213 0.490227473 0.186474076 0.558839087ZFP90 zinc finger protein 90 homolog (mouse) 3528 +/- 279 4260 +/- 161 3870 +/- 345 4323 +/- 157 0.052575066 0.270958779 0.091568156 0.4421446ZNF131 Zinc finger protein 131 (clone pHZ-10) 124 +/- 18 238 +/- 29 160 +/- 22 267 +/- 25 0.010052177 0.011395349 0.126156615 0.066808291ZNF25 zinc finger protein 25 1239 +/- 41 1519 +/- 51 1305 +/- 50 1653 +/- 73 0.001854661 0.005249539 0.085885628 0.065991508ZNF278 zinc finger protein 278 239 +/- 11 277 +/- 12 317 +/- 19 300 +/- 16 0.042714892 -0.486719149 0.060185824 0.746507111ZNF358 zinc finger protein 358 556 +/- 13 684 +/- 43 872 +/- 81 877 +/- 12 0.02865496 0.953890637 0.086471072 0.979644641ZNF45 zinc finger protein 45 279 +/- 18 336 +/- 17 332 +/- 22 400 +/- 18 0.049501338 0.045353643 0.241044901 0.225942957ZNF564 zinc finger protein 564 324 +/- 32 430 +/- 24 307 +/- 19 390 +/- 12 0.02532311 0.006175825 0.087713265 0.046735044ZRANB1 zinc finger, RAN-binding domain containing 1 849 +/- 44 1040 +/- 45 887 +/- 57 1073 +/- 52 0.012514974 0.039302018 0.25207767 0.26501462Downregulated with Age in CA, not MSI CorrelatedACADL acyl-Coenzyme A dehydrogenase, long chain 234 +/- 12 184 +/- 12 226 +/- 9 179 +/- 19 -0.013598903 -0.065476551 0.095939092 0.084506896ACAT1 acetyl-Coenzyme A acetyltransferase 1 (acetoacetyl Coenzyme A thiolase) 4099 +/- 188 3515 +/- 106 3250 +/- 137 3238 +/- 137 -0.027045728 -0.954273333 0.112810616 0.970582072AFTIPHILIN aftiphilin protein 689 +/- 9 552 +/- 54 739 +/- 50 699 +/- 28 -0.050685083 -0.50296709 0.135389216 0.618589192AHSA1 AHA1, activator of heat shock 90kDa protein ATPase homolog 1 (yeast) 3672 +/- 96 3351 +/- 98 3165 +/- 122 3121 +/- 103 -0.041810364 -0.788980672 0.074586308 0.708170741AKAP8L A kinase (PRKA) anchor protein 8-like 115 +/- 15 71 +/- 9 120 +/- 16 99 +/- 3 -0.038473309 -0.237324381 0.094010653 0.464845005ANAPC1 anaphase promoting complex subunit 1 942 +/- 48 810 +/- 32 776 +/- 30 736 +/- 25 -0.048251996 -0.328607776 0.096262188 0.410849046APLP2 Amyloid beta (A4) precursor-like protein 2 397 +/- 24 319 +/- 21 448 +/- 28 403 +/- 22 -0.037329387 -0.240439165 0.077951047 0.515907206ARHGAP26 Rho GTPase activating protein 26 1897 +/- 171 1395 +/- 80 1867 +/- 154 1491 +/- 130 -0.031968056 -0.09582784 0.095924755 0.130662311ARIH2 ariadne homolog 2 (Drosophila) 1295 +/- 30 1073 +/- 49 1029 +/- 41 1044 +/- 54 -0.004512849 0.829441242 0.114765113 0.77566376ASAHL N-acylsphingosine amidohydrolase (acid ceramidase)-like 157 +/- 9 116 +/- 12 192 +/- 21 128 +/- 16 -0.026696429 -0.03809744 0.059545479 0.032905844ASB6 ankyrin repeat and SOCS box-containing 6 176 +/- 8 150 +/- 8 238 +/- 19 208 +/- 4 -0.052556972 -0.185876983 0.185406644 0.328432717ATP5D ATP synthase, H+ transporting, mitochondrial F1 complex, delta subunit 1719 +/- 90 1425 +/- 89 2012 +/- 103 1836 +/- 84 -0.0426828 -0.215554546 0.19475628 0.608712053ATP8B2 ATPase, Class I, type 8B, member 2 1260 +/- 36 1102 +/- 43 1508 +/- 74 1279 +/- 39 -0.018717994 -0.027391031 0.071600827 0.129279316BICD2 bicaudal D homolog 2 (Drosophila) 1123 +/- 23 818 +/- 85 1051 +/- 110 902 +/- 129 -0.014435203 -0.404725053 0.353502736 0.79558013BOP1 block of proliferation 1 292 +/- 18 210 +/- 26 357 +/- 15 258 +/- 9 -0.026404469 -0.000563916 0.093683447 0.002243383BRD2 bromodomain containing 2 683 +/- 52 469 +/- 53 945 +/- 41 572 +/- 72 -0.016524852 -0.003473977 0.280047378 0.097054419BRWD2 bromodomain and WD repeat domain containing 2 564 +/- 69 382 +/- 3 593 +/- 41 404 +/- 22 -0.046177058 -0.004233115 0.137620747 0.03576959BUB3 BUB3 budding uninhibited by benzimidazoles 3 homolog (yeast) 4140 +/- 127 3656 +/- 142 3469 +/- 169 3052 +/- 117 -0.029420059 -0.074617994 0.249553418 0.146021249CACNA1A calcium channel, voltage-dependent, P/Q type, alpha 1A subunit 961 +/- 89 664 +/- 44 1617 +/- 110 993 +/- 119 -0.018644654 -0.00419325 0.07476412 0.121622277CBARA1 calcium binding atopy-related autoantigen 1 1698 +/- 52 1549 +/- 37 1445 +/- 72 1507 +/- 58 -0.044069618 0.517736925 0.140672141 0.701144959CCDC8 coiled-coil domain containing 8 394 +/- 24 308 +/- 20 374 +/- 23 310 +/- 19 -0.020152331 -0.059179115 0.135753437 0.193514213CCT7 chaperonin containing TCP1, subunit 7 (eta) 926 +/- 48 785 +/- 35 940 +/- 51 822 +/- 54 -0.039816803 -0.146650758 0.091686639 0.838260292CD5 CD5 molecule 143 +/- 6 90 +/- 18 125 +/- 19 122 +/- 17 -0.034030857 -0.906423285 0.232602789 0.680417185CEP63 centrosomal protein 63kDa 153 +/- 12 107 +/- 16 136 +/- 25 82 +/- 13 -0.045694317 -0.097117154 0.437954492 0.368089469CKAP1 cytoskeleton associated protein 1 1486 +/- 142 1105 +/- 70 1406 +/- 119 962 +/- 130 -0.04564535 -0.033776237 0.283899216 0.20179708CLEC14A C-type lectin domain family 14, member A 139 +/- 9 108 +/- 10 129 +/- 11 111 +/- 13 -0.040997297 -0.334514157 0.225561185 0.832977876CLK4 CDC-like kinase 4 2680 +/- 52 2262 +/- 87 2336 +/- 119 1847 +/- 72 -0.003236721 -0.007870411 0.089082266 0.093570671CNTNAP2 contactin associated protein-like 2 4333 +/- 298 3178 +/- 404 3580 +/- 316 3606 +/- 414 -0.046274165 0.961216982 0.064276853 0.663013879CORO7 coronin 7 1060 +/- 57 830 +/- 78 1137 +/- 43 970 +/- 97 -0.040219064 -0.170909038 0.127917319 0.532821353
S4- MSI correlated and non-correlated ARGs.xls Page 30

Young vs Aged MSI CorrelationsSymbol Description Young CA Aged CA Young DG Aged DG in CA in DG in CA in DGCREBBP CREB binding protein (Rubinstein-Taybi syndrome) 1537 +/- 76 1340 +/- 29 1670 +/- 25 1368 +/- 90 -0.047722227 -0.026138044 0.218216685 0.238085085DCTN4 dynactin 4 (p62) 2167 +/- 114 1786 +/- 115 2057 +/- 72 1769 +/- 87 -0.03959171 -0.033853445 0.439314547 0.327635314DFFA DNA fragmentation factor, 45kDa, alpha polypeptide 632 +/- 34 537 +/- 27 694 +/- 27 593 +/- 28 -0.054305353 -0.031207415 0.19627277 0.297678699DKFZP779L1PRO0845 1349 +/- 59 1055 +/- 62 1202 +/- 31 955 +/- 46 -0.006254246 -0.002851053 0.117590109 0.084762499DNAJB6 DnaJ (Hsp40) homolog, subfamily B, member 6 3673 +/- 317 2730 +/- 233 3649 +/- 170 3344 +/- 450 -0.039541985 -0.553793572 0.055344944 0.406183815DNPEP aspartyl aminopeptidase 711 +/- 27 636 +/- 18 663 +/- 42 616 +/- 40 -0.04453319 -0.436049287 0.09261531 0.349729268EBF2 early B-cell factor 2 119 +/- 5 103 +/- 3 119 +/- 8 91 +/- 19 -0.028084204 -0.241927208 0.082061252 0.405829609EGLN1 egl nine homolog 1 (C. elegans) 599 +/- 67 426 +/- 24 799 +/- 81 561 +/- 31 -0.050058466 -0.031492154 0.074236615 0.052091752EIF3S9 eukaryotic translation initiation factor 3, subunit 9 eta, 116kDa 3204 +/- 180 2481 +/- 170 2961 +/- 100 2491 +/- 175 -0.01552974 -0.055558645 0.121320466 0.49331045ETF1 eukaryotic translation termination factor 1 243 +/- 4 206 +/- 11 313 +/- 29 253 +/- 16 -0.015712267 -0.113143778 0.073688839 0.171391325FBXL14 F-box and leucine-rich repeat protein 14 1117 +/- 114 749 +/- 52 1272 +/- 40 979 +/- 38 -0.022120684 -0.000484356 0.075790002 0.03101781FBXL5 F-box and leucine-rich repeat protein 5 281 +/- 17 233 +/- 9 307 +/- 13 264 +/- 18 -0.036267776 -0.084253276 0.102507593 0.237619367FLJ42875 FLJ42875 protein 320 +/- 16 256 +/- 17 326 +/- 29 256 +/- 19 -0.019359676 -0.079188515 0.316538742 0.154758509FRMD4A FERM domain containing 4A 926 +/- 37 796 +/- 36 829 +/- 20 663 +/- 39 -0.03071271 -0.008664546 0.131708592 0.03971463GALNTL2 UDP-N-acetyl-alpha-D-galactosamine:polypeptide N-acetylgalactosaminyltransferase-like 2 448 +/- 45 296 +/- 38 272 +/- 18 235 +/- 32 -0.026776319 -0.34309929 0.089751425 0.366674468GGTL3 gamma-glutamyltransferase-like 3 2529 +/- 133 2114 +/- 121 2837 +/- 156 2630 +/- 103 -0.044208216 -0.298117483 0.1027986 0.493083164GK glycerol kinase 118 +/- 7 90 +/- 9 112 +/- 5 102 +/- 8 -0.034464658 -0.312875449 0.10037188 0.146850481GORASP2 golgi reassembly stacking protein 2, 55kDa 1888 +/- 69 1700 +/- 21 1893 +/- 58 1861 +/- 71 -0.040739466 -0.737723285 0.160559526 0.635123478GRSF1 G-rich RNA sequence binding factor 1 2254 +/- 87 1851 +/- 104 2017 +/- 89 2006 +/- 155 -0.014164872 -0.955008368 0.178716788 0.278694007GTF2IRD2 GTF2I repeat domain containing 2 310 +/- 18 224 +/- 27 365 +/- 33 210 +/- 55 -0.028055011 -0.047209612 0.482695937 0.339189571HNRPA3P1 heterogeneous nuclear ribonucleoprotein A3 pseudogene 1 1370 +/- 59 1182 +/- 49 1527 +/- 55 1349 +/- 65 -0.033981032 -0.06724799 0.159137479 0.200331911HTR3A 5-hydroxytryptamine (serotonin) receptor 3A 166 +/- 21 103 +/- 13 182 +/- 25 126 +/- 12 -0.032309566 -0.078401472 0.251783708 0.11535464HYLS1 hydrolethalus syndrome 1 748 +/- 26 632 +/- 33 635 +/- 12 572 +/- 47 -0.020014447 -0.253758296 0.058006283 0.963550522ISG20L1 interferon stimulated exonuclease gene 20kDa-like 1 320 +/- 14 256 +/- 21 292 +/- 17 271 +/- 4 -0.034363224 -0.270544755 0.331455782 0.529138598ITCH itchy homolog E3 ubiquitin protein ligase (mouse) 198 +/- 29 78 +/- 10 178 +/- 21 75 +/- 12 -0.007101125 -0.002594673 0.06165396 0.02277359KCNH2 potassium voltage-gated channel, subfamily H (eag-related), member 2 579 +/- 45 458 +/- 18 529 +/- 26 467 +/- 29 -0.043132112 -0.147815318 0.100719089 0.50597957KCNIP1 Kv channel interacting protein 1 233 +/- 13 189 +/- 12 243 +/- 17 208 +/- 14 -0.033419928 -0.148766965 0.240521615 0.027191385KCNK17 potassium channel, subfamily K, member 17 175 +/- 17 111 +/- 10 253 +/- 20 177 +/- 20 -0.011001664 -0.023816161 0.072727066 0.084128799KCNQ2 potassium voltage-gated channel, KQT-like subfamily, member 2 279 +/- 12 234 +/- 12 261 +/- 17 237 +/- 14 -0.025523326 -0.286495366 0.170292018 0.331447035KIF21A kinesin family member 21A 3821 +/- 217 2757 +/- 229 4422 +/- 302 3119 +/- 95 -0.007042682 -0.006370346 0.063541337 0.033469949KLF13 Kruppel-like factor 13 1790 +/- 60 1158 +/- 151 2000 +/- 133 1313 +/- 196 -0.006850529 -0.022009748 0.148842536 0.386259152LETM2 leucine zipper-EF-hand containing transmembrane protein 2 125 +/- 7 98 +/- 8 102 +/- 12 112 +/- 8 -0.025883089 0.50170882 0.098267951 0.334409248LRP11 low density lipoprotein receptor-related protein 11 4775 +/- 167 4237 +/- 116 4754 +/- 143 4135 +/- 226 -0.026691143 -0.054358382 0.213604269 0.477677495LSM8 LSM8 homolog, U6 small nuclear RNA associated (S. cerevisiae) 638 +/- 35 457 +/- 26 600 +/- 28 455 +/- 21 -0.002364057 -0.00265354 0.113069846 0.050929646LTBP1 latent transforming growth factor beta binding protein 1 361 +/- 17 236 +/- 20 447 +/- 38 218 +/- 28 -0.00071457 -0.000958711 0.098246847 0.0743978MAML2 Mastermind-like 2 (Drosophila) 200 +/- 11 150 +/- 14 192 +/- 13 180 +/- 9 -0.018401983 -0.467974892 0.081825474 0.371377257MAP1LC3A microtubule-associated protein 1 light chain 3 alpha 3967 +/- 274 2363 +/- 245 4800 +/- 253 2961 +/- 404 -0.00144192 -0.00636558 0.059834641 0.163614208MAP4K2 mitogen-activated protein kinase kinase kinase kinase 2 313 +/- 12 258 +/- 18 306 +/- 26 255 +/- 7 -0.032048187 -0.101176641 0.061029039 0.336908863MARK2 MAP/microtubule affinity-regulating kinase 2 823 +/- 33 702 +/- 30 941 +/- 40 765 +/- 25 -0.023035541 -0.005706683 0.135183632 0.132393049MASP1 mannan-binding lectin serine peptidase 1 (C4/C2 activating component of Ra-reactive factor) 248 +/- 14 181 +/- 18 233 +/- 11 210 +/- 10 -0.013608526 -0.157176111 0.076589254 0.472558657MAX MYC associated factor X 1031 +/- 87 779 +/- 39 1103 +/- 54 911 +/- 39 -0.034213781 -0.019564295 0.067448525 0.207610623MCOLN1 mucolipin 1 869 +/- 34 752 +/- 20 733 +/- 41 707 +/- 21 -0.019150725 -0.582761891 0.117746827 0.69446208MDH1B malate dehydrogenase 1B, NAD (soluble) 438 +/- 14 356 +/- 17 295 +/- 17 277 +/- 4 -0.004634236 -0.331350201 0.064732039 0.410328189MED19 mediator of RNA polymerase II transcription, subunit 19 homolog (S. cerevisiae) 1426 +/- 32 1306 +/- 36 1307 +/- 44 1177 +/- 45 -0.032648163 -0.069494943 0.287068914 0.296589671
S4- MSI correlated and non-correlated ARGs.xls Page 31

Young vs Aged MSI CorrelationsSymbol Description Young CA Aged CA Young DG Aged DG in CA in DG in CA in DGMEIS3 Meis1, myeloid ecotropic viral integration site 1 homolog 3 (mouse) 654 +/- 42 481 +/- 45 714 +/- 138 476 +/- 75 -0.019556222 -0.170504977 0.211309688 0.481349059METT11D1 methyltransferase 11 domain containing 1 227 +/- 25 163 +/- 12 203 +/- 17 195 +/- 18 -0.04992278 -0.753511612 0.064328415 0.489343761MLL5 myeloid/lymphoid or mixed-lineage leukemia 5 (trithorax homolog, Drosophila) 1973 +/- 306 931 +/- 182 2063 +/- 365 760 +/- 108 -0.018738458 -0.014618871 0.060188689 0.038757976MNS1 meiosis-specific nuclear structural 1 261 +/- 32 177 +/- 16 182 +/- 17 182 +/- 19 -0.048125733 0.990467511 0.077835709 0.921570071MOBKL2A MOB1, Mps One Binder kinase activator-like 2A (yeast) 166 +/- 17 108 +/- 15 199 +/- 13 144 +/- 22 -0.030365997 -0.067489025 0.177654419 0.013714181MOBKL2B MOB1, Mps One Binder kinase activator-like 2B (yeast) 138 +/- 10 100 +/- 11 127 +/- 7 86 +/- 4 -0.028521632 -0.001403645 0.062958159 0.055919928MPP6 membrane protein, palmitoylated 6 (MAGUK p55 subfamily member 6) 324 +/- 28 239 +/- 22 340 +/- 27 328 +/- 27 -0.038754208 -0.752352879 0.060388315 0.912007047MTHFD2L methylenetetrahydrofolate dehydrogenase (NADP+ dependent) 2-like 641 +/- 53 440 +/- 16 569 +/- 21 415 +/- 23 -0.01097374 -0.000813626 0.082986138 0.023699547NCOA5 nuclear receptor coactivator 5 279 +/- 3 222 +/- 19 348 +/- 18 305 +/- 13 -0.02781036 -0.088612818 0.076350182 0.225401731NFAT5 nuclear factor of activated T-cells 5, tonicity-responsive 3892 +/- 75 3653 +/- 71 3843 +/- 56 3902 +/- 34 -0.043531938 0.390589883 0.0610563 0.353576388OGT O-linked N-acetylglucosamine (GlcNAc) transferase (UDP-N-acetylglucosamine:polypeptide-N-acetylglucos 1094 +/- 60 899 +/- 25 1800 +/- 83 1694 +/- 67 -0.022120839 -0.348760409 0.17190686 0.652687815ORC4L origin recognition complex, subunit 4-like (yeast) 941 +/- 34 812 +/- 27 846 +/- 20 797 +/- 54 -0.014334478 -0.430875402 0.073147755 0.582952723OSBPL6 oxysterol binding protein-like 6 2412 +/- 155 1905 +/- 45 2468 +/- 135 1963 +/- 75 -0.02064243 -0.012145114 0.093437471 0.227481628PABPC5 poly(A) binding protein, cytoplasmic 5 153 +/- 5 103 +/- 10 160 +/- 15 110 +/- 8 -0.003193097 -0.019984793 0.089753987 0.125170727PALMD palmdelphin 203 +/- 17 151 +/- 13 248 +/- 26 204 +/- 20 -0.039876333 -0.211303292 0.202666039 0.239841698PDGFB platelet-derived growth factor beta polypeptide (simian sarcoma viral (v-sis) oncogene homolog) 468 +/- 21 394 +/- 23 454 +/- 37 444 +/- 37 -0.042901277 -0.846960946 0.099304223 0.606204694PHF20 PHD finger protein 20 592 +/- 14 520 +/- 25 526 +/- 18 503 +/- 18 -0.036912135 -0.38866108 0.18622594 0.853931386PIGG phosphatidylinositol glycan, class G 748 +/- 78 456 +/- 62 758 +/- 104 521 +/- 43 -0.015859394 -0.075387155 0.095884911 0.25581642PIP5K3 phosphatidylinositol-3-phosphate/phosphatidylinositol 5-kinase, type III 1685 +/- 66 1442 +/- 57 1387 +/- 56 1232 +/- 71 -0.020365624 -0.126116352 0.179359707 0.222707977PLEKHA5 Pleckstrin homology domain containing, family A member 5 566 +/- 51 398 +/- 55 952 +/- 56 599 +/- 55 -0.048982668 -0.001487041 0.094460525 0.045348518PLK2 polo-like kinase 2 (Drosophila) 4576 +/- 519 3141 +/- 223 3989 +/- 267 3502 +/- 175 -0.039743426 -0.163947479 0.075994905 0.716639141PLXNA2 Plexin A2 261 +/- 24 167 +/- 18 177 +/- 13 194 +/- 14 -0.011534762 0.392874415 0.094225635 0.657815901PNLDC1 poly(A)-specific ribonuclease (PARN)-like domain containing 1 203 +/- 62 42 +/- 1 212 +/- 57 60 +/- 6 -0.047861142 -0.044611804 0.195803754 0.13121375POLR2J polymerase (RNA) II (DNA directed) polypeptide J, 13.3kDa 2255 +/- 115 1934 +/- 54 2042 +/- 31 1942 +/- 47 -0.039376867 -0.118458131 0.065244338 0.176140865PPP2R5C protein phosphatase 2, regulatory subunit B (B56), gamma isoform 1380 +/- 94 967 +/- 75 1220 +/- 33 860 +/- 51 -0.006726147 -0.000552639 0.108054221 0.023206134PROCA1 proline-rich cyclin A1-interacting protein 188 +/- 17 132 +/- 6 195 +/- 11 162 +/- 7 -0.01904541 -0.03118106 0.104932479 0.258450261PSMA6 proteasome (prosome, macropain) subunit, alpha type, 6 5154 +/- 216 4141 +/- 221 4713 +/- 143 4252 +/- 182 -0.00831829 -0.081581543 0.13117447 0.020298228PTBP2 polypyrimidine tract binding protein 2 2307 +/- 103 1782 +/- 161 2298 +/- 39 1811 +/- 152 -0.02381853 -0.030830317 0.438613881 0.216102612PUM2 pumilio homolog 2 (Drosophila) 2633 +/- 77 1935 +/- 111 2753 +/- 131 1997 +/- 141 -0.000604458 -0.003648263 0.05562315 0.081645211PVRL1 poliovirus receptor-related 1 (herpesvirus entry mediator C; nectin) 255 +/- 18 185 +/- 22 246 +/- 25 246 +/- 12 -0.03258425 0.995348068 0.072251382 0.79964555RAE1 RAE1 RNA export 1 homolog (S. pombe) 1175 +/- 43 1040 +/- 42 1125 +/- 36 1035 +/- 26 -0.048285977 -0.073808401 0.063972993 0.34033863RALGPS2 Ral GEF with PH domain and SH3 binding motif 2 280 +/- 27 193 +/- 19 326 +/- 37 295 +/- 16 -0.026245547 -0.484098917 0.24249743 0.660598525RASGRF1 Ras protein-specific guanine nucleotide-releasing factor 1 125 +/- 16 76 +/- 11 145 +/- 12 104 +/- 10 -0.031471125 -0.025192212 0.075248629 0.025369786RBM19 RNA binding motif protein 19 727 +/- 55 514 +/- 46 537 +/- 38 381 +/- 60 -0.014212352 -0.062673075 0.075679997 0.198486376RFT1 RFT1 homolog (S. cerevisiae) 144 +/- 6 123 +/- 7 159 +/- 9 123 +/- 5 -0.053411546 -0.009489794 0.11623316 0.018399732RIT2 Ras-like without CAAX 2 609 +/- 31 437 +/- 55 775 +/- 62 568 +/- 48 -0.025575445 -0.027875631 0.077862913 0.062894532RNF10 ring finger protein 10 3235 +/- 192 2478 +/- 121 3155 +/- 83 2677 +/- 130 -0.009517874 -0.017449864 0.082708791 0.409322341RNF40 ring finger protein 40 697 +/- 31 616 +/- 10 876 +/- 27 750 +/- 31 -0.043586854 -0.014864958 0.340172388 0.108042495RPL6 ribosomal protein L6 10615 +/- 183 9845 +/- 191 10876 +/- 273 9843 +/- 437 -0.015594257 -0.085700023 0.060213935 0.312322385RPS12 ribosomal protein S12 4329 +/- 211 3150 +/- 239 3422 +/- 186 2508 +/- 191 -0.004218543 -0.00763633 0.093213947 0.150396701RPS25 ribosomal protein S25 403 +/- 49 270 +/- 30 272 +/- 35 279 +/- 26 -0.049243212 0.872730942 0.063496005 0.92847741SBK1 SH3-binding domain kinase 1 898 +/- 90 609 +/- 68 744 +/- 48 642 +/- 28 -0.029437261 -0.101300628 0.057854755 0.575062095SDCCAG8 serologically defined colon cancer antigen 8 262 +/- 8 225 +/- 12 276 +/- 23 239 +/- 4 -0.027839426 -0.167449419 0.102992468 0.362649026SEC14L1 SEC14-like 1 (S. cerevisiae) 4771 +/- 153 4085 +/- 221 5018 +/- 284 3990 +/- 299 -0.031449238 -0.03470786 0.459700401 0.261595307
S4- MSI correlated and non-correlated ARGs.xls Page 32

Young vs Aged MSI CorrelationsSymbol Description Young CA Aged CA Young DG Aged DG in CA in DG in CA in DGSEC22A SEC22 vesicle trafficking protein homolog A (S. cerevisiae) 388 +/- 11 342 +/- 16 440 +/- 19 453 +/- 44 -0.037119823 0.80456365 0.189501618 0.161012479SEH1L SEH1-like (S. cerevisiae) 297 +/- 24 216 +/- 13 286 +/- 18 233 +/- 18 -0.018529728 -0.067982475 0.087554376 0.032309737SETD6 SET domain containing 6 357 +/- 14 262 +/- 22 362 +/- 8 285 +/- 23 -0.006155276 -0.024760878 0.071339234 0.157550143SFRS7 splicing factor, arginine/serine-rich 7, 35kDa 2011 +/- 79 1722 +/- 78 1994 +/- 57 1707 +/- 55 -0.026627131 -0.005697307 0.056949117 0.011437644SGPL1 sphingosine-1-phosphate lyase 1 613 +/- 28 522 +/- 26 640 +/- 24 524 +/- 12 -0.040205869 -0.002866218 0.231950816 0.057885563SH3GL1 SH3-domain GRB2-like 1 517 +/- 28 419 +/- 30 649 +/- 35 550 +/- 32 -0.037857085 -0.069011192 0.062625953 0.434473869SMU1 Smu-1 suppressor of mec-8 and unc-52 homolog (C. elegans) 1021 +/- 44 845 +/- 49 1000 +/- 21 892 +/- 31 -0.024100861 -0.021557898 0.061954055 0.167536525SNX3 sorting nexin 3 14461 +/- 818 11436 +/- 483 13459 +/- 458 11655 +/- 653 -0.012676168 -0.055871839 0.068929772 0.41830052SORBS2 Sorbin and SH3 domain containing 2 432 +/- 19 353 +/- 14 405 +/- 14 294 +/- 41 -0.007594933 -0.049321265 0.078440767 0.364208937SOX1 SRY (sex determining region Y)-box 1 375 +/- 39 272 +/- 18 455 +/- 28 336 +/- 23 -0.050160547 -0.010004196 0.137008855 0.008571145SPA17 sperm autoantigenic protein 17 537 +/- 65 330 +/- 45 443 +/- 23 329 +/- 17 -0.027597301 -0.0033444 0.094748997 0.03123644SPTBN1 spectrin, beta, non-erythrocytic 1 1270 +/- 153 835 +/- 88 1365 +/- 200 1056 +/- 161 -0.038682956 -0.260651655 0.148603624 0.490188728SRrp35 serine-arginine repressor protein (35 kDa) 851 +/- 61 650 +/- 57 860 +/- 61 692 +/- 42 -0.036873369 -0.05114665 0.063738218 0.19318906SSB Sjogren syndrome antigen B (autoantigen La) 2114 +/- 118 1777 +/- 99 2359 +/- 70 1882 +/- 138 -0.054697646 -0.021627807 0.061261408 0.162029076STK11IP serine/threonine kinase 11 interacting protein 832 +/- 22 692 +/- 33 760 +/- 43 675 +/- 37 -0.007128495 -0.167253036 0.220170601 0.617636968SUB1 SUB1 homolog (S. cerevisiae) 198 +/- 12 153 +/- 13 233 +/- 7 187 +/- 11 -0.029380853 -0.009334405 0.070572835 0.200849812SURF4 surfeit 4 844 +/- 29 730 +/- 19 751 +/- 33 661 +/- 21 -0.010483129 -0.048622922 0.102185092 0.242072965TBC1D14 TBC1 domain family, member 14 2125 +/- 84 1815 +/- 92 1795 +/- 52 1639 +/- 43 -0.031696434 -0.047244724 0.222267241 0.2088684TCF4 transcription factor 4 4852 +/- 158 4083 +/- 243 6014 +/- 463 4769 +/- 717 -0.027614162 -0.187715991 0.383734576 0.930580376TGM2 transglutaminase 2 (C polypeptide, protein-glutamine-gamma-glutamyltransferase) 141 +/- 8 82 +/- 19 137 +/- 20 132 +/- 28 -0.026135081 -0.900788131 0.249611034 0.855752417TMEM132B transmembrane protein 132B 1274 +/- 123 930 +/- 71 1051 +/- 67 730 +/- 54 -0.041704541 -0.004741841 0.240402673 0.156696458TMF1 TATA element modulatory factor 1 2030 +/- 133 1560 +/- 130 2148 +/- 200 1684 +/- 181 -0.029535359 -0.118837708 0.063449444 0.093234516TOR3A torsin family 3, member A 298 +/- 17 220 +/- 15 308 +/- 11 206 +/- 13 -0.006223971 -0.000302833 0.067683608 0.001767536TRA2A transformer-2 alpha 1956 +/- 84 1639 +/- 102 2458 +/- 104 1919 +/- 80 -0.038510101 -0.002776761 0.316371608 0.022918967TRAM2 translocation associated membrane protein 2 242 +/- 13 139 +/- 24 223 +/- 20 171 +/- 18 -0.0059956 -0.081751721 0.055881213 0.108538562TTC19 tetratricopeptide repeat domain 19 2924 +/- 101 1559 +/- 359 3189 +/- 138 1757 +/- 528 -0.011318191 -0.051446777 0.065680723 0.168026491TXNDC9 thioredoxin domain containing 9 1042 +/- 34 872 +/- 30 979 +/- 44 900 +/- 61 -0.003787137 -0.325892684 0.06940985 0.275006362USP15 ubiquitin specific peptidase 15 2158 +/- 53 1639 +/- 107 2009 +/- 51 1697 +/- 92 -0.003134811 -0.023252573 0.058322123 0.324435591UTP18 UTP18, small subunit (SSU) processome component, homolog (yeast) 599 +/- 58 413 +/- 38 673 +/- 50 479 +/- 70 -0.026657729 -0.055462041 0.136250372 0.365674261VAPA VAMP (vesicle-associated membrane protein)-associated protein A, 33kDa 11082 +/- 381 9798 +/- 151 10132 +/- 197 8992 +/- 317 -0.018084373 -0.018773793 0.114900856 0.004102026VPS13B vacuolar protein sorting 13B (yeast) 993 +/- 26 852 +/- 41 949 +/- 24 938 +/- 47 -0.018653886 -0.831077605 0.195255498 0.508974452WAS Wiskott-Aldrich syndrome (eczema-thrombocytopenia) 214 +/- 11 177 +/- 8 239 +/- 10 176 +/- 17 -0.021343083 -0.016448585 0.11705994 0.003993011WDR23 WD repeat domain 23 428 +/- 44 312 +/- 19 348 +/- 33 318 +/- 26 -0.046415226 -0.501503684 0.07550888 0.624083408YTHDF2 YTH domain family, member 2 2059 +/- 97 1665 +/- 58 2492 +/- 66 2178 +/- 98 -0.007866082 -0.031414013 0.112830832 0.432848963ZBTB24 zinc finger and BTB domain containing 24 626 +/- 63 454 +/- 23 608 +/- 38 435 +/- 38 -0.039583377 -0.01011329 0.187721069 0.150985666ZBTB7A zinc finger and BTB domain containing 7A 1920 +/- 64 1641 +/- 79 2555 +/- 279 2188 +/- 127 -0.021473403 -0.27095963 0.11082624 0.597775134ZC3H14 zinc finger CCCH-type containing 14 1650 +/- 138 1245 +/- 70 1782 +/- 55 1603 +/- 67 -0.033219408 -0.072997615 0.084289326 0.475887219ZNF238 zinc finger protein 238 7398 +/- 390 6014 +/- 471 8244 +/- 127 6592 +/- 730 -0.047964266 -0.085760354 0.152232274 0.530061474ZNF592 zinc finger protein 592 288 +/- 9 242 +/- 16 283 +/- 13 268 +/- 16 -0.040745626 -0.501621816 0.141726982 0.577943699ZNF74 zinc finger protein 74 147 +/- 15 91 +/- 13 170 +/- 12 113 +/- 14 -0.018936105 -0.016370007 0.112743819 0.206491307ZNRD1 zinc ribbon domain containing 1 926 +/- 41 625 +/- 37 853 +/- 26 720 +/- 30 -0.000268689 -0.009907701 0.05962573 0.099213787ZNRF1 zinc and ring finger 1 184 +/- 15 139 +/- 13 202 +/- 22 172 +/- 11 -0.045444127 -0.273991269 0.087313118 0.276516176ZRANB3 zinc finger, RAN-binding domain containing 3 569 +/- 41 434 +/- 28 513 +/- 24 455 +/- 29 -0.024725059 -0.165970594 0.134178585 0.524079369ZXDB zinc finger, X-linked, duplicated B 667 +/- 61 496 +/- 39 665 +/- 46 479 +/- 61 -0.044558801 -0.041047339 0.260164736 0.248674131
S4- MSI correlated and non-correlated ARGs.xls Page 33

Young vs Aged MSI CorrelationsSymbol Description Young CA Aged CA Young DG Aged DG in CA in DG in CA in DGUpregulated with Age in DG, not MSI CorrelatedAARSL alanyl-tRNA synthetase like 672 +/- 50 780 +/- 24 666 +/- 26 777 +/- 38 0.090418925 0.046839926 0.009757478 0.092213728ACAA2 acetyl-Coenzyme A acyltransferase 2 (mitochondrial 3-oxoacyl-Coenzyme A thiolase) 589 +/- 56 854 +/- 62 529 +/- 31 645 +/- 33 0.009788915 0.03015292 0.000593989 0.107868689ACP6 acid phosphatase 6, lysophosphatidic 881 +/- 49 984 +/- 51 742 +/- 28 837 +/- 8 0.171551013 0.018151246 0.035515858 0.071011219ACTC actin, alpha, cardiac muscle 84 +/- 15 206 +/- 35 98 +/- 11 212 +/- 35 0.015564453 0.02973628 0.098010841 0.165795281ACTR10 actin-related protein 10 homolog (S. cerevisiae) 6172 +/- 108 6822 +/- 248 6301 +/- 210 7510 +/- 229 0.048300301 0.003988195 0.590192181 0.084527105ACY1 aminoacylase 1 493 +/- 28 523 +/- 20 435 +/- 30 520 +/- 22 0.397211309 0.04872429 0.606441409 0.155182979ADAM10 ADAM metallopeptidase domain 10 1557 +/- 99 1808 +/- 84 1420 +/- 70 1612 +/- 46 0.083712709 0.049117131 0.062791592 0.364935472ADCK4 aarF domain containing kinase 4 430 +/- 24 546 +/- 40 383 +/- 31 503 +/- 38 0.037411918 0.039519137 0.273091814 0.306370996ADD3 adducin 3 (gamma) 2311 +/- 330 3058 +/- 364 3069 +/- 265 3733 +/- 91 0.159837408 0.054267015 0.156960222 0.272186304AHCYL1 S-adenosylhomocysteine hydrolase-like 1 5935 +/- 600 7815 +/- 704 6059 +/- 511 8209 +/- 330 0.07026454 0.007298966 0.178800998 0.194904583AIM1 absent in melanoma 1 368 +/- 97 238 +/- 44 114 +/- 15 175 +/- 22 -0.26550879 0.050898392 0.416903708 0.355564467AKR7A2 aldo-keto reductase family 7, member A2 (aflatoxin aldehyde reductase) 1175 +/- 77 1379 +/- 69 853 +/- 46 1153 +/- 50 0.078149443 0.001840641 0.307065365 0.089284605ALDH3A1 aldehyde dehydrogenase 3 family, memberA1 99 +/- 11 267 +/- 57 115 +/- 22 357 +/- 54 0.031714621 0.008136205 0.140583247 0.129873586AMY1A amylase, alpha 1A; salivary 217 +/- 46 706 +/- 123 210 +/- 34 692 +/- 108 0.008648671 0.00879563 0.208529984 0.155361317ANAPC11 APC11 anaphase promoting complex subunit 11 homolog (yeast) 1418 +/- 65 1478 +/- 46 1036 +/- 22 1185 +/- 40 0.465122624 0.015792697 0.960143563 0.259395397ANKH ankylosis, progressive homolog (mouse) 2365 +/- 119 2794 +/- 121 2527 +/- 92 2834 +/- 84 0.030335857 0.035777518 0.166489153 0.306504297ANKRD10 ankyrin repeat domain 10 912 +/- 51 1028 +/- 46 829 +/- 38 1027 +/- 65 0.11682503 0.035518672 0.166515558 0.216663444ANKRD16 ankyrin repeat domain 16 117 +/- 11 155 +/- 15 124 +/- 12 175 +/- 8 0.078602961 0.005667174 0.409956627 0.082437628ANKS1B ankyrin repeat and sterile alpha motif domain containing 1B 7067 +/- 478 8852 +/- 493 7058 +/- 279 8534 +/- 485 0.026588622 0.035708506 0.007534706 0.11313409APLP1 amyloid beta (A4) precursor-like protein 1 12980 +/- 687 13451 +/- 820 11777 +/- 440 13170 +/- 402 0.669959939 0.04423183 0.621193395 0.203239234ARHGAP1 Rho GTPase activating protein 1 2732 +/- 133 3160 +/- 91 2618 +/- 114 2959 +/- 91 0.026130162 0.045361642 0.13775446 0.424521136ASTN2 Astrotactin 2 149 +/- 10 185 +/- 27 178 +/- 20 260 +/- 21 0.254061804 0.021934515 0.499386651 0.285792225AURKAIP1 aurora kinase A interacting protein 1 1086 +/- 137 1595 +/- 169 1097 +/- 103 1678 +/- 137 0.042673648 0.009991978 0.163010822 0.071334126AYP1 AYP1 protein 1952 +/- 156 2320 +/- 203 1716 +/- 121 2044 +/- 75 0.183417124 0.04991638 0.080897619 0.067434789B2M beta-2-microglobulin 7946 +/- 519 10622 +/- 678 6616 +/- 572 9837 +/- 646 0.011496581 0.005147291 0.04236259 0.105180339BAG5 BCL2-associated athanogene 5 1207 +/- 46 1153 +/- 44 1176 +/- 30 1285 +/- 20 -0.417450154 0.015127155 0.443112885 0.078735196BAX BCL2-associated X protein 831 +/- 23 877 +/- 24 728 +/- 13 807 +/- 21 0.188443016 0.016139953 0.345293714 0.160529309BBX bobby sox homolog (Drosophila) 1408 +/- 90 1558 +/- 89 1131 +/- 18 1251 +/- 43 0.263537884 0.045522952 0.125772394 0.099866251BTBD2 BTB (POZ) domain containing 2 1567 +/- 138 1823 +/- 101 1620 +/- 100 2016 +/- 105 0.168753944 0.02356382 0.450145408 0.068602553BZRP benzodiazapine receptor (peripheral) 565 +/- 74 798 +/- 62 374 +/- 21 504 +/- 36 0.037740141 0.018487277 0.021493421 0.101408274CALCOCO1 calcium binding and coiled-coil domain 1 1651 +/- 65 1696 +/- 88 1450 +/- 9 1669 +/- 54 0.694453646 0.014306965 0.314744804 0.174343623CAPN2 calpain 2, (m/II) large subunit 2440 +/- 204 3016 +/- 132 1931 +/- 137 2492 +/- 70 0.043050555 0.007570247 0.056262271 0.076747121CBX3 chromobox homolog 3 (HP1 gamma homolog, Drosophila) 2091 +/- 138 2460 +/- 88 2478 +/- 74 2807 +/- 90 0.052848432 0.02160915 0.09765007 0.057418071CCDC28A coiled-coil domain containing 28A 2372 +/- 140 2508 +/- 155 2361 +/- 84 2730 +/- 55 0.529130404 0.005847384 0.829814971 0.086578412CCDC46 coiled-coil domain containing 46 98 +/- 13 159 +/- 31 208 +/- 13 282 +/- 17 0.119453512 0.009055816 0.252766594 0.156967942CCNDBP1 cyclin D-type binding-protein 1 1466 +/- 70 1579 +/- 106 1288 +/- 57 1562 +/- 89 0.396873328 0.03535486 0.750233003 0.138580425CCNF cyclin F 133 +/- 13 125 +/- 9 143 +/- 17 196 +/- 13 -0.62394445 0.034926043 0.366478102 0.148804608CCT3 chaperonin containing TCP1, subunit 3 (gamma) 2068 +/- 138 2872 +/- 102 1999 +/- 97 2727 +/- 72 0.001085379 0.000217763 0.075896541 0.061884585CD63 CD63 molecule 3961 +/- 565 4903 +/- 297 3173 +/- 139 3664 +/- 165 0.180362566 0.050995783 0.198091984 0.403602399CD74 CD74 molecule, major histocompatibility complex, class II invariant chain 1810 +/- 283 3714 +/- 547 1215 +/- 171 2317 +/- 340 0.016152974 0.027628935 0.007913266 0.104936148CD81 CD81 molecule 13811 +/- 551 15425 +/- 255 12732 +/- 477 14927 +/- 743 0.032375137 0.041802505 0.194433538 0.42501107CDC42EP1 CDC42 effector protein (Rho GTPase binding) 1 483 +/- 70 667 +/- 95 446 +/- 30 548 +/- 33 0.150233392 0.047947836 0.072241102 0.096734793CDK5RAP3 CDK5 regulatory subunit associated protein 3 2040 +/- 139 2326 +/- 68 1983 +/- 100 2344 +/- 76 0.105901228 0.018857844 0.276131429 0.128142931
S4- MSI correlated and non-correlated ARGs.xls Page 34

Young vs Aged MSI CorrelationsSymbol Description Young CA Aged CA Young DG Aged DG in CA in DG in CA in DGCEP170 centrosomal protein 170kDa 1001 +/- 123 1338 +/- 117 981 +/- 72 1209 +/- 49 0.075320614 0.029524785 0.13195757 0.346627728CFL2 cofilin 2 (muscle) 1198 +/- 120 1807 +/- 334 1128 +/- 106 1503 +/- 117 0.135085777 0.042518055 0.017425991 0.065838282CGI-38 brain specific protein 1185 +/- 160 1693 +/- 328 699 +/- 44 901 +/- 69 0.204303732 0.043389745 0.172850293 0.13587124CKS1B CDC28 protein kinase regulatory subunit 1B 822 +/- 24 945 +/- 35 686 +/- 28 763 +/- 14 0.018041856 0.041455361 0.045112677 0.247541605CMTM3 CKLF-like MARVEL transmembrane domain containing 3 684 +/- 73 783 +/- 21 553 +/- 20 645 +/- 18 0.241348718 0.007505725 0.18807065 0.06727828CMTM5 CKLF-like MARVEL transmembrane domain containing 5 2631 +/- 293 3487 +/- 483 1346 +/- 59 1861 +/- 191 0.166951238 0.051692549 0.069622957 0.070919054CNTN1 contactin 1 1106 +/- 69 1435 +/- 87 1088 +/- 58 1302 +/- 69 0.014910358 0.04357938 0.008978749 0.206808102COPB coatomer protein complex, subunit beta 2361 +/- 106 2533 +/- 108 2354 +/- 49 2670 +/- 101 0.279401813 0.030976886 0.641905093 0.211013543COPS7A COP9 constitutive photomorphogenic homolog subunit 7A (Arabidopsis) 2132 +/- 50 2760 +/- 207 2135 +/- 183 2910 +/- 174 0.027680484 0.01351365 0.352985886 0.252014955COQ3 coenzyme Q3 homolog, methyltransferase (S. cerevisiae) 962 +/- 18 1137 +/- 65 967 +/- 22 1098 +/- 25 0.043000068 0.00382441 0.334787333 0.133082872COTL1 coactosin-like 1 (Dictyostelium) 2231 +/- 123 2629 +/- 248 2186 +/- 97 2676 +/- 151 0.192130519 0.029099849 0.150606173 0.080539828COX4NB COX4 neighbor 1259 +/- 72 1292 +/- 57 1207 +/- 23 1340 +/- 34 0.725012669 0.012695773 0.985407772 0.273186101COX5B cytochrome c oxidase subunit Vb 6825 +/- 788 9221 +/- 528 4736 +/- 885 7292 +/- 122 0.033108929 0.03387958 0.066557107 0.06557043COX6C cytochrome c oxidase subunit VIc 7080 +/- 300 8976 +/- 497 6419 +/- 237 8142 +/- 260 0.011021066 0.0009592 0.204294097 0.061635335CRNKL1 Crn, crooked neck-like 1 (Drosophila) 267 +/- 89 512 +/- 56 270 +/- 68 595 +/- 45 0.046427355 0.003682882 0.102437924 0.059562553CTSL cathepsin L 1295 +/- 116 1543 +/- 70 1117 +/- 86 1413 +/- 26 0.102404334 0.017269758 0.217904315 0.182779481CYCS cytochrome c, somatic 1114 +/- 69 1523 +/- 105 1124 +/- 93 1485 +/- 52 0.010341606 0.010190902 0.183603931 0.132190411D21S2056E DNA segment on chromosome 21 (unique) 2056 expressed sequence 941 +/- 105 1138 +/- 59 786 +/- 44 1023 +/- 84 0.140487651 0.046019942 0.259928769 0.169810671DDB2 damage-specific DNA binding protein 2, 48kDa 98 +/- 11 160 +/- 9 88 +/- 9 129 +/- 8 0.001531774 0.005825251 0.002332177 0.056883278DDX48 DEAD (Asp-Glu-Ala-Asp) box polypeptide 48 1505 +/- 88 1696 +/- 45 1343 +/- 72 1561 +/- 54 0.091721379 0.038877818 0.021703627 0.22882604DIP13B DIP13 beta 720 +/- 55 858 +/- 45 786 +/- 23 921 +/- 33 0.082075834 0.010296974 0.121643478 0.266151183DNAJB4 DnaJ (Hsp40) homolog, subfamily B, member 4 249 +/- 44 273 +/- 40 286 +/- 16 415 +/- 45 0.688849593 0.042425719 0.654877194 0.144355522DNM2 dynamin 2 623 +/- 66 744 +/- 63 541 +/- 14 626 +/- 29 0.214331217 0.040640265 0.145555683 0.079007191DOCK4 dedicator of cytokinesis 4 83 +/- 24 256 +/- 47 145 +/- 31 379 +/- 38 0.011861311 0.00134105 0.068950788 0.102620985DRG2 developmentally regulated GTP binding protein 2 573 +/- 52 606 +/- 35 521 +/- 31 660 +/- 42 0.616675727 0.03142674 0.900796063 0.174145099DUS3L dihydrouridine synthase 3-like (S. cerevisiae) 283 +/- 16 306 +/- 11 221 +/- 15 291 +/- 20 0.273664984 0.02486242 0.371895688 0.144701876EDG7 Endothelial differentiation, lysophosphatidic acid G-protein-coupled receptor, 7 906 +/- 85 1108 +/- 56 920 +/- 115 1256 +/- 85 0.078961072 0.044671982 0.054416416 0.160917877EEF1A1 eukaryotic translation elongation factor 1 alpha 1 11705 +/- 649 13512 +/- 606 11114 +/- 370 12852 +/- 588 0.069427744 0.041287408 0.345674342 0.491407587EFEMP1 EGF-containing fibulin-like extracellular matrix protein 1 5116 +/- 149 5852 +/- 332 4920 +/- 274 5811 +/- 259 0.086310426 0.042474705 0.022277269 0.155373464EFHC2 EF-hand domain (C-terminal) containing 2 234 +/- 19 266 +/- 17 174 +/- 10 237 +/- 7 0.235677986 0.000754633 0.37893931 0.064217335EGLN2 egl nine homolog 2 (C. elegans) 198 +/- 34 157 +/- 24 231 +/- 12 268 +/- 10 -0.343569739 0.043260351 0.445130998 0.416431218EID-3 EID-2-like inhibitor of differentiation-3 1170 +/- 82 1234 +/- 63 1297 +/- 45 1499 +/- 44 0.551202192 0.010925624 0.817641259 0.087902694EIF5B eukaryotic translation initiation factor 5B 746 +/- 19 848 +/- 36 734 +/- 20 791 +/- 15 0.037126904 0.052223377 0.002047749 0.055285422EMD emerin (Emery-Dreifuss muscular dystrophy) 883 +/- 36 950 +/- 27 898 +/- 19 978 +/- 23 0.170861884 0.02664236 0.727309209 0.383579834ENO1 enolase 1, (alpha) 7846 +/- 333 9198 +/- 336 6480 +/- 135 7880 +/- 253 0.016967227 0.002519542 0.07839016 0.056871124EPHB6 EPH receptor B6 1193 +/- 220 1171 +/- 59 814 +/- 60 1044 +/- 67 -0.925674876 0.032398906 0.797284305 0.163483564ERGIC3 ERGIC and golgi 3 2303 +/- 107 2433 +/- 73 2054 +/- 51 2319 +/- 42 0.342528869 0.003142398 0.817773393 0.111969481FARP1 FERM, RhoGEF (ARHGEF) and pleckstrin domain protein 1 (chondrocyte-derived) 387 +/- 68 1140 +/- 179 336 +/- 59 910 +/- 114 0.006669617 0.004168685 0.139806747 0.091282321FN3KRP fructosamine-3-kinase-related protein 2327 +/- 186 2932 +/- 222 2878 +/- 211 3527 +/- 36 0.0643649 0.027114425 0.247655812 0.095468877FSTL1 follistatin-like 1 1444 +/- 104 1350 +/- 62 956 +/- 42 1093 +/- 20 -0.458444517 0.021569149 0.493827998 0.143663151FTL ferritin, light polypeptide 16238 +/- 1033 18500 +/- 704 14150 +/- 408 17258 +/- 618 0.104527143 0.003849721 0.112985505 0.102660672FYCO1 FYVE and coiled-coil domain containing 1 428 +/- 37 875 +/- 195 355 +/- 20 531 +/- 43 0.07053237 0.011509937 0.119591693 0.117650544GABARAP GABA(A) receptor-associated protein 11702 +/- 341 11960 +/- 190 10752 +/- 157 11400 +/- 130 0.528219608 0.011298876 0.558481851 0.063827617GINS1 GINS complex subunit 1 (Psf1 homolog) 2077 +/- 122 2623 +/- 181 2094 +/- 32 2596 +/- 160 0.034320522 0.033856266 0.367407227 0.345335418
S4- MSI correlated and non-correlated ARGs.xls Page 35

Young vs Aged MSI CorrelationsSymbol Description Young CA Aged CA Young DG Aged DG in CA in DG in CA in DGGJA12 gap junction protein, alpha 12, 47kDa 683 +/- 86 921 +/- 117 493 +/- 44 660 +/- 35 0.135739642 0.01554807 0.090239701 0.124677578GLDN gliomedin 316 +/- 58 508 +/- 25 308 +/- 25 409 +/- 21 0.019579409 0.013554132 0.027041741 0.13033409GNB2L1 guanine nucleotide binding protein (G protein), beta polypeptide 2-like 1 8227 +/- 314 9584 +/- 311 7947 +/- 439 9269 +/- 228 0.011821474 0.030345679 0.037887298 0.095970664GPC4 glypican 4 206 +/- 17 250 +/- 35 346 +/- 28 436 +/- 14 0.288748704 0.023211549 0.655360395 0.210196686GPM6B glycoprotein M6B 5149 +/- 133 6879 +/- 254 6195 +/- 386 7340 +/- 323 0.000392904 0.049273197 0.007491822 0.472334046GRHPR glyoxylate reductase/hydroxypyruvate reductase 1359 +/- 124 1733 +/- 104 1291 +/- 74 1730 +/- 83 0.044182681 0.003678999 0.22865394 0.068657893GSN gelsolin (amyloidosis, Finnish type) 4180 +/- 541 5269 +/- 560 2845 +/- 206 3577 +/- 214 0.192734399 0.0363701 0.233600135 0.13201493GUP1 GUP1 glycerol uptake/transporter homolog (S. cerevisiae) 602 +/- 64 1060 +/- 102 467 +/- 55 753 +/- 60 0.004636206 0.006825919 0.00498831 0.056779731HDAC11 Histone deacetylase 11 3200 +/- 431 3729 +/- 400 2319 +/- 144 2838 +/- 131 0.389408521 0.025646011 0.258166221 0.070318402HDAC6 histone deacetylase 6 858 +/- 46 1082 +/- 96 763 +/- 14 907 +/- 33 0.072679649 0.008625125 0.240840634 0.076849185HIGD1B HIG1 domain family, member 1B 225 +/- 13 268 +/- 11 154 +/- 8 203 +/- 12 0.030329094 0.009652683 0.032430077 0.057293297HMG2L1 high-mobility group protein 2-like 1 827 +/- 48 1078 +/- 75 788 +/- 50 931 +/- 40 0.020869135 0.052828578 0.005334313 0.098226025HSD11B1 hydroxysteroid (11-beta) dehydrogenase 1 182 +/- 39 214 +/- 25 78 +/- 15 136 +/- 13 0.503279126 0.015016412 0.586189179 0.060650646HSPB8 heat shock 22kDa protein 8 2202 +/- 213 3231 +/- 299 2037 +/- 225 2797 +/- 223 0.020507528 0.040315812 0.080176878 0.384594436IBRDC3 IBR domain containing 3 179 +/- 43 292 +/- 22 217 +/- 41 344 +/- 26 0.047629109 0.029838298 0.219191824 0.299550357ICAM1 intercellular adhesion molecule 1 (CD54), human rhinovirus receptor 120 +/- 10 185 +/- 13 126 +/- 9 167 +/- 8 0.002775713 0.007973606 0.00122463 0.186165299IFNAR2 interferon (alpha, beta and omega) receptor 2 189 +/- 22 286 +/- 18 155 +/- 25 256 +/- 36 0.007188099 0.051828412 0.04034989 0.129988797IFNGR1 interferon gamma receptor 1 1775 +/- 52 2011 +/- 102 1350 +/- 54 1527 +/- 56 0.075620617 0.049648095 0.031399147 0.095448484IGF2 insulin-like growth factor 2 (somatomedin A) 536 +/- 149 327 +/- 80 242 +/- 33 429 +/- 64 -0.252465811 0.040788384 0.113397395 0.115069891IGSF11 immunoglobulin superfamily, member 11 1835 +/- 127 2330 +/- 191 1702 +/- 60 1916 +/- 70 0.060224614 0.04837478 0.012762648 0.092311293INSIG1 insulin induced gene 1 1796 +/- 160 2510 +/- 276 2251 +/- 175 2909 +/- 224 0.055464099 0.049264887 0.082813206 0.406367142ISG15 ISG15 ubiquitin-like modifier 312 +/- 25 375 +/- 30 216 +/- 17 298 +/- 16 0.142738312 0.007131799 0.108519497 0.204302163ITGB1 integrin, beta 1 (fibronectin receptor, beta polypeptide, antigen CD29 includes MDF2, MSK12) 657 +/- 64 790 +/- 95 641 +/- 35 744 +/- 25 0.281100272 0.041142204 0.113348138 0.078999066ITGB4 integrin, beta 4 433 +/- 101 626 +/- 98 854 +/- 90 1205 +/- 70 0.199322537 0.013636801 0.311950499 0.128101843ITM2A integral membrane protein 2A 1463 +/- 86 1990 +/- 49 1400 +/- 32 1806 +/- 148 0.000728073 0.050000797 0.020938239 0.247782417KIF3A kinesin family member 3A 6022 +/- 351 7526 +/- 490 5756 +/- 353 7952 +/- 415 0.033884807 0.003445953 0.447769441 0.104240769KIF5A kinesin family member 5A 2488 +/- 627 4967 +/- 527 2216 +/- 519 3839 +/- 250 0.013155403 0.025515348 0.069802094 0.168159715KRR1 KRR1, small subunit (SSU) processome component, homolog (yeast) 143 +/- 22 372 +/- 77 168 +/- 37 387 +/- 79 0.030300603 0.048322189 0.282459063 0.327733661LAYN layilin 174 +/- 39 137 +/- 9 89 +/- 5 120 +/- 9 -0.392233427 0.018567123 0.164778022 0.228966628LGMN legumain 2017 +/- 149 2333 +/- 156 1847 +/- 52 2339 +/- 106 0.175161521 0.00607512 0.455152068 0.133507269LHPP phospholysine phosphohistidine inorganic pyrophosphate phosphatase 1897 +/- 163 2175 +/- 138 1606 +/- 105 1935 +/- 93 0.223221226 0.043901892 0.142317166 0.217039603LONPL peroxisomal LON protease like 691 +/- 82 856 +/- 45 737 +/- 44 891 +/- 39 0.11548954 0.02841048 0.079130996 0.076752512LYK5 protein kinase LYK5 1182 +/- 41 1209 +/- 34 1201 +/- 21 1266 +/- 17 0.622556777 0.038831136 0.540476426 0.066031787MAD2L2 MAD2 mitotic arrest deficient-like 2 (yeast) 622 +/- 72 573 +/- 24 543 +/- 12 601 +/- 20 -0.546858762 0.044277451 0.497512467 0.209700279MAN2A1 Mannosidase, alpha, class 2A, member 1 1559 +/- 217 2028 +/- 286 855 +/- 94 1116 +/- 57 0.221928283 0.044273356 0.18788158 0.143701298MAP3K13 Mitogen-activated protein kinase kinase kinase 13 655 +/- 36 806 +/- 40 539 +/- 37 736 +/- 36 0.019233825 0.004277603 0.193007684 0.08807373MCCC1 methylcrotonoyl-Coenzyme A carboxylase 1 (alpha) 588 +/- 18 799 +/- 27 614 +/- 25 820 +/- 25 0.000133926 0.00024902 0.025550241 0.064593462MEGF10 multiple EGF-like-domains 10 775 +/- 88 1122 +/- 99 648 +/- 44 768 +/- 24 0.025981771 0.045695659 0.012992723 0.233386867METTL5 methyltransferase like 5 537 +/- 35 732 +/- 38 613 +/- 18 740 +/- 26 0.003613606 0.004300567 0.06472819 0.139529211MID1IP1 MID1 interacting protein 1 (gastrulation specific G12-like (zebrafish)) 3282 +/- 363 4184 +/- 464 3175 +/- 236 3893 +/- 110 0.158427813 0.02813132 0.055935797 0.067190839MOBP myelin-associated oligodendrocyte basic protein 3329 +/- 750 6661 +/- 1634 1660 +/- 465 3347 +/- 458 0.106168045 0.029746903 0.016324371 0.05734512MRFAP1 Mof4 family associated protein 1 14404 +/- 697 16399 +/- 660 13724 +/- 840 16337 +/- 665 0.064453558 0.03776177 0.052246116 0.064904074MRPS15 mitochondrial ribosomal protein S15 1027 +/- 36 1142 +/- 68 917 +/- 42 1056 +/- 29 0.173167858 0.023979635 0.119276513 0.105885229MRPS7 mitochondrial ribosomal protein S7 629 +/- 23 658 +/- 22 625 +/- 13 709 +/- 21 0.388263555 0.011889288 0.749164822 0.119174775
S4- MSI correlated and non-correlated ARGs.xls Page 36

Young vs Aged MSI CorrelationsSymbol Description Young CA Aged CA Young DG Aged DG in CA in DG in CA in DGMSTO1 misato homolog 1 (Drosophila) 494 +/- 31 687 +/- 43 490 +/- 34 667 +/- 50 0.005029979 0.02122682 0.054397357 0.261320069MYL6 myosin, light polypeptide 6, alkali, smooth muscle and non-muscle 5381 +/- 175 5499 +/- 158 4330 +/- 103 4685 +/- 116 0.628657669 0.048931037 0.903678889 0.209868003MYLK myosin, light polypeptide kinase 2425 +/- 309 3340 +/- 241 1446 +/- 132 2443 +/- 131 0.043082979 0.000477748 0.11663479 0.069364667NARFL nuclear prelamin A recognition factor-like 763 +/- 44 946 +/- 80 767 +/- 41 988 +/- 52 0.081514566 0.010085315 0.264246001 0.134715202NBR1 neighbor of BRCA1 gene 1 1100 +/- 31 1283 +/- 49 1205 +/- 34 1320 +/- 16 0.012247868 0.018008543 0.001584926 0.086231024NDUFB2 NADH dehydrogenase (ubiquinone) 1 beta subcomplex, 2, 8kDa 2656 +/- 38 2528 +/- 107 2217 +/- 39 2426 +/- 38 -0.300336569 0.003892057 0.010258891 0.114578704NEU4 sialidase 4 318 +/- 28 531 +/- 71 374 +/- 25 540 +/- 33 0.029472306 0.003914097 0.002864159 0.068256338NFX1 nuclear transcription factor, X-box binding 1 115 +/- 15 162 +/- 12 126 +/- 3 169 +/- 16 0.039838428 0.047698285 0.119763606 0.078436117NIBP NIK and IKK{beta} binding protein 744 +/- 67 889 +/- 46 598 +/- 42 755 +/- 42 0.109669292 0.026364631 0.160191984 0.164410187NRP2 neuropilin 2 178 +/- 27 256 +/- 23 279 +/- 17 347 +/- 12 0.054668392 0.010230952 0.044184651 0.056937728NUDT5 nudix (nucleoside diphosphate linked moiety X)-type motif 5 884 +/- 75 1105 +/- 67 672 +/- 11 954 +/- 63 0.053390579 0.010161315 0.094210476 0.12241466OBFC1 oligonucleotide/oligosaccharide-binding fold containing 1 224 +/- 12 220 +/- 22 169 +/- 11 211 +/- 12 -0.891074693 0.028949034 0.425395128 0.32643494OSBPL2 oxysterol binding protein-like 2 588 +/- 28 649 +/- 27 587 +/- 10 638 +/- 14 0.155040087 0.0194728 0.072591055 0.081167639OSGEP O-sialoglycoprotein endopeptidase 459 +/- 30 536 +/- 32 410 +/- 14 486 +/- 23 0.112129968 0.027452984 0.442568705 0.075976483PARP8 poly (ADP-ribose) polymerase family, member 8 406 +/- 45 403 +/- 30 443 +/- 29 519 +/- 18 -0.951027906 0.053006248 0.942158742 0.195589884PCOLN3 procollagen (type III) N-endopeptidase 961 +/- 26 1244 +/- 123 979 +/- 64 1383 +/- 101 0.069583005 0.0121672 0.200868813 0.14737799PDE8B phosphodiesterase 8B 248 +/- 54 368 +/- 71 377 +/- 54 570 +/- 63 0.207360856 0.045280046 0.661091936 0.398262891PDIA2 protein disulfide isomerase family A, member 2 137 +/- 34 221 +/- 20 178 +/- 12 237 +/- 20 0.063359719 0.044120945 0.115138431 0.065775794PDK3 Pyruvate dehydrogenase kinase, isozyme 3 704 +/- 98 960 +/- 111 993 +/- 129 1593 +/- 94 0.113882019 0.004769876 0.428202723 0.064305474PFDN4 prefoldin subunit 4 737 +/- 71 858 +/- 41 809 +/- 83 1017 +/- 19 0.178896009 0.053248731 0.172067647 0.240539698PFKL phosphofructokinase, liver 1784 +/- 148 1890 +/- 147 1627 +/- 63 1907 +/- 88 0.61987493 0.033722935 0.896455807 0.112636176PHF10 PHD finger protein 10 327 +/- 31 419 +/- 15 380 +/- 14 460 +/- 26 0.032516087 0.03490785 0.038848268 0.108541702PIGS phosphatidylinositol glycan, class S 2823 +/- 73 3263 +/- 183 2696 +/- 71 3307 +/- 125 0.062592984 0.004496106 0.214475852 0.093165484PIPOX pipecolic acid oxidase 388 +/- 35 493 +/- 32 447 +/- 29 523 +/- 16 0.052153317 0.0513335 0.036558124 0.332666461PLCH1 phospholipase C, eta 1 327 +/- 12 405 +/- 32 217 +/- 23 304 +/- 19 0.058135757 0.016980964 0.10758693 0.099587986PLCH2 phospholipase C, eta 2 370 +/- 51 502 +/- 14 513 +/- 63 801 +/- 59 0.049362678 0.008956677 0.067947152 0.087632183PLEKHA6 pleckstrin homology domain containing, family A member 6 566 +/- 46 738 +/- 53 585 +/- 29 732 +/- 40 0.034289835 0.018921166 0.162664897 0.080752046PLEKHH1 pleckstrin homology domain containing, family H (with MyTH4 domain) member 1 5498 +/- 891 7056 +/- 1244 2329 +/- 184 3044 +/- 221 0.33509383 0.037095414 0.126982435 0.055861976PLXNA3 plexin A3 205 +/- 22 318 +/- 36 319 +/- 36 416 +/- 24 0.028119323 0.054836451 0.038607059 0.213522033PMS2 PMS2 postmeiotic segregation increased 2 (S. cerevisiae) 429 +/- 49 1254 +/- 258 530 +/- 58 1843 +/- 341 0.023149503 0.017204806 0.200908195 0.119468895POLD2 Polymerase (DNA directed), delta 2, regulatory subunit 50kDa 88 +/- 13 142 +/- 12 136 +/- 20 197 +/- 12 0.01183106 0.028238118 0.079666315 0.256120179POLG polymerase (DNA directed), gamma 1237 +/- 137 1440 +/- 127 1489 +/- 88 1711 +/- 27 0.303373482 0.053158439 0.188355125 0.116686861PQLC3 PQ loop repeat containing 3 422 +/- 15 400 +/- 47 254 +/- 11 298 +/- 12 -0.67462566 0.023289474 0.696102953 0.333425692PRKAB2 protein kinase, AMP-activated, beta 2 non-catalytic subunit 697 +/- 64 885 +/- 68 772 +/- 23 952 +/- 40 0.072252641 0.006776528 0.251662636 0.100464469PRRG1 proline rich Gla (G-carboxyglutamic acid) 1 909 +/- 109 1222 +/- 166 601 +/- 15 713 +/- 29 0.149903006 0.014550283 0.026593935 0.061201776PSMA3 proteasome (prosome, macropain) subunit, alpha type, 3 1537 +/- 38 1871 +/- 67 1481 +/- 61 1913 +/- 144 0.002582344 0.03633931 0.047591605 0.162895805PSME2 proteasome (prosome, macropain) activator subunit 2 (PA28 beta) 821 +/- 80 977 +/- 77 784 +/- 43 921 +/- 39 0.188306895 0.042435257 0.313424352 0.239555764PTP4A2 protein tyrosine phosphatase type IVA, member 2 6286 +/- 287 7210 +/- 518 5634 +/- 234 7240 +/- 434 0.158091566 0.016418053 0.071542259 0.146304192PTP4A3 protein tyrosine phosphatase type IVA, member 3 107 +/- 7 143 +/- 10 103 +/- 8 139 +/- 10 0.013215792 0.023195861 0.197196097 0.071717067PTPRB protein tyrosine phosphatase, receptor type, B 193 +/- 17 229 +/- 15 142 +/- 9 176 +/- 12 0.146745587 0.053788742 0.164375315 0.159282656RAB32 RAB32, member RAS oncogene family 198 +/- 18 242 +/- 23 137 +/- 8 201 +/- 18 0.165471603 0.020571618 0.170373303 0.121408827RAB7 RAB7, member RAS oncogene family 9341 +/- 493 9851 +/- 264 7242 +/- 277 8105 +/- 249 0.3893238 0.045657922 0.72490049 0.287858163RABL4 RAB, member of RAS oncogene family-like 4 740 +/- 95 1128 +/- 110 549 +/- 56 835 +/- 106 0.023895769 0.054057633 0.076826758 0.321291487RANBP5 RAN binding protein 5 936 +/- 51 1233 +/- 94 1110 +/- 54 1359 +/- 44 0.025319009 0.005955687 0.189239579 0.186509537
S4- MSI correlated and non-correlated ARGs.xls Page 37

Young vs Aged MSI CorrelationsSymbol Description Young CA Aged CA Young DG Aged DG in CA in DG in CA in DGRANBP6 RAN binding protein 6 782 +/- 58 993 +/- 47 796 +/- 88 1061 +/- 36 0.018602372 0.028990382 0.04712257 0.074729428RAP80 receptor associated protein 80 1079 +/- 80 1269 +/- 127 891 +/- 21 956 +/- 15 0.24024027 0.03338879 0.377964654 0.130328243RBM25 RNA binding motif protein 25 1188 +/- 33 1453 +/- 33 1540 +/- 42 1830 +/- 101 0.000207634 0.041768993 0.005200005 0.226285734RCHY1 ring finger and CHY zinc finger domain containing 1 986 +/- 103 1349 +/- 54 982 +/- 90 1245 +/- 17 0.01521295 0.031787463 0.054679978 0.202165285RNASE6 ribonuclease, RNase A family, k6 397 +/- 35 654 +/- 73 255 +/- 16 436 +/- 47 0.014909564 0.014505765 0.006242408 0.074681061RNF130 ring finger protein 130 2915 +/- 322 3688 +/- 372 2157 +/- 119 2608 +/- 105 0.148104173 0.019516522 0.061984765 0.080656052RNF141 ring finger protein 141 443 +/- 75 613 +/- 119 430 +/- 48 621 +/- 45 0.261835623 0.017611444 0.106035269 0.107064658RP11-217H1 implantation-associated protein 540 +/- 57 800 +/- 92 433 +/- 35 574 +/- 40 0.041470768 0.027972795 0.00427697 0.14838873RPRC1 arginine/proline rich coiled-coil 1 6598 +/- 221 6480 +/- 243 6871 +/- 111 7286 +/- 69 -0.725680672 0.013168689 0.507847455 0.10427147RPS24 ribosomal protein S24 19440 +/- 754 21550 +/- 931 17416 +/- 712 21538 +/- 983 0.110193751 0.010136048 0.358614016 0.097505268RPS6KB1 ribosomal protein S6 kinase, 70kDa, polypeptide 1 1507 +/- 66 2010 +/- 89 1589 +/- 57 1912 +/- 83 0.001300869 0.013806977 0.043269804 0.121311674S100A6 S100 calcium binding protein A6 (calcyclin) 923 +/- 64 1156 +/- 72 682 +/- 81 1085 +/- 58 0.035962432 0.003149417 0.220246563 0.1084609SAMD13 sterile alpha motif domain containing 13 234 +/- 23 238 +/- 21 261 +/- 20 314 +/- 8 0.903300686 0.044956191 0.922247198 0.231065771SC4MOL sterol-C4-methyl oxidase-like 5593 +/- 587 6927 +/- 418 5526 +/- 348 7175 +/- 378 0.097213757 0.011246032 0.241812869 0.087004427SEL1L sel-1 suppressor of lin-12-like (C. elegans) 350 +/- 53 493 +/- 66 413 +/- 38 592 +/- 39 0.121724193 0.010125779 0.152449292 0.165451398SELS selenoprotein S 2984 +/- 127 2979 +/- 209 2303 +/- 53 2615 +/- 85 -0.986170037 0.017135682 0.789929202 0.079028255SERPINB8 serpin peptidase inhibitor, clade B (ovalbumin), member 8 103 +/- 14 142 +/- 10 101 +/- 7 125 +/- 8 0.0451369 0.047732079 0.210402796 0.567889163SH3BGRL SH3 domain binding glutamic acid-rich protein like 1959 +/- 216 2188 +/- 169 2416 +/- 113 2842 +/- 144 0.422246125 0.048322156 0.305734183 0.272861659SLC12A9 solute carrier family 12 (potassium/chloride transporters), member 9 1093 +/- 101 1413 +/- 80 1023 +/- 47 1257 +/- 43 0.033133089 0.005050841 0.144496165 0.152042307SLC25A16 solute carrier family 25 (mitochondrial carrier; Graves disease autoantigen), member 16 472 +/- 27 547 +/- 23 566 +/- 28 661 +/- 17 0.062968315 0.021426681 0.4766455 0.078900085SLC2A5 solute carrier family 2 (facilitated glucose/fructose transporter), member 5 534 +/- 45 707 +/- 82 446 +/- 26 613 +/- 49 0.102204196 0.0238476 0.12591755 0.289938866SMG7 Smg-7 homolog, nonsense mediated mRNA decay factor (C. elegans) 162 +/- 20 141 +/- 13 158 +/- 9 189 +/- 8 -0.403040824 0.024008982 0.495164729 0.225124116SNAP91 synaptosomal-associated protein, 91kDa homolog (mouse) 10224 +/- 579 10352 +/- 809 10870 +/- 483 12419 +/- 359 0.900359605 0.030730506 0.700578139 0.250164367SNF8 SNF8, ESCRT-II complex subunit, homolog (S. cerevisiae) 2300 +/- 87 2382 +/- 140 1932 +/- 69 2281 +/- 69 0.633700834 0.005860847 0.917105614 0.061040333SNORA24 Small nucleolar RNA, H/ACA box 24 4609 +/- 197 5659 +/- 543 3508 +/- 255 4534 +/- 188 0.116987217 0.010709051 0.29641677 0.066739239SNX1 Sorting nexin 1 172 +/- 19 261 +/- 27 175 +/- 13 234 +/- 16 0.024268377 0.020264833 0.013460226 0.242657218SNX17 sorting nexin 17 2369 +/- 40 2361 +/- 64 1963 +/- 54 2132 +/- 51 -0.920822614 0.05042472 0.208647965 0.384066471SPCS1 signal peptidase complex subunit 1 homolog (S. cerevisiae) 6159 +/- 178 6206 +/- 222 5341 +/- 222 6203 +/- 226 0.872947371 0.023844644 0.565695968 0.205134747SPG21 spastic paraplegia 21 (autosomal recessive, Mast syndrome) 2258 +/- 168 2325 +/- 93 1675 +/- 47 1917 +/- 25 0.735305607 0.002343869 0.972420639 0.064318538SR-A1 serine arginine-rich pre-mRNA splicing factor SR-A1 440 +/- 30 527 +/- 58 660 +/- 33 789 +/- 43 0.220476591 0.046112859 0.815376904 0.105745192SRD5A1 steroid-5-alpha-reductase, alpha polypeptide 1 (3-oxo-5 alpha-steroid delta 4-dehydrogenase alpha 1) 264 +/- 147 539 +/- 62 255 +/- 133 609 +/- 56 0.130382014 0.044720097 0.239776655 0.072801257SREBF2 sterol regulatory element binding transcription factor 2 1173 +/- 80 1157 +/- 64 1650 +/- 13 1844 +/- 70 -0.882990613 0.049562082 0.590125477 0.2589213SS18 synovial sarcoma translocation, chromosome 18 179 +/- 34 427 +/- 43 209 +/- 34 419 +/- 49 0.00124615 0.00896963 0.00299713 0.062158137SSU72 SSU72 RNA polymerase II CTD phosphatase homolog (S. cerevisiae) 2015 +/- 93 2625 +/- 115 1716 +/- 93 2050 +/- 54 0.002266345 0.015168408 0.111942881 0.067295625ST3GAL6 ST3 beta-galactoside alpha-2,3-sialyltransferase 6 690 +/- 106 1161 +/- 162 768 +/- 42 966 +/- 63 0.039073465 0.033661876 0.012021888 0.074533991ST6GALNACST6 (alpha-N-acetyl-neuraminyl-2,3-beta-galactosyl-1,3)-N-acetylgalactosaminide alpha-2,6-sialyltransferas 172 +/- 52 131 +/- 25 89 +/- 27 181 +/- 22 -0.494846146 0.027555818 0.708649901 0.196984254ST6GALNACST6 (alpha-N-acetyl-neuraminyl-2,3-beta-galactosyl-1,3)-N-acetylgalactosaminide alpha-2,6-sialyltransferas 776 +/- 23 926 +/- 60 825 +/- 32 928 +/- 25 0.055348109 0.031676665 0.006031079 0.345575065STAT2 signal transducer and activator of transcription 2, 113kDa 863 +/- 108 1063 +/- 113 815 +/- 45 976 +/- 46 0.229758225 0.03469534 0.10122636 0.069811195STOM stomatin 2053 +/- 253 2990 +/- 261 1953 +/- 163 2755 +/- 171 0.027515679 0.008200839 0.063237653 0.157507683STRC stereocilin 345 +/- 54 551 +/- 31 332 +/- 31 472 +/- 34 0.010851421 0.015353896 0.054073404 0.074431642SUPT4H1 suppressor of Ty 4 homolog 1 (S. cerevisiae) 854 +/- 45 1062 +/- 48 905 +/- 30 1088 +/- 32 0.0099546 0.00239974 0.053306637 0.113993594TAS2R14 Taste receptor, type 2, member 14 101 +/- 20 203 +/- 19 104 +/- 21 230 +/- 27 0.004438424 0.005973521 0.036893291 0.098243184TATDN3 TatD DNase domain containing 3 116 +/- 9 169 +/- 11 138 +/- 16 192 +/- 10 0.0041436 0.02164698 0.07241459 0.055340933TBL1X transducin (beta)-like 1X-linked 155 +/- 28 369 +/- 21 212 +/- 17 525 +/- 99 0.000145665 0.033161203 0.003346196 0.073986264
S4- MSI correlated and non-correlated ARGs.xls Page 38

Young vs Aged MSI CorrelationsSymbol Description Young CA Aged CA Young DG Aged DG in CA in DG in CA in DGTCEAL4 transcription elongation factor A (SII)-like 4 8509 +/- 229 10384 +/- 384 8133 +/- 200 10329 +/- 553 0.00289964 0.013325761 0.097909518 0.138275737TIMM17A translocase of inner mitochondrial membrane 17 homolog A (yeast) 4599 +/- 193 5229 +/- 399 4545 +/- 37 5734 +/- 354 0.196432216 0.027968519 0.885345521 0.246688963TJP1 tight junction protein 1 (zona occludens 1) 881 +/- 94 1108 +/- 148 851 +/- 67 1056 +/- 37 0.229593724 0.029728453 0.165711408 0.115754631TJP2 tight junction protein 2 (zona occludens 2) 2291 +/- 204 3125 +/- 237 2144 +/- 139 2859 +/- 124 0.024080242 0.004053353 0.021048548 0.066068672TMBIM1 transmembrane BAX inhibitor motif containing 1 2080 +/- 216 2514 +/- 203 1362 +/- 54 1608 +/- 56 0.173426436 0.012063122 0.09321828 0.137968757TMCO3 transmembrane and coiled-coil domains 3 771 +/- 94 966 +/- 81 781 +/- 44 952 +/- 37 0.146913058 0.015859224 0.070880413 0.16682445TMEM106C transmembrane protein 106C 1970 +/- 98 2345 +/- 128 1940 +/- 209 2804 +/- 219 0.043413259 0.019261834 0.312849989 0.22733026TMEM11 transmembrane protein 11 845 +/- 33 981 +/- 25 769 +/- 31 945 +/- 37 0.00892987 0.006195045 0.139897829 0.106812496TMEM116 transmembrane protein 116 119 +/- 13 198 +/- 25 90 +/- 10 142 +/- 15 0.022720757 0.023265683 0.00913731 0.065412938TMEM125 transmembrane protein 125 1877 +/- 348 2703 +/- 395 920 +/- 69 1320 +/- 139 0.148153575 0.042879253 0.03925191 0.098260234TMEM42 transmembrane protein 42 1365 +/- 45 1466 +/- 33 1244 +/- 38 1458 +/- 62 0.101339459 0.022843879 0.372759651 0.186549401TMEM48 transmembrane protein 48 109 +/- 18 137 +/- 12 135 +/- 6 164 +/- 4 0.232457296 0.003927966 0.391118219 0.109833919TMTC4 transmembrane and tetratricopeptide repeat containing 4 1389 +/- 212 2022 +/- 276 751 +/- 81 984 +/- 63 0.100947558 0.049565076 0.115955074 0.183471703TNFAIP8L1 tumor necrosis factor, alpha-induced protein 8-like 1 625 +/- 37 647 +/- 29 658 +/- 40 775 +/- 14 0.647160379 0.032228654 0.88913924 0.075513875TNS3 tensin 3 5926 +/- 520 7061 +/- 361 4964 +/- 174 6047 +/- 403 0.106794346 0.052473325 0.393751323 0.350209298TOM1L1 Target of myb1-like 1 (chicken) 114 +/- 13 121 +/- 6 130 +/- 12 171 +/- 11 0.631857575 0.030308589 0.626439221 0.095746474TPP1 tripeptidyl peptidase I 1777 +/- 184 2252 +/- 226 1825 +/- 88 2210 +/- 122 0.135099084 0.035489624 0.109958197 0.072627957TREX2 three prime repair exonuclease 2 95 +/- 10 117 +/- 10 117 +/- 14 160 +/- 11 0.152964498 0.039351889 0.60879764 0.277286121TRIM37 tripartite motif-containing 37 6886 +/- 322 6344 +/- 360 6293 +/- 202 6895 +/- 149 -0.28801761 0.041014136 0.09343696 0.124105633TRUB2 TruB pseudouridine (psi) synthase homolog 2 (E. coli) 855 +/- 93 1100 +/- 56 795 +/- 42 1011 +/- 37 0.052142304 0.003952869 0.128420178 0.100419906TXNL1 thioredoxin-like 1 2413 +/- 328 2952 +/- 186 3020 +/- 129 3692 +/- 218 0.190997911 0.034489609 0.296000373 0.059513589TYROBP TYRO protein tyrosine kinase binding protein 1055 +/- 57 1424 +/- 146 717 +/- 24 899 +/- 63 0.053300789 0.041325655 0.006013855 0.149642205UBAP2L ubiquitin associated protein 2-like 1045 +/- 48 1221 +/- 34 950 +/- 19 1068 +/- 43 0.014530624 0.047736246 0.03302701 0.201222102UBE2H ubiquitin-conjugating enzyme E2H (UBC8 homolog, yeast) 3587 +/- 143 4508 +/- 50 3408 +/- 125 4376 +/- 229 0.000799338 0.0091898 0.001633609 0.083514757UNC13C unc-13 homolog C (C. elegans) 555 +/- 100 536 +/- 112 1134 +/- 113 1508 +/- 113 -0.904621618 0.04444122 0.94897662 0.153211586UQCRC1 ubiquinol-cytochrome c reductase core protein I 5480 +/- 38 5588 +/- 258 5191 +/- 86 5734 +/- 178 0.695534957 0.034439338 0.473698116 0.123746442USP31 ubiquitin specific peptidase 31 360 +/- 19 436 +/- 27 499 +/- 36 687 +/- 45 0.045849929 0.011486388 0.133505683 0.121915743XRCC5 X-ray repair complementing defective repair in Chinese hamster cells 5 (double-strand-break rejoining; Ku a 1545 +/- 90 1864 +/- 59 1424 +/- 33 1774 +/- 97 0.016491456 0.01936134 0.248647388 0.118649987YIF1A Yip1 interacting factor homolog A (S. cerevisiae) 1268 +/- 101 1457 +/- 104 804 +/- 64 1043 +/- 52 0.220786051 0.01763122 0.130302185 0.29882994YTHDC1 YTH domain containing 1 3734 +/- 134 4179 +/- 118 3676 +/- 128 4478 +/- 290 0.031495913 0.048116818 0.003623977 0.154046625ZF HCF-binding transcription factor Zhangfei 481 +/- 22 590 +/- 26 608 +/- 20 692 +/- 20 0.0098783 0.016804892 0.007960292 0.350000711ZNF131 Zinc finger protein 131 (clone pHZ-10) 124 +/- 18 238 +/- 29 160 +/- 22 267 +/- 25 0.010052177 0.011395349 0.126156615 0.066808291ZNF134 zinc finger protein 134 (clone pHZ-15) 473 +/- 12 593 +/- 38 437 +/- 27 544 +/- 37 0.023399139 0.048350318 0.008654068 0.303351624ZNF25 zinc finger protein 25 1239 +/- 41 1519 +/- 51 1305 +/- 50 1653 +/- 73 0.001854661 0.005249539 0.085885628 0.065991508ZNF336 zinc finger protein 336 1688 +/- 83 1861 +/- 80 1511 +/- 33 1629 +/- 15 0.165353585 0.013896344 0.090900778 0.109354234ZNF45 zinc finger protein 45 279 +/- 18 336 +/- 17 332 +/- 22 400 +/- 18 0.049501338 0.045353643 0.241044901 0.225942957ZNF669 zinc finger protein 669 417 +/- 25 647 +/- 62 504 +/- 23 634 +/- 44 0.011643971 0.038528957 0.017252972 0.059934437ZNFN1A1 zinc finger protein, subfamily 1A, 1 (Ikaros) 114 +/- 15 175 +/- 22 102 +/- 11 150 +/- 6 0.044945208 0.005622566 0.00837135 0.080888941ZNRF2 zinc and ring finger 2 122 +/- 11 116 +/- 9 87 +/- 7 125 +/- 7 -0.667415035 0.004701507 0.726488896 0.078907218ZRANB1 zinc finger, RAN-binding domain containing 1 849 +/- 44 1040 +/- 45 887 +/- 57 1073 +/- 52 0.012514974 0.039302018 0.25207767 0.26501462Downregulated with Age in DG, not MSI CorrelatedABTB2 Ankyrin repeat and BTB (POZ) domain containing 2 654 +/- 122 485 +/- 39 505 +/- 32 342 +/- 18 -0.236530963 -0.002265181 0.502144408 0.083242602ACIN1 apoptotic chromatin condensation inducer 1 1859 +/- 171 1790 +/- 102 2092 +/- 94 1822 +/- 45 -0.735092343 -0.035290304 0.856289181 0.099341331ACOT9 acyl-CoA thioesterase 9 370 +/- 33 344 +/- 40 284 +/- 9 218 +/- 20 -0.638310345 -0.02498055 0.671546112 0.283966613
S4- MSI correlated and non-correlated ARGs.xls Page 39

Young vs Aged MSI CorrelationsSymbol Description Young CA Aged CA Young DG Aged DG in CA in DG in CA in DGACVR1B activin A receptor, type IB 1767 +/- 140 1532 +/- 52 1675 +/- 66 1338 +/- 98 -0.163381207 -0.023760859 0.201727547 0.249095982ACY1L2 aminoacylase 1-like 2 224 +/- 39 230 +/- 24 450 +/- 41 321 +/- 40 0.895181939 -0.050237417 0.593761763 0.320936358ANKRD43 ankyrin repeat domain 43 1626 +/- 115 1329 +/- 135 1930 +/- 112 1590 +/- 92 -0.125068566 -0.044002582 0.120734501 0.146407266ANKRD52 ankyrin repeat domain 52 1020 +/- 66 863 +/- 45 1073 +/- 53 917 +/- 18 -0.080713305 -0.03065156 0.143621937 0.172988569ARL6IP ADP-ribosylation factor-like 6 interacting protein 153 +/- 21 148 +/- 10 183 +/- 10 128 +/- 9 -0.810586051 -0.002747514 0.834831774 0.123177274ARMCX1 armadillo repeat containing, X-linked 1 1267 +/- 41 1222 +/- 26 1385 +/- 38 1242 +/- 47 -0.378400402 -0.043795629 0.506433042 0.36170325ASPHD2 aspartate beta-hydroxylase domain containing 2 919 +/- 80 730 +/- 79 1141 +/- 46 992 +/- 32 -0.122917394 -0.027085321 0.06845479 0.055795056ATP6V1C1 ATPase, H+ transporting, lysosomal 42kDa, V1 subunit C1 998 +/- 141 706 +/- 35 1092 +/- 143 659 +/- 56 -0.094191529 -0.027764951 0.167291058 0.16054081ATP8B2 ATPase, Class I, type 8B, member 2 1260 +/- 36 1102 +/- 43 1508 +/- 74 1279 +/- 39 -0.018717994 -0.027391031 0.071600827 0.129279316BCL9L B-cell CLL/lymphoma 9-like 590 +/- 55 534 +/- 38 851 +/- 35 651 +/- 50 -0.417434605 -0.012773731 0.39314015 0.087479157BICC1 Bicaudal C homolog 1 (Drosophila) 484 +/- 64 390 +/- 42 763 +/- 49 466 +/- 75 -0.249578651 -0.012458425 0.469360249 0.113669725BRD2 bromodomain containing 2 683 +/- 52 469 +/- 53 945 +/- 41 572 +/- 72 -0.016524852 -0.003473977 0.280047378 0.097054419BTBD12 BTB (POZ) domain containing 12 437 +/- 23 371 +/- 26 440 +/- 20 356 +/- 19 -0.083174481 -0.013971534 0.13391893 0.206370301CA10 carbonic anhydrase X 1854 +/- 361 1852 +/- 301 4062 +/- 174 3455 +/- 172 -0.996745016 -0.03521384 0.956353675 0.106022879CABP4 calcium binding protein 4 167 +/- 42 189 +/- 30 193 +/- 12 142 +/- 16 0.678144289 -0.035053297 0.3978992 0.097185871CACNA1A calcium channel, voltage-dependent, P/Q type, alpha 1A subunit 961 +/- 89 664 +/- 44 1617 +/- 110 993 +/- 119 -0.018644654 -0.00419325 0.07476412 0.121622277CAMSAP1 calmodulin regulated spectrin-associated protein 1 1864 +/- 55 1556 +/- 68 1653 +/- 70 1442 +/- 53 -0.005928848 -0.039506876 0.036371961 0.15892634CAPZB capping protein (actin filament) muscle Z-line, beta 8247 +/- 582 6857 +/- 252 6783 +/- 248 5959 +/- 245 -0.065542162 -0.042500102 0.126065118 0.093828413CARD9 caspase recruitment domain family, member 9 119 +/- 10 107 +/- 15 126 +/- 10 91 +/- 8 -0.509164665 -0.024558238 0.690461103 0.178182936CARF collaborates/cooperates with ARF (alternate reading frame) protein 269 +/- 10 254 +/- 13 331 +/- 17 273 +/- 18 -0.405663578 -0.042435082 0.984876246 0.23283826CCDC72 coiled-coil domain containing 72 4579 +/- 407 4039 +/- 229 3214 +/- 212 2593 +/- 139 -0.281026307 -0.038620586 0.504518198 0.07465981CCDC84 coiled-coil domain containing 84 574 +/- 64 492 +/- 41 476 +/- 29 359 +/- 41 -0.311383712 -0.049202087 0.533931365 0.296487503CDIPT CDP-diacylglycerol--inositol 3-phosphatidyltransferase (phosphatidylinositol synthase) 3358 +/- 206 3149 +/- 168 3343 +/- 117 2839 +/- 95 -0.451126482 -0.008777598 0.366144649 0.08726787CDK5R1 cyclin-dependent kinase 5, regulatory subunit 1 (p35) 3649 +/- 206 3034 +/- 85 4001 +/- 116 3504 +/- 169 -0.029701932 -0.04397449 0.015793702 0.307385394CDKL1 Cyclin-dependent kinase-like 1 (CDC2-related kinase) 246 +/- 38 126 +/- 18 235 +/- 31 154 +/- 10 -0.024980063 -0.045552325 0.037404744 0.079403962CETN3 centrin, EF-hand protein, 3 (CDC31 homolog, yeast) 1063 +/- 34 1071 +/- 46 1089 +/- 38 984 +/- 18 0.88956516 -0.040432614 0.2173904 0.226173754CHCHD4 coiled-coil-helix-coiled-coil-helix domain containing 4 566 +/- 39 497 +/- 32 476 +/- 27 398 +/- 11 -0.201578789 -0.032703992 0.249583127 0.064587664CHKA choline kinase alpha 607 +/- 41 586 +/- 44 764 +/- 36 646 +/- 32 -0.73894905 -0.035292452 0.861546537 0.056440529CHSY1 carbohydrate (chondroitin) synthase 1 921 +/- 62 844 +/- 26 927 +/- 31 833 +/- 17 -0.289489252 -0.031811573 0.449344127 0.067020501CIC capicua homolog (Drosophila) 2030 +/- 162 2055 +/- 125 3575 +/- 166 3066 +/- 138 0.9079011 -0.04287907 0.62724518 0.175126891CKAP1 cytoskeleton associated protein 1 1486 +/- 142 1105 +/- 70 1406 +/- 119 962 +/- 130 -0.04564535 -0.033776237 0.283899216 0.20179708CKMT1B creatine kinase, mitochondrial 1B 6947 +/- 213 5592 +/- 354 5522 +/- 246 4526 +/- 212 -0.010827979 -0.013361634 0.013891007 0.127060756CLK4 CDC-like kinase 4 2680 +/- 52 2262 +/- 87 2336 +/- 119 1847 +/- 72 -0.003236721 -0.007870411 0.089082266 0.093570671COL11A2 collagen, type XI, alpha 2 262 +/- 34 231 +/- 38 308 +/- 19 229 +/- 25 -0.556715608 -0.038333976 0.712347201 0.208044593CREBBP CREB binding protein (Rubinstein-Taybi syndrome) 1537 +/- 76 1340 +/- 29 1670 +/- 25 1368 +/- 90 -0.047722227 -0.026138044 0.218216685 0.238085085CTDSP2 CTD (carboxy-terminal domain, RNA polymerase II, polypeptide A) small phosphatase 2 2715 +/- 105 2657 +/- 150 2420 +/- 54 2153 +/- 92 -0.758013385 -0.042110021 0.711773627 0.147153688CTTNBP2 cortactin binding protein 2 537 +/- 51 438 +/- 37 539 +/- 47 360 +/- 32 -0.154618487 -0.012403034 0.391687757 0.08725158CYB561 cytochrome b-561 156 +/- 15 132 +/- 15 162 +/- 7 131 +/- 10 -0.284121849 -0.034607242 0.486114137 0.101723839DCTN4 dynactin 4 (p62) 2167 +/- 114 1786 +/- 115 2057 +/- 72 1769 +/- 87 -0.03959171 -0.033853445 0.439314547 0.327635314DEDD2 death effector domain containing 2 610 +/- 25 569 +/- 23 643 +/- 21 576 +/- 15 -0.256153101 -0.027965413 0.840206784 0.298835598DENND1C DENN/MADD domain containing 1C 279 +/- 20 236 +/- 9 241 +/- 20 176 +/- 16 -0.089720524 -0.03421115 0.171088102 0.088209583DFFA DNA fragmentation factor, 45kDa, alpha polypeptide 632 +/- 34 537 +/- 27 694 +/- 27 593 +/- 28 -0.054305353 -0.031207415 0.19627277 0.297678699DKFZP779L1PRO0845 1349 +/- 59 1055 +/- 62 1202 +/- 31 955 +/- 46 -0.006254246 -0.002851053 0.117590109 0.084762499DMTF1 cyclin D binding myb-like transcription factor 1 2324 +/- 160 2497 +/- 93 2237 +/- 55 2007 +/- 60 0.374362942 -0.021051196 0.143186402 0.153899292
S4- MSI correlated and non-correlated ARGs.xls Page 40

Young vs Aged MSI CorrelationsSymbol Description Young CA Aged CA Young DG Aged DG in CA in DG in CA in DGDPF1 D4, zinc and double PHD fingers family 1 1631 +/- 91 1083 +/- 88 1997 +/- 111 1529 +/- 115 -0.001498473 -0.017396385 0.00842478 0.107797752DUSP14 dual specificity phosphatase 14 990 +/- 110 838 +/- 108 1439 +/- 43 1252 +/- 51 -0.347324404 -0.021930512 0.333594532 0.138896559DYNC2LI1 dynein, cytoplasmic 2, light intermediate chain 1 663 +/- 56 564 +/- 36 662 +/- 33 520 +/- 17 -0.174754273 -0.005516776 0.336799351 0.072997445DYRK2 dual-specificity tyrosine-(Y)-phosphorylation regulated kinase 2 831 +/- 140 590 +/- 62 593 +/- 37 489 +/- 19 -0.160623055 -0.040427269 0.126668945 0.133075353DZIP1 DAZ interacting protein 1 1130 +/- 99 875 +/- 66 1406 +/- 101 904 +/- 129 -0.060363791 -0.015726199 0.107536641 0.067234275ECHDC1 enoyl Coenzyme A hydratase domain containing 1 1796 +/- 60 1599 +/- 72 1651 +/- 62 1404 +/- 53 -0.061427477 -0.013713503 0.631625727 0.143303884EEF1A2 eukaryotic translation elongation factor 1 alpha 2 12229 +/- 451 10754 +/- 445 11925 +/- 233 11098 +/- 267 -0.042273622 -0.046167272 0.014356403 0.381357782EFHA2 EF-hand domain family, member A2 3623 +/- 194 3050 +/- 248 4234 +/- 119 3864 +/- 96 -0.100358469 -0.038747985 0.054441395 0.216094687EIF5A2 eukaryotic translation initiation factor 5A2 834 +/- 58 677 +/- 46 773 +/- 40 626 +/- 24 -0.062434805 -0.013845144 0.252096345 0.088746517ELF3 E74-like factor 3 (ets domain transcription factor, epithelial-specific ) 129 +/- 10 68 +/- 11 136 +/- 10 86 +/- 15 -0.002286897 -0.022561321 0.000951718 0.067420213EPS15 epidermal growth factor receptor pathway substrate 15 6961 +/- 240 6152 +/- 333 6822 +/- 320 5815 +/- 233 -0.079764059 -0.03235132 0.517628101 0.151439674ETFA electron-transfer-flavoprotein, alpha polypeptide (glutaric aciduria II) 763 +/- 80 635 +/- 93 926 +/- 45 580 +/- 121 -0.32330849 -0.043133771 0.653014952 0.190916327FADS3 fatty acid desaturase 3 1186 +/- 74 995 +/- 86 1240 +/- 69 944 +/- 62 -0.123482717 -0.010979084 0.178920435 0.081198707FAT4 FAT tumor suppressor homolog 4 (Drosophila) 293 +/- 14 306 +/- 33 708 +/- 23 485 +/- 48 0.734088954 -0.005929323 0.523440986 0.123458292FBXL12 F-box and leucine-rich repeat protein 12 183 +/- 11 198 +/- 17 225 +/- 11 184 +/- 12 0.493511884 -0.04090149 0.225753291 0.178653124FBXO22 F-box protein 22 180 +/- 15 116 +/- 11 204 +/- 17 146 +/- 19 -0.007921782 -0.047840719 0.043884135 0.074214805FCHSD2 FCH and double SH3 domains 2 602 +/- 50 541 +/- 45 432 +/- 23 355 +/- 19 -0.386199664 -0.031366887 0.766445741 0.174599506FCN3 ficolin (collagen/fibrinogen domain containing) 3 (Hakata antigen) 773 +/- 82 612 +/- 38 616 +/- 53 473 +/- 26 -0.119354515 -0.044076483 0.273237449 0.251666904FKRP fukutin related protein 1114 +/- 40 971 +/- 30 1164 +/- 29 1050 +/- 21 -0.018582598 -0.010989279 0.037392418 0.111899405FLJ30092 AF-1 specific protein phosphatase 3538 +/- 114 3147 +/- 187 3387 +/- 111 2870 +/- 54 -0.110710962 -0.003969496 0.051213415 0.077670869FLJ37035 FLJ37035 protein 344 +/- 33 221 +/- 20 323 +/- 33 207 +/- 33 -0.012535482 -0.035517647 0.041448292 0.106054095FLJ39237 FLJ39237 protein 202 +/- 20 175 +/- 23 202 +/- 16 152 +/- 11 -0.390375143 -0.028344303 0.853348508 0.350326323FOXK1 forkhead box K1 1751 +/- 65 1597 +/- 115 1911 +/- 71 1533 +/- 131 -0.279784394 -0.042521364 0.387073506 0.094058559FOXP1 forkhead box P1 285 +/- 29 214 +/- 23 213 +/- 24 144 +/- 16 -0.08604594 -0.043081771 0.74290022 0.22053733FRMD3 FERM domain containing 3 159 +/- 13 124 +/- 13 144 +/- 8 115 +/- 10 -0.090892838 -0.048719648 0.107469981 0.057365271FXYD7 FXYD domain containing ion transport regulator 7 3435 +/- 178 2940 +/- 109 4078 +/- 119 3624 +/- 147 -0.04407684 -0.042429162 0.00488822 0.483348228G3BP Ras-GTPase-activating protein SH3-domain-binding protein 1810 +/- 99 1689 +/- 83 1957 +/- 54 1678 +/- 67 -0.37211519 -0.011907896 0.861534233 0.140315677GABBR2 gamma-aminobutyric acid (GABA) B receptor, 2 1834 +/- 197 1551 +/- 193 2778 +/- 78 2396 +/- 114 -0.329709299 -0.026832838 0.29594896 0.324514968GAPVD1 GTPase activating protein and VPS9 domains 1 1036 +/- 57 938 +/- 97 956 +/- 26 845 +/- 31 -0.405966411 -0.023562626 0.800810376 0.417411893GARNL1 GTPase activating Rap/RanGAP domain-like 1 683 +/- 64 626 +/- 46 579 +/- 30 462 +/- 37 -0.485890005 -0.040098604 0.923399822 0.068734549GCHFR GTP cyclohydrolase I feedback regulator 417 +/- 27 263 +/- 11 403 +/- 32 315 +/- 18 -0.00123335 -0.044121673 0.003602917 0.26266741GEMIN6 gem (nuclear organelle) associated protein 6 120 +/- 23 102 +/- 10 117 +/- 13 77 +/- 3 -0.493262348 -0.024096823 0.256943141 0.077973918GNL2 guanine nucleotide binding protein-like 2 (nucleolar) 347 +/- 23 320 +/- 17 374 +/- 23 301 +/- 18 -0.378445191 -0.03344959 0.835245674 0.109622239GPR153 G protein-coupled receptor 153 395 +/- 32 371 +/- 45 374 +/- 8 300 +/- 22 -0.679134613 -0.024122979 0.921476421 0.14871703GPR155 G protein-coupled receptor 155 3986 +/- 374 3280 +/- 279 5230 +/- 184 4681 +/- 151 -0.164042986 -0.046512652 0.333008264 0.250868344GRM5 Glutamate receptor, metabotropic 5 4099 +/- 219 3135 +/- 171 3523 +/- 175 2644 +/- 98 -0.006510561 -0.002590439 0.006481496 0.085829727GRTP1 Growth hormone regulated TBC protein 1 446 +/- 50 299 +/- 12 412 +/- 52 272 +/- 16 -0.030152815 -0.042958386 0.035210678 0.103772623GTF2IRD2 GTF2I repeat domain containing 2 310 +/- 18 224 +/- 27 365 +/- 33 210 +/- 55 -0.028055011 -0.047209612 0.482695937 0.339189571GTF3C4 General transcription factor IIIC, polypeptide 4, 90kDa 1590 +/- 79 1380 +/- 69 1484 +/- 45 1344 +/- 39 -0.072365264 -0.043751346 0.080517223 0.148008384HADH2 hydroxyacyl-Coenzyme A dehydrogenase, type II 2567 +/- 64 2333 +/- 98 2257 +/- 48 2004 +/- 54 -0.078236206 -0.007018894 0.117523678 0.085956846HECTD1 HECT domain containing 1 154 +/- 14 131 +/- 13 204 +/- 13 162 +/- 11 -0.238273049 -0.041531809 0.852478954 0.224897501HERC1 hect (homologous to the E6-AP (UBE3A) carboxyl terminus) domain and RCC1 (CHC1)-like domain (RLD) 3490 +/- 87 3209 +/- 99 3290 +/- 56 3128 +/- 37 -0.05980791 -0.042149986 0.007128254 0.15256026HERC4 hect domain and RLD 4 725 +/- 37 638 +/- 58 882 +/- 55 667 +/- 35 -0.240880598 -0.010633622 0.333892552 0.133846768HIGD2A HIG1 domain family, member 2A 3641 +/- 182 2920 +/- 183 3456 +/- 163 2935 +/- 93 -0.019088664 -0.024690915 0.023971733 0.087432337
S4- MSI correlated and non-correlated ARGs.xls Page 41

Young vs Aged MSI CorrelationsSymbol Description Young CA Aged CA Young DG Aged DG in CA in DG in CA in DGHMGCR 3-hydroxy-3-methylglutaryl-Coenzyme A reductase 1890 +/- 172 1539 +/- 69 2130 +/- 95 1817 +/- 102 -0.101923573 -0.052680553 0.064745887 0.186102049HNMT histamine N-methyltransferase 396 +/- 32 235 +/- 22 494 +/- 59 338 +/- 17 -0.002524332 -0.044935424 0.021349226 0.072377414HP1BP3 heterochromatin protein 1, binding protein 3 5237 +/- 233 4163 +/- 95 5620 +/- 224 4368 +/- 255 -0.004208435 -0.005506694 0.030837236 0.073044113HSP90B1 heat shock protein 90kDa beta (Grp94), member 1 5233 +/- 258 4774 +/- 119 5615 +/- 180 4876 +/- 111 -0.150045151 -0.008040943 0.453591825 0.200610975HSPA12A heat shock 70kDa protein 12A 420 +/- 40 297 +/- 27 455 +/- 42 300 +/- 28 -0.030853522 -0.015229323 0.054125438 0.100142974HSPC159 HSPC159 protein 145 +/- 22 117 +/- 17 161 +/- 15 118 +/- 10 -0.33280406 -0.04264681 0.211825933 0.056425333IFIT5 interferon-induced protein with tetratricopeptide repeats 5 467 +/- 26 398 +/- 26 493 +/- 24 422 +/- 16 -0.091012978 -0.035868096 0.165892284 0.221069267IKBKAP inhibitor of kappa light polypeptide gene enhancer in B-cells, kinase complex-associated protein 3512 +/- 159 3207 +/- 197 3071 +/- 108 2708 +/- 98 -0.257208496 -0.034273271 0.987911255 0.369116338IPLA2(GAMMintracellular membrane-associated calcium-independent phospholipase A2 gamma 3034 +/- 116 2924 +/- 99 3184 +/- 174 2707 +/- 92 -0.488736044 -0.043351621 0.844156661 0.128193177ITGA6 integrin, alpha 6 1277 +/- 56 1145 +/- 70 1213 +/- 98 804 +/- 50 -0.1737088 -0.006910234 0.617707414 0.075081462ITGA8 integrin, alpha 8 101 +/- 17 101 +/- 14 126 +/- 12 92 +/- 3 -0.982265262 -0.035995202 0.915694298 0.177920495ITGB1BP1 integrin beta 1 binding protein 1 832 +/- 41 713 +/- 53 853 +/- 30 743 +/- 28 -0.108726909 -0.025874579 0.098960687 0.139542575KCMF1 potassium channel modulatory factor 1 904 +/- 45 798 +/- 43 861 +/- 25 761 +/- 23 -0.117733452 -0.01805466 0.118599745 0.186627563KCNK17 potassium channel, subfamily K, member 17 175 +/- 17 111 +/- 10 253 +/- 20 177 +/- 20 -0.011001664 -0.023816161 0.072727066 0.084128799KCTD3 potassium channel tetramerisation domain containing 3 1153 +/- 87 1018 +/- 49 1352 +/- 65 947 +/- 142 -0.213511732 -0.043040726 0.556885 0.316617013KIF3B kinesin family member 3B 1592 +/- 199 1106 +/- 96 1784 +/- 164 1327 +/- 44 -0.062973647 -0.037930748 0.108525391 0.140866785KLF13 Kruppel-like factor 13 1790 +/- 60 1158 +/- 151 2000 +/- 133 1313 +/- 196 -0.006850529 -0.022009748 0.148842536 0.386259152KLHDC5 kelch domain containing 5 3067 +/- 144 2879 +/- 162 2960 +/- 80 2641 +/- 82 -0.405493792 -0.021610156 0.21106509 0.081382931KLHL15 kelch-like 15 (Drosophila) 646 +/- 36 564 +/- 39 642 +/- 26 552 +/- 15 -0.154466202 -0.016238779 0.15678483 0.078429516KLHL2 kelch-like 2, Mayven (Drosophila) 4816 +/- 510 3890 +/- 688 7319 +/- 565 5661 +/- 464 -0.306975408 -0.049756593 0.462715658 0.301801973KRTCAP2 Keratinocyte associated protein 2 159 +/- 10 120 +/- 17 200 +/- 25 128 +/- 5 -0.081010084 -0.033836658 0.076362901 0.156934784KTN1 kinectin 1 (kinesin receptor) 3032 +/- 249 3355 +/- 275 3498 +/- 199 2780 +/- 142 0.403113555 -0.017361537 0.127905871 0.264136844LASS5 LAG1 longevity assurance homolog 5 (S. cerevisiae) 1328 +/- 43 993 +/- 51 1277 +/- 72 1037 +/- 33 -0.000565873 -0.01899967 0.000457208 0.127403657LAT2 linker for activation of T cells family, member 2 246 +/- 22 214 +/- 23 266 +/- 22 203 +/- 17 -0.346152124 -0.047562637 0.606396122 0.104097832LEREPO4 likely ortholog of mouse immediate early response, erythropoietin 4 3868 +/- 230 3508 +/- 145 4093 +/- 95 3354 +/- 211 -0.219624657 -0.020663146 0.280335556 0.126289426LNX1 ligand of numb-protein X 1 2480 +/- 118 1905 +/- 184 2474 +/- 174 1901 +/- 108 -0.028569789 -0.022991433 0.002603438 0.156600864LPHN1 latrophilin 1 3273 +/- 149 2840 +/- 165 3901 +/- 181 3300 +/- 124 -0.080278813 -0.023977973 0.084034496 0.281603487LRP11 low density lipoprotein receptor-related protein 11 4775 +/- 167 4237 +/- 116 4754 +/- 143 4135 +/- 226 -0.026691143 -0.054358382 0.213604269 0.477677495LRRC28 leucine rich repeat containing 28 389 +/- 32 357 +/- 24 478 +/- 25 395 +/- 14 -0.447188926 -0.021642949 0.307742226 0.141729817LRRC3B leucine rich repeat containing 3B 1060 +/- 61 844 +/- 59 1402 +/- 91 1140 +/- 58 -0.029330681 -0.040665115 0.054211861 0.273995944LRRN5 leucine rich repeat neuronal 5 1461 +/- 68 1120 +/- 25 1554 +/- 45 1289 +/- 57 -0.002903974 -0.006256578 0.007370126 0.064886225LSM5 LSM5 homolog, U6 small nuclear RNA associated (S. cerevisiae) 860 +/- 61 808 +/- 19 1126 +/- 50 958 +/- 52 -0.445189711 -0.045761881 0.544638411 0.088792508LTBP1 latent transforming growth factor beta binding protein 1 361 +/- 17 236 +/- 20 447 +/- 38 218 +/- 28 -0.00071457 -0.000958711 0.098246847 0.0743978LUZP2 Leucine zipper protein 2 148 +/- 21 101 +/- 16 116 +/- 17 69 +/- 8 -0.103660365 -0.035561964 0.077490758 0.065440402LZIC Leucine zipper and CTNNBIP1 domain containing 187 +/- 11 146 +/- 17 188 +/- 10 125 +/- 20 -0.073598956 -0.033696692 0.666954141 0.150632468MAD2L1BP MAD2L1 binding protein 801 +/- 48 804 +/- 14 744 +/- 14 700 +/- 10 0.952030525 -0.030986567 0.843314552 0.150394656MAGEH1 melanoma antigen family H, 1 5195 +/- 193 4645 +/- 235 6391 +/- 306 5229 +/- 199 -0.101413156 -0.012417285 0.106845299 0.089632653MAP1LC3A microtubule-associated protein 1 light chain 3 alpha 3967 +/- 274 2363 +/- 245 4800 +/- 253 2961 +/- 404 -0.00144192 -0.00636558 0.059834641 0.163614208MARK2 MAP/microtubule affinity-regulating kinase 2 823 +/- 33 702 +/- 30 941 +/- 40 765 +/- 25 -0.023035541 -0.005706683 0.135183632 0.132393049MAX MYC associated factor X 1031 +/- 87 779 +/- 39 1103 +/- 54 911 +/- 39 -0.034213781 -0.019564295 0.067448525 0.207610623MCF2L MCF.2 cell line derived transforming sequence-like 169 +/- 11 113 +/- 10 232 +/- 24 135 +/- 8 -0.00333276 -0.007613212 0.033674994 0.067935138MEST mesoderm specific transcript homolog (mouse) 2485 +/- 318 2364 +/- 191 3814 +/- 151 3349 +/- 120 -0.7521878 -0.039852063 0.860051759 0.079115205MFAP1 microfibrillar-associated protein 1 1476 +/- 22 1315 +/- 35 1367 +/- 41 1252 +/- 27 -0.004145342 -0.047851898 0.002324551 0.062969353MKKS McKusick-Kaufman syndrome 2005 +/- 127 1739 +/- 127 2049 +/- 26 1793 +/- 93 -0.169457199 -0.049556332 0.363338164 0.191451442
S4- MSI correlated and non-correlated ARGs.xls Page 42

Young vs Aged MSI CorrelationsSymbol Description Young CA Aged CA Young DG Aged DG in CA in DG in CA in DGMLH1 mutL homolog 1, colon cancer, nonpolyposis type 2 (E. coli) 569 +/- 45 480 +/- 41 470 +/- 32 363 +/- 16 -0.174970977 -0.019892831 0.738367087 0.056107414MOBKL2B MOB1, Mps One Binder kinase activator-like 2B (yeast) 138 +/- 10 100 +/- 11 127 +/- 7 86 +/- 4 -0.028521632 -0.001403645 0.062958159 0.055919928MRPL22 mitochondrial ribosomal protein L22 706 +/- 20 652 +/- 26 641 +/- 17 556 +/- 21 -0.128264949 -0.014088609 0.242144385 0.2526271MYO1B myosin IB 240 +/- 40 180 +/- 30 189 +/- 25 121 +/- 13 -0.250919236 -0.045612624 0.463544264 0.074196096N4BP3 Nedd4 binding protein 3 109 +/- 7 101 +/- 7 119 +/- 9 90 +/- 4 -0.40977475 -0.022975305 0.513906381 0.138844257NAP5 Nck-associated protein 5 211 +/- 31 212 +/- 27 162 +/- 11 123 +/- 8 0.973619971 -0.02114515 0.659389709 0.111594389NDUFV1 NADH dehydrogenase (ubiquinone) flavoprotein 1, 51kDa 2923 +/- 155 2506 +/- 143 2595 +/- 65 2288 +/- 108 -0.076226055 -0.045770623 0.127150538 0.255318262NFIL3 nuclear factor, interleukin 3 regulated 495 +/- 40 462 +/- 38 822 +/- 51 669 +/- 29 -0.562878274 -0.032291699 0.563072425 0.125402367NKD2 naked cuticle homolog 2 (Drosophila) 229 +/- 12 225 +/- 18 335 +/- 22 274 +/- 16 -0.873328408 -0.053988924 0.951125038 0.189399495NOG Noggin 599 +/- 81 458 +/- 67 733 +/- 50 542 +/- 33 -0.208994192 -0.011914076 0.177280619 0.099486263NOTUM notum pectinacetylesterase homolog (Drosophila) 87 +/- 16 107 +/- 11 136 +/- 15 92 +/- 6 0.321693695 -0.036054903 0.331144337 0.101913829NPEPL1 aminopeptidase-like 1 143 +/- 12 156 +/- 13 174 +/- 8 136 +/- 11 0.481346845 -0.025600501 0.799900684 0.118329193NPLOC4 nuclear protein localization 4 homolog (S. cerevisiae) 1165 +/- 45 1126 +/- 45 1102 +/- 47 968 +/- 34 -0.557939536 -0.046812294 0.62373956 0.143394738NRXN1 neurexin 1 10862 +/- 245 9499 +/- 402 10764 +/- 142 9886 +/- 287 -0.019307751 -0.033930344 0.031491478 0.148727641NUBP1 nucleotide binding protein 1 (MinD homolog, E. coli) 679 +/- 25 548 +/- 12 607 +/- 21 506 +/- 19 -0.002200702 -0.006861505 0.025427377 0.077320833NUFIP2 nuclear fragile X mental retardation protein interacting protein 2 761 +/- 34 710 +/- 36 845 +/- 39 746 +/- 16 -0.328267414 -0.051373998 0.748716035 0.058155841OCRL oculocerebrorenal syndrome of Lowe 5167 +/- 351 2651 +/- 414 4835 +/- 441 3145 +/- 483 -0.000997411 -0.030467437 0.028945575 0.277285789OSBPL6 oxysterol binding protein-like 6 2412 +/- 155 1905 +/- 45 2468 +/- 135 1963 +/- 75 -0.02064243 -0.012145114 0.093437471 0.227481628P2RX5 purinergic receptor P2X, ligand-gated ion channel, 5 1338 +/- 74 1083 +/- 93 1528 +/- 87 1238 +/- 63 -0.058172178 -0.02551087 0.097410602 0.069564403PABPC5 poly(A) binding protein, cytoplasmic 5 153 +/- 5 103 +/- 10 160 +/- 15 110 +/- 8 -0.003193097 -0.019984793 0.089753987 0.125170727PAK3 P21 (CDKN1A)-activated kinase 3 227 +/- 18 167 +/- 19 271 +/- 16 203 +/- 14 -0.048201664 -0.010497467 0.050619504 0.077254286PAN3 PAN3 polyA specific ribonuclease subunit homolog (S. cerevisiae) 1456 +/- 117 1346 +/- 43 1368 +/- 61 1193 +/- 38 -0.411628265 -0.040479339 0.669218585 0.173963616PASK PAS domain containing serine/threonine kinase 171 +/- 15 144 +/- 18 171 +/- 11 130 +/- 11 -0.279468739 -0.029535745 0.317124345 0.223027582PCDH10 protocadherin 10 956 +/- 148 1051 +/- 135 653 +/- 82 380 +/- 31 0.647461568 -0.019472837 0.718784454 0.070046703PCSK2 proprotein convertase subtilisin/kexin type 2 3146 +/- 220 2328 +/- 198 2601 +/- 119 2049 +/- 105 -0.020417862 -0.006951289 0.01232449 0.060491027PCTK2 PCTAIRE protein kinase 2 4630 +/- 476 3780 +/- 295 5133 +/- 337 4095 +/- 92 -0.166030517 -0.026239816 0.202842072 0.134702193PDZRN4 PDZ domain containing RING finger 4 961 +/- 82 934 +/- 58 831 +/- 30 732 +/- 22 -0.790399473 -0.028344943 0.525706147 0.095878713PEX14 peroxisomal biogenesis factor 14 1046 +/- 74 925 +/- 41 1172 +/- 79 945 +/- 26 -0.190371854 -0.034154868 0.084989484 0.06614945PFDN1 prefoldin subunit 1 3757 +/- 69 3495 +/- 74 3517 +/- 72 3281 +/- 42 -0.026757747 -0.0223749 0.003461971 0.103413488PIK3R2 phosphoinositide-3-kinase, regulatory subunit 2 (p85 beta) 5364 +/- 460 3833 +/- 348 4458 +/- 93 3892 +/- 156 -0.025607679 -0.017781087 0.021090149 0.095284858PINK1 PTEN induced putative kinase 1 5970 +/- 290 3813 +/- 313 5732 +/- 418 4288 +/- 150 -0.000503668 -0.016543541 0.005077902 0.11399275PKIA Protein kinase (cAMP-dependent, catalytic) inhibitor alpha 252 +/- 9 223 +/- 13 277 +/- 14 229 +/- 14 -0.09414404 -0.041147802 0.527385335 0.171524677PLAC9 placenta-specific 9 1835 +/- 282 1130 +/- 254 1524 +/- 212 916 +/- 172 -0.093037075 -0.053552202 0.432079614 0.313665902PLEK pleckstrin 301 +/- 28 251 +/- 18 267 +/- 22 206 +/- 13 -0.167953082 -0.044631566 0.373950719 0.134891651PLEKHG6 pleckstrin homology domain containing, family G (with RhoGef domain) member 6 368 +/- 21 360 +/- 55 442 +/- 17 355 +/- 17 -0.889861604 -0.006192481 0.80103137 0.248088221PLXNB3 plexin B3 457 +/- 56 453 +/- 43 384 +/- 19 316 +/- 15 -0.953366316 -0.01945359 0.654622675 0.075026734PNLDC1 poly(A)-specific ribonuclease (PARN)-like domain containing 1 203 +/- 62 42 +/- 1 212 +/- 57 60 +/- 6 -0.047861142 -0.044611804 0.195803754 0.13121375PPM1E protein phosphatase 1E (PP2C domain containing) 2356 +/- 357 1782 +/- 252 2989 +/- 122 2473 +/- 54 -0.221718191 -0.006500382 0.271745248 0.074406024PRKRIR protein-kinase, interferon-inducible double stranded RNA dependent inhibitor, repressor of (P58 repressor) 1194 +/- 105 1357 +/- 44 1231 +/- 45 1098 +/- 38 0.196904013 -0.049312552 0.262210648 0.112415974PRO0149 PRO0149 protein 3917 +/- 388 3006 +/- 191 4784 +/- 216 3768 +/- 160 -0.071797767 -0.004642731 0.149122069 0.069218685PROCA1 proline-rich cyclin A1-interacting protein 188 +/- 17 132 +/- 6 195 +/- 11 162 +/- 7 -0.01904541 -0.03118106 0.104932479 0.258450261PRPS2 phosphoribosyl pyrophosphate synthetase 2 1966 +/- 106 1443 +/- 29 1604 +/- 58 1369 +/- 46 -0.003525035 -0.011978454 0.001513869 0.084104019PRSS22 protease, serine, 22 376 +/- 33 245 +/- 15 364 +/- 29 215 +/- 21 -0.009083568 -0.002358389 0.046989389 0.059613239PSPC1 paraspeckle component 1 4137 +/- 535 3110 +/- 267 3353 +/- 193 2357 +/- 289 -0.127704105 -0.023390631 0.511080638 0.158301759
S4- MSI correlated and non-correlated ARGs.xls Page 43

Young vs Aged MSI CorrelationsSymbol Description Young CA Aged CA Young DG Aged DG in CA in DG in CA in DGPTBP2 polypyrimidine tract binding protein 2 2307 +/- 103 1782 +/- 161 2298 +/- 39 1811 +/- 152 -0.02381853 -0.030830317 0.438613881 0.216102612PUM2 pumilio homolog 2 (Drosophila) 2633 +/- 77 1935 +/- 111 2753 +/- 131 1997 +/- 141 -0.000604458 -0.003648263 0.05562315 0.081645211QSCN6L1 quiescin Q6-like 1 715 +/- 62 579 +/- 58 1381 +/- 87 1148 +/- 33 -0.143148012 -0.044211937 0.17520605 0.149820638RAB35 RAB35, member RAS oncogene family 778 +/- 29 811 +/- 19 718 +/- 14 670 +/- 5 0.367490517 -0.015565703 0.590646323 0.088326224REV3L REV3-like, catalytic subunit of DNA polymerase zeta (yeast) 1626 +/- 79 1510 +/- 68 1694 +/- 74 1485 +/- 50 -0.293951404 -0.046104157 0.287801253 0.098756475RHOBTB2 Rho-related BTB domain containing 2 686 +/- 32 533 +/- 29 663 +/- 45 502 +/- 41 -0.005244694 -0.028313851 0.007948868 0.08870149RIT2 Ras-like without CAAX 2 609 +/- 31 437 +/- 55 775 +/- 62 568 +/- 48 -0.025575445 -0.027875631 0.077862913 0.062894532RNF10 ring finger protein 10 3235 +/- 192 2478 +/- 121 3155 +/- 83 2677 +/- 130 -0.009517874 -0.017449864 0.082708791 0.409322341RNF149 ring finger protein 149 862 +/- 59 752 +/- 33 938 +/- 25 772 +/- 46 -0.140754258 -0.018644142 0.263253546 0.060960675RNF165 ring finger protein 165 582 +/- 25 444 +/- 19 525 +/- 34 419 +/- 29 -0.001550293 -0.042494447 0.043446064 0.191880592RNF40 ring finger protein 40 697 +/- 31 616 +/- 10 876 +/- 27 750 +/- 31 -0.043586854 -0.014864958 0.340172388 0.108042495RPIB9 Rap2-binding protein 9 1388 +/- 111 1270 +/- 94 1665 +/- 42 1512 +/- 53 -0.437013689 -0.054717856 0.453265894 0.351287158RPL31 ribosomal protein L31 232 +/- 31 172 +/- 17 275 +/- 9 198 +/- 25 -0.128384949 -0.03293557 0.336434313 0.26945184RPL37 ribosomal protein L37 1311 +/- 97 1831 +/- 155 1601 +/- 107 1229 +/- 57 0.020800471 -0.016960897 0.031384133 0.072104543RPS12 ribosomal protein S12 4329 +/- 211 3150 +/- 239 3422 +/- 186 2508 +/- 191 -0.004218543 -0.00763633 0.093213947 0.150396701RRAGC Ras-related GTP binding C 2912 +/- 161 3207 +/- 157 2579 +/- 91 2330 +/- 56 0.220753668 -0.047747997 0.430171906 0.0631591RSBN1 round spermatid basic protein 1 1261 +/- 90 1171 +/- 26 1341 +/- 54 1091 +/- 43 -0.37371077 -0.005686273 0.609460738 0.058652398RUNX1T1 runt-related transcription factor 1; translocated to, 1 (cyclin D-related) 2489 +/- 125 1740 +/- 89 2274 +/- 171 1707 +/- 184 -0.000846719 -0.051017315 0.01645597 0.495650684SCGB3A1 secretoglobin, family 3A, member 1 110 +/- 8 98 +/- 11 132 +/- 9 101 +/- 7 -0.404156732 -0.023415436 0.916556785 0.092843164SDK2 sidekick homolog 2 (chicken) 931 +/- 129 836 +/- 94 667 +/- 46 527 +/- 27 -0.563398746 -0.030214457 0.519932468 0.091562392SEC14L1 SEC14-like 1 (S. cerevisiae) 4771 +/- 153 4085 +/- 221 5018 +/- 284 3990 +/- 299 -0.031449238 -0.03470786 0.459700401 0.261595307SEMA6B sema domain, transmembrane domain (TM), and cytoplasmic domain, (semaphorin) 6B 2141 +/- 281 1472 +/- 204 2572 +/- 104 2191 +/- 53 -0.08595555 -0.013093356 0.105883426 0.195480987SETBP1 SET binding protein 1 177 +/- 22 138 +/- 17 245 +/- 24 131 +/- 20 -0.19183427 -0.005449354 0.448002102 0.13556878SETD6 SET domain containing 6 357 +/- 14 262 +/- 22 362 +/- 8 285 +/- 23 -0.006155276 -0.024760878 0.071339234 0.157550143SFXN1 sideroflexin 1 947 +/- 84 649 +/- 46 800 +/- 33 630 +/- 29 -0.014753663 -0.004024948 0.022844764 0.055998664SFXN3 sideroflexin 3 918 +/- 58 841 +/- 34 1028 +/- 50 787 +/- 44 -0.290513104 -0.00549148 0.547595196 0.069852941SGPL1 sphingosine-1-phosphate lyase 1 613 +/- 28 522 +/- 26 640 +/- 24 524 +/- 12 -0.040205869 -0.002866218 0.231950816 0.057885563SGSH N-sulfoglucosamine sulfohydrolase (sulfamidase) 274 +/- 62 276 +/- 24 224 +/- 8 190 +/- 9 0.975656175 -0.023478068 0.867132759 0.188117293SH3MD4 SH3 multiple domains 4 1732 +/- 142 1583 +/- 171 1400 +/- 71 1205 +/- 43 -0.518297455 -0.047786914 0.928266656 0.259189821SHANK2 SH3 and multiple ankyrin repeat domains 2 3124 +/- 137 2183 +/- 63 2942 +/- 130 2120 +/- 154 -0.000417935 -0.003276605 0.000954574 0.074945144SLC12A5 solute carrier family 12, (potassium-chloride transporter) member 5 9260 +/- 395 7923 +/- 381 8510 +/- 287 7677 +/- 214 -0.035165521 -0.045788367 0.015477601 0.202189808SLC25A25 solute carrier family 25 (mitochondrial carrier; phosphate carrier), member 25 1121 +/- 61 974 +/- 52 1300 +/- 67 1101 +/- 43 -0.096748348 -0.03672137 0.03067862 0.114505719SLC2A6 solute carrier family 2 (facilitated glucose transporter), member 6 542 +/- 34 512 +/- 27 621 +/- 36 490 +/- 11 -0.497871229 -0.013617841 0.527077813 0.10169118SLC35E3 solute carrier family 35, member E3 812 +/- 93 775 +/- 32 861 +/- 58 712 +/- 17 -0.724466004 -0.049851375 0.943595422 0.079531213SLC5A3 solute carrier family 5 (inositol transporters), member 3 289 +/- 39 240 +/- 38 429 +/- 33 342 +/- 17 -0.391168577 -0.052975677 0.388174594 0.078915707SLFNL1 schlafen-like 1 165 +/- 16 140 +/- 13 183 +/- 10 119 +/- 9 -0.234170457 -0.001115942 0.140924896 0.06609075SMS spermine synthase 1440 +/- 104 1361 +/- 60 1756 +/- 49 1533 +/- 42 -0.531937147 -0.007359754 0.606413307 0.117973188SMU1 Smu-1 suppressor of mec-8 and unc-52 homolog (C. elegans) 1021 +/- 44 845 +/- 49 1000 +/- 21 892 +/- 31 -0.024100861 -0.021557898 0.061954055 0.167536525SORBS2 Sorbin and SH3 domain containing 2 432 +/- 19 353 +/- 14 405 +/- 14 294 +/- 41 -0.007594933 -0.049321265 0.078440767 0.364208937SOX11 SRY (sex determining region Y)-box 11 664 +/- 52 459 +/- 46 303 +/- 32 221 +/- 13 -0.014598477 -0.04875412 0.011762268 0.055596693SPG20 spastic paraplegia 20, spartin (Troyer syndrome) 1329 +/- 71 1486 +/- 143 1459 +/- 35 1302 +/- 45 0.3571879 -0.025409897 0.022835492 0.19617511SRrp35 serine-arginine repressor protein (35 kDa) 851 +/- 61 650 +/- 57 860 +/- 61 692 +/- 42 -0.036873369 -0.05114665 0.063738218 0.19318906SSB Sjogren syndrome antigen B (autoantigen La) 2114 +/- 118 1777 +/- 99 2359 +/- 70 1882 +/- 138 -0.054697646 -0.021627807 0.061261408 0.162029076SSTR2 somatostatin receptor 2 181 +/- 26 94 +/- 7 135 +/- 18 66 +/- 7 -0.018011504 -0.010196622 0.005480342 0.055425313
S4- MSI correlated and non-correlated ARGs.xls Page 44

Young vs Aged MSI CorrelationsSymbol Description Young CA Aged CA Young DG Aged DG in CA in DG in CA in DGSTRBP spermatid perinuclear RNA binding protein 926 +/- 84 754 +/- 29 785 +/- 30 663 +/- 42 -0.098304001 -0.049348173 0.212619169 0.250843153SUB1 SUB1 homolog (S. cerevisiae) 198 +/- 12 153 +/- 13 233 +/- 7 187 +/- 11 -0.029380853 -0.009334405 0.070572835 0.200849812SULT1A3 sulfotransferase family, cytosolic, 1A, phenol-preferring, member 3 375 +/- 64 226 +/- 35 292 +/- 26 202 +/- 21 -0.078387951 -0.024139531 0.243997888 0.154238119SUOX sulfite oxidase 266 +/- 15 222 +/- 19 301 +/- 8 220 +/- 19 -0.100405305 -0.008878695 0.261111961 0.096741605SURF4 surfeit 4 844 +/- 29 730 +/- 19 751 +/- 33 661 +/- 21 -0.010483129 -0.048622922 0.102185092 0.242072965SYNGR4 synaptogyrin 4 345 +/- 36 312 +/- 23 289 +/- 21 221 +/- 22 -0.459799236 -0.054898421 0.697862786 0.260900479SYT11 synaptotagmin XI 2979 +/- 924 523 +/- 91 2747 +/- 804 738 +/- 96 -0.044900169 -0.05440499 0.045545221 0.091856384SYT17 synaptotagmin XVII 1654 +/- 367 1225 +/- 137 1568 +/- 101 1227 +/- 51 -0.314314277 -0.018829893 0.265448908 0.055700564SYTL2 synaptotagmin-like 2 300 +/- 78 429 +/- 112 148 +/- 20 94 +/- 10 0.368996022 -0.048362188 0.437356576 0.156373851TAF5L TAF5-like RNA polymerase II, p300/CBP-associated factor (PCAF)-associated factor, 65kDa 511 +/- 14 496 +/- 10 521 +/- 15 459 +/- 15 -0.402735909 -0.015641475 0.628870365 0.189536634TBC1D14 TBC1 domain family, member 14 2125 +/- 84 1815 +/- 92 1795 +/- 52 1639 +/- 43 -0.031696434 -0.047244724 0.222267241 0.2088684TCERG1 transcription elongation regulator 1 1003 +/- 111 1042 +/- 31 1253 +/- 60 1001 +/- 75 0.745116253 -0.029946796 0.597618483 0.293000746TDRD6 tudor domain containing 6 160 +/- 22 164 +/- 14 169 +/- 12 130 +/- 7 0.880838832 -0.026081677 0.724895544 0.064398813TFG TRK-fused gene 5280 +/- 199 4443 +/- 99 4815 +/- 94 4186 +/- 147 -0.006471633 -0.008782778 0.008840003 0.243183596TGFB3 transforming growth factor, beta 3 505 +/- 61 393 +/- 48 651 +/- 37 486 +/- 46 -0.182678045 -0.022850667 0.548310955 0.084469964THBS3 thrombospondin 3 546 +/- 53 445 +/- 55 780 +/- 44 597 +/- 55 -0.214843713 -0.031589826 0.281920388 0.068747408THRAP1 thyroid hormone receptor associated protein 1 2516 +/- 97 2385 +/- 106 2836 +/- 108 2482 +/- 58 -0.383922275 -0.021616483 0.918259791 0.067799701TIMM10 translocase of inner mitochondrial membrane 10 homolog (yeast) 1629 +/- 120 1047 +/- 77 1208 +/- 47 967 +/- 68 -0.003153302 -0.021238258 0.00548846 0.144075924TM2D1 TM2 domain containing 1 743 +/- 38 713 +/- 50 856 +/- 54 690 +/- 41 -0.642776696 -0.037847121 0.714512496 0.179244168TM9SF2 transmembrane 9 superfamily member 2 1860 +/- 104 971 +/- 362 1861 +/- 69 746 +/- 349 -0.057368775 -0.031588019 0.441130942 0.162169021TMEM126B transmembrane protein 126B 118 +/- 16 90 +/- 10 126 +/- 9 89 +/- 10 -0.171889319 -0.02630581 0.27253049 0.057572169TMEM132B transmembrane protein 132B 1274 +/- 123 930 +/- 71 1051 +/- 67 730 +/- 54 -0.041704541 -0.004741841 0.240402673 0.156696458TMEM132E transmembrane protein 132E 138 +/- 10 118 +/- 18 232 +/- 19 159 +/- 19 -0.347427978 -0.023538523 0.121017297 0.070941713TMEM25 transmembrane protein 25 2517 +/- 184 2187 +/- 216 3846 +/- 199 3254 +/- 106 -0.271729579 -0.032155932 0.272918691 0.129767471TMEM93 transmembrane protein 93 2312 +/- 100 1990 +/- 126 2258 +/- 82 1965 +/- 87 -0.075387554 -0.03794458 0.186627666 0.060756516TMEPAI transmembrane, prostate androgen induced RNA 899 +/- 154 699 +/- 73 772 +/- 55 601 +/- 44 -0.277781776 -0.038059058 0.169874262 0.160455495TNRC4 trinucleotide repeat containing 4 4534 +/- 210 3677 +/- 260 5558 +/- 185 4760 +/- 252 -0.029148199 -0.035166821 0.010782622 0.125680243TNRC9 trinucleotide repeat containing 9 230 +/- 31 204 +/- 19 217 +/- 25 147 +/- 15 -0.488732146 -0.042513666 0.476932917 0.099416737TP53BP2 tumor protein p53 binding protein, 2 3969 +/- 331 4293 +/- 320 4425 +/- 200 3879 +/- 120 0.496882968 -0.047499175 0.249564584 0.298378966TRIM46 tripartite motif-containing 46 886 +/- 40 715 +/- 65 1011 +/- 67 787 +/- 42 -0.052703686 -0.02173346 0.018977454 0.072136194TRPM7 transient receptor potential cation channel, subfamily M, member 7 356 +/- 40 334 +/- 21 378 +/- 30 285 +/- 20 -0.629170302 -0.031434627 0.967614532 0.203034517TSGA2 testis specific A2 homolog (mouse) 658 +/- 150 274 +/- 41 370 +/- 40 239 +/- 30 -0.049773829 -0.027797187 0.044111728 0.113750324TSPAN3 tetraspanin 3 4001 +/- 86 3629 +/- 136 3966 +/- 66 3699 +/- 96 -0.047447907 -0.053879539 0.0498443 0.24013768TSPYL3 TSPY-like 3 (pseudogene) 716 +/- 53 638 +/- 63 867 +/- 80 645 +/- 47 -0.361300679 -0.044290446 0.432536145 0.14258546TTC19 tetratricopeptide repeat domain 19 2924 +/- 101 1559 +/- 359 3189 +/- 138 1757 +/- 528 -0.011318191 -0.051446777 0.065680723 0.168026491TUBB2B tubulin, beta 2B 3672 +/- 237 3414 +/- 308 3355 +/- 175 2679 +/- 191 -0.521948217 -0.029003671 0.745515808 0.091447835TUFM Tu translation elongation factor, mitochondrial 1075 +/- 75 895 +/- 60 995 +/- 31 811 +/- 30 -0.091891493 -0.002053773 0.079960181 0.055395999TUSC1 tumor suppressor candidate 1 965 +/- 92 888 +/- 78 1306 +/- 67 1105 +/- 34 -0.537008828 -0.031015491 0.469194186 0.092669085TUSC3 tumor suppressor candidate 3 593 +/- 43 437 +/- 30 743 +/- 35 545 +/- 36 -0.015208368 -0.003574256 0.026811227 0.078995526TXNDC10 thioredoxin domain containing 10 1152 +/- 79 1252 +/- 69 1427 +/- 33 1248 +/- 63 0.36633805 -0.046451728 0.677995212 0.184753814TXNDC4 thioredoxin domain containing 4 (endoplasmic reticulum) 1246 +/- 67 1050 +/- 62 1153 +/- 88 920 +/- 29 -0.057808702 -0.044765299 0.389629165 0.261277625UBC ubiquitin C 6672 +/- 739 5772 +/- 426 7116 +/- 734 5191 +/- 278 -0.321669308 -0.04724725 0.412415109 0.182116236UBE2V2 ubiquitin-conjugating enzyme E2 variant 2 1294 +/- 48 1322 +/- 90 1405 +/- 72 1126 +/- 68 0.789299928 -0.020027247 0.917609583 0.120357726UBE3A ubiquitin protein ligase E3A (human papilloma virus E6-associated protein, Angelman syndrome) 6737 +/- 339 5705 +/- 371 5837 +/- 154 5224 +/- 81 -0.067393974 -0.008728416 0.169678269 0.065819319
S4- MSI correlated and non-correlated ARGs.xls Page 45

Young vs Aged MSI CorrelationsSymbol Description Young CA Aged CA Young DG Aged DG in CA in DG in CA in DGUCN urocortin 399 +/- 28 387 +/- 22 380 +/- 17 317 +/- 13 -0.741043517 -0.017920635 0.98870892 0.101513143UNC45A unc-45 homolog A (C. elegans) 863 +/- 83 692 +/- 25 923 +/- 40 731 +/- 59 -0.096748095 -0.029505868 0.36848176 0.427112546USP15 ubiquitin specific peptidase 15 2158 +/- 53 1639 +/- 107 2009 +/- 51 1697 +/- 92 -0.003134811 -0.023252573 0.058322123 0.324435591USP4 ubiquitin specific peptidase 4 (proto-oncogene) 2228 +/- 74 1806 +/- 34 2258 +/- 99 1973 +/- 65 -0.001323917 -0.04187396 0.015351275 0.35433655WDFY1 WD repeat and FYVE domain containing 1 1082 +/- 175 808 +/- 190 857 +/- 69 579 +/- 68 -0.316251788 -0.018631604 0.815625579 0.218160488WDR47 WD repeat domain 47 4038 +/- 157 3797 +/- 170 4306 +/- 111 3939 +/- 111 -0.322562237 -0.045221443 0.143074397 0.172406686WDR74 WD repeat domain 74 744 +/- 14 687 +/- 26 664 +/- 37 566 +/- 24 -0.095725318 -0.053059872 0.201972744 0.104317297WHDC1 WAS protein homology region 2 domain containing 1 276 +/- 18 251 +/- 22 322 +/- 19 263 +/- 13 -0.402533246 -0.033975828 0.238003182 0.061157987XPNPEP1 X-prolyl aminopeptidase (aminopeptidase P) 1, soluble 1226 +/- 73 1063 +/- 32 1269 +/- 56 1109 +/- 24 -0.080738107 -0.035698474 0.032885789 0.076763929YTHDF2 YTH domain family, member 2 2059 +/- 97 1665 +/- 58 2492 +/- 66 2178 +/- 98 -0.007866082 -0.031414013 0.112830832 0.432848963YTHDF3 YTH domain family, member 3 3848 +/- 269 3599 +/- 115 3721 +/- 144 3177 +/- 92 -0.424114136 -0.012372504 0.629213173 0.062283594ZBTB24 zinc finger and BTB domain containing 24 626 +/- 63 454 +/- 23 608 +/- 38 435 +/- 38 -0.039583377 -0.01011329 0.187721069 0.150985666ZBTB7C zinc finger and BTB domain containing 7C 448 +/- 21 348 +/- 43 483 +/- 41 358 +/- 31 -0.074595508 -0.037871787 0.080420567 0.157762147ZMPSTE24 zinc metallopeptidase (STE24 homolog, yeast) 681 +/- 23 630 +/- 24 787 +/- 36 633 +/- 19 -0.153944684 -0.005706849 0.389119114 0.108993539ZNF161 zinc finger protein 161 1955 +/- 205 2188 +/- 214 1741 +/- 43 1557 +/- 39 0.451333515 -0.011179921 0.120171025 0.072079243ZNF44 zinc finger protein 44 227 +/- 19 193 +/- 5 249 +/- 13 199 +/- 12 -0.132475522 -0.022050181 0.447714259 0.200024235ZNF452 zinc finger protein 452 148 +/- 21 151 +/- 15 209 +/- 9 177 +/- 7 0.896417921 -0.02352519 0.942629341 0.076394206ZNF469 zinc finger protein 469 394 +/- 35 350 +/- 17 320 +/- 12 250 +/- 18 -0.294885976 -0.015176462 0.276885464 0.190211263ZNF573 zinc finger protein 573 187 +/- 34 144 +/- 13 251 +/- 30 152 +/- 28 -0.2795361 -0.039264785 0.562013145 0.431785401ZNF598 zinc finger protein 598 783 +/- 25 699 +/- 38 826 +/- 24 723 +/- 33 -0.098271107 -0.03515865 0.023228201 0.071239091ZNF615 zinc finger protein 615 148 +/- 12 112 +/- 12 154 +/- 12 102 +/- 14 -0.05701512 -0.019855503 0.204070629 0.278452395ZNF650 zinc finger protein 650 1129 +/- 62 1186 +/- 66 1399 +/- 98 1075 +/- 82 0.536553057 -0.031841049 0.061982236 0.201040628ZNF658 zinc finger protein 658 201 +/- 19 171 +/- 8 278 +/- 14 206 +/- 22 -0.20671084 -0.02606887 0.258691386 0.125236317ZNF664 zinc finger protein 664 4855 +/- 461 4156 +/- 264 5217 +/- 185 4351 +/- 285 -0.224378196 -0.037811086 0.462258175 0.189498969ZNF74 zinc finger protein 74 147 +/- 15 91 +/- 13 170 +/- 12 113 +/- 14 -0.018936105 -0.016370007 0.112743819 0.206491307ZNRD1 zinc ribbon domain containing 1 926 +/- 41 625 +/- 37 853 +/- 26 720 +/- 30 -0.000268689 -0.009907701 0.05962573 0.099213787ZWINT ZW10 interactor 592 +/- 49 356 +/- 55 462 +/- 44 332 +/- 21 -0.009324758 -0.032175899 0.007406112 0.088879118ZXDB zinc finger, X-linked, duplicated B 667 +/- 61 496 +/- 39 665 +/- 46 479 +/- 61 -0.044558801 -0.041047339 0.260164736 0.248674131ZZEF1 zinc finger, ZZ-type with EF-hand domain 1 1717 +/- 133 1604 +/- 63 1605 +/- 32 1429 +/- 41 -0.465890658 -0.009886225 0.65265442 0.078559695
S4- MSI correlated and non-correlated ARGs.xls Page 46