s investment relationship financial crisis and structural … · saving-investment relationship,...
TRANSCRIPT

Économie internationale 111 (2007), p. 81-99.
SAVING-INVESTMENT RELATIONSHIP,FINANCIAL CRISIS AND STRUCTURAL CHANGES
IN EAST ASIAN COUNTRIES
Carlos C. Bautista & Samuel Maveyraud-Tricoire1
ABSTRACT. In this article, the impact of the Asian crisis on the saving-investment relation-ship of selected East Asian countries with the rest of the world is examined using a Markovswitching regression on East Asian countries. As a first result, estimates of the saving reten-tion coefficients show that for most Asian countries, the Asian crisis period marks a shiftfrom high saving retention coefficients during the pre-crisis period to low ones up to the endof the sample period. Low saving retention coefficients are also observed during the 1980sdecade. For some countries, these coincide with certain phases of their development. Asecond result of interest is that periods with relatively low coefficient estimates, implyingrelatively higher capital mobility, are associated with current account surpluses. This resultcan be more explained by high and stable domestic saving rates than by low investment rates.
JEL Classification: E2; F21; F36.Keywords: Saving-investment relationship;
Financial integration; Asian crisis; Markov-switching model.
RÉSUMÉ. Dans cet article, nous examinons l’impact de la crise asiatique sur la relationépargne-investissement des pays asiatiques avec le reste du monde. Pour ce faire, nous appli-quons la méthode dite de Markov-switching aux principaux pays d’Asie du Sud Est. Le premierrésultat de notre étude est le fait que la crise asiatique s’est accompagnée d’une réduction signi-ficative de la corrélation entre l’épargne et l’investissement pour la plupart des pays asiatiques.Ces faibles coefficients sont également observés pendant la décennie des années 80, périodecaractérisée par une phase de développement importante. Notre second résultat est paradoxal :pendant les périodes où les coefficients de rétention sont faibles, i.e. où la mobilité du capitalest relativement élevée, les soldes du compte courant sont positifs. Ce résultat s’explique princi-palement par de forts taux d’épargne nationaux plutôt que par de faibles taux d’investissement.
Classification JEL : E2 ; F21 ; F36.Mots-clés : Relation épargne-investissement ;
intégration financière; crise asiatique ; méthode Markow-switching.
1. Corresponding author: Samuel MAVEYRAUD-TRICOIRE, Laboratoire d’Analyse et de Prospective Économiques,University of Limoges ([email protected]).Carlos C. BAUTISTA, Professor, College of Business Administration, University of the Philippines.
INTRODUCTION
During the 1980 and 1990 decades, most of the East Asian economies embarked on tradeand financial liberalization programs which encouraged foreign capital flows. This wasbecause international investors were attracted by the perceived sound macroeconomic fun-damentals (small fiscal deficits, stable exchange rates, high domestic savings rates, and ahighly regarded workforce) of these economies. During this period, Japanese investmentsthat were backed up by a strong Yen chose these economies as low cost manufacturinghubs, thus helping stimulate economic activity in these areas. This, together with low worldinterest rates and the recessions in industrial countries seemed to help make the choice ofinvesting in these economies easier. As a result, short-term capital increased from 49 billionUS dollars in 1991 to 133 billion in 1997. The share of FDI inflows relative to other capitalflows likewise increased (see Baharumshah and Thanoon, 2006). TABLE 1 shows how hold-ings of foreign assets and liabilities in South East Asia have risen between the periods 1990-1997 and 1998-2004. In general, the ratios of FDI assets to GDP for East Asian countrieshave increased between the two periods. They range between 0.3% and 5.96% for theperiod 1990-1997 and between 0.17% and 15.39% for the period 1998-2004. For theperiod under consideration, the ratios went down for Philippines and Thailand but increasedfor South Korea and Singapore. The FDI liabilities in East Asian countries also increased onthe average since the financial crisis, except for Indonesia and Malaysia. For the latter coun-try however, the ratio remains as high as those of Brazil and Mexico in 1998-2004.
The ratios of portfolio investment (i.e. equity and debt) assets and liabilities are close to theratios of FDI assets in the 1990-1997 period. Portfolio investment assets increased enor-mously in the 1998-2004 period. The ratio of portfolio equity holdings held abroadincreased 4-fold for South Korea, 2-fold for the Philippines and 9-fold for Thailand. Theratios of portfolio debt assets also rose: doubling in South Korea and Thailand and increasingby 30% for the Philippines. In Singapore, the ratio of portfolio investment assets doubled.However, the ratio of portfolio investment liabilities decreased in most of East Asian coun-tries except, for South Korea and Singapore.
These results are reinforced by TABLE 2 which shows the size of the domestic financial sectors in1996 and in 2004 for these countries. The size of domestic bond markets significantly increasedbetween 1996 and 2004. It increased by 25% in Malaysia, doubled in Hong Kong and Korea,increased 3 times in Singapore, 4 times in Thailand and by more than 5 times in Indonesia. Thisreflects the concerted efforts, undertaken the ASEAN+3 group (ASEAN countries + China, Japan,South Korea) since December 2002 to develop the regional bond markets (Ghosh, 2006, p. 34-43). The evolution of the size of domestic equity markets is more heterogeneous. Between1996 and 2004, it increased in Hong Kong (by 85%), in South-Korea (by 130%), in Singapore(by 23%) and in Thailand (by 35%). However, it fell in Indonesia (by 29%), in Malaysia (by 49%)and in the Philippines (by 26%). In 2004, the size of the domestic banking sector is still quite
82 Carlos C. Bautista & Samuel Maveyraud-Tricoire / Économie internationale 111 (2007), p. 81-99.

83Carlos C. Bautista & Samuel Maveyraud-Tricoire / Économie internationale 111 (2007), p. 81-99.
Tabl
e 1
-H
oldi
ngs
of f
orei
gn a
sset
s an
d lia
bilit
ies
wit
h th
e re
st o
f th
e w
orld
(per
cent
of
GD
P)
Fore
ign
dire
ct in
vest
men
t (in
% o
f G
DP)
Port
folio
equ
ity
(in %
of
GD
P)Po
rtfo
lio d
ebt
(in %
of
GD
P)
1990
-199
719
98-2
004
1990
-199
719
98-2
004
1990
-199
719
98-2
004
AL
AL
AL
AL
AL
AL
Hon
g Ko
ngN
AN
A15
.39
16.0
0N
A16
.00
NA
–15.
4N
A–2
3.5
NA
19.6
1In
done
siaN
A1.
61N
A–0
.80
NA
0.29
(93-
97)
0.04
(200
4)–0
.54
NA
0.59
0.18
(200
4)0.
34
Sout
h Ko
rea
0.57
0.32
0.79
1.23
0.05
0.75
0.20
1.76
0.26
1.42
0.47
0.30
Mal
aysia
NA
6.30
1.57
(99-
04)
3.20
NA
NA
0.01
(02-
04)
1.60
(02-
04)
NA
NA
0.33
(02-
04)
NA
Phili
ppin
es0.
42(9
3-97
)1.
610.
221.
690.
03(9
6-97
)1.
02(9
6-97
)0.
070.
360.
591.
490.
760.
99
Sing
apor
e5.
9611
.20
8.11
14.1
38.
34*
1.19
*14
.3*
2.33
*N
AN
AN
AN
ATh
aila
nd0.
301.
790.
172.
970.
01(9
4-96
)0.
910.
09(0
2-04
)0.
650.
05(1
997)
0.87
0.11
–0.5
8
Braz
il0.
120.
800.
393.
980.
02(9
5-97
)0.
650.
130.
370.
14(9
3-97
)1.
860.
040.
20
Fran
ce1.
981.
406.
022.
830.
150.
621.
961.
681.
730.
966.
206.
11G
erm
any
1.37
0.25
2.23
2.77
0.86
0.18
2.38
1.13
0.80
2.90
3.53
4.77
Japa
n0.
660.
030.
690.
170.
170.
660.
501.
061.
420.
732.
390.
71M
exic
oN
A2.
080.
42(0
1-04
)3.
05N
A1.
19N
A0.
050.
401.
430.
130.
61
UK
2.96
2.04
7.92
4.35
0.65
1.00
2.06
3.94
4.81
2.61
3.21
4.45
US
1.03
0.77
1.72
1.81
0.68
0.16
0.94
0.89
0.59
2.00
0.22
3.30
*Po
rtfo
lio In
vest
men
t Ass
ets
and
Liab
ilitie
s.
Not
e: A
and
L re
spec
tivel
y st
and
for A
sset
s an
d Li
abili
ties.
Sour
ce: I
MF,
IFS
and
Wor
ld D
evel
opm
ent I
ndic
ator
s 20
06.

important in East Asian countries. It represents more than 100% of GDP in Hong Kong,Malaysia and Thailand. Except for South Korea and Singapore, the size slightly decreasedbetween 1996 and 2004 by 4% for Hong Kong and by 20% for the Philippines and Thailand.
This quantitative assessment shows that, with the exception of the Philippines, the size offinancial markets and volume of capital flows have increased since the crisis of 1997. Thisstudy examines the possible effects of the financial crisis of 1997 on the degree of financialintegration of selected East Asian countries with the global economy by looking at saving-investment relationships using the Feldstein-Horioka framework. Here, it is recognized thatin the short-term, the crisis had a negative impact on integration as can be seen by the hugecapital flight which, as is well known, was a temporary phenomenon. The interest of thispaper is the long-run effect and the extent to which the crisis has hindered or hastened themove towards tighter financial integration. This can be examined most conveniently by look-ing at structural breaks in the process of integration. Unlike recent studies on the saving-investment relationship of East Asian countries which use panel data analysis where nobreaks are considered, the study takes advantage of the Markov-switching model’s ability toendogenously determine the presence of structural changes in the pattern of relationshipsbeing studied. This method also allows for a heterogeneous treatment of the countriesbecause Markov-switching regressions can be done for each country.
84 Carlos C. Bautista & Samuel Maveyraud-Tricoire / Économie internationale 111 (2007), p. 81-99.
Table 2 - Financial sector profile
Size of domesticbond market
(in % of GDP)*
Size of domesticequities market(in % of GDP)**
Size of domesticbanking sector***
(in % of GDP)
1996 2004 1996 2004 1996 2004
Hong Kong 23.76 47.97 286.92 528.51 152.57 146.65Indonesia 3.52 22.40 39.96 28.45 54.02 50.12South Korea 42.86 83.64 24.95 57.37 56.90 92.73Malaysia 72.58 90.18 303.58 153.48 142.42 133.50Philippines 33.43 29.56 97.12 33.82 67.92 53.82Singapore 26.78 73.58 166.02 203.71 66.47 75.88Thailand 10.24 41.13 52.78 71.37 146.36 116.30
Brazil 34.11 528.51 32.97 54.70 45.39 81.01France 78.72 104.33 70.24 119.28 NA 114.65Germany 77.02 81.21 27.27 32.37 NA 138.02Japan 101.70 191.80 75.62 98.92 293.83 305.97Mexico 7.60 26.15 47.04 25.42 27.08 35.33United Kingdom 61.01 48.99 138.06 134.87 125.66 156.87United States 149.63 163.82 108.88 139.38 77.16 94.23
Sources: * World Federation of Exchanges (Domestic market capitalization); For Japan the Osaka SE is excluded in1996; for the United States, data include AMEX, NASDAQ and NYSE.** AsianBondsOnline for Asian countries and BIS, Quarterly Review (for Dec. 1997, table 15 (Domestic Debt Securities)and for Dec. 2004, table 16A (Domestic debt securities)) for the other countries.*** International Financial Statistics, IMF (the size of Domestic banking sector is measured by domestic credits).

This paper proceeds as follows. In the next section, a survey of literature on the saving-investment relationship focusing on Asian country studies is done. The Markov-switchingregression methodology and how it is used within the Feldstein-Horioka framework arebriefly explained in the next section. In section 4, the data for seven Asian countries– Indonesia, Korea, Hong Kong, Malaysia, Philippines, Singapore and Thailand – and theresults of the empirical exercises are shown.2 The last section concludes.
EMPIRICAL ANALYSIS OF THE SAVING-INVESTMENTRELATION
The simplest to state but arguably the most difficult to solve puzzle in international macro-economics has to do with the relation between investment and saving. In a closed economy,changes in investment must be accompanied by changes in national saving in the same direc-tion to attain macroeconomic equilibrium. One would therefore expect a high positive corre-lation between these two macroeconomic aggregates. When the economy is open andcapital is mobile, foreign saving could be tapped and investment is no longer constrained bydomestic saving. Hence, the high correlation should no longer be expected to hold anddomestic saving and investment need not travel the same paths as the economy runs currentaccount imbalances to gain from trade opportunities. Empirical evidence for developedeconomies however runs counter to this notion.
Feldstein and Horioka (1980, hereafter FH) were the first to show strong positive co-move-ment between saving and investment that contradicts other evidence of capital mobility,notably the small and insignificant differences in interest rates of similar assets in differentcountries. FH proposed a measure of economic integration based on the idea that “withperfect world capital mobility, there should be no relation between domestic saving anddomestic investment: saving in each country responds to the worldwide opportunities forinvestment while investment in that country is financed by the worldwide pool of capital”(FH, 1980, p. 317). The FH regression that seeks to quantify the degree of integration maybe written as follows:
(1)
where Iit is the domestic investment rate and Sit the domestic saving rate of country i at time t.
When the saving retention ratio, β, is equal to 1, it can be interpreted as a sign of non-inte-gration and investment is financed entirely by domestic saving. At the other extreme, whenβ is equal to 0, perfect economic integration takes place, i.e., capital is perfectly mobile inter-nationally. FH takes the value of the saving retention coefficient between 0 and 1 to reflectthe degree of integration.
I S i , ...,N I
TIi i i i it
t
T_ _
= + + = ==
∑α β ε ; where a1 1
1
nnd ST
Si itt
T_
==
∑1
1
85Carlos C. Bautista & Samuel Maveyraud-Tricoire / Économie internationale 111 (2007), p. 81-99.
2. China and India are not included in this study because they were less affected by Asian crisis as compared tocountries in East Asia (see Lane and Schmukler, 2006).

FH estimated the above regression using the time-averaged cross-section data of sixteenOECD countries for the period 1960–1974 and find β to be closed to 1, which was contraryto conventional wisdom that capital is mobile across countries.
Since then, a number of articles have been written attempting to explain or to suggest solutionsto what has come to be known as the Feldstein-Horioka puzzle – a high correlation betweendomestic saving and investment in the presence of capital mobility (see for example, Murphy,1984, Krol, 1996, Baxter and Crucini, 1998; Coakley et al. (1998) review the literature).
The more recent interest in the literature has mainly been driven by the availability of newdata and the recent developments in econometric methodology. Some of these studies fol-low the original FH strategy of conducting regressions on averaged country data. Modernmethods in panel regression and cointegration analysis have been used to provide betterinsights into the relation for developed countries (see Coitieux and Olivier, 2000; Corbin,2001, Jansen, 2000; Ho, 2002).
There have been several studies that cover developing Asian countries during the last threedecades. Isaksson (2001) considers seventeen Asian countries from 1975 to 1995. In allcases and using a variety of panel data techniques, the saving retention coefficients Isakssonobtained are unusually large3, implying weak integration.
Sinha (2002) studies the saving-investment relation for several of the Asian countries4 overthe period 1950 and 1999. His cointegration tests show that only the saving and investmentrates of Japan and Thailand are cointegrated. For Malaysia, Singapore, Sri Lanka andThailand, Granger causality analysis shows that an increase in the saving rate implies a rise inthe investment rate. Hence, the degree of integration appears to be weak.
Kim et al. (2005) use the “between-group” fully modified OLS (FMOLS) and dynamic OLS(DOLS) panel cointegration techniques5 and data from 1960 to 1998 for 11 Asian countries.The estimated coefficients are 0.39 and 0.42, using FMOLS and DOLS respectively, for theperiod 1980–1998. These values are much smaller than the estimates of 0.58 and 0.76 for1960–1979. The small coefficients suggest that capital mobility increased in Asian countriesin the 1980s and in the 1990s. Kim et al. (2007) use differenced data on saving and invest-ment for 10 Asian countries6 between 1980 and 2002. Controlling for the impact of shockson both saving and investment, they find that, contrary to other studies, the saving retentionratio is weaker for Asian countries than for most OECD countries and seems to havedecreased over time. These results are very heterogeneous but it seems that the savingretention coefficient has decreased since the 1980’s for most of Asian countries. The esti-mates of saving retention coefficients from the different studies are summarized in TABLE 3.
86 Carlos C. Bautista & Samuel Maveyraud-Tricoire / Économie internationale 111 (2007), p. 81-99.
3. In his study, he introduces another variable that is the foreign aid. However, this variable does not appear to besignificant.4. The countries are Hong Kong (1961-1999), India (1960-1998), Japan (1955-1998), Malaysia (1955-1999),Myanmar (1961-1998), Pakistan (1960-1999), Philippines (1948-1999), Singapore (1957-1999), South Korea (1953-1998), Sri Lanka (1950-1999) and Thailand (1950-1999).5. See Pedroni (2000, 2001) and Kao and Chiang (2000) for a detailed discussion of this recently developed method.6. These are China, Hong Kong, Indonesia, Japan, Korea, Malaysia, Philippines, Singapore, Taiwan and Thailand.

87Carlos C. Bautista & Samuel Maveyraud-Tricoire / Économie internationale 111 (2007), p. 81-99.
Table 3 - Summary of empirical studies on S–I correlation of Asian countries
Study Data Method Estimation results
Isaksson(2001)
17 Asian countries1975-1995
Panel:OLS 0.803***IV 1.057***Fixed effect model (FEM) 0.691***Random effect model (REM) 0.766***IV- FEM 0.372***IV- REM 0.802***
Sinha(2002)
11 Asian countries1950-1999
Time seriesGranger causality tests
ΔlnSR → ΔlnIR Japan (0.29), Hong-Kong (5.88), India(0.22), Malaysia (10.37***), Myanmar(3.95), Pakistan (2.47), Philippines (1.55),Singapore (11.54***), South Korea(3.55), Sri Lanka (10.33***), Thailand(11.55***)
ΔlnSR → ΔlnIR Japan (0.26), Hong-Kong (12.48***),India (0.71), Malaysia (4.15***),Myanmar (7.05), Pakistan (1.61),Philippines (0.17), Singapore (29.27***),South Korea (0.90), Sri Lanka (0.69),Thailand (6.08)
Kim et al.(2005)
11 Asian countries1960-1998
Cointegrating Panel withtime dummy:GM FMOLS 1960-1998: 0.54***, 60-79: 0.58***,
80-98: 0.39***GM DOLS 1960-1998: 0.62***, 60-79: 0.76***,
80-98: 0.42***Cointegrating Panel withouttime dummy:GM FMOLS 1960-1998: 0.69***, 60-79: 0.61***,
80-98: 0.37***GM DOLS 1960-1998: 0.84***, 60-79: 0.76***,
80-98: 0.44***
Kim et al.(2006)
10 Asian countries1980-2002
Time series
OLS (control) China (0.82***), Hong-kong (0.66),Indonesia (1.23*), Japan (1.07***),Korea (1.39***), Malaysia (0.82),Philippines (1.01), Singapore (1.15),Taiwan (0.63), Thailand (2.10*)
GLS (control) China (0.02), Hong-Kong (0.27***),Indonesia (0.26***), Japan (0.71***),Korea (0.47***), Malaysia (0.11*),Philippines (1.07***), Singapore (0.08),Taiwan (0.39***), Thailand (0.68***)
Note: ***, **, * mean that the null hypothesis is respectively rejected at a 1%, 5% or 10% level.FMOLS stand for Fully Modified OLS and DOLS for Dynamic OLS. “Control” denotes the case when all shocks up to laglength 2 taken into account by the considered study are controlled.

METHODOLOGY
Most of the recent studies reviewed above make use of panel data analysis to take advan-tage of new econometric methods. However, only a few recognize the presence of structuralchanges in the pattern of relationships being studied. This study pursues a different empiri-cal strategy. By using the Markov-switching model, the study recognizes the presence ofnonlinearities, which can be endogenously determined, that reflect a dynamic relationshipbetween saving and investment. Instead of forming panel data sets where cointegrationtechniques with multiple heterogeneous endogenous structural breaks are not available yetfor the regression we need to implement, each individual country relation with endogenousshifts is analyzed and modeled as Markov-switches.
Markov-switching regressions are used to estimate the saving retention coefficients and deter-mine in which periods it may have shifted. The FH regression specification is adopted in thisstudy. However, instead of running a linear regression using a panel or time-averaged cross-section of country investment ratios against the corresponding saving ratios, time series regres-sions are done for each country. Here, nonlinearities are accommodated by allowing the slope,intercept and the error variance to vary according to a first-order, two-state Markov process. Bythis, one is able to determine how and when shifts in the degree of capital mobility occurred.
Equation (1) is modified to permit Markov regime switching in the slope and intercept asfollows:
(2)
The dependent variable, It, is the investment to GDP ratio while the independent variable, St,is the saving to GDP ratio; εt ≈ N[0, σ(st)] is the error term. β is, as in equation (1), the savingretention coefficient and is the parameter of interest in this study. The binary variable st isassumed to represent either a high or low degree (or state) of capital mobility in an economyat date t. In both states, β is expected to lie between 0 and 1. The probability that state i isfollowed by state j is given by the transition probability: , where
. For a two-state model such as this, one can collect these probabilities and writethe transition matrix as:
(3)
An auxiliary output of Markov regime-switching regressions is a set of time series showingthe probability of occurrence of each state for each period given information from the wholesample. This is known as the smoothed probability of a state and is the basis of analysis inthe next section. Since the seminal article of Hamilton (1989), a number of algorithms andcomputer programs have been developed to solve Markov-switching problems similar to
p p
p p11 21
12 22
⎡
⎣⎢⎢
⎤
⎦⎥⎥
j ijp∑ = 1 p ob s j s iij t t= = =−Pr ( )1
I s s St t t t t= ( ) + ( ) +α β ε
88 Carlos C. Bautista & Samuel Maveyraud-Tricoire / Économie internationale 111 (2007), p. 81-99.

equation (2). In this study, Krolzig’s (1997) MSVAR package that runs on the OX program-ming environment, console version 3.4, is used.7
DATA AND EMPIRICAL RESULTS
All the annual data on the investment and saving ratios from 1965 to 2004 are provided bythe 2006 World Bank development data. Seven East Asian countries are considered: HongKong, Indonesia, South Korea, Malaysia, Philippines, Singapore and Thailand. Data, showngraphically in FIGURE 1, indicate that saving-investment relationships are heterogeneous.However, they suggest a fall of investment rate after the 1997 crisis in most Asian countrieswhereas saving rates remain constant.
Source: World Bank development data.
Hong-Kong
65 67 69 71 73 75 77 79 81 83 85 87 89 91 93 95 97 99 01 0315
20
25
30
35
40
Investment/GDP (%) Saving/GDP (%) Investment/GDP (%) Saving/GDP (%)
Investment/GDP (%) Saving/GDP (%) Investment/GDP (%) Saving/GDP (%)
Indonesia
6567697173757779818385878991939597990103– 5
0
5
10
15
20
25
30
35
40
45
South Korea
65676971737577798183858789919395979901035
10
15
20
25
30
35
40 Malaysia
656769717375777981838587899193959799010315
20
25
30
35
40
45
50
Figure 1 - Saving and Investment, as percent of GDP
89Carlos C. Bautista & Samuel Maveyraud-Tricoire / Économie internationale 111 (2007), p. 81-99.
7. See APPENDIX 1 for further discussions on the method.

Source: World Bank development data.
TABLE 4 shows the tests for unit roots using the KPSS (Kwiatkowski et al., 1992) and the DF-GLS (a modified ADF test due to Elliot et al., 1996) tests. The KPSS tests cannot reject thenull hypothesis of stationarity at a 10% level. The DF-GLS tests reject the unit root hypothe-sis in general and are consistent with the KPSS tests.
TABLE 5 shows the coefficient estimates of 2-state Markov-switching regressions for the7 countries under study. The results seem reasonable for most countries as can be seen fromthe significant t-values for most of the estimated parameters. However, results associatedwith Thailand are surprising as the saving retention coefficient is superior to 1 in state 1 andnegative in state 2. These results could be interpreted by high shocks in investment asFIGURE 1 suggests it.
Philippines
656769717375777981838587899193959799010310
15
20
25
30
35 Singapore
65676971737577798183858789919395979901035
10
15
20
25
30
35
40
45
50
55
Thailand
656769717375777981838587899193959799010315
20
25
30
35
40
45
Investment/GDP (%) Saving/GDP (%)
Investment/GDP (%) Saving/GDP (%)
Investment/GDP (%) Saving/GDP (%)
Figure 1 - Saving and Investment, as percent of GDP (next)
90 Carlos C. Bautista & Samuel Maveyraud-Tricoire / Économie internationale 111 (2007), p. 81-99.

State 1 is the state where the saving retention coefficient is low, which implies a higherdegree of capital mobility relative to state 2. The average value of the coefficient acrosscountries in state 1 is 0.36 while it is 0.63 for state 2.
The transition probability matrices for the corresponding country estimates, shown in TABLE 6,indicate that shifts are significant for all countries.
91Carlos C. Bautista & Samuel Maveyraud-Tricoire / Économie internationale 111 (2007), p. 81-99.
Table 4 - Unit root tests (with drift but no time trend)
Table 5 - Markov-switching estimates of saving retention coefficients
Hong Kong Indonesia South Korea Malaysia
State 1 Coef t-val Coef t-val Coef t-val Coef t-val
Intercept 1.87 0.58 6.32 2.14 29.42 7.12 16.15 8.33Slope 0.72 7.13 0.54 0.08 0.001 0.01 0.20 3.48Standard error 1.87 2.62 1.52 2.71
State 2 Coef t-val Coef t-val Coef t-val Coef t-val
Intercept 9.15 1.32 5.99 1.27 15.07 9.97 14.36 2.63Slope 0.75 3.32 0.77 0.04 0.61 11.11 0.64 4.34Standard error 2.06 1.46 2.42 2.80
Philippines Singapore Thailand
State 1 Coef t-val Coef t-val Coef t-val
Intercept 10.85 3.12 21.34 5.33 42.13 12.31Slope 0.44 2.58 0.23 2.39 –0.58 –4.90Standard error 1.77 6.12 1.61
State 2 Coef t-val Coef t-val Coef t-val
Intercept 11.42 5.73 32.34 10.90 0.19 0.09Slope 0.73 8.49 0.30 3.51 1.12 15.48Standard error 1.59 2.81 2.10
Series KPSS testH0: series is stationary
DF-GLS testH0: series has a unit root
Hong Kong S 0.31 –2.62**I 0.18 –2.58**
Indonesia S 0.43* –1.34I 0.36* –1.40
South Korea S 0.67** –0.38I 0.52** –1.58
Malaysia S 0.72** –0.68I 0.37* –1.55
Philippines S 0.41* –2.11**I 0.21 –1.68*
Singapore S 0.68** –0.32I 0.24 –0.99
Thailand S 0.64** –0.74I 0.27 –1.90*
Note: ***, **, * mean that H0 is respectively rejected at a 1%, 5% or 10% level.

FIGURE 2 graphs the smoothed probability of being in state 1 (where the saving retentioncoefficient is low) on the left scale and the current account in million US dollars on the rightscale. The shift in state from a high to a low coefficient value in the late 1990s (corre-sponding to the Asian crisis period) can be observed for crisis countries – Hong Kong,Indonesia, South Korea, Malaysia, the Philippines and Thailand. Hence, it appears that,except for Singapore, the Asian crisis has something to do with the path of financial inte-gration.
For countries most affected by the Asian crisis, the resulting decline in output and slack ineconomic activity produced current account surpluses as imports declined considerably.8
Using the Feldstein-Horioka framework, the econometric estimates imply that for these crisiscountries – Hong Kong, Indonesia, South Korea, Malaysia, the Philippines and Thailand –financial integration increased after the Asian crisis. As the data presented in the introduc-tion shows, it was observed that the Asian crisis deepened the financial integration of Asiancountries (see also Shiller, 2000 and Plummer et al., 2005). Hence, the Asian crisis providedenough motivation for governments to strengthen their financial system through furtherreforms that encourage more integration.
Note however that the results also show current account surpluses being accompanied byhigh probabilities of low saving retention coefficients. This is a surprising finding becausethe conventional wisdom is for capital to flow in the opposite direction: insufficient domes-tic saving is augmented by foreign saving to match investment demand, i.e., capital flows
92 Carlos C. Bautista & Samuel Maveyraud-Tricoire / Économie internationale 111 (2007), p. 81-99.
Table 6 - Transition matrices
State 1 State 2
HongKong state 1 0.920 0.080state 2 0.220 0.780
South Korea state 1 0.890 0.110state 2 0.101 0.899
Malaysia state 1 0.925 0.075state 2 0.177 0.823
Philippines state 1 0.899 0.101state 2 0.125 0.875
Singapore state 1 0.957 0.043state 2 0.066 0.934
Thailand state 1 0.924 0.077state 2 0.085 0.915
8. All crisis episodes covered by the study were followed by current account surpluses; they are the 1997 Asian crisisand the 1984-86 BOP crisis in the Philippines.

in, and this should be reflected by a current account deficit. Jeffrey Sachs, in a 1981 papershows a negative relation between investment and the current account balance for14 developed economies and this result has been taken to mean evidence for high capitalmobility. The present study’s results can also be contrasted with other studies. One canlook at the case of the Euro area although the circumstances are totally different from Asia.Blanchard and Giavazzi (2002), in a study of the Euro area show that for Portugal andGreece who were in the process of catching up with their relatively wealthier neighborsthrough financial and goods market integration, current account deficits were seen as areflection of the integration process where declining saving retention coefficients wereobserved.
Source: World Bank development data.
Hong-Kong
65 68 71 74 77 80 83 86 89 92 95 98 01 04– 0,2
0
0,2
0,4
0,6
0,8
1
1,2
– 10
– 5
0
5
10
15
Prob of low coeff CA/GDP (%) Prob of low coeff CA/GDP (%)
Prob of low coeff CA/GDP (%) Prob of low coeff CA/GDP (%)
Indonesia
65 68 71 74 77 80 83 86 89 92 95 98 01 04– 0,2
0
0,2
0,4
0,6
0,8
1
1,2
– 10
– 5
0
5
10
15
20
South Korea
65 68 71 74 77 80 83 86 89 92 95 98 01 04– 0,2
0
0,2
0,4
0,6
0,8
1
1,2
– 15
– 10
– 5
0
5
10
15 Malaysia
65 68 71 74 77 80 83 86 89 92 95 98 01 04– 0,2
0
0,2
0,4
0,6
0,8
1
1,2
– 15
– 10
– 5
0
5
10
15
20
25
30
Figure 2 - Smoothed probability of low retention coefficient and the currentaccount, in percent of GDP
93Carlos C. Bautista & Samuel Maveyraud-Tricoire / Économie internationale 111 (2007), p. 81-99.

Source: World Bank development data.
TABLE 7 shows that the crisis of 1997 has little impact on domestic saving rates of East Asiancountries; indeed, the average savings rates are not really different for the periods 1990-1997 and 1998-2004. These rates stood at more than 30% for both periods in most EastAsian countries. This situation is unlike those of other developing countries as Brazil andMexico whose savings rates are below 18% before and after 1997. For most industrialisedcountries, there is a wide variation in domestic saving rates all of which are much lower thanthose of the Asian countries. Hence, the positive current accounts are mainly explained bythe falling domestic investment rates which, as shown in TABLE 7, have significantly decreasedsince 1997. These rates range between 19% for the Philippines and 29% for South Koreaduring the period 1998-2004 (which nonetheless rates remain higher than those of other
Philippines
65 68 71 74 77 80 83 86 89 92 95 98 01 04– 0,2
0
0,2
0,4
0,6
0,8
1
1,2
– 15
– 10
– 5
0
5
10
Prob of low coeff CA/GDP (%) Prob of low coeff CA/GDP (%)
Singapore
65 68 71 74 77 80 83 86 89 92 95 98 01 04– 0,2
0
0,2
0,4
0,6
0,8
1
1,2
– 25
– 20
– 15
– 10
– 5
0
5
10
15
20
25
30
35
Prob of low coeff CA/GDP (%)
Thailand
65 68 71 74 77 80 83 86 89 92 95 98 01 04– 0,2
0
0,2
0,4
0,6
0,8
1
1,2
– 10
– 5
0
5
10
15
20
Figure 2 - Smoothed probability of low retention coefficient and the currentaccount, in percent of GDP (next)
94 Carlos C. Bautista & Samuel Maveyraud-Tricoire / Économie internationale 111 (2007), p. 81-99.

developing countries and industrialised ones.) Thus the puzzling result of low saving reten-tion coefficients and current account surpluses in South East Asian countries appears to bedue to high domestic saving rates and low, decreasing domestic investment rates.
Table 7 - Gross domestic investment and gross domestic saving
CONCLUDING REMARKS
In this article, the impact of the Asian crisis on the financial integration of selected East Asiancountries with the rest of the world is examined. Financial integration is measured by analyz-ing the saving-investment relationship using the Feldstein-Horioka framework. The frame-work however is not without faults. The source of several criticisms of the Feldstein-Horiokaresult is due to its simplicity in both exposition and empirical testing. Responding to thesecriticisms, e.g., endogeneity of saving, lack of a general equilibrium framework, lack of theo-retical foundations or estimation of an identity, would introduce intricacies which this studyavoided. Here, the simplicity of the framework is retained but the econometric implementa-tion is radically changed.
Markov-switching estimates of the saving retention coefficients for selected East Asianeconomies show that periods with relatively low estimates, implying relatively higher capitalmobility, are associated with current account surpluses. With this, one can interpret switchesfrom one state to another as movements of saving and investment to satisfy the intertempo-ral budget constraint by each individual country. Hence, the results obtained in this studyshow that the saving-investment association is not at all mysterious. The findings of the
Average of domestic investmentrates (in %)
Average of domestic saving rates(in %)
1990-1997 1998-2004 1990-1997 1998-2004
Hong Kong 30.50 25.22 31.98 30.60Indonesia 30.95 19.01 31.97 26.76South Korea 37.47 29.10 36.17 33.83Malaysia 39.25 24.07 38.81 44.90Philippines 23.12 18.71 16.20 17.33Singapore 35.80 25.69 47.37 47.90Thailand 40.25 23.38 35.41 32.21
Brazil 16.22 15.24 16.32 15.15France 23.28 23.48 23.92 24.87Germany 24.83 21.48 25.04 24.07Japan 33.50 29.01 34.99 30.47Mexico 17.89 19.21 16.24 17.30United Kingdom 18.20 19.55 17.27 17.19United States 20.40 23.03 19.35 19.29
Source: World Bank development data.
95Carlos C. Bautista & Samuel Maveyraud-Tricoire / Économie internationale 111 (2007), p. 81-99.

study are consistent with the work of Corbin (2001) who found that the heterogeneity ofcountries may be more important than common characteristics in finding a significant saving-investment relationship. This can be seen from the study’s results where implementation ofpolicies and/or phases of development at different times during the 1980s coincided withshifts in the coefficients.
The puzzling result – low saving retention coefficients that are accompanied by currentaccount surpluses – that runs counter to conventional wisdom was shown to be the result ofdeclining investment rates in the face of high and stable savings rates. At this point, one canonly make conjectures to shed more light on this puzzle. For example, the study did not con-sider the fiscal policy stance of countries which definitely has important implications on sav-ing-investment patterns. It could also be surmised that the Asian crisis implied a decline inTobin’s q and hence, in the capability to invest. At the microeconomic level, many other fac-tors that affect the savings rate may be examined that can potentially help explain theresults, like reorganization efforts in post-Asian crisis firms that shifted the input mix towardless capital and more skill and knowledge-intensive type of production in these countries (Leeet al., 2004). Or perhaps a shift in the demographic transition toward an older populationobserved in these countries may explain the fall of investment rates. All these can beexplored in more detail and may be fruitful areas for further research.
C. C. B. & S. M.-T.9
96 Carlos C. Bautista & Samuel Maveyraud-Tricoire / Économie internationale 111 (2007), p. 81-99.
9. This paper was prepared for the ASIA-LINK human resource development project: Euro-Philippines Network onBanking and Finance, Safety and Soundness of the Financial System, coordinated by the University of Limoges(http://www.upd.edu.ph/~cba/asialink/). ASIA-LINK is a Programme of the European Commission that seeks to pro-mote regional and multilateral networking among higher education institutions in Europe and developing economiesin Asia.Helpful comments of anonymous referees, Valérie Mignon and participants of the 27-28 March 2007 Beijing, ChinaConference on the “Opening and Innovation on Financial Emerging Markets” are gratefully acknowledged. Theremaining errors are however, the sole responsibility of the authors.
APPENDIX 1
Markov-Switching regression
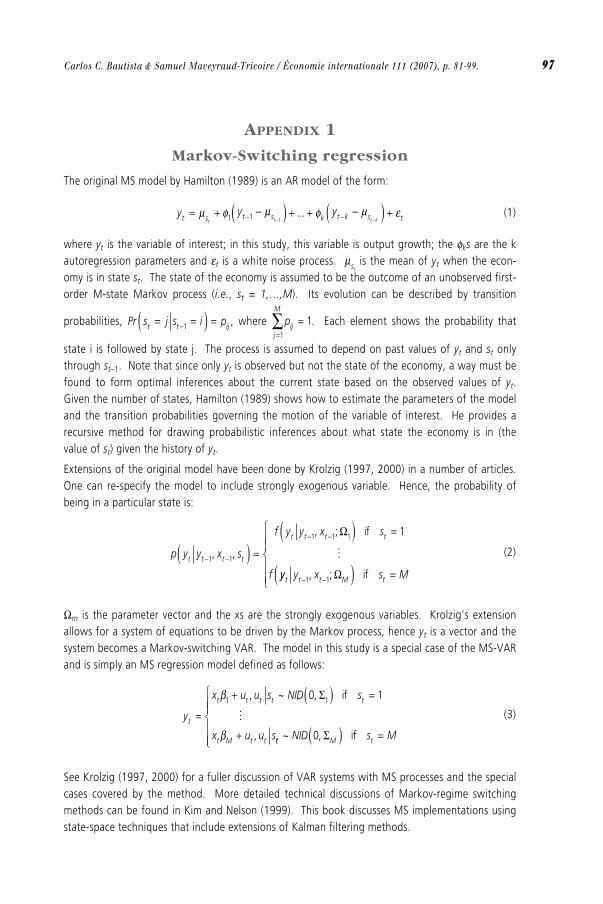
The original MS model by Hamilton (1989) is an AR model of the form:
(1)
where yt is the variable of interest; in this study, this variable is output growth; the φks are the kautoregression parameters and εt is a white noise process. is the mean of yt when the econ-omy is in state st. The state of the economy is assumed to be the outcome of an unobserved first-order M-state Markov process (i.e., st = 1,…,M). Its evolution can be described by transition
probabilities, , where . Each element shows the probability that
state i is followed by state j. The process is assumed to depend on past values of yt and st onlythrough st–1. Note that since only yt is observed but not the state of the economy, a way must befound to form optimal inferences about the current state based on the observed values of yt.Given the number of states, Hamilton (1989) shows how to estimate the parameters of the modeland the transition probabilities governing the motion of the variable of interest. He provides arecursive method for drawing probabilistic inferences about what state the economy is in (thevalue of st) given the history of yt.
Extensions of the original model have been done by Krolzig (1997, 2000) in a number of articles.One can re-specify the model to include strongly exogenous variable. Hence, the probability ofbeing in a particular state is:
(2)
Ωm is the parameter vector and the xs are the strongly exogenous variables. Krolzig’s extensionallows for a system of equations to be driven by the Markov process, hence yt is a vector and thesystem becomes a Markov-switching VAR. The model in this study is a special case of the MS-VARand is simply an MS regression model defined as follows:
(3)
See Krolzig (1997, 2000) for a fuller discussion of VAR systems with MS processes and the specialcases covered by the method. More detailed technical discussions of Markov-regime switchingmethods can be found in Kim and Nelson (1999). This book discusses MS implementations usingstate-space techniques that include extensions of Kalman filtering methods.
y
x u u s NID s
x u u st
t t t t t
t M t t
=
+ ( ) =
+
β
β
1 10 1, ~ ,
,
Σ if
M
tt M tNID s M~ ,0 Σ( ) =
⎧
⎨⎪⎪
⎩⎪⎪ if
p y y x s
f y y x s
ft t t t
t t t t
− −
− −
( ) =
( ) =
1 1
1 1 1 1
, ,
, ; Ω if
M
yy y x s Mt t t M t− −( ) =
⎧
⎨⎪⎪
⎩⎪⎪ 1 1, ; Ω if
pij
j
M
==
∑ 11
Pr s j s i pt t ij= =( ) =−1
μst
y y y
t s t s k t k s tt t t k= + −( ) + + −( ) +− −− −
μ φ μ φ μ ε1 1 1...
97Carlos C. Bautista & Samuel Maveyraud-Tricoire / Économie internationale 111 (2007), p. 81-99.

REFERENCES
Baharumshah, A.Z., Thanoon, M.A.M., 2006. Foreign capital flows and economic growth in EastAsian countries, China Economic Review 17 (1), 70-83.
Baxter, M., Crucini, M.J., 1993. Explaining saving-investment correlation, American EconomicReview 83 (3), June, 416-436.
Blanchard, O.J., Giavazzi, F., 2002. Current account deficits in the euro area: The end of theFeldstein-Horioka puzzle?, Brookings Papers on Economic Activity 2/2002, 147-86.
Coakley, J., Kulasi, F., Smith, R., 1998. The Feldstein-Horioka puzzle and capital mobility: A review,International Journal of Finance and Economics 3 (2), April, 169-88.
Coitieux, M., Olivier, S., 2000. The saving retention coefficient in the long run and in the short run:Evidence from panel data, Journal of International Money and Finance 19, 535-48.
Corbin, A., 2001. Country specific effects in the Feldstein-Horioka paradox: A panel data analysis,Economics Letters 72 (3), 297-302.
Elliott, G., Rothenberg, T.J., Stock, J.H., 1996. Efficient tests for an autoregressive unit root,Econometrica 64 (4), July, 813-36.
Feldstein, M., Horioka, C., 1980. Domestic savings and international capital flows, Economic Journal90 (358), 314-29.
Ghosh, S.R., 2006. East Asian finance: The road to robust markets, The World Bank.
Hamilton, J.D., 1989. A new approach to the economic analysis of nonstationary time series andthe business cycle, Econometrica 57 (2), March, 357 – 84.
Ho, T.-W., 2002. The Feldstein-Horioka puzzle revisited, Journal of International Money and Finance21 (4), August, 555-64.
Isaksson, A., 2001. Financial liberalisation, foreign aid, and capital mobility: Evidence from 90 devel-oping countries, Journal of International Financial Markets, Institutions and Money 11 (3-4),September-December, 309-38.
Jansen, W., 2000. International capital mobility: Evidence from panel data, Journal of InternationalMoney and Finance 19 (4), August, 507-11.
Kao, C., Chiang, M.H., 2000. On the estimation and inference of a cointegrated regression in paneldata, in Nonstationary panels, panel cointegration, and dynamic panels2000, Advances inEconometrics 15, 179–222, Amsterdam; New York and Tokyo: Elsevier Science, JAI.
Kim, S., Kim, H.S., Wang, Y., 2007. Saving, investment and international capital mobility in EastAsia, Japan and the World Economy 19 (2), 279-91.
Kim, C.-J., Nelson, C., 1999. State-Space Models with Regime Switching, MIT Press, Cambridge,Massachusetts.
Kim, H., Oh, K.-Y., Jeong, C.-W., 2005. Panel cointegration results on international capital mobilityin Asian economies, Journal of International Money and Finance 24 (1), February, 71-82.
Krol, H., 1996. International capital mobility: Evidence from panel data, Journal of InternationalMoney and Finance 15 (3), June, 467-74.
98 Carlos C. Bautista & Samuel Maveyraud-Tricoire / Économie internationale 111 (2007), p. 81-99.

Krolzig, H.-M., 1997. Markov-switching vector autoregressions, modelling, statistical inference andapplication to business cycle analysis, Lecture Notes in Economics and Mathematical Systems 454,Heidelberg and New York: Springer.
Krolzig, H.-M., 2000. Predicting Markov-switching vector autoregressive processes, manuscript.
Kwiatkowski, D. et al., 1992. Testing the null hypothesis of stationarity against the alternative of aunit root: How sure are we that economic time series have a unit root?, Journal of Econometrics 54(1-3), October-December, 159-78.
Lane, P.R., Schmukler, S.L., 2006. The international financial integration of China and India, chapter4 in China, dancing with the giants: India and the global economy, www.worldbank.org.
Lee, J.-W., McKibbin, W., Park, Y.-C., 2004. Transpacific trade imbalances: Causes and cures,Brookings Discussion Papers in International Economics 162.
Murphy, R.G., 1984. Capital mobility and the relationship between saving and investment in OECDcountries, Journal of International Money and Finance 3 (3), December, 327-42.
Pedroni, P., 2000. Fully modified OLS for heterogeneous cointegrated panels, in Nonstationary pan-els, panel cointegration, and dynamic panels 2000, Advances in Econometrics 15, 93–130,Amsterdam; New York and Tokyo: Elsevier Science, JAI.
Pedroni, P., 2001. Purchasing power parity tests in cointegrated panels, Review of Economics andStatistics 83 (4), November, 723-31.
Plummer, M.G., Click, R.W., 2005. Bond market development and integration in Asean,International Journal of Finance and Economics 10 (2), April, 133-42.
Sachs, J.D., 1981. The current account and macroeconomic adjustment in the 1970s, BrookingsPaper on Economic Activity 1, 201-68.
Shiller, R.J., 2000. Irrational Exuberance, (see 228-229), Princeton University Press.
Sinha, D., 2002. Saving-investment relationships for Japan and other Asian countries, Japan and theWorld Economy 14 (1), January, 1-23.
99Carlos C. Bautista & Samuel Maveyraud-Tricoire / Économie internationale 111 (2007), p. 81-99.
