rwe company presentation · model at nordsee ost for offshore wind farms and amrumbank london array...
TRANSCRIPT
RWE Company Presentation
As of August 2018
RWE AG | Company Presentation | August 2018
Disclaimer
This document contains forward-looking statements. These statements are based on the current views, expectations, assumptions and information of the management, and are based on information currently available to the management. Forward-looking statements shall not be construed as a promise for the materialisation of future results and developments and involve known and unknown risks and uncertainties. Actual results, performance or events may differ materially from those described in such statements due to, among other things, changes in the general economic and competitive environment, risks associated with capital markets, currency exchange rate fluctuations, changes in international and national laws and regulations, in particular with respect to tax laws and regulations, affecting the Company, and other factors. Neither the Company nor any of its affiliates assumes any obligations to update any forward-looking statements.
Page 2
All figures regarding renewables business are based on pro forma combined innogy and E.ON publicly available renewables data. The implementation of the transaction is still subject to conditions, including merger control clearances.
RWE AG | Company Presentation | August 2018
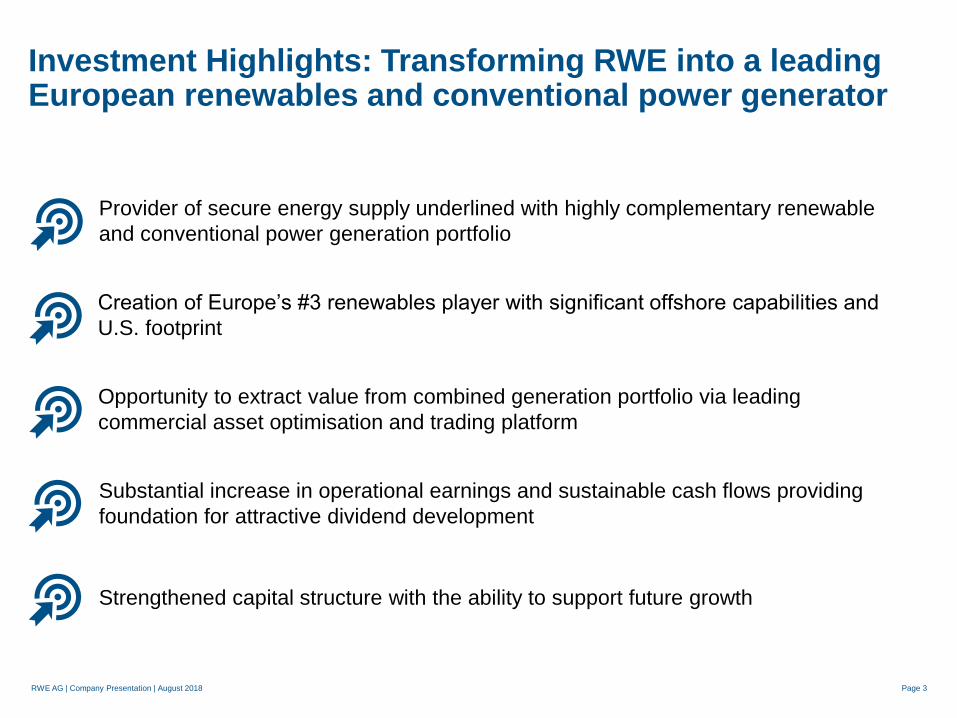
Investment Highlights: Transforming RWE into a leading European renewables and conventional power generator
Opportunity to extract value from combined generation portfolio via leading
commercial asset optimisation and trading platform
Substantial increase in operational earnings and sustainable cash flows providing
foundation for attractive dividend development
Provider of secure energy supply underlined with highly complementary renewable
and conventional power generation portfolio
Strengthened capital structure with the ability to support future growth
Creation of Europe’s #3 renewables player with significant offshore capabilities and
U.S. footprint
Page 3

RWE AG | Company Presentation | August 2018
Strategic highlight:
RWE continues to reshape its future
Page 4
RWE AG | Company Presentation | August 2018
Financial portfolio
New
Renewables
innogy RES
E.ON RES
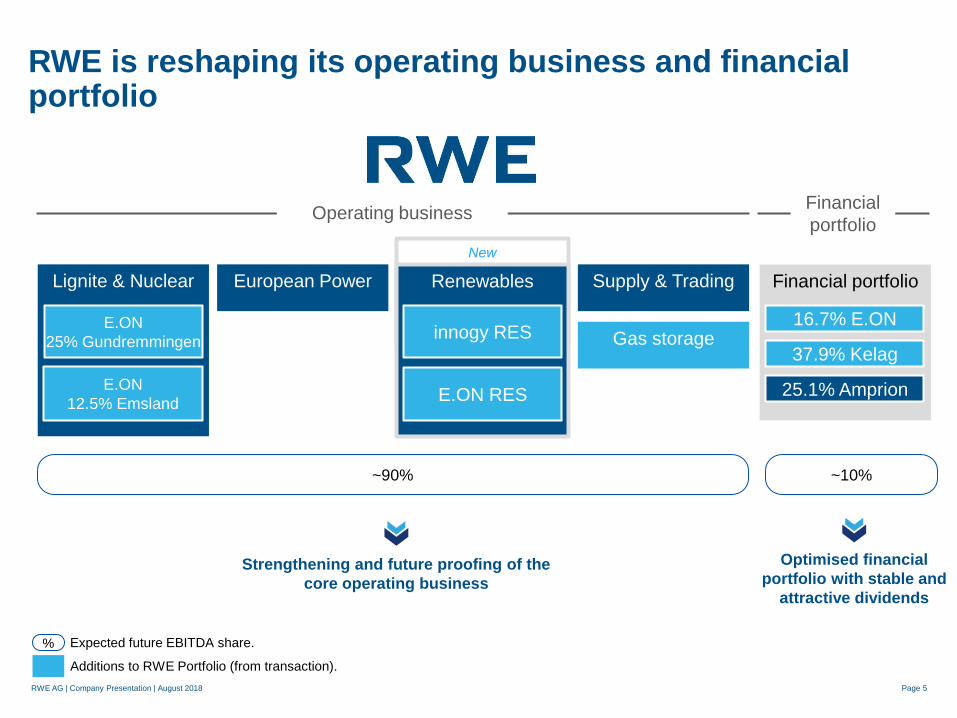
RWE is reshaping its operating business and financial portfolio
Supply & Trading
Gas storage 16.7% E.ON
25.1% Amprion
~90% ~10%
Expected future EBITDA share. %
Lignite & Nuclear
E.ON
25% Gundremmingen
European Power
Optimised financial
portfolio with stable and
attractive dividends
Strengthening and future proofing of the
core operating business
37.9% Kelag
Page 5
Operating business Financial
portfolio
E.ON
12.5% Emsland
Additions to RWE Portfolio (from transaction).
RWE AG | Company Presentation | August 2018
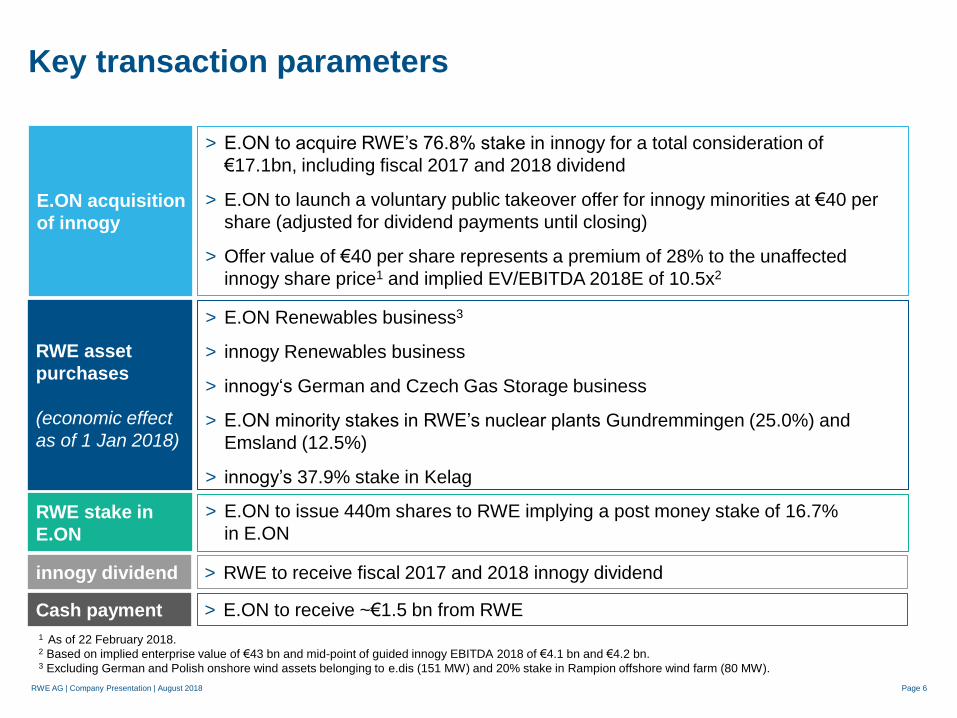
1 As of 22 February 2018. 2 Based on implied enterprise value of €43 bn and mid-point of guided innogy EBITDA 2018 of €4.1 bn and €4.2 bn. 3 Excluding German and Polish onshore wind assets belonging to e.dis (151 MW) and 20% stake in Rampion offshore wind farm (80 MW).
Key transaction parameters
Page 6
E.ON acquisition
of innogy
RWE asset
purchases
(economic effect
as of 1 Jan 2018)
> E.ON to acquire RWE’s 76.8% stake in innogy for a total consideration of
€17.1bn, including fiscal 2017 and 2018 dividend
> E.ON to launch a voluntary public takeover offer for innogy minorities at €40 per
share (adjusted for dividend payments until closing)
> Offer value of €40 per share represents a premium of 28% to the unaffected
innogy share price1 and implied EV/EBITDA 2018E of 10.5x2
> E.ON Renewables business3
> innogy Renewables business
> innogy‘s German and Czech Gas Storage business
> E.ON minority stakes in RWE’s nuclear plants Gundremmingen (25.0%) and
Emsland (12.5%)
> innogy’s 37.9% stake in Kelag
RWE stake in
E.ON
> E.ON to issue 440m shares to RWE implying a post money stake of 16.7%
in E.ON
Cash payment > E.ON to receive ~€1.5 bn from RWE
innogy dividend > RWE to receive fiscal 2017 and 2018 innogy dividend

RWE AG | Company Presentation | August 2018
10.3
7.3
2.8 14.8
8.3
2.8
Highly complementary renewables and conventional generation portfolio
> Leading European generator with
diversified and balanced generation
technologies
> De-risking of portfolio with >60% of low
CO2 generation capacity
> Leading provider of reliable and flexible
generation capacity to balance intermittent
production of renewables
> Opportunity to extract value from enlarged
portfolio through leading commercial asset
optimisation platform Lignite Hard coal Nuclear
Gas Renewables Other
Pro forma combined electricity generation capacity1
46 GW
(as at 31 December 2017)
1 RWE stand-alone (excluding Mátra) plus E.ON’s and innogy’s renewables businesses.
Firm and
flexible
capacity
>80%
Low CO2
generation
capacity
>60%
Page 7

RWE AG | Company Presentation | August 2018
Leading renewables player with attractive growth platform
Pro forma combined renewables capacity2
1 Bloomberg New Energy Finance, March 2018. 2 As at 30 June 2018. Pro rata view. Excludes RWE’s own renewable capacity.
Page 8
> No. 3 renewables player in Europe with well-balanced portfolio and strong position in U.S. onshore
wind market
> Leading European offshore wind platform with 1.9 GW in operation and 1.3 GW in construction and
advanced development
> Strong development pipeline in attractive growth markets and scope for efficiencies
Installed renewable capacity in Europe1
Pro
forma
combined
19%
24%
6% 4%
4%
36%
7% Germany
UK
Iberia
Benelux
Italy
US
RoW
8.6 GW

RWE AG | Company Presentation | August 2018
Strong platform with attractive growth prospects
Inoperation
Underconstruction
Close toFID
Total
8.6
0.7
1.4 10.7
Capacity in operation, under construction and close to FID1
GW, pro rata
1 Pro forma combined renewables capacity as at 30 June 2018. Pro rata view. Excluding renewable portfolio of E.DIS and 20% of Rampion. 2 59% stake in Triton Knoll as per innogy announcement of 13 August 2018.
Source: innogy and E.ON.
> Total combined development pipeline of ~17 GW
> Projects under construction include projects expected to be commissioned in 2018 and 2019
> Advanced development includes projects with FID in 2018 and 2019 and expected commissioning between 2019 and 2021
Page 9
Galloper 88 MW
Arkona 194 MW
Stella 201 MW
Morcone 57 MW
Other 166 MW
Triton Knoll2 507 MW
Australian PV 462 MW
Cassadegga 126 MW
West of Pecos 100 MW
Other 250 MW
RWE AG | Company Presentation | August 2018
Earnings growth foreseen until early 2020s before investing into further pipeline projects
Page 10
2015 2020 2025 2030 20352017
€1.5 bn
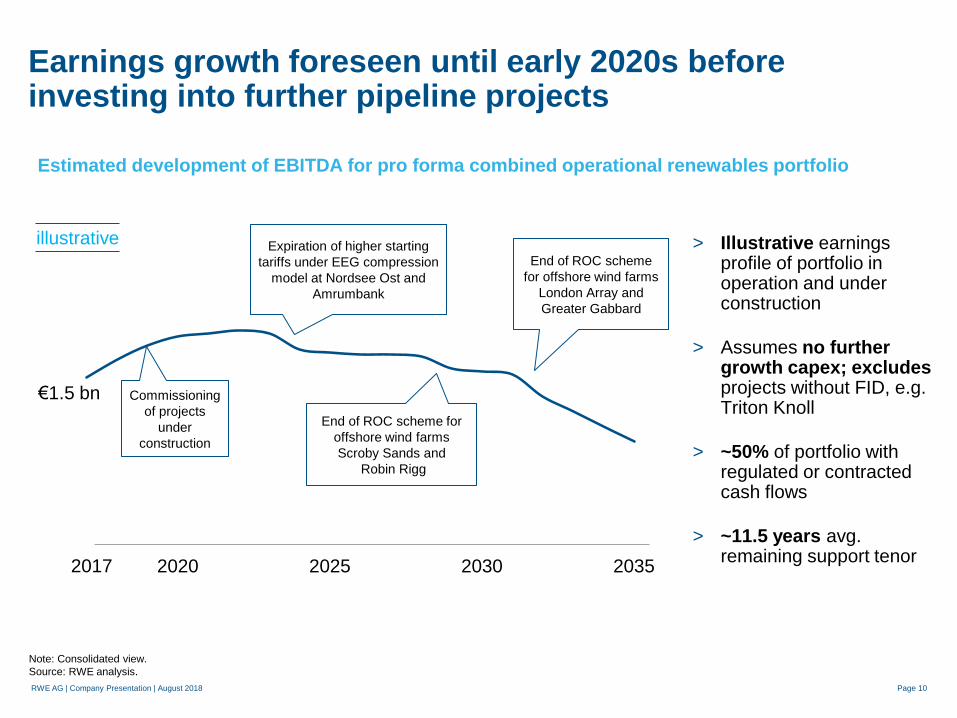
Estimated development of EBITDA for pro forma combined operational renewables portfolio
Commissioning
of projects
under
construction
Expiration of higher starting
tariffs under EEG compression
model at Nordsee Ost and
Amrumbank
End of ROC scheme for
offshore wind farms
Scroby Sands and
Robin Rigg
End of ROC scheme
for offshore wind farms
London Array and
Greater Gabbard
Note: Consolidated view.
Source: RWE analysis.
> Illustrative earnings profile of portfolio in operation and under construction
> Assumes no further growth capex; excludes projects without FID, e.g. Triton Knoll
> ~50% of portfolio with regulated or contracted cash flows
> ~11.5 years avg. remaining support tenor
illustrative

RWE AG | Company Presentation | August 2018
Step-change in operating business with doubling of EBITDA post transaction
European Power
Dividends Renewables
Lignite & Nuclear Supply & Trading
> Significant earnings
accretion with more than
90% of EBITDA from
operating businesses
> Diversification of
earnings mix
> ~60% contribution from
renewables to pro forma
EBITDA
> ~50% of operating EBITDA
coming from contracted
operations3 with visible and
stable earnings profile
1 EBITDA split based on mid-point 2018 EBITDA guidance for RWE stand-alone.
2 Split based on estimated numbers post closing.
3 Contracted operations include earnings from capacity payments for conventional generation, ROCs, CfDs, feed-in tariffs and PPAs.
Pro forma EBITDA2 RWE stand-alone EBITDA1
Page 11
1.4 – 1.7
(€ bn)
~25%
~20%
~40%
~15%
~30%
~10%
~60%

RWE AG | Company Presentation | August 2018
Strong financial position post transaction provides ability to support future growth
Page 12
Transactional debt effects
> Strong commitment to investment grade rating
> Leverage supported by strong operational
cash flows and financial portfolio
> Pro forma net debt / EBITDA post transaction
of 2.5x – <3.0x
Nuclear provisions
Total debt increase
Pension provisions
Tax equity liabilities
~€0.8bn
~€0.9bn
~€0.5bn
~€0.6bn
Rating strategy
~€2.8bn
Financing
> Limited cash requirements from transaction
financed through own liquidity and funds
> No assumption of capital market debt or
plans to issue senior bonds Provisions for wind
asset dismantling

RWE AG | Company Presentation | August 2018
Major transaction and legal milestones until closing
Page 13
Announcement of transaction (12 March 2018)
E.ON public tender offer
(PTO) for innogy minorities
1 Excluding German and Polish onshore wind assets belonging to e.dis (151 MW) and 20% stake in Rampion offshore wind farm (80 MW).
Closing I > RWE sale of 76.8% innogy stake
> E.ON issuance of 440m shares to RWE
> RWE purchase of E.ON minority stakes in nuclear
plants Gundremmingen (25.0%) and Emsland (12.5%)
> RWE cash payment of ~€1.5bn to E.ON
Closing II > RWE purchase of innogy Renewables
> RWE purchase of E.ON Renewables1
> RWE purchase of innogy Gas Storage and 37.9% in Kelag
Merger control and
regulatory reviews
and approvals
Implementation of full control
under corporate law
2019
2018
RWE AG | Company Presentation | August 2018
Strategic developments in current operations
Page 14
RWE AG | Company Presentation | August 2018
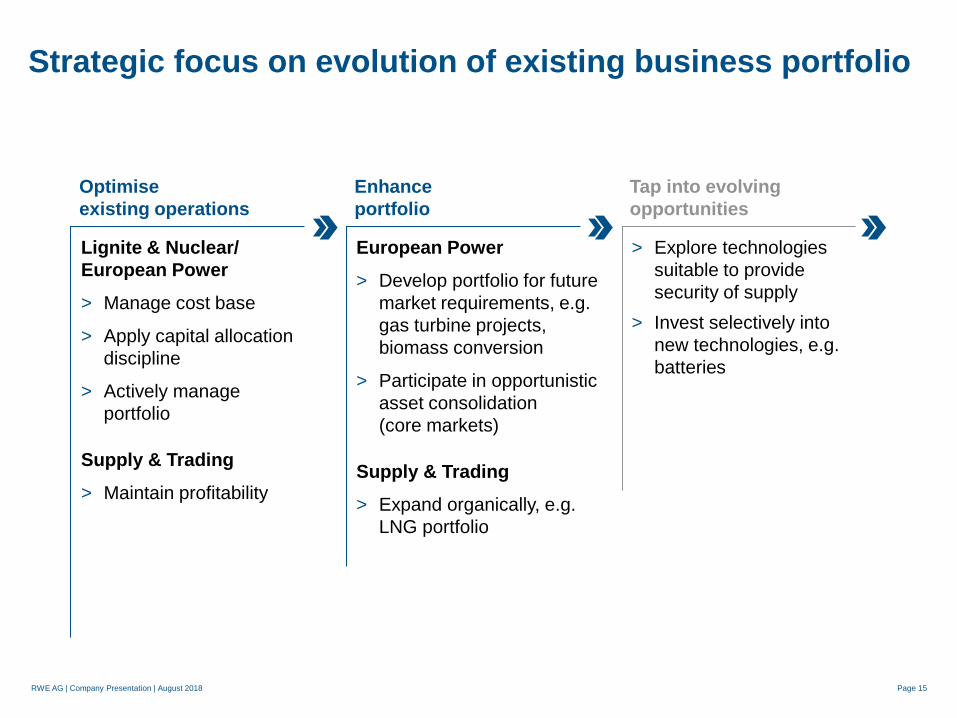
Strategic focus on evolution of existing business portfolio
Page 15
Optimise
existing operations
Enhance
portfolio
Tap into evolving
opportunities
Lignite & Nuclear/
European Power
> Manage cost base
> Apply capital allocation
discipline
> Actively manage
portfolio
Supply & Trading
> Maintain profitability
European Power
> Develop portfolio for future
market requirements, e.g.
gas turbine projects,
biomass conversion
> Participate in opportunistic
asset consolidation
(core markets)
Supply & Trading
> Expand organically, e.g.
LNG portfolio
> Explore technologies
suitable to provide
security of supply
> Invest selectively into
new technologies, e.g.
batteries

RWE AG | Company Presentation | August 2018
TSOs expect significant tightening of secure generation capacity
Page 16
1 Analysis of the German Transmission System Operators (TSO) of supply/demand balance ‘Leistungsbilanz 2016-2020’ from Oct 2017.
-1
0
1
2
3
4
5
2016 2017 2018 2019 2020
(GW)
TSO supply/demand balance1
> TSOs forecast potential for negative
supply/demand balance by 2020
> Reduction of reliable capacity driven by nuclear
phase-out and hard coal plant closures
> Growing need for TSOs to secure capacity via
reserve mechanisms
> Analysis points to increasing reliability on
imports at times of low contribution from
renewables

RWE AG | Company Presentation | August 2018
RWE‘s significant CO2 reductions in line with European and national climate goals
Page 17
7%
2012 2015 2017 2030
> Significant CO2 reduction since 2012
> More than 10% emissions reduction in 2017
> Target to reduce CO2 emissions by 55 to 65
million tonnes by 2030 compared to 2015
> Continuous decline to coal exposure
– Biomass co-firing at Dutch hard coal
plants
– Transfer of 1.5 GW of lignite to stand-by
reserve and final shut-down after 4 years
– Closure of Weisweiler power plant site
(1.8 GW) at end of Inden mine by 2030
– Reduction in load factors of lignite and
hard coal plants
171
141
-27% Reduction
target1:
55 – 65
million tonnes
vs. 2015
RWE’s CO2 emissions in core markets1
(million tonnes)
1 Referring to RWE stand-alone portfolio, excluding Mátra in Hungary and Denizli in Turkey.
125

RWE AG | Company Presentation | August 2018
Future growth options are developed and next steps considered
Page 18
Gundremmingen
> Development of open
gas turbine project for
grid stability reserve
> Use of existing
nuclear site
> Auction by TSOs
expected to start in
2018
Tilbury Energy Centre
> Development of various
new build options
> Attractive location with
existing grid connection
and direct water cooling
Global LNG portfolio
> Growth of supply
contracts portfolio,
among others
– Angola LNG
– Woodside Energy
– Qatargas
0.1 0.7 1.2
2.0
3.7
6.1
0
2
4
6
8
2012 2013 2014 2015 2016 2017
(m tons)
RWE AG | Company Presentation | August 2018
Financial highlights FY 2017
Page 19
RWE AG | Company Presentation | August 2018
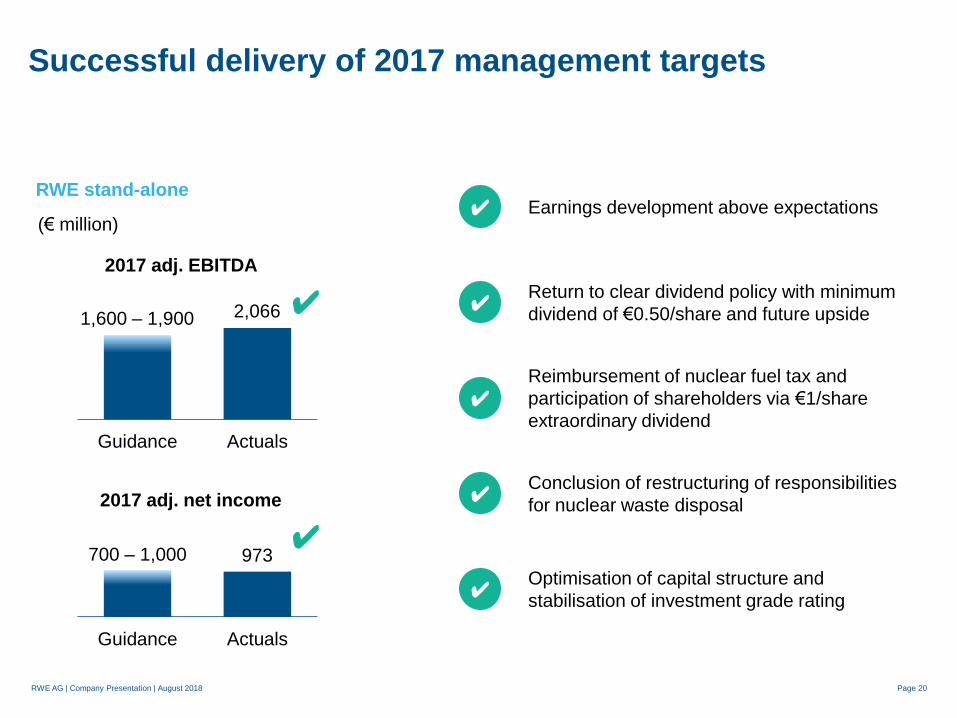
Successful delivery of 2017 management targets
Optimisation of capital structure and
stabilisation of investment grade rating
Earnings development above expectations
Return to clear dividend policy with minimum
dividend of €0.50/share and future upside
Reimbursement of nuclear fuel tax and
participation of shareholders via €1/share
extraordinary dividend
Conclusion of restructuring of responsibilities
for nuclear waste disposal
✔
✔
✔
✔
✔
Guidance Actuals
Guidance Actuals
RWE stand-alone
(€ million)
2017 adj. EBITDA
2017 adj. net income
1,600 – 1,900 2,066 ✔
700 – 1,000 973 ✔
Page 20

RWE AG | Company Presentation | August 2018
Development of adjusted EBITDA dominated by recovery of earnings at Supply & Trading
Page 21
RWE stand-alone
FY 2016
innogy
Supply & Trading
Other,
consolidation
1,928
+97
2,066
-408
+410
FY 2017
Lignite & Nuclear
European Power +86
-47
Group
5,403
+86
-408
+410
+128
+137
5,756
(€ million) > Lignite & Nuclear:
Declining generation margins
Lower non-recurring items compared to 2016
> European Power:
Strong contribution from commercial asset
optimisation
Higher non-recurring items compared to 2016
> Supply & Trading:
Strong earnings contribution after losses in
2016
> innogy as part of RWE stand-alone:
dividend inflow of €683 million in 2017;
Previous year pro forma appropriation of profits
of innogy subsidiaries of €730 million

RWE AG | Company Presentation | August 2018
Adjusted net income FY 2017 reaches €973 million
Page 22
2,066
1,474
-592
-373
-65
973
-63
Adj. financial result
Adj. EBITDA
Adj. depreciation
Adj. tax
Adj. EBIT
Adj. net income
Adj. minorities
& hybrids
Group RWE stand-alone
5,756
3,646
-2,110
-1,060
-630
-724
1,232
(€ million) > RWE stand-alone adj. EBITDA includes
operating income from Lignite & Nuclear,
European Power, Supply & Trading and
dividend from innogy
> All effects related to the reimbursement of the
nuclear fuel tax are adjusted
> Financial result adjusted for effects from
changes in discount rates for other long-term
provisions, interest on nuclear fuel tax, one-off
costs from hybrid bond buy back and interest
income from tax audit for previous years
> Limited adjusted taxable earnings at RWE
stand-alone
> Hybrid bond partly classified as equity pursuant
to IFRS

RWE AG | Company Presentation | August 2018
High FY 2017 distributable cash flow despite negative effects in working capital
Page 23
2,066
1,023
-639
-404
-283
-136
533
-72
Change in operating
working capital
Adj. EBITDA
Change in provisions &
other non-cash items
Cash interests/taxes
Cash contribution
Capex
Distributable
cash flow
Minorities + hybrids
2017
> innogy dividend of €683 million fully reflected in
adj. EBITDA
> Changes in provisions refer mainly to legacy
provisions, nuclear provisions and restructuring
provisions
> Change in operating working capital 2017
mainly impacted by phasing out of working
capital optimisation measures from previous
years and slightly higher gas inventories
> Strong improvement in cash interest/taxes
compared to FY 2016 is another main driver for
higher distributable cash flow
2016
1,928
924
-656
-600
-421
-78
-175
(€ million)
-348
RWE stand-alone
RWE AG | Company Presentation | August 2018
Solid capital structure with high financial flexibility
Page 24
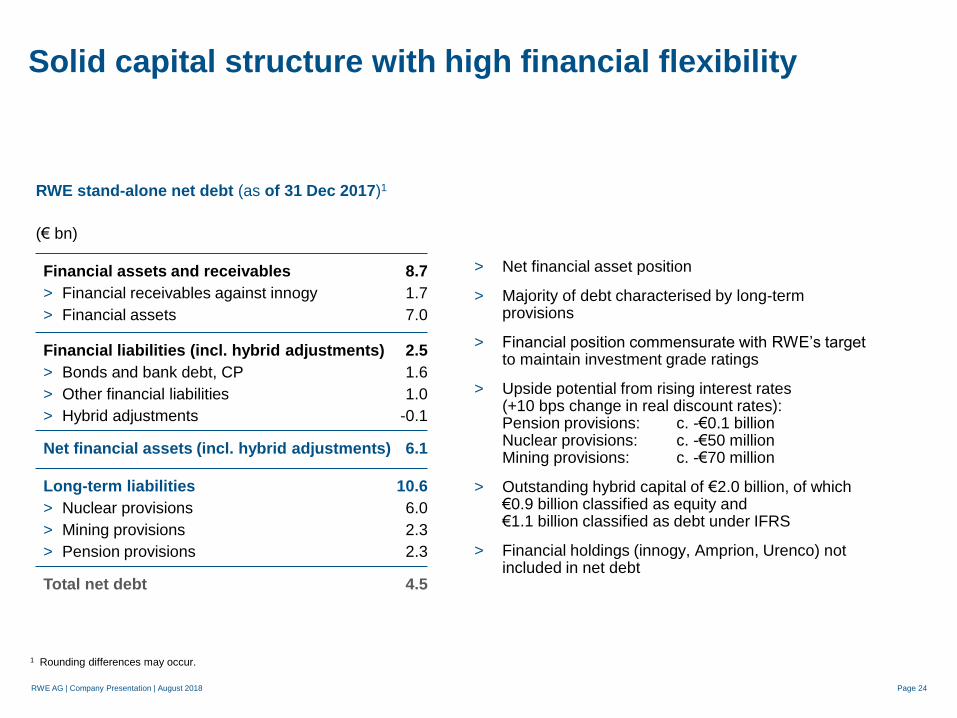
Financial assets and receivables
> Financial receivables against innogy
> Financial assets
(€ bn)
RWE stand-alone net debt (as of 31 Dec 2017)1
Financial liabilities (incl. hybrid adjustments)
> Bonds and bank debt, CP
> Other financial liabilities
> Hybrid adjustments
Net financial assets (incl. hybrid adjustments)
Long-term liabilities
> Nuclear provisions
> Mining provisions
> Pension provisions
Total net debt
8.7
1.7
7.0
2.5
1.6
1.0
-0.1
6.1
10.6
6.0
2.3
2.3
4.5
> Net financial asset position
> Majority of debt characterised by long-term provisions
> Financial position commensurate with RWE’s target to maintain investment grade ratings
> Upside potential from rising interest rates (+10 bps change in real discount rates): Pension provisions: c. -€0.1 billion Nuclear provisions: c. -€50 million Mining provisions: c. -€70 million
> Outstanding hybrid capital of €2.0 billion, of which €0.9 billion classified as equity and €1.1 billion classified as debt under IFRS
> Financial holdings (innogy, Amprion, Urenco) not included in net debt
1 Rounding differences may occur.

RWE AG | Company Presentation | August 2018
Financial highlights H1 2018
Page 25
RWE AG | Company Presentation | August 2018
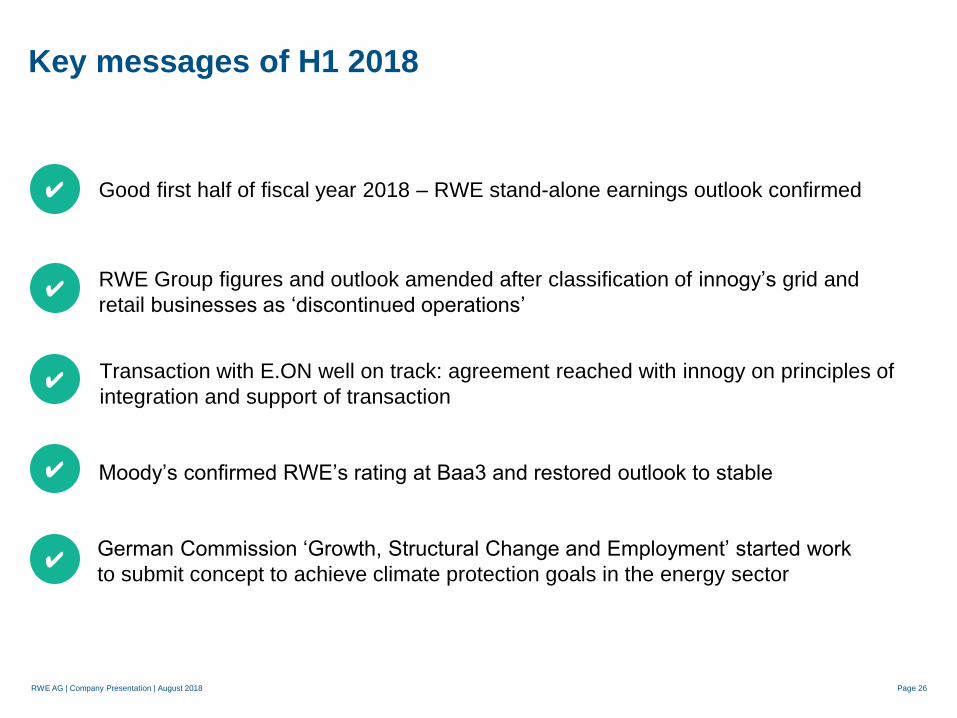
Key messages of H1 2018
Page 26
RWE Group figures and outlook amended after classification of innogy’s grid and
retail businesses as ‘discontinued operations’
Good first half of fiscal year 2018 – RWE stand-alone earnings outlook confirmed
Transaction with E.ON well on track: agreement reached with innogy on principles of
integration and support of transaction
Moody’s confirmed RWE’s rating at Baa3 and restored outlook to stable
✔
✔
✔
✔
✔
German Commission ‘Growth, Structural Change and Employment’ started work
to submit concept to achieve climate protection goals in the energy sector

RWE AG | Company Presentation | August 2018 Page 27
Lower adjusted EBITDA mainly due to declining generation margins in conventional power generation
RWE stand-alone
H1 2017
innogy
Supply & Trading
Other,
consolidation
1,438
-8
1,140
-234
-30
H1 2018
Lignite & Nuclear
European Power -26
-
Group
1,130
-26
-234
-30
-181
+3
825
(€ million)
> Lignite & Nuclear: Declining generation margins
and lower volumes
> European Power: Declining generation margins
offset by income from UK capacity market and
operating cost improvements
> Supply & Trading: slightly below very strong
H1 2017
> innogy as part of RWE stand-alone:
dividend inflow of €683 million in Q2 2018
Same amount as in Q2 2017
1 innogy-continuing operations.

RWE AG | Company Presentation | August 2018 Page 28
Outright
(Lignite
&
Nuclear)
Spread
(Euro-
pean
Power)
2018E 2020E
2018E 2019E 2020E
Open position Hedged position (%)
85 – 90 TWh
50 – 70 TWh2
>90% >10%
80 – 85 TWh ~80 TWh
Expected positions and hedge status as of 30 June 2018
Fully hedged position Average hedge price (€/MWh) Implicit fuel hedge Open position
~28 ~28 ~29
>90% >90% >90%
Change to reported average
hedge price as of 31 March 2018
2019E
>80%
2021E
>40%
2021E
<10%
CO2 > CO2 position financially hedged until end of 2022
Average hedge price 2018 – 2021 corresponds with average hedged CO2 price in the range of ~€5 – 6/t1
1 Equivalent to emission costs of ~€6 – 7/MWh for lignite generation. 2 Total in-the-money spread.
~80 TWh
~29
50 – 70 TWh2 50 – 70 TWh2 50 – 70 TWh2
Hedging – stable average hedge prices

RWE AG | Company Presentation | August 2018 Page 29
Recovery of fuel spreads at the end of Q2 2018 after strong decline since end of 2017
1 Fuel spread defined as: Power price – (pass-through-factor carbon × EUA price + pass-through-factor coal × coal price + pass-through-factor gas × gas price).
Note: Shown figures based on fuel spreads per end of month (€/MWh).
Source: Bloomberg; data until 30 June 2018.
Development of German fuel spreads1
-4
-2
0
2
4
6
8
35 34 33 32 31 30 29 28 27 26 25 24 23 22 21 20 19 18 17 16 15 14 13 12 11 10 9 8 7 6 5 4 3 2 1
€/M
Wh
Months to Delivery
Cal17 Cal18 Cal19 Cal20 Cal21
RWE AG | Company Presentation | August 2018 Page 30
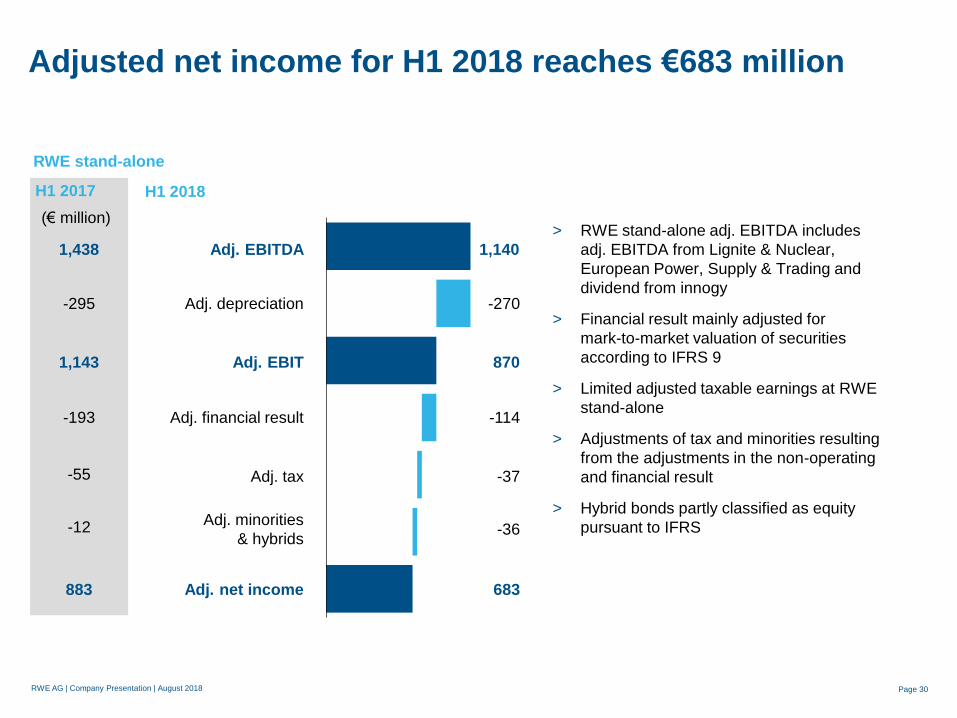
Adjusted net income for H1 2018 reaches €683 million
870
-270
-114
-37
683
-36
Adj. financial result
Adj. depreciation
Adj. tax
Adj. EBIT
Adj. net income
Adj. minorities
& hybrids
1,143
-295
-193
-55
-12
883
(€ million) > RWE stand-alone adj. EBITDA includes
adj. EBITDA from Lignite & Nuclear,
European Power, Supply & Trading and
dividend from innogy
> Financial result mainly adjusted for
mark-to-market valuation of securities
according to IFRS 9
> Limited adjusted taxable earnings at RWE
stand-alone
> Adjustments of tax and minorities resulting
from the adjustments in the non-operating
and financial result
> Hybrid bonds partly classified as equity
pursuant to IFRS
H1 2018 H1 2017
1,140 Adj. EBITDA 1,438
RWE stand-alone

RWE AG | Company Presentation | August 2018 Page 31
High H1 2018 distributable cash flow due to full amount of innogy dividend and cyclical working capital development
1,140
376
-590
-174
534
-18
829
Change in operating
working capital
Adj. EBITDA
Change in provisions &
other non-cash items
Cash interests/taxes
Cash contribution
Capex
Distributable
cash flow (DiCF)
Minorities + hybrids
H1 2018 H1 2017
1,438
552
-748
205
-49
-72
636
(€ million)
-138
-63
> innogy dividend of €683 million (FY 2017:
€683 million) fully reflected in adj. EBITDA
> Changes in provisions: Utilisation of CO2
provisions completed, whereas additions only
halfway
> Change in operating working capital:
– Typical seasonal pattern from reduction in
trade accounts payable and inventories
– 2017 was negatively affected by
phase-out of working capital optimisation
measures
> Improvement in cash interests after redemption
and buy back of hybrids in 2017
RWE stand-alone
RWE AG | Company Presentation | August 2018 Page 32
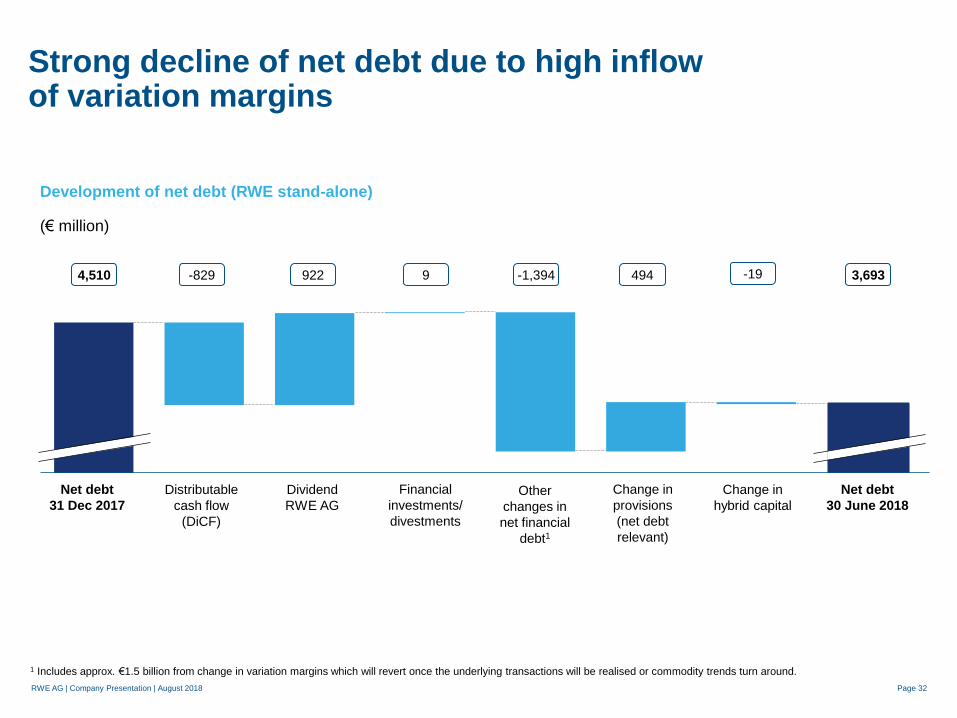
Strong decline of net debt due to high inflow of variation margins
Net debt
31 Dec 2017
Net debt
30 June 2018
-829 4,510 9 -1,394 3,693 922 -19 494
Change in
hybrid capital Distributable
cash flow
(DiCF)
Other
changes in
net financial
debt1
Dividend
RWE AG
(€ million)
Development of net debt (RWE stand-alone)
Financial
investments/
divestments
Change in
provisions
(net debt
relevant)
1 Includes approx. €1.5 billion from change in variation margins which will revert once the underlying transactions will be realised or commodity trends turn around.
RWE AG | Company Presentation | August 2018 Page 33
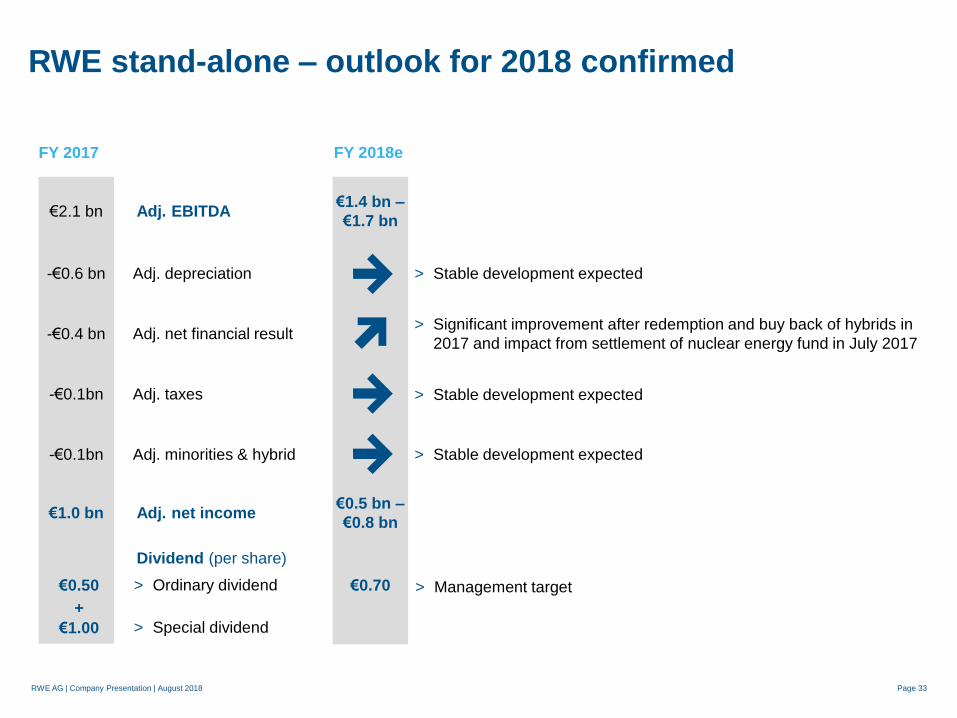
RWE stand-alone – outlook for 2018 confirmed
> Stable development expected Adj. depreciation
Adj. taxes
Adj. EBITDA
Adj. net income
> Significant improvement after redemption and buy back of hybrids in
2017 and impact from settlement of nuclear energy fund in July 2017 Adj. net financial result
> Stable development expected Adj. minorities & hybrid
FY 2017 FY 2018e
-€0.6 bn
-€0.1bn
€2.1 bn
€1.0 bn
-€0.4 bn
-€0.1bn
€1.4 bn –
€1.7 bn
€0.5 bn –
€0.8 bn
Dividend (per share)
€0.70
> Special dividend
€0.50
€1.00
+
> Ordinary dividend > Management target
> Stable development expected
RWE AG | Company Presentation | August 2018
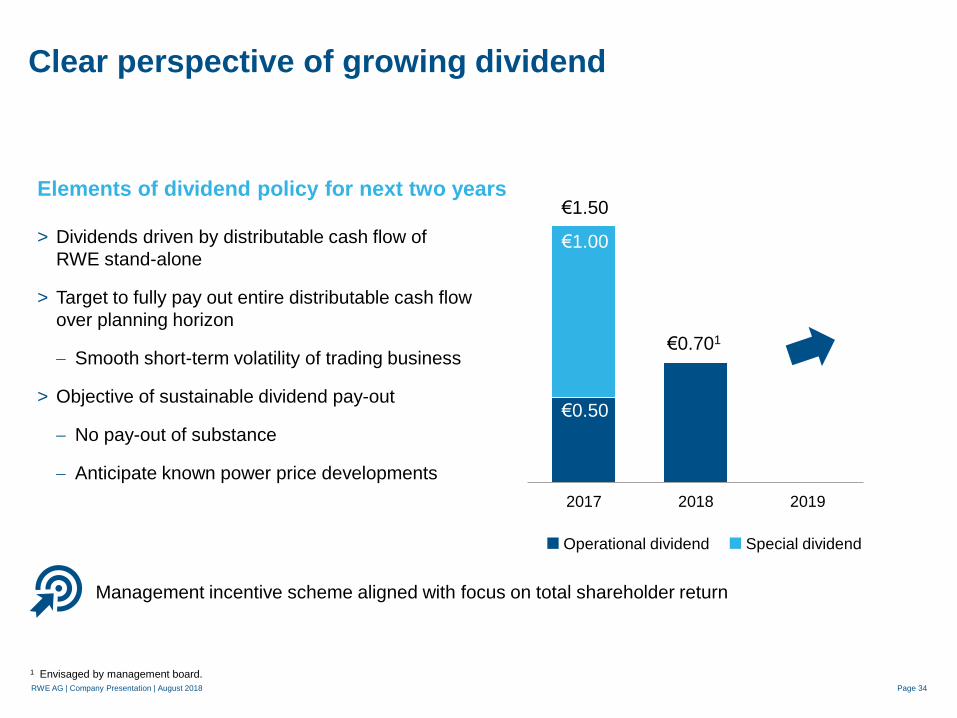
Clear perspective of growing dividend
> Dividends driven by distributable cash flow of
RWE stand-alone
> Target to fully pay out entire distributable cash flow
over planning horizon
Smooth short-term volatility of trading business
> Objective of sustainable dividend pay-out
No pay-out of substance
Anticipate known power price developments
1 Envisaged by management board.
Elements of dividend policy for next two years
2017 2018 2019
€1.00
€0.701
€0.50
€1.50
Special dividend Operational dividend
Page 34
Management incentive scheme aligned with focus on total shareholder return

Appendix
Page 35
RWE AG | Company Presentation | August 2018
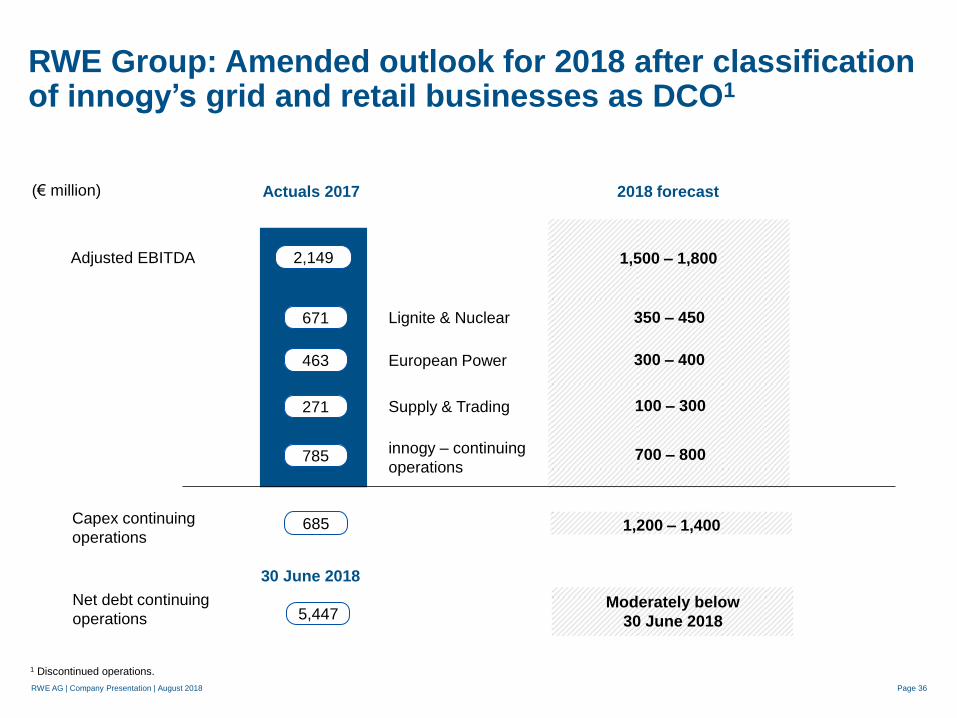
RWE Group: Amended outlook for 2018 after classification of innogy’s grid and retail businesses as DCO1
Actuals 2017 2018 forecast
2,149
Lignite & Nuclear
European Power
Supply & Trading
671
463
271
Adjusted EBITDA 1,500 – 1,800
(€ million)
innogy – continuing
operations 785
350 – 450
300 – 400
100 – 300
700 – 800
Capex continuing
operations
Net debt continuing
operations
685 1,200 – 1,400
5,447
30 June 2018
Moderately below
30 June 2018
Page 36
1 Discontinued operations.
RWE AG | Company Presentation | August 2018
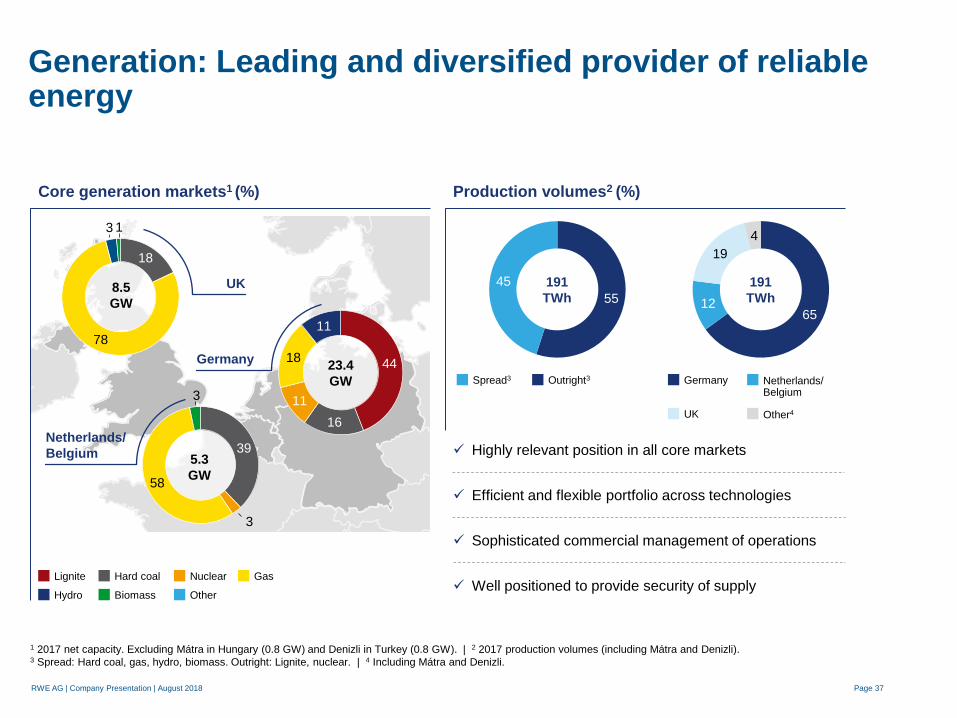
Generation: Leading and diversified provider of reliable energy
Page 37
8.5
GW
23.4
GW
5.3
GW
Core generation markets1 (%) Production volumes2 (%)
1 2017 net capacity. Excluding Mátra in Hungary (0.8 GW) and Denizli in Turkey (0.8 GW). | 2 2017 production volumes (including Mátra and Denizli). 3 Spread: Hard coal, gas, hydro, biomass. Outright: Lignite, nuclear. | 4 Including Mátra and Denizli.
44
16
11
18
11
39
3
58
3
Netherlands/
Belgium
UK
Germany
55
45
65 12
19
4
191
TWh
191
TWh
Lignite Hard coal Nuclear Gas
Hydro Biomass Other
Spread3 Outright3 Germany Netherlands/ Belgium
UK Other4
Highly relevant position in all core markets
Efficient and flexible portfolio across technologies
Sophisticated commercial management of operations
Well positioned to provide security of supply
18
78
3 1

RWE AG | Company Presentation | August 2018
Commercial Asset Optimisation: High value contribution from all activities
Page 38
~15%
~5%
~35%
~40%
~5%
Commercial Asset Optimisation (CAO) value contribution
Option management
> Re-optimisation of power
station option
> Shape management
> Trading around hedge positions
Short-term optimisation
> Short-term trading
> Balancing markets
> Dispatch/intra-day trading
Deviation from Reference Hedge Path
> Within defined limits
> Based on fundamental market views
Fuel procurement & logistics
> Physical procurement of fuel
and substitutes
> Commercialisation of by-products
Reserve & ancillary services
> Reserve, voltage support/
reactive power
> Frequency response, black start
€2 – €3
per MWh1
1 On top of realised forward hedges as per Reference Hedge Path. Reported within results of Lignite & Nuclear and European Power.

RWE AG | Company Presentation | August 2018
Supply & Trading: Important earnings contributor to RWE results
Page 39
Trading 60%
Supply 40%
Trading
Supply
247
346
269
-146
271
2013 2014 2015 2016 2017
Adj.
EBITDA
excl. non-
recurring
items3
Non-
recurring
items3
594 -60 -105 6 --
(€ m)
EBITDA development and gross margin split Business segments
Trading
> Physical and financial products
on screen in liquid markets
> Negotiated contracts (Origination)
Principal Investments
> Private equity style investment
in energy assets
Gas & LNG
> Management of gas supply and
infrastructure contracts
Commodity Solutions
> B2B business for large industrial
customers and municipalities
Gross margin
~50%
Average
return and
margin
split1
Return on risk capital2
1 5 year average. | 2 Adj. EBITDA (excluding non-recurring items) / risk capital employed; includes risk capital for Trading and Origination, invested capital for Principal
Investments, Gas & LNG and Commodity Solutions. | 3 Non-recurring items: predominantly legacy gas midstream contracts.

RWE AG | Company Presentation | August 2018
RWE stand-alone figures relevant for cash and value management
Page 40
Lignite & Nuclear
Supply & Trading
innogy
European Power
Lignite & Nuclear
Supply & Trading
European Power
Consolidated net debt
innogy stake and dividends
Provisions
Operating
business
Financial
portfolio
Adj. EBITDA
Net debt
Adj. EBITDA
Net debt
innogy stake1
RWE Group RWE stand-alone
1 Market value as of 31 December 2017.
Key financials 2017
€5.8 bn
€20.2 bn
€2.1 bn
€4.5 bn
€14.0 bn
RWE AG | Company Presentation | August 2018
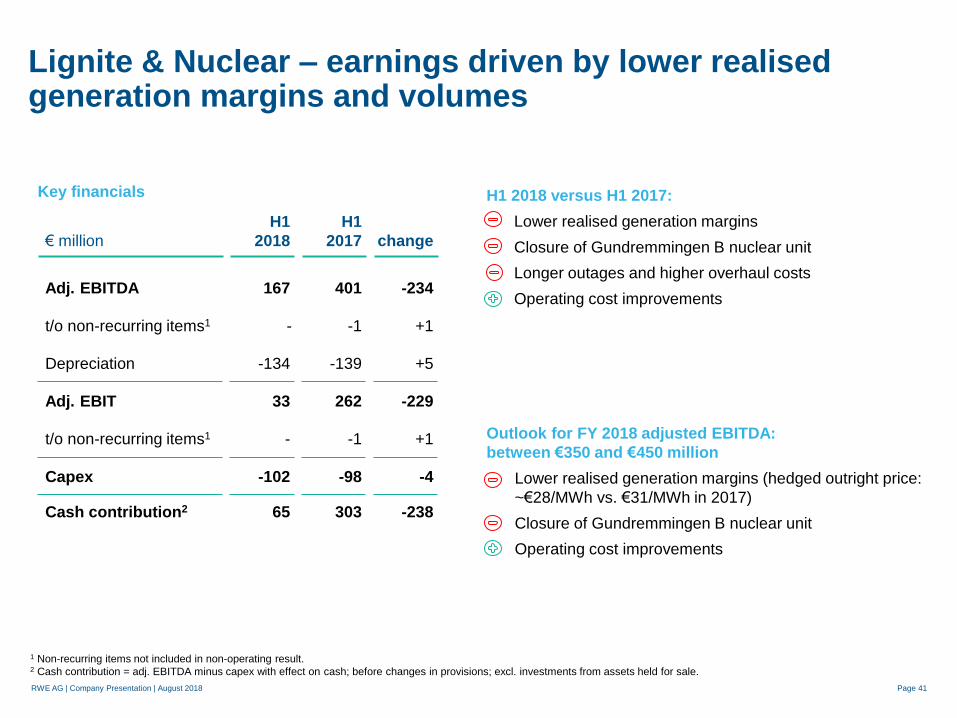
Lignite & Nuclear – earnings driven by lower realised generation margins and volumes
Page 41
1 Non-recurring items not included in non-operating result. 2 Cash contribution = adj. EBITDA minus capex with effect on cash; before changes in provisions; excl. investments from assets held for sale.
Key financials
Adj. EBITDA
t/o non-recurring items1
Depreciation
Adj. EBIT
t/o non-recurring items1
Capex
Cash contribution2
167
-134
33
-
-102
65
401
-1
-139
262
-1
-98
303
-234
+1
+5
-229
+1
-4
-238
Outlook for FY 2018 adjusted EBITDA:
between €350 and €450 million
Lower realised generation margins (hedged outright price:
~€28/MWh vs. €31/MWh in 2017)
Closure of Gundremmingen B nuclear unit
Operating cost improvements
€ million
H1
2018
H1
2017 change
H1 2018 versus H1 2017:
Lower realised generation margins
Closure of Gundremmingen B nuclear unit
Longer outages and higher overhaul costs
Operating cost improvements
-
RWE AG | Company Presentation | August 2018
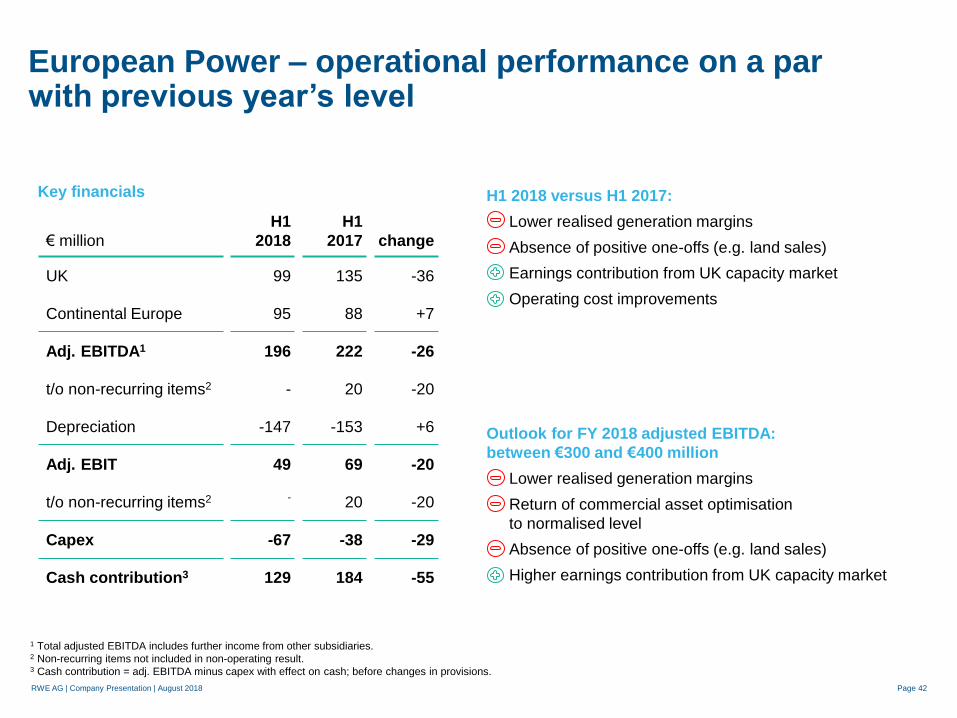
European Power – operational performance on a par with previous year’s level
Page 42
Outlook for FY 2018 adjusted EBITDA:
between €300 and €400 million
Lower realised generation margins
Return of commercial asset optimisation
to normalised level
Absence of positive one-offs (e.g. land sales)
Higher earnings contribution from UK capacity market
Key financials H1 2018 versus H1 2017:
Lower realised generation margins
Absence of positive one-offs (e.g. land sales)
Earnings contribution from UK capacity market
Operating cost improvements
€ million
UK
Continental Europe
Adj. EBITDA1
t/o non-recurring items2
Depreciation
Adj. EBIT
t/o non-recurring items2
Capex
Cash contribution3
H1
2018
99
95
196
-
-147
49
-
-67
129
H1
2017
135
88
222
20
-153
69
20
-38
184
change
-36
+7
-26
-20
+6
-20
-20
-29
-55
1 Total adjusted EBITDA includes further income from other subsidiaries.
2 Non-recurring items not included in non-operating result. 3 Cash contribution = adj. EBITDA minus capex with effect on cash; before changes in provisions.

RWE AG | Company Presentation | August 2018
Supply & Trading – Strong performance in Q2 2018
Page 43
Outlook for FY 2018 adjusted EBITDA:
between €100 and €300 million
> Expected longer-term average earnings contribution of
approx. €200 million
Key financials
Adj. EBITDA
t/o non-recurring items1
Depreciation
Adj. EBIT
t/o non-recurring items1
Capex
Cash contribution2
101
-
-2
99
-
-4
97
131
-
-2
129
-
-1
130
-30
-
-
-30
-
-3
-33
€ million
H1
2018
H1
2017 change
H1 2018 versus H1 2017:
Very good trading performance in Q2 2018
Good performance of gas and LNG business; however,
earnings contribution below high previous year’s result
Value adjustment within Principal Investment portfolio
1 Non-recurring items not included in non-operating result. 2 Cash contribution = adj. EBITDA minus capex with effect on cash; before changes in provisions.

RWE AG | Company Presentation | August 2018
Power prices and commodities
Coal prices – API2 Cal-ahead Gas prices – TTF Cal-ahead
$/t
Carbon prices - EU ETS
€/MWh €/t
Base load power prices – Germany, NL (1 year forward)
€/MWh
UK
Germany
NL
Base load power prices – UK (1 year forward)
€/MWh
2
6
10
14
18
Aug'16 Aug'17 Aug'1812
14
16
18
20
22
Aug'16 Aug'17 Aug'18
30
40
50
60
70
80
90
100
Aug'16 Aug'17 Aug'18
40
50
60
70
80
Aug'16 Feb'17 Aug'17 Feb'18 Aug'18
0
20
40
60
Aug'16 Feb'17 Aug'17 Feb'18 Aug'18
Source: Bloomberg – Data through to 6 of August 2018. Page 44
RWE AG | Company Presentation | August 2018
-5
0
5
10
15
-5
0
5
10
15
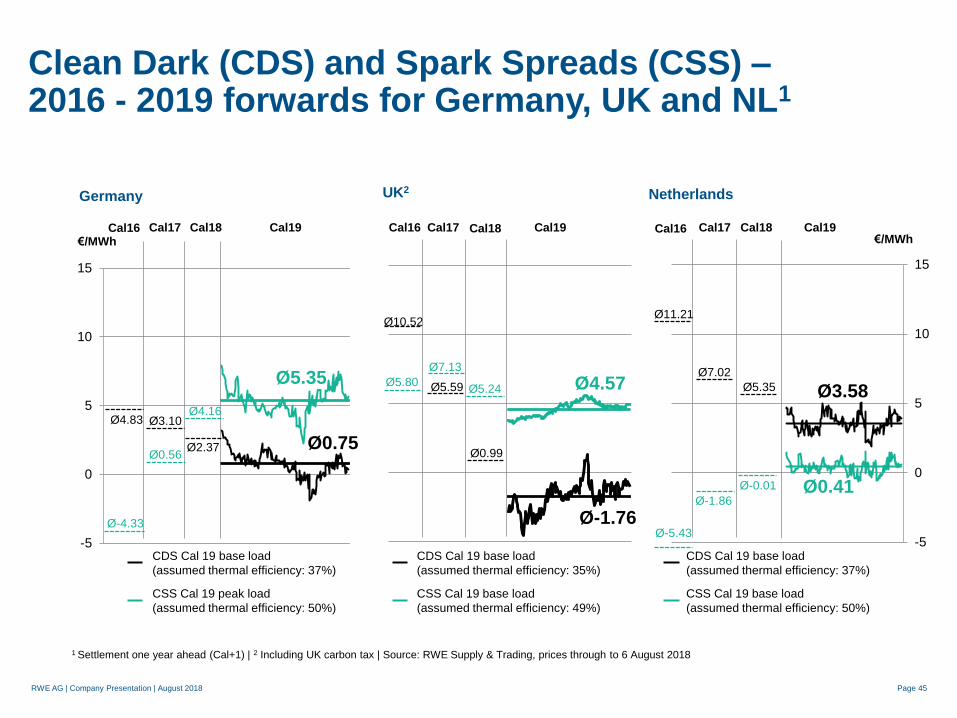
Clean Dark (CDS) and Spark Spreads (CSS) – 2016 - 2019 forwards for Germany, UK and NL1
1 Settlement one year ahead (Cal+1) | 2 Including UK carbon tax | Source: RWE Supply & Trading, prices through to 6 August 2018
CDS Cal 19 base load
(assumed thermal efficiency: 37%)
CSS Cal 19 peak load
(assumed thermal efficiency: 50%)
CDS Cal 19 base load
(assumed thermal efficiency: 35%)
CSS Cal 19 base load
(assumed thermal efficiency: 49%)
CDS Cal 19 base load
(assumed thermal efficiency: 37%)
CSS Cal 19 base load
(assumed thermal efficiency: 50%)
€/MWh €/MWh Cal17 Cal19 Cal18 Cal16 Cal19 Cal17 Cal17 Cal19 Cal18
Ø0.75
Ø4.57
Ø-1.76
Ø10.52
Ø5.80
Ø0.41
Ø3.58
Ø-5.43
Ø11.21
Ø7.13
Ø5.59
Ø7.02
Ø-1.86
Germany UK2 Netherlands
Cal16 Cal18 Cal16
Ø5.35
Ø0.99
Ø5.24 Ø5.35
Ø-0.01
Ø3.10 Ø4.83
Ø-4.33
Ø0.56
Ø4.16
Ø2.37
Page 45
RWE AG | Company Presentation | August 2018
Your contacts @RWE Investor Relations
Page 46
Financial Calendar Important Links
Annual and Interim Reports & Statements
http://www.rwe.com/ir/reports
Investor and Analyst Conferences
http://www.rwe.com/ir/investor-and-analyst-conferences
IR presentations & further factbooks
http://www.rwe.com/ir/presentations
IR videos
http://www.rwe.com/ir/videos
Consensus of analysts’ estimates
http://www.rwe.com/ir/consensus-estimates
3 May 2019
Annual General Meeting
15 May 2019
Interim statement on the first quarter of 2019
14 March 2019
Annual report 2018
14 August 2018
Interim report on the first half of 2018
14 November 2018
Interim statement on the first three quarters of 2018
Contacts for Institutional Investors & Financial Analysts Contact for Private Shareholders
Gunhild Grieve
Head of Investor Relations
Tel. +49 201 5179-3110
Martin Vahlbrock
Tel.: +49 201 5179-3117
Dr. Burkhard Pahnke
Tel.: +49 201 5179-3118
Lenka Zikmundova
Tel.: +49 201 5179-3116
Jérôme Hördemann
Tel.: +49 201 5179-3119
Susanne Lange
Tel.: +49 201 5179-3120
Sabine Gathmann
Tel.: +49 201 5179-3115