rvk summary report: the north dakota land board … rvk investment... · the north dakota land...
TRANSCRIPT

RVK Chicago Office 30 North LaSalle Street Suite 3900 Chicago, Illinois 60602 www.rvkuhns.com
RVK Summary Report:
The North Dakota Land Board
Strategic Asset Allocation and
Implementation Project September 2, 2015

Table of Contents
Page
Executive Summary ................................................................................................2
Section I: Implementation Structures ......................................................................6
Section II: Asset Allocation and Subsequent Portfolio Structure ..............................9
Exhibit A: Investment Policy Statement ..................................................................19
Appendix: PTF Asset Allocation Modeling Results .................................................45
1

www.rvkuhns.com
Executive Summary
2

rvkuhns.com
Click here to enter text. Click here to enter text.
Click here to enter text.
Executive Summary RVK, Inc. (formerly R.V. Kuhns & Associates, or “RVK”) was selected by The North Dakota Board of University and School Lands (Board) in March 2013 to provide strategic investment consulting advice focused on asset allocation, investment policy development, and implementation options for the Permanent Trust Funds (“PTFs”) and Strategic Investment and Improvements Fund (“SIIF”). Over the course of the following seven months, RVK worked closely with Staff and the Board to define the objectives and policy guidelines under the long-term strategic investment plan for the North Dakota Board of University and School Lands as stated in the original request for proposal. This initial project included the following tasks, numbered one through four. The main conclusions from each task are outlined below: 1. A recommendation of an asset allocation for the Permanent Trust Funds that balances the
Board's dual responsibilities under North Dakota law, and also recognizes the Board's risk tolerance and current market conditions.
The Board approved the following asset allocation for the PTFs:
Throughout the course of the project, several asset allocation scenarios and their associated risks were provided to assist the Board in making decisions concerning the investment of the assets of the PTFs. The Board reviewed asset allocation models that projected the financial condition of the PTFs, and the effect on distributions under various economic and market conditions. All scenarios were developed recognizing the Board's responsibility to follow the Prudent Investor Rule.
2. Recommendations for a complete update of the Board's investment policies and procedures
for the PTFs that will help ensure that the Board meets its long-term goals and objectives for the PTFs.
3

The Investment Policy Statement was redrafted to reflect the decisions made by the Board, input received from Staff, and to incorporate best practices for investment policy construction. As drafted, the new Investment Policy Statement provides an investment management framework for North Dakota’s Permanent Trust Funds, the Capitol Building Fund, the Strategic Investment and Improvements Fund, the Coal Development Trust Fund, and the Indian Cultural Education Trust (collectively, Funds). While the Investment Policy Statement is crafted to cover all funds under the care of the Board, there are customized pages to address the specific goals and objectives of each individual fund. (See Exhibit A: Investment Policy Statement).
3. An analysis and recommendation as to the most appropriate way to transition from the
Board’s current asset allocation and policies to the investment plan recommended by the consultant. The analysis and recommendation should include a timetable for implementing any recommendations, the resources and staffing needed to implement, an analysis and discussion of possible options for implementing, and the projected cost of implementing, managing and monitoring the program going forward.
The scope of the asset allocation and implementation project included a timetable for implementing recommendations, as well as the required resources and staffing. RVK also provided an analysis and discussion of possible options for implementing, and the projected cost of implementing, managing, and monitoring the program going forward. RVK discussed various implementation options with the Board, offering both short-term solutions to implement the updated asset allocation, as well as long-term solutions to manage and monitor the portfolios going forward. RVK was selected to work with Staff and the Board to aide in the transition from the current asset allocation and policies to the updated asset allocation. 4. A recommendation for establishing specific goals, objectives and investment policies for the
SIIF. Such recommendations should take into consideration the differences between the nature and the investment timeframe of the SIIF as compared to the PTFs, including liquidity and expendability.
Based on an analysis of the cash flow needs of the Strategic Investment and Improvement Fund, the Board determined that the SIIF should continue to invest fully in cash and cash-like instruments. The recommendations took into consideration the differences between the objective and the investment timeframe of the SIIF as compared to the PTFs. The unique objectives and asset allocation for the SIIF are reflected in specific pages of the Investment Policy Statement. (See Exhibit A). At the conclusion of the initial project, RVK was retained by the Board beginning in January 2014 to support the portfolio restructuring that resulted from the initial project. This subsequent project entailed the following:
1. Investment Manager Searches and Portfolio Restructuring Together with Staff and the Board, review the optimal active/passive mix for each of the PTFs asset classes, including asset classes currently being utilized, and recommend appropriate passive products as needed. As a part of the structure studies completed for each asset class,
4

current managers were analyzed and manager searches were conducted as required to transition of the PTF assets to the Asset Allocation Targets approved by the Board in November 2013. Staff and RVK met with the Board in person to present each of the searches and each of the manager recommendations. RVK assisted Staff in coordinating transaction documents for the funding of new managers and throughout the transition process. In addition to the search work for the PTFs, together with Staff, RVK reviewed the Strategic Investment and Improvement Fund (SIIF) portfolio guidelines and recommended short-term fixed income or cash equivalent manager candidates and vehicles as deemed appropriate.
2. Performance Reporting During the restructure process, RVK provided Staff and the Board interim status reports that included an asset allocation and an investment performance summary. Upon completion of the transition process, RVK provided comprehensive quarterly performance reports to monitor performance of the PTFs, asset class composites, and investment managers. As of the date of this report, all manager searches have been completed. Assets are still in the process of being transitioned to core and core plus real estate managers since funding is subject to timing of manager capital calls. The PTFs, therefore, are currently invested in accordance with its interim asset allocation targets. The information presented in this report focuses on the long-term strategic asset allocation approved by the Board in November 2013. The remainder of this document is divided into the following sections: Section I: Implementation Structures – Summarizes the discussions in which the Board explored various implementation options for the PTFs and SIIF, including the perceived alignment of each implementation option with the preferences, goals, and objectives of the Board. Through ongoing dialogue, the Board decided to implement the updated asset allocation targets with the assistance of Staff and an Investment Consultant. Section II: Asset Allocation and Subsequent Portfolio Structure – Provides a summary of the many asset allocation discussions for the PTFs and SIIF. This includes education on asset classes under consideration by the Board and a summary of the asset allocation modeling results. The full scope of modeling results including the projected cash flows of the PTFs as a result of investment returns, and other inflows and outflows of the portfolio are included in the appendix of the report (See Appendix: PTF Asset Allocation Modeling Results). This section also presents the resulting structure, both in terms of sub asset class allocation and investment manager decisions for each asset class. While the discussions around each asset class were robust, the summary focuses on the outcomes and analysis. Exhibit A: Investment Policy Statement Appendix: PTF Asset Allocation Modeling Results
5

www.rvkuhns.com
Section I: Implementation Structures
6

Section I: Implementation Structures Key Objectives Review fiduciary duties, as well as roles and responsibilities. Evaluate a range of implementation options and narrow down the options to be considered. Approve a specific near-term plan to implement the asset allocation. Prepare an Investment Policy Statement for the PTFs and SIIF. Develop a long-term implementation plan. The initial discussion with the Board regarding implementation included a review of the following topics:
o Level of input that will be necessary from the Board o Prudent Investor Rule o Fiduciary Responsibility o Examples of governing structures
The Board agreed that members would provide input to RVK on preferences for risk, return, and allowable asset classes. The Board also agreed to provide feedback on proposed asset allocation targets, and to discuss the various frameworks for a long-term implementation structure. With a focused appreciation of the fiduciary duty of Board members, RVK and the Board began discussing the various structures for implementing the investment program once the asset allocation and policy development process was completed. The advantages and disadvantages of the following investment decision making options were reviewed:
o Direct decision making by the Board o Delegation to an Advisory Investment Committee o Delegation to the North Dakota State Investment Board (SIB) o Delegation to Staff with assistance from an Investment Consultant o Delegation to an Outsourced Chief Investment Officer (OCIO)
While RVK initially outlined five possible options, after further discussions with the Board, it was determined that two of the options may be difficult to execute on an ongoing basis. The Board-only option would require a significant time commitment and some means to access specific skill sets required for effective implementation. The OCIO model did not appear to be a good fit for the specific needs and structure of the PTFs and SIIF. The Board with the assistance of RVK reviewed the three remaining selected options for further consideration:
o Delegation to an Advisory Investment Committee o Delegation to the North Dakota State Investment Board o Delegation to Staff with assistance from an Investment Consultant
Due to the logistical and regulatory challenges of forming an Advisory Investment Committee separate from the Board, the Board decided not to pursue this option. Instead the Board agreed
7
to focus on the options of utilizing the SIB for implementation, or delegating implementation to Staff with the assistance of an Investment Consultant. RVK offered to meet with each Board member to answer any questions on implementation strategies prior to the next meeting. Open meeting rules were followed during such meetings. Upon the conclusion of these follow-up discussions, RVK reviewed two implementation options in detail, followed by a specific recommendation. The two remaining viable options as well as the resulting recommendation are further explained below. Option 1: Delegation to the SIB: The option of working with the SIB in some capacity has merit where combined resources could be used efficiently by various entities within the state. However, there were potential issues with the SIB options if used in a fully outsourced scenario, namely:
o Some of the asset classes currently approved by the Board are not available through the SIB. For example, the Board has historically embraced passive management for the more efficient asset classes.
o SIB has had recent changes in Staff, including the appointment of a new CIO. It will take time for new SIB Staff members to fully familiarize themselves with the existing responsibilities and mandates of the SIB.
o Board members expressed governance concerns as the Board maintains the ultimate responsibility and liability for the prudent investment of the PTFs and SIIF.
Option 2: Delegation to Staff: The Board expressed interest in this option as a near-term solution to implement the asset allocation approved by the Board in November 2013. However, delegation to Staff could pose some long-term challenges, such as:
o Current levels of staffing may not be sufficient to support all required functions to implement and monitor the investment program.
o The Board would prefer not to have significant duplication of efforts with the SIB, but would like to take advantage of the scale and “buying power” of the combined entities wherever possible.
Recommendation: To mitigate the above challenges, the Board decided to engage an Investment Consultant to assist the Board and Staff in implementation and monitoring. Since the asset allocation was approved (Section II), RVK recommended that the Board move to implement the approved PTFs target allocation as soon as feasible. RVK recommended this be accomplished through Staff, with the assistance of an Investment Consultant. The Board concluded that implementation by Staff with assistance from an Investment Consultant was the implementation option that best met the investment requirements that had been designated to the Board by statute.
8

www.rvkuhns.com
Section II: Asset Allocation and
Subsequent Portfolio Structure
9

Section II: Asset Allocation and Subsequent Portfolio Structure
Key Objectives
Review risk/return analysis based on the current asset allocation and cash flows of each PTF and the SIIF.
Receive educational training on a range of asset classes including equity, fixed income, and alternatives.
Decide on asset classes to be considered in strategic asset allocation modeling.
Identify a tentative target portfolio and review risk/return statistics.
Approve a strategic asset allocation for the PTFs and SIIF.
RVK provided a detailed outline of the process they recommended to develop a strategic asset allocation and investment policy for the PTFs and the SIIF. Initially, The Board, Staff and RVK reviewed the specific goals, risk tolerance, liquidity needs, and appropriate investment vehicles for the portfolios.
The Board provided insight into the purpose of the PTF distributions. The Board noted that, while there are 13 PTFs, the largest component is the Common Trust School Fund. In this regard, both RVK and the Board noted that the investment needs of the Common School Trust Fund and the other PTFs were quite different than the pension assets managed by the SIB. Historically, the PTFs’ assets had been managed conservatively, with an emphasis on the ‘trust fund’ aspect of the PTFs and with a yield/income orientation. The formal shift from an income orientation to a total return orientation was fairly recent in the history of the PTFs. In addition, the assets of the PTFs had grown significantly, and the distributions from PTF assets also had increased significantly (in line with the spending policy for the PTFs).
The Board explained the SIIF and clarified the sources and uses of it. While the SIIF assets had grown, the Board noted that SIIF assets have no permanent balance, or corpus, that could be invested with a long-term time horizon. After this initial discussion, RVK obtained several additional pieces of information from Staff, including:
o Governing regulatory language for the SIIF and PTFs o Current Investment Policy Statement (IPS) for the SIIF and PTFs o Current custodial information for the SIIF and PTFs o Historical and projected cash flow data for the SIIF and PTFs o Detailed input for each source of inflow and outflow in the PTFs projected cash flow
spreadsheet
10

Subsequently, RVK provided an introduction to asset allocation modeling, highlighting the benefits of portfolio diversification in reducing risk and increasing expected return. In order to determine the opportunity set of asset classes to include in the asset allocation model, RVK provided asset class education and review with the goal of receiving input from the Board. The discussion of each asset class was designed with two objectives:
o Provide ample education on the asset class for the Board to evaluate the asset class; o Make a preliminary decision on whether or not the asset class may be a suitable
investment for the PTFs and the SIIF.
PTFs Asset Allocation The Board approved the following asset classes/sub asset classes for inclusion in the PTFs:
o Broad US Equity: Large Cap and Small Cap o Broad International Equity: Developed and Emerging Market o Fixed Income: Investment Grade, Global Fixed Income, High Yield, Low Duration, and
direct Loans o Real Estate: Core and Core Plus Real Estate o Absolute Return: Global Tactical Asset Allocation (GTAA) o Diversified Inflation Strategies: MLPs, Commodities, Natural Resource Equities, and
TIPs
The Board did not approve further consideration for Hedge Funds or Private Equity for the initial implementation phase. RVK discussed investments that may provide some of the positive investment aspects of Hedge Funds and Private Equity without some of the factors that concerned the Board, such as illiquidity, high fees, and lack of transparency. This Board concluded that GTAA or Liquid Multi-Asset managers should be considered as viable options for Absolute Return. For the following discussion, the Board requested additional information and examples of managers for the new asset classes that were proposed for inclusion in the asset allocation. These asset classes include Real Estate (Core and Value Added), GTAA/Liquid Multi-Asset, and Diversified Inflation Strategies. RVK proposed specific asset class targets consistent with the objectives and preferences previously stated by the Board. In the analysis, projected cash flows were included into the modeling and considered over varying time periods. Specific analysis output is included in the Appendix. (See Appendix: Asset Allocation Modeling Results). The Board provided confirmation of the following proposed asset allocation targets which considered all Board and Staff input to-date:
11
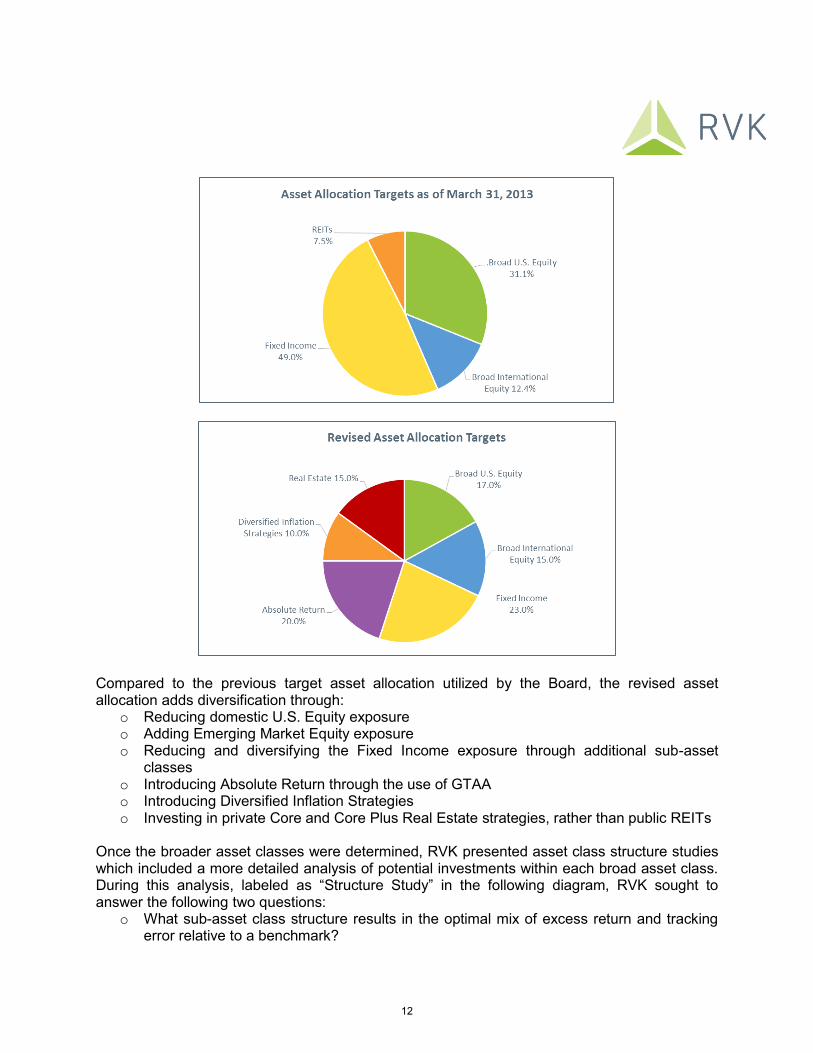
Compared to the previous target asset allocation utilized by the Board, the revised asset allocation adds diversification through:
o Reducing domestic U.S. Equity exposure o Adding Emerging Market Equity exposure o Reducing and diversifying the Fixed Income exposure through additional sub-asset
classes o Introducing Absolute Return through the use of GTAA o Introducing Diversified Inflation Strategies o Investing in private Core and Core Plus Real Estate strategies, rather than public REITs
Once the broader asset classes were determined, RVK presented asset class structure studies which included a more detailed analysis of potential investments within each broad asset class. During this analysis, labeled as “Structure Study” in the following diagram, RVK sought to answer the following two questions:
o What sub-asset class structure results in the optimal mix of excess return and tracking error relative to a benchmark?
12

o What is the optimal mix of active and passive strategies as well as the number of investments to utilize?
Click here to enter text. As depicted in the above diagram, once the structure of each asset class was determined, the focus shifted to identifying specific managers to include in each asset class. For each asset class, Staff, the Board, and RVK analyzed current portfolio holdings, as well as conducted searches for new managers. Staff and RVK conducted in depth interviews with numerous candidates for each asset class, and presented finalist recommendations for the Board to interview. The following sections address the conclusions of sub asset class structure and investment managers for each asset class. Equity Within Equities, the Board adopted a total allocation of 32% (13.5% Large/Mid Cap U.S., 3.5% Small Cap U.S., 12% International, and 3% Emerging Markets). This positioned the portfolio to be in line with the sub components of the MSCI ACWI IM Index and reduced any strategic biases (such as a small cap or value bias). It was noted that the previous structure was significantly overweight to U.S. Equity versus International Equity.
Broad U.S. Equity The Board’s U.S. Equity portfolio was well-positioned with market capitalization and style similar to that of the broad domestic equity market. The current target U.S. Equity structure was designed to maintain neutrality relative to the broad market, relying on passive management for large and mid cap exposure. The following changes are being made or were made within the U.S. Equity portfolio.
o Terminating SSgA Small/Mid Completeness Index Fund o Restructured NTGA Small/Mid Cap portfolio to focus solely on small
capitalization securities o Increased S&P 500 Index exposure utilizing SSgA S&P 500 Index Fund
13

Broad International Equity The Board’s previous International Equity portfolio was completely invested in developed market large/mid cap securities through investments in NTGI EAFE Index Fund and SSgA International Alpha strategy. The portfolio did not have exposure to Canada, Emerging Markets, or International Developed Small Cap. The following changes were made to the International Equity portfolio.
o Passive exposure was transitioned from an EAFE Index fund to a broader SSgA World excluding US Index fund
o Two active Emerging Market managers (Harding Loevner and DFA) were added to further diversify the portfolio and to provide an opportunity for incremental alpha from a less-efficient subset of the global equity market
14

Fixed Income The asset allocation approved by the Board in November 2013 decreased the total Fixed Income allocation while increasing diversification within the asset class. Fixed income exposure serves an important role in asset allocation including: capital preservation, income generation, diversification, and lowering overall volatility. The Board’s previous Fixed Income portfolio consisted of allocations to investment grade Fixed Income, both U,S, and global, high yield, and loans. In order to increase diversification, a global multi-sector Fixed Income manager was added. Specifically, the following changes were made to the Fixed Income portfolio’s target allocation:
o Added Global Multi-sector Fixed Income through Brandywine Global Opportunistic Fund additional source of alpha exposure to fixed income sectors to which the PTFs had limited or no exposure complement to approaches of legacy fixed income managers given Brandywine’s
top-down, value-oriented philosophy o Re-classified TIPS exposure as Diversified Inflation Strategies o Eliminated exposure to Payden & Rygel Low Duration strategy
The resulting asset class is allocated approximately 75% to domestic managers and 25% international/global.
Absolute Return As the portfolio did not have exposure to Absolute Return strategies, RVK provided detailed education to discuss the merits and objectives of various strategies. The primary objective of a GTAA strategy is to systematically exploit inefficiencies in equilibrium values among different asset or sub asset classes. GTAA is based on the assumption that relative returns among asset classes will diverge temporarily from equilibrium levels, allowing the opportunity for excess returns from systematic (generally contrarian) strategies. This broad strategy provides potential to add value by overweighting those asset classes or sub-asset classes that are expected to
15

outperform on a relative basis in the near term and underweighting those expected to underperform in the near term. The allocation provides diversification for the current Board portfolio. It serves as a source of alpha and as a means to obtain exposure to various asset classes. All strategies are liquid, providing many of the benefits of hedge funds without the illiquidity. Given the overall size of the allocation and the variability of approaches, the Board approved splitting the absolute return allocation equally among three unique investment managers.
Diversified Inflation Strategies As a broad asset class, Diversified Inflation Strategies (DIS) includes many liquid sub asset classes such as: TIPS, REITS, MLPs, Commodities, and Natural Resource Equities. Less liquid investment opportunities also exist but were not considered at this stage for investment by the portfolios under the Board’s responsibility. The previous inflation protection exposure consisted of financial assets, including TIPS and REITS. The target DIS structure diversifies the portfolio beyond TIPS through the introduction of MLPs, Commodities, and Natural Resource Equities. Consideration of the PTFs exposure to oil revenue was considered in the structure of the DIS portfolio.
16

Real Estate The Board previously did not have exposure to private Real Estate, but rather public Real Estate (REITS). The target Real Estate structure includes 8% to Core Real Estate and 7% to Core Plus Real Estate. The basic distinction between Core and Core Plus Real Estate is that Core Real Estate managers generally buy assets to extract value through income (rents), while Core Plus managers buy assets at a discount with the goal of improving those assets, increasing their value, and making them core assets. Although Core Plus Real Estate may be somewhat more volatile than Core Real Estate, expected returns are also higher. Based on liquidity preferences, the Non-Core Real Estate manager search solely focused on liquid, open-ended Core Plus Real Estate managers. The Board selected five Real Estate managers (2 Core and 3 Core Plus) to provide:
o Diversified Real Estate exposure through complementary Core and Core Plus funds o Exposure to high quality specialized Core Plus RE managers (Prologis and Jamestown) o Allocation to a well-diversified, relatively conservative Core Plus strategy (JPMorgan)
Assets are still in the process of being transitioned to real estate managers, subject to timing of manager capital calls.
17
SIIF Asset Allocation With Staff, RVK reviewed the current and projected cash flows of the SIIF. As the SIIF is subject to legislative appropriation, the projected expenditures of the SIIF are not controlled by the Board, but rather mandated by North Dakota’s legislature. Outflows for the SIIF for the 2013-2015 biennium are approximately $750 million in obligations, representing approximately 85% of current assets of the SIIF, with timing remaining relatively fluid. While the DTL Revenue Transfers will cease because the unobligated balance will decline below $300 million, the anticipated outflows will occur within the next 18 months. Based on the analysis, RVK recommended that the SIIF maintain its allocation to cash or enhanced cash like exposures. The current investment in cash equivalents remains appropriate given the amount and timing of the projected cash flows. Staff explored various investment options to increase the yield of the SIIF portfolio using a combination of Treasuries, corporate bonds, asset and mortgaged backed securities, commercial paper and other duration investments to add value over a solely Treasury portfolio. The primary goal of the investment portfolio would continue to be to preserve capital and maintain liquidity to meet spending needs. The specific guidelines on the allocation of the SIIF portfolio are included in the Investment Policy Statement (Exhibit A).
18
www.rvkuhns.com
Exhibit A: Investment Policy
Statement
19

1
ND Board of University and School Lands
Investment Policy Statement
An Investment Management Framework for North Dakota’s Permanent Trust Funds, the
Capitol Building Fund, the Strategic Investment and Improvements Fund, the Coal
Development Trust Fund, and the Indian Cultural Education Trust
Last updated 8/27/2015
TABLE OF CONTENTS
Mission Statement ...........................................................................................................................................................2
General Authority .............................................................................................................................................................2
Investment Authority .......................................................................................................................................................2
Purpose of This Policy .....................................................................................................................................................2
Investment Philosophy ....................................................................................................................................................3
Roles and Responsibilities ..............................................................................................................................................4
The Prudent Investor Rule ..............................................................................................................................................6
Social and Economically Targeted Investing ................................................................................................................6
Conflicts of Interest ..........................................................................................................................................................7
External Manager Selection and Evaluation .................................................................................................................7
General Investment Restrictions and/or Guidelines ...................................................................................................9
Securities Litigation and Shareholder Legal Activism .............................................................................................. 10
Securities Lending ......................................................................................................................................................... 10
Proxy Voting ................................................................................................................................................................... 11
Funds Administered by the Board .............................................................................................................................. 11
Permanent Trust Funds ................................................................................................................................................ 12
Strategic Investment and Improvements Fund (SIIF) ............................................................................................... 19
Capitol Building Fund ................................................................................................................................................... 21
Coal Development Trust Fund ..................................................................................................................................... 23
Indian Cultural Education Trust .................................................................................................................................. 25

2
Mission Statement
The mission of the Board of University and School Lands is to manage the assets of the permanent trusts in
a manner that preserves the purchasing power of the funds and maintains stable distributions to fund
beneficiaries and to manage all other assets and programs entrusted to the Board in a prudent,
professional manner, in accordance with the Constitution of North Dakota and applicable state law.
General Authority
On February 22, 1889 Congress passed the Enabling Act, dividing Dakota Territory into two states and
authorizing the people to form the constitution and government of the state of North Dakota. This act
granted a significant amount of land to support common schools, colleges, universities, the state capitol,
and other public institutions. North Dakota's Constitution (Article IX), adopted on October 1, 1889,
entrusted the management of these lands to the "board of university and school lands" (the Board). The
Board is made up of the governor as chairman, the secretary of state as vice-chair, the attorney general,
superintendent of public instruction, and the state treasurer.
Investment Authority
The North Dakota constitution states that the Board “has control of the appraisement, sale, rental, and
disposal of all school and university lands, and the proceeds from the sale of such lands shall be invested as
provided by law.”1 State law further requires that the Board “shall apply the prudent investor rule in
investing the permanent funds under its control.”2
Purpose of This Policy
This Investment Policy Statement (Policy) governs the investment of assets for the thirteen Permanent Trust
Funds, the Strategic Investment and Improvements Fund (SIIF), the Capitol Building Fund, the Coal
Development Trust Fund, and the Indian Cultural Education Trust (collectively, Funds). It is established to
provide a framework for the management of those assets and sets forth the Board’s investment objectives,
philosophy, guidelines, and practices. The Policy is not intended to be a static, one-time document but is
designed to capture investment opportunities while providing parameters that ensure prudence and care in
the execution of the investment program. No investment or action pursuant to an investment may be taken
unless permitted by this Policy or by action of the Board; any exceptions must be approved by the Board.
The Policy provides guidance for fiduciaries which include the Board, the Commissioner of University and
School Lands (Commissioner), investment managers, investment consultants, and custodians. It is the intent
of the Policy to provide the foundation for management of the Funds' assets in a prudent manner including
the standards by which the Board can evaluate the Commissioner, investment managers, investment
consultants, custodians and other service providers.
1 N.D. Const. art. IX, § 3
2 N.D.C.C. § 15-03-04

3
This Policy is supplemented by the Commissioner’s operating procedures and policies, as well as detailed
information within contractual agreements with investment managers.
Investment Philosophy
In order to meet the above investment objectives, the Board has adopted the following principles:
Strategic asset allocation is a fiduciary duty and allocation across asset classes is the most important
determinant of return variability and long-term total return.
Risk is an unavoidable component of investing and is a major factor that must be taken into account
in assessing investment policy and strategy.
Diversification by asset class and within asset classes is a primary risk control element.
Each trust or fund invested by the Board shall have a strategic asset allocation and investment
strategy that is appropriate given its specific requirements for return, risk, time horizon, and
liquidity.
Capital Markets Theory
Return
In order to meet the objective of the Funds, the Board strives to achieve the highest level of investment
performance that is compatible with its risk tolerance and prudent investment practices. The Board’s
mechanism for setting return goals will be accomplished by selecting specific benchmarks that match the
objective and time horizon of each fund. The Funds will have a goal for long-term returns to meet or exceed
its formal benchmark over a full market cycle, while minimizing the costs associated with implementation of
the asset allocation through efficient use of internal and/or external resources.
Risk
The investment risk philosophy for the Funds is based on the principles of capital market theory that are
generally accepted and followed by institutional investors, who by definition are long-term oriented
investors. This philosophy holds that:
Increasing risk is rewarded with compensating returns over time; therefore prudent risk taking is a
necessary element of long-term investing.
Risk can be mitigated through diversification of asset classes and investment approaches, as well as
diversification of individual securities.
The primary determinant of long-term investment performance is the strategic or long-term
allocation of assets among various asset classes.
Relative performance of various asset classes is unpredictable in the short-term and attempts to
shift tactically between asset classes or implementation strategies shall not be undertaken by the
Board.
Given these principles, the Board has established a long-term asset allocation policy for each fund that
balances the returns needed to meet the fund’s objectives and the risk level that is appropriate for that fund
under existing and anticipated circumstances. In determining its risk posture, the Board has considered

4
each fund’s purpose and characteristics, current and projected financial condition, liquidity needs, sources
of contribution, income, and general economic conditions.
Diversification
The Board will choose an investment strategy for each Fund utilizing an appropriate long-term, diversified
asset allocation approach. Diversification distributes a portfolio across many investments to avoid excessive
exposure to any one source of risk. Other considerations in asset allocation modeling should take into
account the purpose of the fund, the size and financial condition of the fund, and general economic
conditions. These factors are not intended to be limiting; rather, they are outlined as a general indication of
the importance of diversification to proper asset allocation. Under such an allocation, each Fund’s assets
may be invested by active and/or passive managers, and by diverse investment strategies and styles within
each asset class. The Board will determine the proper allocation among asset classes and investment
managers, based on advice and analysis provided by the Commissioner and/or Consultants.
Formal Review Schedule
The Board recognizes that though the investments are subject to short-term volatility, the Board shall
maintain a long-term investment focus. This prevents ad-hoc revisions to the philosophy and policies in
reaction to either speculation or short-term market fluctuations. In order to preserve this long-term view,
the Board has adopted the following formal review schedule:
Formal Review Agenda Item Formal Review Schedule
Asset Allocation Policy At least every four years
Manager Structure Policy At least every four years
Investment Policy At least every four years
Total Fund Performance At least quarterly
Asset Class Composite Performance At least quarterly
Investment Manager Performance At least quarterly
Roles and Responsibilities
The Board
The Board of University and School Lands is the primary body charged with overseeing investment activities
relating to the Funds. Members of the Board are fiduciaries subject to the statutory and common law duties
of a fiduciary.
The Board’s mandate, in turn, is to manage each fund entrusted to it ethically and optimally, working to
achieve the highest level of investment performance within acceptable levels of risk. The Board is
responsible for prudent investment of the Funds. The Board will operate the investment program in
compliance with all applicable federal and State laws and regulations. The Board is responsible for
establishing and maintaining all policies and guidelines by which the Funds are managed, and by which the
Commissioner operates.
The Board relies on the Commissioner and any external contractors to properly administer the Funds and
implement the Funds’ investment strategies. The roles of each party as fiduciaries must be clearly identified;

5
such identification increases operational efficiency, ensures clear lines of responsibility, and reduces or
eliminates duplication of effort.
The Commissioner
The Board of University and School Lands is required to appoint a commissioner to act on its behalf.3 The
office of the Commissioner of University and School Lands (the Commissioner)4 has a primary responsibility
to manage the permanent educational trust funds and assets under the Board’s control as outlined in law.
When used in this Policy, the term Commissioner is inclusive of the Department of Trust Lands' Chief
Investment Officer and investment staff. State law also gives the office of the Commissioner the
responsibility for managing the state Unclaimed Property Division, and the Energy Infrastructure and Impact
Office.
The Commissioner is responsible for implementing Board policy, the day to day management of the
investment program, and implementing a process for selection and termination of investment managers
that is sufficiently transparent for the Board to understand the process and provide meaningful oversight.
Investment Consultant
The Investment Consultant (Consultant) is hired by and reports directly to the Board. The Consultant's duty
is to assist the Board in oversight, and the Commissioner in managing the investment process. This
includes regular meetings with the Board to provide an independent perspective on the Funds’ goals,
structure, performance, and managers. The Consultant will render investment advice to the Board
regarding such matters as investment policy, strategy, overall portfolio monitoring and composition, and
diversification of investments. The Consultant will conduct ongoing due diligence of external investment
managers. The Consultant does not have any discretionary authority with respect to investments; the
Board makes all final decisions regarding any investments.
Investment Managers
Investment managers (Managers) are hired by and serve at the pleasure of the Board. The Commissioner
will provide the Managers with explicit written investment guidelines5 which detail permissible securities,
investment strategies, and performance evaluation criteria. Each Manager will select, buy, and sell specific
securities or investments within the parameters specified in their investment guidelines and in adherence to
this Policy or to other policies set forth by the Board. Managers will construct and manage investment
portfolios that are consistent with the investment philosophy and disciplines for which they were hired.
Managers will provide performance reporting at intervals specified by the Commissioner.
Custodian
A custodian bank is a specialized financial institution hired by the Board to safeguard the Funds’ financial
assets; they are a third party that operates separately from Managers. The custodian(s) will collect income
and safely keep all cash and securities, process all transactions, and provide monthly accounting/investment
3 N.D.C.C. § 15-02-01; Specific responsibilities of the Board and the Commissioner are set out in N.D.C.C. §§ 15-01 through 15-08.1.
4 Commissioner of University and School Lands is the statutory name; in 2011 the Board adopted The Department of Trust Lands as the
common reference to the agency. 5 In cases where the Board has selected investments in commingled or mutual funds, the offering document becomes the specific
investment guidelines.

6
reports to the Commissioner and Consultant. The custodian may also provide securities lending,
commission recapture, transition management, securities litigation monitoring, or other services for the
Funds.
The Prudent Investor Rule
North Dakota statute dictates that the Board applies the prudent investor rule in investing the Permanent
Trust Funds under its control. The law states:
“The ‘prudent investor rule’ means that in making investments the board shall exercise the same
judgment and care, under the circumstances then prevailing and limitations of North Dakota and
federal law, that an institutional investor of ordinary prudence, discretion, and intelligence exercises
in the management of large investments entrusted to it, not in regard to speculation but in regard to
the permanent disposition of funds, considering probable safety of capital as well as probable
investment returns.”6
It is the Board’s intent to invest all of the Funds in accordance with the Prudent Investor Rule.
Social and Economically Targeted Investing
Social investing is defined as the practice of aligning one's investment policies with social responsibility.
Some of the issues and topics addressed by social investing promoters include environmental causes,
avoidance of tobacco producers, avoidance of politically sensitive parts of the world, and workers’ rights.
With different sets of values, what one investor may deem irresponsible, another may consider good policy.
The Board shall not use the Funds to participate in activist efforts to implement a social agenda regarding
ownership of specific securities or efforts of shareholders to bring about social change.
Economically targeted investing is defined as an investment designed to create economic benefits for a
targeted geographic area, group of people, or sector of the economy. Economically targeted investing is
barred when investing the Permanent Trust Funds, the Capitol Building Fund, and the Indian Cultural
Education Trust, unless the investment meets the Exclusive Benefit Rule.
Exclusive Benefit Rule
The Exclusive Benefit Rule is met if the following four conditions are satisfied:
The cost does not exceed the fair market value at the time of investment.
The investment provides an equivalent or superior rate of return for a similar investment with a
similar time horizon and similar risk.
Sufficient liquidity is maintained to permit timely distributions.
The safeguards and diversity to which a prudent investor would adhere are present.
Economically targeted investing is allowed within the Coal Development Trust Fund and the Strategic
Investment and Improvement Fund, if the investment meets the purpose of the fund and is directed by law.
6 N.D.C.C. § 15-03-04
7
Conflicts of Interest
Members of the Board, the Commissioner, employees of the Commissioner, Managers, Consultants, and
custodians involved in the investment process will refrain from personal business activity that could conflict
with the proper execution and management of the Board investment program, or that could impair their
ability to make impartial recommendations and decisions. These parties are required to reveal all
relationships that could create or appear to create a conflict of interest in their unbiased involvement in the
investment process.
Manager Selection and Evaluation
When analyzing and evaluating any Manager, the Board believes it is important to review the Manager
within the context of the structure of the entire asset class and portfolio, and not in isolation. A key to
portfolio construction is diversification, not just by asset class but within each asset class. The goal of
diversification is to be exposed to different investment strategies, which will have different performance and
risk patterns. Diversification is optimal when strategies are complementary.
Search and Selection
The Board has established the following guidelines for hiring Managers. In establishing these guidelines, it
is the Board’s intention to assure all interested parties that decisions made in carrying out these actions
occur in a full disclosure environment characterized by competitive selection, objective evaluation, and
proper documentation. Any action to hire a manager should be based on one or more of the following
observations:
Identification of a new asset class or approach which has been approved in advance by the Board
A need for diversification of managers and styles within an existing asset class
A need to replace an investment manager
A need to retain additional managers in order to reach an asset class structure target
The selection of new Managers will adhere to a consistent process to ensure a competitive and transparent
search involving proper evaluation and due diligence of candidates, and selection of Managers that best
demonstrate the characteristics sought in a specific search. The Commissioner will ensure that the
objectives for the mandate are clearly articulated and that pricing is reflective of the market. The evaluation
process may be conducted by the Commissioner or the Consultant and will include but not be limited to the
following steps:
1. Establish investment manager election criteria
2. Identify qualified candidates through minimum qualification screening
3. Quantitative screening
4. Qualitative screening
5. Manager interviews
6. Analysis of quantitative and qualitative factors including portfolio fit and structure
8
The Commissioner will prepare documentation of the search process; this documentation will include
disclosure of all relevant issues and related due diligence. When reviewing the documentation, the Board
shall ensure that decisions were well reasoned, thoroughly considered, and prudent.
Monitoring, Evaluation, and Termination of Managers
The decision to retain a Manager can have the same potential impact on the returns of an asset class
composite as manager selection decisions and should be given the same degree of attention. The Board
recognizes investment and management decisions directed at individual managers must be evaluated not in
isolation but in the context of the overall structure of the asset class and the Fund’s portfolio as a whole. To
maintain the discipline necessary for a long-term focus, the Board will monitor and evaluate the
performance of Managers and identify the specific problems and concerns that may affect returns, with the
following objectives:
Foster a long-term approach to manager evaluation
Provide a review of the manager’s “fit” in the overall asset class composite
Provide a logical and statistically valid framework for manager skill evaluation
Promote timely and appropriate responses to actual and potential performance issues
Provide flexibility to allow application across all asset classes, management styles and market
environments
Monitoring and evaluation relies on a process that includes:
1. Monthly reports from the custodian and Managers to the Commissioner
2. Quarterly performance reports from the Commissioner and Consultant for the Board. These reports
will detail performance of the Funds, asset class composites, and the performance of individual
managers against established benchmarks, as well as peer ranks for each category
3. Qualitative analysis generated in the course of regular, on-going contact between a Manager, the
Commissioner, and the Consultant
Manager Termination Guidelines
From time to time it will be necessary for the Board to terminate a contractual relationship with a Manager;
these actions must be viewed in the context of the entire portfolio and as a business decision. The Board
has established guidelines to assist in making these termination decisions. The overriding consideration
with respect to all decisions is that they shall be made solely in the best interest of the beneficiaries of the
Funds.
Any action to terminate a manager should be based on one or more of the following criteria:
1. Significant changes in firm ownership and/or structure
2. Loss of one or more key personnel
3. Significant loss of clients and/or assets under management
4. Shifts in the firm’s philosophy or process
5. Significant and persistent lack of responsiveness to client requests
6. Changes in the Board’s investment strategy eliminating the need for a particular style or strategy
7. Violations of the Investment Policy or guidelines

9
8. Unsatisfactory investment performance
9. Identification of a new asset class or approach which has been approved in advance by the
Board
10. Need for diversification of styles within an existing asset class
11. Need to reduce exposure to a single manager
12. Any other issue or situation of which the Commissioner, Consultant, and/or Board become
aware that is deemed material
Prior to the termination decision, all relevant considerations and issues should be identified and
documented in Board meeting minutes and supporting documents. It is the Board’s intent to have a plan in
place before termination of a Manager. The Commissioner will redeploy the assets of a terminated
manager’s portfolio in an expedient and prudent manner, which may involve hiring a third party to facilitate
the transition or liquidation of assets.
General Investment Restrictions and/or Guidelines
1. All investments made shall be subject to the quality and diversification restrictions established by
the Prudent Investor Rule.
2. According to North Dakota law, the Board may not purchase as sole owner commercial or
residential real property in the State.7
3. Assets may be held in commingled funds and/or privately managed separate accounts. Exposure
through commingled funds and mutual funds shall be evaluated on a case-specific basis through
analysis of that fund’s offering document. Upon review by the Commissioner and approval by the
Board, this offering document becomes the specific investment guidelines for that allocation.
4. No more than 5% of the stock of any corporation may be purchased.
5. The securities representing debt and equity of any one company shall not exceed 6% of the market
value of any Manager’s portfolio without prior approval from the Commissioner; such approval shall
be reported to the Board.
6. Cash equivalents held by Managers can be disruptive to the allocation process. Unless otherwise
authorized, Managers are expected to be fully invested in the types of securities for which they have
responsibility.
7. Any use of leverage will be consistent with the strategy for which the Board hired the Manager. Use
of leverage will be controlled as appropriate in the Manager’s specific guidelines.
8. The Board recognizes that the Funds are exposed to currency risk through international equity, fixed
income, and absolute return mandates; the Board prefers to utilize unhedged benchmarks and does
not require its Managers to hedge the currency exposure in their portfolios.8
7 N.D.C.C. § 15-03-04 8 The exception is the Board’s international fixed income mandate with First International which is fully hedged in regards to currency
and utilizes a hedged benchmark.

10
Securities Litigation and Shareholder Legal Activism
In carrying out its fiduciary duties to prudently invest and manage the assets entrusted to it, the Board
invests in the securities of various public companies, or issuers. From time to time, class action lawsuits are
brought against the issuers, directors, and/or officers for alleged violations of federal and state securities
laws relating to various disclosure obligations and other breaches of fiduciary or other duties. As
shareholders, the trust funds under the Board’s control are putative members of the alleged classes.
The Board relies on the custodian to monitor settled class action securities litigation where the Funds have
an interest. In resolved litigation, unless directed otherwise, the custodian files proofs of claim on behalf of
the Funds and posts disbursements or settlements to the appropriate portfolios as litigation settlement
proceeds are received.
Although there may be value in influencing an eventual settlement or in pursuing a separate legal action in a
lawsuit, the administration and opportunity costs can be substantial. The Board uses a monitoring approach
to securities litigation to avoid the diversion of staff, financial, and legal resources in building and applying
collective plaintiffs’ arguments through depositions, discovery, and documentation. Serving as the lead
plaintiff does not obtain any additional financial benefit, but rather a lead in a class action suit shares any
final judgment or settlement with the class members on an equal, per share basis.9 Opting out of a “class” or
objecting to the terms of a proposed settlement and pursuing independent legal remedies may also be
pursued although the administration and opportunity costs can be substantial and involve significant
attorney’s fees, costs, and expenses which may or may not be fully compensated.
The Board, in consultation with the Attorney General, may consider more active forms of legal engagement
in cases where:
1. the estimated loss is greater than 0.1% of the total assets under management of the Board; and
2. the trust funds are among the largest shareholders of the defendant issuer; and
3. service as a lead plaintiff or opting out of a proposed settlement to the “class” of claimants would be
in the best interest of the Funds
The Board may contract with firms that provide securities litigation monitoring/tracking services if it
determines it is prudent.
Securities Lending
The objective of the securities lending program is to generate incremental income from overnight and
certain term loans of securities. The Funds may participate in a securities lending program.
The program will utilize a high-quality and conservative collateral re-investment approach that safeguards
the return of principal and maintains adequate daily liquidity to support trade settlement activity and
portfolio restructuring activities. Each securities lending agent will ensure that specific guidelines are in
place as to the quality, duration, liquidity and diversification of securities lending collateral.
9 The lead plaintiff may recover attorney’s fees, costs, and expenses if the lawsuit is successful or a settlement is obtained.

11
The Board requires collateral for loans. The use of assets in any securities lending engagements should:
1. Earn a competitive market return through conservative securities lending practices, consistently with
the preservation of capital.
2. Minimize risk with respect to both the borrower and the collateral,
3. Operate the securities lending program so that it will not interfere with the management of overall
investment portfolio and strategies.
Unless explicitly exempted by the Board, the lending agent shall provide indemnification against losses
arising from borrower default, insolvency, and failure to comply with the terms and conditions of the
lending agreements.
The Commissioner shall provide a report to the Board annually, outlining the performance and status of the
securities lending program.
Proxy Voting
The Board believes that proxies should be voted; it delegates authority to vote shares to each Manager and
expects Managers to vote shares. The principle behind this policy is that Managers have specific reasons for
holding shares and will vote shares in a way the Manager believes will best add value to those
shares. Managers shall submit written reports to the Commissioner upon request advising of the manner in
which each proxy was voted during the preceding period.
An exception to the above policy regarding voting of proxies is for shares held by the Board on behalf of
holders of unclaimed property. As a passive holder of these particular shares the Board chooses not to
exercise voting rights on the owners’ behalf.
Funds Administered by the Board
The pages that follow describe the various funds administered by the Board.

12
Permanent Trust Funds
On February 22, 1889, Congress passed "An act to provide for the division of Dakota Territory into two
states, and to enable the people of North Dakota, South Dakota, Montana and Washington to form
constitutions and state governments . . ." This Act is commonly known as the Enabling Act. This act granted
land to the new states "for the support of common schools," which in North Dakota’s case totaled more
than 2.5 million acres. Further land grants in this legislation provided for the support of colleges,
universities, the state capitol, and other public institutions. These additional grants totaled approximately
668,000 acres, bringing the grand total of Enabling Act land grants to nearly 3.2 million acres.
Purpose
The land grant from the federal government at statehood10
and the state constitution11
both provide that
the Board of University and School Lands manage the trust land and minerals and associated proceeds, for
the exclusive benefit of education and institutional support. In accordance with Article IX of the North
Dakota Constitution as well as federal law12
, the perpetual trust funds must be managed to:
1. Preserve purchasing power
2. Maintain stable distributions to trust beneficiaries
Chapter 15-03 of the North Dakota Century Code governs the management of the Permanent Trust Funds,
including the requirement that any investments conform to the prudent investor rule.
Listing of Permanent Trust Funds
The following are the beneficiaries of the Permanent Trust Funds described in Article IX of the North Dakota
Constitution:
1. Common Schools (K-12)
2. North Dakota State University
3. University of North Dakota
4. Mayville State University
5. ND Youth Correctional Center
6. Ellendale State College13
7. Valley City State University
8. State College of Science
9. School for the Blind
10. School for the Deaf
11. State Hospital
12. School of Mines (UND)
13. Veterans Home
10 The Enabling Act of February 22, 1889 (25 Stat. 676, chapter 180) 11 N.D. Const. art. IX, § 2 and 3 12 7 U.S.C. § 309 and 25 Stat. 676, chapter 180 13 Beneficiaries of the Ellendale permanent trust are now Dickinson State University, Minot State University, Dakota College at
Bottineau, Veterans Home, School for the Blind, State Hospital, and the State College of Science as directed in Chapter 176 of the 1973
legislative session laws.

13
Funding Sources
Funding Sources Common to All Permanent Trust Funds
Each permanent trust individually owns surface land tracts and mineral rights that provide revenue from
agricultural leases, oil and gas royalties and lease bonuses, as well as other productive uses of the surface
and mineral lands owned by each trust.
Common Schools
The Common Schools Trust Fund is the largest of the Permanent Trust Funds administered by the Board. In
addition to the revenues from the surface lands, minerals, and investments that the Permanent Trust Funds
own, the Common Schools Trust Fund also receives funding from the following sources:
1. 10 percent of the oil and gas extraction tax collected by the state14
2. 45 percent of the proceeds from the tobacco class-action lawsuit settlement15
3. Net unclaimed property proceeds collected by the Department16
until such time that property may
be reunited with its owner.
Distribution Policy
Article IX, Section 2 of the North Dakota Constitution states:
“Distributions from an educational or charitable institution's trust fund must be faithfully used and
applied each year for the benefit of the institution and no part of the fund may ever be diverted,
even temporarily, from this purpose or used for any purpose other than the maintenance of the
institution, as provided by law.
The distribution formula17
is also described in Article IX of the state constitution:
... biennial distributions from the perpetual trust funds must be ten percent of the five-year average
value of trust assets, excluding the value of lands and minerals. The average value of trust assets is
determined by using the assets' ending value for the fiscal year that ends one year before the
beginning of the biennium and the assets' ending value for the four preceding fiscal years. Equal
amounts must be distributed during each year of the biennium.
By statute, distributions from the Common Schools Trust Fund are paid to school districts monthly, from
August to April of each fiscal year, through the state tuition fund.18
Historically, distributions have been
smaller during the early part of each fiscal year and higher towards the end of each fiscal year.
14 N.D. Const. art. X, § 24 15 N.D.C.C. § 54-27-25 16 N.D.C.C. § 15-10-05.2 and N.D. Const. art. IX, § 1 17 This distribution formula is the result of a constitutional amendment that was approved by North Dakota voters on November 7,
2006. This constitutional change was validated at the federal level by the passing of the Omnibus Public Land Management Act of 2009
(H.R.146) which amended the First Morrill Act (The Act of July 2, 1862 [7 U.S.C. 301 et seq.]) and the Enabling Act of February 22, 1889
(25 Stat. 676, chapter 180). Prior to these changes, distributions for the Permanent Trust Funds were based on projections of interest
and income for the funds; distributions could only be paid out of interest earned. 18
N.D.C.C. § 15.1-28-01

14
Distributions from the other 12 Permanent Trust Funds are made in equal amounts during January and June
of each fiscal year and are distributed directly to the benefitting institutions.
Investment Objective
The assets of the Permanent Trust Funds are invested with a perpetual time horizon, in a manner that seeks
to balance the longer-term goal of preserving the purchasing power of the trusts with the shorter-term goal
of maintaining a stable stream of distributions to beneficiaries. The long-term nature of the funds,
combined with a disciplined investment approach, provide the ability to the Permanent Trust Funds to
withstand short-term volatility, to profit from periods of elevated risk aversion, and to be rewarded for
providing liquidity.
The Permanent Trust Funds are invested by the Board in a single comingled pool, along with the Indian
Cultural Education Trust (described further on page 25).
Strategic Asset Allocation
The Board recognizes that the most important determinant of long-term return and risk is the asset
allocation decision. The asset allocation decision is intended to reflect the return objective and risk tolerance
expressed in this Investment Policy Statement. It is designed to provide the highest probability of meeting
the Funds’ objectives at a level of risk and liquidity that is acceptable to the Board. In establishing its risk
tolerance, the Board considers the Funds’ ability to withstand short- and intermediate-term volatility in
investment performance and fluctuations in financial condition of the Funds.
To determine the strategic asset allocation target, the Board, with assistance from the Commissioner and
Consultant, examines the historical and projected risk and return of the approved asset classes, the
correlation among these asset classes as well as the effect the expected investment performance will have
on the obligations of the Funds. Based on its long-term return expectations and its determination of the
appropriate risk tolerance for the Funds, the Board has chosen the following strategic asset allocation policy
for the Permanent Trust Funds:
Asset Class
Strategic Asset
Allocation Target
Minimum
Maximum
Broad US Equity 17% 12% 22%
Broad International Equity 15% 10% 20%
Fixed Income 23% 18% 28%
Absolute Return 20% 15% 25%
Real Estate 15% 10% 20%
Diversified Inflation Strategies 10% 5% 15%
The Board and the Commissioner will review the strategic asset allocation policy at least annually for
reasonableness relative to significant economic and market changes or to changes in the Funds’ long-term
goals and objectives. A formal asset allocation study will be conducted at least every four years to verify or
amend the targets.

15
Recognizing that a long-term target allocation utilizing alternative asset classes can take a matter of years to
implement prudently, the Board delegates implementation of strategic asset allocation policy to the
Commissioner including funding of alternative asset classes and setting interim asset allocation targets.
Rebalancing
Rebalancing is the term that describes the periodic movement of funds from one asset or asset class to
another in order to realign assets to the strategic asset allocation target. A rebalancing strategy is an
important element of asset allocation policy. Systematic rebalancing can reduce portfolio volatility and
increase portfolio return over the long-term. However, frequent rebalancing resulting from excessively tight
ranges can lead to unnecessary transaction costs.
The Commissioner is responsible for developing and implementing a rebalancing plan that is appropriate
for existing market conditions, with a primary objective of minimizing transaction costs, market impact,
opportunity costs and portfolio disruptions. To the extent possible, cash flows and revenues will be used to
maintain the strategic target allocation. The Commissioner may make minor changes among asset classes
and within individual asset classes to more effectively maintain proper exposure to the strategic asset
allocation and asset class portfolio structures.
Recognizing that at times it may be impractical or costly to reallocate assets when an upper or lower limit is
breached, the asset class will be rebalanced to within its strategic asset allocation range as soon as is
practically possible, subject to reasonable transaction costs.
Benchmarks
One return objective to be considered when evaluating the Funds’ performance is measured by applying the
investment performance of the asset class benchmarks to the Funds’ strategic asset allocation target. The
Policy Index permits the Board to compare the Funds’ actual performance to its total fund benchmark, and
to measure the contribution of active investment management and policy adherence.
The Board has selected the following Policy Index for the Permanent Trust Funds:
Asset Class Policy Index Strategic Asset Allocation Target
Broad US Equity Russell 3000 Index 17%
Broad International Equity MSCI ACWI Ex USA Index 15%
Fixed Income Barclays Global Aggregate Index 23%
Absolute Return Absolute Return Custom Index1 20%
Real Estate NCREIF ODCE Index 15%
Diversified Inflation Strategies DIS Custom Index2 10%
1 Absolute Return Custom Index: 60% Equity (MSCI All Country World IMI), 40% Fixed Income (Barclays US Aggregate Bond Index)
2 DIS Custom Index: 30% Commodities (Bloomberg Commodities Index ex-energy ), 30% MLPs (S&P MLP Index), 20% TIPS (Barclays US
TIPS), 20% Natural Resource Equities (S&P Global Natural Resources Index).
Recognizing that a long-term target allocation to alternative asset classes can often take a matter of years to
implement prudently, the Board will also review an Interim Policy benchmark which will be adjusted as the
Commissioner makes progress towards its long-term strategic asset allocation target.

16
Permitted Investments19
The Board may invest in the following securities and investment activities as long as such investments
comply with the Prudent Investor Rule20
. Fund of Fund strategies are allowable in any of the asset classes.
All investments are subject to approval of the Board and satisfactory legal review of applicable contractual
terms and conditions.
Equity
1. Preferred stock, common stock, initial public offerings, Real Estate Investment Trusts (REIT’s),
securities of foreign issuers listed on U.S. Exchanges, and any security convertible to common stock
or American Depository Receipts (ADR’s) that are registered by the U.S. Securities and Exchange
Commission (SEC) of any corporation whose securities are listed on at least one U.S. stock exchange
that has been approved by or is controlled by the SEC or on the National Association of Securities
Dealers (NASD). Global mandates may be considered.
2. Preferred stock, common stock, and convertible issues of any non-U.S. Corporation; which may be
denominated in non U.S dollars, provided that the securities are traded on one or more national
stock exchanges or included in a nationally recognized list of stocks; and the Board shall not be
invested in more than ten percent of the voting stock of any company.
Fixed Income
1. Bonds, notes or other obligations of the United States government, its agencies, government-
sponsored enterprises, corporations, or instrumentalities for which the credit of the United States
government is pledged for the payment of the principal and interest. Global mandates may be
considered.
2. Bonds, notes or other obligations issued by a state, its municipalities, or other political subdivisions,
that have received an investment grade bond rating.
3. Bonds, notes, commercial paper or other obligations of any corporation organized and operating
within the United States.
4. Debt obligations of non-U.S. governmental or quasi-governmental entities, these may be
denominated in foreign currencies; obligations, including but not limited to bonds, notes or
commercial paper with an investment grade rating (unless otherwise approved by the Board) of any
corporation organized outside of the United States. Currency transactions, including spot or cash
basis currency transactions, forward contracts and buying or selling options or futures on foreign
currencies, shall be permitted.
5. Collateralized obligations, including but not limited to mortgages, held in trust that: (1) are publicly
traded and are registered by the SEC or other Self-Regulatory Organization (SRO) and (2) have
underlying collateral that is either an obligation of the United States government or else has a credit
rating above or equal to BBB according to the Standard and Poor's rating system or Baa according
to the Moody's investors rating system or their equivalent by a national rating agency approved by
the Board (unless otherwise approved by the Board).
6. Derivatives including forwards, futures, options, mortgage derivatives, structured notes, and swaps.
19 Investments listed here are for general information purposes only. Each manager retained by the Board will be given specific
guidelines with regard to permissible investments relevant to their mandate. 20 N.D.C.C. § 15-03-04. See page 5 for more about the Prudent Investor Rule.

17
7. High yield fixed income securities rated below 'BBB' according to the Standard and Poor's rating
system and below 'Baa' according to the Moody's investors rating system.
8. Loans, warrants and other forms of debt approved by the Board, and managed in conjunction with
the Bank of North Dakota, such as farm loans and energy construction loan, as long as the
investment meets the Exclusive Benefit Rule described on page 6 of this Policy.
Real Estate
Real Estate Partnerships, including investments in private vehicles through limited partnerships or
limited liability companies that have an ownership interest in direct real estate properties, whether
income-producing or non-income producing. The investment strategies may include “core” and
“value added” strategies, which derive their return from both income and appreciation.
Absolute Return
Liquid multi-asset/global tactical asset allocation (GTAA) funds that have the ability to shift capital
tactically based on relative valuations, providing broad diversification across a range of global
investments.
Diversified Inflation Strategies
1. Inflation-indexed bonds, including investments in actively or passively managed investment vehicles.
Treasury Inflation Protected Securities (TIPS) are an example of inflation-indexed bonds.
2. Commodities, including but not limited to futures and/or swaps on individually traded commodities
or indexes comprising groups of commodities like the Goldman Sachs Commodity Index (GSCI) or
Bloomberg Commodities Index.
3. Master Limited Partnerships (MLPs) focused in energy sector including companies that own or
operate energy assets or are involved in the transportation, processing, and storage of natural
resources. May invest in MLP units issued in private investment in public equity (PIPE) transactions.
4. Natural resources securities including securities of natural resource companies and industrial
companies related to the natural resources industry and instruments that derive their value from
natural resources.
Cash Investment Guidelines
The Commissioner will focus on quality when investing cash positions. Cash is an asset class that should
emphasize minimal risk. Cash positions will be kept to the minimum necessary for liquidity, distributions
and ongoing investment activities. Eligible securities include:
1. Repos secured by U. S. obligations or other securities backed by the U.S., A1 or P1 commercial
paper, corporate obligations rated AA or better and maturing in five years or less, or asset-backed
securities rated AAA. All repo collateral must have a market value of at least 102% of the market
value of the contract;
2. Commercial paper issued by corporations organized and operating within the U.S. and rated “prime”
quality by a national rating service;
3. Prime bankers’ acceptances issued by money center banks;
4. Funding agreements rated at least AA by a nationally recognized rating agency. As used in this
paragraph, "funding agreement" means a floating or variable rate insurance company contract that

18
is a general obligation of an insurance company organized and operating within the United States
and that is senior to all other debt issued by the company;
5. Time deposits, with banks incorporated in the United States or time deposits that are fully
guaranteed by banks incorporated in the United States.
19
Strategic Investment and Improvements Fund (SIIF)
Fund Purpose
The Strategic Investment and Improvements Fund (SIIF), was created July 1, 2011 with merger of the Lands
and Minerals Trust Fund and the Permanent Oil Tax Trust Fund.21
The SIIF holds the assets and collects the
revenues earned from State owned mineral acres. The SIIF also receives a substantial portion of the oil and
gas production and extraction taxes collected by the State. The Board is responsible for managing the
physical and financial assets of the SIIF.
The purpose of the SIIF is to provide for one-time expenditures relating to improving state infrastructure or
for initiatives to improve efficiency and effectiveness of state government.
Funding Sources
The SIIF collects the revenues earned from the mineral acres owned by the State, including those formerly
owned by the Bank of North Dakota and State Treasurer, as well as the sovereign minerals located under
navigable rivers and lakes. The SIIF also receives a portion of the oil and gas production and extraction
taxes collected by the State.22
Legislative changes to the oil tax revenue allocations are common and can
have a major impact on the timing and amount oil taxes collected by the SIIF each biennium.
Distribution Policy
There is no explicit distribution policy or objective; rather the Board is responsible for making sure funds are
available to distribute or transfer when needed and as appropriated. The SIIF can be appropriated or
obligated by the Legislature every two years, though State law dictates that the SIIF should be appropriated
only to the extent that the moneys are estimated to be available at the beginning of the biennium in which
the appropriations are authorized.23
Investment Objective
State law provides no guidance as to how the assets of the SIIF should be invested; however, due to the
short-term nature of spending decisions and the uncertainty of the fund’s mineral based revenues, the
Board invests the SIIF with a focus on principal preservation and liquidity. The Board has adopted an
investment objective for the SIIF that provides for a diversified portfolio of fixed income securities that will
exceed on a multi-quarter basis, net of fees, the return of the benchmark described below.
Strategic Asset Allocation
Due to the expendable nature of the SIIF, the strategic asset allocation for the fund is 100% low duration
investment grade fixed income investments.
21
N.D.C.C. § 15-08.1-04 and § 61-33-07 22
N.D.C.C. § 57-51.1-07.5 23
N.D.C.C. § 15-08.1-08

20
Investment Guidelines
The SIIF will be invested in a high quality portfolio that includes a combination of Treasuries, corporate
bonds, asset and mortgaged backed securities, and commercial paper and will adhere to the following
guidelines:
Minimum average quality of AA
Minimum quality for any security of BBB (limited to 10%)
Neutral weighted average maturity of 1 year range of 6 months to 1.5 years
Maximum maturity: 3 years for fixed rate, 5 years for floating rate
No more than 50% in investment grade corporate and agency backed securities
Not more than 2% of the fund will be invested with any single issuer
Benchmark
The benchmark is composed of 50% of the three-month U.S. Treasury Bill and 50% Barclays 1 – 3 Year Gov’t
Corp Index.

21
Capitol Building Fund
Fund Purpose
The Capitol Building Fund was created at statehood with a grant of land from the federal government. The
purpose of the fund, as described in the Enabling Act of 1889, is to provide for “public buildings at the
capital”.24
The Capitol Building Fund was created under Article IX of the North Dakota Constitution;
however, unlike the other trusts, this fund is not permanent in that the entire fund is subject to legislative
appropriation each biennium.
The Capitol Grounds Planning Commission is responsible for managing all of the assets of the Capitol
Building Fund.25
The Board’s role is to invest and manage the various assets of the fund, as directed by the
Capitol Grounds Planning Commission. These roles are statutory, not constitutional in nature; the law
specifically states:
“The capitol grounds planning commission shall have general powers to superintend the
administration of the capitol building fund, its interest and income fund, and its investments and
properties. It may cause any lands now held in such funds to be sold at market value, direct the
conversion of any securities now held by such funds to cash, approve expenditures from such funds
subject to law and legislative appropriations, and to do all other things necessary to carry out the
intent and purposes of this section. The board of university and school lands or its designee, on the
commission's behalf, shall see to the investment and management of the capitol building fund and
its interest and income fund and shall account to the commission concerning these funds at the
commission's request.”26
Funding Sources
The Capitol Building Fund generates revenues from the almost 10,000 surface and more than 27,000
mineral acres which provide revenue from agricultural leases, mineral royalties and lease bonuses.
Distribution Policy
Since the Capitol Building Fund is a fully expendable fund, there is no distribution policy or objective; rather
the Board is responsible for making sure funds are available to distribute or transfer when needed and as
appropriated.
State law provides a continuing appropriation of up to $175,000 per biennium that is available to the Capital
Ground Planning Commission without requiring a legislative appropriation for a given biennium.27
Historically, the legislature has also included a $25,000 biennial appropriation for the operations of the
Capitol Grounds Planning Commission.
24
The Enabling Act of February 22, 1889 (25 Stat. 676, chapter 180) 25
N.D.C.C. § 48-10-02 26
N.D.C.C. § 48-10-02 27
N.D.C.C. § 48-10-02

22
Investment Objective
Due to the fact that the entire balance of this fund can be appropriated by the legislature each biennium
and the uncertainty of the fund’s mineral based revenues, the Capital Grounds Planning Commission has
adopted an investment objective with a focus on principal preservation and liquidity.
Strategic Asset Allocation
Due to the expendable nature of the Capitol Building Fund, the Capital Grounds Planning Commission has
adopted a strategic asset allocation for the fund that is 100% fixed income investments.
Investment Guidelines28
The Capital Grounds Planning Commission has adopted guidelines to invest the fund in a high quality
portfolio that includes a combination of Treasuries, corporate bonds, asset and mortgaged backed
securities, and commercial paper and will adhere to the following guidelines:
Minimum average quality of AA
Minimum quality for any security of BBB (limited to 10%)
Neutral weighted average maturity of 1 year range of 6 months to 1.5 years
Maximum maturity: 3 years for fixed rate, 5 years for floating rate
No more than 50% in investment grade corporate and agency backed securities
Not more than 2% of the fund will be invested with any single issuer
Benchmark
The benchmark is composed of 50% of the three-month U.S. Treasury Bill and 50% Barclays 1 – 3 Year Gov’t
Corp Index.
28
Due to the common investment objectives, strategic asset allocation, and investment guidelines, the assets of the Capitol Building
Fund may be pooled with the SIIF for investment purposes.

23
Coal Development Trust Fund
Fund Purpose
The Coal Development Trust Fund is a permanent trust established under Article X, Section 21 of the North
Dakota Constitution. The primary purpose of the fund is to provide loans to coal-impacted counties, cities,
and school districts and to provide construction loans to school districts; any money that is not in use for
loans may be invested by the Board. The trust fund must be perpetual and held in trust as a replacement
for depleted natural resources.29
Both the Constitution and state law mandate that the income earned by
the fund be used first to replace any uncollectable loans and the balance must be deposited into the
General Fund.30
Funding Sources
State law provides that 30% of coal severance tax revenues be deposited into the fund.31
The Constitution
provides that up to 70% of the taxes deposited into the fund each year may be appropriated by the
legislature for lignite research, development, and clean coal demonstration projects approved by the
industrial commission.32
Thus, the Coal Development Trust Fund retains only 30% of the money deposited
into the fund, which averages about $1 million per year.
Distribution Policy
The income earned by this fund each year must be used first to replace uncollectible loans made from the
fund and the balance must be deposited in the State's general fund. The estimated fiscal year income for
this fund is distributed in June of each year; any difference between estimated and actual income is
distributed in November or December of each year, once final audited financial statements have been
received.
In calculating the income earned by this trust, capital gains earned on investments must be amortized to
income over 10 years.33
Investment Objective
Preservation of capital and added value over the benchmark over a full market cycle through active
management of the portfolio subject to the investment guidelines set forth below.
Strategic Asset Allocation
Due to the expendable nature of the income earned by the Coal Development Trust Fund, and the provision
in state law about replacing any lost principal with income, the strategic asset allocation for the fund is 100%
fixed income investments.
29
N.D.C.C. § 57-62-02 30
N.D. Const. art. X, § 21 and N.D.C.C. § 57-62-02 31
N.D.C.C. § 57-62-02 32
N.D. Const. art. X, § 21 33
N.D.C.C. § 15-03-05.1

24
Investment Guidelines
The Coal Development Trust will be invested in a high quality portfolio that includes a combination of
Treasuries, corporate bonds, asset and mortgaged backed securities, and commercial paper and will adhere
to the following guidelines:
Minimum average quality of AA
Minimum quality for any security of BBB (limited to 10%)
Neutral weighted average maturity of 1 year range of 6 months to 1.5 years
Maximum maturity: 3 years for fixed rate, 5 years for floating rate
No more than 50% in investment grade corporate and agency backed securities
Not more than 2% of the fund will be invested with any single issuer
Benchmark
The benchmark is composed of 50% of the three-month U.S. Treasury Bill and 50% Barclays 1 – 3 Year Gov’t
Corp Index.
25
Indian Cultural Education Trust
Fund Purpose
The Indian Cultural Education Trust was created in 2003 for the purpose of generating income to benefit
Indian culture.34
State law authorizes the Board to accept donations of money or land for this trust to be
managed in the in the same manner that it manages its other trust land and financial assets, subject to state
law and a required donor agreement with one or more federally recognized Indian tribes located in North
Dakota, South Dakota, Montana, Minnesota, or Wyoming.
Three Affiliated Tribes Cultural Education Account
The Three Affiliated Tribes Cultural Education Account is the sole account in the trust, which serves to
benefit the Mandan, Hidatsa & Arikara Nation Cultural Education Foundation. Under an agreement signed
by the tribe, North American Coal, and the Commissioner, the Board must manage and invest this account
exactly as the Permanent Trust Funds are managed and invested.
Funding Sources
Initial funding of the account was a result of donations of both money and land by North American Coal to
the cultural education account. Revenue earned from the donated lands is deposited into the account.
Further donations of land or money from Individuals or organizations may provide additional funding to the
account.
Distribution Policy
The distribution calculation for the Indian Cultural Education Trust is identical to that of the Permanent
Trust Funds as detailed on page 13, however, the specific donor agreement for an account may dedicate a
portion of the amount available to distribute to principal.35
The Three Affiliated Tribes Cultural Education Account donor agreement has mandated that no less than
25% of the annual amount available to distribute go to principal. Each year, the Commissioner notifies the
Mandan, Hidatsa & Arikara Nation Cultural Education Foundation as to the amount eligible for
disbursement. If written request for the disbursement is received by the Commissioner by March 31st
, all or
a portion of that amount shall be distributed as specified in the donor agreement.
Investment Objective, Strategic Asset Allocation, and Investment Guidelines
Like the Permanent Trust Funds, the investment objective is to preserve purchasing power and maintain
stable distributions with a long-term investment horizon. The assets of the Indian Cultural Education Trust
are pooled with the Permanent Trust Funds. The strategic asset allocation, benchmarks, and investment
guidelines are identical to those of the Permanent Trust Funds, which can be found in the corresponding
sections beginning on page 14 of this Policy.
34
N.D.C.C. § 15-68 35
N.D.C.C. § 15-68-04

www.rvkuhns.com
Appendix: PTF Asset Allocation Modeling Results

RVK 2013 Assumptions
A US Equity B International Equity C Fixed Income D Real Estate
E Absolute Return F Real Asset/Diversified Inflation Strategies
G Private Equity
Statistics are calculated on monthly periodicity, except where noted by a (Q) for quarterly periodicity.
46
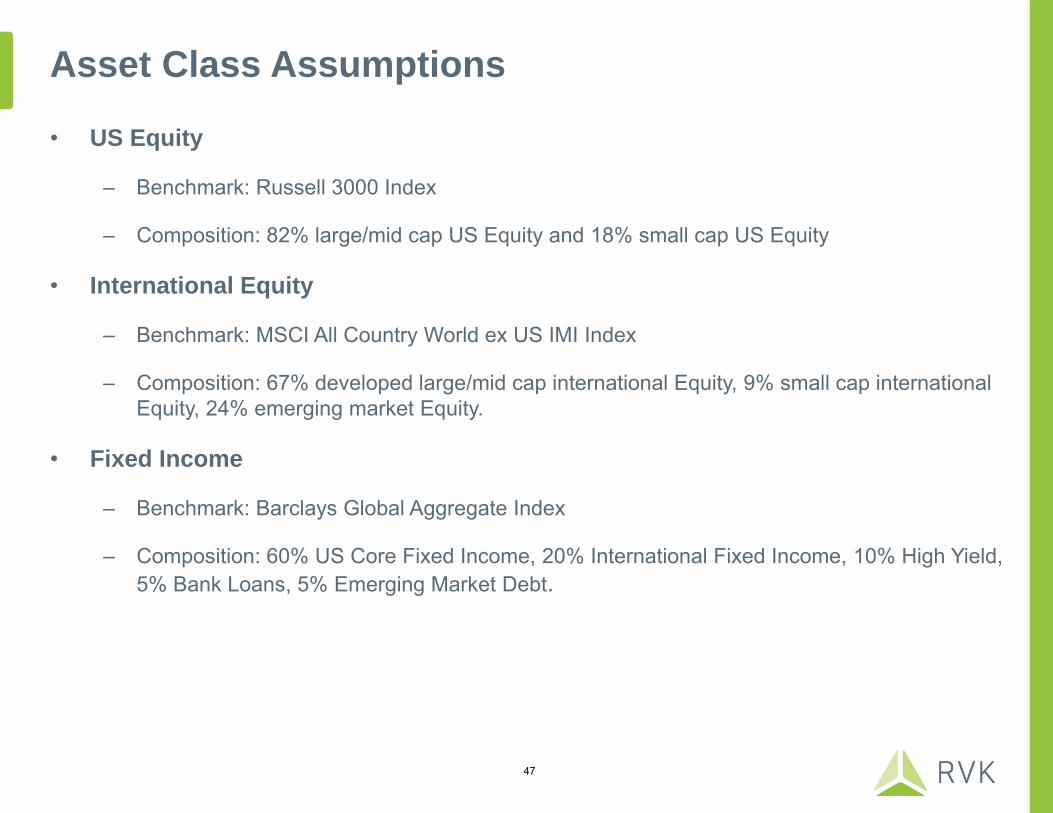
Asset Class Assumptions
• US Equity
– Benchmark: Russell 3000 Index
– Composition: 82% large/mid cap US Equity and 18% small cap US Equity
• International Equity
– Benchmark: MSCI All Country World ex US IMI Index
– Composition: 67% developed large/mid cap international Equity, 9% small cap international Equity, 24% emerging market Equity.
• Fixed Income Income
– Benchmark: Barclays Global Aggregate Index
– Composition: 60% US Core Fixed Income, 20% International Fixed Income, 10% High Yield, 5% Bank Loans, 5% Emerging Market Debt.
47

Asset Class Assumptions
• Real Estate
– Benchmark: RVK Custom Real Estate Blended Index – Composition: 50% Core Real Estate and 50% Non-Core Real Estate
• Absolute Return (Liquid Multi-Asset/GTAA)
– Benchmark: 60% Equity (MSCI All Country World IMI) and 40% Bonds (Barclays US Aggregate Bond Index).
– Composition: No perfect benchmark exists for GTAA managers; we use a continuously rebalanced portfolio of 60% Equity and 40% Bonds is an appropriate proxy.
• Real Asset/Diversified Inflation Strategies
– Benchmark: RVK Custom Diversified Inflation Strategies Index – Composition: Equal allocations to TIPs, broad commodities, and global REITs.
48

Summary of Inflows/Outflows Assumptions
With input from Staff, the following assumptions are used in the modeling of the
inflows and outflows for the PTFs.
FYE 2013
Common
Schools
Other 12
PTFs in
Aggregate
Assumption Utilized in Modeling
Surface Income $5.1 million $672,000 3.5% increase in surface rents each year going forward.
Minerals Income $500,000 $20,000 Remain flat going forward.
Royalty $135.3 million $11.7 million 40% increase in 2013; 10% increase in 2014; 5% increase in 2015, 2016 and 2017; flat thereafter.
Bonus $60.6 million $7.3 million Common School: $12 million per year, no increase. Other PTFs: 12.5% of Common ($1.5 million).
Oil Extraction Tax (OET) $81.9 million -- 40% increase in 2013; 10% increase in 2014; 5% increase in 2015, 2016 and 2017; flat thereafter.
Tobacco $9.0 million -- $9 million per year through 2025.
Unclaimed Property $3.2 million -- $3 million per year; no growth assumed.
Main Expense ($1.5 million) ($156,000) Increase by 25% for the next 1-year; increasing by 5% per year thereafter.
Distribution ($46.3 million) ($3.0 million) Calculated as the biennial distribution of 10% of the 5-year moving average (paid 5% per year of the biennial)
with a 1-year lag.
TOTAL $247.8 million $16.5 million
49

Efficient Frontier
• The blue efficient frontier includes the asset classes currently utilized by North Dakota Board.
• The green efficient frontier includes a broader fixed income menu, international small cap, emerging market debt/equity, GTAA/liquid multi-asset, and diversified inflation strategies.
Note: Current Allocation represents the current target allocation of North Dakota Board as of 3/31/13.
50
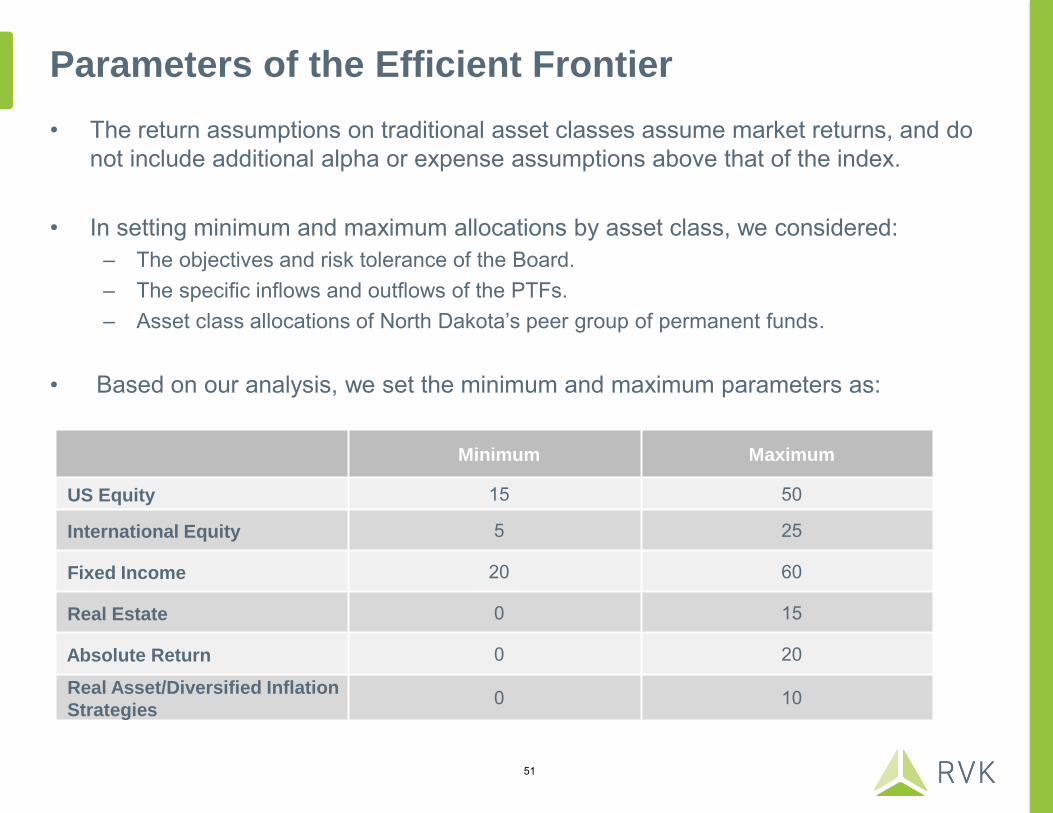
Parameters of the Efficient Frontier
• The return assumptions on traditional asset classes assume market returns, and do not include additional alpha or expense assumptions above that of the index.
• In setting minimum and maximum allocations by asset class, we considered: – The objectives and risk tolerance of the Board. – The specific inflows and outflows of the PTFs. – Asset class allocations of North Dakota’s peer group of permanent funds.
• Based on our analysis, we set the minimum and maximum parameters as:
• Based on our analysis, we set the minimum and maximum parameters as:
• Based on our analysis, we set the minimum and maximum parameters as:
Minimum Maximum
US Equity 15 50
International Equity 5 25
Fixed Income 20 60
Real Estate 0 15
Absolute Return 0 20
Real Asset/Diversified Inflation
Strategies 0 10
51

Parameters of the Efficient Frontier
• Further, we set the following parameters on thematic classifications:
– Capital Appreciation: • Includes: US Equity, International Equity, High Yield, Emerging Markets Debt, and Non-
Core Real Estate • Minimum: 25%; Maximum: 80%
– Capital Preservation:
• Includes: Core Fixed Income and Bank Loans • Minimum: 17%; Maximum: 55%
– Alpha:
• Includes: Absolute Return (Liquid Alternatives/GTAA) • Minimum: 0%; Maximum: 20%
– Inflation:
• Includes: Core Real Estate and TIPs • Minimum: 0%; Maximum: 20%
52

North Dakota Board Efficient Allocations
53
I Min !lola_-,; 1 2 I 3 I 4 5 I 6 7 I 8 I 9 I 10 Current Potential
Allocation Target
US Equity 15 50 15 15 15 15 15 19 27 15 15 15 31 17
International Equity 15 50 15 15 15 15 15 15 15 31 40 50 12 15
Fixed Income 20 50 50 47 41 35 27 21 20 20 20 20 49 23
Real Estate 0 15 7 12 14 15 15 15 15 15 15 15 8 15
Absolute Return 0 20 13 11 14 20 20 20 20 19 10 0 0 20
Real Asset/Inflation Hedge 0 10 0 0 0 0 8 10 3 0 0 0 0 10
Total 100 100 100 100 100 100 100 100 100 100 100 100
Capital Appreciation 41 43 43 43 42 44 52 56 66 76 55 43
Capital Preservation 43 40 35 30 23 18 17 17 17 17 42 20
Alpha 13 11 14 20 20 20 20 19 10 0 0 20
Inflation 4 6 7 8 16 18 11 8 8 8 4 18
Upecred Return 5.91 6n9 6.27 6.46 6.64 6.83 7ni 7.20 7.38 156 6n8 6.76
Risk (Standard Deviation) 8.65 8.78 8.98 9.20 9.69 10.24 10.87 11.74 13no 14.31 9.91 wn4
Return (Compound) 5.56 5.73 5.89 6.06 6.20 6.34 6.46 6.56 6. 60 6.62 5.62 6.29
Retum!R.isk Ratio 0.68 0.69 0.70 0.70 0.69 0.67 0.64 0.61 0.57 0.53 0.61 0.67
RVK Expected Eq Beta (LC US Eq = 1) 0.38 0.39 0.40 0.41 0.44 0.48 0.53 0.55 0.62 0.69 0.49 0.47
RVK Liquidity Metric (T -Bills = 1 00) 69 67 64 62 60 61 64 65 70 76 77 60

Projected Market Values
• The following slides compare the projected market value, or projected total assets based on the modeling output, of the Common Schools PTF under various time frames and various asset allocation targets.
• The projected market values include the assumptions on inflows and outflows for
Common Schools as previously outlined.t • We consider the following asset allocation targets:
– Current Allocation: Current broad asset class allocation of the PTF. – Efficient Portfolio 3: Portfolio is more conservative than current allocations. – Efficient Portfolio 6: Portfolio has similar risk to the current allocations. – Efficient Portfolio 9: Portfolio is more aggressive than current allocations.
54

Projected Market Values – Year 5
Current Allocation Efficient Portfolio 3 Efficient Portfolio 6 Efficient Portfolio 9
5th $3,121 $3,286 $3,302 $2,995
25th $3,753 $3,846 $3,890 $3,783
Median $4,197 $4,246 $4,327 $4,366
75th $4,654 $4,659 $4,770 $5,006
95th $5,405 $5,275 $5,465 $6,054
$2,500
$3,000
$3,500
$4,000
$4,500
$5,000
$5,500
$6,000
$6,500
Current Allocation Efficient Portfolio 3 Efficient Portfolio 6 Efficient Portfolio 9
Mill
ion
s
Projected Market Value Year 5
55

Projected Market Values – Year 10
Current Allocation Efficient Portfolio 3 Efficient Portfolio 6 Efficient Portfolio 9
5th $4,507 $4,826 $4,901 $4,314
25th $5,832 $6,020 $6,189 $5,967
Median $6,785 $6,911 $7,148 $7,269
75th $7,823 $7,819 $8,163 $8,792
95th $9,671 $9,420 $9,980 $11,544
$5,000
$10,000
$15,000
$20,000
$25,000
$30,000
Current Allocation Efficient Portfolio 3 Efficient Portfolio 6 Efficient Portfolio 9
Mill
ion
s
Projected Market Value Year 10
56

Projected Market Values – Year 20
Current Allocation Efficient Portfolio 3 Efficient Portfolio 6 Efficient Portfolio 9
5th $7,072 $7,751 $8,098 $6,812
25th $9,894 $10,543 $11,110 $10,649
Median $12,291 $12,715 $13,589 $14,030
75th $15,180 $15,248 $16,498 $18,486
95th $20,321 $19,641 $21,747 $27,106
$5,000
$10,000
$15,000
$20,000
$25,000
$30,000
Current Allocation Efficient Portfolio 3 Efficient Portfolio 6 Efficient Portfolio 9
Mill
ion
s
Projected Market Value Year 20
57

Projected Market Values Summary
Current Allocation Efficient
Portfolio 3
Efficient
Portfolio 6
Efficient
Portfolio 9
5th Percentile $7,072 $7,751 $8,098 $6,812
50th Percentile $12,291 $12,715 $13,589 $14,030
95th Percentile $20,321 $19,641 $21,747 $27,106
58
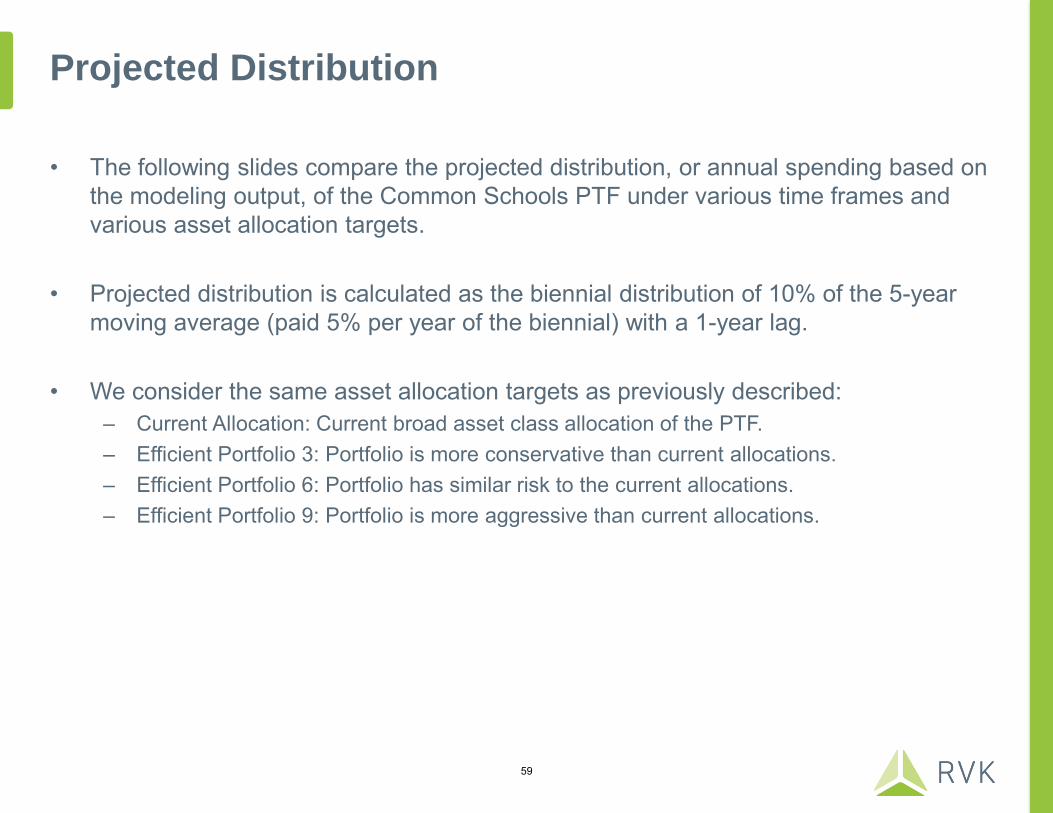
Projected Distribution
• The following slides compare the projected distribution, or annual spending based on
the modeling output, of the Common Schools PTF under various time frames and various asset allocation targets.
• Projected distribution is calculated as the biennial distribution of 10% of the 5-year moving average (paid 5% per year of the biennial) with a 1-year lag.
• We consider the same asset allocation targets as previously described: – Current Allocation: Current broad asset class allocation of the PTF. – Efficient Portfolio 3: Portfolio is more conservative than current allocations. – Efficient Portfolio 6: Portfolio has similar risk to the current allocations. – Efficient Portfolio 9: Portfolio is more aggressive than current allocations.
59

Projected Distribution – Year 5
$120
$130
$140
$150
$160
$170
$180
$190
$200
$210
$220
Current Allocation Efficient Portfolio 3 Efficient Portfolio 6 Efficient Portfolio 9
Mill
ion
s
Projected Distribution Year 5
Current Allocation Efficient Portfolio 3 Efficient Portfolio 6 Efficient Portfolio 9
5th $132 $136 $137 $129
25th $149 $152 $154 $151
Median $162 $163 $165 $166
75th $174 $174 $177 $184
95th $194 $191 $195 $211
60

Projected Distribution – Year 10
Current Allocation Efficient Portfolio 3 Efficient Portfolio 6 Efficient Portfolio 9
5th $192 $201 $204 $185
25th $233 $239 $244 $238
Median $261 $265 $272 $276
75th $292 $292 $302 $320
95th $344 $337 $353 $395
$150
$200
$250
$300
$350
$400
Current Allocation Efficient Portfolio 3 Efficient Portfolio 6 Efficient Portfolio 9
Mill
ion
s
Projected Distribution Year 10
61

Projected Distribution – Year 20
Current Allocation Efficient Portfolio 3 Efficient Portfolio 6 Efficient Portfolio 9
5th $324 $351 $364 $314
25th $440 $464 $484 $468
Median $533 $549 $580 $600
75th $640 $643 $687 $758
95th $831 $806 $878 $1,074
$300
$400
$500
$600
$700
$800
$900
$1,000
$1,100
Current Allocation Efficient Portfolio 3 Efficient Portfolio 6 Efficient Portfolio 9
Mill
ion
s
Projected Distribution Year 20
62

Projected Distribution Summary
Current Allocation Efficient
Portfolio 3
Efficient
Portfolio 6
Efficient
Portfolio 9
5th Percentile $324 $351 $364 $314
50th Percentile $533 $549 $580 $600
95th Percentile $831 $806 $878 $1,074
63

Asset Allocation Modeling Summary
• Broadening the diversification of the portfolio through investments in Absolute Return and Real Asset/Diversified Inflation Strategies can decrease portfolio volatility while maintaining similar levels of return to the current allocation, or increase expected returns while maintaining similar levels of risk.
• Based on our analysis, broad asset class allocations similar to portfolio 6 increase the return expectations of the portfolio without increasing the portfolio volatility.
• Projected future market values for portfolio 6 as well as the worst-case projections compare favorably to the current asset mix.
• Projected future distributions for portfolio 6 as well as the worst-case projections for distributions compare favorably to the current asset mix.
• If the Land Board believes that if the PTFs can withstand higher levels of volatility, then the Board may want to consider portfolios 7-9.
• Based on our analysis, broad asset class allocations similar to portfolio 6 increase the return expectations of the portfolio without increasing the portfolio volatility.
• Projected future market values for portfolio 6 as well as the worst-case projections compare favorably to the current asset mix.
• Projected future distributions for portfolio 6 as well as the worst-case projections for distributions compare favorably to the current as mix. 364
64

Asset Allocation Modeling – Other
12 PTFs
Asset Allocation Modeling for 12 PTFs
• As the main objectives and constraints of the other 12 PTFs are identical to that of Common Schools, we recommend that identical strategic asset allocation targets be set across all PTFs.
• Our recommendation confirms continuation of the pooling of investments as it is
currently structured in managing assets across Common Schools and the other PTFs. • The only difference in our modeling, is the effect the cash inflows and outflows have
on projected market value and distribution as previously outlined.
• Our recommendation confirms continuation of the pooling of investments as it is currently structured in managing assets across Common Schools and the other PTFs.
• The only difference in our modeling, is the effect the cash inflows and outflows have on projected market value and distribution as previously outlined.
66

Projected Market Values – Year 5
$150
$200
$250
$300
$350
$400
Current Allocation Efficient Portfolio 3 Efficient Portfolio 6 Efficient Portfolio 9
Mill
ion
s
Projected Market Value Year 5
Current Allocation Efficient Portfolio 3 Efficient Portfolio 6 Efficient Portfolio 9
5th $191 $201 $202 $183 25th $231 $237 $240 $233
Median $260 $263 $268 $271 75th $289 $289 $296 $312 95th $338 $329 $341 $379
67

Projected Market Values – Year 10
$200
$250
$300
$350
$400
$450
$500
$550
$600
$650
$700
Current Allocation Efficient Portfolio 3 Efficient Portfolio 6 Efficient Portfolio 9
Mill
ion
s
Projected Market Value Year 10
Current Allocation Efficient Portfolio 3 Efficient Portfolio 6 Efficient Portfolio 9
5th $264 $283 $287 $252
25th $344 $357 $367 $353
Median $403 $411 $426 $433
75th $467 $468 $489 $528
95th $585 $568 $601 $699
68
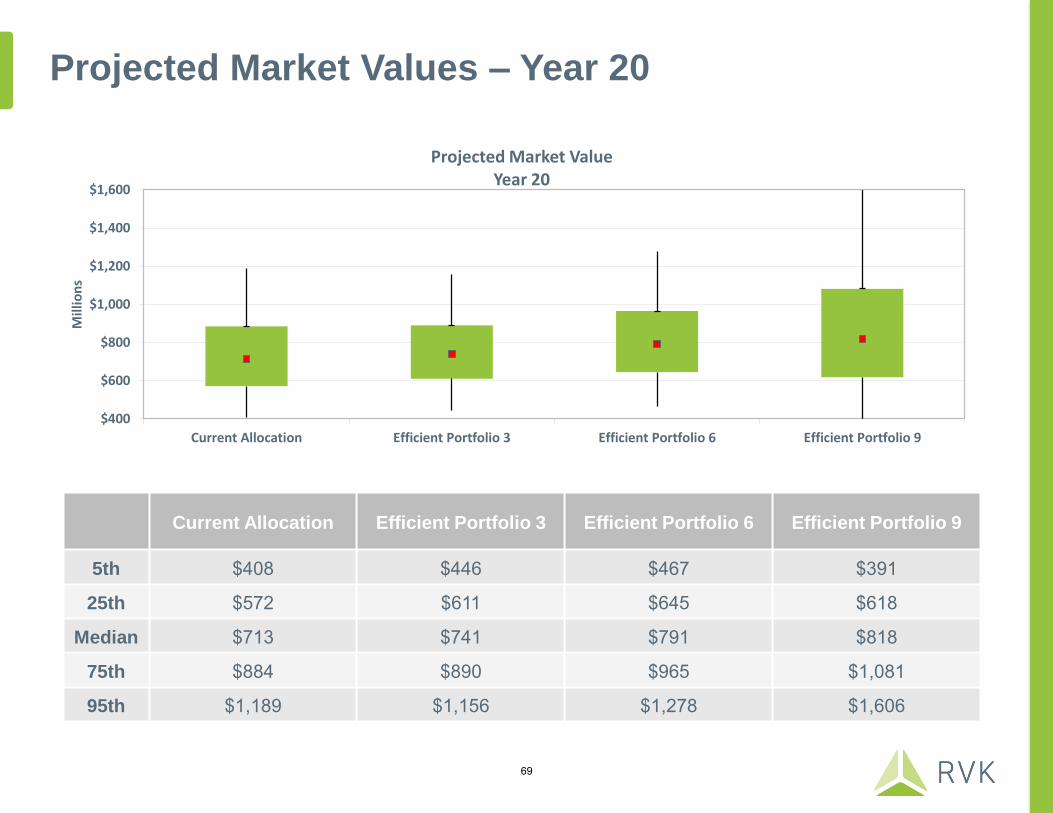
Projected Market Values – Year 20
$400
$600
$800
$1,000
$1,200
$1,400
$1,600
Current Allocation Efficient Portfolio 3 Efficient Portfolio 6 Efficient Portfolio 9
Mill
ion
s
Projected Market Value Year 20
Current Allocation Efficient Portfolio 3 Efficient Portfolio 6 Efficient Portfolio 9
5th $408 $446 $467 $391
25th $572 $611 $645 $618
Median $713 $741 $791 $818
75th $884 $890 $965 $1,081
95th $1,189 $1,156 $1,278 $1,606
69

Projected Market Values Summary
Current Allocation Efficient
Portfolio 3
Efficient
Portfolio 6
Efficient
Portfolio 9
5th Percentile $408 $446 $467 $391
50th Percentile $713 $741 $791 $818
95th Percentile $1,189 $1,156 $1,278 $1,606
70

Projected Distribution – Year 5
$8
$9
$10
$11
$12
$13
$14
Current Allocation Efficient Portfolio 3 Efficient Portfolio 6 Efficient Portfolio 9
Mill
ion
s
Projected Distribution Year 5
Current Allocation Efficient Portfolio 3 Efficient Portfolio 6 Efficient Portfolio 9
5th $8 $9 $9 $8 25th $9 $10 $10 $10
Median $10 $10 $10 $11 75th $11 $11 $11 $12 95th $12 $12 $12 $13
71

Projected Distribution – Year 10
$10
$12
$14
$16
$18
$20
$22
$24
$26
Current Allocation Efficient Portfolio 3 Efficient Portfolio 6 Efficient Portfolio 9
Mill
ion
s
Projected Distribution Year 10
Current Allocation Efficient Portfolio 3 Efficient Portfolio 6 Efficient Portfolio 9
5th $11 $12 $12 $11 25th $14 $14 $15 $14
Median $16 $16 $16 $17 75th $18 $18 $18 $20
95th $21 $21 $22 $24
72

Projected Distribution – Year 20
$15
$20
$25
$30
$35
$40
$45
$50
$55
$60
$65
Current Allocation Efficient Portfolio 3 Efficient Portfolio 6 Efficient Portfolio 9
Mill
ion
s
Projected Distribution Year 20
Current Allocation Efficient Portfolio 3 Efficient Portfolio 6 Efficient Portfolio 9
5th $19 $20 $21 $18
25th $26 $27 $28 $27
Median $31 $32 $34 $35
75th $37 $38 $40 $45
95th $49 $48 $52 $64
73

Projected Distribution Summary
Current Allocation Efficient
Portfolio 3
Efficient
Portfolio 6
Efficient
Portfolio 9
5th Percentile $19 $20 $21 $18
50th Percentile $31 $32 $34 $35
95th Percentile $49 $48 $52 $64
74

Disclaimer of Warranties and Limitation of Liability - This document was prepared by RVK, Inc. (RVK) and may include information and data from some or all of the following sources: client staff; custodian banks; investment managers; specialty investment consultants; actuaries; plan administrators/record-keepers; index providers; as well as other third-party sources as directed by the client or as we believe necessary or appropriate. RVK has taken reasonable care to ensure the accuracy of the information or data, but makes no warranties and disclaims responsibility for the accuracy or completeness of information or data provided or methodologies employed by any external source. This document is provided for the client’s internal use only and does not constitute a recommendation by RVK or an offer of, or a solicitation for, any particular security and it is not intended to convey any guarantees as to the future performance of the investment products, asset classes, or capital markets. August 20, 2015