south dakota agricultural land market trends, 1991 – 2016 · south dakota agricultural land...
TRANSCRIPT
Page 1 iGrow.org | A Service of SDSU Extension | © 2016, South Dakota Board of Regents
Summary The 2016 SDSU Farm Real Estate Market Survey report contains information on current agricultural land values and cash rental rates by land use in different regions of South Dakota. The key findings and comparisons to values from earlier years are highlighted below.
• Agricultural land value changes in the past year reflect the sharp declines in crop prices and returns compared to prices and returns for beef cattle. From 2015 to 2016, all agricultural land values decreased by 2.4%, compared to an increase of 1.4% from the year before and increases varying from 6% to 33.6% for the prior three years. Cropland values decreased by 4% this past year compared to a decrease of 4.8% from 2014 to 2015. Annual increases varied from 5.4% to 37.8% in the prior three years. In 2016 rangeland and pasture values increased by 2.9%. This was down from the double digit increases in rangeland and pasture values in previous years.
• Cash rental rates for cropland and hayland declined in several regions statewide, while cash rental rates for pasture/rangeland increased in many regions. From 2015 to 2016, average statewide cash rental rates decreased $4.00 per-acre for cropland, increased $2.15 for hayland, and decreased $1.88 for rangeland. Cash rental rates for pasture/rangeland increased in the Southeast, East-central, Northeast, North-central, and Central regions. Pasture rental rates in the Western regions decreased. Cropland cash rental rates declined
in all regions, except the North-central which increased $9.36 per-acre.
• Current average rates of return on agricultural land in South Dakota remain very low.For 2016 the average ratio of gross cash rent to current land value was 2.7% for all agricultural land, 3.3% for cropland, 3.3% for hayland and 2.4% for rangeland. During the 1990s, the same ratios were 7.4% for all agricultural land, 8.0% for cropland, and 6.8% for rangeland.
• Agricultural land values and average cash rental rates differ greatly by region and land use. Per-acre values and cash rental rates in each region were highest for irrigated land, followed by non-irrigated cropland, hayland, tame pasture, and native rangeland. For each land use, per-acre land values and cash rental rates were highest in the East-central or Southeast regions and lowest in the western regions of South Dakota.
The average value of non-irrigated all agricultural land (as of February 2016) in South Dakota was $2,444 per-acre. Non-irrigated agricultural land varies from $5,069 per-acre in the East-central region to $827 per-acre in the Southwest region. Average non-irrigated cropland values varied from $6,116 per-acre in the East-central to $1,187 per-acre in the Northwest region.
Within each region, differences in land productivity and land use accounted for substantial differences in per-acre values. In 2016 rangeland value varied from $2,781 per-acre in the East-central to $715 per-acre in the Southwest.
South Dakota Agricultural Land Market Trends, 1991 – 2016:Results from the 2016 SDSU South Dakota Farm Real Estate Survey
Jack Davis | SDSU Extension Crops Business Management Field Specialist Shannon Sand | SDSU Extension Livestock Business Management Field Specialist
agronomySDSU DEPARTMENT OF
ECONOMICSJULY 2016
iGrow.org
Page 2 iGrow.org | A Service of SDSU Extension | © 2016, South Dakota Board of Regents
| agronomy
The highest non-irrigated cropland values and cash rental rates continued to occur in the Minnehaha-Moody county cluster where the average value of cropland in 2016 is $8,262 per-acre and average cash rental rate for cropland is $288 per-acre. Cropland values average $6,684 per-acre and cropland cash rental rates average $233 per-acre in the Clay-Lincoln-Turner-Union county cluster.
At the regional level, average cash rental rates per-acre for non-irrigated cropland in 2016 vary from $201 in the East-central region to $43 in the Southwest region. Average rangeland and pasture rental rates vary from $81 per-acre in the Southeast region to $14.31 per-acre in the Southwest region.
• The longer-term trends in land values, cash rental rates, and cash rates of return are closely related to key economic factors affecting demand for agricultural land. These factors include economies of size, net farm income, agricultural productivity, and land as an investment. Specific factors important in South Dakota include:1. technology changes in agriculture that
expanded the geographic range of corn and soybean production, along with the rapid development of ethanol production in South Dakota,
2. sharp declines in farm mortgage interest rates from early 2001 to late 2004 and continued relatively low mortgage interest rates,
3. general economic conditions of low inflation rates in most years,
4. persistence of farm expansion, through land purchases or leasing, as the major response to pervasive economies of size in production agriculture,
5. continued use of crop insurance for yield or revenue protection along with other federal farm program provisions.
From 1991 to 2014, agricultural land values increased more rapidly than the rate of general price inflation in all regions of South Dakota. Continued increases in cash rental rates
provided underlying support for increases in land values. These basic economic factors, along with relatively low mortgage interest rates, attracted investors in farmland and farmers expanding their own operations. During the past year, 2015 to 2016, land values and cash rental rates by land use were greatly affected by the sharp declines in commodity prices.
• Farm expansion and investment potential continue to be cited as the major reasons for purchasing farmland. The major reasons for selling farmland are realizing gains from high sale prices, settling estates, and retirement from farming.Low mortgage interest rates, high livestock prices, and relatively good crop yields were the three most cited positive factors in the farmland market. Declining crop prices dominated the negative factors influencing the farm real estate market. Rising input costs and economic uncertainty, including interest rate risks, were other negative factors.
• The booming market psychology of recent years, especially for cropland, has been replaced by concerns on adjusting cash rents and land purchase prices to declining crop prices and prospective returns. Respondents remain somewhat more optimistic about rangeland markets.More than half of respondents forecast decreases in cropland values for next year, while one-half of respondents forecast increases in rangeland values. There is a lot of concern that cropland values and cash rental rates will decline further. For rangeland values and cash rental rates respondents forecast prices will remain the same or decrease slightly
South Dakota Farmland Market Trends, 1991 - 2016 Introduction The 2016 SDSU Farm Real Estate Market Survey is the 26th annual survey of agricultural land values and cash rental rates by land use and quality in different
Page 3 iGrow.org | A Service of SDSU Extension | © 2016, South Dakota Board of Regents
| agronomy
regions of South Dakota. Reported are results of the survey and a discussion of factors influencing buyer/seller decisions and positive/negative factors impacting farmland markets. The publication of the survey findings was in response to numerous requests by farmland owners, renters, appraisers, lenders, buyers, and others for detailed information on South Dakota farmland markets.
The 2016 estimates are based on reports from 1961 responses to the 2016 SDSU survey. Responses are from agricultural lenders, Farm Service Agency officials, rural appraisers, assessors, realtors, professional farm managers, and Extension field specialists. All are familiar with farm real estate market trends in their localities. The number of responses for 2016 are the lowest total responses during the past 26 years.
Copies of the SDSU survey were mailed in February and March 2016. The surveys requested information on cash rental rates and agricultural land values as of February 2016. Response characteristics and estimation procedures are discussed in Appendix I.
Results are presented in a format similar to SDSU farmland market reports published in prior years (1991 to 2015). Regional information on land values and cash rent by land use (crop, hay, range, and pasture)2 is emphasized in each of these SDSU reports. Current-year findings are compared to those of earlier years. This report contains an overview and may or may not reflect actual land values or cash rental rates unique to specific localities or properties. Readers should use this report as a general reference and rely on local sources for more specific details.
Most renters, buyers, and sellers of farmland continue to be local area residents, although there is considerable outside interest in recent years. Land market trends are influenced by changing conditions in agriculture and the general economy and strongly influenced by land market participants’ expectations of
future trends and availability of debt or equity financing.
South Dakota Agricultural Economic Conditions The agricultural commodity price trends continue to be a major economic factor influencing in recent years South Dakota agricultural land market conditions. From 2012 to 2016 cash prices received for corn decreased approximately 52%, while farm-level soybean and wheat prices each decreased more than 40%. Calf prices are down over $1.00 per cwt from their peak in 2015. Crop input costs have decreased slightly from their peak in 2013. The sharp decreases in crop prices and slower decrease in crop input prices have continued to pressure crop production margins and farm profitability. South Dakota crop farmers and ranchers have experienced declines in net farm income. The reduction in crop production margins and livestock profitability is reflected in this year’s demand for land. (USDA-NASS, 2015).
Favorable weather conditions and record crop yields in 2015 caused grain commodity prices to continue their retreat from the highs of 2012. From August 2012 to August 2015, farm-level corn prices decreased more than 52%, soybeans fell approximately 42%, and wheat was off more than 40%. Cattle prices have decreased from their highs in 2015 and are similar to prices received in 2012. If farm profitability continues to decline land values could see continued decreases into 2017 and beyond. This year’s survey results are a reflection of the decreased farm profits.
A negative factor influencing farmland and cash rent values has been recent agricultural credit conditions. According to the Minneapolis Federal Reserve (Agricultural Credit Conditions Survey, July 2015), farm mortgage interest rates remain low – generally less than 5.2% for fixed term loans and 4.7% for variable rate loans. Surveyed lenders expect renewals and collateral requirements to increase in 2016, while farm incomes and capital spending decreased in 2015.
1 Responses are the number of survey schedules completed for one or two counties. A growing number of respondents completed separate survey schedules for
different counties. Each completed survey schedule was treated as a survey response. More details are provided in Appendix 1.
2 A major purpose of this survey is to report land values and cash rental rates by major uses of privately owned agricultural land, excluding farm building sites. The
major non-irrigated land uses reported are crops, hay, tame pasture, and rangeland. Rangeland is native grass pasture while tame pasture is seeded to introduce
grasses. Agricultural land typically used for production of alfalfa hay, other tame hay, or native hay is considered hayland in this report. Cropland is agricultural land
typically used for crop production other than hay production. Irrigated crop/hayland values and cash rental rates are also reported in selected regions. These major
land uses comprise nearly 98% of privately owned land in farms in South Dakota (Janssen, 1999).
Page 4 iGrow.org | A Service of SDSU Extension | © 2016, South Dakota Board of Regents
| agronomy
South Dakota’s economy has continued to recover from the national recession with unemployment rates declining from 5.2% in January 2010 to 2.5% in May 2016. Personal income in the state was unchanged from 2014 to 2015. Farm earning declines have contributed to zero personal income growth. Further information about the South Dakota general economy can be obtained from the U.S. Dept. of Commerce – Bureau of Economic Analysis and U.S. Dept. of Labor – Bureau of Labor Statistics.
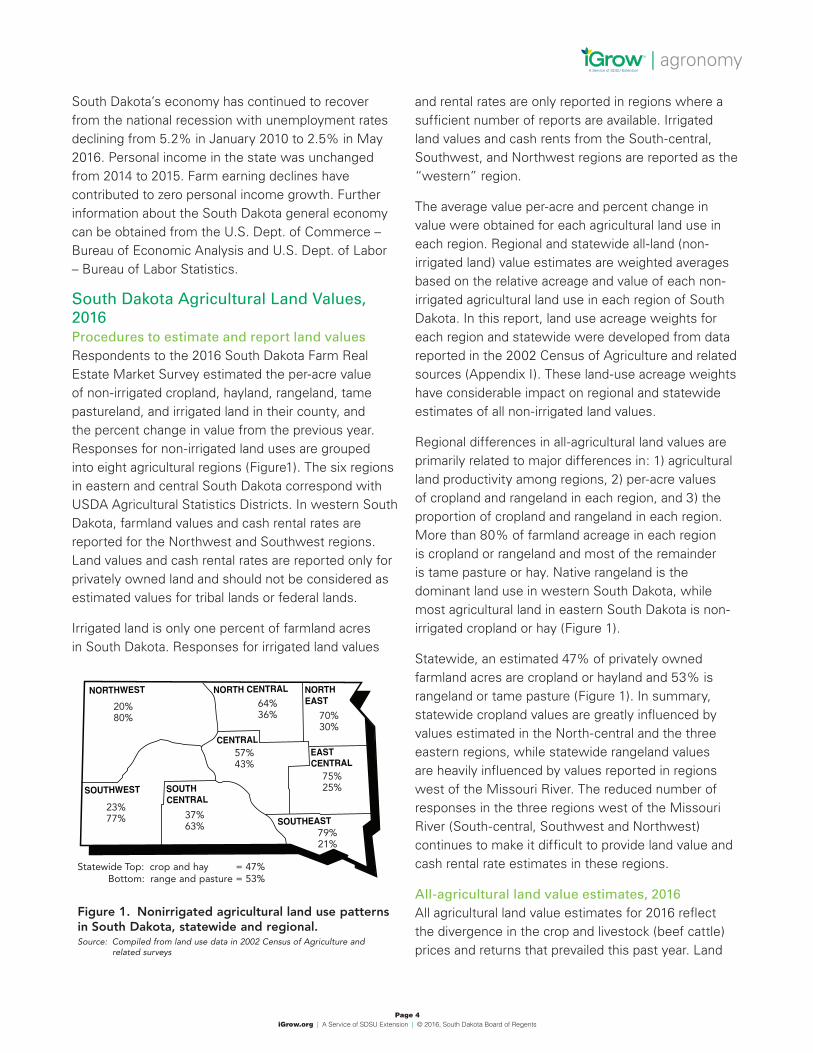
South Dakota Agricultural Land Values, 2016Procedures to estimate and report land values Respondents to the 2016 South Dakota Farm Real Estate Market Survey estimated the per-acre value of non-irrigated cropland, hayland, rangeland, tame pastureland, and irrigated land in their county, and the percent change in value from the previous year. Responses for non-irrigated land uses are grouped into eight agricultural regions (Figure1). The six regions in eastern and central South Dakota correspond with USDA Agricultural Statistics Districts. In western South Dakota, farmland values and cash rental rates are reported for the Northwest and Southwest regions. Land values and cash rental rates are reported only for privately owned land and should not be considered as estimated values for tribal lands or federal lands.
Irrigated land is only one percent of farmland acres in South Dakota. Responses for irrigated land values
and rental rates are only reported in regions where a sufficient number of reports are available. Irrigated land values and cash rents from the South-central, Southwest, and Northwest regions are reported as the “western” region.
The average value per-acre and percent change in value were obtained for each agricultural land use in each region. Regional and statewide all-land (non-irrigated land) value estimates are weighted averages based on the relative acreage and value of each non-irrigated agricultural land use in each region of South Dakota. In this report, land use acreage weights for each region and statewide were developed from data reported in the 2002 Census of Agriculture and related sources (Appendix I). These land-use acreage weights have considerable impact on regional and statewide estimates of all non-irrigated land values.
Regional differences in all-agricultural land values are primarily related to major differences in: 1) agricultural land productivity among regions, 2) per-acre values of cropland and rangeland in each region, and 3) the proportion of cropland and rangeland in each region. More than 80% of farmland acreage in each region is cropland or rangeland and most of the remainder is tame pasture or hay. Native rangeland is the dominant land use in western South Dakota, while most agricultural land in eastern South Dakota is non-irrigated cropland or hay (Figure 1).
Statewide, an estimated 47% of privately owned farmland acres are cropland or hayland and 53% is rangeland or tame pasture (Figure 1). In summary, statewide cropland values are greatly influenced by values estimated in the North-central and the three eastern regions, while statewide rangeland values are heavily influenced by values reported in regions west of the Missouri River. The reduced number of responses in the three regions west of the Missouri River (South-central, Southwest and Northwest) continues to make it difficult to provide land value and cash rental rate estimates in these regions.
All-agricultural land value estimates, 2016 All agricultural land value estimates for 2016 reflect the divergence in the crop and livestock (beef cattle) prices and returns that prevailed this past year. Land
Figure 1. Nonirrigated agricultural land use patterns in South Dakota, statewide and regional.
20%80%
23%77% 37%
63%
64%36%
57%43%
70%30%
75%25%
79%21%
Statewide Top: crop and hay = 47%Bottom: range and pasture = 53%
Source: Compiled from land use data in 2002 Census of Agriculture and related surveys
Page 5 iGrow.org | A Service of SDSU Extension | © 2016, South Dakota Board of Regents
| agronomy
value declines have occurred for cropland throughout the state. While areas in the Central and Northwest experienced increases for rangeland values.
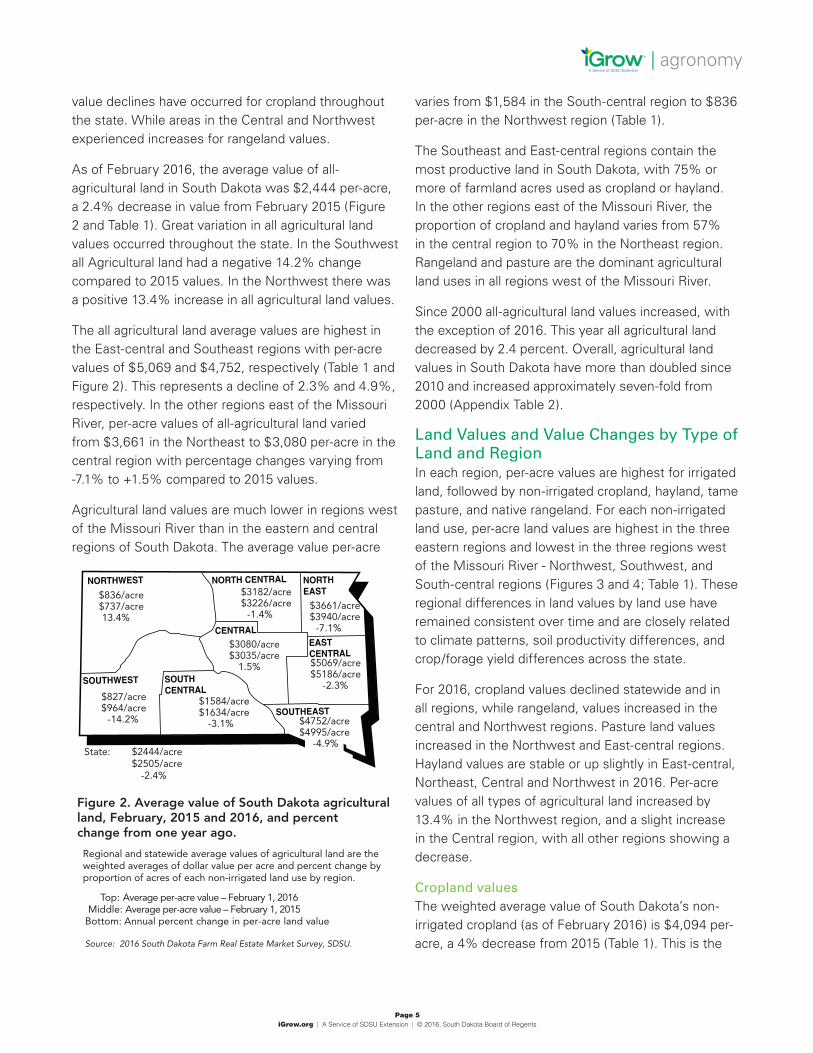
As of February 2016, the average value of all-agricultural land in South Dakota was $2,444 per-acre, a 2.4% decrease in value from February 2015 (Figure 2 and Table 1). Great variation in all agricultural land values occurred throughout the state. In the Southwest all Agricultural land had a negative 14.2% change compared to 2015 values. In the Northwest there was a positive 13.4% increase in all agricultural land values.
The all agricultural land average values are highest in the East-central and Southeast regions with per-acre values of $5,069 and $4,752, respectively (Table 1 and Figure 2). This represents a decline of 2.3% and 4.9%, respectively. In the other regions east of the Missouri River, per-acre values of all-agricultural land varied from $3,661 in the Northeast to $3,080 per-acre in the central region with percentage changes varying from -7.1% to +1.5% compared to 2015 values.
Agricultural land values are much lower in regions west of the Missouri River than in the eastern and central regions of South Dakota. The average value per-acre
varies from $1,584 in the South-central region to $836 per-acre in the Northwest region (Table 1).
The Southeast and East-central regions contain the most productive land in South Dakota, with 75% or more of farmland acres used as cropland or hayland. In the other regions east of the Missouri River, the proportion of cropland and hayland varies from 57% in the central region to 70% in the Northeast region. Rangeland and pasture are the dominant agricultural land uses in all regions west of the Missouri River.
Since 2000 all-agricultural land values increased, with the exception of 2016. This year all agricultural land decreased by 2.4 percent. Overall, agricultural land values in South Dakota have more than doubled since 2010 and increased approximately seven-fold from 2000 (Appendix Table 2).
Land Values and Value Changes by Type of Land and Region In each region, per-acre values are highest for irrigated land, followed by non-irrigated cropland, hayland, tame pasture, and native rangeland. For each non-irrigated land use, per-acre land values are highest in the three eastern regions and lowest in the three regions west of the Missouri River - Northwest, Southwest, and South-central regions (Figures 3 and 4; Table 1). These regional differences in land values by land use have remained consistent over time and are closely related to climate patterns, soil productivity differences, and crop/forage yield differences across the state.
For 2016, cropland values declined statewide and in all regions, while rangeland, values increased in the central and Northwest regions. Pasture land values increased in the Northwest and East-central regions. Hayland values are stable or up slightly in East-central, Northeast, Central and Northwest in 2016. Per-acre values of all types of agricultural land increased by 13.4% in the Northwest region, and a slight increase in the Central region, with all other regions showing a decrease.
Cropland values The weighted average value of South Dakota’s non-irrigated cropland (as of February 2016) is $4,094 per-acre, a 4% decrease from 2015 (Table 1). This is the
Figure 2. Average value of South Dakota agricultural land, February, 2015 and 2016, and percent change from one year ago.
$836/acre$737/acre13.4%
$3182/acre$3226/acre
-1.4%$3661/acre$3940/acre
-7.1%
$5069/acre$5186/acre
-2.3%
$3080/acre$3035/acre
1.5%
$1584/acre$1634/acre
-3.1%
$827/acre$964/acre
-14.2% $4752/acre$4995/acre
-4.9%
Top: Average per-acre value – February 1, 2016Middle: Average per-acre value – February 1, 2015
Bottom: Annual percent change in per-acre land value
Source: 2016 South Dakota Farm Real Estate Market Survey, SDSU.
State: $2444/acre$2505/acre
-2.4%
Regional and statewide average values of agricultural land are the weighted averages of dollar value per acre and percent change by proportion of acres of each non-irrigated land use by region.

Page 6 iGrow.org | A Service of SDSU Extension | © 2016, South Dakota Board of Regents
| agronomy
Table 1. Average reported value and annual percentage change in value of South Dakotaagricultural land by type of land by region, February 2011-2016.
Type of LandSouth-
eastEast-
CentralNorth-east
North-Central
CentralSouth-Central
South-west
North-west
STATE
dollars per acre
All Agricultural Land (nonirrigated)
Average value, 2016Average value, 2015Average value, 2014Average value, 2013Average value, 2012Average value, 2011Annual % change 16/15
475249955385495440142900-4.9%
506951865763550438903332-2.3%
366139403962368425872274-7.1%
318232263319321723251720-1.4%
3080303529312678225714501.5%
1584163414611294917781
-3.1%
827964620606461459
-14.2%
836737512536369342
13.4%
244425052470232817421374
-2.4%
Nonirrigated Cropland
Average value, 2016Average value, 2015Average value, 2014Average value, 2013Average value, 2012Average value, 2011Annual % change 16/15
565358876331590348173402-4.0%
611663297114682847344024-3.4%
461350665291484333692918-8.9%
417742754614456230262301-2.3%
384338953953358029461866-1.3%
216822832087199413481115
-5.0%
12641347820900677625
-6.2%
11871193870792496483
-0.5%
409442654478424930842389-4.0%
Rangeland (native)
Average value, 2016Average value, 2015Average value, 2014Average value, 2013Average value, 2012Average value, 2011Annual % change 16/15
256627192698230819301589-5.6%
2781272728612765210817792.0%
202821361859175913451217
-5.1%
19571758160014731387950
11.3%
2219210018281636149310115.7%
133013381187994724634
-0.6%
715851571529401409
-16.0%
760630436444341309
20.6%
12221187987909737611
2.9%
Pasture (tame, improved)
Average value, 2016Average value, 2015Average value, 2014Average value, 2013Average value, 2012Average value, 2011Annual % change 16/15
281129452968272122751726-4.6%
2988290830983176237120822.8%
230925452244207416781494-9.3%
206722241958177815501161-7.1%
232025572220222217721179
-9.3%
1431150013091129844762
-4.6%
712943596571431465
-24.5%
802769483523373344
4.3%
170418201603154212181011
-6.4%
Hayland
Average value, 2016Average value, 2015Average value, 2014Average value, 2013Average value, 2012Average value, 2011Annual % change 16/15
359740304762419633372401
-10.7%
4226422045984003300827420.1%
2921267524662639163815909.2%
229326872458222319051301
-14.7%
312527552525255221431300
13.4%
17331843163014531039854
-6.0%
10051166640678559552
-13.8%
951917590610407400
3.7%
246925352458228517581377-2.6%
Type of Land
South-east
EastCentral
North-east
NorthCentral
Central Western
dollars per acre
Irrigated land
Average value, 2016High ProductivityLow Productivity
671790506035
635085004940
6143******
525081505500
431452003260
268831151806
Average value, 2015Average value, 2014Average value, 2013Average value, 2012Average value, 2011Annual % change 16/15
73307940751463414212-8.4%
67507190758942393952-5.9%
***625062004140 *** ***
70006340675343722895
-25.0%
438044304469***2711-1.5%
2450149018751483 ***9.7%
Source: 2016 and earlier South Dakota Farm Real Estate Market SurveysStatewide average land values are based on 2002 land use weights

Page 7 iGrow.org | A Service of SDSU Extension | © 2016, South Dakota Board of Regents
| agronomy
second time in the 26 year history of the survey that average cropland values have declined.
Regional cropland values tend to cluster in three groups. The highest cropland values are found in the East-central and Southeast regions with average values of $6,116 and $5,653 per-acre, respectively. The second cropland value cluster consists of the Northeast, North-central, and central regions with average cropland values varying from $4,613 to $3,843 per-acre. Cropland values are considerably lower in the third cluster which contains the three regions west of the Missouri River. As of February 2016, per-acre cropland values averaged $2,168 in the South-central region, $1,264 in the Southwest and $1,187 in the Northwest region (Table 1 and Figure 3).
Cropland values from 2015 to 2016 decreased by at least $6 per-acre in the Southwest and Northwest regions compared to declines of more than $200 per-acre in the Southeast and East-central regions. Overall, cropland values declined in all regions throughout the state (Table 1).
Regional differences in cropland values reflect differences in cropland intensity and crop mix. The three eastern regions contain 45% of South Dakota’s cropland, while the North-central and central regions contain 33% of South Dakota’s cropland acres. Corn and soybeans are the major crops in most counties in the eastern regions compared to corn, soybeans,
sunflowers, and wheat in most counties of the North-central and central regions. The three regions west of the Missouri River contain 22% of the state’s cropland acres. Wheat, corn, and grain sorghum are important crops in the South-central region, while wheat is the dominant crop in the two western regions.
The highest rates and dollar amounts of decline in per-acre cropland values occurred in the major corn and soybean production areas of the State.
Hayland valuesSouth Dakota hayland values averaged $2,469 per-acre as of February 2016, a 2.6% decrease from the previous year (Table 1). Hayland values decreased in the Southeast, North-central, South-central and Southwest regions and increased in all other regions of South Dakota. The strongest increases were in the central region. Statewide, hayland values have doubled since 2010 and increased seven times since 2000 (Appendix Table 2).
Average hayland values also cluster into three regional groups. The highest average values are in the East-central and Southeast regions, with per-acre values of $4,226 and $3,597, respectively. Hayland values are considerably lower in the other regions east of the Missouri River, varying from $2,921 in the Northeast region to $2,293 per-acre in the North-central region (Table 1).
Substantially lower values of hayland are found in all regions west of the Missouri River, varying from $1,733 in the South-central region to $951 per-acre in the Northwest region (Figure 3 and Table 1). Alfalfa hay is the most common hay in the eastern regions, while native hay is more common in the central and western regions.
Pasture and rangeland valuesIn February 2016, the value of South Dakota native rangeland averaged $1,222 per-acre, a 2.9% increase from 2015. The average value of tame pasture was $1,704 per-acre, this is a decrease of 6.4% in the past year (Table 1). Native rangeland is heavily concentrated in the western and central regions of South Dakota, while tame pasture is not concentrated in any particular region.
Crop = Nonirrigated croplandHay = Hayland
Source: 2016 South Dakota Farm Real Estate Market Survey, SDSU.
Crop $4177Hay $2293
Crop $6116Hay $4226
Crop $2168Hay $1733
Crop $3843Hay $3125
Crop $1264Hay $1005
Crop $1187Hay $951
Crop $5653Hay $3597
Crop $4613Hay $2921
Figure 3. Average value of South Dakota cropland and hayland, by region, February 2016, dollars per acre.
Page 8 iGrow.org | A Service of SDSU Extension | © 2016, South Dakota Board of Regents
| agronomy
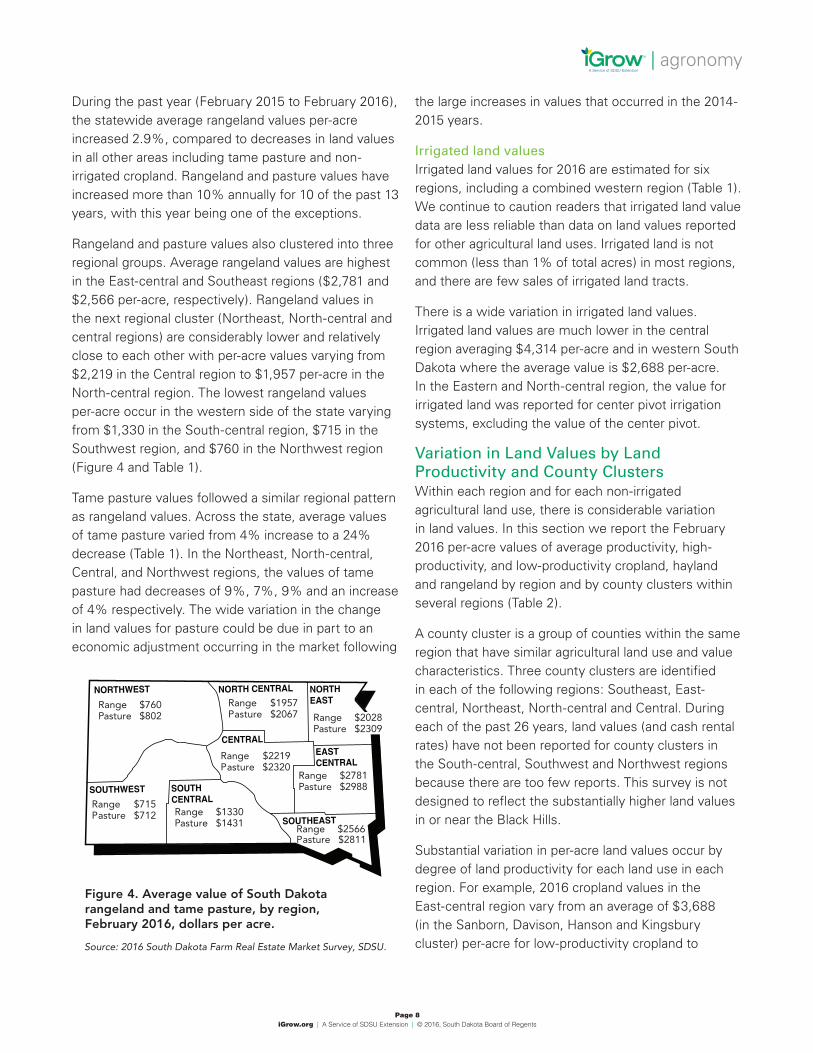
During the past year (February 2015 to February 2016), the statewide average rangeland values per-acre increased 2.9%, compared to decreases in land values in all other areas including tame pasture and non-irrigated cropland. Rangeland and pasture values have increased more than 10% annually for 10 of the past 13 years, with this year being one of the exceptions.
Rangeland and pasture values also clustered into three regional groups. Average rangeland values are highest in the East-central and Southeast regions ($2,781 and $2,566 per-acre, respectively). Rangeland values in the next regional cluster (Northeast, North-central and central regions) are considerably lower and relatively close to each other with per-acre values varying from $2,219 in the Central region to $1,957 per-acre in the North-central region. The lowest rangeland values per-acre occur in the western side of the state varying from $1,330 in the South-central region, $715 in the Southwest region, and $760 in the Northwest region (Figure 4 and Table 1).
Tame pasture values followed a similar regional pattern as rangeland values. Across the state, average values of tame pasture varied from 4% increase to a 24% decrease (Table 1). In the Northeast, North-central, Central, and Northwest regions, the values of tame pasture had decreases of 9%, 7%, 9% and an increase of 4% respectively. The wide variation in the change in land values for pasture could be due in part to an economic adjustment occurring in the market following
the large increases in values that occurred in the 2014-2015 years.
Irrigated land values Irrigated land values for 2016 are estimated for six regions, including a combined western region (Table 1). We continue to caution readers that irrigated land value data are less reliable than data on land values reported for other agricultural land uses. Irrigated land is not common (less than 1% of total acres) in most regions, and there are few sales of irrigated land tracts.
There is a wide variation in irrigated land values. Irrigated land values are much lower in the central region averaging $4,314 per-acre and in western South Dakota where the average value is $2,688 per-acre. In the Eastern and North-central region, the value for irrigated land was reported for center pivot irrigation systems, excluding the value of the center pivot.
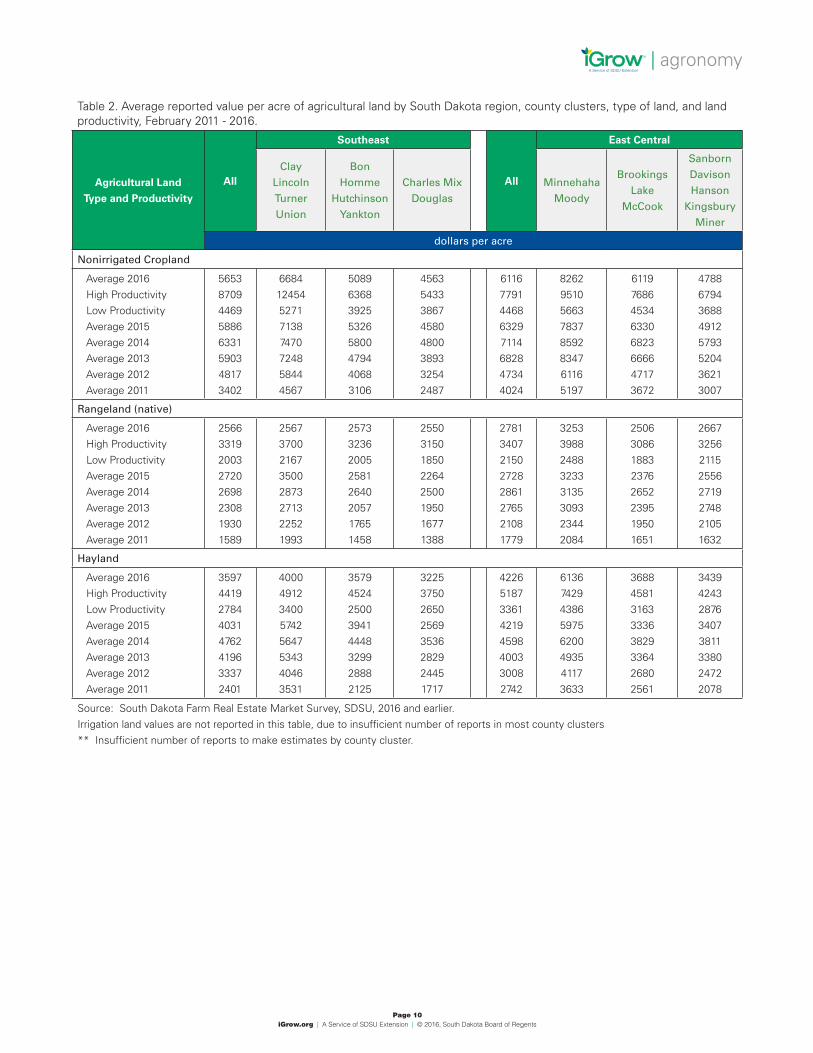
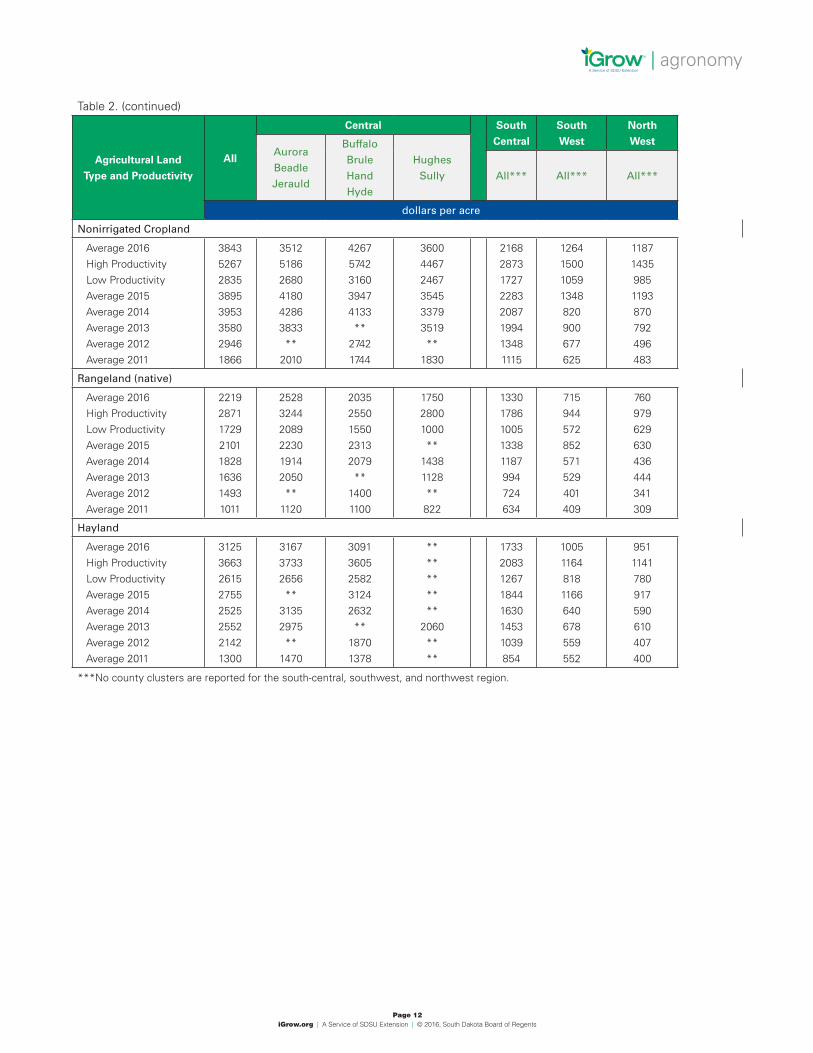
Variation in Land Values by Land Productivity and County ClustersWithin each region and for each non-irrigated agricultural land use, there is considerable variation in land values. In this section we report the February 2016 per-acre values of average productivity, high-productivity, and low-productivity cropland, hayland and rangeland by region and by county clusters within several regions (Table 2).
A county cluster is a group of counties within the same region that have similar agricultural land use and value characteristics. Three county clusters are identified in each of the following regions: Southeast, East-central, Northeast, North-central and Central. During each of the past 26 years, land values (and cash rental rates) have not been reported for county clusters in the South-central, Southwest and Northwest regions because there are too few reports. This survey is not designed to reflect the substantially higher land values in or near the Black Hills.
Substantial variation in per-acre land values occur by degree of land productivity for each land use in each region. For example, 2016 cropland values in the East-central region vary from an average of $3,688 (in the Sanborn, Davison, Hanson and Kingsbury cluster) per-acre for low-productivity cropland to Source: 2016 South Dakota Farm Real Estate Market Survey, SDSU.
Range $760Pasture $802
Range $1957Pasture $2067
Range $715Pasture $712
Range $2219Pasture $2320
Range $1330Pasture $1431
Range $2781Pasture $2988
Range $2566Pasture $2811
Range $2028Pasture $2309
Figure 4. Average value of South Dakota rangeland and tame pasture, by region, February 2016, dollars per acre.
Page 9 iGrow.org | A Service of SDSU Extension | © 2016, South Dakota Board of Regents
| agronomy
almost $9,510 (Minnehaha Moody cluster) per-acre for high-productivity cropland. At the other extreme, the average value of low productivity cropland in the Northwest region is $985 compared to $1,435 per-acre for high-productivity cropland (Table 2).
Rangeland values in the East-central region varied from an average of $1,883 (Brookings, Lake, McCook cluster) per-acre for low-productivity rangeland to $3,988 (Minnehaha Moody cluster) per-acre for high productivity rangeland. In the Northwest region, at the other extreme, the average value of low-productivity rangeland is $629 per-acre, compared to $979 per-acre for high-productivity rangeland (Table 2).
In 2016, average non-irrigated cropland values were $8,262 per-acre in the Minnehaha, Moody county cluster compared to $6,684 per-acre in the Clay, Lincoln, Turner, Union (CLTU) county cluster and $6,119 per-acre in the Brookings, Lake, McCook county cluster. Average cropland values in the remaining county clusters varied from $3,512 per-acre in the Aurora, Beadle and Jerauld cluster to $4,983 per-acre in the Brown, Spink county cluster (Table 2).
Similar patterns, but much lower values, also occur for rangeland across county clusters in the same regions. The highest average values occur in the Sanborn, Davison, Hanson, Kingsbury, Miner and Minnehaha, Moody clusters averaging $2,667 and $3,253 per-acre, respectively. The lowest average rangeland values of $1,125 and $1,893 per-acre, respectively, were reported for the Campbell, Potter, Walworth and
Edmund, Faulk, McPherson county clusters.
Average hayland values are also highest in the Minnehaha-Moody cluster at $6,136 per-acre and in the Clay, Lincoln, Turner, Union cluster at $4,000 per-acre. For the remaining four county clusters in the Southeast and East-central regions, average hayland values vary between $3,225 (Charles-Mix Douglas) and $3,688 (Brookings, Lake, McCook) per-acre. Across the other county clusters located in the Northeast, North-central and central regions, average hayland values vary from $2,018 (Campbell, Potter, Walworth) to $3,700 (Coddington, Deuel, Hamlin cluster) per-acre (Table 2).
For regions west of the Missouri River, average land values for each land use are highest in the South-central region and lowest in the Northwest or Southwest region. Average land values vary from $715 per-acre for rangeland in the Southwest region to $2,168 per-acre for non-irrigated cropland in the South-central region (Table 2). In all cases, average land values in these regions are lower than corresponding average land values in any region east of the Missouri River.
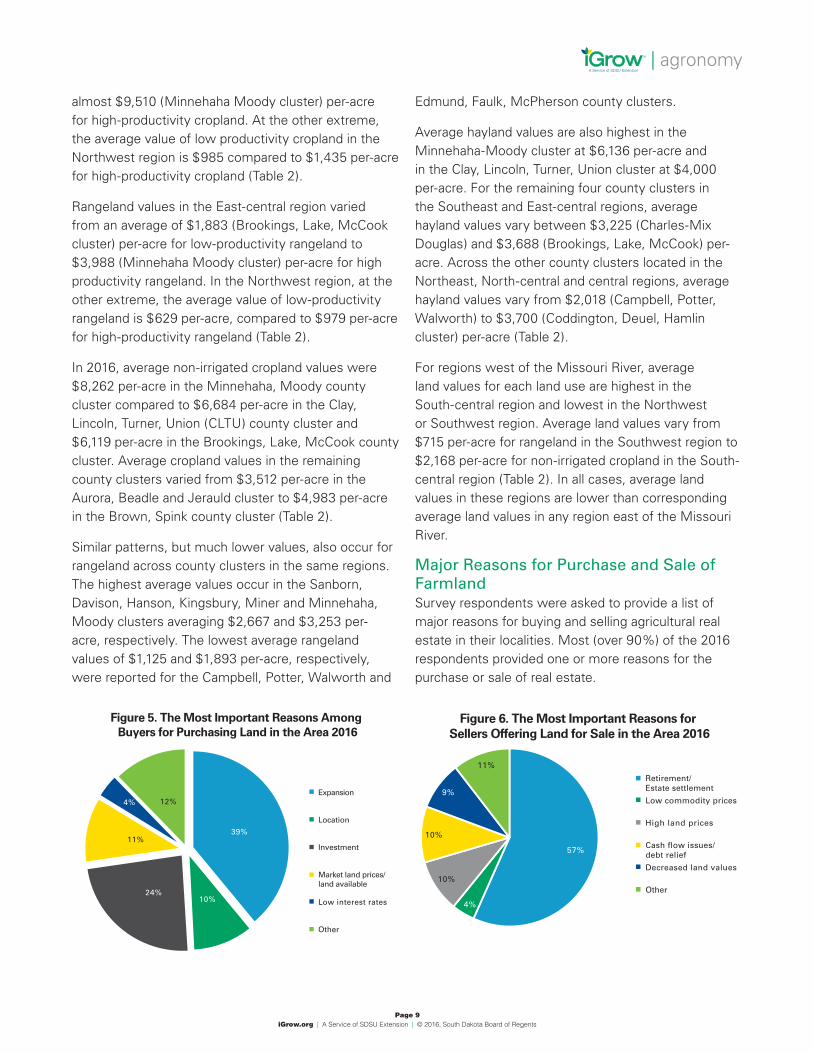
Major Reasons for Purchase and Sale of FarmlandSurvey respondents were asked to provide a list of major reasons for buying and selling agricultural real estate in their localities. Most (over 90%) of the 2016 respondents provided one or more reasons for the purchase or sale of real estate.
39%
10%24%
11%
4% 12%
Figure 5. The Most Important Reasons Among Buyers for Purchasing Land in the Area 2016
Expansion
Location
Investment
Market land prices/land available
Low interest rates
Other
57%
4%
10%
10%
9%
11%
Figure 6. The Most Important Reasons for Sellers Offering Land for Sale in the Area 2016
Retirement/Estate settlement
Low commodity prices
High land prices
Cash flow issues/debt relief
Decreased land values
Other
Page 10 iGrow.org | A Service of SDSU Extension | © 2016, South Dakota Board of Regents
| agronomy
Table 2. Average reported value per acre of agricultural land by South Dakota region, county clusters, type of land, and land productivity, February 2011 - 2016.
Agricultural Land
Type and Productivity
All
Southeast
All
East Central
Clay
Lincoln
Turner
Union
Bon
Homme
Hutchinson
Yankton
Charles Mix
Douglas
Minnehaha
Moody
Brookings
Lake
McCook
Sanborn
Davison
Hanson
Kingsbury
Miner
dollars per acre
Nonirrigated Cropland
Average 2016 High Productivity Low Productivity Average 2015 Average 2014 Average 2013 Average 2012 Average 2011
56538709446958866331590348173402
668412454527171387470724858444567
50896368392553265800479440683106
45635433386745804800389332542487
61167791446863297114682847344024
82629510566378378592834761165197
61197686453463306823666647173672
47886794368849125793520436213007
Rangeland (native)
Average 2016 High Productivity Low Productivity Average 2015 Average 2014 Average 2013 Average 2012 Average 2011
25663319200327202698230819301589
25673700216735002873271322521993
25733236200525812640205717651458
25503150185022642500195016771388
27813407215027282861276521081779
32533988248832333135309323442084
25063086188323762652239519501651
26673256211525562719274821051632
Hayland
Average 2016 High Productivity Low Productivity Average 2015 Average 2014 Average 2013 Average 2012 Average 2011
35974419278440314762419633372401
40004912340057425647534340463531
35794524250039414448329928882125
32253750265025693536282924451717
42265187336142194598400330082742
61367429438659756200493541173633
36884581316333363829336426802561
34394243287634073811338024722078
Source: South Dakota Farm Real Estate Market Survey, SDSU, 2016 and earlier.Irrigation land values are not reported in this table, due to insufficient number of reports in most county clusters** Insufficient number of reports to make estimates by county cluster.

Page 11 iGrow.org | A Service of SDSU Extension | © 2016, South Dakota Board of Regents
| agronomy
Table 2. (continued)
Agricultural Land
Type and Productivity
All
Northeast
All
North Central
Codington
Deuel
Hamlin
Grant
Roberts
Clark
Day
Marshall
Brown
Spink
Edmund
Faulk
McPherson
Campbell
Potter
Walworth
dollars per acre
Nonirrigated Cropland
Average 2016 High Productivity Low Productivity Average 2015 Average 2014 Average 2013 Average 2012 Average 2011
46136356316050665291484333692918
46736744332550935466521737933250
496963543400
**5467500036292721
430059072805**
4914425028672570
41776168300842744614456230262301
49837811347255485593584634792980
36044920261730073303306823201467
32734436257335253736****
1831
Rangeland (native)
Average 2016 High Productivity Low Productivity Average 2015 Average 2014 Average 2013 Average 2012 Average 2011
20282567148021361859175913451217
21672698159222702033182313561389
190022641386**
1746176113831136
19442600140620041723167111681038
1957234714421758160014731387950
23542827174823631972182415751116
1893225013501343119710791190815
1125137587512831236****792
Hayland
Average 2016 High Productivity Low Productivity Average 2015 Average 2014 Average 2013 Average 2012 Average 2011
29213532206426752466263916381590
370043752500
**3036299418831679
252030401960**
2258260016331725
203326671367**
2044212714561333
22932969161126882458222319051301
26443620180034323007262323111755
2073260014201757172516321357900
201824091564**
2200****991
Page 12 iGrow.org | A Service of SDSU Extension | © 2016, South Dakota Board of Regents
| agronomy
Table 2. (continued)
Agricultural Land
Type and Productivity
All
Central South
Central
South
West
North
WestAurora
Beadle
Jerauld
Buffalo
Brule
Hand
Hyde
Hughes
Sully All*** All*** All***
dollars per acre
Nonirrigated Cropland
Average 2016 High Productivity Low Productivity Average 2015 Average 2014 Average 2013 Average 2012 Average 2011
38435267283538953953358029461866
351251862680418042863833
**2010
42675742316039474133**
27421744
360044672467354533793519**
1830
21682873172722832087199413481115
1264150010591348820900677625
118714359851193870 792496483
Rangeland (native)
Average 2016 High Productivity Low Productivity Average 2015 Average 2014 Average 2013 Average 2012 Average 2011
22192871172921011828163614931011
252832442089223019142050
**1120
20352550155023132079**
14001100
175028001000**
14381128**822
13301786100513381187994724634
715944572852571529401409
760979629630436444341309
Hayland
Average 2016 High Productivity Low Productivity Average 2015 Average 2014 Average 2013 Average 2012 Average 2011
31253663261527552525255221421300
316737332656
**31352975
**1470
30913605258231242632**
18701378
**********
2060****
1733208312671844163014531039854
100511648181166640678559552
9511141780917590610407400
***No county clusters are reported for the south-central, southwest, and northwest region.
Page 13 iGrow.org | A Service of SDSU Extension | © 2016, South Dakota Board of Regents
| agronomy
From Figure 5, farm expansion was the top reason for purchasing farmland. Of the total responses, 39% indicated farm expansion as a key reason for purchasing land. Buying land as a form of investment also accounted for 24% of responses. Market land prices and land availability accounted for 11%. Location of agricultural land accounted for 10% of respondent reasons for purchasing land. Farm expansion has consistently been the top reason for buying land.
Retirement and estate settlement of farmers and ranchers emerged as the top reason for selling land, accounting for 57% of the total responses (Figure 6). High land prices accounts for 10% of the reasons for selling land. Decreasing land values accounted for 9% of land sales. Another important reason for land sales include debt and cash flow accounting for 10% of reasons for sales. The top reason for selling land deviated from the previous year findings.
Cash Rental Rates of South Dakota’s Agricultural LandNearly two-fifths of South Dakota’s agricultural land acres are in cash, share, or other lease arrangements (SD Census of Agriculture, 2012). The cash rental market provides important information on returns to agricultural land. Three-fourths of South Dakota’s farmland renters are involved in one or more cash leases for agricultural land. The majority of farmland leases (57%) were fixed cash rate leases and five-eighths of cash leases were annual renewable agreements (Janssen and Xu, 2003).
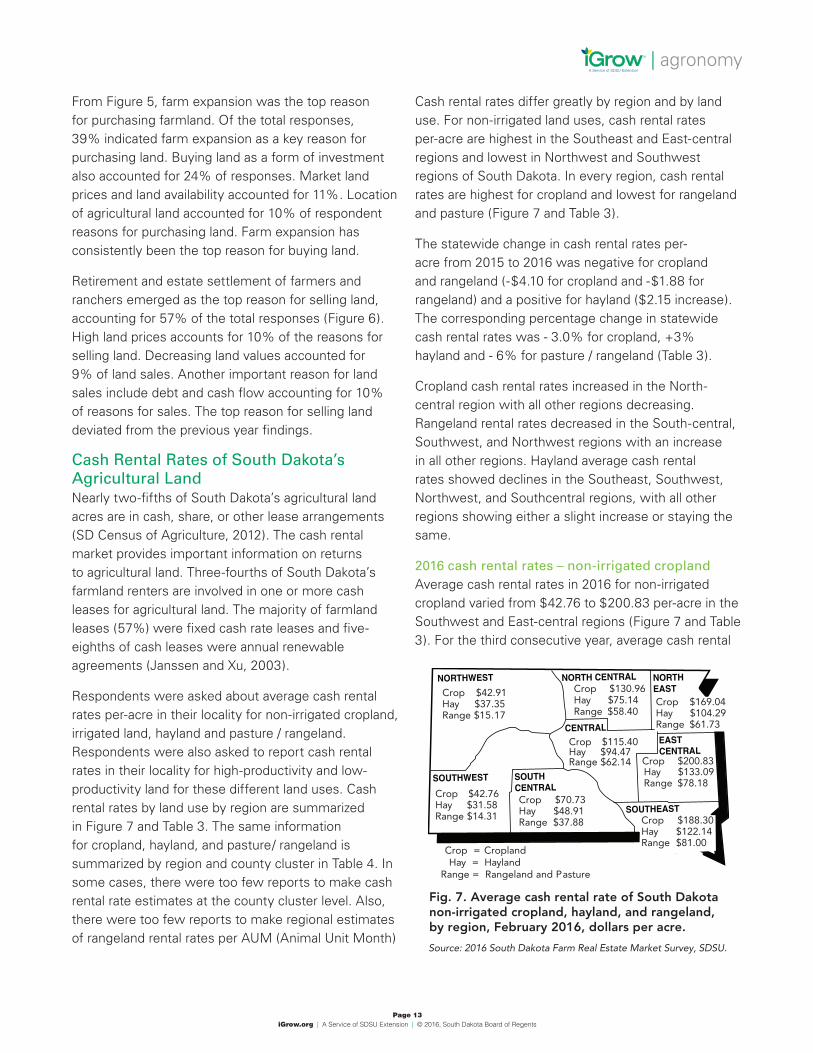
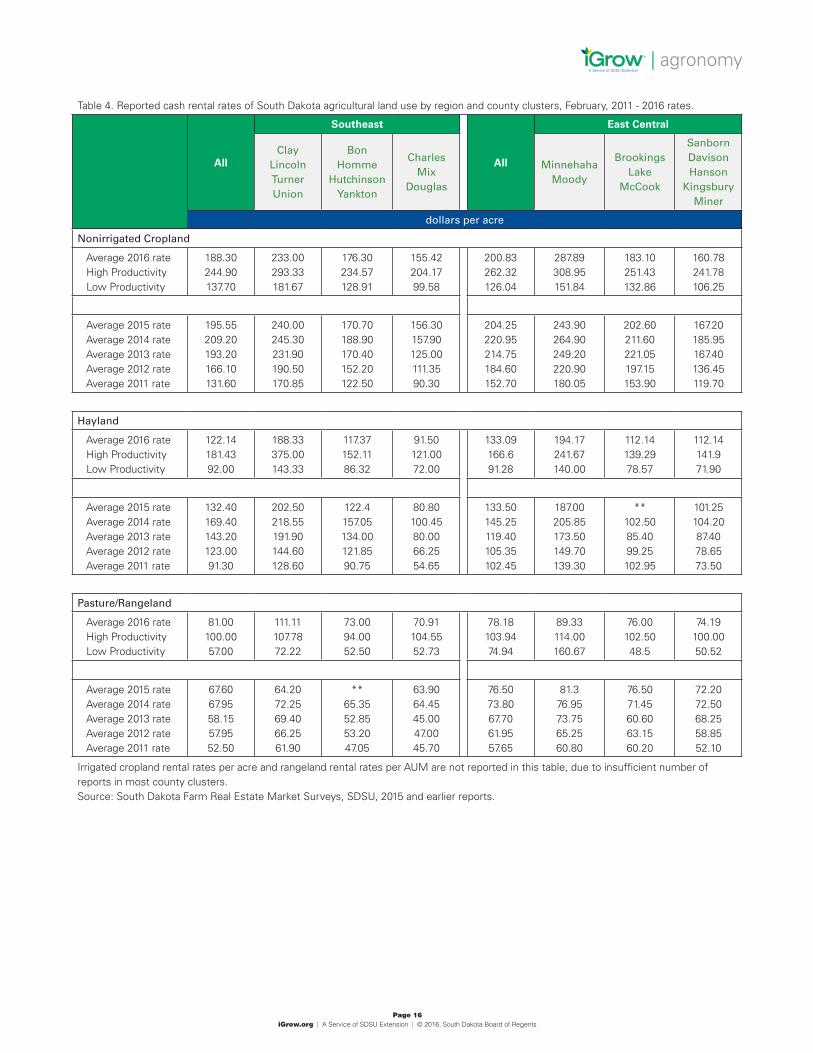
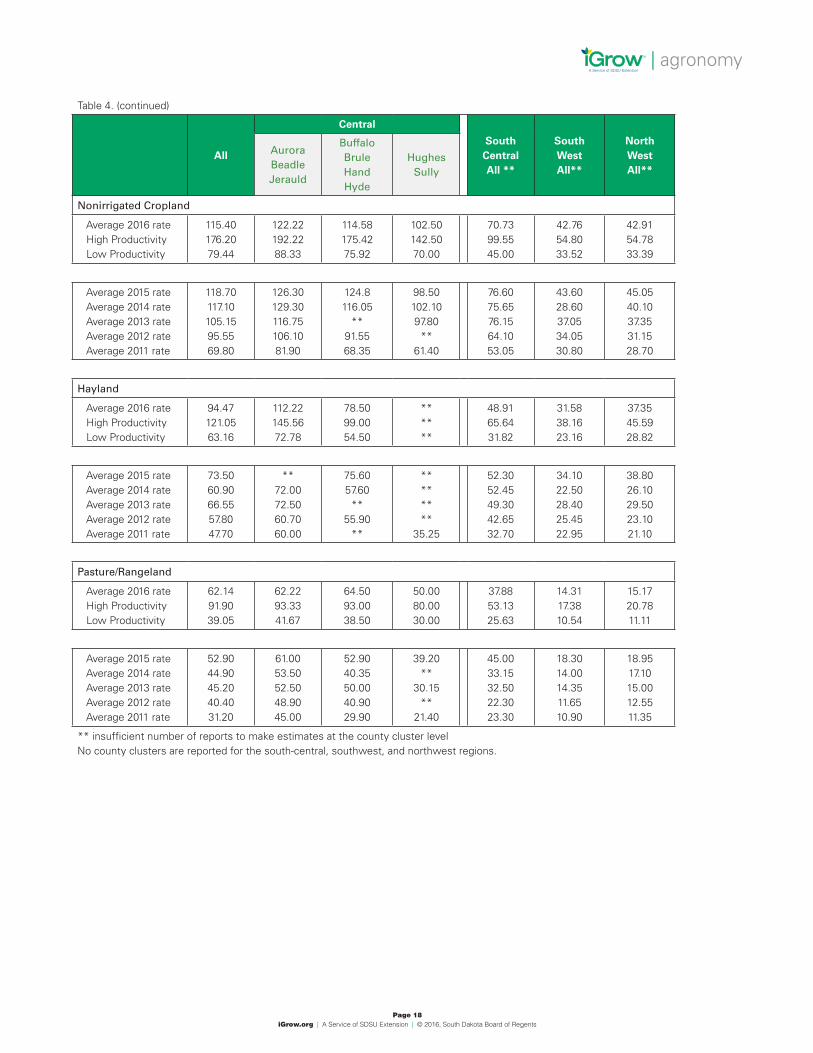
Respondents were asked about average cash rental rates per-acre in their locality for non-irrigated cropland, irrigated land, hayland and pasture / rangeland. Respondents were also asked to report cash rental rates in their locality for high-productivity and low-productivity land for these different land uses. Cash rental rates by land use by region are summarized in Figure 7 and Table 3. The same information for cropland, hayland, and pasture/ rangeland is summarized by region and county cluster in Table 4. In some cases, there were too few reports to make cash rental rate estimates at the county cluster level. Also, there were too few reports to make regional estimates of rangeland rental rates per AUM (Animal Unit Month)
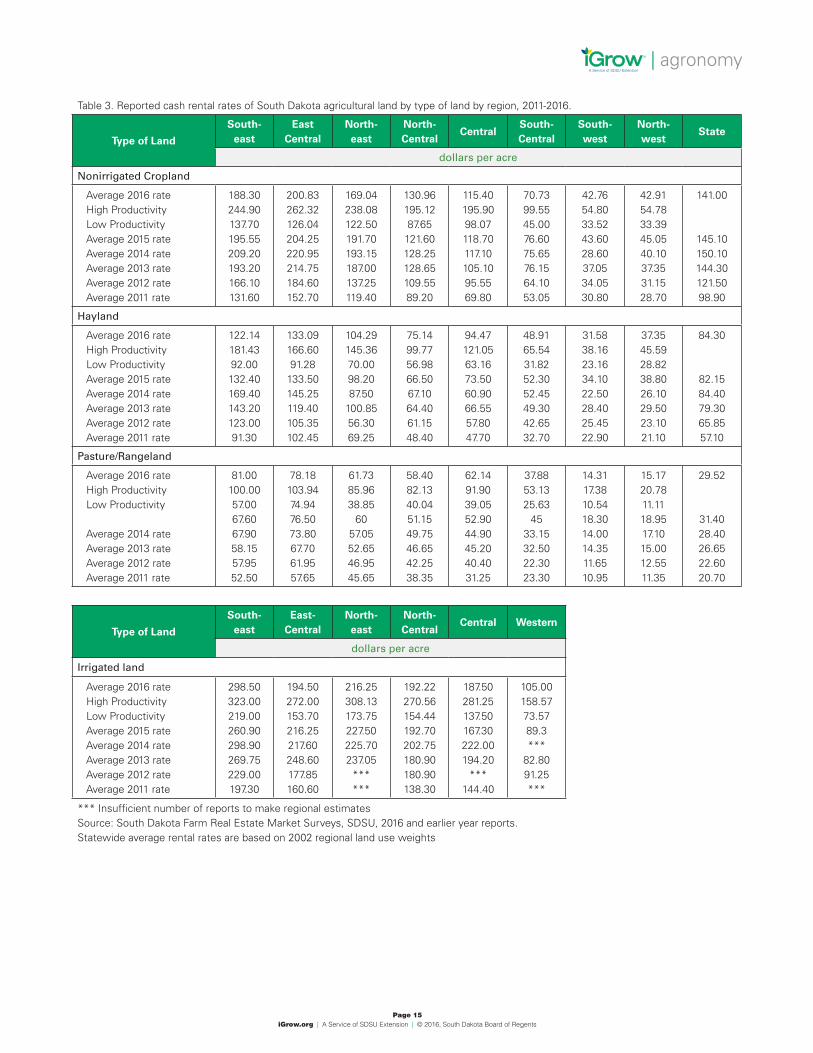
Cash rental rates differ greatly by region and by land use. For non-irrigated land uses, cash rental rates per-acre are highest in the Southeast and East-central regions and lowest in Northwest and Southwest regions of South Dakota. In every region, cash rental rates are highest for cropland and lowest for rangeland and pasture (Figure 7 and Table 3).
The statewide change in cash rental rates per-acre from 2015 to 2016 was negative for cropland and rangeland (-$4.10 for cropland and -$1.88 for rangeland) and a positive for hayland ($2.15 increase). The corresponding percentage change in statewide cash rental rates was - 3.0% for cropland, +3% hayland and - 6% for pasture / rangeland (Table 3).
Cropland cash rental rates increased in the North-central region with all other regions decreasing. Rangeland rental rates decreased in the South-central, Southwest, and Northwest regions with an increase in all other regions. Hayland average cash rental rates showed declines in the Southeast, Southwest, Northwest, and Southcentral regions, with all other regions showing either a slight increase or staying the same.
2016 cash rental rates – non-irrigated croplandAverage cash rental rates in 2016 for non-irrigated cropland varied from $42.76 to $200.83 per-acre in the Southwest and East-central regions (Figure 7 and Table 3). For the third consecutive year, average cash rental
Fig. 7. Average cash rental rate of South Dakota non-irrigated cropland, hayland, and rangeland, by region, February 2016, dollars per acre.Source: 2016 South Dakota Farm Real Estate Market Survey, SDSU.
Crop $42.91Hay $37.35Range $15.17
Crop $200.83Hay $133.09Range $78.18
Crop $70.73Hay $48.91Range $37.88
Crop $42.76Hay $31.58Range $14.31
Crop $115.40Hay $94.47Range $62.14
Crop $130.96Hay $75.14Range $58.40
Crop $169.04Hay $104.29Range $61.73
Crop = CroplandHay = Hayland
Range = Rangeland and Pasture
Crop $188.30Hay $122.14Range $81.00
Page 14 iGrow.org | A Service of SDSU Extension | © 2016, South Dakota Board of Regents
| agronomy
rates for cropland exceeded $100 per-acre in all five regions east of the Missouri, and equaled $200 per-acre in the East-central region.
Average cash rental rates for cropland are highest at $288 per-acre in the Minnehaha-Moody county cluster and $233 per-acre in the Clay, Lincoln, Turner, Union cluster (Table 4). The third highest cash rental rates average $183 per-acre in the Brookings, Lake, McCook county cluster. Cash rental rates for high-productivity cropland in these same three county clusters vary from $251 (Brookings, Lake, McCook) to $309 (Minnehaha Moody) per-acre.
In 2016, average cropland cash rental rates vary from $155 (Charles-Mix, Douglas) to $176 (Bonne-Homme, Hutchinson, Yankton) per-acre across county clusters in the three eastern regions of South Dakota. Within the same five clusters, average cash rental rates for high-productivity cropland vary from an average of $204 (Charles Mix-Douglas) to $243(Codington, Deuel, Hamlin) per-acre.
Cash rental rates are generally lower across county clusters in the North-central and central region. Average cash rental rates for cropland in these county clusters vary from $102 per-acre in the Hughes, Sully county cluster to $149 per-acre in the Brown, Spink cluster (Table 4). Cash rental rates for high-productivity cropland vary from $142 in Hughes, Sully to $230 in Brown, Spink.
Average cash rental rates for cropland are much lower in all regions west of the Missouri River, varying from $43 per-acre in the Southwest region to $71 per-acre in the South-central region (Table 4). Average cash rental rates for high productivity cropland vary from $55 per-acre in the Northwest region to $100 per-acre in the South-central region.
Within each region and county cluster, cash rental rate averages for low-productivity cropland are usually much lower than those reported for high-productivity cropland. For example, reported average cash rent for non-irrigated cropland in the East-central region is $126 per-acre for low-productivity cropland and $262 per-acre for high-productivity cropland (Table 3). In the Southwest region, the average cash rent for low-
productivity cropland is $34 per-acre compared to $55 per-acre for high-productivity cropland.
2016 cash rental rates – hayland and irrigated landCash rental rates for hayland are highest in the south-east and East-central regions, with average cash rents around $122 (Southeast) and $133 (East-central) per-acre. The Northeast region was third highest with an average rate of $104 per-acre. Cash rental rates were in the Central region were $94 and cash rental rates in the North-central region were $75 per-acre. West of the Missouri River, hayland cash rental rates in 2016 vary from an average of $32 per-acre in the Southwest region to $49 per-acre in the South-central region (Figure 7 and Table 3).
Within each region there are considerable differences in average cash rental rates for low-productivity and high productivity hayland. For example, the average rental rates for low and high productivity hayland in the Southeast region are $92 and $182 per-acre, respectively, compared to $23 and $38 per-acre in the Southwest region (Table 3). In many regions, lower cash rental rates are reported for native hayland, while higher rates are quoted for alfalfa.
In 2016, hayland cash rental estimates were only made for 14 of 15 county clusters (Table 4). The highest average cash rental rates of hayland were reported in Minnehaha, Moody at $194, followed by $188 per-acre in the Clay, Lincoln, Turner, Union county cluster. The lowest average hayland rental rates at the county cluster level were $65 per-acre in the Edmunds, Faulk, McPherson county cluster.
Cash rental rates for irrigated land averaged above $190 per-acre in all three eastern regions and the North-central region, varying from an average of $299 in the Southeast region to $192 per-acre in the North-central region. The average per-acre irrigated land rental rates was $187 in the central region and $105 per-acre in the western regions.
2016 cash rental rates - rangeland and pasture Nearly three-eighths of South Dakota’s 26.2 million acres of rangeland and pasture acres are leased to farmers and ranchers. Several million acres of rangeland in western and central South Dakota are
Page 15 iGrow.org | A Service of SDSU Extension | © 2016, South Dakota Board of Regents
| agronomy
Table 3. Reported cash rental rates of South Dakota agricultural land by type of land by region, 2011-2016.
Type of Land
South-east
EastCentral
North-east
North-Central
CentralSouth-Central
South-west
North-west
State
dollars per acre
Nonirrigated Cropland
Average 2016 rate High Productivity Low Productivity Average 2015 rate Average 2014 rate Average 2013 rate Average 2012 rate Average 2011 rate
188.30244.90137.70195.55209.20 193.20 166.10 131.60
200.83262.32126.04204.25220.95 214.75 184.60 152.70
169.04238.08122.50191.70193.15 187.00 137.25 119.40
130.96195.1287.65
121.60128.25 128.65 109.55 89.20
115.40195.9098.07118.70117.10 105.10 95.55 69.80
70.7399.5545.0076.6075.65 76.15 64.10 53.05
42.7654.8033.5243.6028.60 37.05 34.05 30.80
42.9154.7833.3945.0540.10 37.35 31.15 28.70
141.00
145.10150.10144.30121.5098.90
Hayland
Average 2016 rate High Productivity Low Productivity Average 2015 rate Average 2014 rate Average 2013 rate Average 2012 rate Average 2011 rate
122.14181.4392.00132.40169.40143.20 123.00 91.30
133.09166.6091.28
133.50145.25119.40 105.35 102.45
104.29145.3670.0098.2087.50
100.85 56.30 69.25
75.1499.7756.9866.5067.1064.40 61.15 48.40
94.47121.0563.1673.5060.9066.55 57.80 47.70
48.9165.5431.8252.3052.4549.30 42.65 32.70
31.5838.1623.1634.1022.5028.40 25.45 22.90
37.3545.5928.8238.8026.1029.50 23.10 21.10
84.30
82.1584.4079.3065.8557.10
Pasture/Rangeland
Average 2016 rate High Productivity Low Productivity Average 2014 rate Average 2013 rate Average 2012 rate Average 2011 rate
81.00100.0057.0067.6067.9058.15 57.95 52.50
78.18103.9474.9476.5073.8067.70 61.95 57.65
61.7385.9638.85
6057.0552.65 46.95 45.65
58.4082.1340.0451.1549.7546.65 42.25 38.35
62.1491.9039.0552.9044.9045.20 40.40 31.25
37.8853.1325.63
4533.1532.50 22.30 23.30
14.3117.3810.5418.3014.0014.35 11.65 10.95
15.1720.7811.1118.9517.1015.00 12.55 11.35
29.52
31.4028.4026.6522.6020.70
Type of Land
South-east
East-Central
North-east
North-Central
Central Western
dollars per acre
Irrigated land
Average 2016 rate High Productivity Low Productivity Average 2015 rate Average 2014 rate Average 2013 rate Average 2012 rate Average 2011 rate
298.50323.00219.00260.90298.90269.75229.00197.30
194.50272.00153.70216.25217.60248.60177.85160.60
216.25308.13173.75227.50225.70237.05
******
192.22270.56154.44192.70202.75180.90180.90138.30
187.50281.25137.50167.30222.00194.20
***144.40
105.00158.5773.5789.3***
82.8091.25***
*** Insufficient number of reports to make regional estimatesSource: South Dakota Farm Real Estate Market Surveys, SDSU, 2016 and earlier year reports.Statewide average rental rates are based on 2002 regional land use weights
Page 16 iGrow.org | A Service of SDSU Extension | © 2016, South Dakota Board of Regents
| agronomy
Table 4. Reported cash rental rates of South Dakota agricultural land use by region and county clusters, February, 2011 - 2016 rates.
All
Southeast
All
East Central
ClayLincolnTurnerUnion
Bon Homme
HutchinsonYankton
Charles Mix
Douglas
MinnehahaMoody
BrookingsLake
McCook
SanbornDavisonHanson
KingsburyMiner
dollars per acre
Nonirrigated Cropland
Average 2016 rate High Productivity Low Productivity
188.30244.90137.70
233.00293.33181.67
176.30234.57128.91
155.42204.1799.58
200.83262.32126.04
287.89308.95151.84
183.10251.43132.86
160.78241.78106.25
Average 2015 rate Average 2014 rate Average 2013 rate Average 2012 rate Average 2011 rate
195.55209.20193.20166.10 131.60
240.00245.30231.90190.50 170.85
170.70188.90170.40152.20 122.50
156.30157.90125.00111.35 90.30
204.25220.95214.75184.60 152.70
243.90264.90249.20220.90 180.05
202.60211.60221.05197.15 153.90
167.20185.95167.40136.45 119.70
Hayland
Average 2016 rate High Productivity Low Productivity
122.14181.4392.00
188.33375.00143.33
117.37152.1186.32
91.50121.0072.00
133.09166.691.28
194.17241.67140.00
112.14139.2978.57
112.14141.971.90
Average 2015 rate Average 2014 rate Average 2013 rate Average 2012 rate Average 2011 rate
132.40169.40143.20123.00 91.30
202.50218.55191.90144.60 128.60
122.4157.05134.00121.85 90.75
80.80100.4580.0066.25 54.65
133.50145.25119.40105.35 102.45
187.00205.85173.50149.70 139.30
**102.5085.4099.25 102.95
101.25104.2087.40 78.65 73.50
Pasture/Rangeland
Average 2016 rate High Productivity Low Productivity
81.00100.0057.00
111.11107.7872.22
73.0094.0052.50
70.91104.5552.73
78.18103.9474.94
89.33114.00160.67
76.00102.5048.5
74.19100.0050.52
Average 2015 rate Average 2014 rate Average 2013 rate Average 2012 rate Average 2011 rate
67.6067.95 58.1557.95 52.50
64.2072.2569.4066.25 61.90
**65.3552.8553.20 47.05
63.9064.4545.0047.00 45.70
76.5073.80 67.7061.95 57.65
81.376.9573.7565.25 60.80
76.50 71.45 60.6063.15 60.20
72.2072.5068.2558.85 52.10
Irrigated cropland rental rates per acre and rangeland rental rates per AUM are not reported in this table, due to insufficient number of reports in most county clusters. Source: South Dakota Farm Real Estate Market Surveys, SDSU, 2015 and earlier reports.

Page 17 iGrow.org | A Service of SDSU Extension | © 2016, South Dakota Board of Regents
| agronomy
Table 4. (continued)
All
Northeast
All
North Central
CodingtonDeuel
Hamlin
GrantRoberts
ClarkDay
Marshall
BrownSpink
EdmundFaulk
McPherson
CampbellPotter
Walworth
dollars per acre
Nonirrigated Cropland
Average 2016 rate High Productivity Low Productivity
169.94238.08122.50
172.29243.13120.63
175.38226.54122.31
158.33240.00125.67
130.86195.1287.65
148.87230.0499.78
113.67172.00
81
119.23160
73.85
Average 2015 rate Average 2014 rate Average 2013 rate Average 2012 rate Average 2011 rate
191.70193.15187.00137.25 119.40
193.00199.45202.05161.65 130.25
**203.00190.00142.15 108.65
**174.10164.80114.00 109.55
121.60128.25128.65109.55 89.20
150.70151.25150.60122.60 106.50
105.70104.40109.3592.25 71.35
89.2096.45
****
68.40
Hayland
Average 2016 rate High Productivity Low Productivity
104.29145.3670.00
133.33183.3388.33
93.00126.0064.00
65.00101.6743.33
75.1499.7756.98
85.00113.8269.71
65.0789.0048.33
73.6492.7349.09
Average 2015 rate Average 2014 rate Average 2013 rate Average 2012 rate Average 2011 rate
133.5087.50
100.8556.30 69.25
****
114.2071.65 84.05
**********
****
79.0050.55 57.75
66.5067.1064.4061.15 48.40
79.7078.6077.2569.50 54.10
56.1054.0553.0048.75 43.80
********
43.25
Pasture/Rangeland
Average 2016 rate High Productivity Low Productivity
61.7385.9638.85
64.1790.6338.75
62.6985.7738.46
57.0078.6739.33
58.4082.1340.04
65.2196.4846.16
56.7376.0041.00
50.3867.6930.00
Average 2015 rate Average 2014 rate Average 2013 rate Average 2012 rate Average 2011 rate
60.0057.05 52.6546.95 45.65
63.8057.4056.4552.40 51.15
**58.3546.4542.10 36.50
**55.0551.2544.55 44.65
51.1549.75 46.6542.25 38.35
56.7055.0051.8044.90 42.65
51.6047.2044.3541.85 38.10
39.0038.35
****
31.00
Page 18 iGrow.org | A Service of SDSU Extension | © 2016, South Dakota Board of Regents
| agronomy
Table 4. (continued)
All
Central
SouthCentralAll **
SouthWest All**
NorthWestAll**
AuroraBeadleJerauld
BuffaloBruleHandHyde
HughesSully
Nonirrigated Cropland
Average 2016 rate High Productivity Low Productivity
115.40176.2079.44
122.22192.2288.33
114.58175.4275.92
102.50142.5070.00
70.7399.5545.00
42.7654.8033.52
42.9154.7833.39
Average 2015 rate Average 2014 rate Average 2013 rate Average 2012 rate Average 2011 rate
118.70117.10105.1595.55 69.80
126.30129.30116.75106.1081.90
124.8116.05
**91.5568.35
98.50102.1097.80
**61.40
76.6075.6576.1564.10 53.05
43.6028.6037.0534.05 30.80
45.0540.1037.3531.1528.70
Hayland
Average 2016 rate High Productivity Low Productivity
94.47121.0563.16
112.22145.5672.78
78.5099.0054.50
******
48.9165.6431.82
31.5838.1623.16
37.3545.5928.82
Average 2015 rate Average 2014 rate Average 2013 rate Average 2012 rate Average 2011 rate
73.5060.9066.5557.80 47.70
**72.0072.5060.7060.00
75.6057.60
**55.90
**
********
35.25
52.3052.4549.3042.65 32.70
34.1022.5028.4025.45 22.95
38.8026.1029.5023.1021.10
Pasture/Rangeland
Average 2016 rate High Productivity Low Productivity
62.1491.9039.05
62.2293.3341.67
64.5093.0038.50
50.0080.0030.00
37.8853.1325.63
14.3117.3810.54
15.1720.7811.11
Average 2015 rate Average 2014 rate Average 2013 rate Average 2012 rate Average 2011 rate
52.9044.9045.2040.40 31.20
61.0053.5052.5048.9045.00
52.9040.3550.0040.9029.90
39.20**
30.15**
21.40
45.0033.1532.5022.30 23.30
18.3014.0014.3511.65 10.90
18.9517.10 15.0012.55 11.35
** insufficient number of reports to make estimates at the county cluster level No county clusters are reported for the south-central, southwest, and northwest regions.

Page 19 iGrow.org | A Service of SDSU Extension | © 2016, South Dakota Board of Regents
| agronomy
controlled by federal, state, or tribal agencies and are leased to ranchers using cash leases or grazing permits. A majority of leased rangeland and almost all leased pasture are cash rented from private landlords (Janssen and Xu, 2003). Respondents were asked to report 2016 cash rental rates per-acre and per AUM on privately owned rangeland and pastureland in their locality.
Average cash rental rates per-acre reflect regional differences in productivity and carrying capacity of pasture and rangeland tracts. Fluctuations in the commodity markets and potential profits are affecting cash rental rates.
Average cash rental rates vary from $14 per-acre in the Southwest region to $81 per-acre in the Southeast region (Figure7 and Table 3). Typical cash rental rates for low-productivity and high-productivity pasture and rangeland vary from $10.50 to $17.50 per-acre in the Southwest region, and from $75 to $104 per-acre in the East-central region (Table 3).
Estimates of per-acre cash rental rates for rangeland / pasture were made for all county clusters since sufficient reports were available (Table 4). At the county cluster level, cash rental rate averages for rangeland and pasture vary from $71 (Charles-Mix, Douglas) to $89 (Minnehaha, Moody) per-acre across county clusters in the Southeast and East-central regions. Average cash rental rates vary from $50 (Hughes, Sully) to $64 (Coddington, Deuel, Hamlin) per-acre across county clusters in the Northeast, North-central, and Central regions.
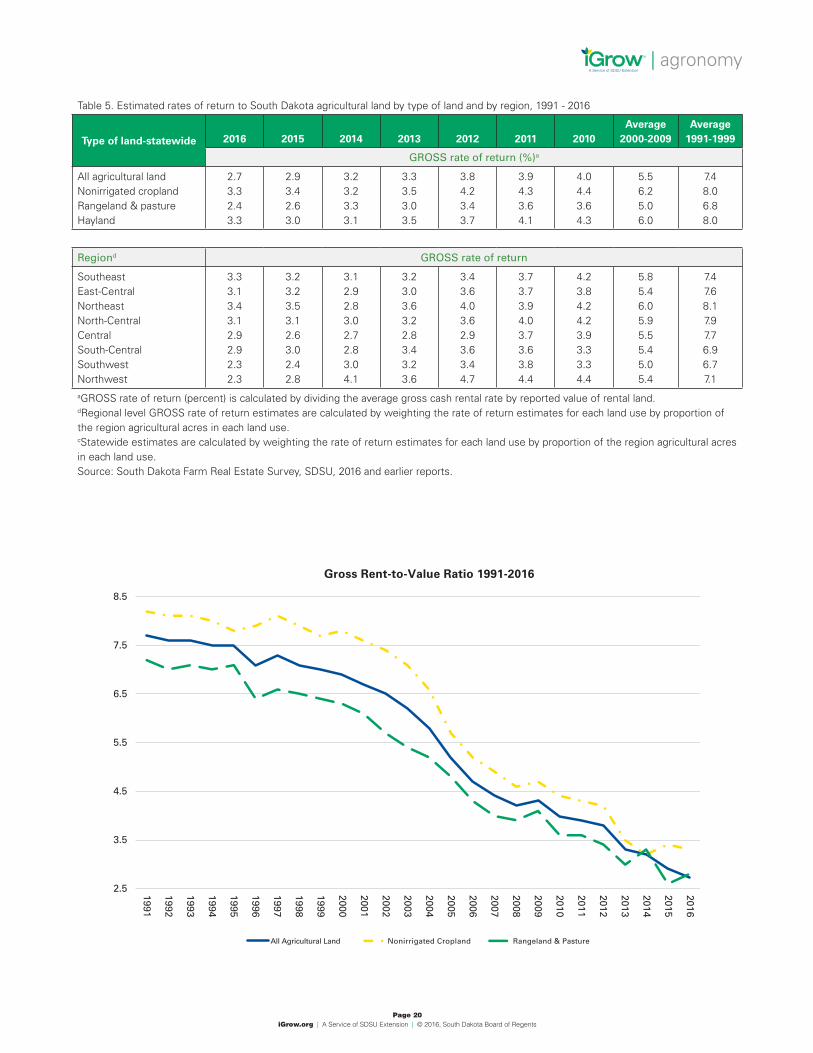
Rates of Return to South Dakota’s Agricultural LandThe gross rate of return (gross cash rent as a percent of land value) is used to estimate current rates of return to land. It is calculated from respondent’s reported average cash rental rates and their estimated values of leased land. This is a measure of the gross rate of return obtained by landlords, before deduction of property taxes and other landlord expenses. The 1991 to 2016 trend in the gross cash rent-to-value ratio is depicted in Figure 8.
In 2016, the statewide average gross rates of return
(rent-to-value ratio) differed somewhat across land use categories: 2.4% for rangeland, 3.3% for hayland, 3.3% for non-irrigated cropland and 2.7% for all-agricultural land. The annual average gross cash rates of return for all-land, rangeland and hayland are the lowest calculated over the past 26 years. The gross rate of return for cropland is the second lowest in the past 26 years.
This is the seventh consecutive year that gross rates of return for all-agricultural land has been 4.0% or lower, compared to an average of 5.5% from 2000 – 2009 and 7.4% during the 1990’s (Table 5).
Respondents were also asked to estimate the current net rate of return (percent) that landowners in their locality could expect given current land values. Appraisers refer to this measure as the market-derived capitalization rate, which is widely used in the income approach to farmland appraisal. The net rate of return is a return to agricultural landownership after deducting property taxes, real estate maintenance, and other ownership expenses from gross cash rent (or other gross rental income measures). In 2016, the average percent net rates of return are approximately 2.5% for cropland and for hayland the average net rate of return is 2.4%, compared to 2.3% for rangeland. The median net rate of return varies from 2.7% for cropland to 2.5% for hayland and only 2.2% for rangeland.
Longer Term Perspective on Farmland Market Changes, 1991 – 2016Longer-term historical data from annual SDSU surveys of agricultural land values and cash rental rates in South Dakota from 1991 to 2016 are located in Appendix Tables 2 and 3 of this report. Long-term trends in average annual cash rates of return are shown in Figure 8. Recent annual reports have emphasized similarities and differences that have occurred across different regions, land uses, and specific time periods. In this report and in the 2015 report, we focus on the major economic supply and demand factors that led to the patterns of changes over time in land values and cash rental rates.
From 1991 to 2016, agricultural land values in South Dakota, and in most other major agricultural production states, have generally appreciated each year. In 2016
Page 20 iGrow.org | A Service of SDSU Extension | © 2016, South Dakota Board of Regents
| agronomy
Table 5. Estimated rates of return to South Dakota agricultural land by type of land and by region, 1991 - 2016
Type of land-statewide 2016 2015 2014 2013 2012 2011 2010Average
2000-2009Average
1991-1999
GROSS rate of return (%)a
All agricultural landNonirrigated croplandRangeland & pastureHayland
2.73.32.43.3
2.93.42.63.0
3.23.23.33.1
3.33.53.03.5
3.84.23.43.7
3.94.33.64.1
4.04.43.64.3
5.56.25.06.0
7.48.06.88.0
Regiond GROSS rate of return
SoutheastEast-CentralNortheastNorth-CentralCentralSouth-CentralSouthwestNorthwest
3.33.13.43.12.92.92.32.3
3.23.23.53.12.63.02.42.8
3.12.92.83.02.72.83.04.1
3.23.03.63.22.83.43.23.6
3.43.64.03.62.93.63.44.7
3.73.73.94.03.73.63.84.4
4.23.84.24.23.93.33.34.4
5.85.46.05.95.55.45.05.4
7.47.68.17.97.76.96.77.1
aGROSS rate of return (percent) is calculated by dividing the average gross cash rental rate by reported value of rental land. dRegional level GROSS rate of return estimates are calculated by weighting the rate of return estimates for each land use by proportion of the region agricultural acres in each land use. cStatewide estimates are calculated by weighting the rate of return estimates for each land use by proportion of the region agricultural acres in each land use. Source: South Dakota Farm Real Estate Survey, SDSU, 2016 and earlier reports.
2.5
3.5
4.5
5.5
6.5
7.5
8.5
1991
1992
1993
1994
1995
1996
1997
1998
1999
2000
2001
2002
2003
2004
2005
2006
2007
2008
2009
2010
2011
2012
2013
2014
2015
2016
Gross Rent-to-Value Ratio 1991-2016
All Agricultural Land Nonirrigated Cropland Rangeland & Pasture
Page 21 iGrow.org | A Service of SDSU Extension | © 2016, South Dakota Board of Regents
| agronomy
all classes of land decreased except rangeland, which had a statewide increase of 2.9 percent (Table 1). Since the amount of land devoted to production agriculture has changed little during this 26-year period, the supply of land is considered as relatively fixed. As a result, changes in demand for land are the main factors driving its value and market price. Many factors influence the demand for agricultural land in states such as South Dakota, and the next several sections of this bulletin address these relationships.
Factors Affecting Demand for FarmlandAccording to MacDonald, Korb, and Hoppe (2013), cropland in the U.S. has been shifting from medium-sized farms to larger operations. The reasons for this structural change are complex, but some relate to economic efficiencies captured from size and scale increases. These authors report that the estimated midpoint acreage for U.S. cropland was 589 acres in 1982 and 1,105 acres in 2007. This midpoint is the size at which half of all cropland is on farms with more acres than the midpoint, and half are on farms having less acres than the midpoint. However, they also report a recent growth in the number of small-sized farms. As a result, average farm size in the United States has changed little over the past few decades.
Similar changes have also affected the average size, distribution, and number of South Dakota farms and ranches. While many unique factors influence a decision to farm or ranch, other variables influence operation size. One factor influencing the latter is called economies of size.
Economies of SizeEconomies of size are achieved when a farm or ranch manager reduces cost per unit of production by expanding operation size. For example, buying or renting more land, holding other fixed costs constant, achieves economies of size because the fixed costs held constant are now spread over more acres. This expansion increases profit per-acre because total costs per-acre are decreased. Even if an increase in farm or ranch size results in an increase in fixed costs (such as increased depreciation expense from use of larger equipment and machinery), economies of size are still achieved if an acreage expansion is proportionally
greater than the increase in fixed costs per-acre.
Economies of size clearly affect farm expansion decisions for both purchase and rental of additional land. Farm expansion has been the first or second leading reason listed by respondents for purchasing South Dakota farmland in all 26 years of this annual survey.
Thus, economies of size reflect powerful forces that influence operation size in agriculture as well as in other industries. Another factor that affects the demand for agricultural land is net income.
Net Farm IncomeThe value of a capital asset – such as real estate – is positively correlated with the asset’s earning potential. For agricultural land, net farm income is one measure of returns and recent strength in crop and livestock prices has pushed net farm income to historically high levels. According to data from USDA - ERS, net farm income in South Dakota increased from $1 billion in 1990 to nearly $4.7 billion in 2013. This increase over time occurred while the number of South Dakota farms and ranches decreased. Clearly, gains in commodity prices have increased farm and ranch income which in turn affected demand for agriculture land, both rental and purchase demand. Major spikes in commodity prices during the past 26 years have led to increases in net farm income and demand for farmland. In addition to increases in net farm income, productivity gains also affect land values and cash rents. However, the projection for net farm income for 2015 and 2016 are downward primarily due to lower commodity prices.
Agricultural ProductivityAs U.S. agricultural productivity has grown, so has the value of land. An increase in productivity makes an input – such as land - more valuable because more units of output are produced per unit of input. For cropland, rangeland, and pastureland higher productivity means increased livestock and crop production per-acre of land. To measure agriculture productivity, USDA uses total factor productivity (TFP), which accounts for changes in output with respect to all inputs used in the production process. TFP has grown consistently in U.S. production agriculture. For example, from 1948 to 2011 the U.S. average

Page 22 iGrow.org | A Service of SDSU Extension | © 2016, South Dakota Board of Regents
| agronomy
annual growth rate of TFP was 1.42 percent. In other words, annual output growth increased 1.42 percent on average during this period, holding input levels constant.
The primary source of productivity increases in U.S. and South Dakota agriculture has been technological advances. Farmers and ranchers have benefited from greater mechanization and from technological advances that have occurred in many fields of science such as chemistry, biology, genetics, engineering, and management.
Land as an InvestmentWhen investors consider whether to include a particular asset class in their investment portfolio, they compare the potential returns from each class. For example, an investment in land offers returns such as net farm income or economic rent. The appreciating value of land also represents an investment gain. Other investment classes such as equities (stocks) and bonds offer returns that can be compared to returns from owning land. When various investments are ranked, those with the highest expected returns are preferred. Analysts will also compare potential returns of an investment to expected inflation – essentially comparing the investment to cash. Ignoring risk, investments that outperform inflation are preferred to holding cash.
For much of the U.S. and in South Dakota, the value of agriculture land has been growing faster than inflation. In fact, land prices in South Dakota have increased faster than the rate of general price inflation in almost all of the past 26 years. For example, South Dakota agricultural land values have increased 10% annually (on average) between 1991 and 2016. During the same time period, the U.S. annual inflation rate has seldom exceeded four percent and has often been less than two percent. Clearly, farmers and other investors purchasing agricultural land as a hedge against inflation have benefited from that decision.
The rapidly growing use of subsidized revenue crop insurance along with increased availability of yield-increasing and more drought-tolerant crop varieties has likely reduced perceived risk of producing selected crops in South Dakota. This combination of (modest)
risk reduction and increased profit potential has also contributed to increased cash rents and values.
Furthermore, sharp declines in farm mortgage interest rates from early 2001 to late 2004 and continued relatively low mortgage interest rates (and low general price inflation rates) has also affected land investment decisions. It has helped lower the investment “hurdle rate” for cost of capital. However, lower interest rates have also led to reductions in the ratio gross (and net) cash return as a percent of land price (Figure 8). During the 1990’s, cash rental rates and land values increased at similar rates. However, since the major reductions in long-term interest rates (starting in 2001) cash rental rates have increased at a slower rate than land values, which has reduced the rent-to-value ratio for all agricultural land from an average of 7.4% in the 1990’s to less than 4% since 2010.
Respondents’ Assessment of Factors Influencing Farmland Markets in South DakotaRespondents to the 2016 annual survey were asked to list major positive and negative factors affecting the farm real estate markets in their localities. These factors play important roles in explaining the changes that occurred in the amount of farmland sold in the past year. Also it explains the direction of changes in rental rates and sale prices of farmland. Seventy eight percent of the survey respondents listed one to three positive reasons, and 4.5% indicated there was nothing positive in the market when asked. Eighty nine percent
14%
11%
13%
37%
5%
2%
1%16%
Figure 9. Positive Factors Currently Impacting the Farm Real Estate Market 2016
Expansion/excess cash
Investments
High cattle prices/high yields/stable market
Low interest rates
None
Demand for land
Lack of supply of land
Other

Page 23 iGrow.org | A Service of SDSU Extension | © 2016, South Dakota Board of Regents
| agronomy
of the total respondents listed one to three negative reasons affecting the real estate market (Figure 9).
Low interest rates was the most frequently listed positive factor affecting agriculture real estate values (37% of responses). Expansion and excess cash were listed as the second most positive market factor affecting farm market real estate purchases, at 14 percent. Commodity prices, especially livestock prices, were listed as the next major reason cited with 13% of responses. Investment made up 11% of the responses and other reasons being 16% (Figure 9).
The decline in commodity prices dominated the negative factors in the real estate market at 70% of the total responses. Lack of profitability was the next most frequent response with 10 percent, followed, by other reasons (5%) and input costs (5%) (Figure 10).
Agricultural Land Market Expectations: Past and ProspectiveIn each survey, respondents were asked to estimate the percentage change in land values during the previous year and to forecast percentage changes in land values for the forthcoming year. Nearly 80% of respondents provided their perception of previous year cropland value changes, compared to 69% for rangeland and 60% for hayland. Almost the same percentage of respondents, in each land use category, projected land value changes for next year (2017).
Compared to prior years, a fair percentage of
respondents reported decreases in land values, especially for cropland. This year, 28% of respondents reported declines in cropland values from 2015 to 2016, 26% reported declines in hayland values, and 26% reported declines in rangeland / pasture values.
Increasing cropland values from 2015 to 2016 were reported by 17% of respondents, compared to 16% and 25%, respectively, reporting increasing hayland values and rangeland values. As a comparison more than 80% of respondents reported increasing land values across all land uses in 2014, while 94% of respondents reported increasing land values in 2012 and 2013. This continues the trend from 2015 of declining values for agricultural land.
Forecasts of future land price changes are lower than forecasts made in recent years. This year, only 10% of cropland responses, 11% of hayland responses, and 12% of rangeland / pasture responses forecast increasing land values for next year. By comparison, decreasing land values for next year are forecast by 60% of cropland responses, 22% of hayland responses, and 48% of pasture / rangeland responses.
The forecast percentage change in land values from winter 2015 to 2016 had an average of -2% for cropland, -1% for hayland, and +0.1% for rangeland.
There were not a lot of regional differences this year in terms of respondent perception of past year changes and forecasts for next year. In general, responses for past year and forecasted land values were negative for crop and hayland, with slightly positive perceptions for this year and slightly negative perceptions for next year for rangeland.
Overall, respondents to the 2016 survey are even less optimistic (compared to 2015 respondents) about farmland market conditions for the following year. The ratio of positive to negative forecasts is 1:2.5 for cropland, 1:2.5 for hayland, and 1:1 for rangeland. In other words, there is a lot more concern that cropland and hayland values may decline compared to rangeland. The prevailing view is that lower crop prices, compared to crop prices in 2012 and 2013, will remain for some time and “force” cropland cash rents downward along with declines in cropland values.
10%
70%
5%
3%
1%
2% 1% 1%
6%
Figure 10. Negative Factors Currently Impacting the Farm Real Estate Market
Lack of profitability Low comodity prices State of the Ag Economy
High input prices High land prices Lack of supply
Demand for land High rental rates Other
Page 24 iGrow.org | A Service of SDSU Extension | © 2016, South Dakota Board of Regents
| agronomy
List of References **Federal Reserve Bank of Minneapolis. 2014.
Agricultural Credit Conditions reports. http://www.minneapolisfed.org/.
Janssen, Larry. 1999. Agricultural land values in South Dakota: a comparison of two surveys. SDSU Econ Research Report 99-1.
Janssen, Larry and Xuan Xu. 2003. Farmland leasing in South Dakota. Ag Expt. Station Bulletin 739. South Dakota State University, Brookings, SD.
Janssen, Larry; Kim Dillivan, and Bronc McMurtry. 2014. South Dakota agricultural land market trends, 1991 – 2014. SDSU Ag Expt. Station Circular 03-7000-2014. Brookings, http://igrow.org/up/resources/03-7000-2014.pdf
Janssen, Larry; Burton Pflueger, and Bronc McMurtry. 2013. South Dakota agricultural land market trends, 1991 – 2013. SDSU Ag Expt. Station Circular 03-7007-2013. Brookings, http://igrow.org/up/resources/03-7007-2013.pdf
Janssen, Larry and Burton Pflueger. 2012. South Dakota agricultural land market trends, 1991 – 2012. SDSU Ag Expt. Station Circular 03-3007-2012. Brookings, SD. http://igrow.org/up/resources/03-3007-2012.pdf.
MacDonald, James M., Penni Korb, and Robert A. Hoppe. 2013. Farm Size and the Organization of U.S. Crop Farming, ERR-152. U.S. Department of Agriculture, Economic Research Service, August.
Pflueger, Burton. South Dakota Agricultural Rental Agreements: What is a Fair Lease Arrangement? Extension Extra 5061. South Dakota State University, 2007. http://pubstorage.sdstate.edu/AgBio_Publications/articles/ExEx5061.pdf
-----. Crop cash lease agreements. Extension Extra 5063. South Dakota State University, 2007. http://pubstorage.sdstate.edu/AgBio_Publications/articles/ExEx5063.pdf
-----. Cash farm lease (short version). Extension Extra 5064. South Dakota State University, 2007. http://pubstorage.sdstate.edu/AgBio_Publications/articles/ExEx5064.pdf
-----. Crop Share Lease Agreements, Extension Extra 5065. South Dakota State University, 2007. http://pubstorage.sdstate.edu/AgBio_Publications/articles/ExEx5065.pdf
-----. Crop Share Farm Lease (Short Version) Extension Extra 5066. South Dakota State University, 2007. http://pubstorage.sdstate.edu/AgBio_Publications/articles/ExEx5066.pdf
-----. Flexible-Cash Lease Agreements. Extension Extra 5067. South Dakota State University, 2007. http://pubstorage.sdstate.edu/AgBio_Publications/articles/ExEx5067.pdf
-----. Flexible-cash farm lease (short version). Extension Extra 5068. South Dakota State University, 2007. http://agbiopubs.sdstate.edu/articles/ExEx5068.pdf.
-----. Pasture lease agreements. Extension Extra 5071. South Dakota State University, 2007. http://pubstorage.sdstate.edu/AgBio_Publications/articles/ExEx5071.pdf
-----. Pasture lease (short version). Extension Extra 5072. South Dakota State University, 2007. http://pubstorage.sdstate.edu/AgBio_Publications/articles/ExEx5072.pdf
-----. Agricultural and Grazing Leases of South Dakota School and Public Lands. Extension Extra 5077. South Dakota State University, 2009. http://pubstorage.sdstate.edu/AgBio_Publications/articles/ExEx5077.pdf
-----. South Dakota’s Rental Agreements: What is a Legal Lease. Extension Extra 5078. South Dakota State University, 2010. http://pubstorage.sdstate.edu/AgBio_Publications/articles/ExEx5078.pdf
U.S. Dept. of Agriculture. 2007 Census of Agriculture, South Dakota. v. 41.
Page 25 iGrow.org | A Service of SDSU Extension | © 2016, South Dakota Board of Regents
| agronomy
U.S. Dept. of Agriculture. 2012 Census of Agriculture, South Dakota. v. 41.
U.S. Dept. of Agriculture. Economic Research Service. Agricultural Productivity in the U.S. http://www.ers.usda.gov/data-products/agricultural-productivity
U.S. Dept. of Agriculture. 2014. National Agricultural Statistics Service. “Land Values: 2014 Summary”, August.
U.S. Dept. of Agriculture. 2014. National Agricultural Statistics Service. South Dakota Agriculture 2014, Bulletin No. 74. June
U.S. Dept. of Agriculture 2015. http://quickstats.nass.usda.gov/results/2641D88F-F934-3050-AE7E-0B6282C710E4
U.S. Dept. of Commerce. 2014. Bureau of Economic Analysis. Various reports.
U.S. Dept. of Labor. 2014. Bureau of Labor Statistics. Various reports.
** Reference citations for annual SDSU farm real estate survey reports from 2001 through 2011 are not listed above but were published in print and electronic format. These reports were published as SDSU Agricultural Experiment Station (AES) Circulars 266, 267, 268 269, 270, 271, 272, 273, 275, 276, and 278. Annual reports from 1991 through 2000 were only published in print format. Dr. Janssen and Dr. Pflueger, often in collaboration with an SDSU Economics student, were the co-authors of each annual report from 1991 through 2013.
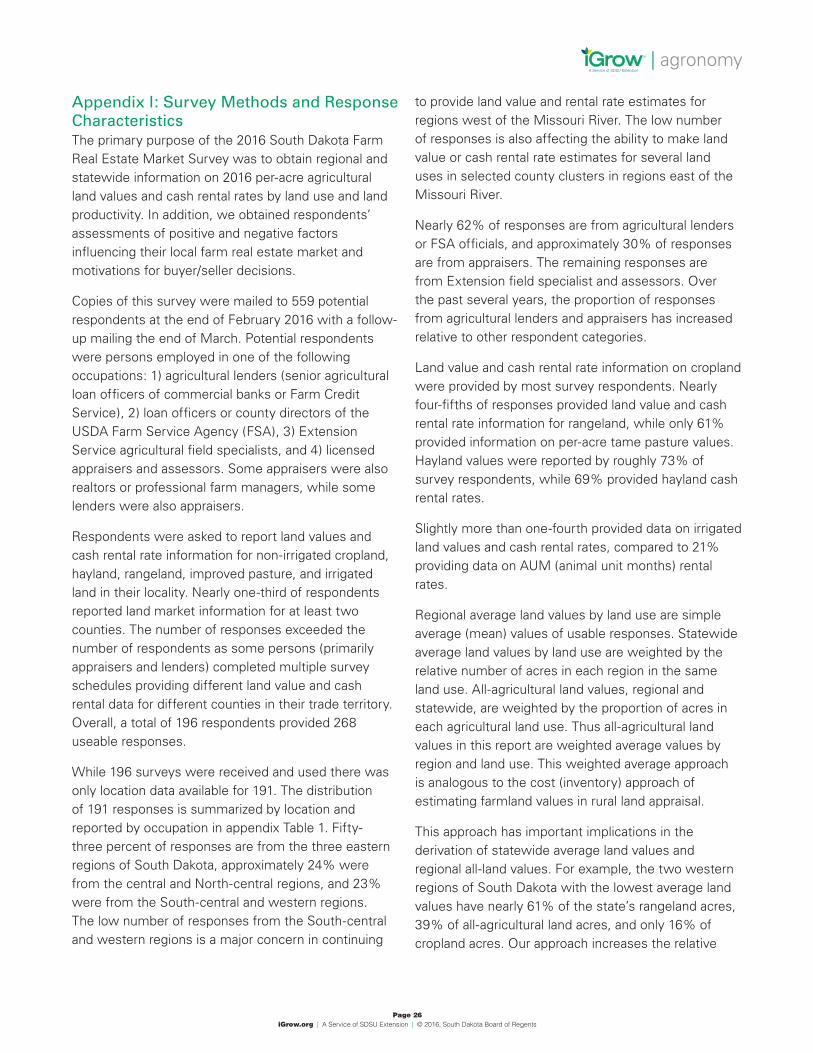
Page 26 iGrow.org | A Service of SDSU Extension | © 2016, South Dakota Board of Regents
| agronomy
Appendix I: Survey Methods and Response CharacteristicsThe primary purpose of the 2016 South Dakota Farm Real Estate Market Survey was to obtain regional and statewide information on 2016 per-acre agricultural land values and cash rental rates by land use and land productivity. In addition, we obtained respondents’ assessments of positive and negative factors influencing their local farm real estate market and motivations for buyer/seller decisions.
Copies of this survey were mailed to 559 potential respondents at the end of February 2016 with a follow-up mailing the end of March. Potential respondents were persons employed in one of the following occupations: 1) agricultural lenders (senior agricultural loan officers of commercial banks or Farm Credit Service), 2) loan officers or county directors of the USDA Farm Service Agency (FSA), 3) Extension Service agricultural field specialists, and 4) licensed appraisers and assessors. Some appraisers were also realtors or professional farm managers, while some lenders were also appraisers.
Respondents were asked to report land values and cash rental rate information for non-irrigated cropland, hayland, rangeland, improved pasture, and irrigated land in their locality. Nearly one-third of respondents reported land market information for at least two counties. The number of responses exceeded the number of respondents as some persons (primarily appraisers and lenders) completed multiple survey schedules providing different land value and cash rental data for different counties in their trade territory. Overall, a total of 196 respondents provided 268 useable responses.
While 196 surveys were received and used there was only location data available for 191. The distribution of 191 responses is summarized by location and reported by occupation in appendix Table 1. Fifty-three percent of responses are from the three eastern regions of South Dakota, approximately 24% were from the central and North-central regions, and 23% were from the South-central and western regions. The low number of responses from the South-central and western regions is a major concern in continuing
to provide land value and rental rate estimates for regions west of the Missouri River. The low number of responses is also affecting the ability to make land value or cash rental rate estimates for several land uses in selected county clusters in regions east of the Missouri River.
Nearly 62% of responses are from agricultural lenders or FSA officials, and approximately 30% of responses are from appraisers. The remaining responses are from Extension field specialist and assessors. Over the past several years, the proportion of responses from agricultural lenders and appraisers has increased relative to other respondent categories.
Land value and cash rental rate information on cropland were provided by most survey respondents. Nearly four-fifths of responses provided land value and cash rental rate information for rangeland, while only 61% provided information on per-acre tame pasture values. Hayland values were reported by roughly 73% of survey respondents, while 69% provided hayland cash rental rates.
Slightly more than one-fourth provided data on irrigated land values and cash rental rates, compared to 21% providing data on AUM (animal unit months) rental rates.
Regional average land values by land use are simple average (mean) values of usable responses. Statewide average land values by land use are weighted by the relative number of acres in each region in the same land use. All-agricultural land values, regional and statewide, are weighted by the proportion of acres in each agricultural land use. Thus all-agricultural land values in this report are weighted average values by region and land use. This weighted average approach is analogous to the cost (inventory) approach of estimating farmland values in rural land appraisal.
This approach has important implications in the derivation of statewide average land values and regional all-land values. For example, the two western regions of South Dakota with the lowest average land values have nearly 61% of the state’s rangeland acres, 39% of all-agricultural land acres, and only 16% of cropland acres. Our approach increases the relative
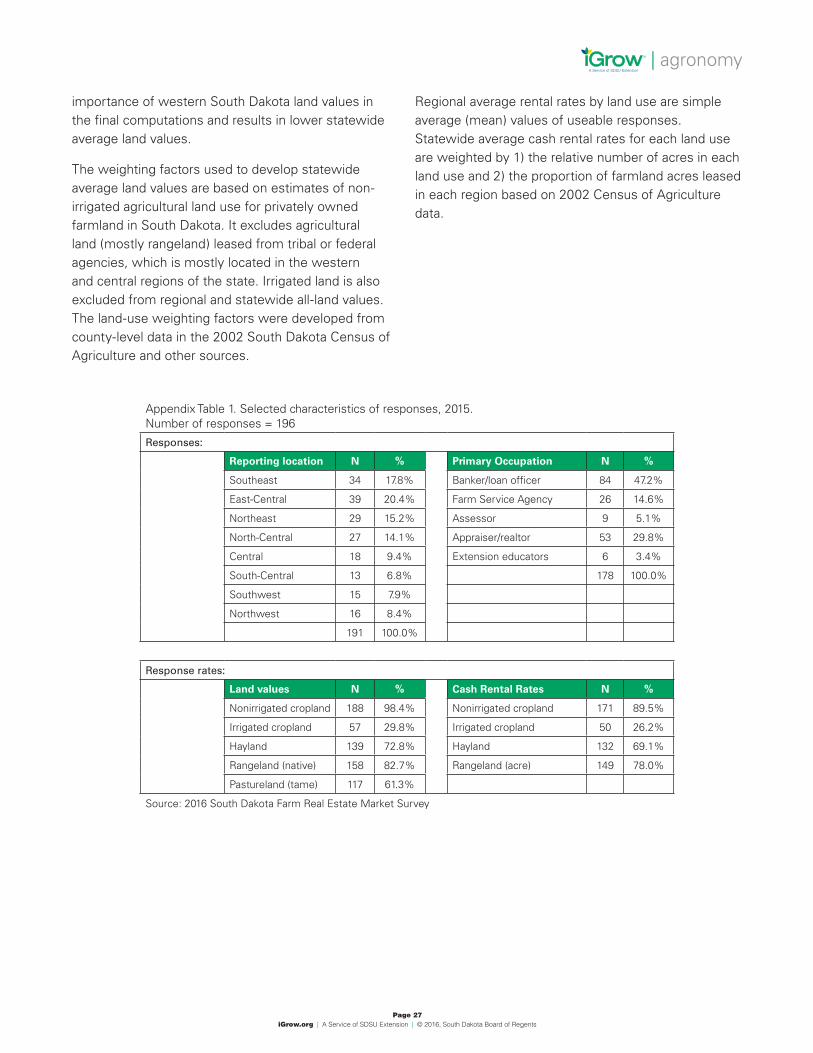
Page 27 iGrow.org | A Service of SDSU Extension | © 2016, South Dakota Board of Regents
| agronomy
importance of western South Dakota land values in the final computations and results in lower statewide average land values.
The weighting factors used to develop statewide average land values are based on estimates of non-irrigated agricultural land use for privately owned farmland in South Dakota. It excludes agricultural land (mostly rangeland) leased from tribal or federal agencies, which is mostly located in the western and central regions of the state. Irrigated land is also excluded from regional and statewide all-land values. The land-use weighting factors were developed from county-level data in the 2002 South Dakota Census of Agriculture and other sources.
Regional average rental rates by land use are simple average (mean) values of useable responses. Statewide average cash rental rates for each land use are weighted by 1) the relative number of acres in each land use and 2) the proportion of farmland acres leased in each region based on 2002 Census of Agriculture data.
Appendix Table 1. Selected characteristics of responses, 2015.Number of responses = 196
Responses:
Reporting location N % Primary Occupation N %
Southeast 34 17.8% Banker/loan officer 84 47.2%
East-Central 39 20.4% Farm Service Agency 26 14.6%
Northeast 29 15.2% Assessor 9 5.1%
North-Central 27 14.1% Appraiser/realtor 53 29.8%
Central 18 9.4% Extension educators 6 3.4%
South-Central 13 6.8% 178 100.0%
Southwest 15 7.9%
Northwest 16 8.4%
191 100.0%
Response rates:
Land values N % Cash Rental Rates N %
Nonirrigated cropland 188 98.4% Nonirrigated cropland 171 89.5%
Irrigated cropland 57 29.8% Irrigated cropland 50 26.2%
Hayland 139 72.8% Hayland 132 69.1%
Rangeland (native) 158 82.7% Rangeland (acre) 149 78.0%
Pastureland (tame) 117 61.3%
Source: 2016 South Dakota Farm Real Estate Market Survey

Page 28 iGrow.org | A Service of SDSU Extension | © 2016, South Dakota Board of Regents
| agronomy
Appendix Table 2. Average reported value and annual percentage change in value of South Dakota agricultural land by type of land by region, February, 1991-2016.
Type of LandSouth-
eastEast-
CentralNorth-east
North-Central
CentralSouth-Central
South-west
North-west
STATE
All Agricultural Land (nonirrigated) dollars per acre Average value, 2016 Average value, 2015 Average value, 2014 Average value, 2013 Average value, 2012 Average value, 2011 Average value, 2010 Average value, 2009 Average value, 2008 Average value, 2007 Average value, 2006 Average value, 2005 Average Value, 2004 Average value, 2003 Average value, 2002 Average value, 2001 Average value, 2000 Average value, 1999 Average value, 1998 Average value, 1997 Average value, 1996 Average value, 1995 Average value, 1994 Average value, 1993 Average value, 1992 Average value, 1991 Av annual % change 16/91 Annual % change 16/15
47524995538549544014290024472355216817681583137211471017930893794740772665643633567548519526
9.2%-4.9%
5069518657635504389033322712263424731946164314271162903875785673644610591522473497498474466
10.0%-2.3%
366139403962368425872274200618631714142211741029779641560519492452452432414419393399368362
9.7%-7.1%
318232263319321723251720148712701179945849736629549501450404378353323294279293254259227
11.1%-1.4%
308030352931267822571450126812461152899803711594522424373352345346302296264255233223225
11.0%1.5%
1584163414611294917781648690642521462414377309313284286273280241217222191199186177
9.2%-3.1%
82796462060646145941141337832228627522320020216716716615513912613011211110497
9.0%-14.2%
83673751253636934232930729528525621119217715014313112211711111510394908984
9.6%13.4%
244425052470232817421374117911211041850743650541461421384352331328298280268250241231223
10.1%-2.4%
Nonirrigated Cropland dollars per acre Average value, 2016 Average value, 2015 Average value, 2014 Average value, 2013 Average value, 2012 Average value, 2011 Average value, 2010 Average value, 2009 Average value, 2008 Average value, 2007 Average value, 2006 Average Value, 2005 Average Value, 2004 Average value, 2003 Average value, 2002 Average value, 2001 Average value, 2000 Average value, 1999 Average value, 1998 Average value, 1997 Average value, 1996 Average value, 1995 Average value, 1994 Average value, 1993 Average value, 1992 Average value, 1991 Av annual % change 16/91 Annual % change 16/15
5653588763315903481734022841274125101999181715561315115610571023910866903777751732661655616623
9.2%-4.0%
611663297114682847344024329131552894224419141659134610401019911785756728699613555590595574554
10.1%-3.4%
461350665291484333692918256023052076176214481255973793691652620565564535514522488497460450
9.8%-8.9%
41774275461445623026230119451673153211871088967822716665592520488452412372353382326342294
11.2%-2.3%
3843389539533580294618661644157714501086986871705631524456436435434386371332331305300300
10.7%-1.3%
2168228320871994134811159671007904702612568541443445423417402399348317326289302287272
8.7%-5.0%
12641347820900677625560596502426387383318290311245248246241217214237218197196185
8.0%-6.2%
11871193870792496483474428399367342316294281244223208202200188191185169163167153
8.5%-0.5%
409442654478424930842389203019001733137512111064882743684626567534534486455437426412400384
9.9%-4.0%
Source:South Dakota Farm Real Estate Market Surveys, SDSU, 2016 and earlier. Statewide values by land use are based on 2002 regional land use weights

Page 29 iGrow.org | A Service of SDSU Extension | © 2016, South Dakota Board of Regents
| agronomy
Appendix Table 2. (continued)
Type of LandSouth-
eastEast-
CentralNorth-east
North-Central
CentralSouth-Central
South-west
North-west
STATE
Rangeland (native) dollars per acre Average value, 2016 Average value, 2015 Average value, 2014 Average value, 2013 Average value, 2012 Average value, 2011 Average value, 2010 Average value, 2009 Average value, 2008 Average value, 2007 Average value, 2006 Average value, 2005 Average value, 2004 Average value, 2003 Average value, 2002 Average value, 2001 Average value, 2000 Average value, 1999 Average value, 1998 Average value, 1997 Average value, 1996 Average value, 1995 Average value, 1994 Average value, 1993 Average value, 1992 Average value, 1991 Av annual % change 16/91 Annual % change 16/15
2566271926982308193015891339125812391073925781684609538488456405408364336354319283271268
9.5%-5.6%
27812727286127652108177915361458153912931055844764580543478417386346354311303283276267271
9.8%2.0%
202821361859175913451217107011251100889751667465389353315297276274268250247228232209205
9.6%-5.1%
19571758160014731387950875755714634548458396345297270253241226204194184184169163147
10.9%11.3%
221921001828163614931011865898836708599552456397325284265255256214214197190175159163
11.0%5.7%
133013381187994724634514570544448397346312257260232235220231197177180149157145137
9.5%-0.6%
71585157152940140936535833929525524119617617214314314313011610010185898074
9.5%-16.0%
7606304364443413092962772712652341851671531271241111029892978380767469
10.1%20.6%
12221187987909737611540530508448386332283246221198187177172155147140128125117112
10.0%2.9%
Pasture (tame, improved) dollars per acre Average value, 2016 Average value, 2015 Average value, 2014 Average value, 2013 Average value, 2012 Average value, 2011 Average value, 2010 Average value, 2009 Average value, 2008 Average value, 2007 Average value, 2006 Average Value, 2005 Average Value, 2004 Average value, 2003 Average value, 2002 Average value, 2001 Average value, 2000 Average value, 1999 Average value, 1998 Average value, 1997 Average value, 1996 Average value, 1995 Average value, 1994 Average value, 1993 Average value, 1992 Average value, 1991 Av annual % change 16/91 Annual % change 16/15
28112945296827212275172614801378136511671085937754683639564516453461416379385371326328315
9.1%-4.6%
298829083098317623712082162918021675146111661018818710607522481437406373358346335333306325
9.3%2.8%
230925452244207416781494117813731304987843730517448391342334314297299279262251249257252
9.3%-9.3%
206722241958177815501161991827795698598465424389327301289266264236231218200194194170
10.5%-7.1%
23202557222022221772117910611042943760711610518493345332303290302265258214224194190199
10.3%-9.3%
1431150013091129844762650571571524425397337294287258268240272222188214194193176163
9.1%-4.6%
71294359657143146542942938430328329121719119317616716116113812711710910410092
8.5%-24.5%
80276948352337334432031430729728222719816315615314412512011411510293988894
9.0%4.3%
170418201603154212181011854857809684596519420372327297279256254230217206196188182179
9.4%-6.4%
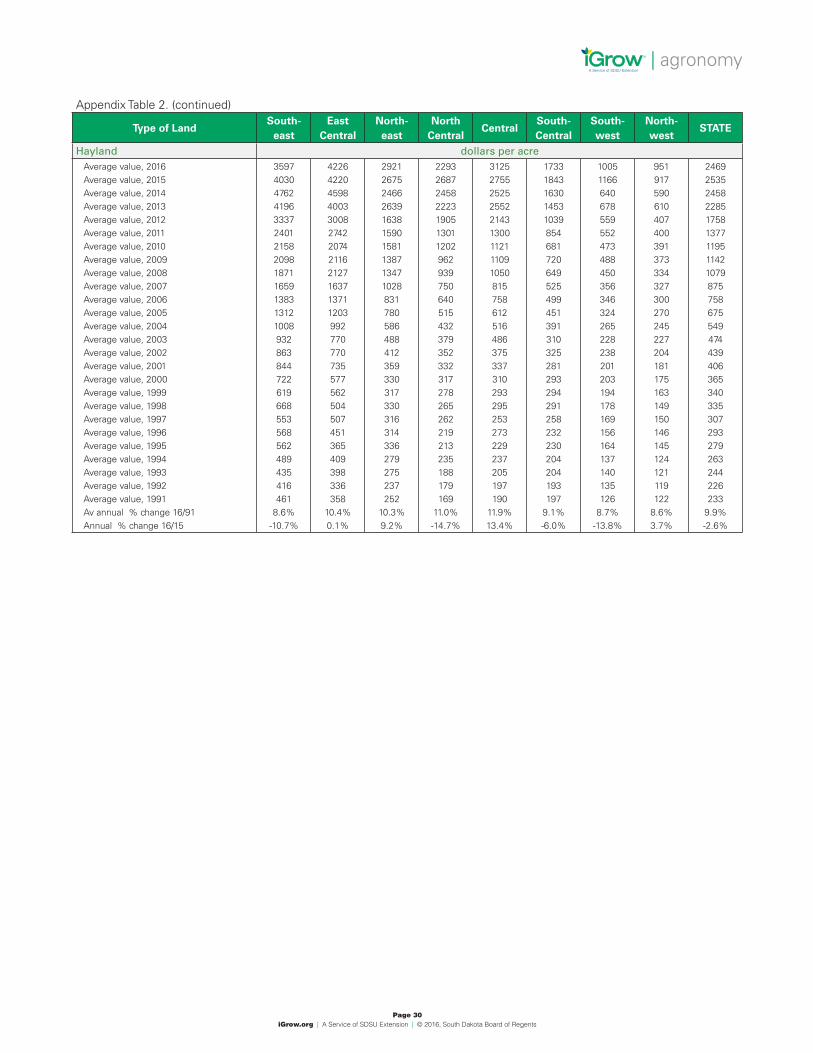
Page 30 iGrow.org | A Service of SDSU Extension | © 2016, South Dakota Board of Regents
| agronomy
Appendix Table 2. (continued)
Type of LandSouth-
eastEast
CentralNorth-east
NorthCentral
CentralSouth-Central
South-west
North-west
STATE
Hayland dollars per acre Average value, 2016 Average value, 2015 Average value, 2014 Average value, 2013 Average value, 2012 Average value, 2011 Average value, 2010 Average value, 2009 Average value, 2008 Average value, 2007 Average value, 2006 Average value, 2005 Average value, 2004 Average value, 2003 Average value, 2002 Average value, 2001 Average value, 2000 Average value, 1999 Average value, 1998 Average value, 1997 Average value, 1996 Average value, 1995 Average value, 1994 Average value, 1993 Average value, 1992 Average value, 1991 Av annual % change 16/91 Annual % change 16/15
3597403047624196333724012158209818711659138313121008932863844722619668553568562489435416461
8.6%-10.7%
422642204598400330082742207421162127163713711203992770770735577562504507451365409398336358
10.4%0.1%
2921267524662639163815901581138713471028831780586488412359330317330316314336279275237252
10.3%9.2%
2293268724582223190513011202962939750640515432379352332317278265262219213235188179169
11.0%-14.7%
312527552525255221431300112111091050815758612516486375337310293295253273229237205197190
11.9%13.4%
17331843163014531039854681720649525499451391310325281293294291258232230204204193197
9.1%-6.0%
10051166640678559552473488450356346324265228238201203194178169156164137140135126
8.7%-13.8%
951917590610407400391373334327300270245227204181175163149150146145124121119122
8.6%3.7%
246925352458228517581377119511421079875758675549474439406365340335307293279263244226233
9.9%-2.6%
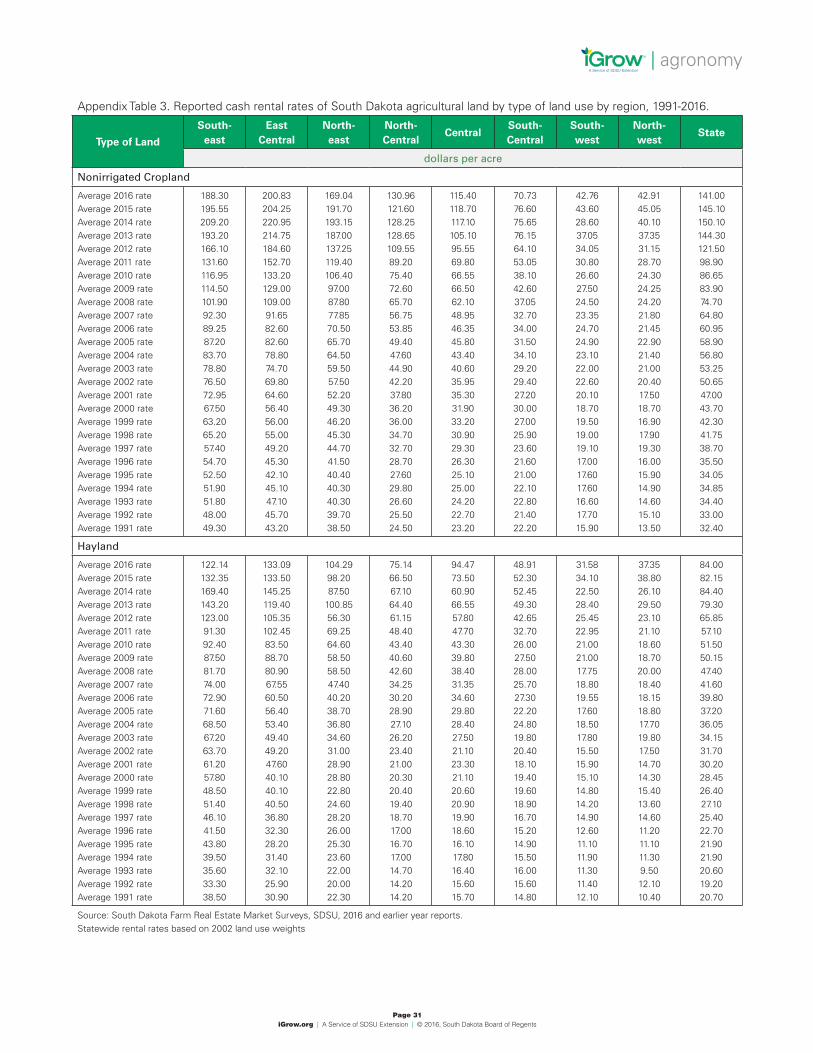
Page 31 iGrow.org | A Service of SDSU Extension | © 2016, South Dakota Board of Regents
| agronomy
Appendix Table 3. Reported cash rental rates of South Dakota agricultural land by type of land use by region, 1991-2016.
Type of Land
South-east
EastCentral
North-east
North-Central
CentralSouth-Central
South-west
North-west
State
dollars per acre
Nonirrigated Cropland
Average 2016 rateAverage 2015 rateAverage 2014 rateAverage 2013 rateAverage 2012 rateAverage 2011 rateAverage 2010 rateAverage 2009 rateAverage 2008 rateAverage 2007 rateAverage 2006 rateAverage 2005 rateAverage 2004 rateAverage 2003 rateAverage 2002 rateAverage 2001 rateAverage 2000 rateAverage 1999 rateAverage 1998 rateAverage 1997 rateAverage 1996 rateAverage 1995 rateAverage 1994 rateAverage 1993 rateAverage 1992 rateAverage 1991 rate
188.30195.55209.20193.20 166.10131.60116.95114.50101.9092.3089.2587.2083.7078.8076.5072.9567.5063.2065.2057.4054.7052.5051.9051.8048.0049.30
200.83204.25220.95214.75 184.60152.70133.20129.00109.0091.6582.6082.6078.8074.7069.8064.6056.4056.0055.0049.2045.3042.1045.1047.1045.7043.20
169.04191.70193.15187.00 137.25119.40106.4097.0087.8077.8570.5065.7064.5059.5057.5052.2049.3046.2045.3044.7041.5040.4040.3040.3039.7038.50
130.96121.60128.25128.65 109.5589.2075.4072.6065.7056.7553.8549.4047.6044.9042.2037.8036.2036.0034.7032.7028.7027.6029.8026.6025.5024.50
115.40118.70117.10105.10 95.5569.8066.5566.5062.1048.9546.3545.8043.4040.6035.9535.3031.9033.2030.9029.3026.3025.1025.0024.2022.7023.20
70.7376.6075.6576.15 64.1053.0538.1042.6037.0532.7034.0031.5034.1029.2029.4027.2030.0027.0025.9023.6021.6021.0022.1022.8021.4022.20
42.7643.6028.6037.05 34.0530.8026.6027.5024.5023.3524.7024.9023.1022.0022.6020.1018.7019.5019.0019.1017.0017.6017.6016.6017.7015.90
42.9145.0540.1037.35 31.1528.7024.3024.2524.2021.8021.4522.9021.4021.0020.4017.5018.7016.9017.9019.3016.0015.9014.9014.6015.1013.50
141.00145.10150.10144.30121.5098.9086.6583.9074.7064.8060.9558.9056.8053.2550.6547.0043.7042.3041.7538.7035.5034.0534.8534.4033.0032.40
Hayland
Average 2016 rateAverage 2015 rateAverage 2014 rateAverage 2013 rateAverage 2012 rateAverage 2011 rateAverage 2010 rateAverage 2009 rateAverage 2008 rateAverage 2007 rateAverage 2006 rateAverage 2005 rateAverage 2004 rateAverage 2003 rateAverage 2002 rateAverage 2001 rateAverage 2000 rateAverage 1999 rateAverage 1998 rateAverage 1997 rateAverage 1996 rateAverage 1995 rateAverage 1994 rateAverage 1993 rateAverage 1992 rateAverage 1991 rate
122.14132.35169.40143.20 123.0091.3092.4087.5081.7074.0072.9071.6068.5067.2063.7061.2057.8048.5051.4046.1041.5043.8039.5035.6033.3038.50
133.09133.50145.25119.40 105.35102.4583.5088.7080.9067.5560.5056.4053.4049.4049.2047.6040.1040.1040.5036.8032.3028.2031.4032.1025.9030.90
104.2998.2087.50
100.85 56.3069.2564.6058.5058.5047.4040.2038.7036.8034.6031.0028.9028.8022.8024.6028.2026.0025.3023.6022.0020.0022.30
75.1466.5067.1064.40 61.1548.4043.4040.6042.6034.2530.2028.9027.1026.2023.4021.0020.3020.4019.4018.7017.0016.7017.0014.7014.2014.20
94.4773.5060.9066.55 57.8047.7043.3039.8038.4031.3534.6029.8028.4027.5021.1023.3021.1020.6020.9019.9018.6016.1017.8016.4015.6015.70
48.9152.3052.4549.30 42.6532.7026.0027.5028.0025.7027.3022.2024.8019.8020.4018.1019.4019.6018.9016.7015.2014.9015.5016.0015.6014.80
31.5834.1022.5028.40 25.4522.9521.0021.0017.7518.8019.5517.6018.5017.8015.5015.9015.1014.8014.2014.9012.6011.1011.9011.3011.4012.10
37.3538.8026.1029.50 23.1021.1018.6018.7020.0018.4018.1518.8017.7019.8017.5014.7014.3015.4013.6014.6011.2011.1011.309.5012.1010.40
84.0082.1584.4079.3065.8557.1051.5050.1547.4041.6039.8037.2036.0534.1531.7030.2028.4526.4027.1025.4022.7021.9021.9020.6019.2020.70
Source: South Dakota Farm Real Estate Market Surveys, SDSU, 2016 and earlier year reports. Statewide rental rates based on 2002 land use weights
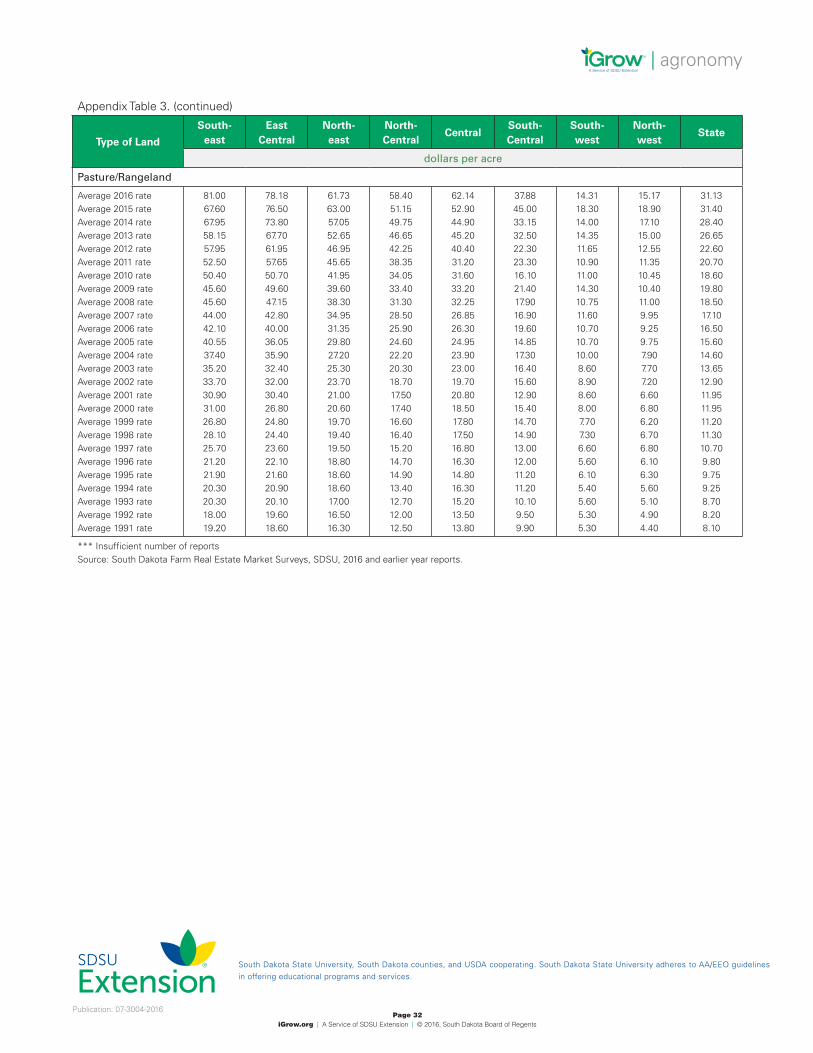
Page 32 iGrow.org | A Service of SDSU Extension | © 2016, South Dakota Board of Regents
| agronomy
Publication: 07-3004-2016
South Dakota State University, South Dakota counties, and USDA cooperating. South Dakota State University adheres to AA/EEO guidelines in offering educational programs and services.
Appendix Table 3. (continued)
Type of Land
South-east
EastCentral
North-east
North-Central
CentralSouth-Central
South-west
North-west
State
dollars per acre
Pasture/Rangeland
Average 2016 rateAverage 2015 rateAverage 2014 rateAverage 2013 rateAverage 2012 rateAverage 2011 rateAverage 2010 rateAverage 2009 rateAverage 2008 rateAverage 2007 rateAverage 2006 rateAverage 2005 rateAverage 2004 rateAverage 2003 rateAverage 2002 rateAverage 2001 rateAverage 2000 rateAverage 1999 rateAverage 1998 rateAverage 1997 rateAverage 1996 rateAverage 1995 rateAverage 1994 rateAverage 1993 rateAverage 1992 rateAverage 1991 rate
81.0067.6067.9558.15 57.9552.5050.4045.6045.6044.0042.1040.5537.4035.2033.7030.9031.0026.8028.1025.7021.2021.9020.3020.3018.0019.20
78.1876.5073.8067.70 61.9557.6550.7049.6047.1542.8040.0036.0535.9032.4032.0030.4026.8024.8024.4023.6022.1021.6020.9020.1019.6018.60
61.7363.0057.0552.65 46.9545.6541.9539.6038.3034.9531.3529.8027.2025.3023.7021.0020.6019.7019.4019.5018.8018.6018.6017.0016.5016.30
58.4051.1549.7546.65 42.2538.3534.0533.4031.3028.5025.9024.6022.2020.3018.7017.5017.4016.6016.4015.2014.7014.9013.4012.7012.0012.50
62.1452.9044.9045.20 40.4031.2031.6033.2032.2526.8526.3024.9523.9023.0019.7020.8018.5017.8017.5016.8016.3014.8016.3015.2013.5013.80
37.8845.0033.1532.50 22.3023.3016.1021.4017.9016.9019.6014.8517.3016.4015.6012.9015.4014.7014.9013.0012.0011.2011.2010.109.509.90
14.3118.3014.0014.35 11.6510.9011.0014.3010.7511.6010.7010.7010.008.608.908.608.007.707.306.605.606.105.405.605.305.30
15.1718.9017.1015.00 12.5511.3510.4510.4011.009.959.259.757.907.707.206.606.806.206.706.806.106.305.605.104.904.40
31.1331.4028.4026.6522.6020.7018.6019.8018.5017.1016.5015.6014.6013.6512.9011.9511.9511.2011.3010.709.809.759.258.708.208.10
*** Insufficient number of reports Source: South Dakota Farm Real Estate Market Surveys, SDSU, 2016 and earlier year reports.