rutgers strategic planning fact book · • translate insights from previous ... (indianapolis and...
TRANSCRIPT

Rutgers Strategic Planning Fact book
April 2013

Draft: advisory, consultative & deliberative material for discussion purposes only 1
About this information
1. Retired faculty and staff survey still open. Retired faculty and staff survey has been released to 418 people
Rutgers has made significant strides in its strategic planning process since the last strategic planning retreat on March 6
• On April 25, ~200 leaders from across the university community will come together again to continue to move the strategic plan forward
• The day will be focused on two key topics: defining the role of each campus and discussing strategic goals and initiatives
These materials are intended to lay out a base of facts to enable constructive conversations about Rutgers' campuses and proposed strategic initiatives
• These materials were prepared with assistance of The Boston Consulting Group (BCG), Rutgers' partner in this strategic planning process
• BCG has conducted more than 130 interviews and 30 focus groups, and surveyed more than 78,000 individuals, including Board members, students, faculty, academic administrators/staff, alumni, and UMDNJ faculty1
• The following materials were informed by these interactions with stakeholders, as well as through research and analysis and BCG's broader experience working in higher education

Draft: advisory, consultative & deliberative material for discussion purposes only 2
Contents
Page Second strategic planning retreat 2 Rutgers campus facts 9 Evaluation of other university systems 29 Strategic initiatives 59 Appendix: Retreat 1 follow-up material 85

Draft: advisory, consultative & deliberative material for discussion purposes only 3
Goals for this retreat
Update you on progress since last retreat Improve alignment on the role and identity of each campus, including clear strengths and differentiators
• Clarify our views on One Rutgers and how the campuses contribute to the mission • Gain a better understanding of how Rutgers can strengthen each campus and leverage
the strengths of each campus to advance the university's aspiration • Generate more ideas to foster greater cohesion and collaboration across the campuses
Refine the core elements of the strategic plan
• Refine list and prioritization of goals and initiatives
We appreciate your continued involvement in shaping Rutgers' strategic plan

Draft: advisory, consultative & deliberative material for discussion purposes only 4
The upcoming retreat will play an important role in refining the strategy
Final strategic plan presented to the Boards
Interim report presented to the Boards
Strategy refinement
Dec '12 Jan '13 Feb Mar Apr May Jun Fall '13 Spring '14
School-specific plans
Finalize strategic plan
First team retreat
Second team retreat
Strategy development and testing
• Translate insights from previous phase into preliminary strategy
Information-gathering
• Engage stakeholders and conduct data analyses
Facilities master plan in the context of new strategy

Draft: advisory, consultative & deliberative material for discussion purposes only 5
Retreat agenda
8:00-8:15 am Opening remarks and progress update
8:15-8:30 am Introduction to campus discussion
8:30-10:00 am Campus discussion (I): Campus roles and identities
10:00-10:30 am Campus discussion (II): Fostering greater cohesion and collaboration across campuses
10:30-10:45 am Break
10:45 am- 12:15 pm Strategic initiatives
12:15-12:30 pm Closing remarks
1
2
4
5
3
6

Draft: advisory, consultative & deliberative material for discussion purposes only 6
Further details on retreat agenda
Opening remarks 8:00 – 8:15 am
Frame the day • Progress update since last retreat • Goals and plan for the day
Intro to campus discussion 8:15 – 8:30 am
Agenda and approach for campus discussion • Vision for One Rutgers • Views on our system and how the campuses contribute to the mission
Campus discussion (I) 8:30 – 10:00 am
Chancellors Pritchett, Yeagle, and Edwards will lead discussions on their respective campuses
• Review current state and goals for each campus, with focus on identifying distinct strengths, assets and capabilities
Campus discussion (II) 10:00-10:30am
Ideas for improved cohesion/collaboration across campuses • Focus on how to leverage strengths of each campus
Break
Strategic initiatives 10:45 am-12:15 pm
Proposed goals and initiatives for each pillar and enabler, with goal of refining list of initiatives and prioritization
• Will leverage input from pre-retreat survey
Closing remarks 12:15 – 12:30 pm
Synthesis the day and next steps
1
2
4
5
3
6
Draft: advisory, consultative & deliberative material for discussion purposes only 7
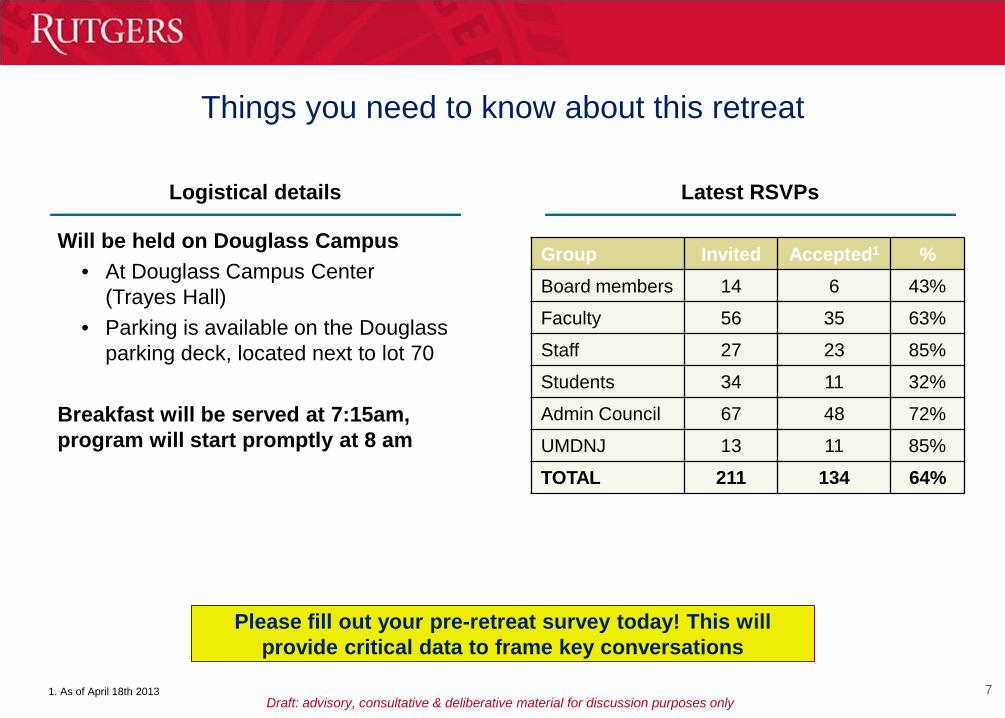
Things you need to know about this retreat
Will be held on Douglass Campus • At Douglass Campus Center
(Trayes Hall) • Parking is available on the Douglass
parking deck, located next to lot 70 Breakfast will be served at 7:15am, program will start promptly at 8 am
Group Invited Accepted1 % Board members 14 6 43%
Faculty 56 35 63%
Staff 27 23 85%
Students 34 11 32%
Admin Council 67 48 72%
UMDNJ 13 11 85%
TOTAL 211 134 64%
Logistical details Latest RSVPs
Please fill out your pre-retreat survey today! This will provide critical data to frame key conversations
1. As of April 18th 2013

Draft: advisory, consultative & deliberative material for discussion purposes only 8
How this retreat will compare to the last one
What is the same?
Same group of invited participants, with a few additions
• As of today, 134 confirmed participants • Board members, deans, faculty, staff,
students, academic administrators and UMDNJ representatives will attend
Heavily interactive, discussion-based
• We are eager for your candid input
Will utilize voting system to allow for real-time input on key questions
What is different?
Half day instead of full day • Will require extra focus and efficiency
No breakout sessions
• While incredibly valuable at last retreat, not possible due to time constraints
Douglass Campus instead of Livingston Will leverage input from pre-retreat survey
We took your feedback from last retreat and have adjusted plan accordingly

Draft: advisory, consultative & deliberative material for discussion purposes only 29
Contents
Page Second strategic planning retreat 2 Rutgers campus facts 9 Evaluation of other university systems 29 Strategic initiatives 59 Appendix: Retreat 1 follow-up material 85
Draft: advisory, consultative & deliberative material for discussion purposes only 30
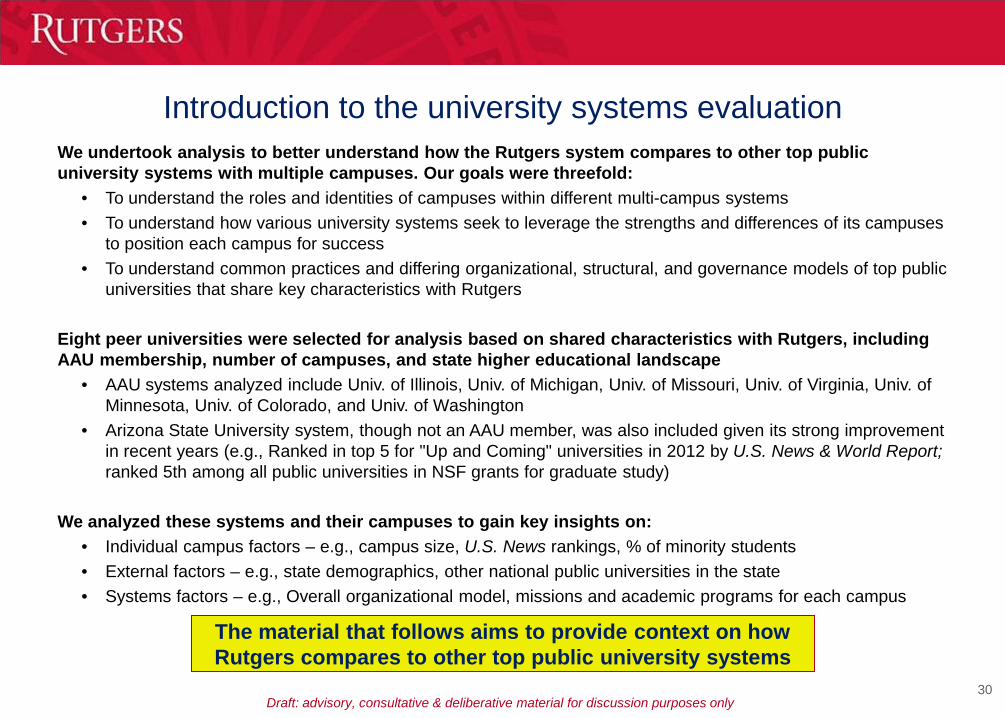
Introduction to the university systems evaluation We undertook analysis to better understand how the Rutgers system compares to other top public university systems with multiple campuses. Our goals were threefold:
• To understand the roles and identities of campuses within different multi-campus systems • To understand how various university systems seek to leverage the strengths and differences of its campuses
to position each campus for success • To understand common practices and differing organizational, structural, and governance models of top public
universities that share key characteristics with Rutgers
Eight peer universities were selected for analysis based on shared characteristics with Rutgers, including AAU membership, number of campuses, and state higher educational landscape
• AAU systems analyzed include Univ. of Illinois, Univ. of Michigan, Univ. of Missouri, Univ. of Virginia, Univ. of Minnesota, Univ. of Colorado, and Univ. of Washington
• Arizona State University system, though not an AAU member, was also included given its strong improvement in recent years (e.g., Ranked in top 5 for "Up and Coming" universities in 2012 by U.S. News & World Report; ranked 5th among all public universities in NSF grants for graduate study)
We analyzed these systems and their campuses to gain key insights on: • Individual campus factors – e.g., campus size, U.S. News rankings, % of minority students • External factors – e.g., state demographics, other national public universities in the state • Systems factors – e.g., Overall organizational model, missions and academic programs for each campus
The material that follows aims to provide context on how Rutgers compares to other top public university systems

Draft: advisory, consultative & deliberative material for discussion purposes only 31
Model candidates selection process
Member of the AAU
Several public
universities excluded (e.g. Arizona State
University)
Comparable universities • University of Illinois • University of Michigan • University of Missouri • University of Virginia • University of Minnesota • University of Colorado • University of Washington • Arizona State University
Gen
erat
e id
eas
Ref
ine
them
es
Prio
ritiz
e/
sele
ct
AA
U c
ampu
s
Num
ber o
f ca
mpu
ses
Criteria
Potential candidates excluded
System has 2-5 campuses
Wisconsin California
SUNY Texas
N. Carolina Maryland
...
Other reasons
Purdue Indiana
Oth
er
reas
ons
Top 150 Public Universities
Not a member of the AAU. Was included given its strong performance in recent years
Unique governance: Purdue and Indiana co-administer two campuses
(Indianapolis and Fort Wayne)
Draft: advisory, consultative & deliberative material for discussion purposes only 32
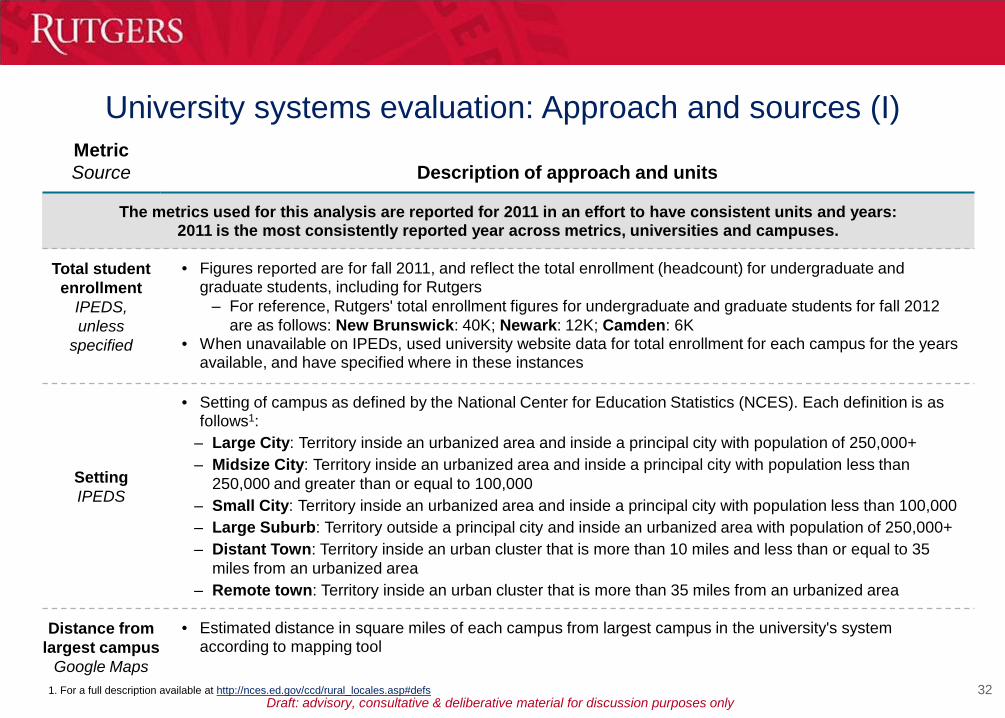
University systems evaluation: Approach and sources (I) Metric Source Description of approach and units
The metrics used for this analysis are reported for 2011 in an effort to have consistent units and years: 2011 is the most consistently reported year across metrics, universities and campuses.
Total student enrollment
IPEDS, unless
specified
• Figures reported are for fall 2011, and reflect the total enrollment (headcount) for undergraduate and graduate students, including for Rutgers
– For reference, Rutgers' total enrollment figures for undergraduate and graduate students for fall 2012 are as follows: New Brunswick: 40K; Newark: 12K; Camden: 6K
• When unavailable on IPEDs, used university website data for total enrollment for each campus for the years available, and have specified where in these instances
Setting IPEDS
• Setting of campus as defined by the National Center for Education Statistics (NCES). Each definition is as follows1:
– Large City: Territory inside an urbanized area and inside a principal city with population of 250,000+ – Midsize City: Territory inside an urbanized area and inside a principal city with population less than
250,000 and greater than or equal to 100,000 – Small City: Territory inside an urbanized area and inside a principal city with population less than 100,000 – Large Suburb: Territory outside a principal city and inside an urbanized area with population of 250,000+ – Distant Town: Territory inside an urban cluster that is more than 10 miles and less than or equal to 35
miles from an urbanized area – Remote town: Territory inside an urban cluster that is more than 35 miles from an urbanized area
Distance from largest campus
Google Maps
• Estimated distance in square miles of each campus from largest campus in the university's system according to mapping tool
1. For a full description available at http://nces.ed.gov/ccd/rural_locales.asp#defs

Draft: advisory, consultative & deliberative material for discussion purposes only 33
University systems evaluation: Approach and sources (II) Metric Source Description of approach and units
U.S. News Category U.S. News
• Categorized each university campus in which the campus is ranked1 – National Universities: Offer a full range of undergraduate majors, as well as master's and doctoral degrees;
many strongly emphasize research – Regional Universities: Ranked within 4 geographic areas: North (N), South (S), Midwest (MW), and West
(W). Provide full range of undergraduate programs and some master programs – National Liberal Arts Colleges: Emphasize undergraduate education and award at least 50% of their degrees
in the liberal arts
U.S. News Ranking
U.S. News
• Rankings featured for each campus are the undergraduate rankings for 2011-2012, as reported on U.S. News. Each campus is ranked in its respective category, as defined above.
• Rankings for each school found on the various campuses are the graduate school rankings for 2011-2012, as reported on U.S. News
SAT scores (25th/75th)
IPEDS
• Figures reported are for fall 2011 for total enrolled undergraduate full time students, including for Rutgers • Figures are the combined Critical Reading and Math scores
– For reference, Rutgers' 25th/75th SAT scores for fall 2012 are as follows: New Brunswick: 1090/1290; Newark: 960/1120; Camden: 950/1120
% Out-of-state
IPEDS
• Defined as students who are not residents of the state in which their university resides, or are foreign – Students' residency that is unknown not included in the analysis
• Reported figures are for first time degree/certificate seeking undergraduate students, Fall 2011, including for Rutgers
– For reference, Rutgers' figures for Fall 2012 are as follows: New Brunswick: 13%; Newark: 7%; Camden: 9%
1. U.S. News defines other categories in which schools are ranked. However, the three aforementioned categories are the only ones applicable to the universities /campuses featured in this analysis. For a full set: http://www.usnews.com/education/best-colleges/articles/2011/09/05/methodology-best-colleges-ranking-category-definitions

Draft: advisory, consultative & deliberative material for discussion purposes only 34
University systems evaluation: Approach and sources (III) Metric Source Description of approach and units
% Minority
IPEDS, unless specified
• Minority students are defined as those who report as: Asians, African Americans, Mexican-Americans, Native Americans (American Indians, Alaska Natives, and Native Hawaiians), Pacific Islanders, Hispanic, and mainland Puerto Ricans, Latino, and two or more
– Minority count reflected here does not include those who reported nonresident alien, or unknown categories
– Figures reported are for the 2011 undergraduate total enrollment (headcount) • Used above classification, which is different from Rutgers' reporting of 'under-represented minorities,' when
reporting % minority due to the consistently available data for each school /campus – Under-represented minority figures do not count Asians and those who are both White and Asian – For reference, Rutgers' minority and under-represented minority figures for Fall 2012 are as follows: % Minority, 2012 % Under-represented minority, 2012
New Brunswick: Newark: Camden:
State information
• Other information reported in subsequent pages (surface, population, median income, and other national public universities) gleaned from sites providing general state information
48% 66% 39%
22% 43% 30%
Draft: advisory, consultative & deliberative material for discussion purposes only 35
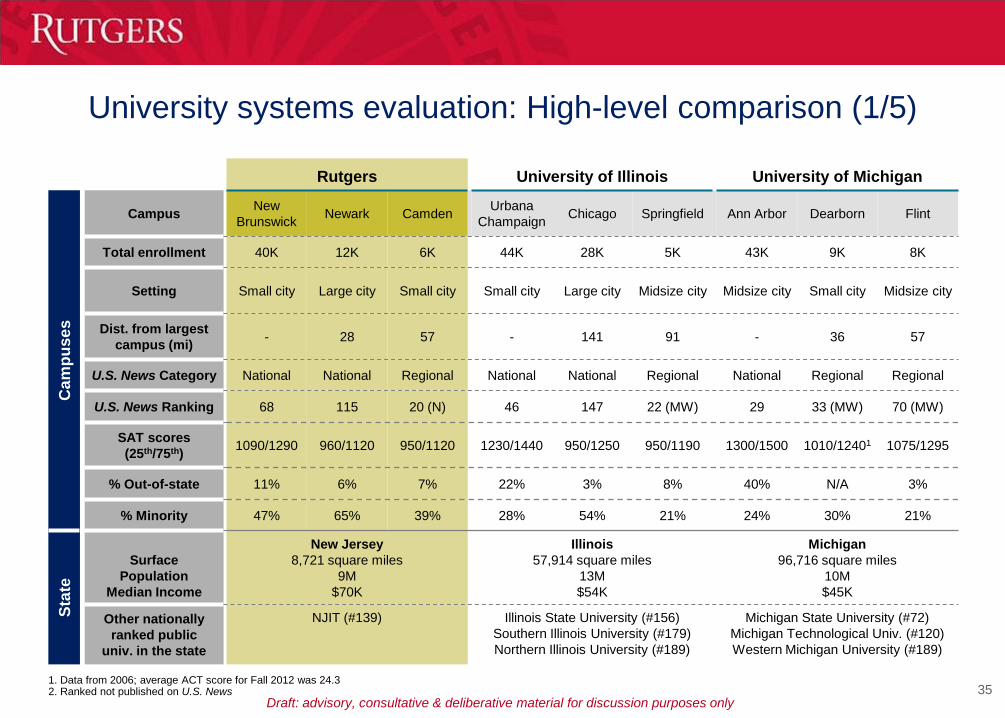
University systems evaluation: High-level comparison (1/5)
Rutgers University of Illinois University of Michigan
Cam
puse
s
Campus New Brunswick Newark Camden Urbana
Champaign Chicago Springfield Ann Arbor Dearborn Flint
Total enrollment 40K 12K 6K 44K 28K 5K 43K 9K 8K
Setting Small city Large city Small city Small city Large city Midsize city Midsize city Small city Midsize city
Dist. from largest campus (mi) - 28 57 - 141 91 - 36 57
U.S. News Category National National Regional National National Regional National Regional Regional
U.S. News Ranking 68 115 20 (N) 46 147 22 (MW) 29 33 (MW) 70 (MW)
SAT scores (25th/75th) 1090/1290 960/1120 950/1120 1230/1440 950/1250 950/1190 1300/1500 1010/12401 1075/1295
% Out-of-state 11% 6% 7% 22% 3% 8% 40% N/A 3%
% Minority 47% 65% 39% 28% 54% 21% 24% 30% 21%
Stat
e
Surface
Population Median Income
New Jersey 8,721 square miles
9M $70K
Illinois 57,914 square miles
13M $54K
Michigan 96,716 square miles
10M $45K
Other nationally ranked public
univ. in the state
NJIT (#139) Illinois State University (#156) Southern Illinois University (#179) Northern Illinois University (#189)
Michigan State University (#72) Michigan Technological Univ. (#120) Western Michigan University (#189)
1. Data from 2006; average ACT score for Fall 2012 was 24.3 2. Ranked not published on U.S. News

Draft: advisory, consultative & deliberative material for discussion purposes only 36
University systems evaluation: High-level comparison (2/5)
1. 2012–2013 undergraduate student statistic
Rutgers University of Missouri University of Virginia
Cam
puse
s
Campus New Brunswick Newark Camden Columbia Kansas
City S&T Saint Louis
Charlottes- ville Wise
Total enrollment 40K 12K 6K 34K 15K 8K1 17K 24K 2K
Setting Small city Large city Small city Midsize city Large city Remote town2
Large suburb Small city Distant town
Dist. from largest campus (mi) - 28 57 - 128 92 117 - 288
U.S. News Category National National Regional National National National National National Lib. Arts
U.S. News Ranking 68 115 20 (N) 97 179 125 N/A 24 N/A
SAT scores (25th/75th) 1090/1290 960/1120 950/1120 1060/1300 1040/1300 N/A N/A 1240/1460 840/1070
% Out-of-state 11% 6% 7% 32% 25% N/A 19% 33% 6%
% Minority 47% 65% 39% 15% 27% N/A 23% 27% 13%
Stat
e
Surface
Population Median Income
New Jersey 8,721 square miles
9M $70K
Missouri 69,704 square miles
6M $47K
Virginia 42,774 square miles
8M $61K
Other nationally ranked public
univ. in the state
NJIT (#139) None College of William & Mary (#33) Virginia Tech (#72)
George Mason Univ. (#139) Virg. Commonw. Univ. (#170)

Draft: advisory, consultative & deliberative material for discussion purposes only 37
University systems evaluation: High-level comparison (3/5)
1. Spring 2013 total enrollment, undergrad. and grad. as reported on the university websites. Fall 2011 unavailable 2. Settings not reported on IPEDS. Used judgment to assign setting category
Rutgers Arizona State University1
Cam
puse
s
Campus New Brunswick Newark Camden Tempe West Polytechnic Downtown
Phoenix
Total enrollment 40K 12K 6K 58K1 14K1 12K1 19K1
Setting Small city Large city Small city Midsize city Large suburb2 Large city2 Large city2
Dist. from largest campus (mi) - 28 57 - 18 25 11
U.S. News Category National National Regional National N/A N/A N/A
U.S. News Ranking 68 115 20 (N) 139 N/A N/A N/A
SAT scores (25th/75th) 1090/1290 960/1120 950/1120 970/1220 N/A N/A N/A
% Out-of-state 11% 6% 7% 35% N/A N/A N/A
% Minority 47% 65% 39% 34% N/A N/A N/A
Stat
e
Surface
Population Median Income
New Jersey 8,721 square miles
9M $70K
Arizona 113,990 square miles
7M $66K
Other nationally ranked public
univ. in the state
NJIT (#139) University of Arizona (#120)

Draft: advisory, consultative & deliberative material for discussion purposes only 38
University systems evaluation: High-level comparison (4/5)
Rutgers University of Minnesota
Cam
puse
s
Campus New Brunswick Newark Camden
Twin Cities Duluth Crookston Morris Rochester
Total enrollment 40K 12K 6K 53K 12K 3K 2K ~300
Setting Small city Large city Small city Large city Small city Distant town
Remote town Midsize city
Dist. from largest campus (mi) - 28 57 - 17 37 160 288
U.S. News Category National National Regional National N/A N/A Lib. Arts Regional
U.S. News Ranking 68 115 20 (N) 68 35 (MW) 49 (MW) 161 N/A
SAT scores (25th/75th) 1090/1290 960/1120 950/1120 1150/1430 930/1190 900/1060 1020/1300 970/1190
% Out-of-state 11% 6% 7% 36% 13% 28% 11% 21%
% Minority 47% 65% 39% 18% 8% 8% 20% 18%
Stat
e
Surface
Population Median Income
New Jersey 8,721 square miles
9M $70K
Minnesota 86,939 square miles
5M $56K
Other nationally ranked public
univ. in the state
NJIT (#139) None

Draft: advisory, consultative & deliberative material for discussion purposes only 39
University systems evaluation: High-level comparison (5/5)
Rutgers University of Colorado University of Washington
Cam
puse
s
Campus New Brunswick Newark Camden Boulder Denver Colorado
Springs Seattle Bothell Tacoma
Total enrollment 40K 12K 6K 33K 22K 10K 42K 4K 4K
Setting Small city Large city Small city Small city Large city Large city Large city Large suburb Midsize city
Dist. from largest campus (mi) - 28 57 - 32 94 - 17 37
U.S. News Category National National Regional National National Regional National N/A N/A
U.S. News Ranking 68 115 20 (N) 97 189 38 (MW) 46 N/A N/A
SAT scores (25th/75th) 1090/1290 960/1120 950/1120 1060/1280 950/1230 970/1190 1100/1350 910/1150 900/1140
% Out-of-state 11% 6% 7% 11% 6% 7% 20% N/A N/A
% Minority 47% 65% 39% 18% 31% 23% 38% 41% 34%
Stat
e
Surface
Population Median Income
New Jersey 8,721 square miles
9M $70K
Colorado 104,094 square miles
5M $57K
Washington 71,300 square miles
7M $58K
Other nationally ranked public
univ. in the state
NJIT (#139) Colorado School of Mines (#77) Colorado State University (#134)
Washington State University (#125)

Draft: advisory, consultative & deliberative material for discussion purposes only 40
University systems deep dive: Approach and sources Metric Source Description of approach and units
The analysis reported in this section reflect the most up-to-date information available from the university websites unless otherwise stated.
Total student enrollment
IPEDS, unless specified
• Figures reported are for fall 2011, and reflect the total enrollment (headcount) for undergraduate and graduate students
• When unavailable on IPEDs, used university website data for total enrollment for each campus for the years available, and have specified where in these instances
Mission, campus
structure, program
information University websites
• Descriptions of and statistics on mission statements, campus structure, number of schools, and number of PhD programs reflect most recently available information from university websites
• Research dollars indicated reflect self-reported figures from university websites and 2012 annual reports • Categories of schools highlighted (e.g., Arts & Sciences, Engineering, Business...) reflect the most
commonly represented schools among the 8 university systems selected for analysis
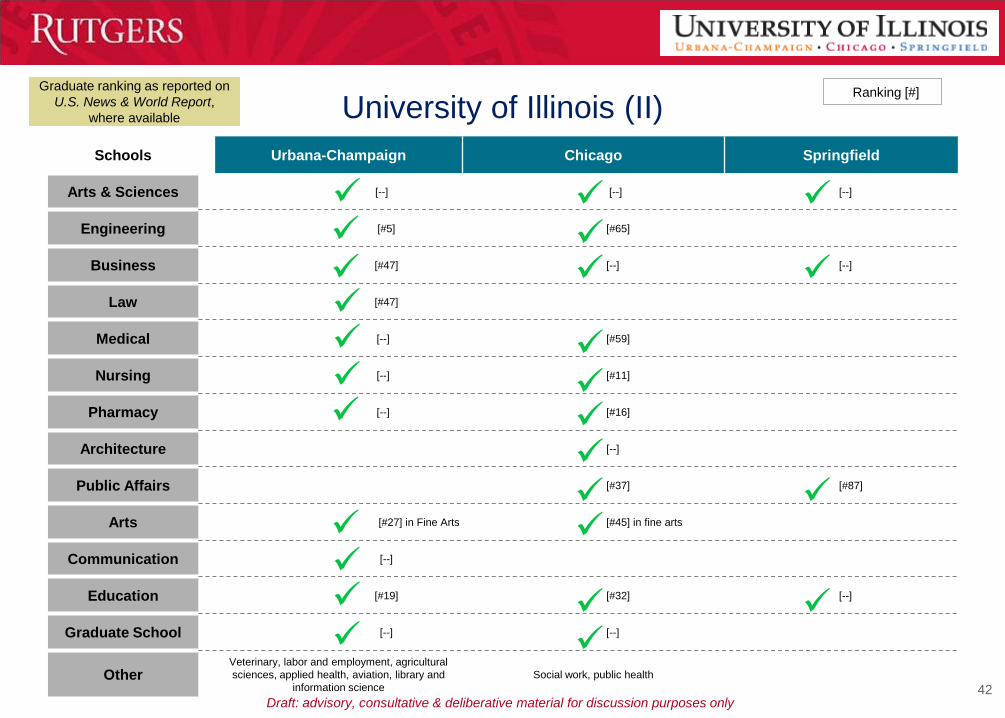
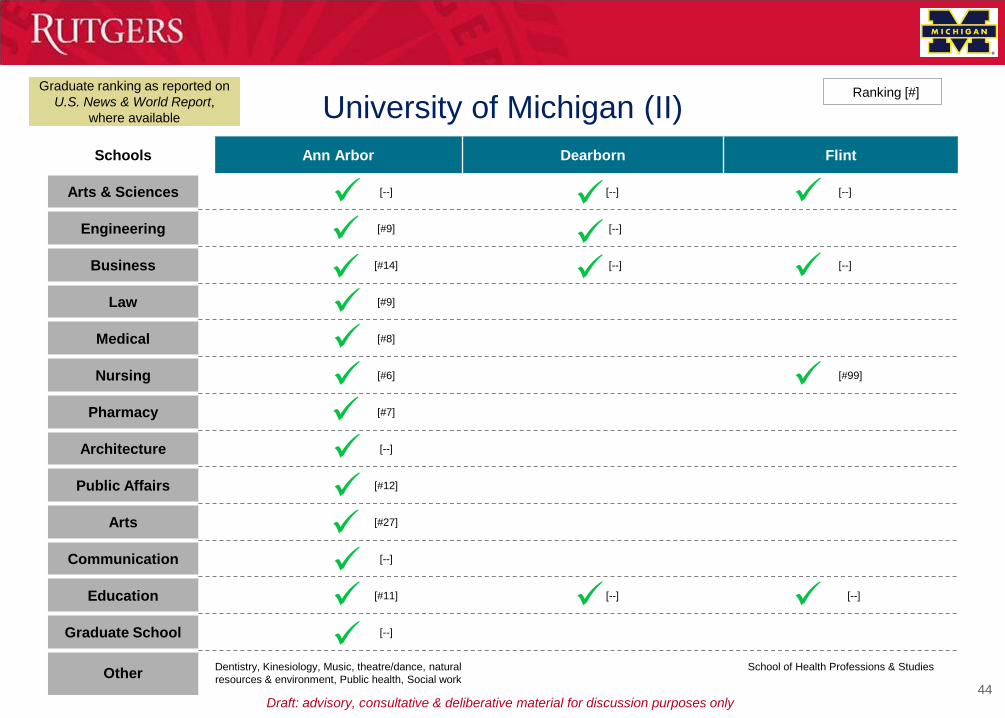
Graduate school rankings
US News & World Report
• 2012 US News & World Report graduate rankings are listed; no ranking is listed for schools for which ranking was not available (denoted [--])
• Undergraduate Arts & Sciences (as individual program), general Graduate School, School of Architecture, and School of Communication rankings are not calculated by US News & World Report
• For all other schools, [--] indicates either: – Rank not published: ranking calculated by US News & World Report, but not published because the
school ranked below the U.S. News editorial cutoff – Unranked: ranking was not calculated by US News & World Report due to insufficient statistical data

Draft: advisory, consultative & deliberative material for discussion purposes only 41
University of Illinois (I)
"The University of Illinois will transform lives and serve society by educating, creating knowledge and putting knowledge to work on a large scale and with excellence"
Mission
Urbana-Champaign
Chicago Springfield
# students 44K 28K 5K
# schools 17 16 4
School overlap
• Education (UC, Chicago, Springfield) • Arts and Sciences (UC, Chicago, Springfield) • Business (UC, Chicago, Springfield) • Public affairs (Chicago, Springfield) • Engineering (UC, Chicago) • Medicine (Chicago, Springfield) • Graduate school (UC, Chicago) • Social work (UC Chicago)
PhD programs offered (#)
Comprehensive (96)
Comprehensive (54)
Public Administration
(1)
Research dollars ($)
563M (Science and
Eng.) 335M N/A
Urbana-Champaign
Chicago
Springfield
Transform lives and serve society by educating, creating knowledge and putting knowledge to work on a large scale and with excellence
Provides the broadest access to the highest levels of intellectual excellence
Provide an intellectually rich, collaborative, and intimate learning environment for students, faculty, and staff, while serving local, regional, state, national, and international communities
Campus structure • The Board of Trustees and the U of I president oversee the whole
institution • Each campus has its own chancellor • The central administration provides vital services and support
(financial services, IT, facilities planning, auditing, legal counsel) to the campuses
Source: University websites; NCES IPEDS Data Center; U.S. News rankings. http://colleges.usnews.rankingsandreviews.com/best-colleges
Academic Programs
Draft: advisory, consultative & deliberative material for discussion purposes only 42
Schools Urbana-Champaign Chicago Springfield
Arts & Sciences [--] [--] [--]
Engineering [#5] [#65]
Business [#47] [--] [--]
Law [#47]
Medical [--] [#59]
Nursing [--] [#11]
Pharmacy [--] [#16]
Architecture [--]
Public Affairs [#37] [#87]
Arts [#27] in Fine Arts [#45] in fine arts
Communication [--]
Education [#19] [#32] [--]
Graduate School [--] [--]
Other Veterinary, labor and employment, agricultural sciences, applied health, aviation, library and
information science Social work, public health
University of Illinois (II)
Graduate ranking as reported on U.S. News & World Report,
where available
Ranking [#]

Draft: advisory, consultative & deliberative material for discussion purposes only 43
University of Michigan (I)
"Serve Michigan and world through preeminence in creating, communicating, preserving and applying knowledge, art, and academic values, and in developing leaders and citizens who will challenge the present and enrich the future"
Mission
Ann Arbor Dearborn Flint
# students 43K 9K 8K
# schools 20 4 4
School overlap
• Arts & Sciences (Ann Arbor, Dearborn, Flint) • Engineering (Ann Arbor, Dearborn) • Business (Ann Arbor, Dearborn, Flint) • Education (Ann Arbor, Dearborn, Flint)
PhD programs offered (#)
Comprehensive (108)
Engineering (2)
None (0)
Research dollars ($) 1.27B
Ann Arbor
Dearborn
Flint
Largest campus, serving students in multiple disciplines at different levels. Mission statement for university is also for Ann Arbor
Student-centered; committed to excellence in teaching; strive to be the institution of choice in SE MI for individuals/ organizations that value accessibility, flexibility, affordability, diversity, and preeminence in education
Comprehensive urban university of diverse learners and scholars committed to advancing our local and global communities; excellence in teaching, learning, scholarship, student centeredness, engaged citizenship
• Consists of a large, national campus in Ann Arbor, with two regional satellite campuses
Source: University websites; NCES IPEDS Data Center; U.S. News rankings. http://colleges.usnews.rankingsandreviews.com/best-colleges
Campus structure
Academic Programs
Draft: advisory, consultative & deliberative material for discussion purposes only 44
Schools Ann Arbor Dearborn Flint
Arts & Sciences [--] [--] [--]
Engineering [#9] [--]
Business [#14] [--] [--]
Law [#9]
Medical [#8]
Nursing [#6] [#99]
Pharmacy [#7]
Architecture [--]
Public Affairs [#12]
Arts [#27]
Communication [--]
Education [#11] [--] [--]
Graduate School [--]
Other Dentistry, Kinesiology, Music, theatre/dance, natural resources & environment, Public health, Social work
School of Health Professions & Studies
University of Michigan (II)
Ranking [#]
Graduate ranking as reported on U.S. News & World Report,
where available

Draft: advisory, consultative & deliberative material for discussion purposes only 45
University of Missouri (I)
"Discover, disseminate, preserve, and apply knowledge. Promotes learning by its students and lifelong learning by Missouri’s citizens. Foster innovation to support economic development. Advance the health, cultural, and social interests of the people of Missouri, the nation, and the world"
Mission
Columbia Kansas City S&T Saint
Louis
# students1 34K 15K 8K1 17K
# schools 14 12 1 9
School overlap
• Arts and Sciences, Business, Nursing, Education, and Graduate Schools common across Columbia , Kansas City, and Saint Louis
• Engineering, Law, and Medical schools Columbia and Kansas City
PhD programs offered (#)
Comprehensive (63)
Some programs across most disciplines
(32)
Science & Computing,
Engineering (20)
Life Sciences, Social Sciences,
Education (15)
Research dollars
($) 447M 52M N/A 11M
Columbia
Kansas City
S&T
Provide all Missourians the benefits of a world-class research university
Lead in life and health sciences; to deepen and expand strength in the visual and performing arts; to develop a professional workforce and collaborate in urban issues and education; to create a vibrant learning and campus life experience
Integrate education and research to create and convey knowledge to solve problems for the state and the technological world.
• The Board of Curators and President oversee institution • Each campus has its own chancellor
Saint Louis
Provide an intellectually rich, collaborative, and intimate learning environment for students, faculty, and staff, while serving local, regional, state, national, and international communities
1. Statistics from university website, available for Fall 2012 only. Source: University websites and Admissions Office; NCES IPEDS Data Center; Source: University websites; NCES IPEDS Data Center; U.S. News rankings. http://colleges.usnews.rankingsandreviews.com/best-colleges
Campus structure
Academic Programs

Draft: advisory, consultative & deliberative material for discussion purposes only 46
Schools Columbia Kansas City S&T Saint Louis
Arts & Sciences [--] [--] [--]
Engineering [#87] [--]
Business [#52] [--] [--]
Law [#76] [#109]
Medical [#76] [--]
Nursing [#50] [#79] [#64]
Pharmacy [--]
Architecture
Public Affairs [#33]
Arts [--]
Communication
Education [#51] [#132] [#132]
Graduate School [--] [--] [--]
Other Agriculture, Health Professions, Human Sciences, Veterinary Medicine
Music and Dance, Biological Sciences, Dentistry Science & Technology Optometry, Social Work,
Continuing Education
University of Missouri (II)
Ranking [#] Graduate ranking as reported on U.S. News & World Report,
where available
Draft: advisory, consultative & deliberative material for discussion purposes only 47
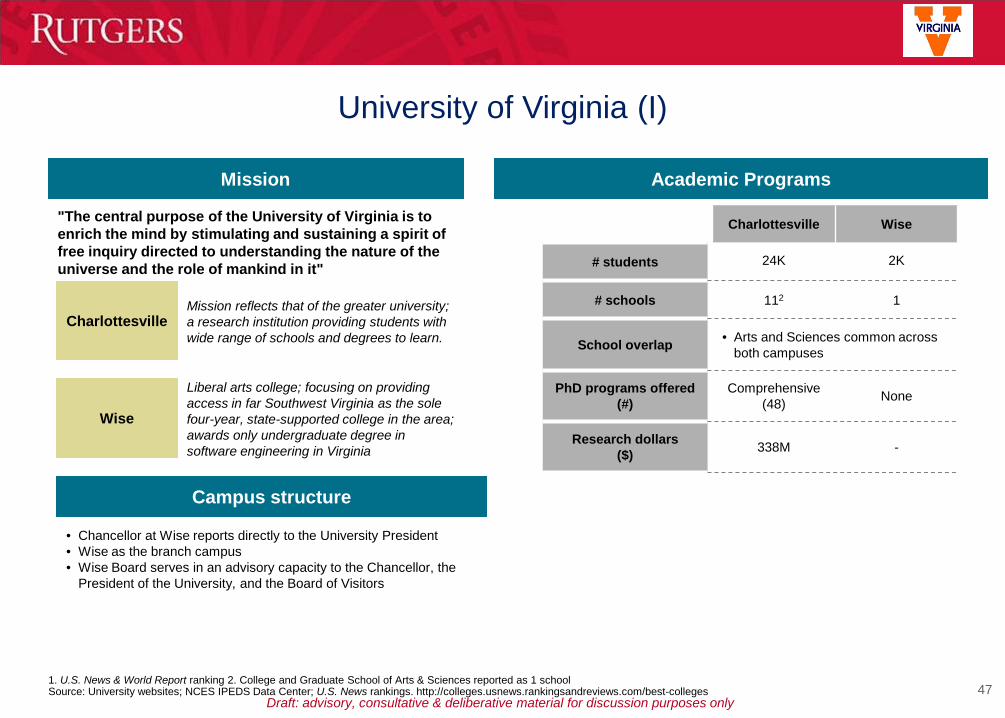
University of Virginia (I)
"The central purpose of the University of Virginia is to enrich the mind by stimulating and sustaining a spirit of free inquiry directed to understanding the nature of the universe and the role of mankind in it"
Mission
Charlottesville Wise
# students 24K 2K
# schools 112 1
School overlap • Arts and Sciences common across both campuses
PhD programs offered (#)
Comprehensive (48) None
Research dollars ($) 338M -
Charlottesville
Wise
Mission reflects that of the greater university; a research institution providing students with wide range of schools and degrees to learn.
Liberal arts college; focusing on providing access in far Southwest Virginia as the sole four-year, state-supported college in the area; awards only undergraduate degree in software engineering in Virginia
• Chancellor at Wise reports directly to the University President • Wise as the branch campus • Wise Board serves in an advisory capacity to the Chancellor, the
President of the University, and the Board of Visitors
1. U.S. News & World Report ranking 2. College and Graduate School of Arts & Sciences reported as 1 school Source: University websites; NCES IPEDS Data Center; U.S. News rankings. http://colleges.usnews.rankingsandreviews.com/best-colleges
Campus structure
Academic Programs

Draft: advisory, consultative & deliberative material for discussion purposes only 48
Schools Charlottesville Wise
Arts & Sciences [--] [--]
Engineering [#38]
Business [#12]
Law [#7]
Medical [#26]
Nursing [#15]
Pharmacy
Architecture [--]
Public Affairs [#46]
Arts
Communication
Education [#22]
Graduate School [--]
Other Commerce, Continuing Education
University of Virginia (II)
Ranking [#] Graduate ranking as reported on U.S. News & World Report,
where available
Draft: advisory, consultative & deliberative material for discussion purposes only 49
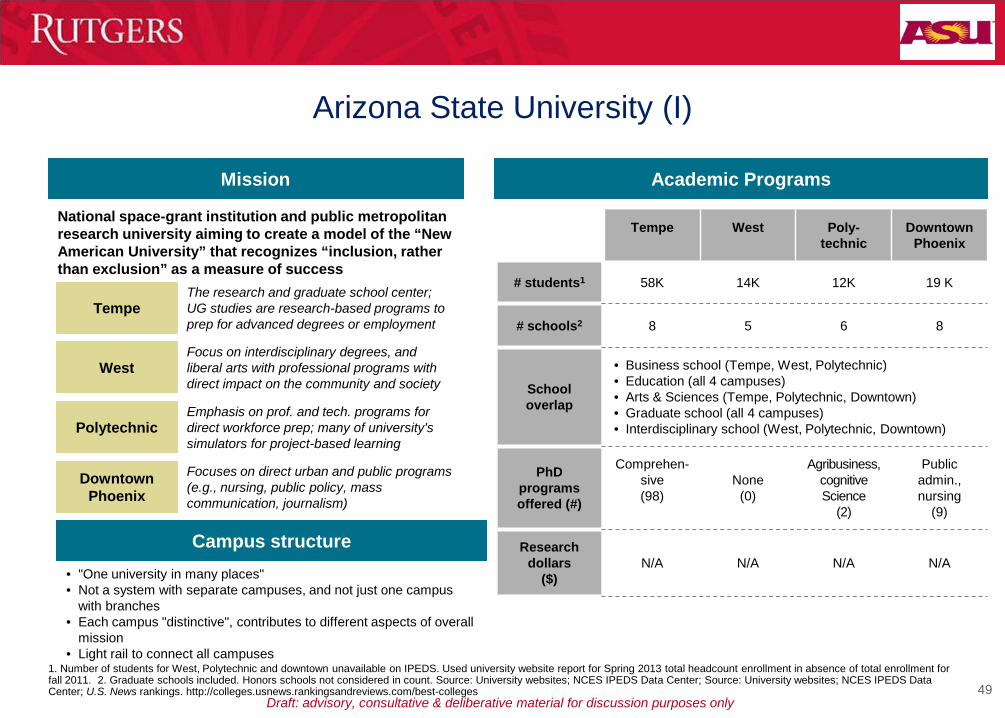
Arizona State University (I)
National space-grant institution and public metropolitan research university aiming to create a model of the “New American University” that recognizes “inclusion, rather than exclusion” as a measure of success
Mission
Tempe West Poly-technic
Downtown Phoenix
# students1 58K 14K 12K 19 K
# schools2 8 5 6 8
School overlap
• Business school (Tempe, West, Polytechnic) • Education (all 4 campuses) • Arts & Sciences (Tempe, Polytechnic, Downtown) • Graduate school (all 4 campuses) • Interdisciplinary school (West, Polytechnic, Downtown)
PhD programs offered (#)
Comprehen-sive (98)
None (0)
Agribusiness, cognitive Science
(2)
Public admin., nursing
(9)
Research dollars
($) N/A N/A N/A N/A
Tempe
West
Polytechnic
Downtown Phoenix
The research and graduate school center; UG studies are research-based programs to prep for advanced degrees or employment
Focus on interdisciplinary degrees, and liberal arts with professional programs with direct impact on the community and society
Emphasis on prof. and tech. programs for direct workforce prep; many of university's simulators for project-based learning
Focuses on direct urban and public programs (e.g., nursing, public policy, mass communication, journalism)
• "One university in many places" • Not a system with separate campuses, and not just one campus
with branches • Each campus "distinctive", contributes to different aspects of overall
mission • Light rail to connect all campuses
1. Number of students for West, Polytechnic and downtown unavailable on IPEDS. Used university website report for Spring 2013 total headcount enrollment in absence of total enrollment for fall 2011. 2. Graduate schools included. Honors schools not considered in count. Source: University websites; NCES IPEDS Data Center; Source: University websites; NCES IPEDS Data Center; U.S. News rankings. http://colleges.usnews.rankingsandreviews.com/best-colleges
Campus structure
Academic Programs

Draft: advisory, consultative & deliberative material for discussion purposes only 50
Arizona State University (II) Schools Tempe West Polytechnic Downtown Phoenix
Arts & Sciences [--] [--] [--]
Engineering [#44]
Business [#30] [--] [--]
Law [#29]
Medical
Nursing [#21]
Pharmacy [--]
Architecture
Public Affairs [#12]
Arts [#22]
Communication [--]
Education [#24] [--] [--] [--]
Graduate School [--] [--] [--]
Other School of Sustainability Interdisciplinary school, University college
Techn. & Innovation school, University college
University college, Heath Solutions
Ranking [#] Graduate ranking as reported on U.S. News & World Report,
where available
Draft: advisory, consultative & deliberative material for discussion purposes only 51
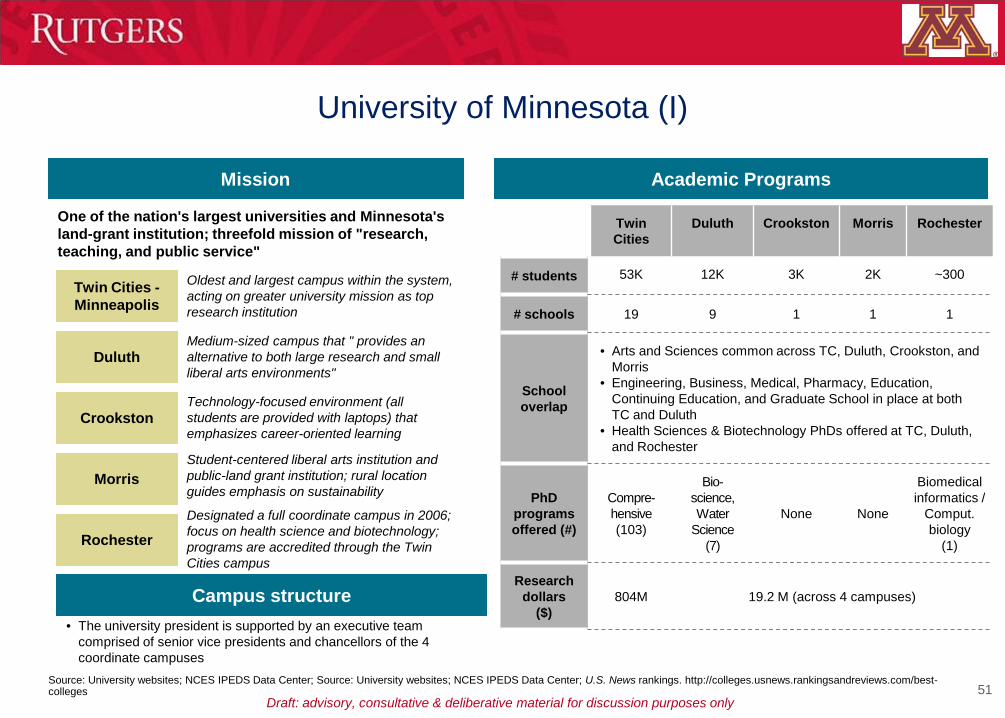
University of Minnesota (I)
One of the nation's largest universities and Minnesota's land-grant institution; threefold mission of "research, teaching, and public service"
Mission
Twin Cities
Duluth Crookston Morris Rochester
# students 53K 12K 3K 2K ~300
# schools 19 9 1 1 1
School overlap
• Arts and Sciences common across TC, Duluth, Crookston, and Morris
• Engineering, Business, Medical, Pharmacy, Education, Continuing Education, and Graduate School in place at both TC and Duluth
• Health Sciences & Biotechnology PhDs offered at TC, Duluth, and Rochester
PhD programs offered (#)
Compre-hensive (103)
Bio-science, Water
Science (7)
None None
Biomedical informatics /
Comput. biology
(1)
Research dollars
($) 804M 19.2 M (across 4 campuses)
Twin Cities - Minneapolis
Duluth
Crookston
Rochester
Morris
Oldest and largest campus within the system, acting on greater university mission as top research institution
Medium-sized campus that " provides an alternative to both large research and small liberal arts environments"
Technology-focused environment (all students are provided with laptops) that emphasizes career-oriented learning
Student-centered liberal arts institution and public-land grant institution; rural location guides emphasis on sustainability
Designated a full coordinate campus in 2006; focus on health science and biotechnology; programs are accredited through the Twin Cities campus
• The university president is supported by an executive team comprised of senior vice presidents and chancellors of the 4 coordinate campuses
Source: University websites; NCES IPEDS Data Center; Source: University websites; NCES IPEDS Data Center; U.S. News rankings. http://colleges.usnews.rankingsandreviews.com/best-colleges
Campus structure
Academic Programs
Draft: advisory, consultative & deliberative material for discussion purposes only 52
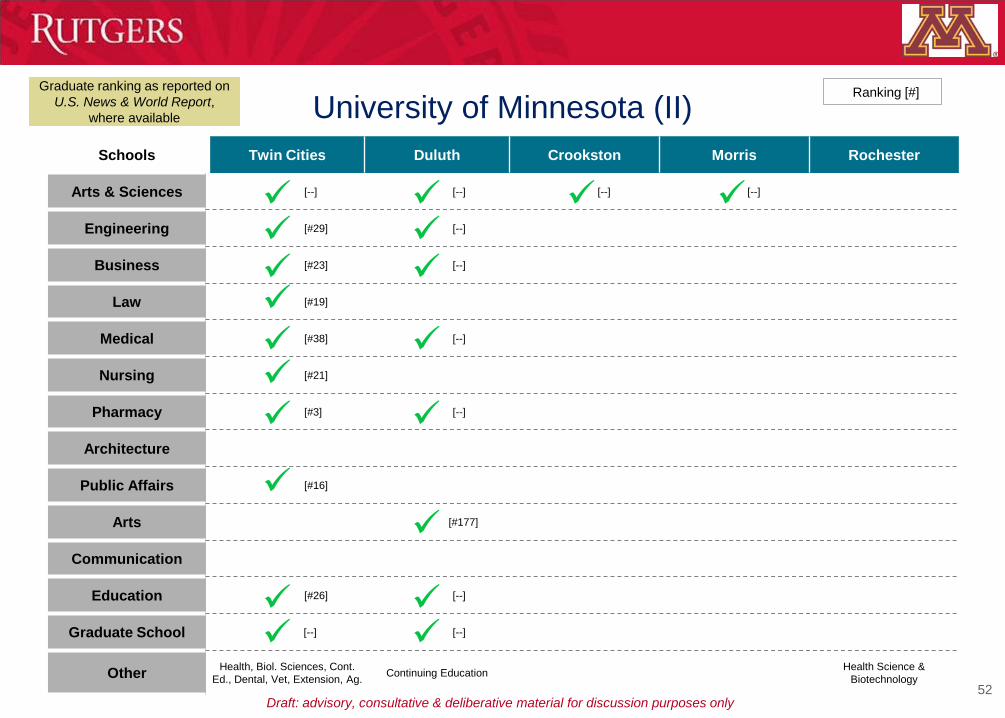
Schools Twin Cities Duluth Crookston Morris Rochester
Arts & Sciences [--] [--] [--] [--]
Engineering [#29] [--]
Business [#23] [--]
Law [#19]
Medical [#38] [--]
Nursing [#21]
Pharmacy [#3] [--]
Architecture
Public Affairs [#16]
Arts [#177]
Communication
Education [#26] [--]
Graduate School [--] [--]
Other Health, Biol. Sciences, Cont. Ed., Dental, Vet, Extension, Ag. Continuing Education Health Science &
Biotechnology
University of Minnesota (II)
Ranking [#] Graduate ranking as reported on U.S. News & World Report,
where available

Draft: advisory, consultative & deliberative material for discussion purposes only 53
University of Colorado (I)
"The University of Colorado is a public research university with multiple campuses serving Colorado, the nation and the world..."
Mission
Boulder Denver Colorado Springs
# students 33K 22K 10K
# schools 7 13 7
School overlap
• Arts and Sciences, Engineering, Business, Education, and Graduate schools common across all 3 campuses
• Colleges of Nursing and Schools of Public Affairs in place at both Denver and Colorado Springs campuses
PhD programs offered (#)
Comprehensive (47)
Applied and clinical science,
education, engineering
(34)
Engineering, psychology,
applied science (8)
Research dollars ($) 380M 434M 5M
Boulder
Denver
Colorado Springs
Comprehensive research university; source of more than one-third of all PhDs awarded annually in Colorado
Urban research campus incorporating Anschutz Medical School and U of Colorado Hospital; state's only professional schools for medicine, pharmacy and architecture; focus on needs of urban population
Regional academic and research campus with focus on accessibility; offers night, weekend, and online courses; strength in community engagement
• "Each campus has a distinct role and mission as provided by Colorado law."
• Shuttle service between Boulder and Denver campuses
Source: University websites; NCES IPEDS Data Center; Source: University websites; NCES IPEDS Data Center; U.S. News rankings. http://colleges.usnews.rankingsandreviews.com/best-colleges
Campus structure
Academic Programs

Draft: advisory, consultative & deliberative material for discussion purposes only 54
Schools Boulder Denver Colorado Sprigs
Arts & Sciences [--] [--] [--]
Engineering [#34] [--] [#143]
Business [#79] [--] [--]
Law [#44]
Medical [#35]
Nursing [#15] [#99]
Pharmacy [#24]
Architecture [--]
Public Affairs [#29] [--]
Arts
Communication [--]
Education [#28] [#81] [--]
Graduate School [--] [--] [--]
Other College of Music School of Dental Medicine; Colorado School of Public Health
University of Colorado (II)
Ranking [#] Graduate ranking as reported on U.S. News & World Report,
where available

Draft: advisory, consultative & deliberative material for discussion purposes only 55
"Washington University’s mission is to discover and disseminate knowledge, and protect the freedom of inquiry through research, teaching, and learning...creates an environment to encourage and support an ethos of wide-ranging exploration... faculty and staff strive to enhance the lives and livelihoods of students, the people of the greater St. Louis community, the country, and the world"
University of Washington (I)
Mission
Seattle
Bothell
Tacoma
Provide wide range of programs to undergraduates through doctorates
Focus on student-faculty relationship; access to excellence via innovative curricula, inter-disciplinary teaching, research, & dynamic community
Change agent for region; access to students; impact and inform economic dev. through community-engaged students and faculty; research for direct use to community/region
Seattle Bothell Tacoma
# students 42K 4K 4K
# schools 16 5 1 (UW-Tacoma)
School overlap
• Business (Seattle, Bothell, Tacoma) • Nursing (Seattle, Bothell, Tacoma-offers nursing
program) • Education (Seattle, Bothell)
PhD programs offered (#)
Comprehensive (~96)
None (0)
None (0)
Research dollars ($) 1.47B
Source: University websites; NCES IPEDS Data Center; U.S. News rankings. http://colleges.usnews.rankingsandreviews.com/best-colleges
Campus structure • Seattle defined as the national campus serving undergraduate
through doctoral level. President resides in this campus • Bothell and Tacoma designed to serve upper-division
undergraduates and to graduate students
Academic Programs
Draft: advisory, consultative & deliberative material for discussion purposes only 56
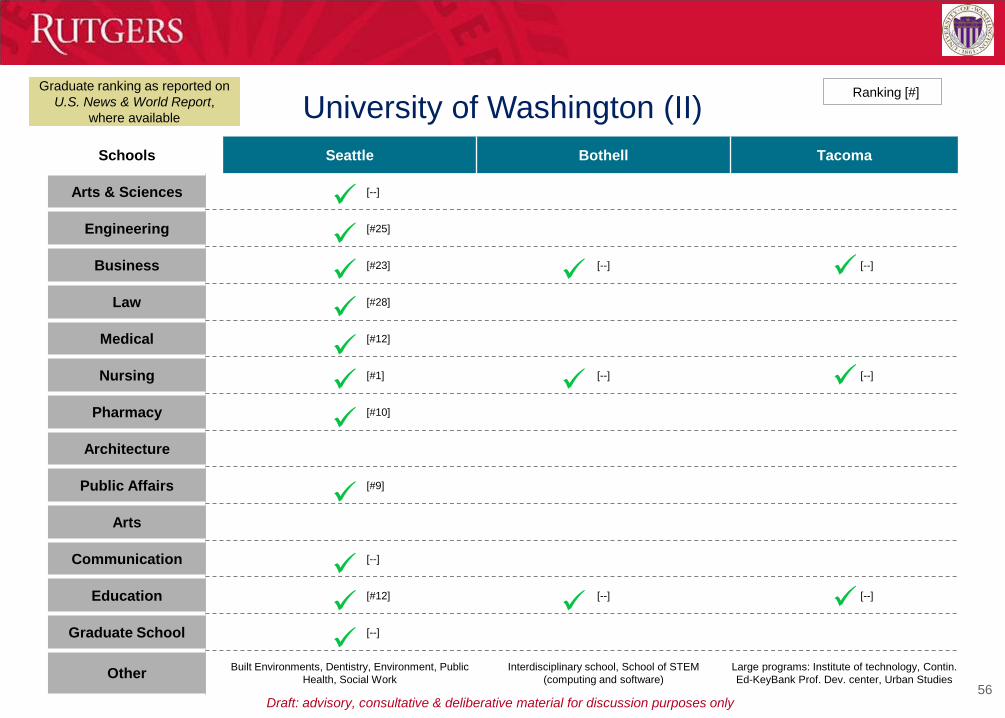
University of Washington (II) Schools Seattle Bothell Tacoma
Arts & Sciences [--]
Engineering [#25]
Business [#23] [--] [--]
Law [#28]
Medical [#12]
Nursing [#1] [--] [--]
Pharmacy [#10]
Architecture
Public Affairs [#9]
Arts
Communication [--]
Education [#12] [--] [--]
Graduate School [--]
Other Built Environments, Dentistry, Environment, Public Health, Social Work
Interdisciplinary school, School of STEM (computing and software)
Large programs: Institute of technology, Contin. Ed-KeyBank Prof. Dev. center, Urban Studies
Ranking [#] Graduate ranking as reported on U.S. News & World Report,
where available

Draft: advisory, consultative & deliberative material for discussion purposes only 57
Campus ranking among AAU public university systems
University Campus U.S. News Ranking
1 California Berkeley 21 2 Virginia Charlottesville 24 3 California Los Angeles 24 4 Michigan Ann Arbor 29 5 North Carolina Chapel Hill 30 6 Georgia Tech Atlanta 36 7 California Davis 38 8 California San Diego 38 9 Wisconsin Madison 41
10 California Santa Barbara 41 11 California Irvine 44 12 Illinois Urbana-Champagne 46 13 Washington Seattle 46 14 Penn State University Park 46 15 Texas Austin 46 16 Florida Gainesville 54 17 Ohio Columbus 56 18 Pittsburgh Pittsburgh 58 19 Maryland College Park 58 20 Purdue West Lafayette 65 21 Texas A & M College Station 65 22 Rutgers New Brunswick 68 23 Minnesota Twin Cities 68 24 Michigan State East Lansing 72 25 Iowa Iowa City 72 26 California Santa Cruz 77 27 SUNY College of ESF 77 28 Indiana Bloomington 83
University Campus U.S. News Ranking
29 SUNY Binghamton 89 30 SUNY Stony Brook 92 31 Missouri Mizzou 97 32 Colorado Boulder 97 33 Iowa State Ames 101 34 California Riverside 101 35 SUNY Buffalo 106 36 Kansas Lawrence 106 37 Rutgers Newark 115 38 Oregon Eugene 115 39 Arizona Tucson 120 40 Missouri S&T 125 41 SUNY Albany 131 42 Illinois Chicago 147 43 Texas Dallas 151 44 Maryland Baltimore County 160 45 Missouri Kansas City 179 46 Carolina Greensboro 189 47 Colorado Denver 189 48 North Carolina Charlotte 199 49 Wisconsin Milwaukee NR 50 Missouri St. Louis NR 51 Texas A & M Commerce NR 52 Texas A & M Corpus Christi NR 53 Texas A & M Kingsville NR 54 Texas Arlington NR 55 Texas San Antonio NR 56 Texas El Paso NR 57 Indiana Indianapolis NR
University Campus U.S. News Ranking
1 SUNY Geneseo 10 (N) 2 North Carolina Wilmington 14 (S) 3 Rutgers Camden 20 (N) 4 Wisconsin Eau Claire 20 (MW) 5 Illinois Springfield 22 (MW) 6 Wisconsin La Crosse 24 (MW) 7 Michigan Dearborn 33 (MW) 8 Colorado Colorado Springs 38 (W) 9 Wisconsin Stevens Point 46 (MW)
10 Wisconsin Whitewater 49 (MW) 11 Wisconsin Stout 60 (MW) 12 Wisconsin Green Bay 66 (MW) 13 Wisconsin Oshkosh 68 (MW) 14 Wisconsin Platteville 70 (MW) 15 Michigan Flint 70 (MW) 16 Texas Tyler 72 (W) 17 Indiana Kokomo 72 (MW) 18 Wisconsin River Falls 80 (MW) 19 Wisconsin Superior 80 (MW) 20 North Carolina Pembroke 80 (S) 21 Purdue Calumet NR (MW) 22 Purdue North Central NR (MW) 23 Texas A & M Texarkana NR (W) 24 Texas Pan American NR (W) 25 Texas Brownsville NR (W) 26 Indiana Fort Wayne NR (MW) 27 Indiana South Bend NR (MW) 28 Maryland University College NR (N) 29 Maryland Eastern Shore NR (N)
Note: NR = Not Ranked i.e. school ranked below the U.S. News cutoff (the top 3/4 of each ranking category are numerically ranked) Source: U.S. News & World Report
National Universities Regional Universities

Draft: advisory, consultative & deliberative material for discussion purposes only 58
Key data sources
The following sources were used to gather data on universities
• U.S. News & World Report: http://colleges.usnews.rankingsandreviews.com/best-colleges
• The Integrated Postsecondary Education Data System (IPEDS): http://nces.ed.gov/ipeds/ • University of Illinois website: http://www.uillinois.edu/ • University of Michigan website: http://www.umich.edu/ • University of Missouri website: http://www.umsystem.edu/ • University of Virginia website: http://www.virginia.edu/ • Arizona State University website: http://www.asu.edu/ • University of Minnesota website: http://www1.umn.edu/twincities/index.html • University of Colorado website: https://www.cu.edu/ • University of Washington website: http://www.washington.edu/

Draft: advisory, consultative & deliberative material for discussion purposes only 85
Contents
Page Second strategic planning retreat 2 Rutgers campus facts 9 Evaluation of other university systems 29 Strategic initiatives 59 Appendix: Retreat 1 follow-up material 85

Draft: advisory, consultative & deliberative material for discussion purposes only 86
Appendix contents
Pages Results from voting on themes for differentiation 87-88 Results of input received on core values 89 Answers to questions received following the last retreat 90-98
Draft: advisory, consultative & deliberative material for discussion purposes only 87
27.8 34.2
35.4 40.5
80
21.5 22.8
24.1 25.3
44.3 45.6
72.2
20.3
19.0 19.0 19.0
16.5 11.4
3.8 2.5
0 20 40 60 % of total respondents
Improving the health and wellness of individuals and populations
Educating leaders for a dynamic world
Ethics, responsibility, and citizenship in our globalized world
Developing a broadly educated citizenry via emphasis on the liberal arts
Impact of science and technology innovation in society
Understanding the limits and potential of the human mind
Creating and sustaining a safe and secure society
Creative expression and the human experience
Deepening the individual's realization and understanding of himself/herself
Collaborative creation and art as a force for cohesion in the modern world
Communicating across cultures through art
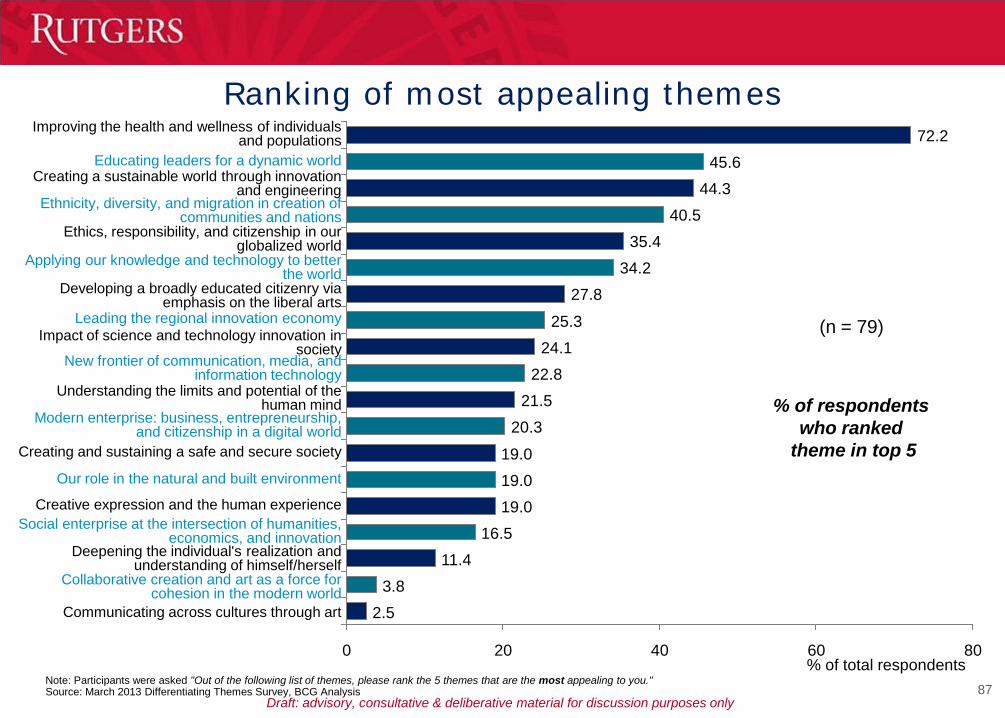
Ranking of most appealing themes
(n = 79)
% of respondents who ranked
theme in top 5
Creating a sustainable world through innovation and engineering
Ethnicity, diversity, and migration in creation of communities and nations
Leading the regional innovation economy
Applying our knowledge and technology to better the world
New frontier of communication, media, and information technology
Modern enterprise: business, entrepreneurship, and citizenship in a digital world
Our role in the natural and built environment
Social enterprise at the intersection of humanities, economics, and innovation
Note: Participants were asked "Out of the following list of themes, please rank the 5 themes that are the most appealing to you." Source: March 2013 Differentiating Themes Survey, BCG Analysis

Draft: advisory, consultative & deliberative material for discussion purposes only 88
15.2
17.7 21.5
24.1 26.6
29.1
30.4 32.9
35.4 41.8
49.4 50.6
7.6 8.9
10.1 10.1
80 60 40 20 0
1.3 7.6
58.2 Deepening the individual's realization and understanding of himself/herself
Communicating across cultures through art
Leading the regional innovation economy
Creative expression and the human experience
Modern enterprise: business, entrepreneurship, and citizenship in a digital world
Our role in the natural and built environment
Creating and sustaining a safe and secure society
New frontier of communication, media, and information technology
Impact of science and technology innovation in society
Creating a sustainable world through innovation and engineering
Improving the health and wellness of individuals and populations
Ranking of least appealing themes
(n = 79)
% of respondents who ranked
theme in bottom 5
Collaborative creation and art as a force for cohesion in the modern world
Social enterprise at the intersection of humanities, economics, and innovation
Developing a broadly educated citizenry via emphasis on the liberal arts
Understanding the limits and potential of the human mind
Educating leaders for a dynamic world
Applying our knowledge and technology to better the world
Ethics, responsibility, and citizenship in our globalized world
Ethnicity, diversity, and migration in creation of communities and nations
Note: Participants were asked "Out of the following list of themes, please rank the 5 themes that are the least appealing to you." Source: March 2013 Differentiating Themes Survey, BCG Analysis
% of total respondents

Draft: advisory, consultative & deliberative material for discussion purposes only 89
Emerging values for Rutgers – based on feedback from retreat participants
23 service1 23 integrity 23
innovation 31 excellence 42
diversity 53
opportunity 6 responsiveness 6
inclusion 6 transparency 8
competitiveness 10 quality 10
vitality2 13 collaboration 14
respect 17 affordability 17 accessibility 21
40%
creativity
60% 0% 20%
4 entrepreneurship 4
leadership 5
sustainability
1. Service counts include both "service" and "service to community" suggestions 2. Vitality counts includes both "vitality" and "intellectual vitality" suggestions. Note: Total number of participants:111. Average number of values proposed by participant: 4.4 Source: Survey about Rutgers values from the first retreat.
% of respondents who mentioned value

Draft: advisory, consultative & deliberative material for discussion purposes only 90
On this slide from the fact book, where are full-time non-tenure-track faculty categorized?
The full-time label includes all "full-time" faculty: tenured, tenure-track, and non tenure-track
Retreat follow-up.pptx Draft: advisory, consultative & deliberative material for discussion purposes only6
Shift of faculty from full-time tenured/tenure track to part-time professors among
AAU public universities
The ratio of instructors to students has remained steady, but the mix has shifted away from tenured professors
Source: NCES, IPEDS Data Center; "Trends in Higher Education," The College Board, Figure 26A. BCG Analysis.
Total number of instructors per student steady over the past ~30 years
Instructors per 100 FTE students10
8
6
4
2
02011
8.7
2009
7.9
1999
8.4
1976
8.3
2011
7.0
2009
6.8
1999
7.3
1976
6.6
Public universities Private universities
Total instructors (%)80
20
10
02011
24.575.5
76.5
20.7
1993
23.5
2001
77.1
2007
22.9
79.3
Full-time Part time

Draft: advisory, consultative & deliberative material for discussion purposes only 91
What are the definitions of need-based aid recipients and financial aid recipients?
Need-based recipients includes only students receiving Pell grants. The financial aid recipients includes students receiving all types of financial aid (e.g., institutional aid, federal student loans, scholarships, etc.)

Draft: advisory, consultative & deliberative material for discussion purposes only 92
Do the research charts on this slide include both tenured and tenure-track faculty? What is included in these figures?
These figures are specific to New Brunswick and UMDNJ and include all research expenditures – not just those that are Federally-funded. The calculations are specific to tenured and tenure-track faculty and exclude part-time and non-tenure track faculty.
Retreat follow-up.pptx Draft: advisory, consultative & deliberative material for discussion purposes only11
Rutgers lags peers in research activities per faculty
1. All aspirants have medical school except for UC Berkeley 2. Public members of the Association of American Universities. See Appendix for full list of schools 3. Funding forall UMDNJ schools was included except for the School of Osteopathic Medicine which will be integrated into Rowan University 4. Tenured faculty includes non tenured faculty on tenure track.Note: Rutgers-NB tenured + tenure track faculty size is 1,526. UMDNJ excluding SOM tenured faculty size is 482 based on data from UMDNJ annual institutional profile.Source: BCG Analysis. National Institute of Health grant database; 2011 National Science Foundation database; National center for education statistics http://nces.ed.gov/ipeds/datacenter
408
AAU Public w/o med school2
338
Rutgers NB & UMDNJ3
330
Rutgers—NB
283
Aspirants1AAU Public w/med school2
522
0
($K)
200
600
400
Federal govtState and local govt
IndustryNon-Profit
InstitutionalAll other
2011 total research expenditure per tenured faculty4

Draft: advisory, consultative & deliberative material for discussion purposes only 93
Why are states like Maryland and Minnesota requiring on-line instruction? What are their stated reasons?
The motivation in Maryland appears to twofold: they are seeking to stimulate new strategies that a) improve learning outcomes and b) lower costs. The Chancellor of the Maryland system has spoken publicly about the desire to free up time for faculty to have closer interaction with students:
"The notion," he said, "is that the classroom is not used for lecture time, but used as time for active learning. Students are working on material, and the professor and graduate students and advanced undergraduate students are walking around the room and helping them work through the material."
The Maryland system has also received grant support from the Gates Foundation aimed at refining the use of online technology so that it is more effective and better integrated with traditional classroom instruction. For example, one Maryland state university has developed a set of guidelines and requirements to ensure that fully-online courses are pedagogically sound. The Minnesota proposal appears also to be aimed at expanding access to more students: the goal to "increase access and student success through online learning" is explicitly stated in the board of trustees' official action plan.
Draft: advisory, consultative & deliberative material for discussion purposes only 94
Is Thomson-Reuters a credible source for data on citations and publications? Doesn't Google Scholar generate more results?
The process of tracking publications and citations is clearly imperfect (well-documented issues include self-citation and the Matthew effect). There are many different publication and citation index sources for evaluating scholarly productivity. Among these are Thomson Reuters (formerly ISI) Web of Knowledge, Academic Analytics, Google Scholar, SCOPUS – each has positives and negatives. Thomson Reuters' Web of Knowledge index has a long history of use in the academic world. It is used by the AAU to develop institutional/member profiles and was the citation index employed in the National Research Council’s Assessment of Research Doctorate Programs (http://www.nap.edu/rdp/). Thomson Reuters has a more limited set of data sources than does Google Scholar – the latter is more comprehensive in its scope, but the tradeoff is that Google Scholar often includes compendia of citations and publications that organizes papers, journal articles, books, etc., but have no new scientific information itself. Thomson Reuters does not index these bibliographic databases. It engages in a process of ongoing cleaning/correction of its information and tends to be more up-to-date. Because Google Scholar is essentially a web crawler, it is prone to inaccuracies. Many in higher education favor Thomson Reuters for its history and widespread use in the field.

Draft: advisory, consultative & deliberative material for discussion purposes only 95
How do Rutgers faculty compare on other metrics, such as the Shanghai ranking/ American Ranking of World Universities?
The ARWU rankings aggregate a number of data points that were captured in the retreat materials, including faculty research activity, publications and citations, and awards. Some of these data are drawn from the Center for Measuring University Performance, a respected source for these types of data. The ARWU rankings are part of an emerging set of international rankings. While they are becoming more well-known and are often considered the best of the international rankings, as with any rankings, they are not without criticism. Some see the rankings as heavily favoring institutions strong in the sciences at the expense of the humanities and social sciences. One study examining its methodology could not reproduce the rankings from the same set of raw data, calling into question the rankings' validity and reliability.

Draft: advisory, consultative & deliberative material for discussion purposes only 96
What % of our students, faculty, and staff are women? How does this compare to other AAU schools?
On gender diversity, Rutgers is on par with other AAU institutions. Women represent 51.4% of students at Rutgers, compared to the AAU average, 49.6%. Similarly, 50.9% of Rutgers' faculty and staff are female, compared to the AAU average, 50.3%.

Draft: advisory, consultative & deliberative material for discussion purposes only 97
Can you refine the survey findings to show actual averages for importance – not just rankings?
Yes, now that almost all of the surveys have been closed, we have refined our findings and released more detailed information to the public. Full survey results are available at the strategic planning website, www.universitystrategy.rutgers.edu.
Draft: advisory, consultative & deliberative material for discussion purposes only 98
Can you show more detailed data (e.g., breakdown of total research dollars, % minorities) for each campus?
Yes, we have been working to break out these and other data specific to each campus. New campus-specific information is included on pages 9-28 of the April fact book document