russian federation export opportunities for the u.s ... · twelve cities in russia ... these...
TRANSCRIPT

THIS REPORT CONTAINS ASSESSMENTS OF COMMODITY AND TRADE ISSUES MADE BY
USDA STAFF AND NOT NECESSARILY STATEMENTS OF OFFICIAL U.S. GOVERNMENT
POLICY
Date:
GAIN Report Number:
Approved By:
Prepared By:
Report Highlights:
In 2012, the Russian economy grew 3.4 percent. Unemployment dropped to record lows and wages
grew at a solid pace. Strong labor markets and price stability reduced poverty. The Russian food
industry is characterized as highly dependent on imports. In 2012, Russia joined the WTO which
should not only have some positive effect on tariffs but also improve predictability and transparency in
the business environment. These are two significant factors that make Russia an attractive market for
U.S. exporters and many of their competitors. The U.S. was the fifth largest supplier to Russia in 2012
by value of agricultural, fish and forestry products. The consumer oriented sector accounted for 69
percent of total agricultural imports from the United States, worth more than $1.3 billion according to
Russian customs statistics. With growing demand, Russia presents great opportunities for U.S.
Olga Kolchevnikova, Marketing Specialist
and FAS Russia Staff
Deanna Ayala, ATO
Director
Export Opportunities for the U.S. Suppliers of Agricultural
Products
Exporter Guide
Russian Federation
RSATO1304
4/19/2013
Required Report - public distribution

suppliers, particularly suppliers of live animals, red meats1, poultry, fish and seafood products, tree
nuts, fresh and dried fruits, food preparations/ingredients and pet foods. Russia remains a complicated
market in terms of regulatory environment, financial structure, and in terms of its market size and
diversity. Post recommends that U.S. exporters review this guide and other reports, e.g. FAIRS Report,
from FAS Russia prior to entering the market.
Post:
1 Note: at present the Russian market is closed for U.S. beef, pork, turkey and their products. Please check FAS Gain reports
for updates on this and any other trade policy issue.
Moscow ATO

Author Defined:
SECTION I. MARKET OVERVIEW
The Russian consumer market is the largest in Eastern Europe boosted by the country’s vast size,
population, and strong economic growth. Euromonitor estimates by 2020 Russia will overtake Germany
as Europe’s largest consumer market. Rising incomes and a growing middle class have particularly
fueled demand for packaged food in Russia, as well as more intermediate and casual dining options in
the foodservice industry. Russia’s entry into the WTO in August 2012 should create a more transparent
policy environment and predictable business environment. These trends ultimately present great
opportunities for U.S. food and beverage exporters looking to enter the large and increasingly
advantageous Russian marketplace.
Russia’s economy grew 3.4 percent in 2012 (down from 4.3 percent in 2011). Gross domestic product
(GDP) in 2012 totaled $2,007 billion ($1,860 in 2011). Growth declined mainly due to weaker
performance of investments in the country. In contrast, consumption growth remained almost as strong
as in 2011 due to low unemployment, wage increases, and government spending. As a result,
consumption became the main growth driver in 2012. According to World Bank estimates, the GDP is
forecast to grow by 3.3 percent in 2013 and by 3.6 percent in 2014. Experts forecast that growth in 2013
will be slightly lower than in 2012 due to weak global sentiment, flat oil prices, high inflation, and
moderate domestic demand.
In 2012, retail sales in Russia amounted to $706 billion or up 5.9 percent year-on-year, according to the
Russian Federal Statistics Service (Rosstat). The share of food products in total retail sales in 2012 was
46.5 percent versus 47.8 percent in 2011. Foodservice sales grew by 6.3 percent and totaled $32 billion.
Real disposable income was up to 4.2 percent in 2012 and totaled $7,578 per person per year. The
average monthly wage grew 13.9 percent and totaled $859. Unemployment in Russia continues to
decline. It stood at 5.7 percent in 2012 (6.6 in 2011), the same level as before the financial crisis of
2007-8. In addition, Russia's savings ratio has been falling in recent years. In 2012, savings amounted
to 10.1 percent of disposable income (10.4 in 2011). The number of poor people in Russia reached a
record low. In the first nine months of 2012, 17.2 million of people were below the poverty line -- 3
million less than a year ago and the lowest number in the last two decades. For the first three quarters of
2012, the share of poor people declined to 12.1 percent, compared to 14.3 percent in 2011. The decline
in poverty reflected low unemployment, growth of wages and public transfers, as well as low food
inflation in the first half of 2012.
The Russian government continues to focus on fundamental changes in the country’s economic
structure over the long term. The economy remains heavily dependent on oil and natural gas exports,
which account for two-thirds of export revenues. Their goal is to reduce the economy’s dependence on
the energy sector.
European Russia, geographically west of the Urals, is home to over 75 percent of the total population
(143 million people). 74 percent of Russians in 2012 lived in urban areas and over 8 percent of the total

population lived in either Moscow (12 million people) or St. Petersburg (5 million people). There are
twelve cities in Russia (e.g. Novosibirsk, Yekaterinburg, Nizhniy Novgorod, etc.) with a population of
more than one million people. These Russian metropolitan areas also represent the largest retail and
Hotel/Restaurant/Institutional (HRI) markets in the country.
Table 1. Russia – Economic Activity, 2008-2012
2008 2009 2010 2011 2012 Nominal GDP, billion rubles 41,277 38,807 45,173 54,586 62,357
Nominal GDP, billion dollars 1,410 1,293 1,474 1,860 2,007
Real GDP growth, % change y-o-y 5.2 -7.9 4.0 4.3 3.4
GDP per capita, US$ 11,304 8,682 10,315 16,700 17,687
Population, millions 142 141.9 141.9 142.96 143.1
Unemployment, % 7 8.2 7.5 6.6 5.7
Inflation, % 13.3 8.8 8.8 6.1 6.6
Exchange rate (per $1) 24.85 31.76 30.36 29.35 31.07
Source: Federal State Statistics Service, The Central Bank of Russian Federation, 2013
In 2012, the Ruble was still weak against the Dollar and Euro. The Central Bank of Russia allows the
Ruble to float within a certain band to adjust to market conditions. Figure 1 below shows the exchange
rate of U.S. Dollar to Russian Ruble in 2012.
Figure 1. Russia’s Central Bank’s Exchange Rate of $1 USD to Ruble in 2012-2013
Source: The Central Bank of the Russian Federation, 2013
Consumer price inflation in Russia in 2012 stood at 6.6 percent (6.1 in 2011). According to the World
Bank, the increase of the inflation rate in 2012 was related to three factors. First, it reflects the increase
in food inflation triggered by the drought in Russia and among international grain producers, as well as
higher excise taxes on alcohol. Second, the rise in administrative prices in July and September 2012
pushed up services inflation. Finally, there was some uptick in core inflation, which excludes food and

gasoline. Sberbank estimates food inflation in 2013 will total 5.8 percent.
Figure 2. Consumer price inflation, 2000-2012, %
Source: Rosstat, 2013
Consumer spending on food has steadily increased from 2006 through 2012 by 125 percent with an
annual growth rate of 16 percent. Approximately 31 percent of consumer expenditure in 2012 was
allocated to the purchase of food and non-alcoholic beverages (compared to approximately 12.7 percent
in the United States in 2010), totaling about $300 billion. Figure 3 shows Russian consumers’
expenditures by sector in 2012.
Figure 3. Russia. Consumer Expenditure by Sector in 2012, %
Source: Euromonitor International from trade sources and national statistics, 2013
In 2012, Russian exports and imports slowed down their growth significantly. It was mainly due to low
investments and weak external demand due to the recession in the European Union.
Export sales increased by 1.4 percent (versus 31.5 percent in 2011) and imports by 3.6 percent

(versus 30.0 percent in 2011), according to Rosstat.
Figure 4. Russian Foreign Trade Data, 2002-2012, $US billions
Source: Rosstat, 2013
Imports of agricultural products to Russia decreased by 5.5 percent compared to 2011 and totaled $40.2
billion, according to Rosstat. In total, Russia’s imports have grown 143 percent since 2006. This
indicates an opportunity for future growth, suggesting U.S. exporters can benefit from further increasing
Russian import demand.
Table 2. Import of Agricultural Products to Russia, 2008-2012
2008 2009 2010 2011 2012 Agricultural Imports, billion dollars 35.2 30.0 36.5 42.4 40.2
Growth Year on Year, % - -14.8 21.7 16.2 -5.5
5-Year Average Annual Growth Rate, % 4.4
Source: Rosstat, 2013
The U.S. and Russia maintain strong trade relations and cooperate through trade and investment,
energy, and educational and cultural partnerships. The United States is Russia’s fifth largest import
source and in total U.S. - Russia bilateral trade amounted $25 billion in 2012.
Table 3. The U.S. – Russia Bilateral Trade, 2012
Russian Total Trade $864 billion
Exports $529 billion
Imports $335 billion
Trade Balance $194 billion
The U.S.-Russia Trade $25 billion
Exports from Russia to U.S. $10 billion

Imports to Russia from U.S. $15 billion
Trade Balance $5 billion
The U.S.-Russia Ag. Trade* $2.2 billion
Exports from Russia to U.S. $0.2 billion
Imports to Russia from U.S. $2.0 billion
Trade Balance $1.8 billion
Source: Rosstat, Global Trade Atlas, 2013
*Note: Agricultural, Fish and Forestry Products
Russia is among the top export destinations for U.S. agricultural products. Based on U.S. official export
data, the U.S. share of agricultural, fish and forestry products in 2012 increased by 29 percent and
exceeded $1.7 billion. Note: these figures are understated due to transshipments via Europe.
According to Russian customs statistics, U.S. agricultural imports in 2012 accounted for $2 billion – a
figure that is up by 26 percent compared to 2011. The U.S. remains the fifth largest supplier to Russia
(by value of agricultural, fish and forestry products) with 5.2 percent of Russia’s agricultural imports
behind Brazil, the EU, China, and others (please see Appendix Statistics, Table C). The U.S.’s top
agricultural exports to Russia in 2012 included: red meat, poultry, food preparations, tree nuts (almonds
and pistachios), fresh fruit, fish and seafood, and other products. Total U.S. - Russia agricultural trade,
approximately $2.2 billion, represents about 9 percent of total trade between the two countries.
Figure 5. Value of U.S. Exports of Agricultural, Fish & Forestry Products to the Russian
Federation (in millions of dollars), 2006-2012
Source: Global Trade Atlas. Note: These figures are based on U.S. Customs
export data, and will differ from Global Trade Atlas data on Russian imports
from the U.S., which are based on Russian Customs import data.

U.S. suppliers of a wide variety of products and services are active in the Russian market. The Russian
chapter of the American Chamber of Commerce includes more than 850 members successfully
operating in Russia. Among them are such American companies as Kraft, Mars, DuPont, Wrigley,
Cargill, PepsiCo and many others. According to PMR research, a number of leading international
brands entered or returned to the Russian market in 2011, including Berghaus, Diesel, DKNY Jeans,
Jaeger, Victoria’s Secret, La Senza, Jimmy Choo and many others. Moscow has been ranked as the third
most attractive city for international retailers after London and Paris, according to a survey of 150
leading international retailers in 55 countries in Europe conducted by Jones Lang LaSalle.
Successful U.S. businesses operating in Russia should not rest on their laurels. Russian companies are
raising their game in order to compete for customers. For some staple products, domestic production
meets demand. Certain imported food and agricultural products have difficulty competing with domestic
products due to the high cost of foreign exchange, high import duties and/or difficult regulatory
framework and generally efficient production of unsophisticated food products. Successful imports tend
to be those that add to the variety of foods available on the market such as those that are not grown in
Russia or for which domestic production is insufficient to meet domestic demand.
As part of its WTO accession agreement, Russia has committed to reducing and binding import tariffs to
all agricultural goods, thereby providing more predictability on its duties. For Russia’s WTO
commitments please see: http://tariffdata.wto.org/ReportersAndProducts.aspx. To see Russia’s current
applied rates please refer to the Customs Union schedule:
http://www.tsouz.ru/db/ettr/ettwto/Pages/default.aspx. The average tariff for agricultural products will
be reduced from current 13.2 percent to 10.8 percent. For more information on market opportunities
please see the following report:
http://gain.fas.usda.gov/Recent%20GAIN%20
Publications/Market%20Opportunities%20for%20Key%20U.S.%20Products%20in%20
Russia_Moscow_Russian%20Federation_3-20-2012.pdf
Exporters should review some of the advantages and challenges of the Russian market (please see Table
4 below) when considering their marketing strategy.
Table 4. Russia: Advantages and Challenges for U.S. Exporters
Advantages Challenges
Population of 143 million people who are potential
consumers. The U.S. is the fifth largest supplier to
Russia (by value) of food and agricultural products.
The relatively low purchasing power of many
Russian consumers, particularly in the
regions and the consequently lower demand
for durable goods, premium grocery, and
non-grocery goods.
Russia’s retail sector is growing, which creates a
number of opportunities for prospective U.S.
exporters. The ongoing development of the mass
grocery retail industry will allow producers to route
products to the market more efficiently.
Economic vulnerability, dependence on oil
and mineral extraction for most wealth.
Substitution of imports for domestic products
as part of the Russian Government’s policy of
self-sufficiency. Distance is one if the major
barriers complicating logistics for the retail
chains.
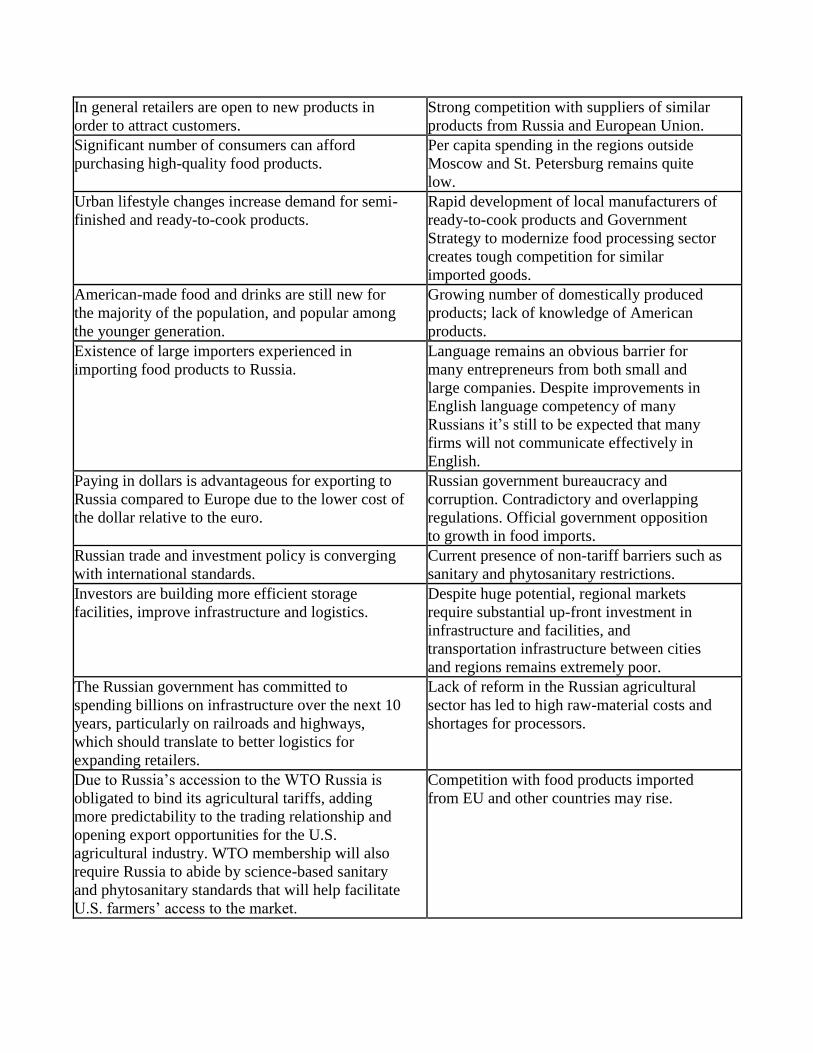
In general retailers are open to new products in
order to attract customers.
Strong competition with suppliers of similar
products from Russia and European Union.
Significant number of consumers can afford
purchasing high-quality food products.
Per capita spending in the regions outside
Moscow and St. Petersburg remains quite
low.
Urban lifestyle changes increase demand for semi-
finished and ready-to-cook products.
Rapid development of local manufacturers of
ready-to-cook products and Government
Strategy to modernize food processing sector
creates tough competition for similar
imported goods.
American-made food and drinks are still new for
the majority of the population, and popular among
the younger generation.
Growing number of domestically produced
products; lack of knowledge of American
products.
Existence of large importers experienced in
importing food products to Russia.
Language remains an obvious barrier for
many entrepreneurs from both small and
large companies. Despite improvements in
English language competency of many
Russians it’s still to be expected that many
firms will not communicate effectively in
English.
Paying in dollars is advantageous for exporting to
Russia compared to Europe due to the lower cost of
the dollar relative to the euro.
Russian government bureaucracy and
corruption. Contradictory and overlapping
regulations. Official government opposition
to growth in food imports.
Russian trade and investment policy is converging
with international standards.
Current presence of non-tariff barriers such as
sanitary and phytosanitary restrictions.
Investors are building more efficient storage
facilities, improve infrastructure and logistics.
Despite huge potential, regional markets
require substantial up-front investment in
infrastructure and facilities, and
transportation infrastructure between cities
and regions remains extremely poor.
The Russian government has committed to
spending billions on infrastructure over the next 10
years, particularly on railroads and highways,
which should translate to better logistics for
expanding retailers.
Lack of reform in the Russian agricultural
sector has led to high raw-material costs and
shortages for processors.
Due to Russia’s accession to the WTO Russia is
obligated to bind its agricultural tariffs, adding
more predictability to the trading relationship and
opening export opportunities for the U.S.
agricultural industry. WTO membership will also
require Russia to abide by science-based sanitary
and phytosanitary standards that will help facilitate
U.S. farmers’ access to the market.
Competition with food products imported
from EU and other countries may rise.

Russia’s accession to World Trade Organization (WTO) is expected to create changes that will improve
market access for foreign companies as well as a much healthier competitive environment domestically.
As part of its WTO accession agreement, Russia has committed to reducing and binding import tariffs to
all agricultural goods, thereby providing more predictability on its duties. The average tariff for
agricultural products will be reduced from current 13.2 percent to 10.8 percent. Through commitment to
WTO rules and norms, the investment in and expansion into the Russian market will become more
predictable thus reducing the “risk cost” of the entry ticket onto the market. To get more information on
the market opportunities for key food products that will occur with WTO accession for U.S. suppliers
please see the report:
http://gain.fas.usda.gov/Recent%20GAIN%20Publications/Market%20Opportunities
%20for%20Key%20U.S.%20Products%20in%20Russia_Moscow_Russian%20Federation_3-20-
2012.pdf
SECTION II. EXPORTER BUSINESS TIPS
General Consumer Tastes and Preferences
According to EMEA retail consulting and research, more than 90 percent of the most popular European
brands already operate in the Russian market with the rest considering entry. Experts estimate that
within the coming years, the high level of disposable income and the rapidly growing middle class will
make the Russian retail market one of the European leaders in terms of turnover.
According to Sberbank research, the average Russian consumer is largely debt free and has a larger
discretionary income as a percentage of pay than his or her counterparts in the West. Younger
consumers seem keener to spend rather than save their newfound incomes. Consumer finance is
booming, the number of Russian credit cards in circulation reaching 26 million in 2012, compared with
a mere 597,000 in 2003.
Eating habits in Russia are changing -- the increasing pace of life has led to a desire to reduce the time
spent cooking. This has resulted in greater use of processed and pre-cooked food, as well as a rise in
snacking and eating out including fast-food restaurants. At the same time, many consumers have
embraced the healthy eating trend and are consuming more fruit and vegetables. Higher income
consumers are seeking out low fat, natural and functional foods. Environmental awareness is expected
to grow in Russia as a result of new legislation and pressure from other developed markets, opening
opportunities for greener, healthier and more natural products. The demand for eco-brands and organic
products is also growing, whilst there is a lack of regulation in Russia concerning organic production,
and any company can name its products “bio” or “eco”. For more information on the Russian organic
market please see ATO Moscow’s Organic Market report:
http://gain.fas.usda.gov/Recent%20GAIN%20Publications/
Russian%20Organic%20Market%20Continues%20to%20Grow_Moscow%20ATO_
Russian%20Federation_2-15-2013.pdf
For high end Russian consumers, food is becoming more of a fashion statement or a lifestyle choice. In
major cities, growth in high-end shops and boutiques continues apace. Russian consumers are tempted
by bite sized brand offerings aimed at greater novelty, convenience and superior niche services.

According to a recent Nielsen Global Survey, Russian shoppers love new products and innovations.
More than three-fourths of Russian consumers (76 percent) are interested in trying new products. And
they keep their eyes open for them. Thirty-eight percent of Russian respondents frequently notice new
products on store shelves, well above the global average of 29 percent. In fact, 23 percent of Russians
indicate that product variety is the most important factor in determining where to shop. Responding on
this, in 2012, Russian FMCG manufacturers and retailers launched almost 7,000 new products.
Along with that, Russian shoppers love their tried-and-true brands and exhibit strong brand loyalty.
Many Russians know which brands they will purchase before they enter a store, and 43 percent are
brand loyalists in most categories. Private label store brands have had less success in Russia than many
other markets -- 73 percent of the survey respondents still don’t buy them.
Family remains important in Russian life, and it affects shopping habits. More than half (53 percent) of
Russian consumers shop regularly for the whole family (compared with 45 percent globally).
Comparatively, one-third (32 percent) of Russians shop only for themselves.
The vast majority of Russians shop for products they intend to use in the short term. Only 5 percent
shop with future buying intentions in mind. One quarter of Russians shop to satisfy an immediate need,
and half (47 percent) shop to buy things to use that day. This is good opportunity wide range of U.S.
packaged products and ready-to-eat options.
Packaged Food Sales
With growing demand, Russia is increasingly dependent on imports of retail and packaged food
products, and this presents opportunities for U.S. suppliers. Russia’s packaged food market is amongst
the fastest growing in the world reaching $100 billion by some estimates. In 2012, the market was
boosted by steady growth in almost all categories of packaged food. Sales in this sector increased by 5.5
percent in 2012 supported by rising incomes as well as the availability of imported products on the
market.
Moscow is a priority market for many packaged food players. Global brands and imported products
have a higher share of value sales in Moscow than they do nationally. This is largely due to the city’s
higher income level and Muscovites’ Western-looking attitudes being affected by European lifestyle
trends and brands. In addition, the higher share of imported products in Moscow is due to generally
higher prices in the city. This reduces the price gap between domestic and imported goods. Many
products are often launched in Moscow long before they are launched nationwide. As a result, Moscow
accounted about 15 percent share of overall packaged food sales in 2012 and saw stronger growth than
Russia as a whole (according to Euromonitor).
The influence of Western consumption habits in Russia has led to an increasing penchant among
Russian consumers for snacking between meals, making the snacks category a growth market. Since
2000, sales of snacks have grown rapidly due to new product launches and the heavy promotion of
national brands. As you can see below, the Snack Bars category reached record volume with 14 percent
growth year-on-year. Almost all categories of packaged products also saw noticeable growth in 2012 in
both volume and value terms.

Figure 6. Packaged Food Sales through Retail Stores in Russia (2011/2012 % growth, $US
millions in y-o-y exchange rate)
Source: Euromonitor International
The popularity of fortified products in Russia is also growing. Various types of noodles, dairy products,
soup, and baby food products fortified with vitamins (omega 3, vitamins A, B1, B2) were launched in
the market in 2011-2012. Producers emphasize the new health and wellness features of their products
(reduced-fat or vitamins added) on the packaging of their products (for more information on food
package labeling please see FAIRS report:
http://gain.fas.usda.gov/Recent%20GAIN%20Publications/Food%20and
%20Agricultural%20Import%20Regulations%20and%20Standards%20-
%20Certification_Moscow_Russian%20Federation_05.02.2013.pdf
Significant market opportunities exist for U.S. exporters of non-alcoholic beverages and many of these
are already experiencing strong growth in Russia. According to Euromonitor, in 2012 the sales of sport
and energy drinks reached 17 percent growth year-on-year. Bottled water increased by 8 percent
followed by ready-to-drink coffee (6 percent) and carbonates (3 percent). Significant growth in sports
and energy drinks sales was due to the novelty of the products on the market as well as their active
promotion in media. In 2010, there was a spike in bottled water sales due to the record-setting
temperatures. The bottled water habit that was formed that summer has persisted for many Russians.

Figure 7. Drink & Beverages Sales through Retail Stores in Russia (2011/2012 % growth, $US
millions in y-o-y exchange rate)
Source: Euromonitor International * Note: RTD - ready-to-drink
Table 5 below shows retail value sales of packaged food in 2008-2012.
Table 5. Packaged Food Sales through Retail Stores in Russia, 2008-2012, $US millions
2008 2009 2010 2011 2012
2011/2012
% Growth
Packaged Food
74,77
7
65,50
9
77,31
5
87,76
9
92,61
9 5.5
Dairy
14,97
9
13,98
4
16,87
1
18,92
2
20,03
3 5.9
Bakery
12,36
6
10,60
3
12,25
0
13,91
5
14,55
0 4.6
Confectionery 9,760 8,569
10,13
3
11,81
2
12,58
0 6.5
Frozen Processed Food 6,674 5,840 6,853 8,149 8,744 7.3
Chilled Processed Food 5,939 5,139 6,358 7,032 7,394 5.2
Oils and Fats 5,691 4,675 5,502 6,172 6,428 4.1
Canned/Preserved Food 4,654 4,007 4,666 5,313 5,590 5.2
Sauces, Dressings and
Condiments 4,085 3,560 4,050 4,586 4,805 4.8

Ready Meals 3,740 3,250 3,726 4,304 4,563 6
Sweet and Savory Snacks 3,683 3,018 3,396 3,783 3,935 4
Dried Processed Food 3,203 2,755 3,103 3,539 3,681 4
Ice Cream 1,734 1,543 1,999 1,999 2,159 8
Baby Food 1,534 1,404 1,648 1,971 2,107 6.9
Pasta 1,313 1,211 1,344 1,462 1,541 5.4
Noodles 555 503 557 616 685 11.1
Soup 462 414 506 605 677 11.9
Spreads 419 370 442 529 560 5.9
Snack Bars 11 10 12 15 17 14.7
Source: Euromonitor International from trade sources and national statistics, 2013
Starting Business with Russia
The World Bank's Ease of Doing Business 2013 report ranked Russia 112th
out of 185 countries (in
2011, 111th
out of 183). The conditions for starting a business have deteriorated significantly since 2009
when Russia ranked 88th out of 183 countries. This is due to the lack of reform in terms of the time and
number of procedures required for setting up a business in the country. While many countries have
simplified and streamlined the process, it takes 8 procedures and 18 days in Russia to open a business.
However, the cost of starting a business in Russia is low: only 2 percent of per capita income, compared
to an average of 8.3 percent of per capita income in the Eastern Europe and Central Asia region in 2012.
Exporters can request a brief market assessment for their products and/or a list of Russian importers
from ATO Moscow, St. Petersburg and Vladivostok. Additionally, ATO Moscow offers the following
recommendations to help exporters select the best approach for their firm:
A prospective entrant is advised to estimate market prospects for their product with respect to
consumer preferences and incomes, local competition and sales channels (marketing research
from a specialized consulting firm may be required). A thorough review of Russian regulations
is also advised including a review of any changes to the tariff post WTO-accession.
Attend Promotional Events: One of the main challenges to exporters entering the Russian
market is product promotion. A cost-effective way exporters can promote their products is to
participate in one of the largest general food and beverage trade shows in Russia, World Food
Moscow, held annually in September. If exporters are targeting specific regions within Russia,
the Moscow ATO recommends participating in regional exhibitions. Participation fees for
regional exhibitions are lower, and are aimed at local consumers and retail food chains. The
Russian retail market is competitive; exporters should allocate time to visit Russia and earmark
funds in their sales plans for promotional support.
Work with a Russian Importer: Selecting the right trade partner is one of the most important
decisions for exporters developing their business in Russia. Working with a local partner in
Russia significantly expands business opportunities, and minimizes the need for exporters to
establish direct contact with multiple retail chains. A local Russian partner familiar with market
conditions and the regulatory environment can help exporters navigate the Russian retail market,

resolve issues, and increase the likelihood of success.
In order to make the first delivery, usually a large local import company is chosen. The company
should have a good reputation and experience in customs clearance, and must have storage facilities and
a developed distribution network. Make sure the company has experience working with Western
suppliers and has experience in arranging regular supplies of food products. Western companies that
strive to supply directly, circumventing Russian middle men, often sustain losses due to lack of local
market knowledge. A large domestic import company is usually better adjusted to local conditions,
with established trade ties and contacts in state structures.
Exporters representing U.S. companies may contact the Moscow ATO for an importer list. Performing
due diligence is critically important, such as verifying banking and supplier references of potential
importers, and local and U.S.-based organizations in Russia can provide helpful information to
exporters. However, credit reporting is a relatively new practice in Russia, and credit-reporting
agencies may not have complete information on potential Russian business partners. Retail chains may
be another valuable source for exporters collecting information on importers.
Provide Sales Support: Exporters must help market the products they sell in Russia. Russian
importers and wholesalers expect exporters to participate in the sales process, either by
providing event marketing support, advertising assistance, training, packaging/handling advice,
or point of sales materials.
Establish a Representative Office: Once a company has established firm contacts and has a solid
prospect for sales, one of the best ways to conduct business in Russia is to open a representative
office. Depending on the product and target market, an office might be situated in Moscow, a
city that hosts a large concentration of retailers and representative offices; St. Petersburg, the
port city through which the largest volume of sea-borne freight passes; or Vladivostok, the
principal transpacific gateway to the Russian Far East.
Trade Shows in Russia
Participation in one of several established trade shows in Russia allows exporters to take a first-hand
look at the local market, to meet potential importers, and to gauge the competitiveness of their products
compared to similar products promoted at the show.
World Food Moscow Moscow, Expocentre
September 16-19, 2013
www.world-food.ru/eng
World Food Moscow is a USDA-supported show, and is essentially the “main event” for U.S. exporters
interested in market opportunities in Russia. ATO Moscow and the Office of Trade Programs (in
Washington) organize American pavilions in the grocery, fruit, and seafood sections offering “turn-key”
service. USDA industry organizations (aka Cooperators) typically organize a pavilion in the meat hall. In
2012, this 4-day show drew 1,600 exhibitors from 69 countries and attracted more than 26,000
importers, wholesalers, retailers, and processors from all parts of Russia and from many neighboring

countries.
PIR Hospitality Industry Moscow, Crocus Expo Center
October 1-4, 2013
http://www.pir.ru/
The PIR Hospitality Industry exhibition is the leading show for the hotel, restaurant, and industrial
catering sector (HRI) and is affiliated with the Restaurateurs and Hoteliers Federation of Russia.
In 2012, more than 850 exhibitors from 25 countries participated in the PIR show. The PIR show
attracted approximately 45,000 visitors from the Russian hospitality industry.
Ingredients Russia Moscow, All-Russian Exhibition Centre (VVC)
March 11-14, 2014
http://www.ingred.ru/
Ingredients Russia is a specialized trade show for suppliers and buyers of ingredients worldwide. In
2012, more than 240 companies and organizations from 21 countries exhibited at the show. More than
6,000 specialists visited the show last year searching for new contacts and different kinds of ingredients
for food processing (e.g. confectionery, meat, fish, dairy, etc.).
Golden Autumn Moscow, All-Russian Exhibition Center (VVC)
October, 9-12, 2013
http://www.goldenautumn.ru/en/
The Golden Autumn trade show is organized by the Russian Ministry of Agriculture, and is the
largest Russian trade show for production agriculture. In 2012, more than 2,000 companies and
organizations from 70 Russian regions and 30 foreign countries exhibited at the show. Golden
Autumn occupied over 70,000 meters of space, including open grounds, displaying over 700 items of
agricultural equipment, both Russian and foreign. More than 100,000 visitors attended the event,
most of who are involved in farming and livestock production, food processing, agri-business,
research, or business financing. At this annual trade show, the USDA pavilion displays animal and
plant genetics, high-grade feeds, animal nutrients, and feed additives.
Prodexpo Moscow, Expocentre
February 10-14, 2014
http://prod-expo.ru/en/
Prodexpo is Moscow’s largest international trade show highlighting foodstuffs manufactured in Russia
and Eastern Europe. In 2012, Prodexpo hosted more than 2,200 exhibitors from 63 countries and
attracted more than 50,000 visitors.
Logistics and Transportation

Imported products arrive in Russia via land, sea, or air freight into ports or customs warehouses for
clearance before proceeding to the next destination. The transportation system for shipping U.S. high
value food products into Russia via St. Petersburg and Moscow is well established. Most consumer-
oriented food and beverage products including those from the U.S. enter through St. Petersburg or
Moscow for customs clearance. Most American products are delivered to the Russian Federation in
containers by sea and around 90 percent enter via the Port in St. Petersburg. MAERSK LINE, APL,
OOCL, Hapag Lloyd, Evergreen, CMA-CGM shipping lines deliver cargos from the United States to
Rotterdam, Hamburg, or Bremerhaven in Northern Europe. The transatlantic shipment can take from 17
to 30 days depending of the departure port and number of ports the vessel calling on the way to Europe.
In Northern European ports, the containers are reloaded onto feeder vessels and travel an additional five
days to St. Petersburg. It then takes an additional four days shipping time for final delivery by rail or
truck to Moscow.
Outside of Russia, imports are also delivered to Baltic ports and then shipped by truck or rail to St.
Petersburg or Moscow. Baltic and Finnish ports had offered greater efficiency, fewer problems with loss
or damage, and lower port fees. However, changes in Russian import requirements have largely
redirected these shipments to Russian ports: St. Petersburg, Ust-Luga, Vysotsk, Kronshtadt,
Novorossiysk and Vladivostok.
The cleared products are then shipped further into the interior via truck or rail to Moscow,
Yekaterinburg, Novosibirsk, Rostov-on-Don, Kazan, Samara, Ufa, and other major population centers
in Russia, the main markets for the high end products.
Products destined for the Russian Far East (RFE) enter through the ports of Vladivostok, Vostochnyy,
Vanino, Nakhodka and Magadan. Although Vostochnyy is the region’s largest port by volume, the
majority of U.S. food exports to the RFE enter through Vladivostok.
Figure 8. Entry Gateways for the U.S. Products by Sea
Source: SVT Group
Currently several forwarders make shipments from the U.S. west coast to Vladivostok: Hyundai
Merchant Marine, MAERSK LINE, APL, and Hapac Loyd. Average transit time from the U.S. west
coast to Vladivostok takes 18 days: ocean vessels bring containerized goods to the Korean Port of Pusan
(it takes 9 to 13 days), then, feeders transfer them to the Port of Vladivostok (it takes 4 to 7 days).

MAERSK LINE has the longer transit time, because it goes though Japan first, and then delivers goods
to Korea (Pusan). In 2008, FESCO launched a direct line from Everett, Washington to RFE ports
(Vladivostok, Korsakov, Petropavlovsk, and Magadan). Direct voyages are scheduled approximately
once per month and the average transit time is 14 days. From Vladivostok food products are shipped to
the other cities in the RFE and Siberia by truck or rail.
Distribution Channels
Imported food products for Russian retail chains and food service establishments come through
importers, distributors, and wholesalers. Large suppliers are typically also importers.
Figure 9. Russia: Distribution channel for food retail chains, import of transatlantic products via
the Port of Greater St. Petersburg
Figure 10. Russia: Distribution channel for food retail chains, delivery from U.S. to the Russian
Far East
Most hotels and restaurants choose to purchase the majority of products through food service
importers/distributors in the hotel, restaurant, and industrial (HRI) sector, both large and small.
Credit and Payment Terms

The Russian banking system continues to make strides towards complying with international standards,
and many banks that are authorized to open foreign currency accounts also have general licenses
enabling them to undertake a full range of foreign currency transactions. Many of these banks have
correspondent banks in the United States. Further, several American and foreign banks such as Citibank,
Raffeissenbank, Societe Generale, and Credit Suisse are licensed to operate in Russia. Securing credit
can be costly, however, and there can be obstacles to securing credit in Russia if the company is 100
percent foreign-owned. Russian bank fees are often high, and it can take much longer to open letters of
credit or transfer funds than is common in the United States.
However, the Russian banking industry remains unconsolidated with a large number of small banks, and
it is still considered underdeveloped with low penetration of banking services and strong growth
potential. The largest state banks play a huge role in the domestic banking sector. Sberbank and VTB
have a combined market share of over 42 percent of Russian banking sector assets. Sberbank dominates
in both retail deposits and retail loans (45 percent and 33 percent market shares respectively) with over
100 million retail clients in total. (Source: Sberbank Report, 2013)
According to Sberbank, Russia’s banking sector has been one of the fastest growing of the leading
emerging markets over recent years with a 26 percent CAGR in 2005-2012. In 2012, the Russian
banking sector delivered retail loan growth of 39 percent (versus 36 percent in 2011).
Prospective borrowers should expect Russian banks to request a package of documents, including a
balance sheet showing profits for the last three quarters and proof of assets to mitigate the bank’s risk.
Interest rates on credit became lower in 2011-2012 after a significant rise in 2009-2010 (up to 13.9
percent) making credit more available for Russian businesses.
Figure 11. Average Interest Rates on Ruble-Denominated Credit to Nonfinancial Institutions Up
to One Year, 2012, %
Source: Central Bank of Russian Federation, 2013
The Russian credit card and payments market demonstrated significant growth during the last five years.
In 2012, the Russian credit card market grew by 82.5 percent in value terms having exceeded the growth

rates of 2011 (61.6 percent) with about 26 million of credit cards. Key growth drivers included
increased annual disposable income, the development of online shopping, investment in the banking
infrastructure and raised consumer awareness about the benefits of using payment cards. In total, the
market size of plastic cards (both debit and credit) is expected to grow at a CAGR of 5.4 percent in
terms of volume over 2012–2016, to reach 266.5 million cards in 2016. (Source:
Researchandmarkets.com)
Table 6. Growth of Loans in Russia in 2011-2012, %
Type of Loan 2011 2012
Consumer Credit 32.67 36.94
Car Loans 33.15 36.71
Mortgage Loans 35.44 50.53
Total Loans 34.69 44.54
Source: National Bureau of Credit Histories, 2013
Regarding payment terms, many U.S. exporters require 100 percent up-front payment especially for
new trading partners. Russian importers may not be accustomed to making a 100 percent pre-payment
prior to shipment and moreover may struggle to finance it. As the business relationship develops,
Russian importers may eventually expect exporters to ship on credit, with payment due upon arrival in
the Russian port. The importer may alternatively make a pre-payment and pay the balance when the
product arrives to the importer’s storage facility.
In established business relationships, bank transfers are sometimes made on the basis of payment–on-
delivery, or payment after an agreed number of days. A letter of credit (LC) may be used when required
by the foreign supplier, but Russian importers consider LCs expensive and difficult to arrange.
Document Collections work relatively well at ports, and importers are accustomed to these procedures.
Nevertheless, until exporters and importers build relationships and reach a level of trust, exporters may
find letters of credit worthwhile.
The GSM credit guarantee program offered through the United States Department of Agriculture
(USDA) provides credit guarantees to encourage financing of commercial exports of U.S. agricultural
products. The GSM Credit Guarantee allocation for Russia for FY 2013 (October 2012 – September
2013) is $125 million with $25 million specifically for all commodities excluding beef, pork, poultry
and live animals. The GSM-102 program is in great demand due to the difficult financial environment
and lack of financing available commercially in Russia. GSM-102 reduces risk to the U.S. exporter’s
bank and facilitates shipments of U.S. commodities to markets that may not be able to import these
same products without the guarantee offered by the Commodities Credit Corporation.
The list of approved participating foreign banks in the GSM-102 program is available at FAS web-site:
http://www.fas.usda.gov/excredits/foreignbanks.html#RUSSIA. The list is regularly updated upon the
review of incoming financial information and applications from banks that desire to participate in the
GSM-102. For further information on these programs, please visit the FAS website:
http://www.fas.usda.gov/excredits/ecgp.asp).
Food Standards and Regulations

Russia has complex food import regulations. Exporters should carefully question importers regarding
certification and documentation requirements, as well as procedures for clearance of shipments into the
Russian Federation. Upon WTO accession many of the rules and regulations governing food and
beverage imports will change so please continue to check the FAS website for updates.
In February 2010, compulsory certification for non-veterinary food products and cosmetics was
cancelled. The Government of the Russian Federation (GOR) now requires only a declaration of
conformity with the product safety regulations, instead of an obligatory certificate. At the same time, the
authorities are planning to impose heavy fines on the manufacturers of unsafe products. Sanitary norms
and technical regulations were not cancelled and continue to regulate the production process. For more
detailed information on certification, customs procedures, documentation, tariffs, and labeling
requirements please see the following GAIN reports:
1) Food and Agricultural Import Regulations and Standards report:
http://gain.fas.usda.gov/Recent%20GAIN%20Publications/Food%20and%20Agricultural
%20Import%20Regulations%20and%20Standards%20-%20Narrative_Moscow_
Russian%20Federation_01.02.2013.pdf
2) RS1015 Declaration of Conformity Replaces Certification for Many Products
http://gain.fas.usda.gov/Recent%20GAIN%20Publications/Declaration%20of%20Confor
mity%20Replaces%20Certification%20for%20Many%20Products_Moscow_Russian%2
0Federation_3-22-2010.pdf
On January 1, 2010, Russia, Belarus and Kazakhstan launched a Customs Union which has since
introduced many new rules and regulations for food products exported to the Union. The unification of
sanitary norms and technical regulations continues, and reforms affecting food standards and regulations
may last for quite some time. Please check the Customs Union Ag Times in the FAS GAIN system for
regular updates on the Customs Union developments.
Pricing
Retail prices in Russia can vary significantly; however pricing has become more competitive as large
retail chains increase their aggregate market share. On the regulatory side, exporters should consider the
effect of the Russian tax regime when making pricing and margin decisions. Again, please continue to
monitor GOR tariffs and other duties as WTO accession moves forward. Some of the taxes assessed
include:
Import duties are applied to most goods and typically range from 5 to 20 percent of products’
customs values. However, some agricultural products are subject to specific tariffs that are
calculated by volume, weight or quantity. Excise taxes, depending on the commodity exported,
apply to goods such as alcohol and tobacco products. For checking excise taxes rates please
contact ATO Moscow.
Russia typically levies an 18 percent Value Added Tax (VAT) on imported goods; however,
some food products (e.g. sugar, salt, milk, bread, pasta, vegetables, baby food, end etc.) are
subject to a reduced rate of 10 percent
Customs clearance charges add about 1.25 percent. The wholesale mark-up is typically 12 to15
percent, while retail mark-up runs 35 percent or more, depending on the product and the retailer;
and,
A 39 percent profit tax is assessed on gross margin.
SECTION III. MARKET SECTOR STRUCTURE AND TRENDS
Retail Food Sector
Over the past 10 years, the retail market in Russia has changed dramatically. In 2002-2012, the Russian
retail sector increased its turnover six fold, created 5 million new jobs and doubled its productivity. The
main driver of this improvement has been the growth in modern retail formats which currently accounts
for about 90 percent of sales across Russia. Open-air markets and older Soviet-style stores, including
wet markets, continues to decline in popularity and lose market share to modern retail formats.
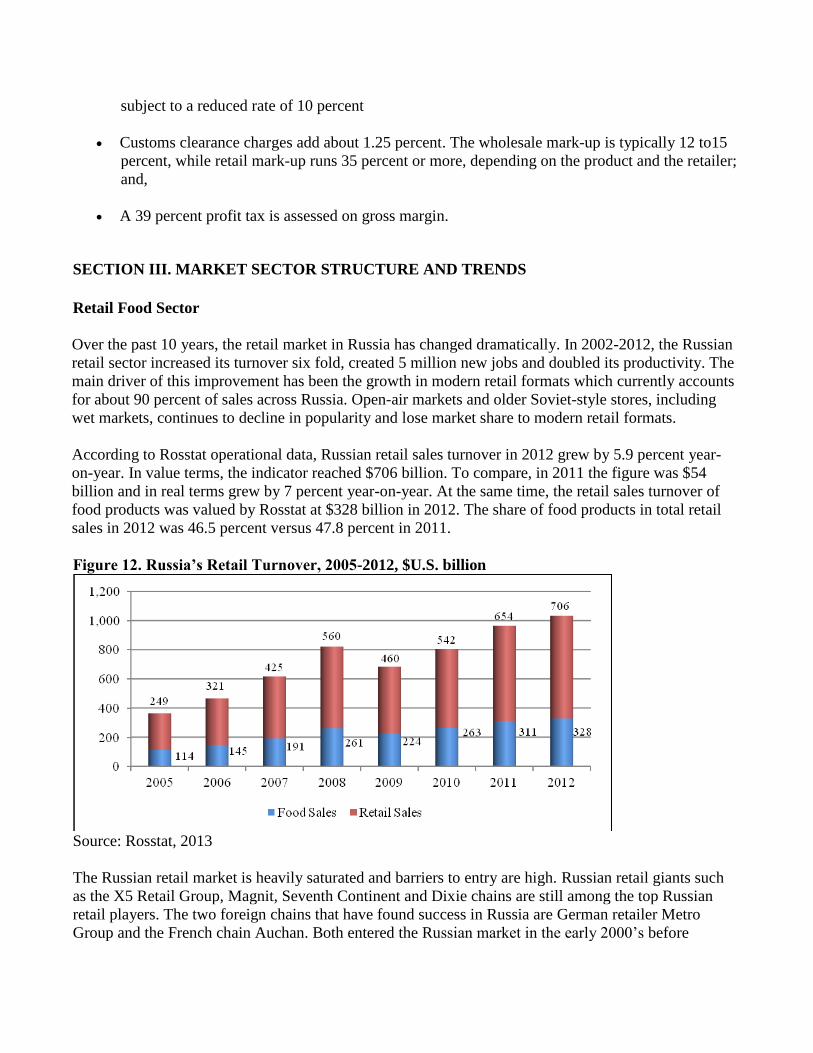
According to Rosstat operational data, Russian retail sales turnover in 2012 grew by 5.9 percent year-
on-year. In value terms, the indicator reached $706 billion. To compare, in 2011 the figure was $54
billion and in real terms grew by 7 percent year-on-year. At the same time, the retail sales turnover of
food products was valued by Rosstat at $328 billion in 2012. The share of food products in total retail
sales in 2012 was 46.5 percent versus 47.8 percent in 2011.
Figure 12. Russia’s Retail Turnover, 2005-2012, $U.S. billion
Source: Rosstat, 2013
The Russian retail market is heavily saturated and barriers to entry are high. Russian retail giants such
as the X5 Retail Group, Magnit, Seventh Continent and Dixie chains are still among the top Russian
retail players. The two foreign chains that have found success in Russia are German retailer Metro
Group and the French chain Auchan. Both entered the Russian market in the early 2000’s before

competitors became well-established. Of the top 10 leading food retailers Metro and Auchan have been
the only non-Russian companies to command a leading position in the retail sector. Notably absent from
the Russian market are Carrefour and Wal-Mart although both had attempted to enter.
Table 7. Top 10 Grocery Retailers in Russia by sales turnover, 2012
Rang Company Name Sales turnover
(US$, bn)
1 X5 Retail Group 18.2
2 Magnit 16.7
3 Auchan Group 9.9
4 Metro Group 8.4
5 Dixie Group 5.5
6 O'Key 4.3
7 Lenta 4.2
8 Seventh Continent 2.3
9 Globus 1.0
10 Rewe Group (Selgros) 0.8
Source: PlanetRetail, 2013
Russia's enormous size contributes to the fact that the retail market is currently divided among many
players and differs by region. The market shares of large retail chains are relatively small. For example,
the X5 Retail Group which is the largest Russian food retailer controls only 8 percent of the grocery
market and the top 10 food retailers comprise about 23 percent, according to Euromonitor. This presents
great opportunity for consolidation for Russia's retail chains in future for widening regional and national
market shares.
As an example of consolidation activities in 2013, Auchan Group is going to purchase a retail chain
Real which is currently a part of Metro Group. The sale of Real to Auchan comprises 91 hypermarkets
in Russia, Poland, Romania and Ukraine. Currently, Real takes 22nd
position in the rank of Russian food
retailers, according to Infoline. Sixteen Real hypermarkets operating in Russia will be sold by the end of
2013 and will operate under the Auchan brand in future. With this deal Auchan Group takes the
opportunity to balance its presence in Central and Eastern Europe, according to the company’s
management.
According to InfoLine research agency, 130 major Russian grocery retailers opened 4,059 outlets of
different formats in 2012. The retailers’ joint trading area grew by 1.75 million sq. m. to 11.5 million sq.
m. which means 17.5 percent growth year-on-year. Magnit remained the fastest growing company
during the last year. Currently, the company holds 25.5 percent of the total market in terms of retail
space. Second position in the rating is taken by X5 Retail Group with 10.1 percent growth in combined
trading area. Dixie is third with 4.8 percent growth.
Table 8. Number of New Openings by Selected Grocery Retailers in Russia, 2012
Retailer No. of Stores Opened in 2012 Store Count at the End of 2012
Magnit: 1,093 6,192

Convenience stores 1,040 6,046
Hypermarkets 36 126
Magnit Semeyniy 17 20
X5 Retail Group: 800 3,802
Soft discounters 695 3,220
Supermarkets 40 370
Hypermarkets 1 78
Convenience stores 64 134
Dixie Group: 380 1,499
Convenience stores 368 1,437
Supermarkets 11 42
Hypermarkets 1 19
Maria-Ra 131 502
Auchan Group: 40 156
Hypermarkets 8 56
Supermarkets (Atak) 30 96
Nasha Raduga 2 4
O'Key: 12 83
Hypermarkets 10 52
Supermarkets 2 31
Lenta 10 56
Azbuka Vkusa 8 51
Metro Group: 6 84
Metro Cash & Carry 6 68
Real 0 16
Source: PMR, 2013
According to Euromonitor data, the most dynamic growth in modern retail formats in 2012 was in
convenience stores (14 percent year-on-year), the format which is very close to discounters.
Hypermarkets grew by 8 percent, supermarkets -- by 6 percent. Traditional retail is shrinking their
market share and declining in sales. The most popular grocery retail format in Russia remains
supermarkets with $96 billion sales in 2012.
Table 9. Russia: Sales in Retailing by Sector in 2008-2012, $ US Million
Formats 2008 2009 2010 2011 2012 %
change
'11-'12
%
change
'08-'12
Modern Grocery
Retailers 95,619 86,012 106,534 131,450 141,259 7 48
Supermarkets 70,679 62,286 75,244 90,646 96,344 6 36
Hypermarkets 17,455 16,288 20,988 26,477 28,713 8 64
Convenience Stores 6,873 6,954 9,695 13,603 15,473 14 125

Forecourt Retailers 611 484 607 724 729 1 19
Traditional
Grocery Retailers 99,444 86,827 98,378 111,560 107,486 -4 8
Independent Small
Grocers 62,836 55,609 63,512 72,642 70,349 -3 12
Food/Drink/Tobacco
Specialists 5,053 4,353 5,054 5,776 5,607 -3 11
Other Grocery
Retailers 31,556 26,865 29,812 33,142 31,530 -5 0
Total Grocery
Retailers 195,063 172,839 204,912 243,010 248,745 2 28
Source: Euromonitor International from trade sources and national statistics, 2013
Development of private labels in Russia is a relatively new phenomenon. The X5 Retail Group, Metro
Group and Magnit are among the first to introduce private labels in Russia starting from 2001.
Currently, the share of private labels sales in total turnover of the retail chain is relatively small at about
5-7 percent. The main reason of this is the lack of a clear strategy for the majority of retailers and lack
of the quality control. Also retailers confirm that it is difficult to establish long-lasting and trusting
relationships with contractors, as private label manufacturing brings little profit.
Table 10. Share of Private Labels Sales in Total Retail Sales in 2012, %
Retailer PL Share
X5 Retail Group 5
Magnit 13.2
Auchan Group 14
Metro Group 10.5
Maria-Ra 17.3
Source: Infoline, 2013
Nonetheless, retailers see private label products as offering strong advantages in terms of price
competition in the longer term. The leading retailers are investing in better packaging and improving the
quality of private label offerings. The majority of the leading retailers have ambitious plans on further
private label development. The X5 Retail Group plans to increase its private labels’ share up to 50
percent in Pyaterochka stores, to 25 percent in Perekriostok supermarkets and to 10 percent in Karusel
hypermarkets. Auchan intends to increase its own brands’ share in total sales up to 17 percent
introducing 500-700 SKU’s under the private label annually. The development of private labels in the
medium and upper-medium price brackets will become one of the major trends in Russian retailing,
according to the PMR report “Private Label in Russia 2012. Market Analysis and Development
Forecasts for 2012-2014”.
Moscow and St. Petersburg account for the highest number of shopping malls in Russia. At the end of
2011, approximately 45 percent of all shopping centers in the country were in these two cities. In 2012,
twelve new shopping centers were completed in Moscow and eighth in St. Petersburg.
Retailers demand consistent quality and adherence to contract specifications and penalize suppliers for
failure to meet requirements. As a result, foreign suppliers continue to be competitive in the Russian

market as they are more accustomed to meeting such strict specifications than Russian agricultural
producers. Please see the “Retail Foods Annual 2012” report for more information on the retail sector in
Russia: http://gain.fas.usda.gov/Recent%20GAIN%20Publications/Retail%20Foods_Moscow%20
ATO_Russian%20Federation_9-24-2012.pdf. The next updated Retail Report will be available in
August – September, 2013. For search engine please visit
http://gain.fas.usda.gov/Lists/Advanced%20Search/AllItems.aspx
Legislation Regulating Retail Trade
The Russian Federal Law on Trade came into force on February 1, 2010. The Law is aimed at creating
transparent conditions of cooperation between domestic suppliers and retailers and boosting competition
in the retail sector. The Law contains strict antimonopoly regulations, such as capping store openings
once a retailer reaches a 25 percent market share threshold within a city or municipal region, a 10
percent limit on bonuses paid to retailers by suppliers, and payment terms regulating how fast a retailer
has to pay for goods with a certain shelf life, among others. The Law stipulates that the terms and
conditions of food product supply contracts shall be brought into accord with requirements of the Law
within one hundred eighty days from the effective date.
Please see the “Russian Trade Law” report for further information on the legislation regulating retail
trade in Russia: http://gain.fas.usda.gov/Recent%20GAIN%20Publications/The%
20Russian%20Federal%20Law%20on%20Trade%20_Moscow%20ATO_Russian%20Federation
_8-30-2010.pdf
According to PMR, the Russian Federal Antimonopoly Service (FAS) is currently to amend the Trade
Law to allow retailers to exceed a 25 percent share of a particular municipal market on a one-off
occasion when the company is in the middle of developing a new trading object (or objects). According
to local media, the construction of a new trading outlet may bring a company a one-time increase in
market share which will still have to be less than 50 percent to comply with the anti-monopoly law.
After the one-off breach of the 25 percent threshold a retailer will not be able to open more stores.
Hotel, Restaurant, and Institutional (HRI) Sector
HRI sales grew by a respectable 12.2 percent in 2012, on par with pre-crisis sales growth of 10 to 12
percent (2005 to 2008). Returning consumer confidence brought customers back HRI dining
establishments. Most notably the HRI sector’s growth was in the fast food, coffee shop, and casual-
dining segments. Since imports make up the vast majority of HRI products (more than 65 percent),
opportunities for U.S. products are significant.
Table 11. Food Service Industry Sales in Russia
2008 2009 2010 2011 2012
RUR, billion 722.7 711.2 781.4 903.3 1013.6
Growth Year on Year, % -1.6 9.8 15.6 12.2
US Dollars, billion 29.09 22.42 25.63 30.77 32.62
Average exchange rate 24.84 31.72 30.48 29.35 31.07
Source: Federal State Statistics Bureau (Rosstat)

According to Russian Business Consulting the number of cafes, restaurants, and other food outlets in
Russia currently stands at about 63,500. There are currently more than 400 restaurant chains operating in
Russia, each of which manages between 3 - 600 outlets. The total number of restaurant chains currently
is about 8,500 outlets. McDonald’s, Subway, Rosinter Restaurant Holding, Arkadiy Novikov
Restaurants, Ginza project, Markon, Shokoladnitsa, and Coffee House are the largest restaurant chains
in different foodservice segments in Russia.
The consumer markets are flourishing in Moscow and St. Petersburg as the incomes of their residents
grow. As a result, Moscow and St. Petersburg are Russia’s largest restaurant cities with market shares of
15 % in Moscow and 5.6 % in St. Petersburg in 2012. This growth comes despite the higher rate of
increase in the cost of food, which increased faster than overall inflation in 2012. After some
consolidation in the industry during the crisis years (2008-2010), in 2011-2012 more and more local as
well as international chains are active in the Russian foodservice market and are planning further
regional expansion into other wealthy cities.
The fast-food sector is the fastest-growing restaurant category in Russia with an annual growth rate of
20 to 30 percent. McDonald’s, which entered Russia in 1990 and created two generations of fast food
eaters has remained the absolute leader with a 43 percent value share of fast-food chain sales. On April
2012 McDonald’s gave one of Russia's largest multi-concept restaurant operators Rosinter Restaurant
Holding subsidiary right to develop chain in Moscow and St. Petersburg transport hubs. Subway, the
world’s largest sandwich chain, is one of the most rapidly developing fast food chains in Russia opened
155 new restaurants in Russia in 2011, twice as many as in 2010. As of March 2013, Subway had 535
outlets in all Russian regions, including the Far Eastern Federal District. In turn, about 210 new outlets
were appeared in the country in 2012. In St. Petersburg, the popularity of the Subway brand is
underscored by the fact that, from May to July 2010, one local Subway restaurant had the highest sales
turnover out of 31,000 Subway restaurants worldwide. Subway has an ambitious plan of expansion and
had caught up to McDonald’s in terms of number of outlets in 2011.
Franchising models dominate in fast food. As of now more than 90 percent of fast food chains in Russia
work under various franchise agreements. Fast-food is an increasingly attractive market for overseas
investors and many famous American fast-service operators have appeared in Russia since 2009. Most
of the international companies which decide to enter consumer foodservice in Russia open their first
outlets in Moscow. Only two foodservice players launched their restaurants from St. Petersburg:
Subway and Carl’s Jr.
Burger King, one of the largest fast food corporations in the world, established a presence in Russia by
opening its first restaurant in Moscow on January 2010. Currently, Burger King’s franchisees operate 54
restaurants in Moscow and in St. Petersburg and intend to open several hundred Burger King outlets in
Russia over the next few years. Dunkin' Donuts, the U.S. doughnut eatery chain that left Russia after a
three-year stint in 1999, returned to Moscow in 2010 with big plans for rapid expansion. The Russian
company Donuts Project received exclusive franchising rights for development of the chain in Russia
and the Ukraine. Dunkin’ Donuts opened its first outlet in May 2010 and currently has seventeen
restaurants in Moscow. Wendy's/Arby's Group, one of the world's leading fast food operators entered
the Russian market in 2011 and will open 180 restaurants there over the next 10 years. The company
currently operates eight outlets in Moscow. Regional expansion through sub franchising will start in mid
2013, when the company will open 20 outlets by franchising.

The coffeehouse business in Russia boomed in the early 2000s. Today, there is an increasingly high
concentration of the leading chains, including Shokoladnitsa, Coffee House, McCafé, Starbucks, and
Coffeeshop Company, in Moscow and St. Petersburg, so in the short term many coffeehouse chains plan
to expand to the Russian provinces. The world leader, Starbucks Coffee Company, opened its first outlet
in Moscow in September 2007 and currently is number three by coffee sales after Shokoladnitsa and
Coffee House. As of March 2013, Starbucks operates 63 coffee shops.
Baskin Robbins, the world's largest chain of ice cream specialty shops, entered Russia in 1990.
Baskin Robbins Production International opened 69 new ice cream salons in Russia in 2011 expanding
its chain 40%. As of January 2013, Baskin-Robbins' network in Russia consists of 253 outlets in 82
cities, most of them franchises.
Many restaurants import the vast majority of their ingredients, creating opportunities for U.S. exporters
of meat, seafood, wine, rice, spirits and specialty foods.
Please see the “HRI Food Service Sector” 2012 report for further information on the HRI sector in
Russia http://gain.fas.usda.gov/Recent%20GAIN%20Publications/Food%20Service%20-
%20Hotel%20Restaurant%20Institutional_Moscow%20ATO_Russian%20Federation_12-28-
2012.pdf
Food Processing Sector
Russia is the largest processed food market in Europe and one of the world's largest importers of
ingredients for food processing, for example Russia is the world’s largest dairy products importer in the
world. According to ID-Marketing the number of food processing plants in Russia in 2012 was around
53,000 (including beverage and tobacco production) and the number has been growing by about 10%
per annum over the last 3-4 years. In 2012, Russian food industry production was valued at 4,062
billion Rubles ($135.4 billion), twofold growth from 2006.The food processing sector is expected to
continue growing in 2012-13, supported by rising disposable incomes, increasing real wages and
declining unemployment. Among the growth leaders are: meat products (including pork, poultry,
sausages and semi-finished meat), dairy products, confectionary, dry baby food and dietary products
with cereal.
Currently, the food processing industry is made up of foreign and domestic manufacturers with the latter
dominating number wise. Among the biggest Russian food manufacturers are: Baltika Brewery
Company, Yug Rusi Group, “United Confectionaries”, “Cherkizovo”, “Efko” Group, RusAgro and
Miratorg. Among the most well-known foreign food manufacturers in Russia are Kraft Foods and
PepsiCo which invested heavily in WimmBill Dann in 2010-2011 These foreign investors are
strengthening their positions with investments and marketing activities that overshadow domestic
companies. That said, many Russian manufacturers are investing in modernization and expansion in
order to strengthen their position in the market. The leaders in this market are focused on consolidation
and expansion into regions outside of Moscow and St. Petersburg.
Demand for higher-quality ingredients is increasing as more local food processors strive to meet
international quality standards. That demand will lead to increased imports given that around 86 percent
of the products used by the Russian food industry are imported. More than a half of the meat and milk

products in big Russian cities are provided by import suppliers. 70 percent of the raw materials in meat
processing plants are imported. And specialized ingredients for bakery, confectionery and juice
manufacturers are also widely imported. The majority of food ingredients are imported from: Denmark,
Belgium, France, Germany, Austria, Great Britain, China, Brazil, India and the United States.
Perhaps in response to this current situation, on April 17, 2012 the Russian Government announced its
Strategy for Food Processing Industry Development. In it, they target public and private sector
investments into the sector at more than 777 billion rubles (USD 24.9 b) for the period of 2013-2020.
The strategy is aimed at modernizing production facilities and increasing their capacity through
innovation and technologies providing more advanced processing. As a result, the sector would be able
to manufacture more competitive products, decrease power consumption and be more environmentally
friendly. The aim is to increase production of flour, grains, bakery products, sugar, dairy products,
butter, cheese and cheese products, fruit and vegetable preserves, oil, confectionary products, fish and
fish preserves. One of the strategy’s targets is to develop infrastructure and logistics for food products
distribution system. This is clearly an ambitious strategy and Post will monitor its development.
The FAS Russia “Food Processing Annual 2013” will be available by the end of April and can be found
at http://gain.fas.usda.gov/Lists/Advanced%20Search/AllItems.aspx
Internet Sales
Even though Russia became the largest internet audience in Europe in 2011, with more than 53 million
users, e-commerce here remains in its infancy. Consumers are highly skeptical of making purchases
online and are uncomfortable with transactions in which they cannot inspect products beforehand. The
logistical challenges of home deliveries remain unsolved. The federal mail system has a poor reputation
for parcel service, and the market for home delivery has been too small for large parcel delivery services
to expand nationwide. These trends are underscored by the fact that Russia's current leader in e-
commerce, OZON.ru, relies primarily on pick-up points rather than home delivery and still conducts 80
percent of its transactions in cash.
One of the obstacles to the faster development of internet retailers is the underdeveloped system of e-
payments. Currently most e-shop operators accept cash on delivery. It is still true that Russian
consumers do not trust e-payments. Only 10 percent of e-shops offer the option to pay by debit/credit
cards. Industry experts explain that e-shop operators prefer to call consumers before the final
confirmation of purchase. The PayPal system of security for e-payments has recently opened a
subsidiary in Russia, but it mainly serves foreign e-shop operators. In Moscow, traffic may also be a
factor limiting internet and delivery sales particularly for perishable items.
Nevertheless, in 2012, growth of internet retailing in Russia remained high and exceeded growth rates
of store-based retailing. According to Euromonitor data, internet sales in Russia grew by 29.5 percent to
reach $10.4 billion in 2012. More than 50 percent of consumers who buy goods online live in Moscow
or St. Petersburg. The average bill is about $300. Experts estimate internet sales turnover will grow by
21 percent in 2013 to reach $12.6 billion.
Russian consumers mainly shop online for non-grocery products. In 2012, online grocery market in
Russia was worth $334 million and accounted 3.2 percent of total internet sales. People are not used to

shopping for groceries online, and they have difficulty using the technology for this purpose. It is still
perceived to be less stress and less time consuming to visit the local supermarket than to shop for
groceries online. However, significant annual growth in internet sales in recent years shows that online
grocery retailing has great potential.
Table 12. Internet Sales in Russia in 2008-2012, $US Million
Category 2008 2009 2010 2011 2012
Growth,
%
2011/2012
Internet Retailing 5,262 4,960 6,640 9,125 10,421 14.2
Food and Drink Internet Retailing 133 137 172 258 334 29.5
Source: Euromonitor International from trade sources and national statistics, 2013
Figure 13. Internet Sales in Russia in 2008-2012, Growth Year-on-Year, %
Source: Euromonitor International from trade sources and national statistics, 2013
The internet sites developed by store-based retailers are increasingly important, as the current
environment favors well-established chains such as X5 Retail Group, with an established physical
presence in major cities and across the regions, which removes some issues related to storage and
transportation. The X5 chain launched its E5 project, offering a wide online range of non-grocery
products, including books, electronics and home care products, among others. Consumers are able to
collect products through Perekriostok outlets which are a particularly attractive option to Russian
consumers unwilling to pay online, although courier delivery and post office collection are also offered
as options. (Source: Euromonitor)
In March 2012, Utkonos, one of the largest online grocery retailers in Russia, started selling grocery
goods using the online retail platform Wikimart, which is supposed to grow Utkonos' turnover by 3-5
percent, according to the Company’s management. In 2011, Utkonos’ online sales reached
approximately $300 million. Currently, the Company handles about 10,000 orders per day.
Tourism Sales
The upcoming 2014 Winter Olympic Games (February 7-23, 2014) and Paralympic Games (March 7-
16, 2014) in the resort town of Sochi are expected to boost tourism in Russia. Hotels, restaurants and
catering are all ramping up in order to serve the influx of visitors. According to Sochi Olympic
Committee plans, 62 restaurants, 40 cafes, and 27 fast food outlets will operate during the Olympic
Games. These could provide opportunities for foreign firms and investors. In December 2012, the
Russian Government set a maximum cost per room per night for the Olympic Games time period and
events that precede them. The maximum cost per night in 5* hotels will be 13,896 Rubles
(approximately $448), in 4* hotels will be 13,048 Rubles (approximately $420), in 3* it will be 9,003
Rubles ($290), in 2*, 1* or mini-hotels the maximum rate will be 5,741 Rubles ($185). A total of 47
transport infrastructure construction and modernization projects are underway and there are also
plentiful opportunities in terms of telecom, energy and environmental protection services. Two years
ago the Russian government renovated the Sochi airport, increasing capacity to serve 1,300 to 2,500
passengers per hour. The $14 billion investment package in Sochi and the determination of the
government to make the Olympics a domestic and international success make Sochi an attractive
proposition although information on how to become a supplier of food and beverages to the Olympic
Games is still unclear at this stage.
Currently, the tourist sector in Russia is relatively underdeveloped with the possible exception of the
city of St. Petersburg. Therefore, Russia has unique opportunities both for the development of internal
tourism and for reception of foreign travelers. A variety of landscapes (mountains, sea, rivers, woods,
tundra) allows developing different kinds of tourism, e.g. beach vacation, ski vacation, etc. Vladimir
Putin announced in 2011 that the Russian Government would launch a new federal program
“Development of domestic tourism in Russia”. 7 billion rubles ($US 233 million) were allocated from
the federal budget in order to enhance tourism in Russia (source: Rossiyskaya Gazeta).
Already the hotel market, which has been underserved in Russia, is growing. Growth in the tourist
sector will spur further development of Russia’s hotels and restaurants which, in turn, will lead to a
better quality services and offer new opportunities for the exporters of food products to Russia.
In addition to the Olympics events, in 2013, the World University Summer Games (a.k.a.
“Universiade”) will be held in the city of Kazan (population 1.2 million). And a bit further afield,
Russia will host the 2018 Football World Cup. Matches are to be held in 11 cities including: Moscow,
St. Petersburg, Kaliningrad, Kazan, Yaroslavl, Nizhny Novgorod, Samara, Saransk, Rostov-on-Don,
Volgograd, and Sochi.
Holiday Gifts Sales
While the Russian economy including the food sector appears to be growing, consumer confidence still
has a bit of catching up to do particularly with respect to year-end holiday spending. According to a
Deloitte 2012 survey, the average amount of money Russians allocated for their festive budget included
spending on food, gifts and entertainment of about $583, about 11 percent more than in 2011 but still
below the pre-crisis spending average of $700 (2008).
Consumers in Russia usually start to think of their gift shopping near to the middle of December and

buy gifts, for the most part, during the last week before the holiday season. Russians tend to buy
presents primarily in hypermarkets, with second place given to specialized shops, and the third place
given priority being open-air-markets. Russian consumers continue to ignore the Internet as one of the
major trading channels for buying gifts, especially during the pre-holiday period. According to Deloitte
survey, the main reason is that Russians desire to see a product in person, to hold it in their hands and
not just to look at a picture of it on a website.
SECTION IV. BEST PRODUCT PROSPECTS
The U.S. is the fifth largest supplier to Russia by value of agricultural, fish and forestry products. Based
on official data, the U.S. share of Russia’s agricultural imports exceeded $2 billion in 2012. This is 26
percent growth compared to 2011. The U.S. share of Russia’s total agricultural imports in 2012 was 5.2,
on par with 2011. Top performing retail-oriented U.S. exports to Russia in 2012 included red meats and
poultry, tree nuts, fresh and processed fruit and vegetables, snack foods, pet food, wine and beer, and
fish and seafood.
In 2012, U.S. poultry exports accounted for roughly $330 million (about 265,000 metric tons), followed
by pork --$293 million (nearly 88 million tons), and beef --$237 million (approximately 46 million
tons). Following WTO Accession, Russia is expected to remain an attractive market for poultry imports
for the next several years, particularly for affordable frozen chicken leg quarters that do not compete
against domestically-produced chilled whole birds. Russia is the second largest importer of beef and
veal products (including offal) in the world, and the 5th largest importer of pork products. Russia
demonstrated significant growth as an importing meat market in 2012, compared to recent years. In
2012, Russian beef, pork, and poultry imports exceeded 2011 levels by 15, 13, and 19 percent,
respectively, by value, and three, nine, and 17 percent, respectively, by volume.
Russia’s accession to the World Trade Organization (WTO) has helped to bring some of the country’s
legal and regulatory regimes closer in line with internationally accepted practices. Also, while Russia’s
stated goal to be self-sufficient in categories such as meat and dairy products may, to some extent, limit
U.S. exports of those products, these goals may also create new opportunities for U.S. exporters to
supply high protein feeds and animal genetics. For example, the United States was the largest exporter
of live bovine animals to Russia in 2012. U.S. exports grew from $85 million (19,092 head) in 2011 to
$289 million (74,734 head) in 2012.
U.S. fish and seafood exports to Russia were down by 20 percent in 2012 and totaled $48 million. That
was due to lower than average salmon catch in the United States and salmon roe being the significant
export product from the United States to Russia (between 30-40 percent of all U.S. fish and seafood
exports to Russia). However, lower exports of those products were partially compensated by increasing
shipments of frozen scallops, lobsters and crabs as a result of growing demand from the Russian HRI
sector. Because of this growing market, U.S. fish and seafood producers will continue to be able to find
new market opportunities in Russia as consumer income rises, demand continues to boom, and
consumer habits continue to change. For more information please see Gain report:
http://gain.fas.usda.gov/Recent%20GAIN%20Publications/Fish%20and%20Seafood%20
Production%20and%20Trade%20Update_Moscow_Russian%20Federation_7-24-2012.pdf
The market for commercial pet food has strong growth potential. The growth is related to a greater
demand for specific types of pet food. Currently products include both wet and dry food, economic and
premium products, and products that meet very specific needs related to the age (for young, adult and
older animals), lifestyle (high-energy or light diets), and health condition (for diets that prevent allergies
or address certain diseases) of pets. U.S export of pet food to Russia was up more than double in 2012
and reached $6 million. The increase is a result of renewed economic growth, higher household
incomes, an increase in the number of pets within Russian families and higher demand for new flavors
and premium products.
In 2012, overall Russian nut imports totaled at 88,597 tons, valued $425 million. The growth in nut
consumption is driven by the growing popularity of healthy snacks in Russia and increasing use of nut
ingredients in food processing. In 2012, the United States exported 22,263 tons of tree nuts to Russia,
valued at $125 million, a twofold increase in volume and value since 2008. The main driver of this
growth was the increase in California almond exports. California pistachio sales have been growing
since 2010, but volumes fluctuate based on price competitiveness particularly with Iranian pistachios.
Almonds shelled and in shell, shelled hazelnuts and shelled cashews enjoy zero tariffs; the customs
tariff for other raw nuts is 5 percent. For more information on Russian nuts market please see Gain
report RSATO1108:
http://gain.fas.usda.gov/Recent%20GAIN%20Publications/Russia%20Going%20Nuts
%20Over%20Almonds_St.%20Petersburg_Russian%20Federation_4-20-2011.pdf).
Russia is the world’s second largest importer of fruit, and ranks as the number one market for pears. In
2012, overall Russian imports of fresh fruits totaled at 5.8 million tons valued $5.5 billion. In 2012,
Russia imported 15,945 metric tons (MT) of U.S. fruit worth $23 million. In 2011, Russia was the third
largest export market for Northwest Pears. Pears, apples, California table grapes and pomegranates. For
more information on the Russian fruit market please see Gain report:
http://gain.fas.usda.gov/Recent%20GAIN%20Publications
/Fresh%20Deciduous%20Fruit%20Annual_Moscow%20ATO_Russian%20Federation_
12-17-2012.pdf
The most dynamic growth in the high-valued sector compared to 2011 was shown by such categories of
U.S. products as popcorn (both raw and microwave), soy sauce, peanut butter, frozen pastry, mixed
seasonings, spices, tomato sauces, prunes, wine and beer, nonalcoholic beverages (excluding fruit and
vegetable juices), fresh apricots, peaches and nectarines. To get more information on market
opportunities for the U.S. products please see the report:
http://gain.fas.usda.gov/Recent%20GAIN%20Publications/Market%20Opportunities%20
for%20Key%20U.S.%20Products%20in%20Russia_Moscow_Russian%20Federation
_3-20-2012.pdf
Table 13 (below) provides additional information on food and agricultural product prospects /1
.
Table 13. Russia: Suggested Best Prospects for U.S. Exporters, by Sector, 2012
Product
2012
US
Import
($ US
mln.)
Average
Growth
of
Import
over the
Last 5
Import Taxes Key Constraints to
Market
Development
Attractiveness of the
Market for the USA

Years, % Poultry 338 -16 See GAIN
Poultry and
Products reports.
Tariff-rate quotas
apply to some
items. Tariffs
change
unpredictably.
Competition with
Brazilian and EU
producers; Quick
growth of domestic
production;
Perception of U.S.
product as cheap and
of low quality.
Veterinary controls
and demands do not
follow international
standards. Official
goal of “food
security” calls for
reduction of meat
imports.
U.S. product has well-
established position;
Low prices attract
buyers. Local
producers will not be
able to satisfy demand
in near future.
Pork 293 -3 See GAIN
Livestock and
Products reports.
Tariff-rate quotas
apply to some
items. Tariffs
change
unpredictably.
Competition from
Brazilian pork,
complicated import
procedures.
Veterinary controls
and demands do not
follow international
standards. Official
goal of “food
security” calls for
reduction of meat
imports.
Shortage of pork in
the country; declining
production; high
prices; Demand for
stable deliveries of
both cheap and high
quality product. New
health certificates are
in place for U.S.
origin pork.
Live Cattle 289 7612 0% Competition from
Australian and
European cattle
suppliers (the latter
being true if Russia
eliminates ongoing
trade restrictions
with the EU)
Russia needs more
highly productive
cattle to reach its
publicly stated food
security goals which
call for a reduction of
imported meat and
dairy products.
2 Average growth of imports over the last four years because the United States did not begin shipping until 2008.
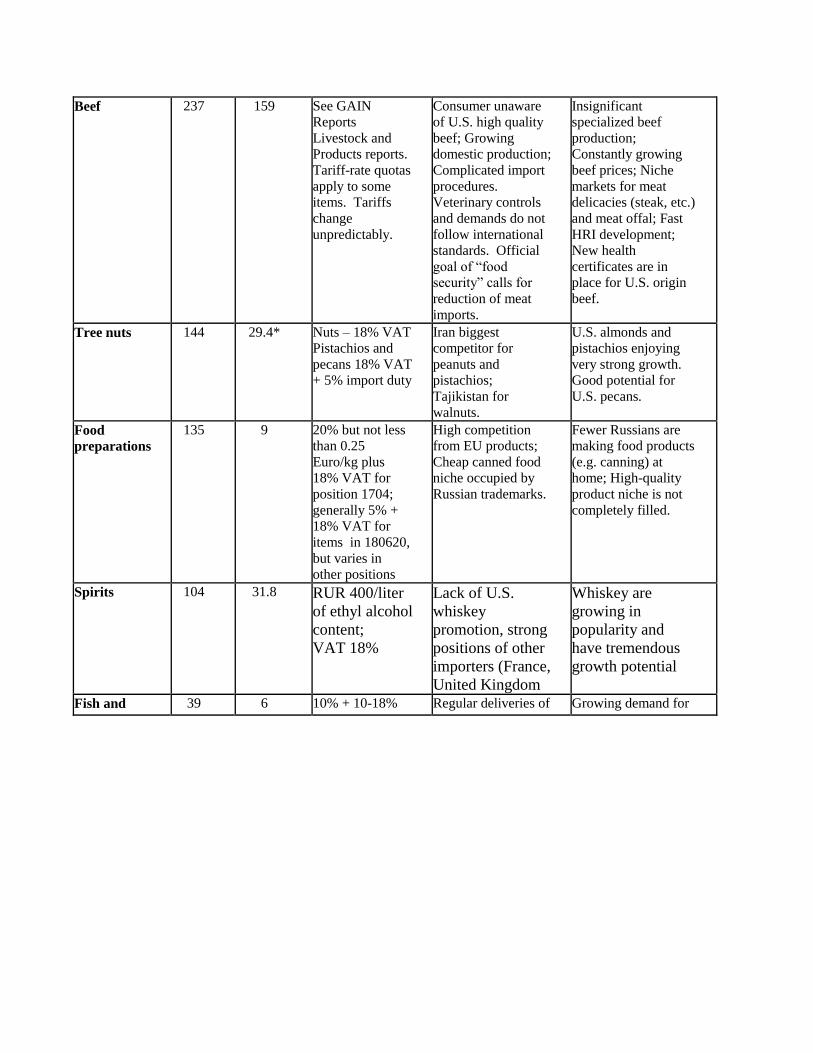
Beef 237 159 See GAIN
Reports
Livestock and
Products reports.
Tariff-rate quotas
apply to some
items. Tariffs
change
unpredictably.
Consumer unaware
of U.S. high quality
beef; Growing
domestic production;
Complicated import
procedures.
Veterinary controls
and demands do not
follow international
standards. Official
goal of “food
security” calls for
reduction of meat
imports.
Insignificant
specialized beef
production;
Constantly growing
beef prices; Niche
markets for meat
delicacies (steak, etc.)
and meat offal; Fast
HRI development;
New health
certificates are in
place for U.S. origin
beef.
Tree nuts 144 29.4* Nuts – 18% VAT
Pistachios and
pecans 18% VAT
+ 5% import duty
Iran biggest
competitor for
peanuts and
pistachios;
Tajikistan for
walnuts.
U.S. almonds and
pistachios enjoying
very strong growth.
Good potential for
U.S. pecans.
Food
preparations
135 9 20% but not less
than 0.25
Euro/kg plus
18% VAT for
position 1704;
generally 5% +
18% VAT for
items in 180620,
but varies in
other positions
High competition
from EU products;
Cheap canned food
niche occupied by
Russian trademarks.
Fewer Russians are
making food products
(e.g. canning) at
home; High-quality
product niche is not
completely filled.
Spirits 104 31.8 RUR 400/liter
of ethyl alcohol
content;
VAT 18%
Lack of U.S.
whiskey
promotion, strong
positions of other
importers (France,
United Kingdom
Whiskey are
growing in
popularity and
have tremendous
growth potential
Fish and 39 6 10% + 10-18% Regular deliveries of Growing demand for
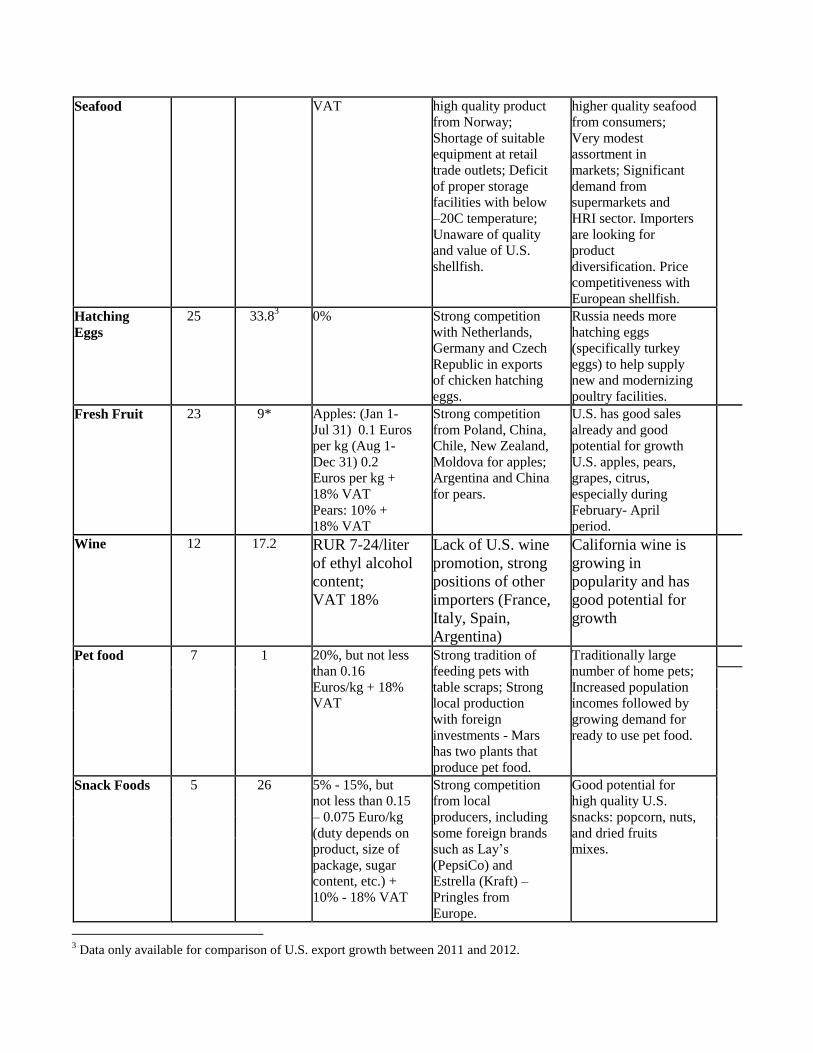
Seafood VAT high quality product
from Norway;
Shortage of suitable
equipment at retail
trade outlets; Deficit
of proper storage
facilities with below
–20C temperature;
Unaware of quality
and value of U.S.
shellfish.
higher quality seafood
from consumers;
Very modest
assortment in
markets; Significant
demand from
supermarkets and
HRI sector. Importers
are looking for
product
diversification. Price
competitiveness with
European shellfish.
Hatching
Eggs
25 33.83 0% Strong competition
with Netherlands,
Germany and Czech
Republic in exports
of chicken hatching
eggs.
Russia needs more
hatching eggs
(specifically turkey
eggs) to help supply
new and modernizing
poultry facilities.
Fresh Fruit 23 9* Apples: (Jan 1-
Jul 31) 0.1 Euros
per kg (Aug 1-
Dec 31) 0.2
Euros per kg +
18% VAT
Pears: 10% +
18% VAT
Strong competition
from Poland, China,
Chile, New Zealand,
Moldova for apples;
Argentina and China
for pears.
U.S. has good sales
already and good
potential for growth
U.S. apples, pears,
grapes, citrus,
especially during
February- April
period.
Wine 12 17.2 RUR 7-24/liter
of ethyl alcohol
content;
VAT 18%
Lack of U.S. wine
promotion, strong
positions of other
importers (France,
Italy, Spain,
Argentina)
California wine is
growing in
popularity and has
good potential for
growth
Pet food 7 1 20%, but not less
than 0.16
Euros/kg + 18%
VAT
Strong tradition of
feeding pets with
table scraps; Strong
local production
with foreign
investments - Mars
has two plants that
produce pet food.
Traditionally large
number of home pets;
Increased population
incomes followed by
growing demand for
ready to use pet food.
Snack Foods 5 26 5% - 15%, but
not less than 0.15
– 0.075 Euro/kg
(duty depends on
product, size of
package, sugar
content, etc.) +
10% - 18% VAT
Strong competition
from local
producers, including
some foreign brands
such as Lay’s
(PepsiCo) and
Estrella (Kraft) –
Pringles from
Europe.
Good potential for
high quality U.S.
snacks: popcorn, nuts,
and dried fruits
mixes.
3 Data only available for comparison of U.S. export growth between 2011 and 2012.
Source: Global Trade Atlas, U.S. Trade Database, Russian Tariff Database
* U.S. Export Data (Global Trade Atlas) 1/
Food products listed in Table 13 are based on market intelligence, including discussions with retailers
and data analysis efforts, and should not be considered an official endorsement by the United States
Department of Agriculture or any affiliated agencies.
SECTION V. KEY CONTACTS AND FURTHER INFORMATION
Contact Information for FAS Offices in Russia and in the United States U.S. Agricultural Trade Office Headquarters, Moscow
Email: [email protected]
Deanna Ayala, Director
E-mail: [email protected]
Alla Putiy, Marketing Specialist
E-mail: [email protected]
Olga Kolchevnikova, Marketing Specialist
E-mail: [email protected]
Tatyana Kashtanova, Administrative Assistant
E-mail: [email protected]
Street address (for express parcels):
U.S. Agricultural Trade Office
American Embassy
Bolshoy Devyatinskiy pereulok, 8
121099 Moscow, Russia
Fax: 7 (495) 728-5069
Tel: 7 (495) 728-5560
http://eng.usda.ru
For mail coming from the U.S. (delivery may take 2 to 4 weeks):
Director, Agricultural Trade Office
5430 Moscow Place, Box 355
Washington, DC 20521-5430
Covering Northwest Russia (St. Petersburg):

Svetlana Ilyina, ATO Marketing Specialist
American Consulate General
Furshtatskaya Street 15
191028, St. Petersburg, Russia
Fax: 7 (812) 331-2675
Tel: 7 (812) 331-2880
E-mail: [email protected]
Covering the Russian Far East (Vladivostok):
Irina Konstantinova, ATO Marketing Specialist
American Consulate General
Pushkinskaya street, 32
690001 Vladivostok, Russia
Fax: 7 (4232) 300-089
Tel: 7 (4232) 300-089
E-mail: [email protected]
For General Information on FAS/USDA Market Promotion Programs and Activities:
Office of Trade Programs
U.S. Department of Agriculture
Foreign Agricultural Service
1400 Independence Ave., S.W.
Washington, DC 20250
http://www.fas.usda.gov/OTP_contacts.asp
FAS Website: www.fas.usda.gov
For Trade Policy/Market Access Issues, General Information on the Russian Agricultural Sector, etc:
Holly Higgins , Agricultural Minister-Counselor
Levin Flake, Senior Agricultural Attaché
Christopher Riker, Agricultural Attaché
Office of Agricultural Affairs
American Embassy
5430 Moscow Place
Dulles, VA 20189
Fax: 7 (495) 728-5133 or 728 5102
Tel: 7 (495) 728-5222
E-mail: [email protected]
Other Useful Contacts
The Agricultural Trade office works with a large number of U.S. industry organizations, several of
which are resident in Russia. These cooperators share the view that Russia is a promising market for
food products.
Alaska Seafood Marketing Institute
Andrew Brown
Pound House
Pound Lane Godalming
Surrey GU7 1BX, UK
Tel: +44-1483-41-6136
Fax: +44-1483-42-6662
E-mail: [email protected]
Almond Board of California
RK Marketing Office,
29/1 Generala Tyuleneva Str., 117465, Moscow, Russia
Tel: 7 (495) 729-3080
Fax: 7 (495) 989-2670
E-mail: [email protected]
http://www.Almonds.ru
California Prune Board
Mark Dorman
Suite 18, Harborough Innovation Centre
Airfield Business Par, Leicester Road
Market Harborough, Leicestershire
LE16 7QX
UK
Tel: +44 (0) 1858 414218
Fax: +44 (0) 1858 469333
E-mail: [email protected]
California Table Grape Commission
Ksenia Gorovaya (St. Petersburg)
Address: 194223, St. Petersburg, Russia, Orbeli str., 25/3, office 7
Tel: 7 (921) 637-4199
E-mail: [email protected]
http://crispconsulting.ru/
Katerina Akulenko (Vladivostok)
Address: 690090 Vladivostok, Russia, Svetlanskaya str., 37, Office 2

Fax: 7 (4232) 63-8411
Tel.: 7 (4232) 56-5536
E-mail: [email protected]
Pear Bureau Northwest
Katerina Akulenko
Address: 690090 Vladivostok, Russia, Svetlanskaya str., 37, Office 2
Fax: 7 (4232) 63-8411
Tel.: 7 (4232) 56-5536
E-mail: [email protected]
http://www.usapears.ru
Ksenia Gorovaya (St. Petersburg)
Address: 194223, St. Petersburg, Russia, Orbeli str., 25/3, office 7
Tel: +7 (921) 637-4199
E-mail: [email protected]
http://crispconsulting.ru/
USA Poultry and Egg Export Council (USAPEEC)
Albert Davleev
Address: 123592 Moscow, Russia, Kulakova str., 20, Building 1A
Tel: 7 (495) 781-9200
Fax.: 7 (495) 781-9201
E-mail: [email protected], [email protected]
http://www.usapeec.ru
U.S. Meat Export Federation (USMEF)
Galina Kochubeyeva (Moscow)
Address: 119049 Moscow, Russia, Leninsky Prospekt, 2, 9th Floor, Business Center
Fax: 7 (495) 230-6849
Tel.: 7 (495) 544-9387
E-mail: [email protected], [email protected]
Yuriy Barutkin (St. Petersburg)
Address: 190031 St. Petersburg, Russia, Yefimova str., 4a, office 303
Fax: 7 (812) 309-71102
Tel.: 7 (812) 309-1101
E-mail: [email protected]
Washington Apple Commission
Ksenia Gorovaya (St. Petersburg)
Address: 194223, St. Petersburg, Russia, Orbeli str., 25/3, office 7
Tel: 7 (921) 637-4199
E-mail: [email protected]
www.bestapples.ru
Katerina Akulenko (Vladivostok)
Address: 690090 Vladivostok, Russia, Svetlanskaya str., 37, Office 2
Fax: 7 (4232) 63-8411
Tel.: 7 (4232) 56-5536
E-mail: [email protected]
Wine Institute of California
Olga Tuzmukhamedova
Address: 127521 Moscow, Russia, Staromarinskoe shosse, 14-77
Tel: +7 926-389-5745
E-mail: [email protected]
http://www.discovercaliforniawines.com/
The American Chamber of Commerce is another good source for information on doing business in
Russia. The Chamber has offices in Moscow and St. Petersburg.
American Chamber of Commerce in Russia (AmCham)
Ul. Dolgorukovskaya, Building 7, 14th floor
127006 Moscow, Russia
Fax: 7 (495) 961-2142
Tel: 7 (495) 961-2141
Email: [email protected]
http://amcham.ru/
American Chamber of Commerce in St. Petersburg
Ulitsa Yakubovicha 24, left wing, 3rd
Floor
190000 St. Petersburg, Russia
Fax: 7 (812) 448-1645
Tel: 7 (812) 448-1646
Email: [email protected]
http://amcham.ru/spb/
The U.S Commercial Service has offices in Moscow, St. Petersburg, and Vladivostok. For questions
regarding agricultural machinery, food processing and packaging equipment or materials, refrigeration
equipment, and other industrial products, please contact:
U.S. Commercial Service
Bolshoy Devyatinskiy pereulok, 8
121099 Moscow, Russia
Fax: 7 (495) 728-5585
Tel: 7 (495) 728-5580
E-mail: [email protected]
http://export.gov/russia/
The U.S. Commercial Service office at the U.S. Embassy in Moscow assists American exporters by
identifying potential partners through the Gold Key Matching Service. The program features:
appointments (typically four per day) with prescreened Russian firms; background and contact information on each potential partner, such as: the size of the company;
number of years in business; product or service lines; and capability to provide after-sales
service; customized market briefing with U.S. Commercial Service staff; and, available market research on the relevant industry sector.
The World Bank and the U.S. Agency for International Development also maintain missions in Russia.

APPENDIX – STATISTICS
TABLE A. KEY TRADE & DEMOGRAPHIC INFORMATION, 2012
Agricultural Imports From All Countries ($Mln) / U.S. Market Share (%) 1/ 35,053/5.6
Consumer Food Imports From All Countries ($Mln) / U.S. Market Share (%) 2/ 25,843/5.2
Edible Fishery Imports From All Countries ($Mln) / U.S. Market Share (%) 3/ 2,554/1.5
Total Population (Millions) / Annual Growth Rate (%) 143.2/+0.2 Urban Population (Millions) / Annual Growth Rate (%) 106/+0.2 Number of Major Metropolitan Areas
4/ 12
Size of the Middle Class (Millions) / Growth Rate (%) 5/ 48/2.8
Per Capita Gross Domestic Product (U.S. Dollars) 16,700
Unemployment Rate (%) 6.6 Per Capita Food Expenditures (U.S. Dollars) 6,447 Percent of Female Population Employed
6/ 93 Exchange Rate (US$1 = RUR), 2012
7/ 31.07 1/
Source: 2012, Global Trade Atlas (Agricultural Total, Group 2) 1/2/
Source: 2012, Global Trade Atlas 2/ 3/
Source: 2012, Global Trade Atlas
3/ 4/ Population in excess of 1,000,000
4/ 5/
Sources: Various - based on estimate of individuals earning US$500-$1,150 per month 5/
6/
Source: 2012 Rosstat data. As percentage of economically-active female population (employed or
actively seeking employment). Female workers account for 49.1 percent of the total economically-active
population 7/
See Figure 1. Russia’s Central Bank exchange rate of $1 USD to Ruble in 2012
TABLE B. CONSUMER FOOD & EDIBLE FISHERY PRODUCT IMPORTS, CY 10-12
Imports from Imports from
U.S Market Share the World the U.S.
(Million Dollars) (Million Dollars) (Percent)
2010 2011 2012 2010 2011 2012 2010 2011 2012
CONSUMER-ORIENTED
AG, Total 21,719 25,325 25,843 1,011 1,143 1,355 4.7 4.5 5.2
Snack Foods (Excl. Nuts) 910 1,165 1,192 3.3 4.9 5.1 0.4 0.4 0.4
Breakfast Cereals & Pancake
Mix 21 25 25 0.9 1.4 0.9 0.5 0.6 0.4
Red Meats,
Fresh/Chilled/Frozen 4,615 5,090 5,820 334 413 592 7.2 8.1 10.2
Red Meats, Prepared/Preserved 157 271 255 3.4 4.9 6.2 2.2 1.8 2.4
Poultry Meat 863 572 707 331 307 338 38.4 53.7 47.9
Dairy Products (Excl. Cheese) 659 618 573 20.6 0.06 0.09 3.1 0.01 0.02

Eggs & Products (Excl. Cheese) 116 153 176 9.8 21.6 25.3 8.5 14.1 14.4
Fresh Fruit 4,572 5,462 5,527 29.3 32.1 22.8 0.6 0.6 0.4
Fresh Vegetables 2,025 2,858 2,260 1.3 1.9 1.5 0.06 0.07 0.07
Processed Fruit & Vegetables 1,457 1,621 1,417 24.9 27.4 18.8 1.7 1.7 1.3
Fruit & Vegetables Juices 364 441 485 6.3 4.6 4.2 1.7 1.1 0.9
Tree Nuts 335 391 425 82.6 113 144 24.7 29 34
Wine & Beer 1,075 1,265 1,384 7.4 9.7 12.3 0.7 0.8 0.9
Pet Foods (Dog & Cat Food) 139 196 219 4.6 8.7 6.8 3.3 4.4 3.1
Other Consumer Oriented
Products 2,352 2,786 2,921 146.7 190.1 172.8 6.2 6.8 5.9
FISH & SEAFOOD
PRODUCTS TOTAL 2,150 2,564 2,554 51.6 60.4 39,2 2.4 2.4 1.5
Salmon 524 604 704 1.5 0.3 0.2 0.3 0.1 0.01
Molluscs 60 88 90 4.4 4.1 3.5 7.4 4.7 3.9
Crustaceans 253 325 302 0.4 0.5 1.2 0.2 0.1 0.4
Other Fishery Products 1,082 1,304 1,270 32.3 37.8 25.7 3 2.9 2
AGRICULTURAL
PRODUCTS TOTAL 30,599 36,301 35,053 1,278 1,510 1,963 4.2 4.2 5.6
AG, FISH AND FORESTRY
TOTAL 33,727 40,271 39,199 1,347 1,608 2,023 4 4 5.2
Source: Global Trade Atlas
TABLE C. TOP 15 SUPPLIERS OF CONSUMER FOODS & EDIBLE FISHERY PRODUCTS
CONSUMER-ORIENTED AG TOTAL
№ Country Million United States Dollars
2010 2011 2012
1 Brazil 2,150 1,698 1,845
2 Ukraine 1,415 1,613 1,778
3 Germany 1,633 1,882 1,613
4 Netherlands 1,185 1,403 1,356
5 Turkey 1,336 1,408 1,355
6 United States 1,010 1,143 1,355
7 Spain 785 1,135 1,235
8 Poland 923 932 1,205
9 Ecuador 878 1,189 1,160
10 Italy 796 1,088 1,089
11 China 857 1,089 1,023
12 France 781 893 874
13 Canada 232 402 622
14 Paraguay 227 196 568
15 Argentina 509 526 521
World 21,719 25,325 25,843
Source: Global Trade Atlas
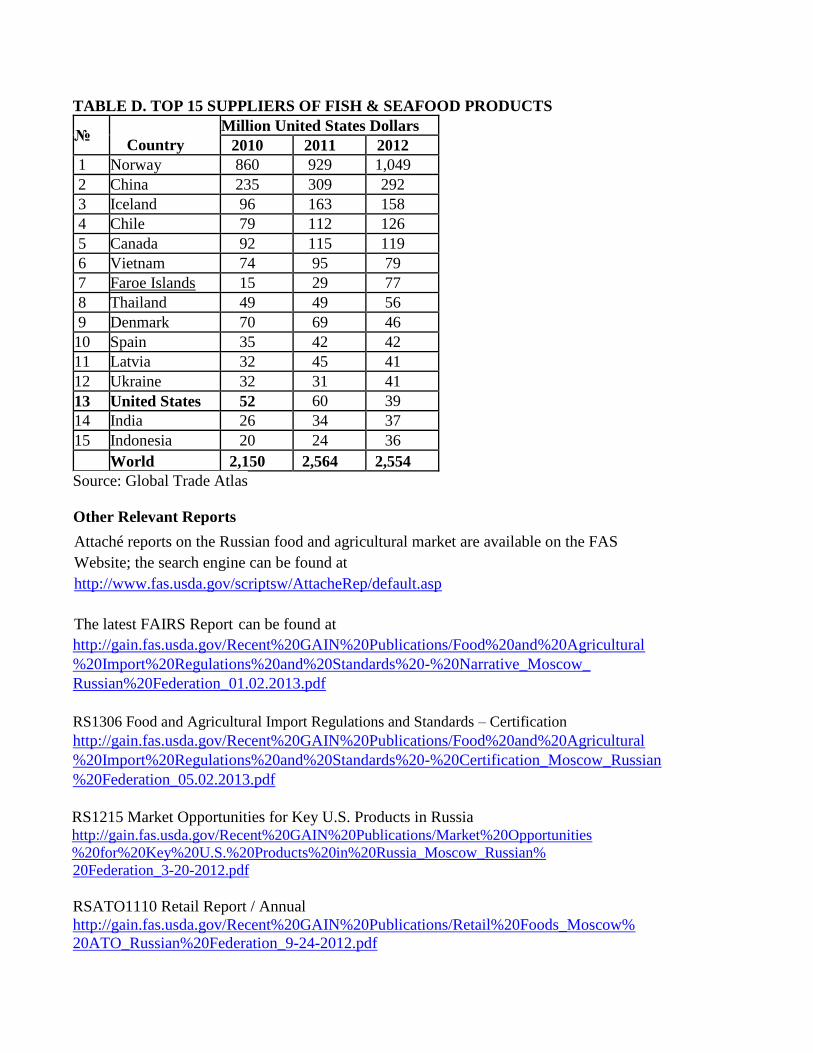
TABLE D. TOP 15 SUPPLIERS OF FISH & SEAFOOD PRODUCTS
№
Country Million United States Dollars
2010 2011 2012 1 Norway 860 929 1,049
2 China 235 309 292
3 Iceland 96 163 158
4 Chile 79 112 126
5 Canada 92 115 119
6 Vietnam 74 95 79
7 Faroe Islands 15 29 77
8 Thailand 49 49 56
9 Denmark 70 69 46
10 Spain 35 42 42
11 Latvia 32 45 41
12 Ukraine 32 31 41
13 United States 52 60 39
14 India 26 34 37
15 Indonesia 20 24 36
World 2,150 2,564 2,554 Source: Global Trade Atlas
Other Relevant Reports
Attaché reports on the Russian food and agricultural market are available on the FAS
Website; the search engine can be found at
http://www.fas.usda.gov/scriptsw/AttacheRep/default.asp
The latest FAIRS Report can be found at
http://gain.fas.usda.gov/Recent%20GAIN%20Publications/Food%20and%20Agricultural
%20Import%20Regulations%20and%20Standards%20-%20Narrative_Moscow_
Russian%20Federation_01.02.2013.pdf
RS1306 Food and Agricultural Import Regulations and Standards – Certification
http://gain.fas.usda.gov/Recent%20GAIN%20Publications/Food%20and%20Agricultural
%20Import%20Regulations%20and%20Standards%20-%20Certification_Moscow_Russian
%20Federation_05.02.2013.pdf
RS1215 Market Opportunities for Key U.S. Products in Russia http://gain.fas.usda.gov/Recent%20GAIN%20Publications/Market%20Opportunities
%20for%20Key%20U.S.%20Products%20in%20Russia_Moscow_Russian%
20Federation_3-20-2012.pdf
RSATO1110 Retail Report / Annual
http://gain.fas.usda.gov/Recent%20GAIN%20Publications/Retail%20Foods_Moscow%
20ATO_Russian%20Federation_9-24-2012.pdf

RSATO1002 Trade Law Report
http://gain.fas.usda.gov/Recent%20GAIN%20Publications/The%20Russian%20Federal%
20Law%20on%20Trade%20_Moscow%20ATO_Russian%20Federation_8-30-2010.pdf
RSATO1107 Russian Food Processing Sector
http://gain.fas.usda.gov/Recent%20GAIN%20Publications/Food%20Processing
%20Ingredients_Moscow%20ATO_Russian%20Federation_12-21-2010.pdf
RSATO1102 Russian HRI Sector
http://gain.fas.usda.gov/Recent%20GAIN%20Publications/Food%20Service%20-
%20Hotel%20Restaurant%20Institutional_Moscow%20ATO_Russian%20Federation_
12-28-2012.pdf
RSATO1002 Fresh Deciduous Fruit / Annual
http://gain.fas.usda.gov/Recent%20GAIN%20Publications/Fresh%20Deciduous%20Fruit
%20Annual_Moscow%20ATO_Russian%20Federation_12-17-2012.pdf
RSATO1109 Russian Organic Market
http://gain.fas.usda.gov/Recent%20GAIN%20Publications/Russian%20Organic%20
Market%20Continues%20to%20Grow_Moscow%20ATO_Russian%20Federation
_2-15-2013.pdf
RSATO1301 Development of a National Standard for Organic Products in Russia
http://gain.fas.usda.gov/Recent%20GAIN%20Publications/Development%20of%20a%20
National%20Standard%20for%20Organic%20Products%20in%20Russia_Moscow%20ATO
_Russian%20Federation_2-8-2013.pdf
RSATO1010 Russian Alcohol Market Regulation 2008-2010 Update
http://gain.fas.usda.gov/Recent%20GAIN%20Publications/Russian%20Alcohol%20
Market%20Regulation%202008-2010%20Update_Moscow%20ATO_Russian%20
Federation_11-22-2010.pdf
RSATO1208 Customs Union Technical Regulations on Food Products Labeling
http://gain.fas.usda.gov/Recent%20GAIN%20Publications/Customs%20Union%20
Technical%20Regulations%20on%20Food%20Products%20Labeling_Moscow%20
ATO_Russian%20Federation_7-18-2012.pdf
RSATO1205 Russian Duma Revises Wine Definitions and Other Alcohol Rules
http://gain.fas.usda.gov/Recent%20GAIN%20Publications/Russian%20Duma%20
Revises%20Wine%20Definitions%20and%20Other%20Alcohol%20Rules_Moscow
%20ATO_Russian%20Federation_7-13-2012.pdf
RSATO 1205 Strategy of the Russian Food Industry Development until 2020
http://gain.fas.usda.gov/Recent%20GAIN%20Publications/Strategy%20of%20the%
20Russian%20Food%20Industry%20Development%20until%202020_Vladivostok

_Russian%20Federation_6-7-2012.pdf
RS 1247 Fish and Seafood Trade Update
http://gain.fas.usda.gov/Recent%20GAIN%20Publications/Fish%20and%20Seafood%
20Production%20and%20Trade%20Update_Moscow_Russian%20Federation_
7-24-2012.pdf
RS 1139 Poultry and Products Annual
http://gain.fas.usda.gov/Recent%20GAIN%20Publications/Dairy%20and%20Products%
20Annual_Moscow_Russian%20Federation_11-6-2012.pdf
RS 1144 Livestock and Products Annual
http://gain.fas.usda.gov/Recent%20GAIN%20Publications/Livestock%20and%20Products
%20Annual_Moscow_Russian%20Federation_9-5-2012.pdf
RS 1146 Dairy and Products Annual
http://gain.fas.usda.gov/Recent%20GAIN%20Publications/Dairy%20and%20Products%
20Annual_Moscow_Russian%20Federation_11-6-2012.pdf
RS 1015 Declaration of Conformity Replaces Certification for Many Products
http://gain.fas.usda.gov/Recent%20GAIN%20Publications/Declaration%20of%20Confor
mity%20Replaces%20Certification%20for%20Many%20Products_Moscow_Russian%2
0Federation_3-22-2010.pdf
RS1117 Pet Food Market Brief
http://gain.fas.usda.gov/Recent%20GAIN%20Publications/Pet%20Food%20Market%20Brief_
Moscow_Russian%20Federation_4-21-2011.pdf