rural development and migration commission, uttarakhand
TRANSCRIPT

1
RURAL DEVELOPMENT AND MIGRATION
COMMISSION,
UTTARAKHAND, PAURI GARHWAL
ANALYSIS OF SCHEMES AND PROGRAMMES IN THE RURAL
DEVELOPMENT SECTOR AND RECOMMENDATIONS FOR
STRENGTHENING THE RURAL SOCIO-ECONOMY IN ORDER TO
MITIGATE OUT-MIGRATION
SEPTEMBER, 2019

2
3
PREFACE
In Uttarakhand, where more than 66% of the population lives in the rural areas ( more than 80%
in the hill districts) the major challenge for development and overcoming poverty continues to be
the difficult mountain terrain and dispersed population of the mountain regions. Development of
rural areas has accelerated in the plain districts of the state that are Haridwar, Dehradun and
Udham Singh Nagar leaving the hill districts less developed. The land holdings are very small and
fragmented in the hilly areas. Only about 10% of land in hill districts is irrigated. Majority of the
rural population in the hills either survives on subsistence agriculture or migrates for better
livelihood opportunities. The development in the hill districts with regards to infrastructure like
electricity, roads and irrigation continue to be deficient. The inter-district inequality in
infrastructure leads to increasing disparity in terms of income and livelihood between the hills and
the plains. Also, income dependence on non-farm sector in the region has risen substantially. Out-
migration from rural areas of the hill districts of the state has become a major problem, resulting
in many depopulated hamlets or villages whose population has declined drastically. Stagnant
socio-economic conditions of the hill villages is a major challenge for tackling the problem of out-
migration.
Strengthening rural development and rural livelihoods has been considered as one of the key
drivers for change in the rural areas of Uttarakhand, particularly in the hill districts. The rural
population depends largely on agriculture and labor for their livelihoods. Strengthening the rural
economy of the state will be one of the key interventions for arresting the out-migration from these
areas.
The Rural Development and Migration Commission constituted by the state government in 2017
is tasked with evolving a vision for the focused development of the rural areas of the state, that
would help in mitigating out-migration and promote welfare and prosperity of the rural population;
advising the government on multi-sectoral development at the grassroots level which would
aggregate at the district and state levels; submit recommendations on those sections of the
population that is at risk of not adequately benefitting from economic progress and recommending
focused initiatives in sectors that would help in development of rural areas and thus help in
mitigating the problem of out-migration. It is as a part of this mandate that the Commission has
analysed major schemes and programmes in the Rural Development sector being implemented by
different departments / agencies of the state government for their socio-economic benefits and has
given suggestions for strengthening them, leading to enhancing the rural socio-economy which in
turn would help in mitigating out-migration.
This report is based on the work of the task force that was set up for this purpose in June 2018;
extensive field visits and interactions with experts, officials and the local population and also
senior government officials at the state headquarters. A detailed field assessment of the socio-
economic impact of schemes of the Rural Development department was also carried out in 156
villages of 36 blocks, the results of which have been presented in Annexure I. Recommendations
for strengthening the schemes and programmes of the rural development sector have been given
for enhancing the rural socio-economy, particularly of the hill districts which would tackle the
problem of out-migration.

4
The commission gratefully acknowledges the guidance and encouragement given by its Chairman,
Shri Trivendra Singh Rawat, Hon’ble Chief Minister, Uttarakhand; for suggestions and support to
Shri Utpal Kumar Singh Chief Secretary, MrsManisha Pawar, Principal Secretary, Rural
Development, Uttarakhand; Government officers of different departments; other stakeholders in
various districts; Shri A.K.Rajput, Deputy Commissioner Programmes Rural Development
department; Dr R S Pokhariya, Member Secretary; members of the expert group Mrs. SudhaTomar
(BDO, Raipur),Mr. Naveen Anand (Expert), Mr. Rajinder Singh (PD Dehradun) , Shri G B
Chandani, Research Officer; Shri Govind Singh Dhami, Mrs. Divya Pandey Young
Professional(s) of the commission for their untiring efforts in preparing this report.
September, 2019
Dr. Sharad Singh Negi
Vice Chairman

5
Table of Contents
LIST OF ABBREVIATIONS ....................................................................................................... 1
CHAPTER 1 OUT-MIGRATION IN UTTARAKHAND ..................................................... 3
CHAPTER 2 RURAL DEVELOPMENT: SCHEMES AND PROGRAMMES................... 9
CHAPTER 3 CURRENT STATUS OF THE SCHEMES OF RURAL ............................. 35
DEVELOPMENT DEPARTMENT
CHAPTER 4 UTTARAKHAND DECENTRALISED WATERSHED ........................... 136
DEVELOPMENT PROJECT
CHAPTER 5 CURRENT STATUS OF SCHEMES AND PROGRAMMES OF ........... 161
PANCHAYATI RAJ DEPARTMENT
CHAPTER 6 COOPERATIVES ...................................................................................... 178
CHAPTER 7 CASE STUDIES .......................................................................................... 196
CHAPTER 8 ANALYSIS AND RECOMMENDATIONS ............................................... 213
ANNEXURE I: IMPACT ASSESSMENT OF SOME RURAL .......................................... 231
DEVELOPMENT SCHEMES
ANNEXURE II: CONSTITUTION OF EXPERT GROUP .................................................. 242

6
ABBREVIATIONS
AAP : Annual Action Plan
AUP : Agri-Business Up scaling Plan
AWCs : Anganwadi Centres
BP : Business Promoters
BPL : Below Poverty Line
CC : Collection Centres
CCL : Cash Credit Limit
CLF : Cluster Level Federation
CRP : Community Resource Person
DAY- NRLM : Deendayal Antodaya Yojana- National Rural Livelihood Mission
DIC : District Industries Centre
DMU : Divisional Management Unit
DRDO : Defence Research and Development Organisation
EDP : Entrepreneurship Development Programme
EFMS : Electronic Funds Management System
FL-CRP : Financial Inclusion- Community Resource person
FMU : Field Management Unit
FNGO : Facilitating Non Governmental Organisation
FSIP : Food Security Improvement Plan
GP : Gram Panchayat
HHs : Households
ICDS : Integrated Child Development Scheme
IFAD : International Fund for agricultural Development
IGAs : Income Generating Activities
ILSP : Integrated Livelihood Support Project
JICA : Japan International Cooperation Agency
KVK : Kisan Vigyan Kendras
LAMPS : Large Area Multi Purpose Societies
LB : Labour Budget
LCs : Livelihood Collectives
LDPE : Low Density Polyethylene
MAP : Medicinal and Aromatic Plants

7
MCP : Micro Credit Plan
MGNREGA : Mahatma Gandhi National Rural Employment Guarantee Act
MGNREGS : Mahatma Gandhi National Rural Employment Guarantee Scheme
MoRD : Ministry of Rural Development
MOU : Memorandum of Understanding
NABARD : National Bank for Agriculture and Rural Development
NPA : Non Performing Asset
NRM : National Resource Management
NRRDA : National Rural Roads Development Agency
NSDC : National Skill Development Corporation
NSQF : National Skills Qualification Framework
PACS : Primary Agricultural Cooperative Societies
PG : Producer Group
PMGSY : Pradhan Mantri Gram Sadak Yojana
PRPs : Project Resource Persons
RSETIS : Rural Self Employment Training Institutes
SCC : Small Collection Centres
SERP : Society for Elimination of Rural Poverty
SHGs : Self Help Groups
ST : Schedule Tribe
STA : State Technical Agency
UC : Utilization Certificate
UFRMP : Uttarakhand Forest Resource Management Project
UGVS : Uttarakhand Gramya Vikas Samiti
ULIPH : Uttarakhand Livelihood Improvement Project in the Himalayas
UPASaC : Uttarakhand Parvatiya Ajeevika Sanvardhan Company
UREDA : Uttarakhand Renewable Energy Development Agency
USRLM : Uttarakhand State Rural Livelihood Mission
VPG : Vulnerable Producer Group
WMD : Watershed Management Directorate

8
Chapter 1
OUT-MIGRATION IN UTTARAKHAND
1.1 Statistics and Key reasons of Migration
Migration from rural to urban areas in Uttarakhand is a major challenge with a comparison
between 2001 and 2011 census data showing a slow decadal growth of population in most of the
mountain districts of the state. An absolute decline of 17868 persons in the population of Almora
and Pauri Garhwal districts between 2001 and 2011 points towards an out flux of people from
many hill regions of the state.The state is divided into 2 administrative divisions; 13 districts; 102
tehsils; 95 development blocks; 670 nyaay panchayats; 7950 gram panchayats . There are 16793
census villages (2011 census) of which 15745 are inhabited and 1048 uninhabited (2011 census).
In the last 10 years, a total of 3,83,726 persons in 6338 gram panchayats have migrated on
a semi - permanent basis, though they come to their homes in the villages from time to time and
have not migrated permanently.
In the last 10 years, there are 1, 18,981 permanent migrants from 3946 gram panchayats.
Data indicates that there are more semi-permanent migrants than permanent migrants in all
districts of the state.
The analysis of the data in the report of Migration Commission shows that the main
occupation of the people living in different villages of the state is agriculture, followed by labor
and government service.
The district wise Gross Domestic Product of hill districts like Almora, Bageshwar,
Champawat, Chamoli, Pauri, Tehri, Pithoragarh, Rudraparyag and Uttarkashi is less than 40% of
that of the plain districts like Dehradun, Udham Singh Nagar and Haridwar. This is perhaps due
to their relatively lesser population and largely rural based economy. When we compare the
approximate rate of growth of gross domestic product of the hill and plain districts of the state
between 2009-10 and 2016-17, it has increased by about 2 or 2.5 times in case of the former
districts(i.e. hill districts) and 3 times or more in case of the latter districts(i.e. plain districts). The
contribution of primary sector in the financial year 2011-12 was 14%, which in the financial year
2018-19 has decreased to 10.81 %. The contribution of secondary sector in the state GDP has
decreased from 52.13% to 48.28%. The contribution of tertiary sector is approximated to increase
to 40.91% from 33.88%. (Economic Survey 2018-19, GoU).
At constant price (year 2011-12), District Economic development of Dehradun is highest at 7.62%
while that of Champawat is the lowest at 5.75%.The per capita income of Haridwar, Dehradun
and U.S. Nagar was Rs. 2,54,050, Rs. 1,95,925 and Rs. 1,87,313 respectively.(2016-17) All other
hill districts had a per capita income lower than the state per capita income with Rudraprayag at
the lowest with Rs. 83,521. (Economic Survey 2018-19, GoU).

9
The contribution of the primary sector to the Gross Domestic Product of the hill districts is
much more than the state average even though it is showing a declining trend. This is another
evidence pointing to the dependence of people living in the hill districts on primary sector, mainly
agriculture and allied activities for their livelihood. In year 2016-17, contribution of primary sector
was the least in Haridwar district with only 4.4% in DDP while it was the highest in Almora’s
DDP at 30.2%. (Source: District Domestic Product Estimates 2011-12 to 16-17)
The decadal growth of various districts has slowed down between 1981 and 2011, with the
figure being negative in the districts of Pauri and Almora and relatively very low in Tehri district.
1.2 Segregation of people who Migrate – Youth, Mid-age people having
families, Senior retired persons
Table 1.1:District and Age wise Migration Status from gram panchayats (in Percentage)
District less than 25 years 26 to 35 years old more than 35 years of
age
Uttarkashi 30.68 36.56 32.77
Chamoli 26.71 43.49 29.79
Rudraprayag 28.97 41.83 29.2
Tehri Garhwal 29.26 40.92 29.82
Dehradun 38.41 34.47 27.12
Pauri Garhwal 29.23 41.67 29.1
Pithoragarh 28.32 42.58 29.1
Bageshwar 33.92 42.1 23.97
Almora 29.19 42.22 28.59
Champawat 25.23 45.49 29.29
Nainital 29.48 44.57 25.96
Udham Singh Nagar 16.66 43.34 40
Haridwar 13.99 52.79 33.22
The segregation of migrated people from Uttarakhand in given in the table above. The table shows
maximum percentage migration in the age group of 26 to 35 in all districts.
The average percentage of people migrated from the age of 26 to 35 in the state is at 42.25 which
is the youth of the state.

10
1.3 Reasons
The main reasons identified in the report of Migration Commission are given in the table below:
District
Em
plo
ym
ent
Med
ical
Faci
liti
es
Ed
uca
tion
Infr
ast
ruct
ure
Poor
agri
cult
ura
l
pro
du
ce
foll
ow
ed t
he
fam
ily
that
mig
rate
d
des
tru
ctio
n o
f
agri
cult
ura
l p
rdu
ce
by w
ild
an
imals
others
Uttarkashi 41.77 6.04 17.44 2.29 7.14 2.1 4.04 19.17
Chamoli 49.3 10.83 19.73 4.93 4.73 2.51 3.09 4.87
Rudraprayag 52.9 8.64 15.67 4.43 4.27 3.26 5.11 5.72
Tehri Garhwal 53.43 7.84 18.24 3.07 6.17 2.47 4.26 5.52
Dehradun 56.13 6.33 12.5 1.2 2.08 1.4 1.65 18.7
Pauri Garhwal 52.58 11.26 15.78 3.03 5.35 2.53 6.27 3.21
Pithoragarh 42.81 10.13 19.52 4.97 4.66 2.36 4.08 11.48
Bageshwar 41.39 9.09 14.49 4.32 2.18 1.45 3.42 23.65
Almora 47.78 8.61 11.75 3.81 8.37 2.68 10.99 6.02
Champawat 54.9 6.67 10.24 5.46 6.31 4.3 6.65 5.46
Nainital 53.7 7.79 10.37 4.96 4.94 2.1 6.38 9.76
Udham Singh
Nagar 65.63 4.27 3.52 0.6 0.38 5.4 2.6 17.6
Haridwar 76.6 1.62 2.73 0.05 0.64 1.69 0.82 15.85
Table 1.2: Interim Report on the status of migration in gram panchayats of Uttarakhand.
Of the total people migrated the maximum percentage migrated due to the reason of
employment, 50.16% in the state. Education came second with a contribution of 15.21% people
migrated.

11
Figure 1.1: Source: Interim Report on the status of migration in gram panchayats of Uttarakhand.
The chart above shows the main reasons of migration from the state and there percentage
contribution in migration.
1.4 Specific areas where the migration is high
Migration from some areas in the state is higher than the others. Many of the villages in
the state are uninhabited after 2011. District wise distribution of such villages is given below:
District Total revenue
villages/toks/majra
Uttarkashi 70
Chamoli 41
Rudraprayag 20
Tehri Garhwal 58
Dehradun 7
Pauri Garhwal 186
Pithoragarh 75
Bageshwar 77
Almora 57
Champawat 64
Nainital 22
Udham Singh Nagar 19
Haridwar 38 Table 1.3: Interim Report on the status of migration in gram panchayats of Uttarakhand.

12
Figure 1.2: Source: Interim Report on the status of migration in gram panchayats of Uttarakhand.
Pauri accounts for the highest number of uninhabited villages after 2011 which makes it a priority
district. Most of the economic opportunities happened to concentrate in plain areas of the State, leading
to huge income inequalities across the hill and plain districts of the State. Per capita income in
Bageshwar, Champawat, Tehri Garhwal, Rudraprayag, Uttarakashi and Almora districts is almost half
of that in Dehradun and Haridwar.( Districtwise per capita Income, 2016-17).
Number of villages/toks/ Majra where population has declined more than 50%
Name of District Total villages/Toks/Majra
Uttarkashi 63
Chamoli 18
Rudraprayag 23
Tehri Garhwal 71
Dehradun 42
Pauri Garhwal 112
Pithoragarh 45
Bageshwar 37
Almora 80
Champawat 44
Nainital 14
Udham Singh Nagar 9
Haridwar 7
Table 1.4: Interim Report on the status of migration in gram panchayats of Uttarakhand.
Uttarkashi9% Chamoli
6%
Rudraprayag3%
Tehri Garhwal8%
Dehradun1%
Pauri Garhwal25%
Pithoragarh10%
Bageshwar10%
Almora8%
Champawat9%
Nainital3%Udham Singh Nagar
3%
Haridwar5%
Total revenue villages/toks/majra Uninhabited
Uttarkashi
Chamoli
Rudraprayag
Tehri Garhwal
Dehradun
Pauri Garhwal
Pithoragarh
Bageshwar
Almora
Champawat
Nainital

13
The total number of villages/toks/majra that have seen more than 50% decline in the
population in last 10 years is 564. Showing a similar trend to uninhabited village in the state, Pauri
district accounts for the highest number of villages with more than 50% decline in the population
with 112 such villages/toks/majra followed by Almora, with the number at 80.
The data highlights the disparities between the hill and the plain districts of Uttarakhand.
Out-migration in Uttarakhand has become an issue of prime importance and proactive steps are
required to curb migration in the region.
REFERENCES:
District Domestic Product Estimates, 2011-12 to 2016-17
Districtwise per Capita Income (Uttarakhand), 2016-17
Economic Survey of Uttarakhand, 2018-19
Interim Report on the status of Migration in Gram Panchayats of Uttarakhand, Migration
Commission (April, 2018)

14
Chapter 2
RURAL DEVELOPMENT: SCHEMES AND
PROGRAMMES
The term "Rural Development" ... refers to a distinct approach to interventions by the state
in the economies of underdeveloped countries, and one which is at once broader and more specific
than 'agricultural development'. It is broader because it entails much more than the development
of agricultural production - for it is in fact a distinct approach to the development of the economy
as a whole. It is more specific in the sense that it focuses (in its rhetoric, and in principle)
particularly on poverty and inequality. Although there is a substantial overlap between the field
of conventional agricultural economics and the concerns of "Rural Development", the kinds of
study required to understand the factors affecting "Rural Development" are not contained within
the discipline of agricultural economics.( Harris: 1982)
Rural development has gained a lot of significance lately especially in the developing
nations. It has greater importance for a country like India where majority of the population, around
65% of the people continue to live in rural areas. The present strategy of rural development in
India mainly focuses on poverty alleviation, better livelihood opportunities, provision of basic
amenities and infrastructure facilities through innovative programmes of wage and self-
employment.
The Ministry of Rural Development in India is the apex body for formulating policies,
regulations and acts pertaining to the development of the rural sector. Agriculture, handicrafts,
fisheries, poultry, and dairy are the primary contributors to the rural business and economy.
UTTARAKHAND:
Uttarakhand was formed on 9th November, 2000 as the 27th State of India, when it was
carved out of northern Uttar Pradesh. Located at the foothills of the Himalayan mountain ranges,
it is largely a hilly State, having international boundaries with China (Tibet) in the north and Nepal
in the east. On its north-west lies Himachal Pradesh, while on the south is Uttar Pradesh. It is rich
in natural resources especially water and forests with many glaciers, rivers, dense forests and
snow-clad mountain peaks.
About 70% of Uttarakhand’s population lives in rural areas. In Uttarakhand the major
challenge for development and overcoming poverty continues to be the difficult mountain terrain.
Development has continued to flock in the plain districts of Uttarakhand that are Haridwar,
Dehradun and Udham Singh Nagar leaving the hill districts less developed. The land holdings are
very small and fragmented in the hilly areas. Only about 10% of land in hill districts is irrigated.
At the same time soil and water conservation add to the issues hindering inclusive development.
Majority of the rural population in the hills either survives on subsistence agriculture or migrates
to other parts of the country for employment. The development in the hill districts with regards to

15
infrastructure like electricity, roads and irrigation continue to be less. The inter-district inequality
in infrastructure leads to increasing disparity in terms of income and livelihood between the hills
and the plains. Also, income dependence on non-farm sector in the region has risen substantially.
(Uttarakhand Government)
At the same time, the hill districts of Uttarakhand have tremendous potential. The vast
natural resources add to the state’s attractiveness as an investment destination, especially for
tourism and agriculture- and forest –based industries.
Various Rural Development Programs in the State
2.1 Mahatma Gandhi National Rural Employment Guarantee Act
(MGNREGA) :
The National Rural Employment Guarantee Act was notified in 2005. As per an
amendment to the Act the words ‘Mahatma Gandhi’ were prefixed to National Rural Employment
Guarantee Act. The Act covers the entire country with the exception of districts that have hundred
percent urban population. Mahatma Gandhi NREGA provides a number of legal entitlements to
rural workers through a series of provisions in the law. While the Act makes provision for a
hundred days work per rural household in a year, it is the strong legal framework of rights and
entitlements that come together to make the hundred days of work per year possible.
MGNREGA aims at enhancing livelihood security by providing upto one hundred days of
guaranteed wage employment in a financial year to every rural household whose adult members
volunteer to do unskilled manual work. The Mahatma Gandhi NREGA is a demand driven
programme, hence requirement of funds and employment generation depend on demand for work.
The main focus of the act is to facilitate the social protection for the people living
in rural India by providing employment opportunities and therefore contributing towards the
overall development of the local people.
In 2008-2009, Ministry of Rural Development, Government of India prepared joint
guidelines for convergence of MGNREGS activities with the activities of Ministry of Water
Resources, Indian Council of Agriculture Research, Ministry of Agriculture, Ministry of
Environment and Forests, Pradhan Mantri Gram Sadak Yojana, and schemes of Department of
Land Resources, Ministry of Rural Development to build synergies between the activities of
MGNREGS and the activities of these ministries, optimize use of scarce resources and create
durable and productive assets for rural livelihood sustainability. Initially, 126 districts of India
were selected as pilot for the convergence activities. Later on, the MGNREGS convergence was
extended to some more schemes/activities such as PMKSY(Pradhan Mantri Krishi Sinchai
Yojana), National Livelihood Mission, etc (Study Report on Assessment of Convergence
Activities under MGNREGA in Uttarakhand, NIRDPR)
Types of work under the Scheme:

16
Flood Control and Protection works including drainage in waterlogged areas.
Rural connectivity to provide all weather access. Other works notified by the Central/State
Government
Water conservation and Water Harvesting.
Drought Proofing ( Afforestation and tree plantation)
Irrigation Canals
Provision of irrigation facility to land owned by SC/ST/beneficiaries under IAY.
Renovation of traditional water bodies, desilting of tanks
Land Development
To provide productive assets and income generating employment opportunities to the poor,
many state and centrally sponsored schemes have been implemented in Uttarakhand. The
MGNREG Scheme is an important demand-driven employment guarantee programme that has
been providing employment for those who depend on casual work for their livelihood. Although
the overall days of employment are low (one and half months) for this scheme, the dependence on
such employment is higher among the lower quintile income groups compared to the highest
quintile groups. (HDR, Uttarakhand 2017)
2.2 DAY-NRLM
The Swarnjayanti Gram Swarozgar Yojana (SGSY) was a flagship programme of the Ministry of
Rural Development. It was started in 1999 and was restructured in FY 2010-11 for implementation
as the National Rural Livelihoods Mission. The SGSY aimed at providing sustainable income to
rural BPL households through income generating assets/economic activities in order to bring them
out of poverty.
The Ministry of Rural Development (MoRD), Government of India (GoI) constituted a Committee
on Credit Related Issues under SGSY (under the Chairmanship of Prof.Radhakrishna) to examine
various aspects of the scheme implementation. The Committee recommended adoption of a
‘Livelihoods Approach’ to rural poverty elimination. The approach encompassed the following
four inter-related tasks:
Mobilizing poor households into functionally effective SHGs and their federations.
Enhancing access to bank credit and financial, technical and marketing services.
Building capacities and skills for gainful and sustainable livelihoods development.
Converging various schemes for efficient delivery of social and economic support services
to poor households.

17
The Ministry of Rural Development is implementing Deen Dayal Antodaya Yojana-
National Rural Livelihoods Mission to reduce poverty by enabling the poor households to access
gainful self-employment and skilled wage employment opportunities resulting in appreciable
improvement in their livelihoods on a sustainable basis, by building strong and grassroots
institutions of the poor. The objective is to ensure that each family, once it is in the SHG network
for a period of 6-8 years, is able to achieve household food security and have 3-4 stabilized
livelihoods. The National Rural Livelihoods Project is being implemented in 13 high poverty
states accounting for about 90% of rural poor in the country.
DAY-NRLM encourages public sector banks to set up Rural Self Employment Training
Institutes in all districts of the country. RSETIs transform unemployed rural youth in the districts
into confident self-employed entrepreneurs through need-based training program followed by
systematic handholding support and bank linkage. Banks are involved in selection, training and
post training follow-up.
NRLM set out with an agenda to cover 7 Crore rural poor households, across 600 districts,
6000 blocks, 2.5 lakh Gram Panchayats and 6 lakh villages in the country through self-managed
Self Help Groups (SHGs) and federated institutions and support them for livelihoods collectives
in a period of 8-10 years.
In addition, the poor would be facilitated to achieve increased access to rights, entitlements
and public services, diversified risk and better social indicators of empowerment. DAY-NRLM
believes in harnessing the innate capabilities of the poor and complements them with capacities
(information, knowledge, skills, tools, finance and collectivization) to participate in the growing
economy of the country. (Aajeevika)
In November 2015, the program was renamed Deendayal Antayodaya Yojana (DAY-
NRLM).
2.2.1 COMPONENTS
2.2.1.1 Financial Inclusion
1. Making poor preferred clients of financial institution
NRLM provides Revolving Fund and Community Investment Fund (CIF) as Resources in
Perpetuity to the institutions of the poor, to strengthen their institutional and financial management
capacity and build their track record to attract mainstream bank finance.
NRLM provides Revolving Fund (RF) to SHGs of Rs.10,000-15,000 as corpus to meet
the members’ credit needs directly and as catalytic capital for leveraging repeat bank finance. RF
is given to SHGs that have been practicing ‘Panchasutra’ (Regular meetings; Regular savings;
regular inter-loaning; timely repayment; and Up-to-date books of accounts).
18
NRLM provides Community Investment Fund as Seed Capital to SHG Federations at
Cluster level to meet the credit needs of the members through the SHGs/Village
Organizations and to meet the working capital needs of the collective activities at various
levels.
NRLM provides Vulnerability Reduction Fund (VRF) to SHG Federations at Village
level to address vulnerabilities like food security, health security etc., and to meet the needs
of the vulnerable persons in the village.
SHG Credit Linkage: While the Mission provides only catalytic capital support to the
community institutions, it is expected that the banks provide the major chunk of funds required
for meeting the entire gamut of credit needs for the rural poor households. The Mission therefore
expects that the SHGs leverage significant amount of bank credit.
The Mission assumes that over a period five years, each SHG would be able to leverage
cumulative bank credit of Rs. 10,00,000/- in repeat doses, such that on the average each
member household accesses a cumulative amount of Rs. 100000/-.
In order to facilitate bank linkages, State Level Bankers’ Committees (SLBC) would
constitute exclusive sub-committees for SHG bank linkages and financial inclusion in
NRLM activities. Similarly, District Level Coordination Committees and Block Level
Coordination Committees would review SHG-Bank linkages and NRLM.
The Mission units are also expected to use the services of the field level customer
relationship managers such as Bank Mitra/Sakhi.
Further, institutions of the poor are expected will be guided to constituting community-
based recovery mechanisms (sub-committees on bank linkage and recovery of loans).
2.2.1.2 SOCIAL INCLUSION AND DEVELOPMENT
In order to ensure that no poor family is left out, NRLM would use differential strategies for
social inclusion of all identified rural poor households into functionally effective and self-
managed institutions, with particular focus on more vulnerable sections like Scheduled Castes
(SCs), Scheduled Tribes (STs), Primitive Tribal Groups (PTGs), single women and women
headed households, Persons With Disabilities (PWDs), landless, migrant labour, isolated
communities and communities living in remote, hilly and disturbed areas. It would identify
the poorest and vulnerable through participatory identification of poor (PIP). The mobilization
would begin with them first. The mobilization effort would progress with the satisfactory
community readiness and milestones for various stages of mobilization and graduation as evolved
and tested in a participatory manner. Existing institutions, their leaders, staff and community
resource persons (CRPs) would support the processes of inclusion and mobilization.
2.2.1.3 INSTITUTIONAL AND CAPACITY BUILDING
NRLM organizes all poor households (women) into aggregate institutions of the poor that
provide them with voice, space and resources. These platforms ‘of the poor’ and ‘for the poor’

19
would partner with local self-governments, public service providers, banks, private sector and
other mainstream institutions to facilitate delivery of social and economic services to the poor.
2.2.1.4 CONVERGENCE AND PARTNERSHIPS
Government of India and State Governments are implementing a wide range of
programmes to address different dimensions of poverty and deprivation. Major Government
programmes impacting on the poor can broadly be classified as –
Entitlements – PDS, MGNREGS, social security, Right to education etc.
Improving quality of life – Health & nutrition, clean drinking water, sanitation, permanent
housing, electricity etc.
Enhancing capabilities – Elementary education, vocational, technical education, skills
enhancement, etc.
Creating livelihoods opportunities – Institutional finance, Agriculture, animal husbandry,
watersheds, MSME development, food processing, etc.
Physical Infrastructure Schemes – Roads, electricity, telecommunications, etc.
2.2.1.5 LIVELIHOOD PROMOTION
NRLM focuses on stabilizing and promoting existing livelihoods portfolio of the poor through its
three pillars
‘vulnerability reduction’ and ‘livelihoods enhancement’ through deepening/enhancing and
expanding existing livelihoods options and tapping new opportunities in farm and non-
farm sectors;
‘employment’ - building skills for the job market outside; and
‘Enterprises’ - nurturing self-employed and entrepreneurs (for micro-enterprises).
2.2.2 DEEN DAYAL UPADHYAYA GRAMEEN KAUSHALYA YOJANA:
It is placement linked skill development scheme and is a part of DAY-NRLM. It has
evolved out of the need to diversify incomes of the rural poor to cater to the occupational
aspirations of the rural poor youth. It aims at skilling rural poor youth and providing them jobs
with regular monthly wages (at a minimum of Rs. 6000 per month or above the minimum wages
whichever is higher).
DDU-GKY is uniquely focused on rural youth between the ages of 15 and 35 years from
poor families. As a part of the Skill India campaign, it plays an instrumental role in supporting the
social and economic programs of the government like the Make in India, Digital India, Smart
Cities and Start-Up India, Stand-Up India campaigns. Over 180 million or 69% of the country’s
youth population between the ages of 18 and 34 years, live in its rural areas. Of these, the bottom

20
of the pyramid youth from poor families with no or marginal employment number about 55
million.
The DDU-GKY skilling ecosystem consists of The Ministry of Rural Development
(MoRD) or the National Mission Management Unit (NMMU or NU), State Missions, Project
Implementing agencies or training partners and Technical Support Agencies. Curriculum support
is through National Council for Vocational Training (NCVT) and the Sector Skill Councils (SSC)
of National Skill Development Corporation (NSDC). Combined with industry partnerships and
partnerships with employers, the ecosystem comes together to provide the best possible training
and gainful employment for a candidate.
DDU-GKY is guided by programme guidelines (2016).The guidelines provide a
framework for major processes such as: who can be trained, the essential eligibility norms for
potential PIAs, projects and PIA appraisal norms, funding norms as well as the roles and
responsibilities of the stakeholders. Many of these processes are further elaborated in the Standard
Operating Procedures (SOP), which will be notified from time to time. It is essential that the SOP
and the guidelines are read together, in order to understand the overall policy framework and
institutional procedures for implementing DDU-GKY. (DDU-GKY)
2.3 Pradhan Mantri Gram Sadak Yojana (PMGSY)
(Source: pmgsy.nic.in)
Pradhan Mantri Gram Sadak Yojana is a 100 per cent centrally sponsored scheme which
has the objective to provide all –weather road connectivity to all eligible unconnected habitations
existing in the Core Network , in rural areas of the country. The programme envisages connecting
all eligible unconnected habitation with a population of 500 persons and above (as per 2001
census) in Special Category states which includes Uttarakhand and in selected tribal and backward
districts (as identified by the ministry of homeaffairs/erstwhile Planning Commission). The
PMGSY permits upgradation (to prescribed standards) of existing rural roads in districts where
all the eligible habitations with population of 100 and above (as per 2001 census) would be eligible
to be covered under PMGSY. PMGSY-II has the objective to cover upgradation of existing
selected rural roads based on the criterion to make the road-network vibrant. In order to achieve
‘Improved Access to market by 2022’, PMGSY-III is being launched with a dream of “New India
2022” by consolidating the rural road network by providing for upgradation of existing selected
rural roads based on their economic potential and their role in facilitating the growth of rural
market centres and rural hubs.
The PMGSY shall cover only the rural areas. Urban roads are excluded from the purview
of this Programme. Even in the rural areas, PMGSY covers only the Rural Roads i.e., Roads
that were formerly classified as ‘Other District Roads’ (ODR) and ‘Village Roads’ (VR). Other
District Roads (ODR) are roads serving rural areas of production and providing them with outlet
to market centres, taluka (tehsil) headquarters, Block headquarters or other main roads. Village
Roads (VR) are roads connecting villages / Habitation or groups of Habitation with each other
and to the nearest road of a higher category. Major District Roads, State Highways and National

21
Highways cannot be covered under the PMGSY, even if they happen to be in rural areas. This
applies to New Connectivity roads as well as Upgradation works.
The Rural Roads constructed under the Pradhan Mantri Gram Sadak Yojana will be in
accordance with the provision of the Indian Roads Congress (IRC) as given in the Rural Roads
Manual (IRC:SP20:2002). In case of Hill Roads, for matters not covered by the Rural Roads
Manual, provisions of Hills Roads Manual (IRC:SP:48) may apply.
2.4 NATIONAL RURBAN MISSION ( RURBAN)
The Shyama Prasad Mukherji Rurban Mission had been launched in February 2016, with
an aim of creating 300 Rurban clusters and plugging the gaps in basic, social, economic and digital
amenities in these clusters.
Large parts of rural areas in the country are not stand-alone settlements but part of a cluster
of settlements, which are relatively proximate to each other. These clusters typically illustrate
potential for growth, have economic drivers and derive locational and competitive advantages.
Hence, making a case for concerted policy directives for such clusters. These clusters once
developed can then be classified as 'Rurban'. Hence taking cognizance of this, the Government of
India, has proposed the Shyama Prasad Mukherji Rurban Mission (SPMRM), aimed at developing
such rural areas by provisioning of economic, social and physical infrastructure facilities.
There will be provision of basic and economic amenities to emerge with at- least 100 of
the 300 rurban clusters, with thematic economic growth points in the sectors of agri-services,
tourism and SME that would be Open Defecation Free, Zero Waste, covered with adequate street
lights using green technologies, comprising households with access to safe drinking water and
saturated with LPG connection.
The National Rurban Mission (NRuM) follows the vision of "Development of a cluster of
villages that preserve and nurture the essence of rural community life with focus on equity and
inclusiveness without compromising with the facilities perceived to be essentially urban in nature,
thus creating a cluster of "Rurban Villages".
2.5 PRADHAN MANTRI AWAAS YOJNA – GRAMIN:
Rural housing programme, as an independent programme, started with Indira Awaas
Yojana (IAY) in January 1996. Although IAY addressed the housing needs in the rural areas,
certain gaps were identified during the concurrent evaluations and the performance Audit by
Comptroller and Auditor General (CAG) of India in 2014. These gaps, i.e. nonassessment of
housing the shortage, lack of transparency in selection of beneficiaries, low quality of the house
and lack of technical supervision, lack convergence, loans not availed by beneficiaries and weak
the mechanism for monitoring was limiting the impact and outcomes of the programme.
To address these gaps in the rural housing program and in view of Government’s
commitment to providing “Housing for All’’ by the 2022, IAY has been re-structured into Pradhan
Mantri Awaas Yojana–Gramin (PMAY-G) w.e.f. 1st April 2016.PMAY-G aims at providing a
pucca house, with basic amenities, to all houseless households and those households living in

22
kutcha and dilapidated house, by 2022. The immediate objective is to cover 1.00 crore household
living in kutcha house/dilapidated house in three years from 2016-17 to 2018- 19.The minimum
size of the house has been increased to 25 sq.mt (from20sq.mt) with a hygienic cooking space.
The unit assistance has been increased from Rs. 70,000 to Rs. 1.20 lakh in plain and from Rs75,000
to Rs 1.30 lakh in hilly states, difficult areas and IAP district. The beneficiary is entitled to 90-95
person day of unskilled labour from MGNREGS. The assistance for construction of toilet shall be
leveraged though convergence with SBM-G, MGNREGS or any other dedicated the source of
funding. Convergence for piped drinking water, electricity connection, LPG gas connection etc.
different Government programmers are also to be attempted.
The cost of unit assistance is to be shared between Central and State Government in the
ratio 60:40 in plain areas and 90:10 for North Eastern and the Himalayan States. From the annual
budgetary grant for PMAY-G, 90% of funds is to be released to States/UTs for the construction
of new house under PMAY-G this would also include 4% allocation towards Administrative
expenses. 5% of the budgetary grant is to be retained at the central Level as reserve fund for special
Projects. The annual allocation to the states is to be based on the Annual Action Plan (AAP)
approved by the Empowered Committee and the fund to States /UTs is to be released in two equal
installments. One of the most important features of PMAY-G is the selection of beneficiary. To
ensure that assistance is targeted at those who are genuinely deprived and that the selection is
objective and verifiable, PMAY-G instead of selecting a the beneficiary from among the BPL
households selects beneficiary using housing deprivation parameters in the Socio Economic and
Caste Census (SECC), 2011 which is to be verified by the Gram Sabhas. The SECC data captures
specific deprivation related to housing among households. Using the data, households that are
houseless and living in 0, 1 and 2 kutcha wall and kutcha roof houses can be segregated and
targeted . The Permanent Wait List so generated also ensures that the states have the ready list of
the household to be covered under the scheme in the coming years (through Annual Select Lists)
leading to better planning of implementation.
2.6 NATIONAL SOCIAL ASSISTANCE PROGRAMME
It is a social assistance programme for the aged, widows, and disabled and to the families
in the case of death of the breadwinner belonging to BPL households. This scheme has been
launched keeping in view the spirit of article 41 of the constitution of India which directs the state
to provide public assistance to its citizens in case of unemployment, old age, sickness and
disablement and in other cases of undeserved want within the limit of its economic capacity and
development. The intention of launching the scheme is to ensure the social protection to the
beneficiaries is available throughout the country and for this 100 percent central assistance is
provided. NSAP comprises of the following schemes for Below Poverty Line Households
(BPL):
(a) Indira Gandhi National Old Age Pension Scheme (IGNOAPS): Under the scheme,
financial assistance of Rs. 200 per month is provided to person belonging to family living
below poverty line in the age group of 60-79 and Rs. 500 per month to persons of 80 years
and above.

23
(b) Indira Gandhi National Widow Pension Scheme (IGNWPS): Under the scheme
Central financial assistance at Rs.300 per month is provided to widows in the age group
of 40-79 years and belonging to family living below poverty line as per the criteria
prescribed by Government of India.
(c) Indira Gandhi National Disability Pension scheme(IGNDPS): Under the scheme
central assistance of Rs.300 per month is provided to persons aged 18-79 years with severe
and multiple disabilities and belonging to family living below poverty line as per the
criteria prescribed by Government of India.
(d) National Family Benefit Scheme (NFBS): Under the scheme a BPL household is entitled
to lump sum amount of money on the death of the primary breadwinner aged between 18-
59 years. The amount of assistance is Rs.20,000.
(e) Annapurna: Under the scheme, 10kg of food grains per month are provided free of cost
to those citizens who, though eligible under IGNOAPS, are not receiving old age pension.
2.7 SAANSAD ADARSH GRAM YOJNA (SAGY):
It was launched on 11th October 2014 with the objective of creating model gram
panchayats in all parts of the country. The development of SAGY Gram Panchayats takes place
under the guidance of honorable members of parliament through the convergence and
implementation of existing Government Schemes and programmes without allocating any
additional funds. These ‘Adarsh grams’ serves as ‘ nucleus of health, cleanliness, greenery and
cordiality’ within the village community becoming schools of local development and governance,
inspiring neighboring Gram Panchayats.
The Members of Parliament (MPs) are the pivots this Scheme will run on. Gram Panchayat would
be the basic unit for development. It will have a population of 3000-5000 in plain areas and 1000-
3000 in hilly, tribal and difficult areas. In districts where this unit size is not available, Gram
Panchayats approximating the desirable population size may be chosen. The MP will identify one
Gram Panchayat to be taken up immediately, and two others to be taken up a little later. Lok Sabha
MP has to choose a Gram Panchayat from within his/her constituency and Rajya Sabha MP a
Gram Panchayat from the rural area of a district of his/her choice in the State from which he/she
is elected. Nominated MPs may choose a Gram Panchayat from the rural area of any district in
the country. In the case of urban constituencies (where there are no Gram Panchayats), the MP
will identify a Gram Panchayat from a nearby rural constituency. Primarily, the goal is to develop
three Adarsh Grams by March 2019, of which one would be achieved by 2016. Thereafter, five
such Adarsh Grams (one per year) will be selected and developed by 2024.
2.8 MISSION ANTODAYA:
Under Mission Antodaya, the state government has purposively selected 50,000 gram
panchayats and their ranking on parameters of physical infrastructure, human development and
economic activities was done in October, 2017. This is to facilitate identification of gaps in a quest

24
for Poverty Free Gram Panchayats through convergent actions over the next 1000 days. The state
governments have uploaded data in respect of the mission Antodaya G.Ps/ Clusters. An analysis
of uploaded data reveals that the state governments need to focus more on infrastructure and social
amenities in G.P.s which score less than 60, with special focus on G.P.s having scored less than
40. The state governments are advised that the state action plan in respect to Rural Development
schemes be based upon the gap analysis of mission Antodaya G.Ps so as to fill those gaps in
saturation mode in the year 2018-19.
2.9 INTEGRATED LIVELIHOOD SUPPORT PROJECT (IFAD):
Integrated Livelihood Support Project (ILSP) is a joint initiative of Government of
Uttarakhand and International Fund for Agriculture Development (IFAD) and being implemented
in Uttarakhand in 44 blocks of 11 hill districts under the Rural Development department. The
overall goal of ILSP is to reduce poverty which would be achieved via the more immediate
development objective to “enable rural households to take up sustainable livelihood opportunities
integrated with the wider economy”.
ILSP is a poverty alleviation programme being implemented in Uttarakhand in 44 blocks
of 11 hill districts (Almora, Bageshwar, Chamoli, Tehri, Uttarkashi, Rudraprayag, Dehradun,
Pauri, Champawat, Pithoragarh and Nainital).
The strategy behind ILSP is to adopt a two pronged approach to building livelihoods in
hill districts. The first of these is to support and develop the food production systems which remain
the main means of support for most households. The second main thrust of the project is to
generate cash incomes by supporting non-farm livelihoods, especially community involvement in
rural tourism, and vocational training.
Monitoring and Evaluation in ILSP has been developed under the project as a continuous
process for effective project implementation management. The objective of M&E process is to
collect reliable data and information for measuring performance and progress towards
achievement of results; and to provide information about success and failures, and to take
corrective measures for successful implementation of project activities. It is also used as a learning
tool to provide information for critical reflection on project strategies and operations and
supporting decision-making at various levels as a basis for results based management.
The mechanisms developed under ILSP to facilitate project monitoring and evaluation
includes the online MIS, Monitoring Committees at State, District and Block level, Surveys and
third party evaluation etc.
2.10 UTTARAKHAND DECENTRALIZED WATERSHED
DEVELOPMENT PROJECT (UDWDP)
In the state of Uttarakhand, about 80 percent of the population living in the hills depends
on agriculture. The major crops are subsistence cereals with productivity as low as 1.2 to 1.4
tons/ha. By and large, the product yields in the hills are 50 percent lower than those found in the
25
plains, due predominantly to constrained accessibility of irrigation water, poor in-situ rainwater
conservation, and loss of fertile topsoil. In the hills, traditional irrigation practices are not feasible.
In addition, there has been a general decrease in the release rate of spring and stream water sources:
around 10 percent of these water sources have vanished in the course of the last decade.These are
real requirements to upgrading rainfed agronomic practices and expanding farming efficiency.
The degraded lands are owned by poor families, and their land holdings are little and scattered.
As a result, family earnings are low and more than 24 percent of the populace out-migrates.
Enhancing water accessibility through watershed treatment is along these lines critical to expand
farming efficiency and enhance employments in the rainfed regions of Uttarakhand.(PAD,
UDWDP 2)
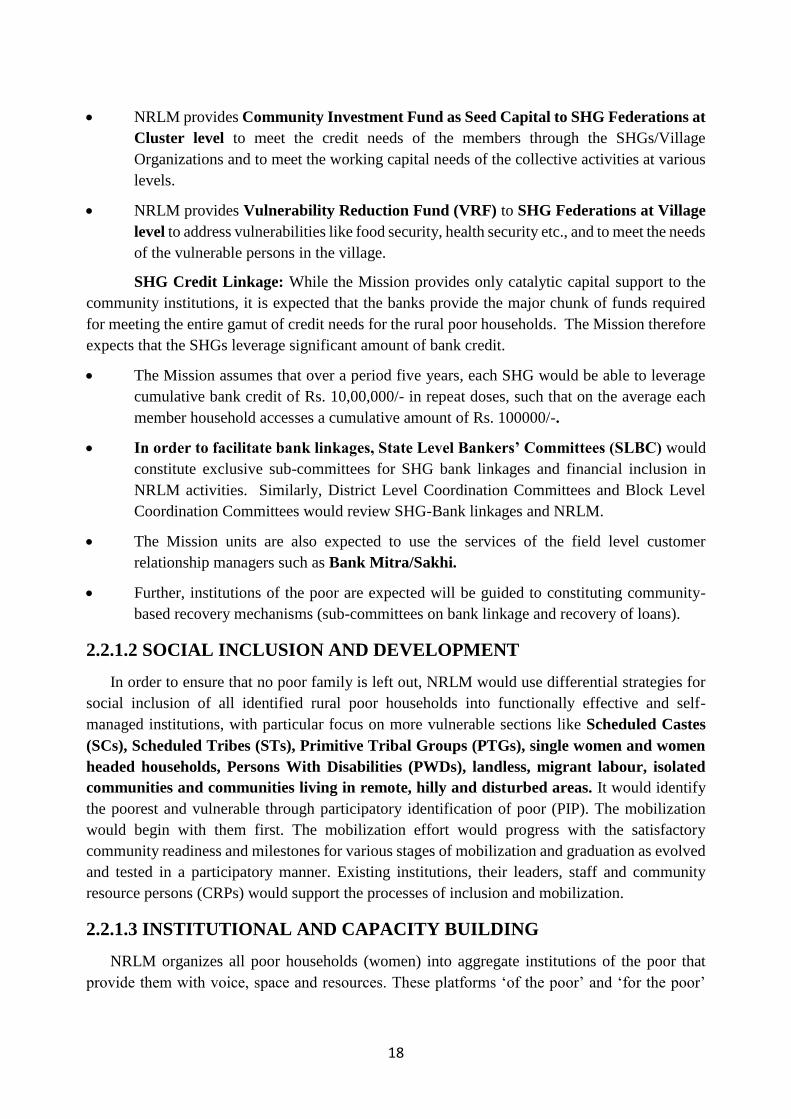
2.10.1 Gramya 1
Project Development Objective: To improve the productive potential of natural resources and
increase incomes of Rural inhabitants in selected watersheds through socially inclusive,
institutionally and environmentally sustainable approaches.
Project area: 468 identified Gram Panchayats in 18 development Blocks of 11 Districts
participated in this project. An estimated 2,58,000 population of the project was proposed to be
benefited from the project outcomes.
PROJECT COMPONENTS:
1. Participatory Watershed Development and Management.
● Promotion of social mobilization and Community driven decision-making.
❖ Ownership
❖ Accountability
❖ Transparency
❖ Cost-effectiveness
❖ Participation of disadvantaged groups
Watershed treatments and village development: In GPWDP activities such as soil and moisture
conservation, afforestation, water harvesting, agriculture terrace repair, agriculture interventions
like introduction of high value crops and value addition of farm produce, horticulture, livestock
management and breeding activities, fodderproduction, repair of roads and culverts, non-
conventional energy programs etc. were included. The Environmental and Social Guidelines
(ESG) were made an integral part of the GPWDP and Sub- projects. Through these guidelines the
objective was to minimize or mitigate the negative environmental and social impacts and to
enhance the positive impacts.
2. Enhancing Livelihood Opportunities
● Farming systems improvement
● Value addition and marketing support

26
● Pine Briquetting
● Income generating activities for vulnerable groups
3. Institutional Strengthening
● Capacity building of Gram Panchayats and local community institutions
● Information, Education and communication.
● Project Management and Information Management Monitoring and Evaluation(IMME)
● External Monitoring (Baseline, MTR and Final Impact Assessment consultancy)
● Participatory Monitoring and Evaluation(PME)
2.10.2 Phase-II (Gramya):
The project is a World Bank Funded (IDA credit) with a sequel to UDWDP Phase-I Project. The
main objective of the project is to increase the efficiency of natural resource use and productivity
of rain-fed agriculture by participating communities in selected micro-watersheds of the State of
Uttarakhand.
The project objective would be achieved by (a) supporting sustainable natural resource
management through treating watersheds comprehensively at micro-watershed level; (b)
increasing productivity on arable lands through providing extension services; (c) increasing rural
incomes through enhancing agribusiness development for target farmers and alternative
livelihoods for vulnerable households; and (d) as needed, providing response to an eligible crisis
or emergency in the target micro-watersheds.
This project will be based on joint relationship among three entities: (i) village communities and
GPs; (ii) WMD; and (iii) NGOs and other service providers.
2.10.2.1 Project Components
Four core principles guide the proposed Gramya II:
(a) the Project would promote bottom-up preparation, implementation, and monitoring of
GPWDPs, which would build GP institutional capacity and develop community-based
organizations;
(b) micro watershed planning covers the entire landscape from mountain ridge to valley floor,
including arable and non-arable lands, reserve forests and inter-GP areas;
(c) watershed treatment is an integral part of rainfed agricultural development, as it supports
increased productivity of rainfed crops by enhancing insitu water efficiency and natural
resource conservation; and
(d) watershed treatment brings new areas under irrigation and improves water availability and
efficiency for currently-irrigated areas, where the Project would support cultivation of
high-value vegetable crops.
2.10.2.2 Sustainability

27
The success of Gramya I was built on its innovative design that decentralized watershed
management, including finance, to GPs. Gramya I provided targeted training to enhance GP
capacity in project management, fiduciary and safeguards compliance, and social accountability.
The participatory approach in GPWDP preparation and implementation also ensured GP
ownership in the GPWDPs and the sustainability of project investments by forming: (a) user
groups for check dams and water harvest structures; (b) VPs for new forest plantations; and (c)
FFs for value-added activities. The proposed Gramya II would continue to strengthen
decentralized watershed management and build local institutional capacity, including GPs, VPs,
water user groups, FIGs, and FFs, which would ensure overall project sustainability.
The project area is spread over 263837 Ha. in 82 MWS (including 1 model MWS)
belonging to 509 Gram Panchayats in 18 Developmental Blocks, of 8 hilly Districts in
Uttarakhand. The project is likely to benefit 55605 households with a population of about 300553.
The project will be implemented through Panchayati Raj institutions with Gram Panchayat as PIA.
2.11 UTTARAKHAND FOREST RESOURCE MANAGEMENT
PROJECT FUNDED BY JICA
(UFRMP-JICA)
PROJECT BACKGROUND
Roughly 80% of the forest area of Uttarakhand State is open and moderately dense as per Forest
Survey of India (FSI) “State of the Forest” Report (2011). The overall goal of the Project is to
contribute to eco-restoration and development of forest resources, by empowering the community
through their improved livelihoods and income generation. To achieve this goal, the Project adopts
the following basic approaches:
a. Empowering forest-fringe communities, particularly women, through sustainable
livelihoods and ensuring positive involvement of rural people in managing their own
environment.
b. Strengthening community institutions such as Van Panchayats and Biodiversity
Management Committees (BMCs)
c. Alleviating poverty of the rural poor through income generating interventions.
d. Planning and implementing site specific technical and scientific forestry interventions,
including soil and moisture conservation, restocking of degraded areas through appropriate
silvi-cultural operations utilizing the inherent potential of available root stock, under
planting with suitable species, block plantations in blank patches.Promoting inter-sectoral
convergence.
e. Interventions to be planned and implemented by Van Panchayats and Biodiversity
Management Committee.

28
f. Capacity Development of the executing agency (Uttarakhand Forest Department) and
other stakeholders, which would contribute to eco-restoration outside Van Panchayat
(Reserved Forests, Civil &Soyam forests, etc.).
g. Promoting forest-based and non-forest-based enterprises (such as the value addition and
marketing of medicinal & aromatic plants, resin, food items such as honey, natural fibers,
natural dyes, utilization of forest biomass, ecotourism, handicrafts, off-season vegetable,
dairy products, etc.) to generate sustainable employment, develop industries and enhance
the value of forests.
h. Caring for the socially disadvantaged groups in the society, such as Scheduled Castes,
Scheduled Tribes, forest dwellers, women and other vulnerable people through proper
safeguard measures as per the JICA guideline and applicable Indian laws and regulations.
i. Utilizing international platforms, such as UN-REDD+, Ramsar Convention, UNESCO
World Heritage Sites (natural), UNESCO Man and Biosphere (MAB) Program, etc. to
draw more resources and generate momentum for conservation.
2.11.1 PROJECT COMPONENTS
ECO-RESTORATION OF DEGRADED FORESTS
This component deals with restoration of degraded forests, especially fringe forest areas,
where the community pressures on forests are beyond sustainable limits. These forests are more
degraded.
LIVELIHOOD DEVELOPMENT AND INCOME GENERATION
This component focusses on raising income levels and other basic human needs of the
community living around these forest fringe areas so that their dependence of forests decreases
and we are able to achieve sustainable management of forests
OTHER SUPPORT ACTIVITIES
This component takes care of logistics required for project implementation.
Uttarakhand Forest Resource Management Project (UFRMP)
2.11.2 TARGET AREA SELECTION
The primary criteria for selection of VanPanchayats for assigning treatment areas are:
The VP must be in the priority ranges of the project.
The VP should have an elected body.
The VP should have given consent to participate in the project.
There should not be any similar on-going intervention.
2.12 GROWTH CENTRES

29
Growth centre scheme has been started in the state by 1800/VII-02(05)- MSME/2018
notification for identified economic activities in specific rural areas, to get the local produce and
services identified at both national and international level and to generate large scale employment
opportunities at the local level. Growth centres for accelerated development can be defined for the
selected area, in which in order to develop backward and forward linkage in which investment
will be decided.
Growth centre can be mainly Product based or Service based. While the centres run there
separated leading financial activities they will be special financial centres.
Objective:
To establish growth centres mainly lead product/ service centres, in which by removing
critical gaps and spreading the financial activity lead to region specific development.
To enable successful entrepreneurs / farming producers / craftsmen and weavers for
successful operation of the micro and small enterprises and service sector enterprises on
cluster based approach, to make their business sustainable.
Capacity development for the creation of collective facility centers, testing labs and other
establishments such as the management of mass supervision programs in micro and small
enterprises.
Installing inventory inputs for select / encouraged venture activity at cluster level such as:
Involvement of new technology, applying inventory linkages for availability of machinery
and equipment, design, packaging and distribution related infrastructure.
For the promotion of entrepreneurial activity, create awareness in the prospective
entrepreneurs towards financial inclusion and incentives schemes available.
Assessment of availability of available product on cluster level, surplus available for
marketing and ensuring the availability of combination and information between the
collector group and the worker of the product for the semi-processed / processed value
to provide market opportunity, business selection, business planning and marketing
seminar to encouraged ventures / products driven at the cluster level.
Development of brand for products, development of packaging and testing lab, general
facility center, design studio, trade center etc. E-marketing for the various facilities and
participation in various national / international fairs
Create employment opportunities through accelerated economic activity at the local level,
curbing the migration of youth.
2.13 PANCHAYATI RAJ
More than 70 percent of India's population lives in villages. Gram Sabha and Gram
Panchayat come into existence from the villagers. Panchayat based rural development and judicial
system has been based since ancient times. In the history of India, the governmental arrangements

30
have been successful, whose Panchayat based judicial system is good. The origin of Gandhiji's
dream of India was also the strength of rural self-government.
Giving a new look to the Panchayat system by the 73rd Constitutional amendment,
Panchayats were given constitutional status. This has opened the way for participation of common
rural communities through Panchayati raj institutions.
Several schemes are being run for the empowerment of panchayats in Uttarakhand state.
These beneficial schemes, which are being operated through the cooperation of the central
government and the state government, have started getting good results. The Panchayati Raj
Department is trying to take the benefits of schemes till the last person of the villages.
2.13.1 14th Central Finance Commission:
In accordance with the recommendations of the 14th Finance Commission, funds are kept
at the disposal of Gram Panchayats, in which, according to the local requirement by the
Panchayats, water supply, sewerage and solid waste management, septage management including
sanitation, drainage, maintenance of community assets, roads, maintenance of footpaths, street
lights and graveyard and cremation grounds and development / construction works are done.
2.13.2 State Finance Commission:
On the basis of the recommendation of the State Finance Commission, the State
Government is getting funds every year which are kept at the disposal of Panchayats. Development
/ construction works are done according to the local requirement by Panchayats from the said
amount. Fourth State Finance Commission has set norms for distribution of funds for panchayats,
35 percent for gram panchayats, 30 percent for village panchayats and distribution of 35 percent
for district panchayats.
In accordance with the standards, amount of honorarium to the elected representatives will
be paid from the fund. The remaining amount will be spent on development works like on water
supply and construction of solid waste management, sewerage management, drainage and
sanitation, maintenance of community assets, construction of State Light, Anganwadi buildings /
additional classroom-rooms etc and community building construction. etc. will be spent on
development works.
2.13.3 GPDP (Gram Panchayat Development plan)
In the wake of the recommendations of the 14th Finance Commission of Panchayati Raj,
Government of India, a decision has been taken to create Gram Panchayat Vikas Yojana for the
utilization of the resources received from all the sources by the Gram Panchayats.
It is to be noted that according to section 15-A of the Uttar Pradesh Panchayat Raj Act, 1947
(as in Uttarakhand), the Gram Panchayat will prepare a development plan for Panchayat area every
year. The State Government has given this scheme the name of "Dr. A. P. J. Abdul Kalam Gram
Badlav Yojana "under which the draft plan of comprehensive and integrated Gram Panchayat
Vikas Yojana will be prepared from the resources available through interactive planning and

31
public participation by the state's village panchayats.” In the Abdul Kalam Gram Badlav Yojana,
participation and activity of the community, especially the Gram Sabha, will be ensured so that
the objectives of social justice and economic development can be met. The GPDP planning
process has to be comprehensive and based on participatory process which involves the full
convergence with Schemes of all related Central Ministries / Line Departments related to 29
subjects enlisted in the Eleventh Schedule of the Constitution. Panchayats have a significant role
to play in the effective and efficient implementation of flagship schemes on subjects of National
Importance for transformation of rural India. Nodal Department for this scheme will be Panchayat
Raj Department. Further, in consonance with the emerging needs of holistic development of the
villages, the Ministry has revised the Model GPDP guidelines issued during 2015 in 2018.
2.13.4 Rajiv Gandhi Panchayat Empowerment Campaign (RGPSA)/
National Village Swaraj Campaign (RGSA)
This scheme started in year 2012-13. It is 75 percent centrally funded and 25 percent state-wise.
In the main components of the scheme at the beginning of the plan
1. Extension of installation facilities in the village panchayats and reconstruction of damaged
buildings and construction of buildings in panchayats in which they are lacking
2. Capacity development and training of elected panchayat office bearers and personnel
3. Preparation of institutional framework for training at state, district and block level
4. Providing computer / networking in Gram Panchayats under e-Panchayat
5. Other innovation activities, etc. were included.
The format of this plan has been changed from year 2015-16. Now under this scheme only
components like development of basic structure for training and training for capacity development
have been included. In this scheme, Rs. 281.96 lakhs were allocated for year
2012-13 and Rs. 2469.01 combined were allocated for year 2013-14 and 2014-15. For the year
2015-16, a plan of Rs. 1259.665 lakhs has been approved, against which the centre has allocated
Rs. 309 lakhs as the first instalment.
2.13.5 Panchayat Empowerment Awards
1. National Gaurav Gram Sabha Award (RGGS) -
This scheme has been started by the Government of India from the year 2011-12. Under the
scheme, every year, the meeting of the Gram Sabha / Gram Panchayat meetings will be held
regularly, for the purpose of organizing social reforms and other remarkable works related to them.
On the basis of the activities of the Gram Sabha, the selection for the award is done.
2. Panchayat Empowerment Award (PSP) -
This scheme has been started in the form of Panchayat Empowerment and Accountability
Incentive Scheme from the year 2011-12 to make Panchayats strong and responsive by the
Ministry of Panchayati Raj, Government of India. It is currently being run by the Government of

32
India as a Panchayat Empowerment Award (PSP) scheme. The main purpose of this scheme is to
undertake excellent works such as regular meetings of Gram Sabha / Gram Panchayat, Panchayat
tax collection, panchayats to increase their income from their own sources and to create income
generating assets, pure drinking water, street lighting, water in Panchayat area, drainage, sanitation
etc., 100% registration of births, registration of children's school and Anganwadi centers, and
100% vaccination of children, plantations, pollution control, improving sex ratios, stop domestic
violence, to foster a spirit of healthy competition in panchayats encouraging Panchayats
transparency in education and public distribution and proper implementation of duties and
functions . Under this scheme, all three level Panchayats (1 Zilla Panchayat, 02 Kshetra Panchayat
and 04 Gram Panchayat) doing excellent works are selected on the basis of a prescribed procedure
every year.
3. MGNREGS Awards -
Gram Panchayats, who are doing good work in the implementation of the MGNREGA
scheme, are awarded under the scheme. This award is given by the Ministry of Rural
Development, Government of India, on the recommendations of the Indian Council of Panchayati
Raj.
2.13.6 Panchayat Building Construction
Out of 7950 Gram Panchayats in Uttarakhand, presently, Panchayat Buildings have been
constructed in 6816 Gram Panchayats whereas 1134 Gram Panchayats are without Panchayat.
Panchayat Bhawans have been constructed in the previous years under the departmental scheme
Panchayat Bhawan Building / centrally funded scheme, Rajiv Gandhi Panchayat Empowerment
Campaign (RGPSA).
2.13.7 Area Panchayat Development Fund
For the purpose of getting equal work in Regional constituencies of the area Panchayat, the
funds are sanctioned by the government under this scheme. In accordance to the announcement of
Chief Minister, in the year 2005-06, every year, funds have been allocated at the rate of Rs.25
lakh per development block for development works in the Panchayats. In the year 2012-13, a
decision was made to provide a total of Rs 33.25 crore to the panchayats at the rate of Rs 35 lakh
per development block, but in the year 2015-16, only 720 lakhs was allocated. From this amount
development works of all 3266 Area Panchayats have been done.
2.14 COOPERATIVES
Co-operatives are enterprises that put people at the Centre of their business and not capital.
Co-operatives are business enterprises and thus can be defined in terms of three basic interests:
ownership, control, and beneficiary. Only in the co-operative enterprise are all three interests
vested directly in the hands of the user.
A co-operative is an autonomous association of persons united voluntarily to meet their
common economic, social, and cultural needs and aspirations through a jointly-owned and
democratically-controlled enterprise.

33
Panchayat Raj institutions and cooperative sector can bring about positive change in the
rural areas. Cooperatives have extended across the entire country and there are currently estimated
230 million members nationwide. The cooperative credit system has the largest network in the
world and cooperatives have advanced more credit in the Indian agricultural sector than
commercial banks. In fertilizer production and distribution the Indian Fertilizer Cooperative
commands over 35% of the market. In the production of sugar the cooperative share of the market
is over 58% and in cotton they have share of about 60%.The cooperative sector accounts for 55%
of the looms in the hand-weaving sector. (source: Indian Cooperative Movement:A Statistical
Profile– 2016, National Cooperative union of India)
(Table 2.1 Source: Indian Cooperative Movement:A Statistical Profile– 2018, National
Cooperative union of India)
34
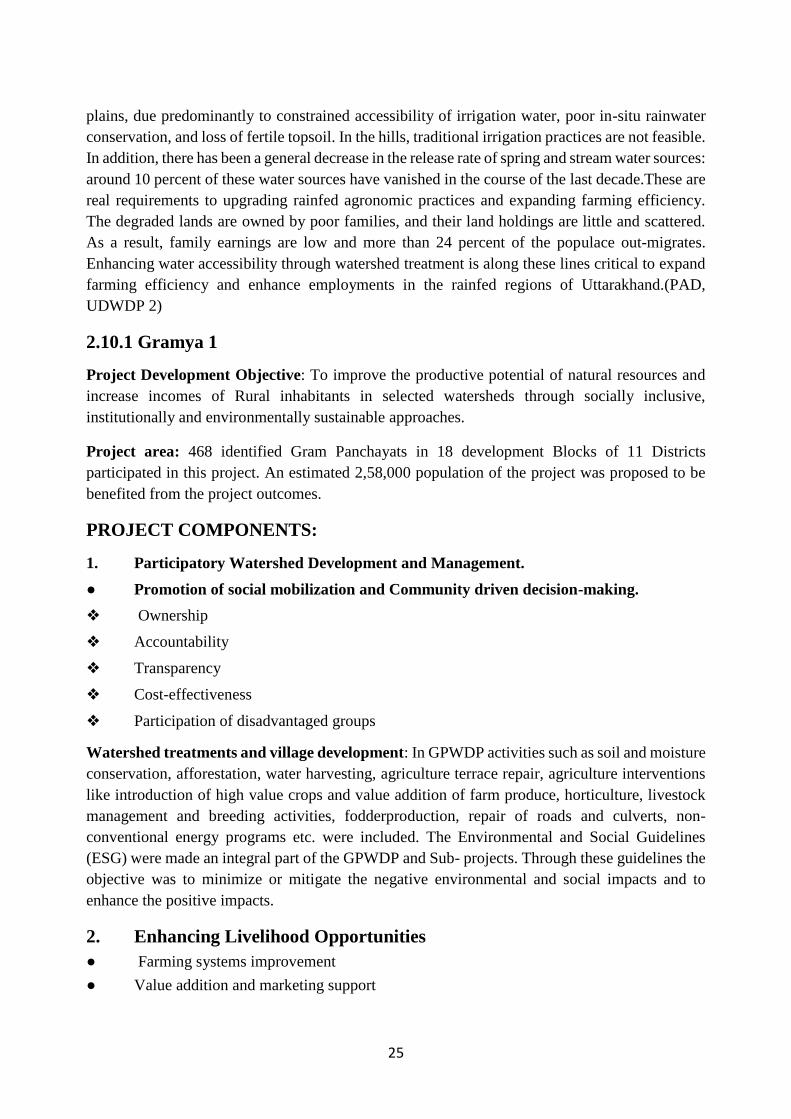
Table 2.2( Source Indian Cooperative Movement:A Statistical Profile– 2018, National
Cooperative union of India)
2.14.1 Cooperatives in Uttarakhand
The aim of the Co-operative department of the Uttarakhand government is:
Taking the Co-operative Movement to the Public
Providing accessible agricultural loans to farmers on low interest rates.
Timely supply of agriculturalinputs.
Giving the farmers a fair price for their produce.
Co-operative societies provide loans to the members according to their requirements, non-
agricultural loans such as education, health, social obligations.

35
Freeing the farmers from the moneylenders
Creation of self-employment through cooperatives.
Implementation of public interest policies of the government through co-operative
institutions.
Making available consumer goods in remote and rural areas at reasonable rates.
Purchase and marketing of agricultural produce through co-operative institutions.
Generating employment by allotting the work to labor committees up to Rs 2.00 lakhs
without tender.
Autonomy of Cooperatives.
Formation of 1042 Autonomous Cooperatives.
Establishment of District Cooperative Banks in all the districts.
Make co-operative societies self-reliant.
Converting PACs (Primary Agricultural Credit Society) as a multipurpose institution in a
phased manner.
Incentives for tourism to rural communities.
2.14.2 Uttarakhand Co-operative Societies Act-2003-A Glimpse
There is no mandate of separate agricultural and rural development bank in the Act.
Urban banks were defined in Section 2.
The provisions of section 3 (3) of the Act are given in elaborate form.
International principles of cooperatives were adopted under Section 4.
The system of representation when the committee is not registered by the Registrar.
Provision for self-help groups and students to get membership of committees under
Section 17
The provision to make a sympathetic member is over.
Managing committees office term made five years (97th Constitution Amendment)
The provision of nominating maximum 1 non-governmental members in the managing
committee.
Section 30 (a) Provision of proposal for distrust against the Chairman and Deputy
Chairman.
The provision of appointment of experienced bank officers to the top co-operative bank in
the Section 31 (a).
Increase in the limits of the financial rights of the managing director.
Section 35 (a) the recovery percentage for the outstanding amount was made 60 percent.
The involvement of the state government was defined.

36
Auditing procedure can be done through chartered accountants
The provision of determining and exemption of audit fees
Section 71 (6) Provision of ensuring compulsory attendance and giving oath and
affirmation on affidavits
Section 71 (a) Provision of direct action against the defaulters of the funding committee /
bank funded committee.
Section 74 (b) the provision for disposal of the remaining properties of the Committee,
which is to be terminated in the pre-Act.
Section 77 for the formation of cooperative agricultural committees.
The appeal date was increased to 45 days instead of 30 days against the adjudication of
Section 97.
Section 98 of other appeals, orders, and decisions were made to extend appeals against a
period of 30 day to 45 days.
Section 103 an increase in penalties of various types.
Section 104 has been increased from Rs 500 to Rs 1000 for the offense of crime and in
case of continued crime was increased from 10 rupees per day to 100 rupees per day.
Section 116 Co-operation to be developed in the form of participation and joint disclosure.
The provision of the enforcement of subsidiary organizations under section 117.
Section 118 of the Reconstruction Council comprising seven members.
The provision of participation of the Chairman / Operations Board in the appointment
process.
The rural economy in Uttarakhand and in particular in the hilly region of the state is
marked by disaggregated farming, marginal land holding patterns, traditional methods of farming
without any access to organized markets for the farm products. The supply chain logistics are
either absent or not being utilized in the manner that’s desired for effective transportation
mechanism for the perishable farm products. The farmers resort to either subsistence farming or
selling at local markets at extremely low prices.
Cooperatives have the potential to play significant role in agriculture and allied sectors for
enhanced welfare of farmers. The co-operatives in Uttarakhand have been made Multi-Purpose
Primary Societies and could be a fulcrum of large spectrum of legal business activities.
State cooperative societies Act (2003), defines a co-operative society, process of
registration for a cooperative society and role of a registrar, members of the cooperative society
and their rights and liabilities, management of societies, state aid to cooperative societies,
properties and funds of cooperative societies; audit, inquiry, inspection, surcharge and settlement
of disputes; winding up and dissolution of cooperative society; cooperative farming societies,
insured cooperative banks and formation and role of Uttaranchal State cooperative council.

37
2.14.3 Cooperative partnership Plan
In the state of Uttarakhand, co-operatives have been initiated to provide financial
assistance by slashing interest rates on cooperative loans taken by small and marginal farmers and
families below poverty line with the aim of providing dynamism to the cooperative movement.
The scheme provides loans like crop loans, industrial loans, tractor loan, housing loans, silk
production, animal husbandry loans, etc. Under the scheme loan at low interest rate for small and
marginal farmers and farmers below poverty line is being provided. Interest relief is being
provided on loans distributed under the Cooperative engagement plan.
2.14.4 Cooperative loans and Adhikoshan Yojana
This scheme helps in the successful implementation of various agricultural production
programmes. Currently, the cooperative credit committees are providing the means for
agricultural production credit, fertilizers, seeds, pesticide drugs, etc. to their farmers ' members.
In addition, it also aims at helping people from the weaker sections of the society to not remain
marginalized and at least 30 percent of the loan is to be provided to this category. The mini banks
are also being operated in agricultural credit committees through district cooperative banks in the
state. The State has 5 urban cooperative banks of which the Municipal Bank of Nainital and
Almora are doing well, giving people opportunities for job creation in the urban areas. Salaried
cooperatives have been constituted in their institutions for facilitating salaried staff who are being
provided credit facility to their members. The economic status of maximumsalaried committees
is strong. The following grants are made under this program:
1. Common Cadre Grants for the salary of PACS(Primary Agricultural Cooperative
Societies) Secretaries
2. Interest free loan / grant for purchase of shares of SC / ST members
3. Grants for Reimbursement of Losses to Initial Agricultural Credit Societies
4. Administrative and maintenance Grant for the establishment of Mini Bank for the
Agricultural Co-operative Credit Societies
5. Grants for interest relief to SC / ST members
6. Margin money to women savings group
7. Financial Assistance for setting up and training women savings groups
2.14.5 Cooperative deal plan
It has been implemented by the Department to provide proper market to the farmers near
their village for their produce, ensuring a fair price to them and protect them from various
exploitations of the market. The following are the main plans under this program:
1- Grant for repair of damaged warehouses of PACs-
On the basis of appraisal, the financial assistance is provided for the repair of damaged
warehouse.
2- Grants-in-aid for re-purchase of commodities-

38
The weak Purchasing Committees are provided financial assistance only once for re-
establishment.
3- Grant to PACs to Build Warehouse-
PACs are provided financial assistance for the construction of warehouse on the basis of
appraisal.
4- Grant to PACs / LAMPs (Large Area Multi-Purpose Societies) for rural Godown
buildings to construct boundary wall. In the district plan, financial assistance is provided
for construction of boundary wall for the safety of rural Godowns.
2.14.6 Customer Cooperative Plan
The scheme has been started in the state with the aim of eliminating economic complexities
and artificial shortage of daily use items. It also aims to maintain continuous supply and provide
high quality daily consumer goods. Keeping in view the special economic conditions of
Uttarakhand, the initiatives of cooperative consumer stores have made significant contribution in
preventing rising prices and availability of goods at reasonable prices to the consumers.Through
the consumer stores and their branches, the supply of consumer goods to the local public is being
done at reasonable prices
2.14.7 Cooperative Education, Training and Dissemination
Cooperative training college in Uttarakhand, Rajpur is functioning in Dehradun for
cooperative training to staff, officers and other stakeholders. Cooperative Training Center
organizes cooperative seminars and spreads awareness to the local public about the facilities
available to cooperative societies.
2.14.8 Fertilizer transport subsidy
In the hilly areas of the state, the retail centers are so distant from the railheads that if the
fertilizer is continued to be supplied under regular arrangement, the prices for remote areas will
increase and sale of fertilizer cannot be done at the same price at all places, as the policy mandates.
Keeping the above situation in mind, of the expenditure incurred in the supply of fertilizer from
the railway head to the committee sales centers, Rs. 10 per tonne will be borne by transport
expenditure organization. Remaining amount is demanded from the government and is provided
in the form of grant. Apart from this, due to the increase in fertilizer rates, transport subsidies
should be given on the distribution of fertilizers in the plains so that fertilizers can be distributed
to the farmers in accordance to their requirement. Under the scheme, subsidy on fertilizer transport
is proposed to be provided in the plain areas like the hilly regions. The said scheme is directly
linked to the farmers / wage earners, thereby increasing their opportunities for self-employment.

39
REFERENCES:
Department of Cooperatives, Uttarakhand
Department of Panchayati Raj, Uttarakhand
http://ddugky.gov.in/
http://jicauttarakhand.org/
http://nsap.nic.in/
http://rurban.gov.in/
http://saanjhi.gov.in/
http://uk.gov.in/
http://uk.gov.in/files/Uttarakhand_at_a_glance-final_2013-14.pdf
http://ukrd.uk.gov.in/pages/display/91-pradhan-mantri-awaas-yojana-gramin
https://aajeevika.gov.in/
https://rhreporting.nic.in/netiay/newreport.aspx
https://shodhganga.inflibnet.ac.in/bitstream/10603/20735/9/09_chapter%203.pdf
https://www.nrega.nic.in/netnrega/mgnrega_new/Nrega_home.aspx
https://www.sciencedirect.com/science/article/pii/S1574008087800147
https://www.soas.ac.uk/cedep-demos/000_P530_RD_K3736-
Demo/module/pdfs/p530_unit_01.pdf
ILSP.in
Implementation Completion Report, Gramya 1
Indian Cooperative Movement:A Statistical Profile – 2016, National Cooperative union of
India
pmgsy.nic.in
Project Appraisal Document, UDWDP 2
Study Report on Assessment of Convergence Activities under MGNREGA in
Uttarakhand, IIT Roorkee , NIRDPR(2018)

40
Chapter 3
CURRENT STATUS OF THE SCHEMES OF RURAL
DEVELOPMENT DEPARTMENT
In this Chapter, the current status of the schemes of the Rural Development Department of
Uttarakhand has been presented.
3.1 Mahatma Gandhi National Employment Guarantee Act ( MGNREGA)
A total number of 10.82 lakh job cards have been issued of which a total number of 7.09 lakh job
cards are active (March, 2019). A total number of 9.77 lakh workers are active in the state of 17.48
lakh workers. Of the total active workers 17.34% are SC and 3.91% are ST.
4.89 lakh households have been provided work with a total of 221.83 lakh man days generated in
2018-2019. The total works taken up in 2018-19 are 1.42 lakh of which 80,081 have been
completed and 0.62 lakh are still in progress.
A total of 4,62,575 assets have been created in Uttarakhand till date 4-5-2019.
A district wise distribution of MGNREGA details is given below:
Table 3.1 State : UTTARAKHAND
District : ALMORA As on 15-04-2019
Total No. of Blocks 11
Total No. of GPs 1,168
I Job Card
Total No. of Job Cards issued [In Lakhs] 1
Total No. of Workers [In Lakhs] 2.1
Total No. of Active Job Cards [In
Lakhs] 0.53
Total No. of Active Workers [In Lakhs] 0.76
(i) SC worker against active workers
[%] 21.29
(ii) ST worker against active workers
[%] 0.09
II Progress FY 2018-
2019
FY
2017-2018
FY 2016-
2017
FY
2015-2016

41
Approved Labour Budget [In Lakhs] 13.08 14 10 9.74
Persondays Generated so far [In Lakhs] 13.52 14.14 11.77 12.99
% of Total LB 103.36 100.98 117.76 133.41
% as per Proportionate LB
SC persondays % as of total persondays 21.22 21.07 21.64 19.73
ST persondays % as of total persondays 0.13 0.08 0.09 0.09
Women Persondays out of Total (%) 57.88 57.61 56.28 54.57
Average days of employment provided
per Household 39.74 38.03 32.73 31.71
Average Wage rate per day per
person(Rs.) 175 174.98 173.98 160.99
Total No of HHs completed 100 Days of
Wage Employment 1,291 1,124 1,427 851
Total Households Worked[In Lakhs] 0.34 0.37 0.36 0.41
Total Individuals Worked[In Lakhs] 0.46 0.5 0.46 0.5
Differently abled persons worked 50 42 13 20
III Works
Number of GPs with NIL exp 72 38 16 75
Total No. of Works Takenup
(New+Spill Over)[In Lakhs] 0.08 0.11 0.1 0.07
Number of Ongoing Works[In Lakhs] 0.03 0.04 0.06 0.05
Number of Completed Works 4,356 6,789 4,449 2,156
% of NRM Expenditure(Public +
Individual) 67.5 58.61 46.62 39.58
% of Category B Works 36.65 24.73 14.2 9.4
% of Expenditure on Agriculture &
Agriculture Allied Works 75.78 72.3 53.44 41.71
Table 3.2 State : UTTARAKHAND
District : BAGESHWAR As on 15-04-2019
Total No. of Blocks 3
Total No. of GPs 416

42
I Job Card
Total No. of JobCards issued [In Lakhs] 0.47
Total No. of Workers [In Lakhs] 0.78
Total No. of Active Job Cards [In Lakhs] 0.31
Total No. of Active Workers [In Lakhs] 0.45
(i)SC worker against active workers [%] 27.29
(ii)ST worker against active workers [%] 0.57
II Progress FY 2018-
2019
FY 2017-
2018
FY 2016-
2017
FY 2015-
2016
Approved Labour Budget [In Lakhs] 7.27 7.65 9.46 9.21
Persondays Generated so far [In Lakhs] 8.1 8.69 11.11 9.97
% of Total LB 111.47 113.55 117.49 108.24
% as per Proportionate LB
SC persondays % as of total persondays 23.71 26.79 27.93 27.54
ST persondays % as of total persondays 0.73 0.49 0.55 0.53
Women Persondays out of Total (%) 53.87 52.27 49.97 47.93
Average days of employment provided
per Household 43.91 42.22 45.45 42.32
Average Wage rate per day per
person(Rs.) 174.99 174.99 173.94 160.97
Total No of HHs completed 100 Days of
Wage Employment 904 531 2,163 1,208
Total Households Worked[In Lakhs] 0.18 0.21 0.24 0.24
Total Individuals Worked[In Lakhs] 0.25 0.28 0.33 0.29
Differently abled persons worked 83 20 21 19
III Works
Number of GPs with NIL exp 1 0 0 1
Total No. of Works Takenup (New+Spill
Over)[In Lakhs] 0.06 0.08 0.1 0.04
Number of Ongoing Works[In Lakhs] 0.02 0.04 0.05 0.03
Number of Completed Works 3,365 4,969 4,485 1,340
% of NRM Expenditure(Public +
Individual) 55.5 43.89 40.68 56.52
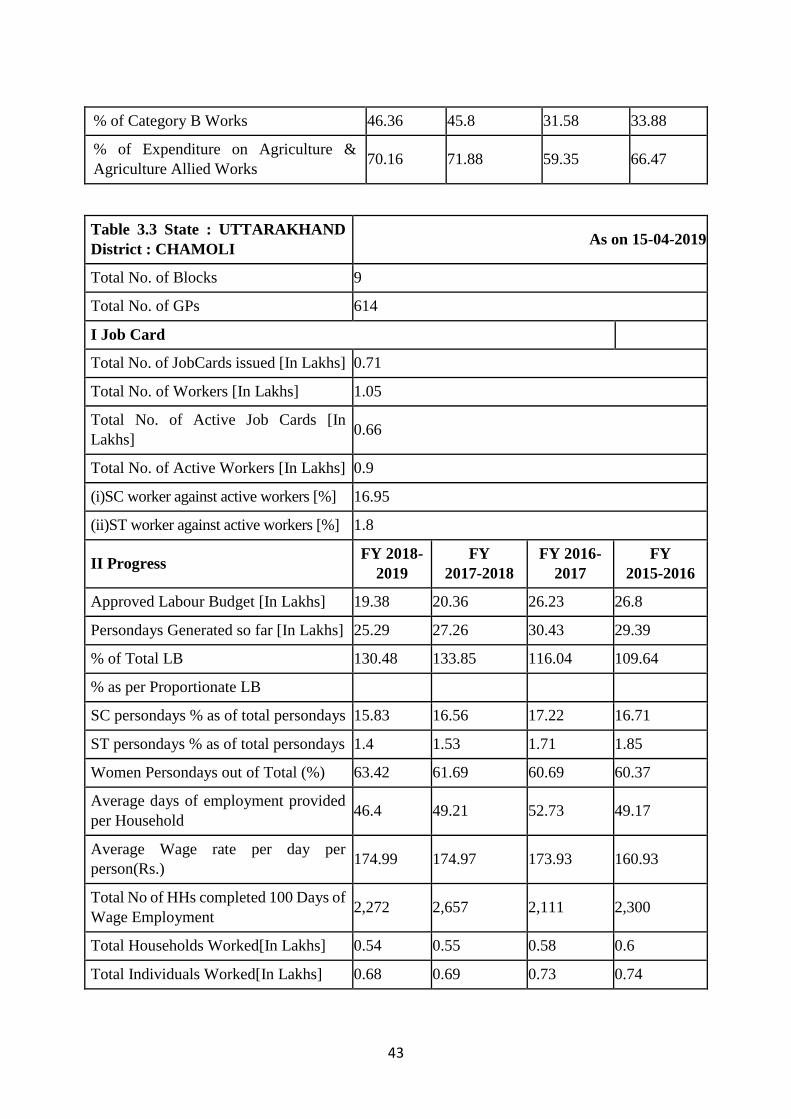
43
% of Category B Works 46.36 45.8 31.58 33.88
% of Expenditure on Agriculture &
Agriculture Allied Works 70.16 71.88 59.35 66.47
Table 3.3 State : UTTARAKHAND
District : CHAMOLI As on 15-04-2019
Total No. of Blocks 9
Total No. of GPs 614
I Job Card
Total No. of JobCards issued [In Lakhs] 0.71
Total No. of Workers [In Lakhs] 1.05
Total No. of Active Job Cards [In
Lakhs] 0.66
Total No. of Active Workers [In Lakhs] 0.9
(i)SC worker against active workers [%] 16.95
(ii)ST worker against active workers [%] 1.8
II Progress FY 2018-
2019
FY
2017-2018
FY 2016-
2017
FY
2015-2016
Approved Labour Budget [In Lakhs] 19.38 20.36 26.23 26.8
Persondays Generated so far [In Lakhs] 25.29 27.26 30.43 29.39
% of Total LB 130.48 133.85 116.04 109.64
% as per Proportionate LB
SC persondays % as of total persondays 15.83 16.56 17.22 16.71
ST persondays % as of total persondays 1.4 1.53 1.71 1.85
Women Persondays out of Total (%) 63.42 61.69 60.69 60.37
Average days of employment provided
per Household 46.4 49.21 52.73 49.17
Average Wage rate per day per
person(Rs.) 174.99 174.97 173.93 160.93
Total No of HHs completed 100 Days of
Wage Employment 2,272 2,657 2,111 2,300
Total Households Worked[In Lakhs] 0.54 0.55 0.58 0.6
Total Individuals Worked[In Lakhs] 0.68 0.69 0.73 0.74

44
Differently abled persons worked 251 253 288 285
III Works
Number of GPs with NIL exp 1 1 1 2
Total No. of Works Takenup
(New+Spill Over)[In Lakhs] 0.23 0.31 0.29 0.15
Number of Ongoing Works[In Lakhs] 0.11 0.13 0.18 0.09
Number of Completed Works 12,258 18,005 10,367 5,608
% of NRM Expenditure(Public +
Individual) 64.55 50.09 48.05 65.85
% of Category B Works 34.62 38.65 22.83 2.93
% of Expenditure on Agriculture &
Agriculture Allied Works 61.5 67.33 61.87 66.24
Table3.4 State:UTTARAKHAND
District : CHAMPAWAT As on 15-04-2019
Total No. of Blocks 4
Total No. of GPs 313
I Job Card
Total No. of JobCards issued
[In Lakhs] 0.32
Total No. of Workers[In Lakhs] 0.44
Total No. of Active Job Cards[In Lakhs] 0.26
Total No. of Active Workers[In Lakhs] 0.33
(i)SC worker against active workers[%] 15.76
(ii)ST worker against active workers[%] 0.19
II Progress FY 2018-
2019
FY
2017-2018
FY
2016-2017
FY 2015-
2016
Approved Labour Budget[In Lakhs] 6.08 6.26 8.18 8.18
Persondays Generated so far[In Lakhs] 9.17 9.1 9.34 8.96
% of Total LB 150.79 145.46 114.13 109.49
% as per Proportionate LB
SC persondays % as of total persondays 16.29 15.62 16.14 16.6

45
ST persondays % as of total persondays 0.18 0.23 0.13 0.08
Women Persondays out of Total (%) 45.64 43.54 42.71 37.79
Average days of employment provided
per Household 50.53 46.74 45.99 46.13
Average Wage rate per day per
person(Rs.) 174.99 175 173.99 160.99
Total No of HHs completed 100 Days of
Wage Employment 2,150 1,666 1,667 781
Total Households Worked[In Lakhs] 0.18 0.19 0.2 0.19
Total Individuals Worked[In Lakhs] 0.23 0.25 0.25 0.23
Differently abled persons worked 29 31 34 25
III Works
Number of GPs with NIL exp 0 0 1 20
Total No. of Works Takenup (New+Spill
Over)[In Lakhs] 0.05 0.08 0.06 0.04
Number of Ongoing Works[In Lakhs] 0.02 0.03 0.04 0.02
Number of Completed Works 3,501 4,327 1,895 1,857
% of NRM Expenditure(Public +
Individual) 71.11 59.67 56.8 57.54
% of Category B Works 35.72 36.33 28.38 18.77
% of Expenditure on Agriculture &
Agriculture Allied Works 79.82 72.39 65.27 61.01
Table 3.5 State : UTTARAKHAND
District : DEHRADUN As on 15-04-2019
Total No. of Blocks 6
Total No. of GPs 462
I Job Card
Total No. of JobCards issued [In Lakhs] 0.6
Total No. of Workers [In Lakhs] 0.95
Total No. of Active Job Cards [In Lakhs] 0.4
Total No. of Active Workers [In Lakhs] 0.51

46
(i) SC worker against active workers[%] 21.42
(ii) ST worker against active
workers[%] 32.64
II Progress FY 2018-
2019
FY 2017-
2018
FY 2016-
2017
FY
2015-2016
Approved Labour Budget [In Lakhs] 15.11 14 8.86 8.63
Persondays Generated so far [In Lakhs] 14.54 15.47 15.67 13.71
% of Total LB 96.23 110.48 176.83 158.8
% as per Proportionate LB
SC persondays % as of total persondays 22.9 23.86 25.51 26.66
ST persondays % as of total persondays 36.81 41.68 41.51 42.13
Women Persondays out of Total (%) 31.79 31.68 27.88 23.46
Average days of employment provided
per Household 54.54 54.34 53.08 52.82
Average Wage rate per day per person
(Rs.) 174.99 174.98 173.99 160.97
Total No of HHs completed 100 Days of
Wage Employment 2,975 2,777 1,818 1,925
Total Households Worked [In Lakhs] 0.27 0.28 0.3 0.26
Total Individuals Worked [In Lakhs] 0.33 0.36 0.36 0.31
Differently abled persons worked 18 26 19 20
III Works
Number of GPs with NIL exp 46 28 48 112
Total No. of Works Takenup
(New+Spill Over)[In Lakhs] 0.08 0.11 0.09 0.04
Number of Ongoing Works[In Lakhs] 0.03 0.05 0.05 0.02
Number of Completed Works 4,583 6,202 3,533 2,086
% of NRM Expenditure(Public +
Individual) 77.08 73.95 70.66 62.06
% of Category B Works 39.61 30.38 10.65 2.72
% of Expenditure on Agriculture &
Agriculture Allied Works 66.98 81.99 71.38 62.07

47
Table 3.6 State : UTTARAKHAND
District :HARIDWAR As on 15-04-2019
Total No. of Blocks 6
Total No. of GPs 306
I Job Card
Total No. of Job Cards issued [In
Lakhs] 1.68
Total No. of Workers [In Lakhs] 2.09
Total No. of Active Job Cards [In
Lakhs] 0.52
Total No. of Active Workers [In Lakhs] 0.65
(i)SC worker against active workers[%] 19.74
(ii)ST worker against active
workers[%] 0.25
II Progress FY 2018-
2019
FY
2017-2018
FY 2016-
2017
FY 2015-
2016
Approved Labour Budget [In Lakhs] 9.79 10.34 8.27 8.05
Persondays Generated so far [In Lakhs] 13.11 10.53 9.69 11.01
% of Total LB 133.89 101.83 117.22 136.77
% as per Proportionate LB
SC persondays % as of total persondays 18.27 20.81 23.87 23.44
ST persondays % as of total persondays 0.13 0.13 0.7 0.35
Women Persondays out of Total (%) 32.92 31.9 31.23 20.12
Average days of employment provided
per Household 42.89 37.36 39.16 49.68
Average Wage rate per day per
person(Rs.) 175 175 173.95 160.91
Total No of HHs completed 100 Days
of Wage Employment 746 464 101 1,582
Total Households Worked[In Lakhs] 0.31 0.28 0.25 0.22
Total Individuals Worked[In Lakhs] 0.37 0.34 0.3 0.25

48
Differently abled persons worked 24 14 15 10
III Works
Number of GPs with NIL exp 1 1 3 43
Total No. of Works Taken up
(New+Spill Over) [In Lakhs] 0.1 0.12 0.09 0.05
Number of Ongoing Works [In Lakhs] 0.04 0.05 0.05 0.02
Number of Completed Works 5,934 6,942 3,688 2,613
% of NRM Expenditure (Public +
Individual) 68.47 41.37 48.28 53.74
% of Category B Works 25.43 25.19 17.36 34.38
% of Expenditure on Agriculture &
Agriculture Allied Works 73.84 51.92 51.81 56.83
Table 3.7 State : UTTARAKHAND
District : NAINITAL As on 15-04-2019
Total No. of Blocks 8
Total No. of GPs 517
I Job Card
Total No. of JobCards issued[In Lakhs] 0.58
Total No. of Workers[In Lakhs] 0.96
Total No. of Active Job Cards[In
Lakhs] 0.36
Total No. of Active Workers[In Lakhs] 0.56
(i)SC worker against active workers[%] 20.18
(ii)ST worker against active
workers[%] 0.54
II Progress
FY
2018-
2019
FY
2017-2018
FY
2016-2017
FY
2015-2016

49
Approved Labour Budget[In Lakhs] 8.64 12.06 8.61 8.38
Persondays Generated so far[In Lakhs] 10.8 10.18 11.32 9.79
% of Total LB 125 84.41 131.55 116.74
% as per Proportionate LB
SC persondays % as of total persondays 18.89 20.08 21.25 22.25
ST persondays % as of total persondays 0.47 0.89 0.88 0.99
Women Persondays out of Total (%) 41.45 39.52 36.62 33.53
Average days of employment provided
per Household 46.82 45.81 48.93 46.48
Average Wage rate per day per
person(Rs.) 174.99 175 173.98 161.02
Total No of HHs completed 100 Days
of Wage Employment 1,105 956 2,549 1,515
Total Households Worked[In Lakhs] 0.23 0.22 0.23 0.21
Total Individuals Worked[In Lakhs] 0.36 0.34 0.33 0.28
Differently abled persons worked 31 40 29 20
III Works
Number of GPs with NIL exp 23 23 25 45
Total No. of Works Takenup
(New+Spill Over)[In Lakhs] 0.12 0.1 0.09 0.04
Number of Ongoing Works[In Lakhs] 0.06 0.05 0.04 0.02
Number of Completed Works 5,926 5,528 4,825 1,913
% of NRM Expenditure(Public +
Individual) 57.11 54.72 48.12 45.62
% of Category B Works 51.72 41.59 19.55 9.53
% of Expenditure on Agriculture &
Agriculture Allied Works 80.25 80.84 56.63 48.37
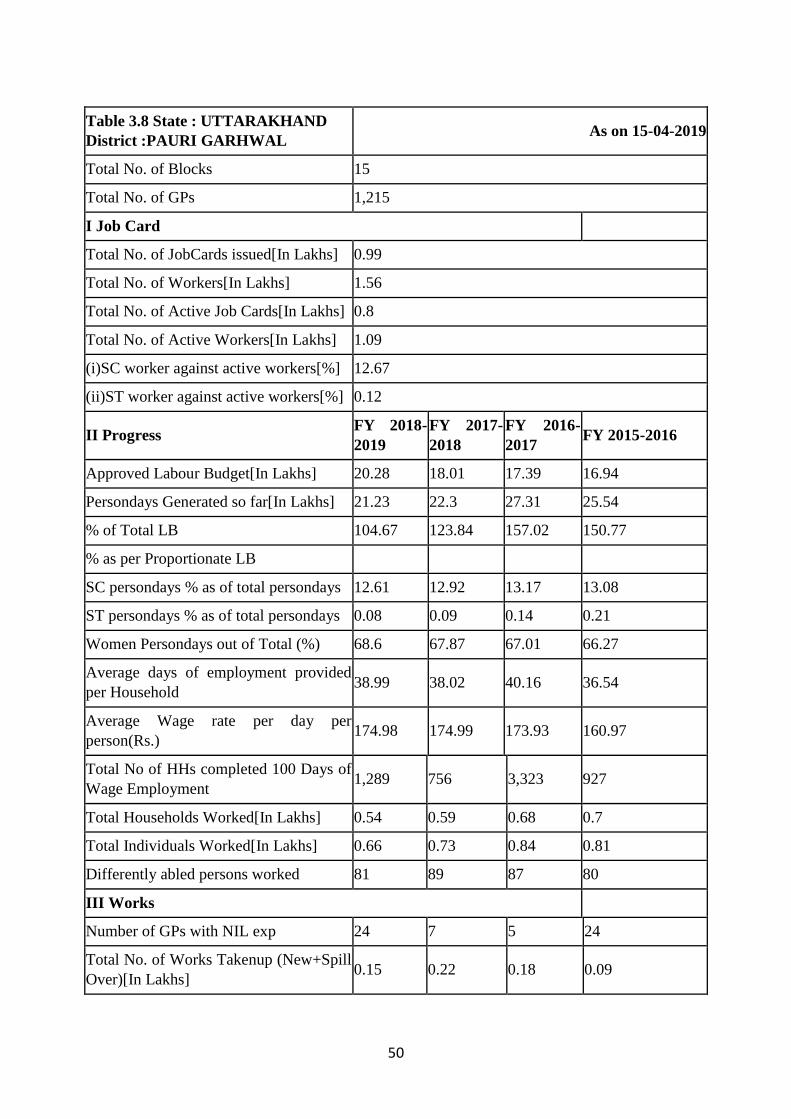
50
Table 3.8 State : UTTARAKHAND
District :PAURI GARHWAL As on 15-04-2019
Total No. of Blocks 15
Total No. of GPs 1,215
I Job Card
Total No. of JobCards issued[In Lakhs] 0.99
Total No. of Workers[In Lakhs] 1.56
Total No. of Active Job Cards[In Lakhs] 0.8
Total No. of Active Workers[In Lakhs] 1.09
(i)SC worker against active workers[%] 12.67
(ii)ST worker against active workers[%] 0.12
II Progress FY 2018-
2019
FY 2017-
2018
FY 2016-
2017 FY 2015-2016
Approved Labour Budget[In Lakhs] 20.28 18.01 17.39 16.94
Persondays Generated so far[In Lakhs] 21.23 22.3 27.31 25.54
% of Total LB 104.67 123.84 157.02 150.77
% as per Proportionate LB
SC persondays % as of total persondays 12.61 12.92 13.17 13.08
ST persondays % as of total persondays 0.08 0.09 0.14 0.21
Women Persondays out of Total (%) 68.6 67.87 67.01 66.27
Average days of employment provided
per Household 38.99 38.02 40.16 36.54
Average Wage rate per day per
person(Rs.) 174.98 174.99 173.93 160.97
Total No of HHs completed 100 Days of
Wage Employment 1,289 756 3,323 927
Total Households Worked[In Lakhs] 0.54 0.59 0.68 0.7
Total Individuals Worked[In Lakhs] 0.66 0.73 0.84 0.81
Differently abled persons worked 81 89 87 80
III Works
Number of GPs with NIL exp 24 7 5 24
Total No. of Works Takenup (New+Spill
Over)[In Lakhs] 0.15 0.22 0.18 0.09

51
Number of Ongoing Works[In Lakhs] 0.08 0.07 0.11 0.04
Number of Completed Works 7,205 15,021 7,587 4,882
% of NRM Expenditure(Public +
Individual) 66.89 56.03 56.49 50.21
% of Category B Works 31.42 28.63 22.95 6.38
% of Expenditure on Agriculture &
Agriculture Allied Works 67.89 68.72 65.3 51.26
Table 3.9 State : UTTARAKHAND
District :PITHORAGARH As on 15-04-2019
Total No. of Blocks 8
Total No. of GPs 691
I Job Card
Total No. of JobCards issued[In Lakhs] 0.63
Total No. of Workers[In Lakhs] 1.11
Total No. of Active Job Cards[In Lakhs] 0.52
Total No. of Active Workers[In Lakhs] 0.87
(i)SC worker against active workers[%] 21.87
(ii)ST worker against active workers[%] 3.24
II Progress FY 2018-
2019
FY 2017-
2018
FY
2016-2017
FY
2015-2016
Approved Labour Budget[In Lakhs] 17.38 13.01 18.05 18.15
Persondays Generated so far[In Lakhs] 19.34 17.13 18.66 17.49
% of Total LB 111.3 131.69 103.36 96.34
% as per Proportionate LB
SC person days % as of total persondays 21.21 21.63 22.95 22.1
ST persondays % as of total persondays 1.86 2.98 4.08 3.39
Women Persondays out of Total (%) 49.56 48.42 47.98 44.79
Average days of employment provided
per Household 52.55 45.22 43.2 39.6
Average Wage rate per day per
person(Rs.) 174.98 174.98 173.99 160.95

52
Total No of HHs completed 100 Days of
Wage Employment 3,904 1,852 3,402 1,843
Total Households Worked[In Lakhs] 0.37 0.38 0.43 0.44
Total Individuals Worked[In Lakhs] 0.59 0.59 0.67 0.66
Differently abled persons worked 121 146 157 198
III Works
Number of GPs with NIL exp 2 0 0 7
Total No. of Works Takenup
(New+Spill Over)[In Lakhs] 0.16 0.21 0.21 0.13
Number of Ongoing Works[In Lakhs] 0.06 0.08 0.13 0.09
Number of Completed Works 9,884 12,390 8,070 4,297
% of NRM Expenditure(Public +
Individual) 65.89 58.53 50.91 55.36
% of Category B Works 38.48 28.21 16.39 8.89
% of Expenditure on Agriculture &
Agriculture Allied Works 77.86 72.42 60.61 60.52
Table 3.10 State : UTTARAKHAND
District :RUDRA PRAYAG As on 15-04-2019
Total No. of Blocks 3
Total No. of GPs 339
I Job Card
Total No. of JobCards issued[In Lakhs] 0.48
Total No. of Workers[In Lakhs] 0.78
Total No. of Active Job Cards[In Lakhs] 0.34
Total No. of Active Workers[In Lakhs] 0.5
(i)SC worker against active workers[%] 16.65
(ii)ST worker against active workers[%] 0.02
II Progress FY
2018-2019
FY
2017-2018
FY
2016-2017
FY
2015-2016
Approved Labour Budget[In Lakhs] 11.09 7.46 9.53 9.28
Persondays Generated so far[In Lakhs] 11.79 11.59 10.49 11.04
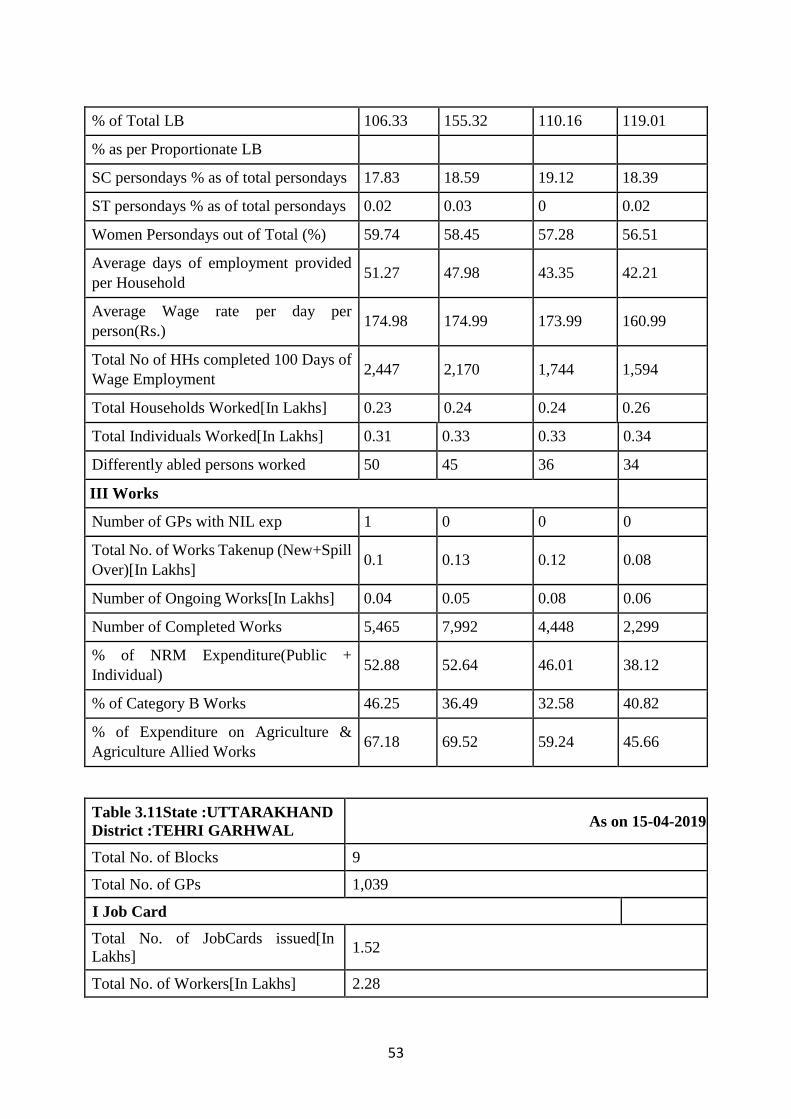
53
% of Total LB 106.33 155.32 110.16 119.01
% as per Proportionate LB
SC persondays % as of total persondays 17.83 18.59 19.12 18.39
ST persondays % as of total persondays 0.02 0.03 0 0.02
Women Persondays out of Total (%) 59.74 58.45 57.28 56.51
Average days of employment provided
per Household 51.27 47.98 43.35 42.21
Average Wage rate per day per
person(Rs.) 174.98 174.99 173.99 160.99
Total No of HHs completed 100 Days of
Wage Employment 2,447 2,170 1,744 1,594
Total Households Worked[In Lakhs] 0.23 0.24 0.24 0.26
Total Individuals Worked[In Lakhs] 0.31 0.33 0.33 0.34
Differently abled persons worked 50 45 36 34
III Works
Number of GPs with NIL exp 1 0 0 0
Total No. of Works Takenup (New+Spill
Over)[In Lakhs] 0.1 0.13 0.12 0.08
Number of Ongoing Works[In Lakhs] 0.04 0.05 0.08 0.06
Number of Completed Works 5,465 7,992 4,448 2,299
% of NRM Expenditure(Public +
Individual) 52.88 52.64 46.01 38.12
% of Category B Works 46.25 36.49 32.58 40.82
% of Expenditure on Agriculture &
Agriculture Allied Works 67.18 69.52 59.24 45.66
Table 3.11State :UTTARAKHAND
District :TEHRI GARHWAL As on 15-04-2019
Total No. of Blocks 9
Total No. of GPs 1,039
I Job Card
Total No. of JobCards issued[In
Lakhs] 1.52
Total No. of Workers[In Lakhs] 2.28

54
Total No. of Active Job Cards[In
Lakhs] 1.18
Total No. of Active Workers[In
Lakhs] 1.37
(i)SC worker against active
workers[%] 10.4
(ii)ST worker against active
workers[%] 0.11
II Progress FY
2018-2019
FY
2017-2018
FY
2016-2017
FY
2015-2016
Approved Labour Budget[In Lakhs] 30.82 26.69 27.2 26.49
Persondays Generated so far[In
Lakhs] 33.02 33.69 39.41 40.21
% of Total LB 107.13 126.23 144.89 151.78
% as per Proportionate LB
SC persondays % as of total
persondays 10.39 9.88 9.83 10.01
ST persondays % as of total
persondays 0.11 0.07 0.08 0.05
Women Persondays out of Total (%) 73.02 71.85 71.48 69.09
Average days of employment
provided per Household 38.3 36.55 37.63 37.5
Average Wage rate per day per
person(Rs.) 174.98 174.98 173.95 160.97
Total No of HHs completed 100 Days
of Wage Employment 1,793 1,608 1,815 2,960
Total Households Worked[In Lakhs] 0.86 0.92 1.05 1.07
Total Individuals Worked[In Lakhs] 0.97 1.04 1.19 1.21
Differently abled persons worked 114 128 140 132
III Works
Number of GPs with NIL exp 18 8 4 35
Total No. of Works Takenup
(New+Spill Over)[In Lakhs] 0.08 0.11 0.1 0.06
Number of Ongoing Works [In Lakhs] 0.04 0.04 0.05 0.03
Number of Completed Works 4,880 6,466 4,503 2,475
% of NRM Expenditure(Public +
Individual) 73.79 58.04 45.97 52.98

55
% of Category B Works 34.67 34.24 23.31 4.25
% of Expenditure on Agriculture &
Agriculture Allied Works 71.87 67.35 50.72 52.97
Table 3.12 State : UTTARAKHAND
District :UDAM SINGH NAGAR As on 15-04-2019
Total No. of Blocks 7
Total No. of GPs 392
I Job Card
Total No. of Job Cards issued[In Lakhs] 1.01
Total No. of Workers[In Lakhs] 1.7
Total No. of Active Job Cards[In Lakhs] 0.48
Total No. of Active Workers[In Lakhs] 0.71
(i)SC worker against active workers[%] 15.39
(ii)ST worker against active workers[%] 21.35
II Progress FY
2018-2019
FY
2017-2018
FY
2016-2017
FY
2015-2016
Approved Labour Budget[In Lakhs] 11.7 12.97 10.22 7.91
Person days Generated so far[In Lakhs] 12.17 12.73 13.22 12.06
% of Total LB 104.01 98.1 129.39 152.55
% as per Proportionate LB
SC person days % as of total person days 14.36 16.59 16.54 18.58
ST person days % as of total person days 16.74 15.19 15.87 16.67
Women Person days out of Total (%) 44.17 43.15 41.07 37.24
Average days of employment provided
per Household 45.18 44.78 42.28 42.17
Average Wage rate per day per
person(Rs.) 175 175 173.99 161
Total No of HHs completed 100 Days of
Wage Employment 1,506 1,941 1,637 1,756
Total Households Worked[In Lakhs] 0.27 0.28 0.31 0.29
Total Individuals Worked[In Lakhs] 0.37 0.39 0.46 0.42
Differently abled persons worked 41 47 47 42
III Works
Number of GPs with NIL exp 9 6 5 6

56
Total No. of Works Taken up
(New+Spill Over)[In Lakhs] 0.09 0.09 0.11 0.08
Number of Ongoing Works [In Lakhs] 0.03 0.02 0.03 0.03
Number of Completed Works 5,259 7,004 8,102 4,961
% of NRM Expenditure (Public +
Individual) 52.25 48.03 39.41 39.03
% of Category B Works 45.4 49.74 31.91 35.93
% of Expenditure on Agriculture &
Agriculture Allied Works 50.53 61.52 51.31 49.14
Table 3.13 State : UTTARAKHAND
District :UTTAR KASHI As on 15-04-2019
Total No. of Blocks 6
Total No. of GPs 501
I Job Card
Total No. of JobCards issued[In Lakhs] 0.83
Total No. of Workers[In Lakhs] 1.65
Total No. of Active Job Cards[In
Lakhs] 0.68
Total No. of Active Workers[In Lakhs] 1.03
(i)SC worker against active workers[%] 17.97
(ii)ST worker against active
workers[%] 0.59
II Progress FY
018-2019
FY
2017-2018
FY
2016-2017
FY
2015-2016
Approved Labour Budget [In Lakhs] 29.38 19.18 18.01 17.54
Persondays Generated so far [In Lakhs] 29.76 30.22 28.27 21.73
% of Total LB 101.31 157.53 156.96 123.85
% as per Proportionate LB
SC persondays % as of total persondays 18.16 17.91 17.65 18.15
ST persondays % as of total person
days 0.66 0.68 0.59 0.78
Women Person days out of Total (%) 53.19 52.31 51.96 49.91
Average days of employment provided
per Household 52.78 53.18 49.55 39.22

57
Average Wage rate per day per
person(Rs.) 174.99 175 173.98 161
Total No of HHs completed 100 Days
of Wage Employment 3,634 3,264 1,796 660
Total Households Worked [In Lakhs] 0.56 0.57 0.57 0.55
Total Individuals Worked [In Lakhs] 0.8 0.8 0.79 0.73
Differently abled persons worked 177 106 78 32
III Works
Number of GPs with NIL exp 2 1 1 0
Total No. of Works Taken up (New
+Spill Over)[In Lakhs] 0.13 0.16 0.14 0.07
Number of Ongoing Works [In Lakhs] 0.06 0.07 0.08 0.06
Number of Completed Works 6,876 8,790 5,129 1,185
% of NRM Expenditure (Public +
Individual) 86.4 84.21 82.79 86.9
% of Category B Works 16.25 16.22 10.17 2.61
% of Expenditure on Agriculture &
Agriculture Allied Works 61.94 82.22 84.1 87.15
% of Total Expenditure through EFMS 99.99 99.99 99.99 99.89
% payments generated within 15 days 99.96 95.38 65.85 24.63

58
3.1.2 District wise active job cards
Figure 3.1: Source: MGNREGA, 2019 The chart given above, shows that the percentage of active job cards and active workers is
lowest in District Haridwar with 30.9 % active job cards and 31.1% active workers of the total
workers registered followed by Udham Singh Nagar with 47.5 % and 41.7 % respectively.
In the hill districts it is lowest for Almora with 53% active job cards and 36.19% active
workers. Chamoli has the highest percentage of active job cards and active workers which is
92.95% and 85.71% respectively.
The average wage rate per day per person in the year 2015-16 was approximately Rs. 161
across districts. In the year 2018-19 the average wage rate per person increased to Rs. 175. The
market wage in Haridwar is Rs.291, in U.S. Nagar Rs.283, in Pauri Rs.306 and in Champawat
Rs.310(Assessment of Convergence activities under MGNREGA in Uttarakhand,2018) The daily
wage under MGNREGA is way lower than the Market wage.
3.1.3 Provision of Work & Unemployment Allowance:
No demand for work was made in 50% of the villages visited in Uttarakhand (National
Level Monitoring, Common Review mission and Internal audit on MGNREGA, 2017). Delay of
more than four weeks in all (100%) the villages visited was reported in Jageshwar, Chamoli,
Udham Singh Nagar and Uttarkashi of Uttarakhand. Quality management systems were not
established in any of the villages visited in Uttarakhand. None of the wage seekers were aware of
the entitlements about unemployment allowance in majority of the sample villages in Uttarakhand.
The current data published on the website of MGNREGA shows that the timely
payments(within 15 days) which were less than 50% for all the districts of the state in 2015-16
has become more than 99% nearing 100% for all the districts in the state in 2018-19.
0
10
20
30
40
50
60
70
80
90
100
Districtwise Pecentage of Active Job Cards and Workers
% of Job Cards active % of workers Active
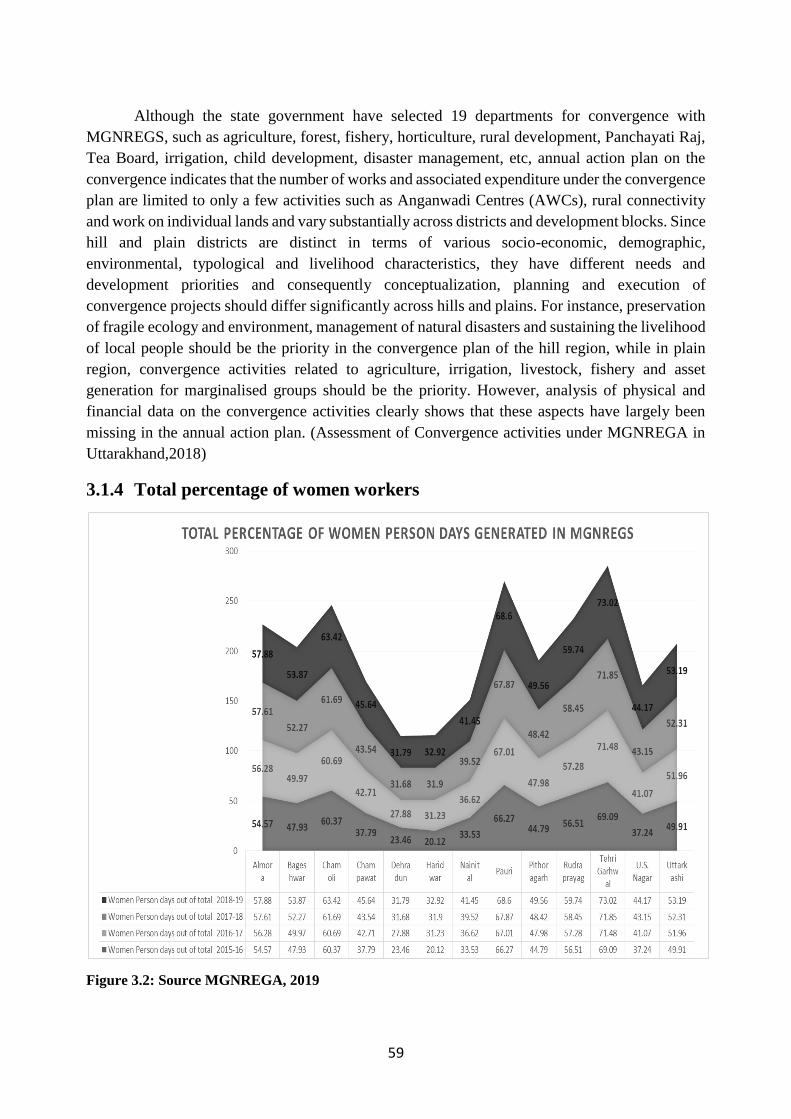
59
Although the state government have selected 19 departments for convergence with
MGNREGS, such as agriculture, forest, fishery, horticulture, rural development, Panchayati Raj,
Tea Board, irrigation, child development, disaster management, etc, annual action plan on the
convergence indicates that the number of works and associated expenditure under the convergence
plan are limited to only a few activities such as Anganwadi Centres (AWCs), rural connectivity
and work on individual lands and vary substantially across districts and development blocks. Since
hill and plain districts are distinct in terms of various socio-economic, demographic,
environmental, typological and livelihood characteristics, they have different needs and
development priorities and consequently conceptualization, planning and execution of
convergence projects should differ significantly across hills and plains. For instance, preservation
of fragile ecology and environment, management of natural disasters and sustaining the livelihood
of local people should be the priority in the convergence plan of the hill region, while in plain
region, convergence activities related to agriculture, irrigation, livestock, fishery and asset
generation for marginalised groups should be the priority. However, analysis of physical and
financial data on the convergence activities clearly shows that these aspects have largely been
missing in the annual action plan. (Assessment of Convergence activities under MGNREGA in
Uttarakhand,2018)
3.1.4 Total percentage of women workers
Figure 3.2: Source MGNREGA, 2019

60
The average percentage of women given employment in 2018-19 is 51.94. Though the
state average is more than 50% there are differences between districts. Where Tehri district shows
a high percentage of the woman days generated with 73.02% while in Dehradun and Haridwar is
mere 31.79% and 32.92% respectively. From the Area chart above it can be seen that the
percentage of women days generated with respect to the total number of days generated in the
district, it is comparatively low in the plain districts of Haridwar and Dehradun. In the hill districts
of Champawat ,Pithoragarh and Nainital it has been lower than 50% for the last 4 years.
3.1.5 Expenditure of GPs
The total percentage of GPs with no expenditure is highest in Dehradun (46 out of 462) followed
by Almora with 72 gram panchayats out of 1168.
3.1.6: Registered Skilled Workers
Figure 3.3 : Data Source: mgnrega.nic

61
A clear gender gap can be seen in the number of registered skilled workers across all
districts. The gender gap is highest in Pauri with 20,699 male workers and 1,251 female workers.
The least number of skilled workers registered under MGNREGS are in Champawat with a total
of 76 workers (58 male and 18 female).
3.1.7 Works Completed
Figure 3.4: Data Source: mgnrega.nic
The column chart above shows district wise Work completion Rate under MGNREGS as
a percentage of the number of works started. The Completion Rate for year 2017-18 and earlier is
on an average more than 90%. A substantial drop can be seen in completion rate for the year 2018-
19 with the average completion rate as a mere 28.23%.

62
3.1.8 Vulnerable Communities
Figure 3.5: Source: MGNREGA, 2019
Individual assets can also be developed under MGNREGS, for better natural resource
management or to produce / strengthen livelihood in that area. This would also help them to not
be dependent on daily wage for their livelihood. The chart above shows the number of households
from vulnerable communities (defined in para 5 of Sch 1) who got individual assets and stopped
considering for MGNREGA works. In the district of Almora, Pauri and Pithoragarh this number
remains zero. The number is highest in Udham Singh Nagar with 83 such households. In the hill
districts, Rudraprayag has 57 such households.

63
3.1.9 Employment Demand Pattern
The monthly employment demand pattern for last five years is given below ( State and District
wise)( Department of MGNREGA):
Graph 3.1: Source: Department of MGNREGA
For the state of Uttarakhand, looking at the employment demand pattern the demand for
the employment is highest in the moths of july and January over last five years. The demand seems
to be comparatively low in the month of November and April.
Graph 3.2: Source: Department of MGNREGA
In Uttarakashi, the employment demand is seen to peak in the months of January and a
slight in May. The demand for employment seems to be low for the month of November over the
last five years, similar to the trend seen at the state level.

64
Graph 3.3: Source: Department of MGNREGA
In the district of Udham Singh Nagar the trend of employment demand is slightly different
than that of the state with highest demand being reflected in the month of June and a decrease is
seen in February and March.
Graph 3.4: Source: Department of MGNREGA
For the district Tehri data shows that the demand is comparatively low in the month of
April and Novermber. Increase in demand can be in months of July , January and february with
slight fluctuations over the last five years.

65
Graph 3.5: Source: Department of MGNREGA
For the district of Rudyaprayag, the employment demand is highest in the month of
September over the last five years, but seems to have taken a dip in the year 2018-19. It is
comparatively lower in the month of December.
Graph 3.6: Source: Department of MGNREGA
The demand in the month of July and January is comparatively higher for Pithoragarh. It
is low in the month of November. In the year 2015-16 it has peaked substantially for the month of
February; which in other years has remained more or less similar (5000-10,000).

66
Graph 3.7 :Source: Department of MGNREGA
For the district Pauri, the employment demand pattern shows high fluctuations over the
years in the months of June and February. For the year 2015-16 the demand is the highes in the
year of February which is comparatively lower in other years. Similarly, for the year 2015-16 the
demand is lowest in the month of June which is seen to be the peak demand season for the adjacent
years 2014-15 and 2016-17. The demand is high in the month of August and January and seems
to take dip in the month of April.
Graph 3.8: Source: Department of MGNREGA
The average employment demand is high in the month of June with fluctuations for district
Nainital. The employment demand is moderate and constant for the month of November for the
past 4 years.

67
Graph 3.9: Source: Department of MGNREGA
The average employment demand is almost constant over the year with slight fluctuations
over the 5 years in district Haridwar. The demand seems to peak slightly in the month of July.
Graph 3.10: Source: Department of MGNREGA
For district Dehradun, the employment demand is high in the month of July and May. It is moderate and
constant for the month of November over the past 5 years. In the month of February fluctuations can be
seen.

68
Graph 3.11: Source: Department of MGNREGA
In district Champawat the employment demand is high in the month of July. For the month
of February, there are fluctuations over the past 5 years, it shows high demand in the years 2015-
16 and 2017-18 and shows low demand for the years 2014-15, 2016-17 and 2018-19.
Graph 3.12: Source: Department of MGNREGA
For Chamoli disctrict the demand for employment is low from April to November with
fluctuations in the month of July where it increases. The demand increases in the months of
December to March.
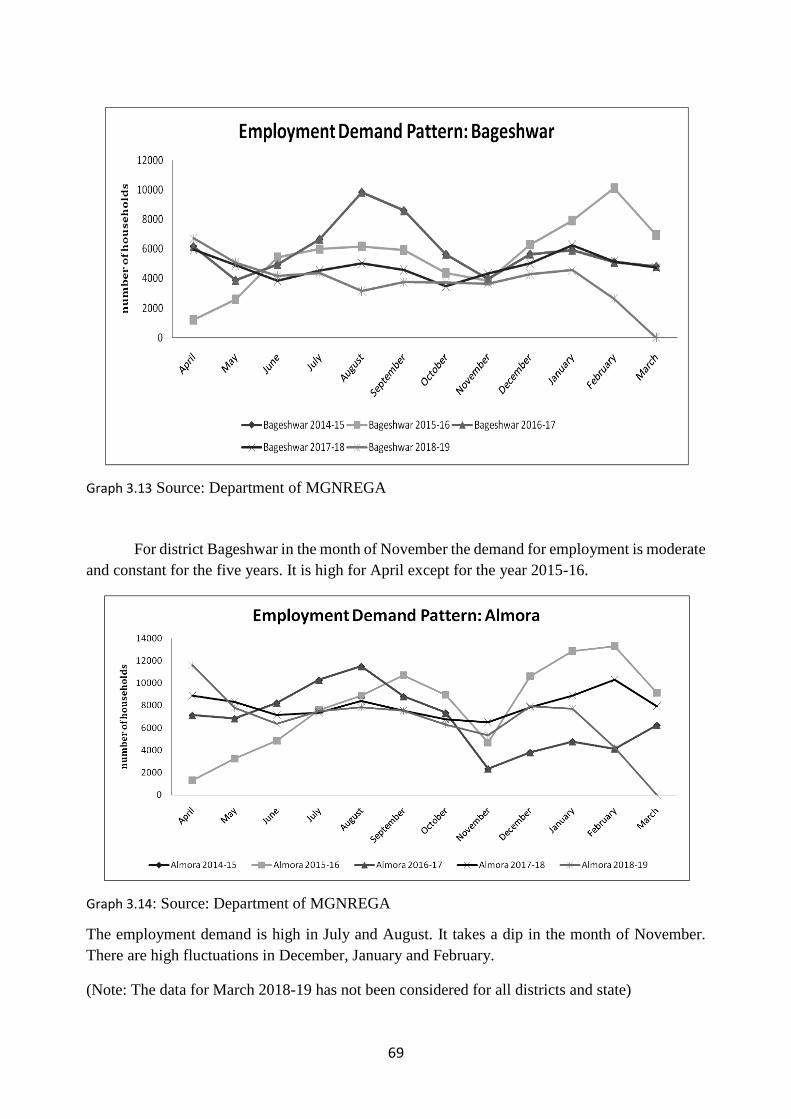
69
Graph 3.13 Source: Department of MGNREGA
For district Bageshwar in the month of November the demand for employment is moderate
and constant for the five years. It is high for April except for the year 2015-16.
Graph 3.14: Source: Department of MGNREGA
The employment demand is high in July and August. It takes a dip in the month of November.
There are high fluctuations in December, January and February.
(Note: The data for March 2018-19 has not been considered for all districts and state)

70
A dip in demand for employment under MGNREGS is seen in the month of November in most of
the hill districts which also coincides with the sowing of Rabi crops and March-April which is
again the harvesting season for Rabi and sowing season for Kharif crops.
3.1.10 National Level Monitoring (Summary of National Level Monitoring,
Common Review Mission & Internal Audit on MGNREGA, 2015)
Delay in payments
NLMs have also found that payment of wages is ‘mostly’ or ‘always’ delayed in almost
one fourth of villages in the country. This was found to be rampant in a few states including
Uttarakhand
Jageshwar, Chamoli, Udhamsingh Nagar and Uttarkashi of Uttarakhand States have
registered a delay in payment of wages according to the report.
None of the wage seekers’ were aware of the provision of acknowledgement receipt in
29% of the sample villages while `very few of them’ were aware in 12% of the villages visited.
Uttarakhand state is one of the state that have the poorest levels of awareness on this aspect. None
of the wage seekers were aware of the entitlements about unemployment allowance in majority of
the sample villages Uttarakhand State.
The committee for revision of wages paid under the Mahatma Gandhi National Rural
Employment Guarantee Act (MGNREGA) has found that minimum agricultural wages are higher
than MGNREGA wages in 15 states. An upward revision in MGNREGA wages is estimated to
require Rs 4,500 crore increase in its budget. The farm wages paid to agricultural workers in
Uttarakhand are significantly higher.
3.1.11 MGNERGA (State performance report 2017-18)
Under MGNERGA, 2.20 Crore person days of employment had been generated during 2017-18,
amounting to a total expenditure of Rs. 695.87 Crores, agriculture formed 72.53% of the total
spends. This helped 5.06 Lakh households and 6.58 individuals work under the scheme. This
helped generate on an average 43.44 days of employment per household. An interesting factor to
note here is that 54.39% were women person days out. Wage formed the biggest chunk of
expenditure amounting to 414.70 Crores. 94.64% of the payments were generated within 15 days.
Total 1.85 Lakh works were taken up, out of which 55% (1.02 Lakh) have been completed.
It is pertinent that state needs to focus more on NRM(Natural Resource Management) related
works (59.32%), completed works related to promotion of livestock, category B works (33.01%),
horticulture, Rural Haat etc. In terms of money spent, expenditure on NRM works in Uttrakhand
is only 50% in the MWC (Mission Water Conservation) blocks against the mandated 65%.
Shockingly, out of the completed works in 2 groundwater stressed blocks, only 4% of works are
related to groundwater recharge. State definitely needs to take more of NRM works.

71
Among the works taken till FY 2016-17, more than 27000 were still incomplete; state had
taken a target to complete all incomplete works of the said FY by 30th April 2018. There are 563
works which do not have any work done and should be deleted on priority, with a deadline of 20th
March. 178 works have only material expenditure and 914 works have exceeded 100% of the
sanctioned estimate. Pithoragarh and Chamoli districts have the highest incomplete works.
3.2 DAY–NRLM (Deendayal Antyodaya Yojana-National Rural Livelihood Mission)
(Source: USRLM)
National Rural Livelihood Mission (NRLM) is a poverty alleviation project implemented
by Ministry of Rural Development, Government of India. This scheme is focused on promoting
self-employment and organization of rural poor. The basic idea behind this programme is to
organize the poor into SHG (Self Help Groups) groups and make them capable for self-
employment. A total 21308 SHGs have been formed since inception, 899 Village organization
and 34 cluster level federation formed. Total 4173 SHGs started livelihood activities with the help
of CCL/TL from banks.
3.2.1 Phase wise intensive Blocks- DAY NRLM
Defining Intensive block:
Intensive Block:
A block with full complement of NRLM components with trained and dedicated professional staff
at every level (State, District, Block and Cluster) is categorised as Intensive Block.
Criteria for selection of intensive blocks:
The selection of intensive blocks is done by the states based on the demographic vulnerabilities.
It will be rolled out in a phased manner over the next 7 - 8 years. All blocks in the country will
become intensive blocks over time.
Key components of intensive block approach:
Social mobilization and saturation approach for coverage of all NRLM target families
through involvement of community resource persons
Building federations of SHGs at various levels
Financial inclusion – to provide at-least Rs.1 lakh credit to each family over 5 years
Ensure food security and vulnerability reduction through various livelihood initiatives
Livelihoods promotion through community based organizations – providing at-least 2
stable livelihoods to each family over 5 years
Bookkeeping and participatory monitoring mechanism
Convergence with Line departments and PRIs
Building strong, self-reliant community managed sustainable organizations of poor

72
Phase 1: FY 15-16 (10) blocks Phase 2- FY 16-17 (5 Blocks)
Pauri : Duggada, Yamkeshwar
Dehradun: Doiwala, Shahaspur
Nainital: Kotabagh, Ramnagar
U.S.Nagar: Kashipur, Jaspur
Chamoli: Joshimath , Karanprayag
Pauri : Thalisen
U.S. Nagar: sitarganj , khatima
Pithoragarh : Dharchula
Haridwar: Bhagwanpur
Phase 3- FY 17-18 (15 Blocks) Phase 4 - FY 17-18 (30 Blocks)
Pauri: Kot, Pauri
Dehradun : Raipur, Vikas Nagar
Nainital: Betalghat
U.S. Nagar: Gadarpur
Pithoragarh :Berinag, Gangolihat
Almora: Takula
Tehri: Narendra Nagar
Uttarkashi: Chinyalisaur
Rudraprayag: Ukhimath
Champawat: Champawat
Haridwar: Bhadrabad, Laskar
Pauri: Ekeshwar, Khirsu. Bironkhal, Dwarikhal,
Pabo, Rikhni Khal, Zahrikhal
Nainital: Bhimtal, Dhari, Haldwani, Ramgarh,
Okhalkanda
U.S.Nagar: Bajpur, Rudrapur
Chamoli: Garisen
Pithoragarh: Munsayari
Almora: Lamgara, Dhauladevi
Bageshwar : Bageshwar, Kapkot
Tehri: Bhelangana, Devprayag, Kirtinagar,
Jakhnikhal, Thauldhar
Uttarkashi: Dunda
Champawat: Lohaghat
Haridwar: Khanpur, Narsan, Roorkee
All the blocks have been included under intensive blocks in the last phase.
3.2.2 Strategy for SHG Formation
Internal Cadre of 300 CRP(Community Resource Person), for SHG Formation has been
developed. 60 Teams of CRP are taken from SERP(Society for Elimination of Rural
Poverty)Telangana in old 30 Intensive Blocks.60 Teams are taken from Jeevika Bihar for new 30
Intensive blocks.
Total SHGs active since Inception : 21308
Total Target for FY 2018-19 : 8000
Total SHGs formed in FY 2018-19 : 9251
3.2.3 Strategy for MCP(micro credit plan) Preparation
104 masters trainers for preparation of MCP and development of MCP have been appointed.

73
Training has been provided to CRP cadre.50 PRPs (Project Resource Persons) have been taken
from SERP Telangana and Jeevika Bihar, they are being engaged exclusively in MCP preparation
work. 60 types of activity have been identified and a detailed project Report including Backward
& Forward linkage have been prepared with the help of ILSP, UGVS NABARD and DIC.
3.2.4 Strategy for achieving the CCL (Cash Credit Limit) Target
USRLM conducted a seminar to discuss NRLM position and future strategy. The Seminar was
attended by SLBC, RSETI, NABARD, LDMs of Banks and other bankers. It has appointed
advisor Finance and Banking so as to help achieving the target .USRLM has appointed Project
Resources Person (PRPs) 30 from Bihar and 20 from Telangana .43 Bank Sakhi have been trained
by USRLM from SHGs and allocating bank branches to them. USRLM is also planning to prepare
Financial Inclusion Community Resource Person (FL-CRP) to educate the SHGs. It is planning
to select Business Correspondence Agent from SHGs at the centres where Bank facilities are not
available.
Total No of CLFs ( Cluster Federations) formed since Inception :34
Total Target of CLF Formation in FY 2018-19 : 20
Total CLF formed in FY 2018-19 : 22
Sn
o
Fin
an
cia
l Y
ear
SH
G
Fo
rma
tio
n
RF
MC
P
CIF
VO
CC
L
CL
F
No
. O
f M
emb
er
lin
k L
ivel
iho
od
Act
ivit
ies
Act
ive
Ina
ctiv
e
Ta
rget
Ach
iev
emen
t
Ta
rget
Ach
iev
emen
t
Ta
rget
Ach
iev
emen
t
Ta
rget
Ach
iev
emen
t
Ta
rget
Ach
iev
emen
t
Ta
rget
Ach
iev
emen
t
1 2014-15 527 153 200 156 0 0 50 0 20 5 0 0 2 0 0
2 2015-16 2036 820 340 808 200 272 200 245 30 76 355 61 0 1 2142
3 2016-17 2985 745 2104 1998 737 878 737 733 60 55 366 189 5 0 5864
4 2017-18 7417 5500 5512 1500 1588 1500 1537 150 229 3268 1721 10 11 17899
5 2018-19 9521 6476 5897 8655 8687 2258 1798 800 760 5641 3191 20 22 9947
21308 4052 15644 13929 11092 9357 5262 4024 1060 899 9630 4173 37 34 35852
Table 3.14: (Source:USRLM)

74
Sno Financial Year SHG Formation
Target Achievement
1 2014-15 1050 527
2 2015-16 500 2036
3 2016-17 2785 2985
4 2017-18 7050 7417
5 2018-19 8000 9251
Total 19385 21308
Table 3.15: Source: USRLM
The number of SHGs formed since inception is higher than the target for every financial
year. As a result 21308 SHGs have been formed since inception against a target of 19385. The
achievements are lagging behind in all other step in the capitalization strategy of SHG (RF, MCP
preparation, CIF, VO and CCL). A total of 35852 people have been linked to livelihood activites.
More focus should be given to the SHG capitalization strategy to make the SHGS functional and
profitable. The RF and CIF are centrally funded hence the lower achievement is attributed to
budget constraints.
The gap in achievement of CCL is attributed to different reasons like lack of proper MCP,
unwillingness of community to take loan and bank constraints. More focus should be given on
Micro credit plan preparation, which is need based. Master trainers should be increased for smooth
functioning of plan preparation. Community awareness and bank linkages should be strengthened.
3.3 Rural Self Employment Training Institutes ( RSETIs)
RSETIs are Rural Self Employment Training Institutes, an initiative of Ministry of Rural
Development (MoRD) to have dedicated infrastructure in each district of the country to impart
training and skill upgradation of rural youth geared towards entrepreneurship development.
RSETIs are managed by banks with active co-operation from the Government of India and State
Governments.
3.3.1 The details of trainings conducted in RSETIs are given in the table
below:
SI.
No
.
Name of the
District
Name of the
RSETI
AAP (annual action
plan) Target FY 2018-19
ACHIEVEMENT from 01-
04-2018 to 31-12-2018
Number of
Programmes
Number of
Candidates
Number of
Programmes
Conducted
Number of
Candidates
Trained
1 ALMORA SBI Almora 21 540 14 349

75
2 BAGESHWAR SBI
Bageshwar
21 605 13 352
3 CHAMOLI SBI Chamoli
(Gopeshwar)
17 459 12 355
4 CHAMPAWAT SBI
Champawat
19 500 13 352
5 DEHRADUN OBC
Dehradun
25 750 19 447
6 NAINITAL BOB
Haldwani
(Nainital)
20 500 20 545
7 HARIDWAR PNB
Haridwar
25 625 19 488
8 PAURI
GARHWAL
SBI Pauri 18 450 13 355
9 RUDRAPRAYAG SBI
Rudraprayag
18 515 13 372
10 TEHRI
GARHWAL
SBI Tehri
Garhwal
18 450 12 310
11 UDHAM SINGH
NAGAR
BOB Udham
Singh Nagar
(Pantnagar)
25 625 9 248
12 UTTAR KASHI SBI
Uttarkashi
18 450 18 451
13 PITHORAGARH SBI
Pithoragarh
17 430 15 358
Total 262 6899 191 5107
Table 3.16 (Source: USRLM)
Different trainings are given under RSETIs to develop entrepreneurship in the people and facilitate
loaning to start enterprises and small business.

76
3.3.2 List of RSETI Training Courses Aligned with NSQF( National Skills
Qualification Framework)
Sl.
No.
Qualification Name Category
(I/II/III)
Duration
(Hours)
Duration
(Days)
1 Homemade Agarbatti Maker II 80 10
2 Resham Kosh Utpadak Udyami II 80 10
3 Dairy Farming and Vermi Compost Making I 80 10
4 Paper Cover, Envelope and File Making II 80 10
5 Commercial Horticulture I 104 13
6 KrishiUdyami II 104 13
7 Soft Toys Maker and Seller I 104 13
8 Sheep Rearing II 80 10
9 Jute Products Udyami I 104 13
10 Poultry I 80 10
11 Papad, Pickle and Masala Powder II 80 10
12 Goat Rearing II 80 10
13 Cultivation of Medicinal and Aromatic Plants II 80 10
14 Rubber Tapping & Processing II 80 10
15 Fast Food Stall Udyami II 80 10
16 Business Correspondent & Business Facilitator III 80 10
17 Debt Recovery Agents III 104 13
18 Piggery II 80 10
19 Commercial floriculture II 80 10
20 Vegetable Nursery Management and Cultivation II 80 10
21 Bee Keeping II 80 10
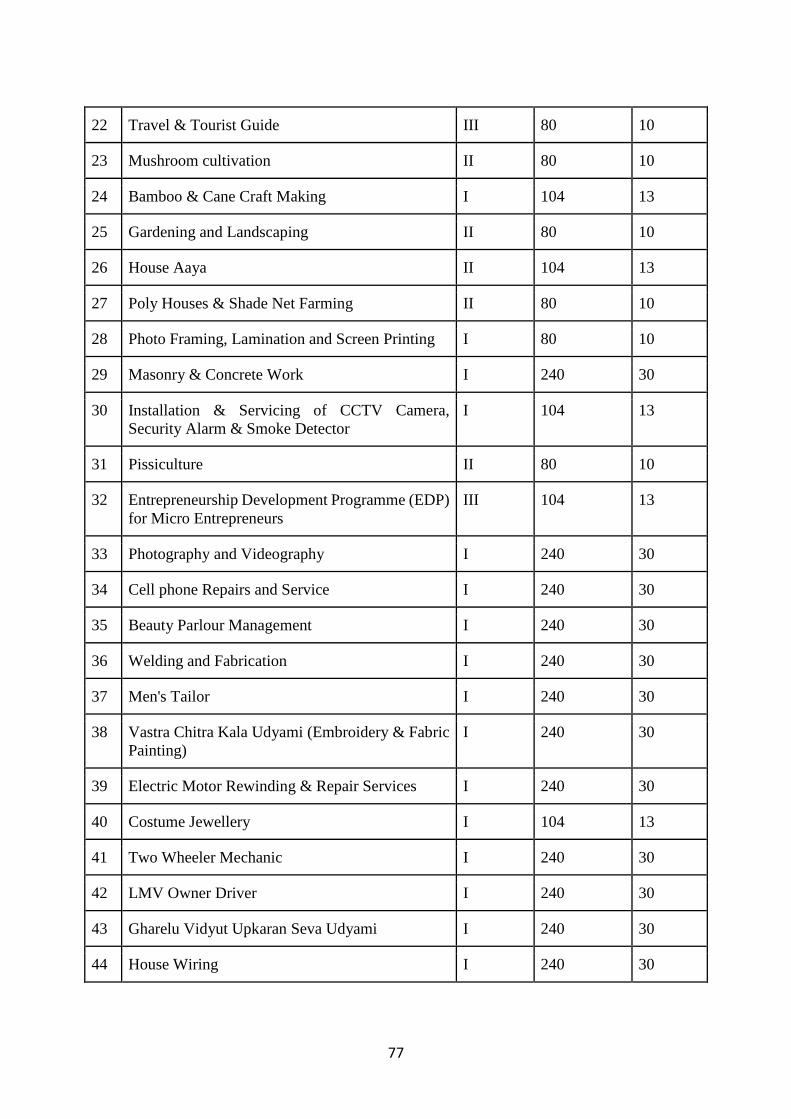
77
22 Travel & Tourist Guide III 80 10
23 Mushroom cultivation II 80 10
24 Bamboo & Cane Craft Making I 104 13
25 Gardening and Landscaping II 80 10
26 House Aaya II 104 13
27 Poly Houses & Shade Net Farming II 80 10
28 Photo Framing, Lamination and Screen Printing I 80 10
29 Masonry & Concrete Work I 240 30
30 Installation & Servicing of CCTV Camera,
Security Alarm & Smoke Detector
I 104 13
31 Pissiculture II 80 10
32 Entrepreneurship Development Programme (EDP)
for Micro Entrepreneurs
III 104 13
33 Photography and Videography I 240 30
34 Cell phone Repairs and Service I 240 30
35 Beauty Parlour Management I 240 30
36 Welding and Fabrication I 240 30
37 Men's Tailor I 240 30
38 Vastra Chitra Kala Udyami (Embroidery & Fabric
Painting)
I 240 30
39 Electric Motor Rewinding & Repair Services I 240 30
40 Costume Jewellery I 104 13
41 Two Wheeler Mechanic I 240 30
42 LMV Owner Driver I 240 30
43 Gharelu Vidyut Upkaran Seva Udyami I 240 30
44 House Wiring I 240 30

78
45 Men's Parlour and Salon I 240 30
46 TV Technician I 240 30
47 Computerized Accounting I 240 30
48 Women’s Tailor I 240 30
49 Desktop Publishing I 360 45
50 Computer Hardware & Networking I 360 45
51 Candle Making II 80 10
52 Plumbing and Sanitary Works I 240 30
53 Refrigeration and Air-conditioning I 240 30
54 Alluminium Fabrication I 240 30
55 UPS and Battery Making & Servicing I 240 30
56 Carpentry I 240 30
57 Grocery &Kirana Shop III 48 6
58 EDP to Persons with Disabilities III 80 10
59 Bank Mitra III 48 6
60 General EDP III 48 6
61 Training Programme on Financial Literacy for
FLCRPs
III 48 6
Table 3.17 (Source:RSETI)
3.3.3 Aajeevika Skill: Making Rural Poor Youth Employable
Aajeevika- National Rural Livelihood Mission (NRLM) is an initiative launched by
Ministry of Rural Development (MoRD), Government of India in June 2011. The Aajeevika Skill
is a sub-mission under NRLM. It has evolved out of the need to:
• Cater to the occupational aspirations of the rural youth who are poor and
• To diversify incomes of the rural poor.
Key Features
• Provides customized residential and non-residential training

79
• Minimum 624 hours of training with modules on trade specific skills, IT and soft skills.
• Special programs for Jammu and Kashmir, Minorities and Most critical Left wing
Extremist districts .
• Implemented under the supervision of the central and state governments
• 75% assured placement above minimum wages
• Post placement support
• Food and transport support during training
3.3.4 District wise people trained under Aajeevika Skills (till April 10, 2019)
NO
Dis
tric
ts
No. O
f P
IAS
No. O
f P
roje
cts
Tota
l T
arg
et
Tota
l T
rain
ed
Tota
l P
lace
d
(Tra
ined
VS
Targ
et)
(%)
(Pla
ced
Vs
Tra
ined
) (%
)
1 ALMORA 2 2 290 243 169 27.93 69.55
2 BAGESHWAR 1 1 100 0 0 0 0
3 CHAMOLI 1 1 136 91 37 66.91 40.66
4 CHAMPAWAT 2 2 260 163 142 62.69 87.12
5 DEHRADUN 8 16 5,071 4,925 3,958 5.71 80.37
6 HARIDWAR 9 16 5,261 4,790 3,706 6.07 77.37
7 NAINITAL 4 6 1,286 1,037 831 13.44 80.14
8 PAURI GARHWAL 5 8 915 873 685 11.93 78.47
9 PITHORAGARH 2 2 205 105 85 51.22 80.95
10 TEHRI GARHWAL 2 5 513 531 485 20.7 91.34
11 UDAMSINGH NAGAR 3 3 1,205 1,753 1,212 48.49 69.14
12 UTTARKASHI 2 2 150 121 110 40.33 90.91
Table 3.18 Source: Ajeevika skills website
A total of 14,632 people have been trained under Aajeevika Skills of which 11,420 have
been placed (78.05%). In Bageshwar none were trained against a target of 100. Placement was
considerably lower in Chamoli as compared to other districts, with only 40.66 % placed of the
total trained.

80
3.3.5 A description of different activities under DAY- NRLM are given below
(Source: USRLM)
Activities Existing Balance Comments
FMB(Farm
Machinery Bank
- 200 In the meeting of management Committee of USBS
Secretary Agri Govt of Uttarakhand assured
Establishment of 200 FMB for SHGs. Demand for
FMB has been received from 200 NRLM SHGs
Prasad Making 20 50 SHG and temples have been selected. Prasad making
has been started in 15 SHGs.
Nursery 15 20 Nursery of following types has been established
by members of SHGs :
1. Nursery for raising temperate fruits.
2. Floriculture nursery
3. Off seasonal vegetable Nursery.
4. Medicinal plant nursery
Enterprise 705 1695 Individual and collective enterprises are run by SHG
member. Mainly Dairy, woollen, Masala Units are
being run by SHG women.
Dairy 893 107 21 SHG women had been trained & 30 SHG woman
will be trained.
Agriculture 246 1254 Cultivation of traditional crops such as mandua, red
rice, Jhangora organic pulses, and wheat are majorly
practiced by SHG women
Horticulture 10 25 Cultivation of low chilling apple variety and other
temperate fruits is being done. Protected cultivation of
Vegetables and flowers is also done by SHG members.
Rural Haat 55 40 Site selection is under process
RUTF(Ready to
use Therapeutic
Food)
2 3 Pilot project started will be replicated once successful
Organic Cluster 4 0 4 organic cluster have been selected in 2 district, in
which 990 Mahila Kisan are identified and 25 Master
trainers are trained

81
Led Bulb
Distribution
26 69 26 SHGs in 3 VOs from 2 District are engaged in LED
Bulb Distribution with the help of EESLN with an
average income generation of 10,000 per VO.
Table 3.19 (Source:USRLM)
3.3.6 Per member profit through different activities by SHGs throughout the
state is given as follows (Monthly):
Fig 3.6 Source: USRLM
Fishery is the most profitable farm activities with a profit of Rs. 6500 per month per
member. It is followed by Mushroom production with a profit of Rs.4980 at the state level.
Sugar cane production and MAP (Medicinal and Aromatic Plants) take the bottom most
position with Rs. 986/month and Rs. 333/ month respectively. Medicinal and Aromatic plants
have a good potential in Uttarakhand but a lot of work has not been done yet in the same. The
efforts should be expanded in this.

82
Fig 3.7 Per Member Profit: Non Farm
Activity

83
In non- farm activities Cosmetic shop, Hardware shop, small businesses and namkeen making
take the top spots in terms of profit. Power tiller business, marketing of Tata Tea and marketing
of water purifier take the lowest spots.
As we look at the activities districtwise the most profitable activities are given below
1. Almora : Farm Activity – Goatery: Rs.6833.333
Non- Farm Activity- Shop :Rs.10,0000
2. Chamoli: Farm Activity- Vegetable Production: Rs.3663
Non-Farm Activity- Chaulai Ladoo: Rs. 13,636 and homestay: Rs. 4285
3. Champawat: Farm Activity- Livestock: Rs. 2083
Non Farm Activity- Beauty Parlor : Rs. 11,000(Number of Units 1) and
Shop- Rs. 4000( number of units -19)
4. Dehradun : Farm activity : Mushroom Production- Rs.10,323
Non-Farm Activity: Business: Rs.13422 followed by Cosmetic Shop:
Rs.11915
In the top ten most profit making activities in the districts , 9 were non farm with only
Mushroom as a farm activity.
5. Haridwar: Farm Activity: Mushroom Production: Rs. 4250
Non Farm Activity: Namkeen Making: Rs.17,000 followed by Hardware
Shop: Rs. 8500.
Similar to that in Dehradun district, only one farm activity (Mushroom Production) is in
the top ten most profit making per person.
6. Nainital: Farm Activity- Poultry: Rs.9000
Non Farm Activity: Taxi: Rs. 7500
7. Pauri: Farm Activity- Sowing: Rs.17,093 followed by Agriculture: Rs. 5108
Non Farm Activity- Shop: Rs. 2528
Farm activities are performing beeter than non farm activities in the district.
8. Pithoragarh: Farm Activity: Nursery : Rs. 8250
Non Farm Activity: Homestay : Rs. 8250
9. Rudraprayag: Farm Activity: Horticultre/ Polyhouse :Rs.6625
Non Farm Activity: Aata Chakki/Water Filter Sale/Dhaba/ Furniture:
Rs.6625

84
10. Tehri : Farm Activity: Vegetable: Rs.1001
Non Farm activity: Prasad making: Rs. 957
A total of only 6 livelihood activities are mentioned.
11. Udham Singh Nagar: Farm Activity: Goatery: Rs.4250
Non Farm Activity: Bakery: 5700 followed by Shop: Rs.5537
12. Uttarkashi: Farm Activity: Poultry and Mushroom Production: Rs.5000
Non- Farm Activity: Beauty Parlor/knitting/Fast food/Jute bag: Rs. 5000.
The maximum diversification in the livelihood activities is in the districts of Dehradun(40)
, Haridwar(36) amd Rudrapryag (33). The minimum diversity is seen in the districts of Tehri(6),
Champawat(8) and Almora (7).*
(*Data for district Bageshwar is not available as the work was started in 2018-19.)
Mushroom Production has proved to be profitable in almost every district in the state.
3.3.7 Number of Resource Persons Developed Under USRLM
S.No. Participants Target
Total Participants
Required Trained Proposed
(FY 19-20)
1 Active Women 7000 3100 2000
2 Tablet Sakhi 2200 130 200
3 BMM & Staff Members
(BRP) 550 80 100
4 Bank officer 1000 199 200
5 C.R.P 1000 538 100
6 Senior C.R.P 500 112 120
7 M.C.P (MT) 500 104 150
8 S.H.G. Book Keeper (MT) 650 116 190
9 V.O. Book Keepper (MT) 430 42 120
10 Bank Sakhi 350 43 157
11 Pashu Sakhi 3000 44 50
12 Krishi Sakhi (Organic) 3000 25 50
13 Setu Sakhi 800 0 120
14 Senior CRP-CLF 640 0 40
15 Poshan sakhi 640 0 35
16 Udhyam Sakhi 4000 0 30
Total 26,260 4533 3662
Table 3.20 (Source : USRLM)

85
A total of 4533 participants were trained under different roles. The targets in which no person has
been trained are Setu Sakhi, Senior CRP-CLF, Poshan Sakhi and Udhyam Sakhi. Of the total
required 26,260 only 4533 people have been trained.
3.3.8 Details of NPA block wise is given below:
NRLM SHGs NPA Status of 60 Blocks ( Amt. in Lakhs )
S.NO. District Block
Outstanding NPA % of NPA
No of
Account Amount
No of
Account
NPA
Amount
No of
Account
NPA
Amount
1 Almora
TAKULA 60 70.91 0 0 0 0
LAMGARA 132 28.76 17 4.25 12.88 14.78
DHAULADEVI 37 15.45 6 2.01 16.22 13.01
2 Bageshwar BAGESHWAR 233 99.2 26 3.99 11.16 4.02
KAPKOT 54 11.77 1 1.09 1.85 9.26
3 Chamoli
JOSHIMATH 226 42.28 16 3.39 7.08 8.02
KARNAPRAYAG 142 32.66 6 0.36 4.23 1.1
GAIRSAIN 61 24.56 0 0 0 0
4 Champawat CHAMPAWAT 9 4.49 2 2 22.22 44.5
LOHAGHAT 16 2.86 1 0.56 6.25 19.55
5 Dehradun
DOIWALA 433 230.76 31 23.07 7.16 10
RAIPUR 178 65.34 27 5.85 15.17 8.95
SAHAS PUR 169 60.05 28 5.26 16.57 8.76
VIKASNAGAR 103 51.17 19 3.93 18.45 7.68
6 Haridwar
BAHADRABAD 194 133.92 92 64.12 47.42 47.88
BHAGWANPUR 239 74.34 22 9.83 9.21 13.22
KHANPUR 10 6.82 4 5.82 40 85.34
LAKSAR 30 21.18 8 10.26 26.67 48.45
NARSAN 81 70.76 30 18.23 37.04 25.76
ROORKEE 33 70.84 14 23.04 42.42 32.52
7 Nanital
BETALGHAT 68 27.75 3 0.08 4.41 0.29
BHIMTAL 85 33.91 7 3.53 8.24 10.41
DHARI 13 3.41 0 0 0 0
HALDWANI 303 150.87 192 81.85 63.37 54.25
KOTABAG 104 38.43 6 0.82 5.77 2.13
OKHALKANDA 8 1.25 0 0 0 0
RAMGARH 6 2.84 0 0 0 0
RAMNAGAR 148 129.52 3 0.97 2.03 0.75
8 Pauri DUGGADA 292 119.72 7 3.3 2.4 2.76

86
DWARIKHAL 3 0.01 0 0 0 0
EKESHWAR 11 1.22 0 0 0 0
KALJIKHAL 3 0.23 2 0.15 66.67 66.49
KHIRSU 8 0.76 0 0 0 0
KOT 6 1.44 0 0 0 0
PABAU 39 13.37 0 0 0 0
PAURI 31 4.62 2 0.14 6.45 3.03
POKHRA 14 1.97 0 0 0 0
THALISAIN 52 9.72 2 1.3 3.85 13.37
YAMKESHWAR 213 21.26 0 0 0 0
ZAHRIKHAL 43 17.73 0 0 0 0
9 Pithoragarh
BERINAG 18 5.15 2 2.05 11.11 39.81
DHARCHULA 141 22.4 7 2.29 4.96 10.23
GANGOLIHAT 17 8.07 2 3.84 11.76 47.57
MUNSIARI 253 81.66 2 0.02 0.79 0.02
10 Rudryapryag UKHIMATH 139 70.78 2 0.36 1.44 0.51
11 Tehri DEVPRAYAG 11 1 0 0 0 0
NARENDRANAGAR 10 2.61 0 0 0 0
12 U.S. Nagar
BAJPUR 19 15.89 5 3.73 26.32 23.48
GADARPUR 63 39.56 11 8.58 17.46 21.69
JASPUR 12 4.75 4 1.3 33.33 27.37
KASHIPUR 374 215.7 260 132.12 69.52 61.25
KHATIMA 89 70.27 10 33.01 11.24 46.97
RUDRAPUR 66 38.21 6 3.55 9.09 9.29
SITARGANJ 129 75.5 9 11.08 6.98 14.68
13 Uttarkashi CHINIYALISAUR 27 3.62 5 1.83 18.52 50.61
DUNDA 58 7.33 5 1.22 8.62 16.65
Total 5316 2360.65 904 484.18 17.01 20.51
Table 3.21 Source: USRLM
The overall Outstanding amount in the 60 intensive blocks under NRLM is 2360.65 (lakhs)
with a total of 17.01% accounts NPA. The highest percentage of NPA amount is in blocks:
Khanpur (Haridwar): 85.34%, Kaljikhal (Pauri)- 66.49%, Kashipur (Udham Singh Nagar):
61.25%, Haldwani (Nainital): 54.25%, Chinyalisaur (Uttarkashi): 50.61%, Gangolihat
(Pithoragarh): 47.57%, Khatima (Udham Singh Nagar): 46.97 and Champawat (Champawat)-
44.5%. A few blocks with no NPA are Takula (Almora), Gairsain (Chamoli), Dhari (Nainital),
Ramgarh (Nainital), Okhalkanda (Nainital), Yamkeshwar (Pauri), Zahrikhal (Pauri) and Narendra
Nagar (Tehri).

87
Munsiyari (Pithoragarh) has an NPA of 0.02% on Rs.81.66 (lakh) disbursement as loan,
indicating a good ability to pay back loans.
3.3.9 The table below shows inactive SHGs formed under NRLM(as on March
2019)
(Source: USRLM)
District Name Block Number of SHGs
Almora BHAISIACHHANA 24
BHIKIASAIN 31
CHAUKHUTIA 22
DHAULADEVI 35
DWARAHAT 71
HAWALBAG 57
LAMGARA 60
SULT 45
SYALDEY 14
TAKULA 15
TARIKHET 9
BAGESHWAR BAGESHWAR 134
GARUR 3
KAPKOTE 73
CHAMOLI DASHOLI 8
DEWAL 2
GAIRSAIN 32
GHAT 1
JOSHIMATH 12
KARNAPRAYAG 33
NARAYANBAGAR 3
THARALI 14
CHAMPAWAT CHAMPAWAT 118
LOHAGHAT 57
DEHRADUN CHAKRATA 73
DOIWALA 135
KALSI 70
RAIPUR 11
SAHASPUR 73
VIKASNAGAR 8

88
HARIDWAR BHAGWANPUR 82
LAKSAR 40
ROORKEE 6
NAINITAL BETALGHAT 12
BHIMTAL 45
DHARI 44
HALDWANI 235
KOTABAG 27
OKHALKANDA 30
RAMGARH 31
RAMNAGAR 102
PAURI GARHWAL DUGGADA 32
KALJIKHAL 3
KHIRSU 12
KOT 22
NAINIDANDA 4
PAURI 145
THALISAIN 2
YAMKESHWAR 28
PITHORAGARH BERINAG 45
DHARCHULA 3
DIDIHAT 21
GANGOLIHAT 40
KANALICHINA 49
MUNAKOT 43
MUNSYARI 56
PITHORAGARH 28
RUDRA PRAYAG AUGUSTYAMUNI 230
JAKHOLI 220
UKHIMATH 228
TEHRI GARWAL BHILANGANA 72
CHAMBA 55
DEOPRAYAG 56
JAKHNIDHAR 88
JAUNPUR 104
KIRTI NAGAR 51
NARENDRA NAGAR 146
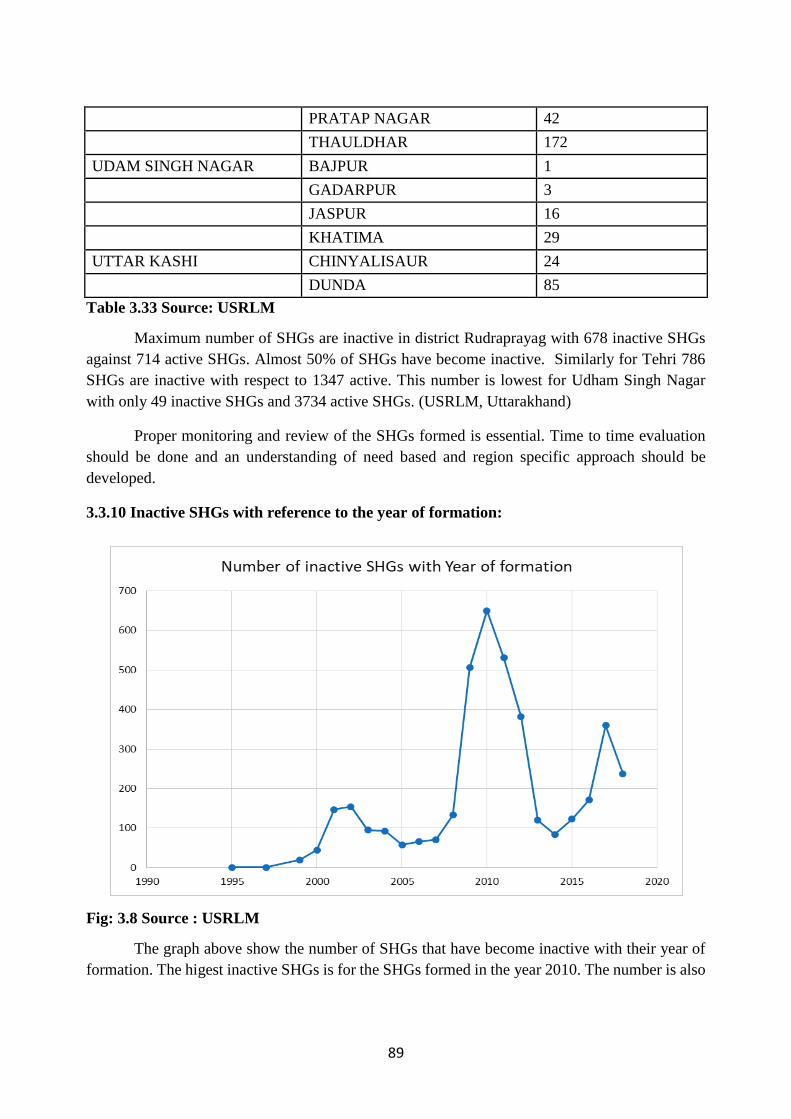
89
PRATAP NAGAR 42
THAULDHAR 172
UDAM SINGH NAGAR BAJPUR 1
GADARPUR 3
JASPUR 16
KHATIMA 29
UTTAR KASHI CHINYALISAUR 24
DUNDA 85
Table 3.33 Source: USRLM
Maximum number of SHGs are inactive in district Rudraprayag with 678 inactive SHGs
against 714 active SHGs. Almost 50% of SHGs have become inactive. Similarly for Tehri 786
SHGs are inactive with respect to 1347 active. This number is lowest for Udham Singh Nagar
with only 49 inactive SHGs and 3734 active SHGs. (USRLM, Uttarakhand)
Proper monitoring and review of the SHGs formed is essential. Time to time evaluation
should be done and an understanding of need based and region specific approach should be
developed.
3.3.10 Inactive SHGs with reference to the year of formation:
Fig: 3.8 Source : USRLM
The graph above show the number of SHGs that have become inactive with their year of
formation. The higest inactive SHGs is for the SHGs formed in the year 2010. The number is also

90
high for the year before (2009) and year after (2011 and 2012) . It futher peaks for the year 2017.
The graph shows that maximum no. of SHGs that became inactive were formed in these 5 years.
Few constrainsts in the implementation are : the difficult terrain and inadequate
infrastructure. More convergence is required. MGNREGA, ICDS, MID DAY MEAL scheme,
Schemes of Agriculture and allied departments, forest department can play important role in
achieving goals of DAY NRLM of enhancing livelihood opportunities of targeted group.
3.3.11 Status of Staff in USRLM
Level Required In
position
%
filled
Vacancy Remarks
SMMU 21 18 85 04 01 Selected and 01 Staff
Joined from UNDP
DMMU 39 34 87 07 06 Selected and 06 Staff
joined from UNDP.
BMMU 220 210 95 10 31 Selected and 31 Staff
joined from UNDP.
Total 280 262 93.5 21 21 persons would be placed
by UNDP.
Table 3.23 Source: USRLM
3.4 IFAD- ILSP
3.4.1 Activities conducted under ILSP :
Kisan Mela : “Sankalp se Sidhi” (source: ilsp.in)
During 2017-18 Kisan mela has been organised at each district with coordination of District
Administration and Department of Agriculture. The theme of the fairs was “Ensuring Better
Livelihood Security and Doubling farmers Income”.
The main objectives were–
1) Creating awareness of need, importance, policies and programmes for promoting
secondary agriculture among farmers, entrepreneurs, developmental experts, scientists and
other stakeholders.
2) Providing an opportunity for exchange of ideas / technologies / innovations and
experiences among various stakeholders.
More than 2500 farmers participate in each mela and benefits from various Good
Agricultural Practices, innovative tools and technical know-how, solutions. A knowledge
exchange platform provided during the mela where farmers and expert share their experience /
ideas. Agriculture – Horticulture Universities, Line Departments such as Agriculture,
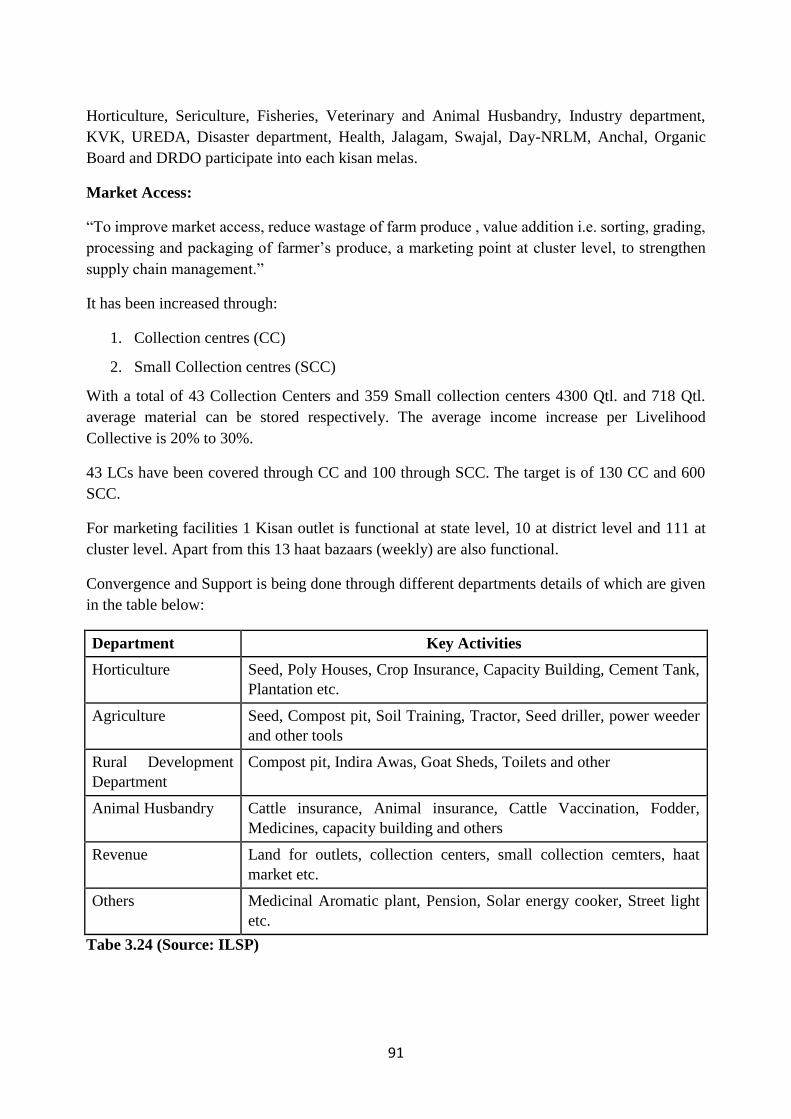
91
Horticulture, Sericulture, Fisheries, Veterinary and Animal Husbandry, Industry department,
KVK, UREDA, Disaster department, Health, Jalagam, Swajal, Day-NRLM, Anchal, Organic
Board and DRDO participate into each kisan melas.
Market Access:
“To improve market access, reduce wastage of farm produce , value addition i.e. sorting, grading,
processing and packaging of farmer’s produce, a marketing point at cluster level, to strengthen
supply chain management.”
It has been increased through:
1. Collection centres (CC)
2. Small Collection centres (SCC)
With a total of 43 Collection Centers and 359 Small collection centers 4300 Qtl. and 718 Qtl.
average material can be stored respectively. The average income increase per Livelihood
Collective is 20% to 30%.
43 LCs have been covered through CC and 100 through SCC. The target is of 130 CC and 600
SCC.
For marketing facilities 1 Kisan outlet is functional at state level, 10 at district level and 111 at
cluster level. Apart from this 13 haat bazaars (weekly) are also functional.
Convergence and Support is being done through different departments details of which are given
in the table below:
Department Key Activities
Horticulture Seed, Poly Houses, Crop Insurance, Capacity Building, Cement Tank,
Plantation etc.
Agriculture Seed, Compost pit, Soil Training, Tractor, Seed driller, power weeder
and other tools
Rural Development
Department
Compost pit, Indira Awas, Goat Sheds, Toilets and other
Animal Husbandry Cattle insurance, Animal insurance, Cattle Vaccination, Fodder,
Medicines, capacity building and others
Revenue Land for outlets, collection centers, small collection cemters, haat
market etc.
Others Medicinal Aromatic plant, Pension, Solar energy cooker, Street light
etc.
Tabe 3.24 (Source: ILSP)
92
Career Counselling Fair
The main objective was to share all aspects of vocational training with local unemployed and
school dropout youths as per their skills. The other aspects of fairs are
1) Check migration of youth from hills,
2) Provide skills to encourage self-employment,
3) Provide skills to gain wage-employment,
4) Provide skills to develop clusters based on activities related to agriculture/ horticulture/
animal husbandry / tourism, and
5) Women empowerment: More than 17500 youths along with their parents have participated
into fair. On the other side, all empanelled vocational training agencies provided all details
related to trade, training mechanism, placement options, job descriptions, salary range and
benefits. Youths and their parents interacted with all agencies and registered themselves
after review all prospects of particular trades.
(Source: ilsp.in)
Sustainability Workshop
A two-day workshop was organised by Uttarakhand Gramya Vikas Samiti (UGVS) on
December 08 - 09, 2015 for sustainability of producer groups and livelihood collectives/
federations under an apex organization (proposed) named "Hilans". More than 222 leaders from
different federations / livelihood collective was actively participates, express their views in the
workshop. Different brainstorming sessions were organized with different representatives of line
dept., boards and participants.
Way forward for Self-Sustainability:- A two day knowledge sharing workshop was
organized by Uttarakhand Gramya Vikas Samiti (UGVS) on January 09 - 10, 2015 for cross
pollination of ideas and learnings made by the Federations and Producer Groups (PGs)/ SHGs
being supported under IFAD's Integrated Livelihood Support Project (ILSP).
The workshop was comprised of more than 220 participants from 9 hill districts of
Uttarakhand being covered under ILSP including the representatives of 65 federations, Panchayati
Raj Institutions, SHGs and Producer Groups. The main agenda was to bring various stakeholders
particularly the rural community and the institutions on a common platform for sharing the
experiences in their livelihood journey and learn from each other. The external participant was to
be instrumental in bringing in new opportunities of businesses for these community institutions.
The exhibition put up during the event enabled the stakeholders to showcase their products and
gain visibility.
(Source: ilsp.in)

93
3.4.2 Project Coverage:
The project (ILSP) is being implemented by three project implementation agencies UGVS, PS-
WMD and UPASaC. So far, project has supported 121,049 HHs of 13,017 Groups in 3,507
villages (including 980 villages, 3,607 SHGs and 35,377 HHs from ULIPH Project) directly. Total
237 Livelihood Collectives (LCs)/Federations have been formed and registered under the Self-
Reliant Cooperative Act. Under the Vocational Training program, 7,043 youths out of targeted
10,000 have been trained, whereas 5,428 additional youths are undergoing the training. Under
component 2, project is working in 22 Micro Watersheds covering 70194 ha area of 190 Gram
Panchayats. Key highlights of the project are as under (ANNUAL PROGRESS REPORT 2017-
18):
Component 1 – Food Security and Livelihood Enhancement
2344 numbers of LDPE tanks have been constructed under the Irrigation Infrastructure
development and increasing the land area
205 ha area have been covered under fodder cultivation, 250 ha under use of fallow land
and 376 ha area protected through chain linked fencing.
30 numbers of collection centres out of 32 (constructed) are operationalised and they are
pooling farm produce; in addition to this 50 more are in various construction stages.
331 numbers of small collection centres have been constructed and 200 other are in
construction phases.
Under HILANS brand 12 Kisan outlets are opened is being functionalizing in the 8 districts
and getting on an average a profit of INR 1079/ day.
In the collaboration with Agriculture Department, 136 farm machinery banks have been
sanctioned to Livelihood Collectives (LCs) under the All Mission on Agriculture
Mechanization Scheme.
An opportunity for exchange of ideas/technologies/innovations and experiences among
various stakeholders there were 18000 households have participated in 9 Kisan fair
organized at each district.
Out of 17500 youths, 4000 were selected by organizing 20 Career Counselling Fairs
organized at block level under Vocational Training Program.
Component 2 – Participatory Watershed Management
15147 farmers in producer groups.
44453 cubic meters terraces repaired / vegetative field boundary;
478.692 ha homestead plantation, 60.5 ha orchard development
310 poly houses, 278 poly tunnels and 1096 mangers have been developed.
4530 Roof Water Harvesting Tank, 30 Village Pond, 43.548 KM irrigation Channel.
280 Small Bridges (up to 5 mt. Span) constructed.

94
Component 3 – Livelihood Financing
128 Term Loans of INR 219.00 Lakh
406 Cash Credit Limit of INR 272.18 Lakh
2213 Kishan Credit Cards of INR 1016.24 Lakh
3.4.3 Enhancing Food Security and Livelihood opportunities
S.N. Activity Unit Achievement
till 2016-17
Achievement
2017-18
Cumulative
Achievement
till 31st march
2018
1. No. of GPs in which
Producer Groups has
been formed
No. 190 190 190
2. No. of Producer
Groups formed
No. 1462 149 1611
3. No. of Farmers in
Producer Groups
A- Male
B- Female
No. 13908
5644
8364
1239
268
971
15147
5912
9235
Table 3.25: Source: ILSP
3.4.4 Access to Market
S.N. Activity Unit Achievement
till 2016-17
Achievement
2017-18
Cumulative
Achievement till 31st
march 2018
1. No. of Livelihood
Collectives has been
formed
No. 4 26 30
2. No. of LCs has been
registered
No. 4 22 26
3. No. of Gram
Panchayats (GPs) in
LC
No. 25 165 190
4. No. of Members in LC
Male
Female
No. 941
690
251
12030
5142
6888
12971
5832
7139
5. No. of members who
have deposited their
share money
No. 857 3486 4343

95
6. No. of Agribusiness
plan has been prepared
No. 0 10 10
7. No. of Agribusiness
plan has been
implemented
No. 0 1 1
Table 3.26: Source: ILSP
Of the 10 agribusiness plans prepared only one has been implemented by 31st March 2018.
3.4.5 Status of Land Area (Ha) from project initiatives
Particular Total Area (Ha)
Total land area 9289.0
Total cultivable land area 3573.05
Increased land area through project initiatives 3032.09
Total cultivable Land area 6605.14
Table 3.27: Source: ILSP
The cultivable land in the project area has been almost doubled through different initiatives given
below:
3.4.6 Increased Land Area (Ha) from project initiatives
Activity Name Total Area Increased (Ha)
Irrigated Area by LDPE tank 234.56
Crop Sown Area 2132.09
Crop Diversified Area 696.54
Total Cultivable land area 3032.09
Table 3.28: Source: ILSP
3.4.7 Employment and Income after Project Activities
Particulars Activity Minimum
Financial
Support
Employment Avg. Income
Producer Group
(PG)/Vulnerable
Producer Group
(VPG)
Food Security
Improvement
Plan (FSIP)
Rs. 33600 per
member,
additional Rs.
1600 per VPG
member
Minimum 1
person involved
in activities
under FSIP (self-
employment)
Rs. 218/HH/day
at baseline, Rs
425/HH/day
Present

96
Livelihood
Collective (LC)
Agri-Business
Up scaling Plan
(AUP)
Rs. 3600 per
shareholder,
Rs.3.6 Lakh for
AUP
3 Office staff,
shareholders
involve in
business and
other activities
Rs. 12.97 Cr
turnover
Vocational
Training
Skill
Development
training
Training,
Placement
2597 Youths Rs.8000-
Rs.20000
Table 3.29: Source: ILSP
3.4.8 Project Interventions and Impact of Interventions ( upto 31.03.2019)
(Source : ILSP)
A. Micro Irrigation
1966 LDPE tanks constructed – 1593 producer groups with 13987 HHs benefitted
Irrigated area increased- 234.56 Ha
S.No. Financial
Year
Number of
Tanks
constructed
Area
increased
( In Ha)
No of PGs
benefitted
No of HHs
benefitted
1. 2014-15 2 0.22 1 13
2. 2015-16 412 39.30 328 2610
3. 2016-17 668 67.88 555 4275
4. 2017-18 884 127.16 787 7079
Total 1966 234.56 1593 13987
Table 3.30 : Project MIS data analysis
Area expansion of crops from LDPE tanks
S.N. Area increased
( in Ha)
Value chain Crops Name
1. 97.50 Spices Chilly, Garlic, Ginger & Onion
2. 95.71 Vegetables Potato, Pea, Cabbage, Tomato &
Arbi
3. 30.15 Leafy Vegetables Rai, fenugreek, spinach, &
Cucurbits
3. 11.20 Seed Production Paddy , Mandua , Pea, Garlic &
Onion
234.56 Total
Table 3.31 : Project MIS data analysis

97
10 water lifting pump in Garur ,Bageshwar – 10 producer groups with 84 HHs started Cash
crop production
27 LDPE tanks Fish Farming – common carp for additional income from tanks in
Bageshwar.
B. Value Chains based activities
Value chain based cluster development and promotion of value chain activities
accordingly.
5 Value chains are being implemented by the Producer groups and vulnerable producer
groups
Status of Value chains for primary activities
S.N. Name of
Value chain
Groups Village HHs Area in
Ha
Ist output
production
in 1000 kg
/season
Marketed
volume in
1000
kg/season
Ist output
turn over in
Lakh
/season
1 Spices 1782 941 15747 473.2 2403.8 2219.44 1033.31
2 Pulses 589 290 5607 479.97 566.64 335.63 279.88
3 OSV 1322 593 12422 674.52 6700 5466.83 867.2
4
Traditional
crops 630 356 5284 245.61 524.56 254.03 37.95
5 Livestock 1415 618 11874 3772.33 2514.11 811.81
Total 5738 2798 50934 2130.7 13967.33 10790.04 3030.15
Table 3.32 Source- Project MIS data analysis
C. Crop diversification – From traditional crops to Cash crops – Total 696. 54 ha
area increased under Cash crop due to crop diversification from traditional cereal, Millets to
Vegetable, spices and Tulsi.
S.N. Crop Name Variety No. of groups
covered
No. of HHs
covered
Area (in Ha )
Name
1 Seed production of
Tomato, Pea,
Garlic, Quinoa ,
Onion etc.
Tomato- V L tomato
Pea- Arkle
Garlic- VL Garlic &
Parvati
Onion – VL Piyaz
10 100 10
2 Ginger Cultivation Reo de Zenero,
Himgiri & Local
607 3372 105.65
3 Potato Cultivation Kufari Jyoti 294 2584 132.38

98
4 Chilly Cultivation
-Lakhori
Lakhori 211 1650 59.96
5 Onion cultivation VL Pyaz 53 438 12.14
6 Garlic cultivation VL Garlic, Parvati ,
Jamuna safed
142 1076 53.65
7 Pea Cultivation GS -10 ,Azad Pea 358 3046 171.14
8 Tulsi Cultivation Ocimum basilicum
(OB-15), Ocimum
cannum OC-11-
8 100 2
9 Tomato
Cultivation
Himsona, Naveen, 88 1137 29.1
10 Chilly Cultivation Pant Chilly , Local 67 676 39.48
11 Arbi Cultivation Traditional Local 66 699 25.58
12 Lentil Cultivation VL-lentil 32 330 14.92
13 Capsicum
Cultivation
Mahabharat , Tanvi 16 142 3.96
14 Cabbage
Cultivation
Varun, Pride of
India
36 241 32.58
15 Large cardamom Local selection
/HRDI
20 195 4
Total 2008 15786 696.54
Table 3.33 Source- Project MIS data analysis ILSP
D. Promoted Scientific farming practices – Seed replacement, Seed treatment, Line
sowing , Package of Practices, Lifesaving irrigations, Integrated insect & disease management,
Use of Plant protection kit, Light traps, post-harvest management practices (Grading, sorting,
cleaning, Packaging and value addition) etc.
In Spice value chain through project interventions Av. income of Rs. 9287.00/ HH/ Season
/ year reported which is the highest
In Off Season vegetable value chain through project interventions Av. income of Rs.
6999.00/ HH/ Season / year reported
In Pulses value chain through project interventions Av. income of Rs. 5646.00/ HH/
Season/ year reported
In Traditional crops value chain through project interventions Av. income of Rs. 1027.00/
HH/ Season / year reported
Details of value chain wise crops income :-

99
S.N. Name Activity Covered
PGs
Covered
HHs
(No.)
Area
(Ha)
Average
Nali /
HH
Average income
Rs./ HH/ Season /
Year
1 OSV Average 6999
Potato 594 5266 292.14 2.7 6567
Pea 399 3952 260.03 3.28 6617
Tomato 102 1105 36.65 1.65 7984
Cabbage 121 1064 48.76 2.29 9970
2 Spices Average 9287
Chilly 581 5313 228.95 2.15 8442
Garlic 161 1207 56.29 2.33 6211
Ginger 515 4534 164.52 1.8 10913
Turmeric 266 2236 109.44 2.44 10461
Onion 88 745 20.07 1.35 3410
Coriander 13 119 3.03 1.25 3136
3 Pulses Average 5646
Gahat 55 522 67.06 6.42 10376
Lentil 49 454 20.82 2.29 1212
Rajma 272 2803 312.46 5.57 6874
Soybean 176 1443 58.37 2.02 1791
Urd 10 103 11.26 5.46 10010
4 Traditional
crops
Average 1027
Mandua 224 1845 73.36 1.98 979
Cholai 94 784 51.78 3.3 1165
Maize 30 297 17.52 2.94 1371
Table 3.34 Source- Project MIS data analysis
E. Seed production initiatives under various sub-projects
Garlic – Variety Parvati and Zamuna safed seed production in Almora with 15 group
members on 0.5 ha area
Onion variety – VL Piyaz - 3 seed Production in Almora with 25 group members on 0.5
ha area.
Onion – Traditional hill variety seed production in Chamoli with 55 group members on
0.5 ha area in Tharali area.

100
Seed production of Finger millet and Hill Paddy on 10.0 ha areas with 500 group members
as a seed cluster development in Pithoragarh through technical support of KVK
Pantnagar, Agriculture Department ( ATMA) and US&TDC.
S.N Crop name & variety Area in
Ha
PGs
covered
HHs
covered
Village covered
1. Finger millet- VLM -
324
5.0 16 117 7
2. Paddy 5.0 28 143 7
Table 3.35 Source: Project MIS data analysis
F. Innovation activities for supporting the Farmers Income Enhancement
Introduction 80.0 kg seed of Longderma turmeric variety from NE in Chakrata, Dehradun
Introduction of 15.0 Qtl. Pragati (Curcumin content more than 6 %) variety of Turmeric
on 1.5 Ha in 4 districts – Chamoli, Pauri , Rudraprayag and Tehri.
Pulse- Arahar variety – VL arahar -1 production on 1.0 Ha with 52 group members in
Lamchuna village of Garur.
Cash Crop -vegetable production on 2.0 Ha areas with 40 group members.
Vegetable Pea production on 10.0 Ha area with 165 Group members in Raithal village of
Bhatwari, Uttrakashi each member earned average Rs. 35,000 to 50, 000 from pea.
High yielding Varieties of vegetables introduced with 1350 group members on 11.5 ha
areas in Pithoragarh through technical support of KVK – Pithoragarh
Tulsi production on 1.0 ha in Chamoli with 100 women farmers in wild animal infestation
area
Establishment of 2 rice seller plant in Garur Bageshwar - Annapurna and Baiznath SRC /
Federations – 300 Qtl. Paddy procured and threshed in to rice.
Demonstration of XGuard for repelling of wild animal in Sult block of Uttarakhand
results were satisfactory
Introduction of 152 nos. plant protection kit and light traps for integrated disease and pest
management in Tharali, Chamoli and gaur, Bageshwar and Bhikiaysen Almora –
Community owned the activities
G. Innovation sub – project status
Promotion of Goat based Livelihood in 40 villages with coverage of 1200 HHs through the
development of 37 Pashusakhi and 4 Cluster livestock Manager
Promotion of Machine shearing in sheep, treatment camps, vaccination camps and
providing tent , torch and solar lanterns with coverage of 2000 shepherd , 1.0 lakh sheep
and establishment of 6 Paravet centers.

101
Commercial bee Farming with 500 HHs in Almora
Establishment of 64 Integrated Livestock Development center for supporting the dairy
value chain
26 Milk collection centers opened in Almora , Bageshwar ,Tehri & Uttrakashi under
Integrated Dairy Project
54 Paravet centers has been established under Integrated dairy Project
H. Convergence with line Departments
Livestock insurance, Pradhanmantri crop Insurance and weather based crop insurance
schemes implementation.
Custom Hiring Center in Janshakti SRC- Ataal , Dehradun
Biofertilizers & Pesticide , seed agency to federation, Dehradun
50 Qtls. Gola Nashpati @ Rs. 5.00 / Kg from Bageshwar through Uttarakhand
Marketing Board
Arhar Plantation through VPKAS – KVK , Bageshwar
Tejpat Plantation in Bageshwar
5.0 Ha Mulberry plantations in Bageshwar through Sericulture
walnut plantation in Bageshwar
27 LDPE tank – Fish farming in Bageshwar
Cement Tank from MANREGA in Bageshwar
13 units of Azolla cultivation promotion in Rudraprayag
Pauri – Bilkhet fruit plantation on 5.0 Ha land ( Barren / uncultivated )
3.4.9 Key Lessons learned with regards to trainings conducted by ILSP
(ANNUAL PROGRESS REPORT, 2014-15)
Vocational Training Best Practices the project has taken up a pilot programme of around
760 students in 11 different trades based on the community needs and market demand. 91% of
students as targeted (760) were enrolled in five project districts namely Almora (167), Bageshwar
(96), Chamoli (68), Tehri (128) and Uttarkashi (150). The participation of women applicant were
65%. Till the end of FY 2014-15, 445 students were facilitated for job placement after the
completion of training and certification and 234 of these availed the opportunity which included
68% of the women
Candidates after the completion of training and certification and more prone to move back
to routine and the job aspirations are close to their native place.
Mobilization and selection process need to be more counselling based and with systematic
collaborative approach (project team and agency).

102
The programmes executed in residential mode resulted in more successful as compared to
non-residential programme.
It has been experienced that better infrastructure/ resource facilities for vocational training
are available at state level. Practically, students (particularly the girls) prefer the training
at local level which is conducted by the concerned agency by hiring local resources.
Counselling of candidates as well as their parents needs to be done and undertaking from
both to be taken at the time of selection.
Getting 25% contribution from the candidates could be a challenge as several other
programmes are offering similar vocation training at 100% free to candidates with some
additional support. A mechanism needs to be developed to overcome this challenge.
Need for established training centres for rural households to relate to for the safety and
security of their youth especially girls;
There is a greater role required from ILSP team (DMU, TAs and others) for improving the
processes of mobilization and also curtailing the drop outs experienced at different stages
influenced by a number of factors such as cultural, lack of confidence by youth and their
families for want of local level rapport, agencies lack knowledge of local villages etc.
Job placement has been a biggest challenge for the key reasons such as inadequate data
base on the demand for potential employment by trade, the contact of VT institutions with
various companies/agencies needs structured dialogue to stimulate demand where possible
and capture prevailing opportunities. Present job placement was <50%;
Linkages with Sector Skills Councils/NSDC/Others is more on securing the training
contracts and less on the job placement since ILSP is the only project that has a strong pre-
requisite to link training with job placement structurally for a one year period;
For some certification has been an issue, but opportunities are there to link with
NCVT/NSDC/Other independent bodies. It is not certain if the certification from
independent body do hold recognition for employment and also for admission to pursue
further studies/training;
Drop out especially during and post training period. There are a number of reasons such
as pursue further studies in unrelated subject, marriage, family not permitting to leave the
village (need family counselling and more information during mobilization to youth and
families), salary not attractive, others;
Training institutions have the capacity to conduct skills vocational training in a number of
trades;
Most training institutions have expressed boost in the training cost remuneration. This is
primarily influenced by the higher remunerations being offered by the DGTE, but also
have expressed to go along with ILSP in the Post pilot phase. Vocational Training
component is a vast field and need focused efforts to achieve gainful results for the
candidates as well as the project.

103
3.10 STAFF POSITION of ILSP
S.N. Post No. of
sanctioned
posts
Positions
filled
Vacant
positions
remarks
1 2 3 4 5 6
1 Deputy Project Director 4 4 0
2 Assistant director
(project) / assistant forest
guardian
2 1 1 1 on contract in
Champawat division
3 Agricultural /
Horticulture officer
4 2 2 1 in Haldwani , 1 in
Pauri and 1 in C
hampawat on contract
4 Veterinarian 2 2 0
5 Additional statistical
officer
3 2 1 1 in Haldwani and
one in Pauri on
contract
6 Forest Area Officer /
Subject Specialist / Unit
Officer
12 8 4
7 Senior administrative
officer
0 1 -1
8 Administrative officer 3 3 0
9 assistant writer 4 0 4
10 Head assistant 2 1 1
11 Sub forestic 3 2 1 1 in Haldwani and, 1
in Pauri and one in
Champawat on
contract
12 Junior engineer (civil) 4 3 1 1 in Haldwani, 1 in
Champawat and one
in Pauri on contract
13 Junior engineer
(agriculture)
2 2 0 1 in Haldwani and 1
in Champawat on
contract

104
14 Surveyor 3 2 1 1 on contract in
Haldwani
15 Senior Assistant 4 4 0
16 Cartographer 2 2 0 1 on contract in
Champawat division
17 Junior assistant 4 6 -2
18 S.V. officer 9 9 0 3 in Haldwani , 3 in
Pauri and 3 in
champawat on
contract
19 Forestry / Forest daroga 9 8 1 2 in Haldwani and 2
in Champawat on
contract
20 Livestock dissemination
officer
12 5 7 2 in Pauri and 1 in
Champawat on
contract
21 Assistant Agricultural
Officer Class-3
10 5 5
22 Assistant land protection
officer class-3
12 8 4 1 in Pauri and 3 in
Haldwani on contract
23 Forest guard 11 7 4 3 in Pauri, 1 in
Haldwani and 1 in
Champawat on
contract
Table 3.36 : Source: ILSP
7 out of 12 Livestock dissemination officer posts are vacant. 5 of 10 Assistant Agricultural officer
posts are vacant.
Main problems and gaps in the implementation of the project is given below(data provided by
ILSP-IFAD):
PG/VPG formation: Diverse Agro-climatic Conditions and scattered land holding.
Livelihood Collectives: The producers are being sensitizing towards the Collective
approach of Production and Marketing under the project. However, it is challenging as the
land holding in the mountain region are scattered. The availability of Farm Based Storing
Facility through convergence is needed to be introduced in the scattered mountain region,

105
so that collective production and its marketing could get respectable remuneration to the
producers.
Vocational Training: The placement is being offered by VTA so far from Uttarakhand with
Low wages. Convergence with UPNAL, PRD and other govt agency is needed to be
introduced so that youths could get employed with in the state.
LDPE Tanks: The producers are being sensitizing towards the Collective approach of
Production. However, it is challenging as the natural resources are going to be reduced day
by day in mountain region. Conserving Natural Resources facility through convergence is
needed to be introduced in the scattered mountain region, so that collective production
could get improved.
3.5 PRADHAN MANTRI GRAM SADAK YOJNA
3.5.1 In 2018-19 the details of length of roads completed and connected
habitations are given below:
District Completed Length in kms Connected Habitations
Almora 302.137 39
Bageshwar 148.845 11
Chamoli 237.333 23
Champawat 79.525 4
Dehradun 95.945 8
Haridwar 4.000 0
Nainital 75.515 6
Pauri 205.144 31
Pithoragarh 229.501 24
Rudraprayag 64.955 7
Tehri 211.704 24
Udham Singh Nagar 0 0
Uttarkashi 101.665 25
Total 1726.269 202
Table 3.37 Source: ommas

106
A total of 202 habitations were connected under PMGSY in the year 2018-19 with a total
construction of 1,756.269 kms of road. In the year 2017-18 a total of 2017 habitations were
connected with a completed length of 1,839.106.
The habitations for the district of Udham Singh Nagar and Haridwar have been completely
saturated as per the norms/eligibility under PMGSY.
3.5.2 Details of Roads under Community Contracting in Uttarakhand:
PIU Road Name / Bridge Name Road Length Completed
Till Date
Lohaghat Pati Mehroli Motor Road 7.06
Pokhri Kothiyal Sain Saveri Sain to Nandprayag
Devkhal M Road
4.00
Lohaghat Raigalbend Mulakot Motor Road 8.00
Bageshwar Kandhar Rolyana Motor Road 7.00
Lohaghat Chomel Walso Motor Road 2.55
kapkote Cheerabagar pothing Motor Road 7.00
Champawat Roushal Dungra Bora Chek Silkot 5.00
Lohaghat Chamel - Walso Motor Road, Stage I&II
(Missing Link of Phase-II)
1.00
Srinagar Milai - Kui M/R Stage-II 2.10
Bageshwar Kafaligair - Kholsir Motor Road, Stage I & II 7.82
Rudraprayag Gulabrai - Tuna Motor Road Stage II 10.50
Satpuli Kirkhu - Pang M/R Stage-II 7.00
Satpuli Kunjkhal - Kota M/R Stage-II 13.52
Kalsi Chakrata-Lakhamandal Road - Lawari-
Dhatrota Motor Road, Stage-II
6.46
Kalsi Sahiya-Kwanu Motor Road Km 19 - Maletha
Motor Road, Stage-II
7.69

107
Karanprayag-1 Tharali-Dungari - Ruisain Motor Road-Stage
II
7.43
Narendra Nagar Saurpani - Chamarada Devi Motor Road
Stage-II
7.80
Bazro Bedikhal - Chorkinda 4.50
Karanprayag-1 Doongri - Ratgaon Motor Road 6.01
Ruderprayag Koluband to Swarigwans 8.50
Bazro Sounder Bend - Eithi Motor Road 6.61
Jakholi L040-Tilwara Tehri Km 6 to Kot Langa 4.86
Karanprayag-1 L032-Simali to Sankot 8.38
Jakholi L045-Rayari to Arkhund 5.75
Joyolikot Amel - Khola Motor Road 6.00
Kirti Nagar Nainisain - Pathwara Motor Road 12.86
Dwarahat L032-Km 2 of ODR 36 to Jhla Hat 4.70
Tehari-2 L022-Nagni to Bhatusain 4.85
Joyolikot L043-Bajron to Akhosu 5.80
Table 3.38 Source: PMGSY
A total of 29 roads are under community contracting in the state.

108
3.5.3 State Quality Monitor [SQM] District wise Grading Abstract Report
(2018-19)
S: Satisfactory
SRI: Satisfactory but requires improvement
U: Unsatisfactory
Completed Works Ongoing Works Maintenance Works
Dis
tric
t
To
tal N
o. o
f
Insp
ecti
on
s
S
SR
I
U
U%
To
tal
S
SR
I
U
U%
To
tal
S
SR
I
U
U%
To
tal
Almora 100 22 2 0 0.00% 24 51 11 5 7.46% 67 4 0 3 42.86% 7
Bagesh-war
32 7 0 0 0.00% 7 13 4 2 10.53% 19 4 0 1 20.00% 5
Chamoli 59 10 0 1 9.09% 11 27 8 6 14.63% 41 4 1 2 28.57% 7
Champa-wat
21 4 1 0 0.00% 5 8 1 1 10.00% 10 3 2 1 16.67% 6
Dehradun 13 6 0 0 0.00% 6 5 1 0 0.00% 6 1 0 0 0.00% 1
Haridwar 2 2 0 0 0.00% 2 0 0 0 0.00% 0 0 0 0 0.00% 0
Nainital 15 5 0 0 0.00% 5 2 3 1 16.67% 6 0 2 0 0.00% 2
Pauri 64 13 0 1 7.14% 14 32 3 5 12.50% 40 5 2 3 30.00% 10
Pithoragarh
50 9 1 0 0.00% 10 13 15 2 6.67% 30 9 1 0 0.00% 10
Rudraprayag
23 8 1 0 0.00% 9 6 0 1 14.29% 7 3 0 2 40.00% 5
Tehri 50 16 1 0 0.00% 17 26 2 0 0.00% 28 4 0 1 20.00% 5
Uttarkashi
23 5 0 0 0.00% 5 7 7 0 0.00% 14 3 0 0 0.00% 3
Total 452 107 6 2 1.74% 115 190 55 23 8.58% 268 40 8 13 21.31% 61
Table 3.39 Source: ommas
The percentage of unsatisfactory works is highest for maintenance works in 2018-19. It is 21.31%
for the state with 42.86% for Almora, 40% for Pithoragarh and 30% for Pauri. The percentage of
ongoing works that were satisfactory but need improvement is high with 190 of 268 works in the
category (70.89%)

109
3.5.4 Last Five Years: 2015-2019
Completed Works Ongoing Works Maintenance Works
Dis
tric
t
To
tal N
o. o
f
Insp
ecti
on
s
S (
Sat
isfa
cto
ry)
SR
I
U
U%
To
tal
S
SR
I
U
U%
To
tal
S
SR
I
U
U%
To
tal
Almora 336 52 2 0 0.00% 54 188 15 6 2.87% 209 39 4 8 15.69%
51
Bageshwar 213 37 0 0 0.00% 37 91 23 3 2.56% 117 22 3 10 28.57%
35
Chamoli 281 43 0 1 2.27% 44 144 13 7 4.27% 164 18 1 5 20.83%
24
Champawat
136 25 1 0 0.00% 26 66 1 1 1.47% 68 23 2 1 3.85% 26
Dehradun
139 26 0 0 0.00% 26 89 4 0 0.00% 93 14 3 3 15.00%
20
Haridwar 37 20 0 0 0.00% 20 14 0 0 0.00% 14 0 3 0 0.00% 3
Nainital 108 12 0 0 0.00% 12 46 5 2 3.77% 53 26 5 0 0.00% 31
Pauri 280 60 0 1 1.64% 61 154 8 7 4.14% 169 36 4 6 13.04%
46
Pithoragarh
274 46 3 1 2.00% 50 149 33 4 2.15% 186 30 2 1 3.03% 33
Rudraprayag
175 32 1 0 0.00% 33 78 3 2 2.41% 83 20 5 10 28.57%
35
Tehri 275 66 1 0 0.00% 67 162 2 1 0.61% 165 41 1 1 2.33% 43
Udham Singh Nagar
1 0 0 0 0.00% 0 0 0 0 0.00% 0 1 0 0 0.00% 1
Uttarkashi
135 23 0 0 0.00% 23 72 17 7 7.29% 96 12 0 1 7.69% 13
Total 2,390 442 8 3 0.66% 453 1,253 124
40
2.82% 1,417 282 33 46 12.74% 361
Table 3.40 Source: ommas
12.74% of the maintenance works in the last 5 years were unsatisfactory. This percentage
is higher if we look only at last year’s data (21.13%). The quality of maintenance works need to
be improved. Off carriage way maintenance can be done by locals leading to both a sense of
ownership and livelihood source. Routine maintenance activities play an important role in the state
as roads through mountainous areas are prone to landslides and washouts during intense rains and
need regular inspections during this period. Maintenance would ensure functionality of the road
network and prevent loss of asset.

110
New Connectivity
(Sanctioned)
Upgrada tion
(Sanction ed)
Total
(Sanctioned)
New Connectivity
(Completed)
Upgrada tion
(Complet ed)
Total
(Completed)
Sr.
No.
Hill State N
o. o
f R
oad
s
Ro
ad L
eng
th
No
. of
Ro
ads
Ro
ad L
eng
th
No
. of
Ro
ads
Ro
ad L
eng
th
No
. of
Ro
ads
Ro
ad L
eng
th
No
. of
Ro
ads
Ro
ad L
eng
th
No
. of
Ro
ads
Ro
ad L
eng
th
1 Uttarakhand
Total 2,264 17,391.147 126 857.626 2,390 18,248.773 1,082 8,207.550 119 735.961
1,201 8,943.511
Table 3.41 Source:ommas
3.6 DEEN DAYAL UPADHYAY – GRAMEEN KAUSHAL YOJANA (data provided by DDU –GKY) (2018-19)
Deen Dayal Upadhyay Grameen Kaushal Yojana (DDU-GKY) is a flagship scheme of
Ministry of Rural Development and being implemented by State Rural Livelihood Mission. In
context of the state, a target of 5000 trainings and placement of rural youth by 2019 had been set.
The main initiatives taken up:
1- Mobilization and Community Engagement of Rural youth from all 13 District along with
majorly focused on SAGY Villages, Rurban Cluster’s, Mission Antodaya and Backward
districts.
2- Enrolment of eligible youth in Kaushal Panji App. 22,500 Youth has registered in Kaushal
Panji for Skills training and Employment.
3- Organized 80+ Kaushal Mela for awareness and Enrolment of youth in Scheme.
4- Industry tie-ups for placement of candidates,
As of now, USRLM has received requirement of 8000+ trained youth in different sectors.
Setting up of 10 Residential training centres across Uttarakhand has been done.
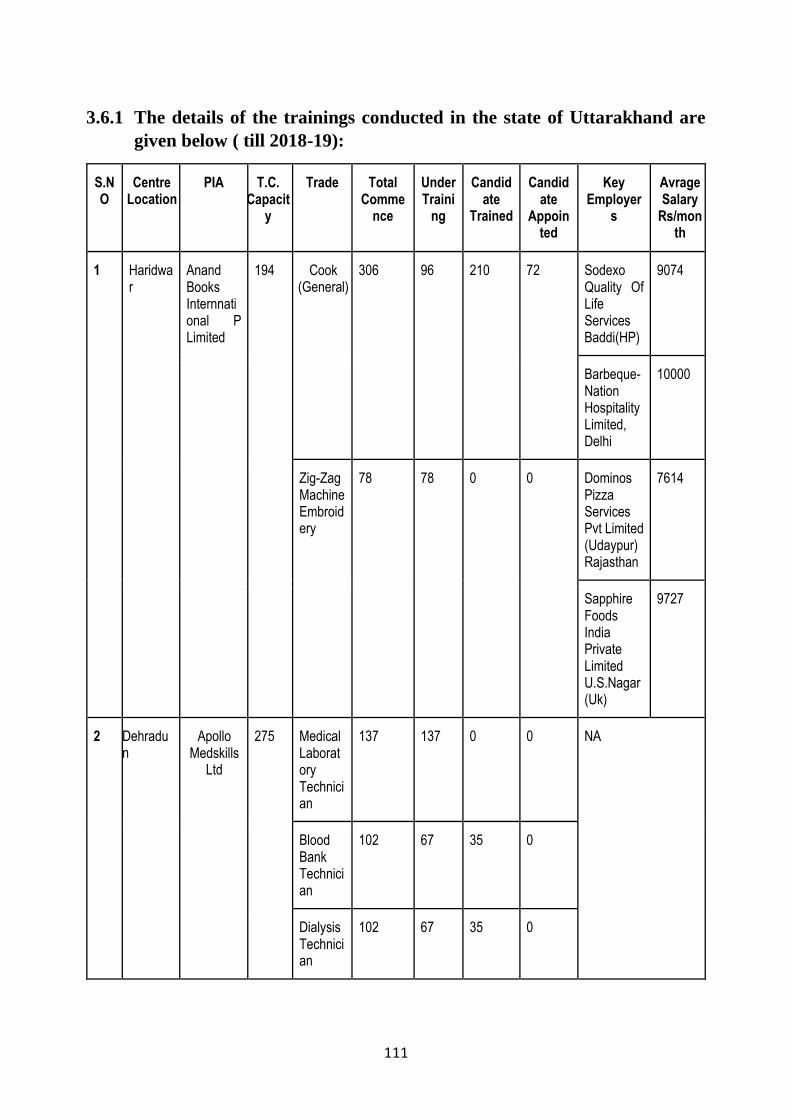
111
3.6.1 The details of the trainings conducted in the state of Uttarakhand are
given below ( till 2018-19):
S.NO
Centre Location
PIA T.C. Capacit
y
Trade Total Comme
nce
Under Traini
ng
Candidate
Trained
Candidate
Appointed
Key Employer
s
Avrage Salary
Rs/month
1 Haridwar
Anand Books Internnational P Limited
194 Cook (General)
306 96 210 72 Sodexo Quality Of Life Services Baddi(HP)
9074
Barbeque-Nation Hospitality Limited, Delhi
10000
Zig-Zag Machine Embroidery
78 78 0 0 Dominos Pizza Services Pvt Limited (Udaypur) Rajasthan
7614
Sapphire Foods India Private Limited U.S.Nagar(Uk)
9727
2 Dehradun
Apollo Medskills
Ltd
275 Medical Laboratory Technician
137 137 0 0 NA
Blood Bank Technician
102 67 35 0
Dialysis Technician
102 67 35 0

112
Emergency Medical Technician
35 35 0 0
3 Dehradun
Dev Rishi Educational Society
35 Accounts Assistant using Tally
70 35 35 17 The Ranger Resorved Ramnagar (Nainital )
9045
4 Pauri Garhwal
Divine International Foundation
35 Sales Person (Retail)
55 20 35 20 Ison Bpo India Pvt.Ltd Dehradun
8100
5 Nainital Khalsha Consultancy Services Private Limited
60 Cook (General)
93 33 60 20 Burger King India Private Limited (U.S.Nagar)
10130
Sunrays Hotels N Resorts (i)
8800
6 Almora Marg Erp Limited
150 Accounts Assistant using Tally
118 89 29 19 NA
Accounting
30 30 0 0
7 Nainital Pro Mind Solutions Private Limited
105 Emergency Medical Technician - Advanced
105 105 0 0 NA
8 Nainital Teamlease Services Ltd
180 Cook (General
)
150 90 60 50 The Fern Residency Vadodara (Gujrat)
11612
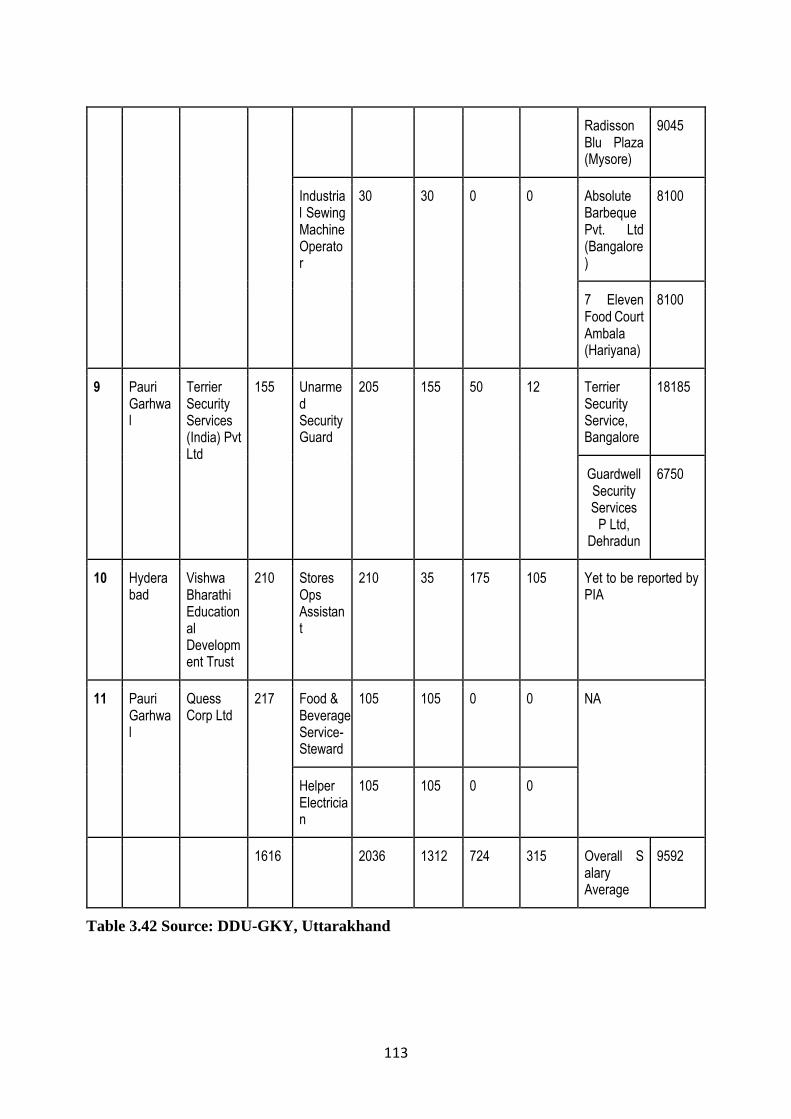
113
Radisson Blu Plaza (Mysore)
9045
Industrial Sewing Machine Operator
30 30 0 0 Absolute Barbeque Pvt. Ltd (Bangalore)
8100
7 Eleven Food Court Ambala (Hariyana)
8100
9 Pauri Garhwal
Terrier Security Services (India) Pvt Ltd
155 Unarmed Security Guard
205 155 50 12 Terrier Security Service, Bangalore
18185
Guardwell Security Services
P Ltd, Dehradun
6750
10 Hyderabad
Vishwa Bharathi Educational Development Trust
210 Stores Ops Assistant
210 35 175 105 Yet to be reported by PIA
11 Pauri Garhwal
Quess Corp Ltd
217 Food & Beverage Service-Steward
105 105 0 0 NA
Helper Electrician
105 105 0 0
1616
2036 1312 724 315 Overall S
alary Average
9592
Table 3.42 Source: DDU-GKY, Uttarakhand
114
The average salary through placements after training is around Rs. 9592. The aim of DDU
GKY is placement for atleast 70% of all trained. Of the 724 trained in the state, a total of 315 have
been placed which is 43.5 percent. It can also be seen that maximum trainings though being
conducted within the district, lead to migration. This is due to lack of employability within the
region. The placements shown in the table above are either in the plain areas of Uttarakhand or
outside the state. Though the skilling and placements of the youth cannot be disregarded, there is
a need to identify skills that are region specific/ need based in order to arrest migration.
The scheme is targeting organised sector. This makes placement in the region itself is
difficult as most of the business’ running in the region are unorganised. This leads to non-
availability of pay-slips and tracking of the placed student, which is a mandate in DDU-GKY.
Convergence with State Skill Mission to conduct skill gap study to understand the
aspirations of youth, with Labour and Employment Department for identification of local job
market and design of centralized LMIS for tracking of candidates, with other state government
departments to build awareness of the scheme and mobilization of youth for trainings needs to be
strengthened.
The scheme was started in 2016 but it’s proper implementation in the state only started in
February 2018. The initial target was of training 5000 youth by 2019. The Project is substantially
lagging behind the set target given to the late implementation.
Main gaps as pointed out by the department are:
Non- availability of industry at the district level.
High Aspiration of candidates.
Work force demand in urban areas.
Convergence being done under the scheme:
Convergence with State Skill Mission to conduct skill gap study to understand the
aspirations of youth.
Convergence with Labour and Employment Department for identification of local job
market and design of centralized LMIS for tracking of candidates.
Convergence with other state government departments to build awareness of the scheme
and mobilization of youth for trainings.
3.6.2 DDU-GKY (State performance report 2017-18 and action plan 2018-19)
Against a target of skilling of 5000 candidates under DDU-GKY between 2016 and 2019,
no candidate could be skilled by 28th February 2018. Nodal agency designated by state for
monitoring and implementing DDU-GKY projects is Uttarakhand state rural livelihood mission
(UKSRLM), also central technical support agency designated by MoRD for monitoring projects
is NABCONS.

115
The performance for both years has been really disappointing with no candidate being
trained in both financial years. There is a total outlay of Rs. 54.6 Crores (Including Support Cost)
approved by the Empowered Committee for NRLM, out of which centre has already released
17.01 Crores to the state.
The physical progress itself is slow as state is yet to sanction 975 candidates more to
complete approved target of 5000 candidates. In terms of Human Resources, also state has not
adhered to scheme guidelines and has in place 1 COO and 5 thematic positions against the strength
of 1 COO+ 8 Thematic positions. In terms of center capacity utilization, state has approved 10
project, however only 1 Teaching Centre is installed by state with a capacity of 105, where only
35 candidates were undergoing training leading to 33% capacity utilization only.
RSETI : Uttarakhand has 13 Rural State Employment Training Institute (RSETIs) and they have
trained a total of 6479 candidates as on 28th February 2018 against the target of 6610. These rural
unemployed youths are trained to be self-sufficient entrepreneurs by means of self-sustaining skill
training. Total candidates settled in self-employment as on 28th Feb 2018 is 3599, where 104
candidates are settled in wage employment.
Land allocation is pending for RSETIs in two districts of Rudraprayag and Tehri Garhwal (New
Tehri). Also 3 districts are awaiting construction clearance, Chamoli (Gopeshwar), Champawat
and Uttarkashi.
3.6.3 Uttarakhand Skill Development Mission
Sn. PMKVY 2.0 Centrally Sponsored State Managed Component (Table 3.54)
1 Training Partners (Since Inception) 44
2 Trained (By training partners) 12444
3 Current ongoing Trainings and partners (data) 1436
4 Training Centres (with regional distribution) 86 47 Garhwal 39 Kumaon
5 Placed 2385
7 Strategy / the basis of choosing the skills NSDC Skill Gap Study.
275 Job Roles covered under PMKVY
2.0 CSSM
A total of 12444 people have been trained under the PMKVY 2.0 of which only 2385 have been
placed. The placement is substantially lower than the total number trained. This suggests that the
trainings are not need based or are not able to meet the aspirations of the candidate.
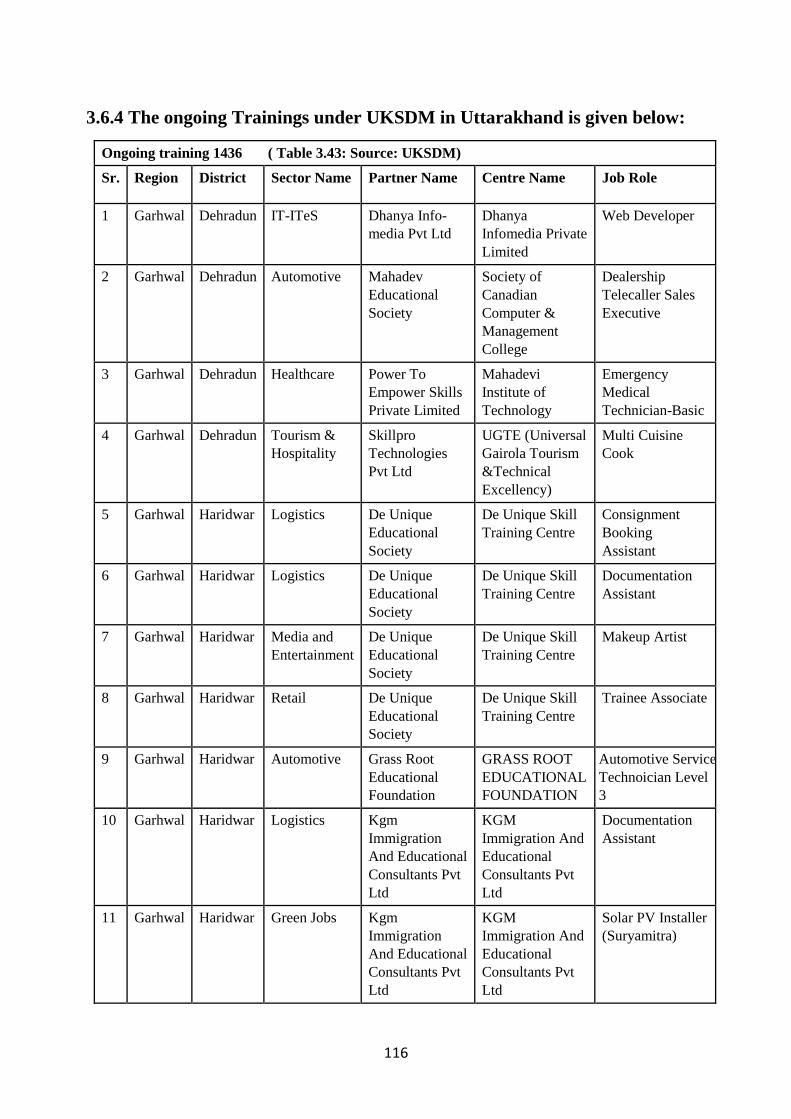
116
3.6.4 The ongoing Trainings under UKSDM in Uttarakhand is given below:
Ongoing training 1436 ( Table 3.43: Source: UKSDM)
Sr. Region District Sector Name Partner Name Centre Name Job Role
1 Garhwal Dehradun IT-ITeS Dhanya Info-
media Pvt Ltd
Dhanya
Infomedia Private
Limited
Web Developer
2 Garhwal Dehradun Automotive Mahadev
Educational
Society
Society of
Canadian
Computer &
Management
College
Dealership
Telecaller Sales
Executive
3 Garhwal Dehradun Healthcare Power To
Empower Skills
Private Limited
Mahadevi
Institute of
Technology
Emergency
Medical
Technician-Basic
4 Garhwal Dehradun Tourism &
Hospitality
Skillpro
Technologies
Pvt Ltd
UGTE (Universal
Gairola Tourism
&Technical
Excellency)
Multi Cuisine
Cook
5 Garhwal Haridwar Logistics De Unique
Educational
Society
De Unique Skill
Training Centre
Consignment
Booking
Assistant
6 Garhwal Haridwar Logistics De Unique
Educational
Society
De Unique Skill
Training Centre
Documentation
Assistant
7 Garhwal Haridwar Media and
Entertainment
De Unique
Educational
Society
De Unique Skill
Training Centre
Makeup Artist
8 Garhwal Haridwar Retail De Unique
Educational
Society
De Unique Skill
Training Centre
Trainee Associate
9 Garhwal Haridwar Automotive Grass Root
Educational
Foundation
GRASS ROOT
EDUCATIONAL
FOUNDATION
Automotive Service
Technoician Level
3
10 Garhwal Haridwar Logistics Kgm
Immigration
And Educational
Consultants Pvt
Ltd
KGM
Immigration And
Educational
Consultants Pvt
Ltd
Documentation
Assistant
11 Garhwal Haridwar Green Jobs Kgm
Immigration
And Educational
Consultants Pvt
Ltd
KGM
Immigration And
Educational
Consultants Pvt
Ltd
Solar PV Installer
(Suryamitra)

117
12 Garhwal Pauri
Garhwal
Tourism &
Hospitality
Power To
Empower Skills
Private Limited
Power To
Empower Skill
Training Centre
Trainee Chef
13 Garhwal Tehri
Garhwal
Electronics
and Hardware
Dhanya
Infomedia Pvt
Ltd
Dhanya
Infomedia Private
Limited
Field Engineer -
RACW
14 Kumaun Almora Telecom Facilitation And
Awareness Of
Community For
Empowerment
Face Society
FACE Skill
Center
Broadband
Technician
15 Kumaun Nainital Logistics De Unique
Educational
Society
De Unique Skill
Training Center
Warehouse
Supervisor
16 Kumaun Nainital Healthcare Kumaun
Paramedical &
Health Institute
KUMAUN
PARAMEDICAL
& HEALTH
INSTITUTE
General Duty
Assistant
17 Kumaun Nainital Electronics
and Hardware
Vidya VAP
TECHNOLOGY
Field Technician
- Computing and
Peripherals
18 Kumaun Nainital Tourism &
Hospitality
Vidya VAP
TECHNOLOGY
F & B Service:
Steward
19 Kumaun Nainital Beauty and
Wellness
Vidya VAP
TECHNOLOGY
Beauty Therapist
20 Kumaun Nainital Life Sciences Vidya Vahini
Education
&Charitable
Trust
Sarvodaya Skill
Development
Center -
Kotabagh
Medical Sales
Representative
21 Kumaun Nainital Apparel VidyaVahini
Education
&Charitable
Trust
Sarvodaya Skill
Development
Center
Self Employed
Tailor
22 Kumaun Nainital Electronics
and Hardware
VidyaVahini
Education
&Charitable
Trust
Sarvodaya Skill
Development
Center
Field Technician
- Networking and
Storage
23 Kumaun Nainital Retail VidyaVahini
Education
&Charitable
Trust
Sarvodaya Skill
Development
Center
Retail Team
Leader
24 Kumaun Nainital Green Jobs VidyaVahini
Education &
Charitable Trust
Sarvodaya Skill
Development
Center
Solar PV Installer
(Suryamitra)

118
25 Kumaun Nainital Tourism &
Hospitality
VidyaVahini
Education
&Charitable
Trust
Sarvodaya Skill
Development
Center
Front Office
Associate
26 Kumaun Nainital Tourism &
Hospitality
Vidya Vahini
Education
&Charitable
Trust
Sarvodaya Skill
Development
Center
Multi Cuisine
Cook
27 Kumaun Nainital Automotive VidyaVahini
Education
&Charitable
Trust
Sarvodaya Skill
Development
Center
Dealership Sales
and Value Added
Services
Executive
28 Kumaun US
Nagar
Construction Mitr Ek Saanjha
Prayaas
Galaxy Trade and
Training Centre
Assistant
Electrician
29 Kumaun US
Nagar
Beauty and
Wellness
N I A C E
Foundation
Sarv Jan Kalyan
Kendra
Beauty Therapist
30 Kumaun US
Nagar
Electronics
and Hardware
N I A C E
Foundation
Sarv Jan Kalyan
Kendra
Field Technician
- Computing and
Peripherals
31 Kumaun US
Nagar
Electronics
and Hardware
Paryavaran
Evam Jan
Kalyan Samiti
PEJKS Skills Field Technician
- Computing and
Peripherals
32 Kumaun US
Nagar
Domestic
Worker
Vidya Vahini
Education
&Charitable
Trust
Sarvodaya Skill
Development
Center -
Kotabagh
Housekeeper cum
cook
Source: UKSDM
Of the current ongoing trainings in the state, 16 are in Dehradun, Haridwar and Udham Singh
Nagar; 13 are in Nainital and 1 in Almora, 1 in Pauri and 1 in Tehri. This clearly shows that the
maximum number of training are being conducted in the plain districts of Uttarakhand, pointing
towards skewed regional distribution.
Training Centers – Regionwise
86 Training Centers
47: Garhwal Region
39:Kumaun Region
53 Job Roles

119
3.7 PRADHAN MANTRI AWAAS YOJNA
3.7.1 Details of last five years
Table 3.44 PMAY Year 2018-19
District Under Construc
tion Houses
Yearly Target
Cumulative fulfillment
Toilet Gas Stove Category wise
completed houses:
Women
Landless Handi-capped
Dehradun 502 0 793 793
635 0 0
Haridwar 376 0 418 418
276 0 0
Chamoli 239 0 567 567
567 0 0
Uttarkashi 108 0 132 132
120 0 0
Tehri 89 0 348 348
293 0 0
Pauri 3 0 181 181
138 0 0
Rudraprayag 0 0 2 2
2 0 0
Garhwal Mandal
1317 0 2441 2441
2031 0 0
Pithoragarh 52 0 383 383
359 0 0
Champawat 542 0 194 194
91 0 1
Almora 10 0 133 133
120 0 0
Udham Singh Nagar
984 0 1636 1636
1082 0 0
Bageshwar 15 0 65 65
39 0 0
Nainital 98 0 87 87
50 0 0
Kumaon Mandal
1701 0 2498 2498
1741 0 1
Grand Total 3018 0 4939 4939
3772 0 1
4910 housing of Indra Housing / Pradhan Mantri Awas Yojana (Rural) was under construction in 2017-18 which will be completed this year.
The target for the financial year 2018-19 has not been given by the Government of India.
Table 3.45 PMAY 2017-18
District Under Constructio
n Houses
Yearly Target
Cumulative
fulfillment
Toilet Gas Stove Category wise completed
houses: Women
Land less
Handicapped
Dehradun 1091 225 1499 1499 0 1203 0 0
Haridwar 652 378 1766 1766 0 1654 0 0
Chamoli 651 710 311 311 0 311 0 0
Uttarkashi 137 275 314 314 0 310 0 0
Tehri 40 470 686 686 0 589 0 0
Pauri 43 325 41 41 0 0 0 0

120
Rudraprayag 2 0 109 109 0 108 0 0
Garhwal Mandal
2616 2383 4726 4726 0 4175 0 0
Pithoragarh 415 425 293 293 0 213 0 0
Champawat 46 710 46 46 0 37 0 0
Almora 121 180 85 85 0 80 0 0
Udham Singh Nagar
1592 750 1694 1694 0 1410 0 1
Bageshwar 6 77 159 141 0 123 0 0
Nainital 114 390 314 314 0 234 0 0
Kumaon Mandal
2294 2532 2591 2573 0 2097 0 1
Grand Total
4910 4915 7317 7299 0 6272 0 1
4306 of Indra Housing / Pradhan Mantri Awas Yojana (Gramin) in the year 2016-17 and 298 of the disaster, totalling 4604, were under construction which was completed this year.
Table 3.46 PMAY 2016-17
District Under
Constru
ction
Houses
Yearly
Target
Cumulative
fulfillment
Toilet Gas Stove Category
wise
completed
houses:
Women
Landless Handi-
capped
Dehradun 359 2203 335 335 335 302 0 0
Haridwar 1015 2355 568 394 0 568 0 0
Chamoli 89 393 273 273 273 270 0 0
Uttarkashi 10 335 304 304 0 290 0 0
Tehri 580 186 847 847 847 782 0 0
Pauri 84 283 265 132 0 225 0 0
Rudraprayag 126 29 1414 1414 0 1052 0 0
Garhwal
Mandal
2263 5784 4006 3699 1455 3489 0 0
Pithoragarh 97 288 30 30 0 16 0 0
Champawat 46 625 31 31 0 31 0 0
Almora 63 58 249 249 0 249 0 0
Udham Singh
Nagar
1153 3588 1942 1942 0 799 0 0
Bageshwar 210 115 147 147 0 146 0 0
Nainital 156 403 139 139 139 0 0 0
Kumaon Mandal 1725 5077 2358 2538 139 1241 0 0
Grand Total 3988 10861 6544 6237 1594 4730 0 0

121
Table 3.47 PMAY 2015-16
District Under Construction
Houses
Yearly Target
Cumula-tive
fulfillment
Toilet Gas Stove Category wise
completed houses: Women
Landless Handi-capped
Dehradun 694 436 462 462 462 406 0 0
Haridwar 1373 1271 1702 1702 0 1361 0 0
Chamoli 99 264 350 350 350 324 0 0
Uttarkashi 234 314 31 31 0 0 0 0
Tehri 1427 397 696 696 696 573 0 0
Pauri 171 136 136 136 0 58 0 0
Rudraprayag 1540 794 794 794 0 681 0 0
Garhwal Mandal
5538 3612 4171 4171 1508 3403 0 0
Pithoragarh 80 125 1958 1958 0 1802 0 0
Champawat 160 46 210 210 210 190 0 0
Almora 266 285 285 285 0 269 0 0
Udham Singh Nagar
1981 2009 2019 2019 0 1569 0 0
Bageshwar 190 242 55 55 0 33 0 0
Nainital 22 113 113 113 113 106 0 0
Kumaon Mandal
2699 2820 4640 4640 323 3969 0 0
Grand Total 8237 6432 8811 8811 1831 7372 0 0
Table 3.48 PMAY 2014-15:
District Under Construc
tion Houses
Yearly Target
Cumula-tive
fulfillment
Toilet Gas Stove Category wise
completed houses: Women
Landless Handi-capped
Dehradun 1089 796 437
399 0 0
Haridwar 1817 1013 843
771 0 0
Chamoli 448 165 292
252 0 0
Uttarkashi 3 185 154
115 0 0
Tehri 1746 955 285
9 0 0
Pauri 148 298 102
56 0 0
Rudraprayag 1540 2025 655
472 0 0
Garhwal Mandal
6819 5437 2768
2074 0 0
Pithoragarh 1891 107 881
852 0 0

122
Champawat 84 130 190
133 0 0
Almora 291 101 206
188 0 0
Udham Singh Nagar
1900 1395 1405
1234 0 0
Bageshwar 58 130 147
139 0 0
Nainital 22 167 192
127 0 0
Kumaon Mandal
4246 2030 3021
2673 0 0
Grand Total 11065 7467 5789
4747 0 0
In maximum number of houses built as per the mandate, toilets have been built. Provision of
providing Gas stove seems to be lagging behind. In 2016-17 of the total 6544 houses built only
1594 were provided with gas stove. Convergence needs to be strengthened in the PMAY-G to
include basic amenities in the houses built under the scheme.
Number of handicapped people who got house under PMAY-G has remained low with a total of
2 people registered in the last 5 years.
The number of women beneficiaries under the scheme remains to be high in all the 5 years with
more than 50% of the total beneficiaries.
3.7.2 PMAY-G (State performance report 2017-18 and action plan 2018-19)
In last financial year a target was taken to re-map all villages to PMAY-G Gram
Panchayats was undertaken, 4127 villages out of a universe of 4146 villages with eligible
beneficiaries have been mapped with PMAY-G Gram Panchayats.
In an endeavour to ensure proper data collection for beneficiaries, target was taken to
achieve 100% AADHAR Seeding for registered PMAY-G Beneficiaries. AADHAAR has been
entered for 9794 beneficiaries out of a total of 10,692 beneficiaries who were registered in 2016-
17, and for 1581 out of a total of 2,218 beneficiaries registered in 2017-18. Revised target was
taken to close all seeding by 30th June 2018.
Under this scheme, a cumulative target of 14,082 units had been taken between 2016 and
2018. 10,421 units have been sanctioned to eligible beneficiaries as on 4th April, 2018. Out of
which, construction has been completed for 5.552 houses. Target was taken to complete sanction
of all 14,082 houses by 30th April 2018, and complete construction of 7,000 houses by 10th April
2018 and balance numbers to be completed by 31st December 2018.
State has also identified 981 beneficiaries who do not own land of their own for
construction of dwelling unit. Land had been provided to 504 landless beneficiaries and target was
to provide to remaining 477 beneficiaries by 31st December 2018.

123
In addition to this 2 aspirations districts have been identified by NITI Aayog for their
holistic development against a scheduled timeline
3.8 PERSONNEL OF RURAL DEVELOPMENT DEPARTMENT AND
THIER CAPACITY BUILDING
The Rural Development department of Uttarakhand has been given the prime
responsibility of implementing these programmes and its officers and staff play an important role.
The current staff position is given below.
3.8.1 CAPACITY BUILDING
The capacity building of the personnel of the RD department is mainly through the ETC’s
and Uttarakhand Institute of Rural Development and Panchayati Raj (UIRDPR), Rudrapur, Other
than these there are few capacity building programmes outside the state for the RD personnel.
3.8.1.1 Extension Training Centers (ETCs)
The Extension Training Centers (ETCs) function under the State governments at Regional
level to impart training to the rural development functionaries and elected representatives of
Panchayati Raj Institutions at village and block level. So far, 89 ETCs have been established and
upgraded all over the country with Central assistance. Consequent on increase in the number of
developmental functionaries and the need for providing training to members of Panchayati Raj
institutions, ETCs have acquired an added importance. Central assistance is provided is 100% for
non-recurring expenditure and up to a maximum of Rs. 10.00 lakh per ETC per annum for
recurring expenditure to enable them to cope with increased training load for RD functionaries
and PRI members.
The ETCs conduct courses for rural artisans, rural entrepreneurs, Self - Help Group
(SHGs), Gram Sevaks/Sevikas, Secretaries of Panchayats and Co-operatives, grass-root level
functionaries of all development departments, orientation to schemes like Watersheds, etc. in
addition to courses for PRI members, members of Village Monitoring Committees at Block and
Gram Panchayat level.
Currently there are 8 ETCs in Uttarakhand. Details of the trainings conducted in each
centre since 2015 are given in tables below:
Table 3.49 Extension Training Centre: Deorkhadora (Gopeshwar)
S. No. Venue of Training
Name of Post
Year of Training
Duration of Training days
Total employees invited for the training
Total employees present for training
No. of absent employees
1 Extension Training
Account Clerk
2015-16 - - - -

124
2 Center, Deorkhadora (Gopeshwar, Chamoli)
GPVA/ADO 03 50 50 -
3 Account clerk
2016-17 03 23 23 -
4 GPVA/ADO 03 59 59 -
5 Account Clerk
2017-18 03 25 11 14
6 GPVA/ADO 03 50 29 21
Account clerk and GPVA/ADO
2018-19 01 72 72
Table 3.50 Extension Training Centre Tharkot : Pithoragarh
S. No.
Venue of Training
Name of Post
Year of Training
Duration of Training days
Total employees invited for the training
Total employees present for training
No. of absent employees
1 Extension Training Centre, Tharkot, Pithoragarh
Assistant Development Officer
2015-16 3 days 20 17 3
2 Establishment and account clerk
2015-16 3 30 25 5
3 Village Development Officer
2016-17 3 40 32 8
4 Village panchayat development officer
2016-17 3 40 56 -
5 Assistant development officer
2016-17 3 20 20 -
6 Village development officer
2017-18 3 64 45 19
7 Establishment and account assistant
2017-18 3 26 20 06

125
8 Village development officer
2018-19 3 64 42 22
9 Assistant development officer
2018-19 3 24 10 14
10 Establishment and accounts assistants
2018-19 3 32 17 15
Table 3.51 Extension training centre : Rudrapur (Udham Singh Nagar)
S. No.
Venue Name of post Year of Training
Duration of Training days
Total employees invited for the training
Total employees present for training
No. of absent employees
1 Extension Training Centre, Rudrapur
VDO/GPDO 2015-16 3 days 40 38 2
2 NEWLY APPOINTED VDO
2015-16 6 months 36 36 -
3 Training of group B and Group C employees of RD and other line departments
2015-16 12 days 70 67 3
4 Members and post holders of C.R.P. and S.H.G.
2015-16 6 days 60 62 -
5 Public Representative/SHG/NGO/BNB officer
2015-16 1 day 350 752 -
6 Gram Panchayat member and B.N.B. chairman, Yuva/YuvtiMangal Dal/retired government officer
2015-16 1 day 700 942 -

126
7 Pradhan, Member Area Panchayat
2015-16 1 day 210 233 -
8 Member gram panchayat/ Bharat Nirman Sevak
2015-16 1 day 1300 1135 -
9 C.R.P., S.H.G. post holders, N.G.O. postholders
2015-16 6 days 60 59 1
10 Assistant development officer/ Class 2 officer
2016-17 3 days 20 18 2
11 Village Development Officer/GPDO
2016-17 3 days 40 23 17
12 Establishment and accounts officers of all development departments
2016-17 3 days 40 39 1
13 Block and village vevelLokSuchnaAdhikari
2016-17 1 day 120 131 -
14 C.R.P/N.G.O/ S.H.G officer
2016-17 5 days 80 79 1
15 S.HG. postholders
2016-17 2 days 80 76 4
16 Vigilance and monitoring Committee members, Bharat NirmanSewak/ employees of line departments
2016-17 3 days 200 217 -
17 Vigilance and monitoring Committee members, Bharat NirmanSewak/ employees of line
2016-17 2 days 200 201 -

127
departments
18 B.F.T. member
2016-17 90 days 60 45 15
19 Village Development officer/GPVA
2017-18 3 days 40 37 3
20 Establishment and accounts officer of all development departments
2017-18 3 days 30 30 -
21 Block and Village level loksuchna Adhikari, Assistant lok Suchna Adhikari
2017-18 1 day 90 99 -
22 Village Development officer/ GPVA/ Village and area panchayat representative, S.H.G. Member
2017-18 3 days 450 389 61
23 O.T.C. training 2017-18 3 days 3920 3150 770
24 Newly joined patwari and lekhpal
2017-18 9 months 57 57 -
25 Assistant Development Officer/ Class 2 officer
2018-19 3 days 15 12 3
26 VDO/GPVA 2018-19 3 days 40 35 5
27 Establishment and accounts officers of all development departments
2018-19 3 days 30 29 1
28 O.T.C. Training
2018-19 3 days 750 750 -
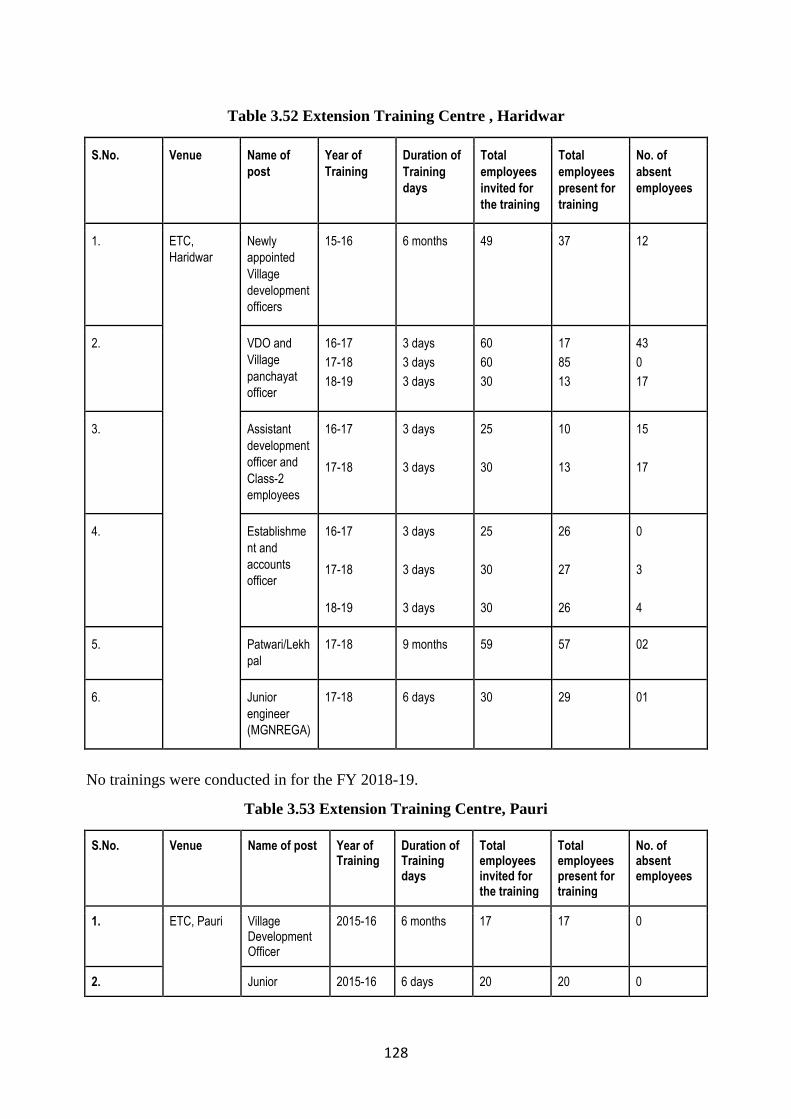
128
Table 3.52 Extension Training Centre , Haridwar
S.No. Venue Name of
post
Year of
Training
Duration of
Training
days
Total
employees
invited for
the training
Total
employees
present for
training
No. of
absent
employees
1. ETC,
Haridwar
Newly
appointed
Village
development
officers
15-16 6 months 49 37 12
2. VDO and
Village
panchayat
officer
16-17
17-18
18-19
3 days
3 days
3 days
60
60
30
17
85
13
43
0
17
3. Assistant
development
officer and
Class-2
employees
16-17
17-18
3 days
3 days
25
30
10
13
15
17
4. Establishme
nt and
accounts
officer
16-17
17-18
18-19
3 days
3 days
3 days
25
30
30
26
27
26
0
3
4
5. Patwari/Lekh
pal
17-18 9 months 59 57 02
6. Junior
engineer
(MGNREGA)
17-18 6 days 30 29 01
No trainings were conducted in for the FY 2018-19.
Table 3.53 Extension Training Centre, Pauri
S.No. Venue Name of post Year of Training
Duration of Training days
Total employees invited for the training
Total employees present for training
No. of absent employees
1. ETC, Pauri Village Development Officer
2015-16 6 months 17 17 0
2. Junior 2015-16 6 days 20 20 0

129
assistant
3. Group B and Group C
2015-16 12 days 40 33 7
4. Group B and Group C
2016-17 12 days 40 40 0
5. Administration officer, Head assistant,seniorAssistant, Junior Assistant
2016-17 5 days 30 21 9
6. Village Development Officer
2016-17 4 days 150 83 67
7. Revenue sub inspector (Patwari / Lekhpal)
2017-18 8 months 75 75 0
8. B.D.O,V.D.O/V.P.D.O
2017-18 2 days 300 205 95
9. VDO and VPDO
2018-19 3 days 150 110 40
In 2018-19 110 VDOs/VPDOs attended training of 150 invited.
Table 3.54 Extension Training Centre, Hawalbagh (Almora)
S.No. Venue Name of post
Year of Training
Duration of Training days
Total employees invited for the training
Total employees present for training
No. of absent employees
1. ETC, Hawalbagh
Pre-service training selected Village Development Officer
2015-16 6 months 29 29 0
2. - 2016-17 - - - -

130
3. ABDO/Class 2 officers Village Development Officer Village Panchayat Development Officer Revenue sub inspector/Patwari /Lekhpal
2017-18 3 days 3 days 3 days 9 months
25 35 70 93
15 12 58 93
10 23 12 0
4. ABDO/ Class 2 officers Village Panchayat Development Officer
2018-19 3 days 3 days
30 60
29 22
1 38
The total VDOs who attended the training in the ETC is low , 22 out of 60.
Table 3.55 Extension Training Centre, Shankpur, Dehradun
S.No. Venue Name of post
Year of Training
Duration of Training days
Total employees invited for the training
Total employees present for training
No. of absent employees
1. Extension Training Centre, Shankpur, Dehradun
Accounting and general clerk, administrative officer
2015-16 3 days 50 32 18
2. Newly appointed VDO
2015-16 6 months 44 44 0
3. Chief Servants
2015-16 32 days 200 184 16
4. In the year 2016-17, 4 sessions of 3 month training of barefoot technicians 6 sessions of trainings for Development Block level Public Information Officer (Pradhan) were organized Training of government personnel was not conducted 5.
6. District level officer
2017-18 1 day 39 30 9

131
7. Newly appointed Revenue sub inspector/Patwari /Lekhpal
2017-18 9 months 75 72 3
8. Accounting and computer operator
2018-19 1 day 90 90 0
9. Assistant Development officer/Class 2 officers
2018-19 3 days 24 18 6
10. VDO/VPDO 2018-19 3 days 36 28 8
11. ABDO/VDO 2018-19 2 days 36 28 8
12. Accountant and computer operator
2018-19 2 day 30 16 14
Table 3.56 Extension Training Center, Haldwani (Nainital)
S.No. Venue Name of post
Year of Training
Duration of Training days
Total employees invited for the training
Total employees present for training
No. of absent employees
1. Extension Training Centre, Haldwani
Assistant Development officer/ Group 2 officers
2015-16 3 days 30 10 20
2. VDO/VPDO 2015-16 3 days 40 38 2
3. Accounsst and establishment officers of all Development departments
2015-16 3 days 30 27 3
4. Assistant Development Officer
2016-17 3 days 30 15 15
5. VDO/VPDO 2016-17 3 days 40 52 -

132
6. Accounsst and establishment officers of all Development departments
2016-17 3 days 30 53 -
7. Accounts and establishment officers of all Development departments
2017-18 3 days 30 29 1
8. BDO, ABDO, VDO, BMM/DPO and MGNREGA/ NRLM Staff
2018-19 2 days 80 105 -
9. ABDO,ADO,VDO,VPDO,BFT Employment worker
2018-19 1 day 50 191 -
10. BDO,ABDO,BMM,Accountant, MIS operator and VDO
2018-19 2 days 60 95 -
3.8.1.2 Uttarakhand Institute of Rural Development and Panchayati Raj
(UIRDPR), Rudrapur, Udham Singh Nagar
S.No. Name of post Year of Training
Duration of Training days
Total employees invited for the training
Total employees present for training
No. of absent employees
Curriculum
Year 2015-16
1. Zila Panchayat Chaiman and Vice Charman
2015 27-29 April (3 days, 1 training)
26 11 15 Rajiv G Andhi Panchayat Sashaktikaran Abhiyan
2. Block Pramukh 2015 5-7 May (3 days, 1 training)
95 18 77 RGPSA
3. Govt. officials and NGOs functionaries
2015-16 20 Nov-11 Feb (3 day, 10 trainings)
500 407 170 ToT on RGPSA

133
4. Village Level handicraftsman
2015 27 April-30 May (6 days, 4 trainings)
150 124 26 Skill development on mukhyamantrishilpvikasyojana
5. RD/PR, Line Department Govt. officials and NGO finctionaries,KP/GP Members
2015 20 April-14 October(5days,4 trainings)
150 112 38 Promotion of sustainable rural livelihood , rural credit for poverty alleviation
6. Newly appointed GPVA
2015 17 Aug-20 Sept(6days, 2 trainings)
63 63 0 Panchayati Raj Training under RGPSA
7. Block/Vilage level officials functionaries and engineers, Masons
2015-16 3 Nov to 11 Mar (3 days,2 Trainings)
100 81 19 ToT-2 Course on Book-Keeping and Accountancy under IAY
8. Assistants of CSS(direct recruits)
2015-16 1 June -4 March (5 days, 9 trainings)
350 319 31 Village attachment programmes
9. PRI Members and ICDS Official and NGOs
2015 8 Sept-9 Oct (3 days, 2 trainings)
125 99 26 Gender budgeting Programme
10. Project Members and Gram Panchayat Secretary
2015 7 and 8 May (1 day, 2 trainings)
100 84 16 IWMP Training Programmes
11. SHGs and GVAs/GPVAs
2015-16 14 Dec- 19 March (6 days, 13 trainings)
433 433(off campus)
67 National Rural Livelihood Mission (NIRD Networking)
12. ZP/KP members and GP members
2015-16 28 Oct-30 Mar (3 days, 37 Trainings)
2500 2343 (2283 off campus)
157 BRGF training Programmes (3 in campus, 60 participants and 34 off campus Programmes, 2283 participants)
13. IAS,PCS Officers and students of GBPAU, Pantnagar
2015 24 april- 28 Oct (1-3 days, 5 trainings)
150 139 11 Orientation training Programme on RD/ PR
14. ERs and SHGs members
2016 17-18 march (1 day, 5 trainings)
200 180 20 Orientation training Programme on RD/ PR
15. Panchayat Official Functionaries
2015 22-23 dec (2 days, 1 training)
65 61 4 E-Panchayat Training in Plan plus software

134
16. Education,UREDA Dept. and Gender Perspective and Law Department. Official functionaries
2015-16 20 July - 11 March (1 and 2 days, 4 trainings)
300 260 40 Venue/Co-ordination Programmes (Education, UREDA Dept. and Gender Perspective and Law)
Table 3.57 (Source: UIRDPR)
S.No. Name of post Year of Training
Duration of Training days
Total employees invited for the training
Total employees present for training
No. of absent employees
Curriculum
Year 2016-17
1. ZP Chairman, Vice-Chairmans, Members and official Functionaries
2016 5 May-15 June (3 days, 13 trainings)
413 394 19 Orientation training under RGSPA
2. NGOs Functionaries 2016 31 May-2 June (3 days, 1 training)
30 30 0 ToT Training Programmes
3. PR Official Functionaries 2016 10 June-4 June (2 days, 2 trainings)
60 57 3 GPDP Plan Plus Software TRaining Programmes under PGPSA
4. District Resource Team Members
2016 28 Apr-11 May (3 days, 3 trainings)
90 76 14 Training Programme under MGNREGA
5. PD/APD, DDO and AEs, training of Assistant, Statistics officers, DRDA and Computer operators
2016 6 Jun-14 Oct (1 day, 5 trainings)
150 128 22 PMAY-G SECC 2011 for Data Feeding Training Programmes
6. Assistant Section Officers
2016-17 17 Oct- 20 Jan (5 days, 3 trainings)
115 115 0 Village attachment Programme for direct recruits Assistants of central Secretariat
7. Semi-Skilled Masons 2016 22 Aug-5 Oct (45 days, 6 trainings)
30 30 0 Training Programme for semi-skilled masons in field level undey IAY
8. ABDO,ADO,GVA,GPVA and SHGs members
2017 6 Mar-28 Mar
400 333 67 Orientation training on RD

135
(2 days, 10 trainings)
Schemes under State budget
9. Official Functionaries of ICDS and Women Gram Pradhans
2017 12-14 Jan (3 days, 1 training)
60 50 10 Gender budgeting Training programmes
10. ABDO, ADO, GVA, GPVA,JE (MGNREGA) KP Members, Pradhans, Gram Rozgar Sewak and SHGs
2017 16 Feb-3 March(1 and 2 days, 14 trainings)
465 465(433 off campus)
0 Orientation training on RD Schemes under recurring budget
11. Barefoot Technicians 2016-17 1 Oct-25 Mar (90 and 2 days, 24 trainings)
750 641 (596 off campus)
109 Training programme under MGNREGA
12. ADO, GVA, Gram Pradhan and Gram Rozgar Sewak
2016 6 Dec-16 Dec (2 days, 3 trainings)
90 83 7 Orientation training under MGNREGA
13. RD and Line Department Official NGOs
2016 8-10 April (3 days, 1 training)
50 46 4 Training Programme on Primary health, jointly recognised by India Red Cross Society and Disaster Management US Nagar
14. IWMP official functionaries and village members
2016 26 Sept-10 Nov (3 days, 3 trg)
90 89 1 Training programmes IWMP
15. SRP,DRP,BRP,GRP (Master trainers) and Community Resource Persons (CRP)/Active women
2016-17 29 Aug-3 March (6 and 12 days, 4 trainings)
300 273 27 Training Programme under NRLM
16. IAS officers, livestock, Cattle and ICDS Supervisors, Lab Technicians and Blood bank Incharge
2016-17 10 june-25 March (1,2 and 3 days, 6 trainings)
150 143 7 Other Training Programme (IAS,NLSM,ACDS)
17. Department of education, swajal, election office functionaries
2016-17 13 July-28 Jan (1,2,3,4 and 6 days, 19 trainings)
950 940 10 Venue/Co-ordination Programmes (Department of Education, Swajal,Election office)
S. No.
Name of post Year of Training
Duration of Training
Total employees
Total employees
No. of absent
Curriculum

136
days invited for the training
present for training
employees
Year 2017-2018
1. CRP,BRP and Active Women
2017-18 17 April- 10 Mar (6 days, 3 trainings)
250 233 17 Training programme under NRLM
2. Tablet sakhiyan, Block Mission Manager, Accountant, Project Assistant cum computer operator and MIS
2017 24 April-25 May (2 and 6 days, 3 trainings)
150 140 10 MIS Training under NRLM
3. SHGs and federation members
2017 27-29 July and 17-20 Sept (3 days, 2 trainings)
30 28 2 Capacity Building Training for module development under NRLM
4. DDOs, APDs, SRP, BRP, ABDOs,GVAs, CRP, SHGs and bankers
2017 4 Sept-31 Dec (2 and 6 days, 9 trainings)
360 314 46 Training Programmes on role of Bank in the implementation of NRLM
5. Officer of directorate audit, district audit cell, ADO,GPVA, GVA, Accountant and junior engineer
2017 13 June- 12 July (2 days, 3 trainings)
105 93 12 CAG Orientation Training under PAnchayati Raj
6. DOs panchayat and GPVA
2017 2 -22 Nov (2 days, 2 trainings)
75 63 12 ToT on GPDP under Panchayati Raj
7. GPVA and officials of all the district panchayati raj offices
2018 16-18 Jan(3 days,1 training)
50 48 2 PES Software training under Panchayati Raj
8. Block Development Officers and Executive officers of Zila Panchayat
2018 29 Jan- 14 March (45 days, 1 training)
23 23 0 Foundation courses for BDOs
9. NGOs and SHGs Members, non-officials, JE, MGNREGA and Rojgar Sewak, Govt. Officials, ABDO/ADO, GVA, GPVA, Gram Pradhans
2017-18 6 Nov- 29 March (3-5 days, 49 trainings)
1250 1266(652 off campus)
0 Orientation trainings on RD schemes
10. UIRDPR, ETCs and RD officials, BDOs, ABDOs, GVA, Livestock
2017 3 July-30 Nov (2 and 4 days, 7 training)
280 266 14 Refresher/Orientation training on RD Schemes
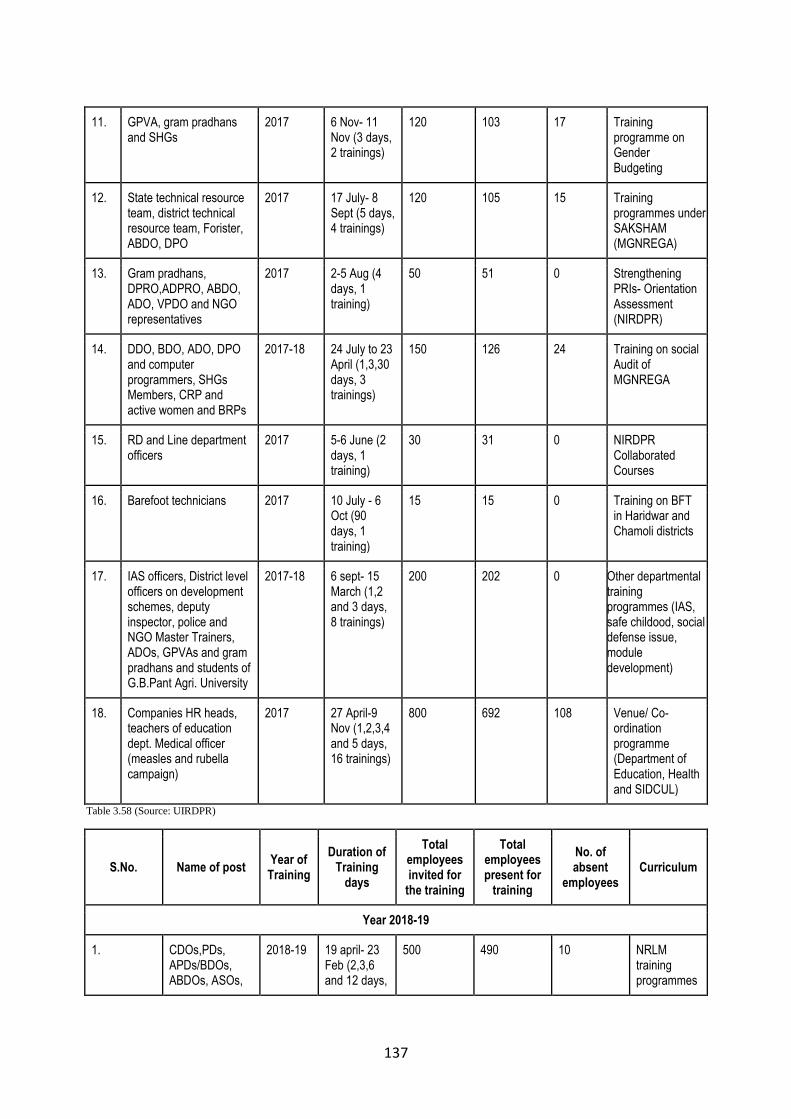
137
11. GPVA, gram pradhans and SHGs
2017 6 Nov- 11 Nov (3 days, 2 trainings)
120 103 17 Training programme on Gender Budgeting
12. State technical resource team, district technical resource team, Forister, ABDO, DPO
2017 17 July- 8 Sept (5 days, 4 trainings)
120 105 15 Training programmes under SAKSHAM (MGNREGA)
13. Gram pradhans, DPRO,ADPRO, ABDO, ADO, VPDO and NGO representatives
2017 2-5 Aug (4 days, 1 training)
50 51 0 Strengthening PRIs- Orientation Assessment (NIRDPR)
14. DDO, BDO, ADO, DPO and computer programmers, SHGs Members, CRP and active women and BRPs
2017-18 24 July to 23 April (1,3,30 days, 3 trainings)
150 126 24 Training on social Audit of MGNREGA
15. RD and Line department officers
2017 5-6 June (2 days, 1 training)
30 31 0 NIRDPR Collaborated Courses
16. Barefoot technicians 2017 10 July - 6 Oct (90 days, 1 training)
15 15 0 Training on BFT in Haridwar and Chamoli districts
17. IAS officers, District level officers on development schemes, deputy inspector, police and NGO Master Trainers, ADOs, GPVAs and gram pradhans and students of G.B.Pant Agri. University
2017-18 6 sept- 15 March (1,2 and 3 days, 8 trainings)
200 202 0 Other departmental training programmes (IAS, safe childood, social defense issue, module development)
18. Companies HR heads, teachers of education dept. Medical officer (measles and rubella campaign)
2017 27 April-9 Nov (1,2,3,4 and 5 days, 16 trainings)
800 692 108 Venue/ Co-ordination programme (Department of Education, Health and SIDCUL)
Table 3.58 (Source: UIRDPR)
S.No. Name of post Year of
Training
Duration of Training
days
Total employees invited for
the training
Total employees present for
training
No. of absent
employees Curriculum
Year 2018-19
1. CDOs,PDs, APDs/BDOs, ABDOs, ASOs,
2018-19 19 april- 23 Feb (2,3,6 and 12 days,
500 490 10 NRLM training programmes

138
PE, DMM,CRP, block/village level RD officers, GVA, BMM, accountant and branch managers
10 trainings)
2. District level RD/PR and line department officers
2018 17 May- 5 June (2 days, 2 trainings)
80 65 15 Orientation Training on Panchayati Raj under RGPSA
3. GVA, GPVA, JE MGNREGA and Rozgarsewak, yuva/mahilamangal dal and SHGs, PRDs, CRPs, active women and BFT
2018-19 12 June- 31 March (3 days, 48 trainings)
1200 1233 - Orientation training on RD schemes
4. GPVAs, accountants and clerks
2019 5 Jan-28 Feb (3 and 4 days, 8 trainings)
300 251 49 Refresher/ Orientation training on RD schemes
5. GPVAs and gram pradhans
2018 10-12 July (3 days, 1 training)
25 21 4 Training on social defense issue
6. Block resource persons
2018 26 April- 25 May (30 days, 1 training)
30 30 0 Training programme on social audit of MGNREGA
7. UIRDPR and ETCs official functionaries and block/ village level officers, engineers of RD and line departments
2018 28 May- 7 Sept (2,3,4 and 5 days, 4 trainings)
100 78 22 NIRDPR collaborate courses
8. Women of silk SHGs
2018-19 8 May- 27 Feb (1 day, 12 trainings)
1200 1200 0 Orientation training on RD and PR
9. Assistant section officers
2018 21 May- 1 June (5 days, 2 trainings)
60 60 0 Village Attachment Programmes
10. IAS, PCS Officers, dairy
2018-19 29 June- 19 Jan
2500 2146(1616 off campus)
354 Other departmental
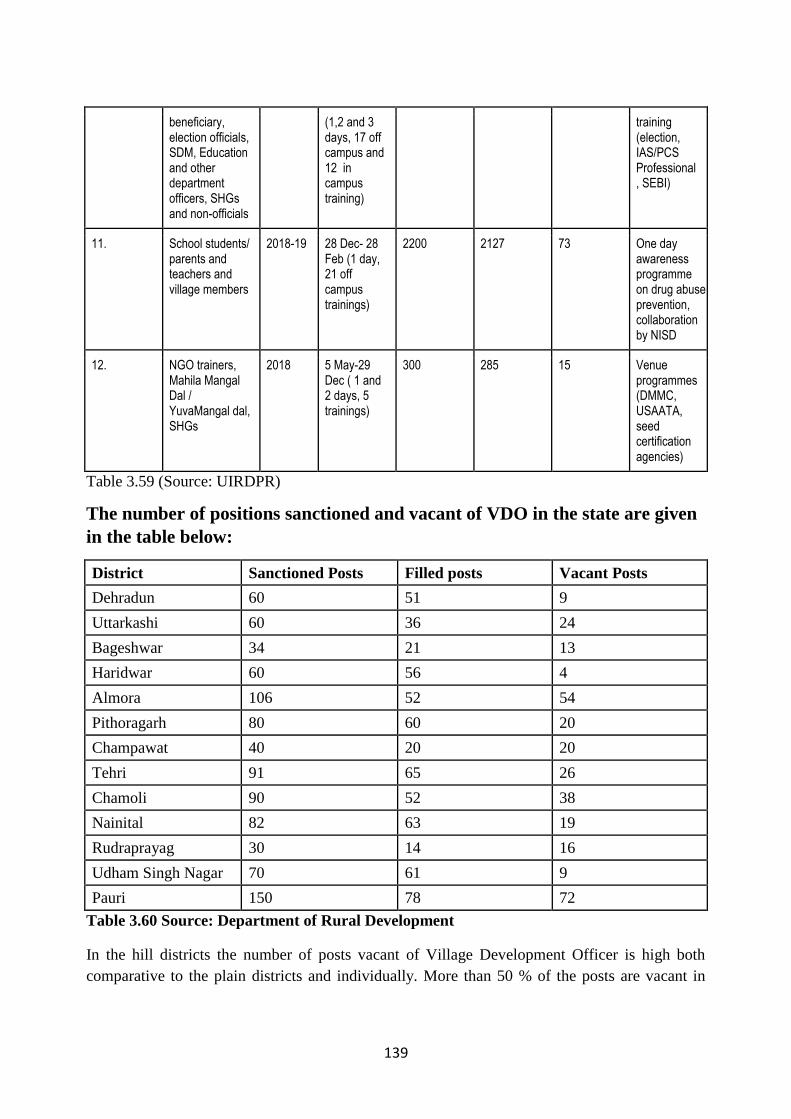
139
beneficiary, election officials, SDM, Education and other department officers, SHGs and non-officials
(1,2 and 3 days, 17 off campus and 12 in campus training)
training (election, IAS/PCS Professional , SEBI)
11. School students/ parents and teachers and village members
2018-19 28 Dec- 28 Feb (1 day, 21 off campus trainings)
2200 2127 73 One day awareness programme on drug abuse prevention, collaboration by NISD
12. NGO trainers, Mahila Mangal Dal / YuvaMangal dal, SHGs
2018 5 May-29 Dec ( 1 and 2 days, 5 trainings)
300 285 15 Venue programmes (DMMC, USAATA, seed certification agencies)
Table 3.59 (Source: UIRDPR)
The number of positions sanctioned and vacant of VDO in the state are given
in the table below:
District Sanctioned Posts Filled posts Vacant Posts
Dehradun 60 51 9
Uttarkashi 60 36 24
Bageshwar 34 21 13
Haridwar 60 56 4
Almora 106 52 54
Pithoragarh 80 60 20
Champawat 40 20 20
Tehri 91 65 26
Chamoli 90 52 38
Nainital 82 63 19
Rudraprayag 30 14 16
Udham Singh Nagar 70 61 9
Pauri 150 78 72
Table 3.60 Source: Department of Rural Development
In the hill districts the number of posts vacant of Village Development Officer is high both
comparative to the plain districts and individually. More than 50 % of the posts are vacant in

140
Almora, 50% in Champawat, 40 % in Uttarkashi and 38% in Bageshwar. This points towards the
shortage in the field staff (staff at grassroots level) which effects the implementation of policies
on ground. With more responsibility on the VDO’s in the region their efficiency also decreases.
The posts should be filled as soon as possible so as to ensure better and efficient implementation
on ground.
References:
http://ddugky.gov.in/
http://jicauttarakhand.org/van-panchayat/
http://mnregaweb4.nic.in/netnrega/all_lvl_details_dashboard_new.aspx
http://mnregaweb4.nic.in/netnrega/citizen_html/demregister.aspx?page=S&lflag=eng&state_na
me=UTTARAKHAND&state_code=35&fin_year=2018-
2019&source=national&Digest=5STZ13v3kbB+HYVZR+3h5A
http://omms.nic.in/#
http://pmgsy.nic.in/circulars/RCPLWEA22feb17.pdf
https://aajeevika.gov.in/content/welcome-deendayal-antyodaya-yojana-nrlm
https://daynrlmbl.aajeevika.gov.in/UI/Shared/Reports.aspx
https://nrega.nic.in/netnrega/mgnrega_new/Nrega_home.aspx
https://nrega.nic.in/netnrega/mgnrega_new/Nrega_StateReport.aspx?typeN=2
https://rhreporting.nic.in/netiay/newreport.aspx
https://www.msde.gov.in/nationalskilldevelopmentcorporation.html
rural.nic.in
www.nrlmskills.in

141
Chapter 4
UTTARAKHAND DECENTRALISED WATERSHED
DEVELOPMENT PROJECT
This project is being implemented through the Directorate of Watershed Development of
the Uttarakhand Government and is based on external funding of the World Bank. Prior to this, a
series of similar projects have been implemented in various parts of the state, thus providing
valuable experience and inputs for refining various approaches.
No. Project Name Duration Area Expenditure Execution
1 South Bhagirathi
Phase-I Project
financed by the
European Economic
Community (E.E.C)
1982 to
1988
District Tehri
Garhwal
(6MWS),172 sq.
km.
Rs. 6.46
Crore
Through Line
Department
2 Himalayan Integrated
Watershed
Management Project
financed by the World
Bank
1983 to
1992
District Pauri
and Almora (75
MWS),2867 sq.
km.
Rs. 80.49
Crore
Through Line
Department
upto the year
1987-88
3 South Bhagirathi
Phase-II Project
financed by the
European Economic
Community (E.E.C)
1988 to
1996
District Tehri
Garhwal(18
MWS),356 sq.
km.
Rs. 19.56
Crore
by the project
administration
under the
Unified
command.
4 Bhimtal Project Project
financed by the
European Economic
Community (E.E.C)
1991 to
1998
District
Nainital(8
MWS),216 sq.
km.
Rs. 12.68
Crore
by the project
administration
under the
Unified
command.
5 Doon Valley
Watershed
Management Project
Project financed by the
European Economic
Community (E.E.C)
1993 to
December
2001
District
Dehradun,Tehri
and Nainital(62
MWS),2408 sq.
km.
Rs. 102.12
Crore
by the project
administration
under the
Unified
command.
6 IWDP (Hills-II)
Shiwalik Project
Project financed by the
World Bank
1999 to
2005
District
Pauri,U.S Nagar
and Nainital(24
MWS),573 sq.
km.
Rs. 189
Crore
by VDC.

142
7 Reconstitution Of
Watershed
Management
Directorate by giving a
permanent form to the
watershed management
department.
Nominating Watershed
Management
Directorate as the
nodal agency for
Watershed-based
projects executed by all
departments. 2004-
2012: Commencement
of Uttarakhand
Decentralized
Watershed
Development Project
(GRAMYA) under
Panchayati Raj
Institution.
Sep 2004
– March
2012
District
Pauri,U.S Nagar
and Nainital(24
MWS),573 sq.
km.
Rs 488 Crore By GP (Gram
Panchayat)
Table 4.1 Source: GRAMYA website
4.1 World Bank aided “Uttarakhand Decentralized Watershed
Development Project” (UDWDP- GRAMYA).
• Area- District Dehradun, Tehri, Uttarkashi, Pauri, Rudrprayag, Chamoli, Bageshwar,
Champawat, Pithoragarh, Almora and Nainital (76 MWS), 2348 Sq.km.
• Duration - from year 2004 to year 2012
• Expenditure - Rs.488 Crore
Implementation of Project works on the basis of Community participation.
Global Environment Facility (GEF) Trust Funded UDWDP sub project- SLEM
• Area- District Uttarkashi, Rudraprayag, Bageshwar and Nainital (under UDWDP 20
MWS), 608 Sq.km.
• Duration - from year 2009 to year 2013
• Expenditure - Rs.37.60 Crore
• Implementation of Project works on the basis of Community participation
4.1.1 Administrative structure:
1. Establishment of Watershed Management Directorate: Watershed Management
Directorate (WMD) was established as a nodal agency for coordinating and monitoring

143
the implementation of all state sponsored, centrally sponsored, externally aided and other
schemes of integrated watershed development projects in the state.
2. Establishment and maintenance of State Level Watershed Development and Monitoring
Council: The Govt has created a State Level Watershed Development and Monitoring
Council to supervise and monitoring all watershed development programmes and schemes
being implemented by various departments across the state
3. State Level Watershed Council:- The State Govt has established a State Label Watershed
Council under the Chairmanship of Hon'ble Chief Minister for monitoring & evaluation
of all the watershed and similar nature of Projects in the state of Uttarakhand.
4.1.2 GRAMYA 1
The project was spread over an area of around 2348 sq Km. in 76 selected MWS in Middle
Himalayas. A total of 468 identified Gram Panchayats in 18 Development Blocks of 11 Districts
were covered in this project. An estimated 2,58,000 population of the project area was aimed to
be benefit from the project outcomes.
Name of
Districts
Name/ No. of
Development Block
No. of
MWS
No. of
GPs
Area of
GPs(Ha.)
Population
of GPs
Area of
MWS
(Ha.)
Dehradun Kalsi (1) 7 52 21925.43 27666 19192
Tehri
Garhwal Jaunpur,Thauldhar (2) 8 31 6882.54 14278 12127
Uttarkashi Chinyalisaur(1) 5 33 5131.27 16800 16835
Pauri
Garhwal
Dwarikhal, Jaiharikhal
(2) 6 30 10014.73 11107 12995
Rudrapyag Augustmuni (1) 5 52 9968.67 38111 20349
Chamoli Gairsain (1) 7 27 4979.47 179731 32075
Almora Chaukhutia, Dwarahat (2) 3 46 8190.32 24034 12669
Bageshwar Bageshwar, Garur,
Kapkot (3) 13 47 8925.23 27788 35743
Champawat Lohaghat, Barakot (2) 8 66 22763.95 37358 28510
Pithoragarh Gangolihat (1) 9 44 11946.66 24004 17242
Nainital Okhalkhanda, Dhari (2) 5 40 8163.93 17935 27050
Total 18 76 468 118892.26 258054 234787
Table 4.2 Source: GRAMYA 1

144
The project period was from 2004-2012. Original Project Development Objectives (PDO)
and Key Indicators (as approved) (Source: ICR, GRAMYA 1)
The PDO of Gramya I was to improve the productive potential of natural resources and
increase incomes of rural inhabitants in selected watersheds through socially inclusive,
institutionally and environmentally sustainable approaches. It encompassed three broad themes:
(a) Community participation in watershed development and management aimed at integrating
land-water management with the objectives of increased soil moisture retention and
improved biomass production, while simultaneously enhancing incomes and livelihood
options;
(b) Strengthening the administrative capacity of GPs to manage project financial resources,
implement sub-projects, deliver legally mandated services (in the context of natural
resource management), and sustain those services beyond the duration of the project; and
(c) Ensuring equitable participation by all groups, especially the landless and women who rely
disproportionately on common-pool resources for fodder, fuel, and other forest products.
The original PDO indicators were:
i. 10 percent increase in household income (over baseline) in targeted villages;
ii. 10 percent increase in vegetation and biomass index of treated watersheds;
iii. 15 percent increase in availability of water over baseline for domestic and/or
agriculture use; and
iv. 20 percent improvement in administrative capacity of GPs as measured by
performance indicators.
4.1.3 The Final Impact Assessment (report of TERI study):
1- Improving the productive potential of natural resources: The productivity and irrigated
area under almost all key crops show an increase. The increase in area (21%) and value
(27%) are significantly higher than the target values. The key reasons for such increase
have been credited to the increased availability of water due to soil and water conservation
activities. Poly houses and polytunnels constructed have been a major contributing factor
to the growth of offseason vegetables.
According to the report, wherever processing centres have been established, post
harvesting operations have been successfully adopted in the grading and packing of vegetables,
spices, pulses etc. Commercial packing with different trade names proved to be attractive for sale
of these products in local markets, fairs and even in the outside market. Agribusiness ventures
have been successful in several places and there exist several innovative cases. The report
highlights the agribusiness activity in Garsain on account of its innovative arrangement of reverse
profit’.

145
2- The number of livestock belonging to improved breeds shows a notable increase. Members
of Vulnerable Groups have been major beneficiaries. On the whole, there have been 19%
and 191% increases in the holdings of improved breed cows and buffaloes respectively in
the sampled GPs. There has been an overall 9.6% increase in fodder availability over the
baseline.Theaverage fodder production ranged between 0.5 -5.67 q/ha/year across
different land uses. The highest percentage change (24.18%) in availability of fodder was
recorded for irrigated agriculture land suggesting that farmers in the project area have been
motivated to grow fodder crops / trees on the bunds /risers of their agriculture resulting in
increase in fodder availability. The percentage change in household dependency for fodder
and grasses from private agricultural/barren land/other land is the highest (13%),while
dependency on fodder from forests and feed purchased from market have declined by 8%
and 5% respectively. On an average, there has been an 11% reduction in times pen ton
collecting fodder by a household.
3- It was observed in the assessment that the biomass of the treated areas has increased by
9.37% from 2004-05 to 2011-12 (across treated micro watersheds). These changes were
on account of increase in vegetation cover due to new plantations under the project and
natural regeneration of grasses, shrubs and tree seedlings because of the protection against
grazing and over usage. The average survival percentage within the surveyed sites was
around 45% in a range of 23% to 85%. The impact of soil and water conservation measures
is seen in terms of increased amount of irrigated land(increase of 24.7%),an increase in
crop yields and an increase in access to domestic water. The time spent in collecting water
has significantly reduced with a sharp increase (48%) in the number of households taking
< 1 hour to collect water and a similar decrease (39%) in the number of households taking
between 1-2 hours. In terms of efficacy of impacts, it is seen that turbidity levels during
monsoon months have reduced significantly in the case of successful catchment
treatments.
4- The total increase in income across all categories is 57%, but increase in farm income is
overall higher (61.1%) than non-farm incomes (56.6%).The total increase in income of
57%translates to a real income increase of 17% when adjusted for inflation using the
Consumer Price Index (CPI) for rural laborers, using agricultural year average values, and
accounting for the impact of non-project interventions. There is almost a doubling in the
ownership of consumer durables, indicating a general increase in living standards. The
economic analysis of the project includes benefits from agriculture, livestock, horticulture,
forestry, soil conservation, domestic water and employment. Following the approach used
in the PAD, aggregate level economic analysis has been done. The Benefit Cost Ratio
(r=8%, t=10 years) works out to 2.63 including the employment benefits. The Economic
Rate of Return is estimated at 18.5%.
Economic analysis has also been done for selected interventions as well as for selected
IGAs(Income Generating Activities)-Irrigation channels and irrigation tanks return BCR values
of 1.36 and1.54 respectively over a 10 year horizon, indicating their economic viability even in

146
the medium run. Participation in Gram Sabha and Gram Panchayat meetings, show a sharp
increase. For example, the attendance percentage in Gram Sabha meetings has doubled and the
attendance percentage of women in Gram Sabha meetings has increased fivefold. The average
number of GP meetings has increased from 5.28 in a year to 11.14 in a year. The assessment also
point towards a high degree of transparency in various project processes. An average of 78.96%
of total households in a Gram Panchayat has been involved in the preparation of GPWDP. An
average of 48.7% of the community members was aware of GP budget and expenditure and 91%
of households were aware of project objectives, activities and methodologies. Though the initial
response to the process of FIG formation was low, as the produce of off-season vegetables and
cash crops increased and farmers started selling the surplus, the response picked up and helped
establish the necessary market linkages. The level of transparency in the project has been quite
high largely on account of different levels of auditing (CA,internal and CAG) and regular
Participatory Monitoring and Evaluation (PME). Most of the interventions undertaken under the
agriculture and horticulture component have strong potential of sustainability. For instance,
minikits have been effectively utilized by almost all the farmers and wherever the productivity
has substantially increased, the farmers have retained the seeds to be used for the next agriculture
season. The soil conservation structures that withstood the heavy rainfall in 2010 and 2011 have
served their purpose to a large extent, and the formation of UGs for maintenance of these structures
is a step towards ensuring post-project sustainability. In case of plantations, most of the activities
have been taken up in Van Panchayats, managed by Van Panchayat committees with strict codes
of conduct and usufruct sharing. It could be expected that these institutions would ensure adequate
upkeep of the plantations.
Fig 4.1: Percentage income change (source: Final Impact Assessment ,TERI)

147
4.1.4 LEARNING’S FROM THE PROJECT: The learning’s from the project
according to the report were as follows:
Partnering with NGOs for social mobilization, project implementation and support for
Agribusiness was a successful initiative in the project. The human resource development by the
project would be useful for central sponsored Integrated Watershed Management Programme as
well as for follow on projects. Such experience would also be replicated in other community based
programmes.
Involvement of Women Social Mobilization Workers: In the project a number of facilitators
for a cluster of Gram Panchayats and village motivators at the village level were engaged. These
village motivators and facilitators visited villages, assisted in PRA and organised women along
with other stakeholders into groups. These village motivators would prove to be resource persons
for other programmes.
Women Aam Sabha: These Sabhas served as a platform for women to bring up issues of concern,
identifying needs and redressing grievances. Women Aam Sabhas were held prior to finalization
of Gram Panchayat plans to identify and prioritize issues impacting the women locally. It helped
in addressing gender issues in a transparent way.
Involvement of Women in Governance: Woman Ward member was made a co-signatory with
the Gram Pradhan for the operation of the dedicated watershed account of the project.
Livelihood Interventions: The project was designed to target all the rural inhabitants of the
project area thus sharing the benefits of the project. The poorest and the most vulnerable sections
of the community were addressed through the support of vulnerable group fund.
Participatory Monitoring and Evaluation (PME) were carried out in the project as a social audit
process. PME proved to be an important feedback and learning mechanism for the community in
the project area.
Pine briquetting: The project introduced pine briquetting as a pioneer venture to meet the
objective of reducing drudgery of women and forest fires. The pine briquette was also an income
generating activity where the user groups could sell the briquettes in the village and in the nearby
market.
Cost Sharing: To ensure sustainability of activities that enhance productivity and incomes of the
rural population, the project laid emphasis on sharing of costs by the individual beneficiaries, for
this the cost sharing norms were clearly defined.
Enhancing the capacity of the GPs: To ensure proper, effective and efficient management of
the project funds the project funded, the appointment of Account Assistant, in each Gram
Panchayat. This Account Assistant was generally a local of the village having knowledge in
accounting procedures. This experience would benefit to other Govt. programmes such as
MGNREGA, IWMP etc.

148
Sustainability through User Groups: In the project for future sustenance and O&M of common
assets user groups were formed. In the project user groups were especially for water based
structures such as irrigation tanks, roof rain water harvesting tanks, irrigation channels/guls, naula
and ponds. The members of user groups conducted regular meetings and generated fund for
operation and maintenance of created common assets. The funds were collected on monthly basis
or on crop basis depending on the rules and regulations of that particular user group.
4.1.5 Issues (ICR, Gramya 1)
Fiscal decentralization and community empowerment are necessary but not
sufficient to promote improved community management of natural resources. The
massive increase in transfers from GoI to PRIs potentially provides communities,
particularly GPs, with a source of funds for needed watershed treatment. Successful
implementation of GPWDPs also requires training in financial management as well as
technical knowledge transfer to GPs to both maintain and sustain these investments.
Gramya I promoted a participatory approach in preparing and implementing GPWDPs,
which strengthened GP administrative capacity, including social accountability. The
youth engagement was particularly effective as account assistants. The participatory
approach also fostered ownership among water users, FIGs, SHGs, and the Vulnerable
Group in targeted GPs, which helps to ensure the sustainability of project investments.
Science and cutting-edge technology in hydrology cannot be overemphasized:
watershed development should balance participation and science in its design and
implementation. The Gramya I was designed and implemented with an emphasis on
decentralization and participation, which was appropriate considering the GoUK priority
at the design phase. However, science and technology should not be compromised in
GPWDP or MWDP development/implementation and outcome monitoring in the results
framework. The science and technology were enhanced in the project design and
implementation and highlighted in the results framework in the proposed Gramya II,
without compromising the participatory approach.
Watershed development projects are a relevant response to the needed increase in
rain fed agricultural productivity in India. GPWDP investments increased the water
holding capacity, and comprehensive watershed treatment at the micro watershed level,
including reserve forests, has proven effective by SLEM, in sustaining natural water
source. Building on these investments, Gramya I demonstrated the effectiveness of
rainwater conservation and harvesting in rainfed areas, when combined with improved
seeds and management practices. More attempts must be made to quantify costs and
benefits relative to alternative interventions. Impact evaluation and economic analyses of
Gramya I quantified the relevant costs and benefits accruing to the GPWDPs and by WMD
in watershed development and considered these relative to alternatives.
Revival of traditional energy sources can address climate change mitigation, boost
resilience and contribute to livelihoods. Gramya I initiated pine needle briquetting,

149
which was scaled up by the SLEM. The SLEM piloted other traditional activities, such as
gharat power generation, natural regeneration of oak, and bamboo basket making, and
promoted local plants. All these activities demonstrated the potential for not only increased
incomes, but also diversified income sources, thereby contributing to added resilience of
livelihood and market options, which were developed in partnership with the public and
private sectors.
Staffing: WMD was slow in staffing Gramya I, completing it only by the Mid-term Review. The
project had 509 posts, about 40 percent of which were occupied by state government staff through
secondments from the Departments of Agriculture, Forestry, Horticulture, Animal Husbandry,
Irrigation, and Rural Development. Because the State of Uttarakhand is a relatively new state,
there is an acute shortage of state government staff, in particular, for the Agriculture and
Horticulture Departments. The staffing for these technical positions was around 70 percent. To
ensure project implementation, WMD contracted various service providers, including NGOs, in
overall project implementation, social mobilization, and PME, and new graduates for junior
engineers and accounting assistant.
Targeting: The number of targeted GPs, was four percent more than originally planned while the
area under the treatment was about 21.7 percent less than originally planned. According to the
PAD, Gramya I was to support 450 GPs in 19 development blocks to treat 300,000 ha in 76 target
micro-watersheds in the following 19 development blocks: Augustmuni, Bageshwar, Bhikiyasain,
Chinyalisaur, Choukhutiya, Dwarhat, Dwarikhal, Gairsain, Gangolihat, Garur, Jaiharikhal,
Jaunpur, Kalsi, Kapkot, Karnprayag, Lohaghat, Munakot, Thouldhar, and Vin. Gramya I was not
implemented in Bhikiyasain, Karnprayag, Munakot, and Vin but in Barakot, Dhari, and
Okhalkhanda instead (in 18 blocks in total). In maintaining the number of targeted GPs at 450, the
target area was adjusted to 234,000 ha (22 percent less than originally planned) in 18 blocks in
June 2007 (acknowledged in the June 2007 mission Aide Memoire). In the revised target areas,
118,000 ha of land was available (excluding reserve forest), which was composed of 67,000 ha of
arable land, 25,000 ha of non-arable land, 5,000 ha of bio-carbon forestry, 5,000 ha of degraded
un-demarcated forest, and 16,000 ha of inter-GP areas. At the Midterm Review in November
2008, the number of targeted GPs was increased to 468 (four percent more than originally planned)
to fully treat the target 76 micro-watersheds.
Afforestation: As a part of watershed treatment and source sustainability, about 17,475 ha of
plantations were taken up in the project MWS’. The treatment was as follows: (i) afforestation
model in 5,676 ha, (ii) silvipasture model in 5,340 ha, and (iii) fuelwood model in 6,459 ha, with
the plant density varying from 800 to 1,600 plants per ha. No systematic documentation of plant
establishment, growth, and yield assessment was done by the project. Given the plantation
survival rate of 45 percent, yield projections are calculated based on the available WMD database
resulting from afforestation interventions which are similar to the Gramya I interventions.
4.2 GRAMYA 2

150
Gramya 2 isa sequel of Gramya 1which was started on 15th July, 2014 and is currently an
ongoing project. The project will complete on 30th September 2021. The project is in its 5th year
of implementation. The project is being implemented by Watershed Management Directorate of
Uttarakhand with Gram Panchayat as PIA at field level.
The Project is operational in 82 selected micro watershed of middle Himalaya covering an
area of 2638.37 sq. km. and benefitting around 66,600 HHs of 524 Gram Panchayats (GPs).
Uttarakhand Decentralized Watershed Development Project II (hereafter referred to as
Gramya II), is to increase the efficiency of natural resource use and productivity of rainfed
agriculture by participating communities in selected micro watersheds of the State of Uttarakhand.
The project will be implemented in seven years from 2014 to 2021. The Project is operational in
82 selected micro watershed of middle Himalaya covering an area of 2638.37 sq. km. and
benefitting around 55,600 HHs of 509 (523) Gram Panchayats (GPs).
4.2.1 EXPECTED OUTCOME INDICATORS (PAD, GRAMYA 2)
1. Increase in water discharge – 25% at the end of the Project (7th year)
2. Increase in biomass – 20% at the end of the Project (7th year)
3. Increase in rainfed area under irrigation- 20% at the end of the Project (7th year)
4. Increase in productivity in irrigated and rainfed crops – 50% 0f irrigated and 20% of
rainfed at the end of the Project (7th year) 5. 80% HHs should be direct project
beneficiaries from the Project interventions.
MONITORING IN THE PROJECT
1. Internal Monitoring: By the WMD staff, through MIS/GIS and field visits.
2. External Monitoring: Baseline Survey, concurrent monitoring, mid-term review and final
impact evaluation.
3. Social Audit: Participatory Monitoring and Evaluation (PM&E) at GP level by the
Stakeholders.
4. Environmental and Social Safeguard Monitoring: Integrated with the development and
implementation of the GP/MWS plans.
5. Evidence based monitoring: Short studies and consultancies.
6. Hydrological monitoring: Continuous monitoring on surface runoff, reduction in silt load
and increase in water availability on selected MWS.
Concurrent Monitoring enables to measure progress of achievements against various
project components, it is an embedded system to monitor the input-output relations, and quantum
of achievement and quality of intervention in relation to expected results as identified in the
planning process. The major objectives of this system are to understand, check the physical and
financial progress and verify input and output with expected outcomes.

151
One of the important tasks of the external M&E consultant is to undertake 6 monthly
progresses monitoring of the project by analyzing MIS based data and undertake interim
projections on project targeted results. The monitoring report is prepared based on physical
progress data on project outputs provided by the project and independent qualitative field
assessment of progress implementation focusing on agriculture and horticulture interventions. The
focus of qualitative assessment is to identify issues in project implementation and capture
feedback and suggestions from project stakeholders and beneficiaries; and identify opportunities
and constraints in smooth delivery of project
External agencies have been hired for regular monitoring of the project development
objectives by UDWDP. Six monthly status reports are prepared by the Sutra, which has been hired
for the project. Regular internal monitoring is also done through the implementation of the project.
4.2.2 Uttarakhand Decentralized Watershed Development Project: March
2018- September 2018 (Source: THIRD SIX MONTHLY CONCURRENT
MONITORING REPORT –UDWDP II, Sutra Consulting)
The monitoring is done in an interactive mode following an indicative checklist related to
core areas. The process consists of desk review of physical, financial status and review of all
relevant records related to project implementation, physical verification of work implemented and
ongoing as sanctioned in the project, on-field discussions with different stakeholders, including
CBOs, staff and beneficiary farmers involved in project implementation.
Summary of results to date:
Table 4.3 Source: Six Monthly Report, Sutra Consulting
4.2.2.1 Key Achievements

152
Component 1 Social mobilization and Participatory Watershed Planning,
Out the total no of HH’s (66,352) in the 524 GP’s, the participation rate of HH’s in the
preparation of GPWDP was 46%.The participation of vulnerable households in GPWDP
preparation was 66% since the inception of the Project.
In 523 GPs total 2638 Women Aam Sabha was organized and the major issues raised in
WAS related to drudgery reduction, water and its harvesting, production of fodder, fuel,
fruit trees and construction of animal shelters, terrace repairing, poly house and additional
income opportunity was also considered. In these Women Aam Sabha total no. of 15798
proposals* were received and 73.3% were incorporated in GPWDP preparation
In terms of preparation of GPWDP, against the target FY’17-18(524) for the fourth year,
the Project has completed preparation of GPWDP for all the GP’s.
Component 2 of "Watershed Treatment &Rainfed Area Development”
Under the Sub-Component 2(a), Watershed treatment and source availability,
Overall, Agri-Horticultural tools has achieved the Project target up to 46%.For the current
fiscal year, the progress is at 16%.
Afforestation component (afforestation & ANR) has registered a good progress, with an
overall Project achievement of 78% and 37% respectively. For this quarter Afforestation
component has registered a progress of 20%.
The sub component of Energy conservation achieved impressive progress in two of its
interventions of solar lantern followed by Bio Gas Plant. Although the Project has
exceeded the overall Project target in Solar lantern, there has been continuation in this
initiative due to need based demand by the community.
Under the component of Drainage line treatment works, overall the maximum
achievement was registered in the construction of dry stone and crate wire check dams
with 70% and 65% respectively. Overall, the retaining wall progress has reached 41%
completion rate However, looking into the progress is the first six months of this financial
year, progress is to pick up in this component.
Out of the various components in Water Harvesting in the overall progress of the Project,
solar water lifting pump with solar panels, pre-fabricated geomembrane water harvesting
tank has completed its target. Looking into the overall achievement for other activities in
this component, progress was in the recharge pits (79%), village irrigation pond (60%)
rainwater harvesting component (58%) and village ponds/dugout ponds (55%).All these
are need based and community driven interventions.
Overall, Rural road improvement and construction of small bridges have achieved 65%
and 56% progress respectively. However, for this monitoring period there has been slow
progress due to continued inclement weather in the State.

153
Under the Sub-Component 2 (b), Rainfed area development,
Overall in the Project context, there has been a maximum achievement in the components
of Demo. of High Yielding agric. crops (0.2 ha. For rainfed ag) (95%), Demonstration for
high yielding vegetable crops (0.08ha. for irrigated area) (106%),Homestead plantation
(250 Plant) (71%), Adoption support for High yielding agric. crops (0.06 ha for rainfed
area) (65%) and Orchard Development (250 plant/ha.) (65%). For the progress this year,
good progress has been achieved in Demo. of High Yielding agric. crops (0.2 ha. For
rainfed area), Homestead plantation (250 Plant) and Orchard Development (250
plant/ha.)
In the sub component of Animal Husbandry programme, overall almost all of the
interventions have gone as planned. Paravet (AI services) which was lagging previously
has progressed much with overall Project achievement of 62%.Most remarkable progress
is in the activity of Manger (156%) & NBC (86.7%) respectively. For the reporting period,
activity under this component is slowly picking up.
Overall, the Fodder production programme achieved an impressive 99% for fodder
minikit and 72 % under Napier crop border plantation. Forage row plantation, achieved 63
ha progress. If this monitoring progress is to be considered Napier crop plantation has
achieved 69% progress.
Under Component 3
Enhancing livelihood opportunities Under sub component 3(a) Agribusiness support,
All six Agri-Business Support Organizations (ABSOs) are working with Division Offices
and project beneficiaries (villagers) for agribusiness development and market linkages.
Currently in this financial year, 14,792 farmers have benefited through agribusiness
initiative through 1334 FIGs.
Under sub-component 3(b) Support for vulnerable groups
Under Vulnerable Group Fund (VGF) till August 2018, 2646 beneficiaries’ and 428
vulnerable groups (VG) have been benefited. In group activity major activities taken by
beneficiaries are Tent House, Dress for traditional dance and instrument, flour mill, Band
Party, Catering, Fiber works- Carpet, Dari, Rope, Basket making, Barber shop, Carpentry,
Tailoring, Blacksmithing.
Under subcomponent 3 Consolidation of Gramya I activities
In Gramya-I, 18 Farmer’s Federations that were linked with processing centers and 9
Farmer’s Federations linked with Collection centers. Currently there are seven active
Farmers federations linked with processing units and one with collection center.
Under Component 4

154
"Knowledge Management and Project Coordination Under Sub component 4(a) of
Knowledge management,
The progress regarding capacity-building initiatives of the Project under the knowledge
management component for this six monthly progress includes 1315 training event
covering 61112 participants (Male-45.2% and female-54.7%)
In terms of Social and Financial audit,
Out of 523 GP’s, social audit was targeted in all GP’s. Against a planned target of 523
social audits, the Project has been able to achieve 74.7% completion rate i.e. 391 GP’s
have completed the audit process and equal percentage have had “satisfactory” social
audit. Due to “certain operational issues with two Districts of Uttarkashi and
Rudraprayag”, social audit could not take place. Apart from these two districts, all other
districts have achieved 100% target
Out of the total targeted Gram panchayat for financial audit, the Project has been able to
achieve a completion rate of 74.7% by March 2018.The no of GP’s with satisfactory”
financial audit too stands at 74.7%.
Under Sub component 4(b) of Project coordination,
This sub-component finances the management and supervision of Project implementation.
For the last financial year the expenditure was 91.01% against the planned budget.
Expenditure during FY 2018-19 is Rs. 4504.99 Lakh, while Cumulative expenditure since
the inception of the Project is Rs. 43435.59 Lakh
Software for Financial Management Information System (FMIS) was developed inhouse.
The Financial progress reports are generated regularly using FMIS. In-house software has
been developed to monitor activity wise beneficiaries under different component activities
Out the total no. of HH’s (63,691) in the 524 GP’s, the participation rate of HH’s was
76%.The participation of vulnerable households in GPWDP was at 66% (21722HH’s out of 31049
Vulnerable HH). In GPWDP preparation, the involvement of women stakeholder has been ensured
through organizing Women Aam Sabha, prior to GPWDP preparation, at Revenue Village/ Gram
Panchayat level (as per convenience). The above analysis of 524 GPWDPs indicates the
participation of women (48%) was adequately addressed at the time of preparation of GPWDPs.
This also indicates that the social mobilization in the villages is effective as per the objective
envisaged in the Project.
In 524 GPs total 64097 Women Aam Sabha were organized and the major issues raised in
WAS related to drudgery reduction, water and its harvesting, production of fodder, fuel, fruit trees
and construction of animal shelters, terrace repairing, poly house and additional income
opportunity was also considered. In the Women Aam Sabha, in this current year a total no. of
11580 proposals* were raised and 73.3% were incorporated in GPWDP preparation

155
Water & Watershed Management Committee
WWMC has been constituted at GP level headed by Gram Pradhan to assist FNGOs in
mobilization of village communities, lead the process of planning, preparation & implementation
of GPWDP, manage the Vulnerable Groups Fund, delegate responsibility for implementation of
Village Watershed Development Plans to RVC and ensure the audit of GP annual accounts etc.
It is mandated by the project that 50% women’s representation, inclusion of SC/ST should
be ensured. In 524 Gram Panchayats, total members are 3079 of which women members are 1817
(59%). Social category wise SC are 568 (31%), ST are 154 (8.5%), OBC are 345 (19%) and
General are 751(42%).
Revenue Village Committees (RVC)
Promotion of social mobilization and community driven decision making financed
participatory watershed planning at the village level using a budget envelop as the basis and
established Revenue Village Committees (RVCs) as representative bodies of resource users;
identified treatments on arable and non-arable lands; and integrated RVC proposals into Gram
Panchayat Watershed Development Plans (GPWDPs).
In 524 Gram Panchayats, total RVC are 1041 in which total members are 7896 of which
women members are 4337 (56%). +Out of total women members, social category wise SC are
1012 (26%), ST are 242 (8%), OBC are 706 (18%) and General are 2178 (49%).
Women’s Participation In 524 GPs total 64097 Women Aam Sabha were organized and
the major issues raised in WAS related to drudgery reduction, water and its harvesting, production
of fodder, fuel, fruit trees and construction of animal shelters, terrace repairing, poly house and
additional income opportunity was also considered. In the Women Aam Sabha, in this current year
a total no. of 11580 proposals were raised and 73.3% were incorporated in GPWDP preparation.
during the field visit sampled the proposals in the Women Aam Sabha to understand the
nature of proposals/activities in demand to be incorporated/implemented through the GPWDP.
The following table below (from Thatyur Division) depicts the line activities, total no of proposals
received from GP’s and no of proposals incorporated as well. It also elucidates the percentage of
proposals activity wise against the total no of proposals in UDWDP. It is very clear that Assistance
of seeds, rainwater harvesting tanks, plantation and animal shelter dominate the proposal of the
Division.
On similar lines, the analysis of the incorporation of activities in Aam Sabha in PMU
(Pauri) show that Roads, solar lights and afforestation form a majority of the activities
incorporated in the proposal. The report shows that the incorporation of the activities is need based
and differs from one division to the other.
4.2.3 Change in Milk Production:

156
Table 4.4: Source: Six Monthly Report, Sutra Consulting
From the above table it is clear that has been a slight increase production of milk after the Inception
of the Project but what is remarkable is the introduction of improved breed where the production
of milk is at a much higher quantity.
The table below shows the target to be achieved by the current year 2018-19 (Year 5) and the
cumulative value achieved till September 2018
Table 4.5 (source: Concurrent Monitoring Report UDWDP, Sutra Consulting)
PDO LEVEL INDICATORS
UNIT BASELINE
YR 4 (2017-18)
YR 5 (2018- 19)
Cumulative value achieved till Sept 18
Increase in water Discharge
% 0 10 65.8% (Treated water sources having more than 10% water discharge LPM)(Source: Sutra, Oct 2018)
Increase in biomass % 0 10 10 Current progress area under Biomass is 9845 Ha
Increased Ha of rainfed area under irrigation
No. 5,262 4,500 5,000 3537 (Data for year 4)(Source:Sutra,2018)
Increase in productivity in irrigated and rainfed crops
% 0 30 5
45 10
50 20
Direct project beneficiaries, of which % of female
No. 0 30,000 35,000 41,712

157
Indicator 1: Increase in Water Discharge
Sl. No. Name of Division
No. of GPs Water sources Treated so far
Increase in water discharge (%) LPM - From May-June 2016 to May-June 2018)
5-10(%) 11-30 (%) 31-50 (%) 51> (%)
1 Almora 87 148 70 40 30 8
2 Bageshwar 43 32 15 10 4 3
3 Pithoragarh 61 42 35 4 3 -
4 Dehradun 48 56 15 25 10 6
5 Tehri 78 151 17 99 14 21
6 Pauri 62 137 39 53 24 21
7 Rudraprayag 61 58 30 15 6 7
8 Uttarkashi 60 20 8 5 5 2
9 MWS (PMU) 7 34 3 13 5 13
Total 504 678 232 264 101 81
Table 4.6 Source: Six Monthly Report, Sutra Consulting
Indicator 2: Increase in biomass
Biomass
S.N Name of Division Forestry (Ha.)
Oak ANR (Ha.)
Horticulture (Ha.) (Orchard Dev.+
Homestead Plantation +Seed
& Seedling, orchard cluster)
Fodder Development (Napier Crop
Border+ Forage Row) (Ha.)
Total Plantation activities (Ref. to
increase in Biomass)*
1 Almora 416 0 880.73 769.5 2066
2 Bageshwar 508 0 401.14 630.28 1539
3 Pithoragarh 493 55 661.59 265 1474
4 Dehradun 546 0 494.06 370.1 1410
5 Pauri 320 85 191.7 313 909
6 Tehri 451 40 340.5 275 1107
7 Rudraprayag 266 0 101 155 522
8 Uttarkashi 271 0 184 150 605
9 MMWS (PMU) 37 0 70.6 105.33 213
TOTAL 3307 180 3325.32 3033.21 9845
Table 4.7:Source: Six Monthly Report, Sutra Consulting

158
Indicator 3: Increase in rain-fed area under irrigation
Intervention Unit Overall Project Target
Overall Project Achievement
% Overall Project Achievement
Irrigation Channel Km. 283 123 44
Irrigation Tank No. 1586 734 46
Roof Water Harvesting Tank No. 9445 5472 58
LDPE Tank No. 778 145 19
Solar water lifting Pump with solar panels
No. 3 3 100
HDPE Irrigation Pipeline Km. 408 84 20
Pre Fabricated Geo Membrane Water Harvesting Tank
No 3 3 100
Village Irrigation Pond No 168 100 60
Gross increase in Irrigated area 3537 Ha
Increase in Water Holding capacity* 34,620 cum for irrigation- storage structures
140,719 cum for dugout ponds and other percolation structures.
Impacting soil moisture regime in rainfed areas
Table 4.8: Source: Six Monthly Report, Sutra Consulting
Indicator 4: Increase in productivity in irrigated and rain- fed crops
Change in productivity of major crops in rainfed conditions:
Crop Project Baseline (Qtl/ha) Crop Productivity
(2017-18)
% Increase in productivity
Rice 11.23 14.49 29.03
Wheat 12.62 15.94 26.31
Maize 12.97 17.7 36.47
Madira 11.65 12.96 11.24
Soyabean 8.90 10.14 13.96
Finger Millet 12.05 13.91 15.41
Black Gram 7.25 8.15 12.40
Horse Gram 6.84 7.86 14.94
Lentil 7.31 8.39 14.77
Mustard/Toria 5.61 7.08 26.20
Table 4.9: Source: Six Monthly Report, Sutra Consulting

159
Intervention Unit Overall
Project
Target
Overall Project
Achievement
% Overall Project
Achievement
Irrigated
Demonstration for high yielding vegetable
crops (0.08ha. for irrigated area)
No. 18950 20062 106
Poly tunnels No. 13000 4563 35
Poly houses No. 2500 1575 63
Terrace Repair/Vegetative Field Boundary Cu M 88514 13968 16
Rainfed
Adoption support for High yielding agric.
crops (0.06 ha for rainfed area)
Farmer 50500 32697 65
Demo. of High Yielding agric. crops (0.2 ha.
For rainfed ag)
No. 14300 13635 95
Table 4.10 Source: Six Monthly Report, Sutra Consulting
Indicator Five: Direct Project beneficiaries of which % of female
63% farmers adopted efficient farming practices through demonstration and adoption
practices
14,792 Farmers benefited through agribusiness initiative. 1,334 FIGs formed
22,134 Household benefited through animal husbandry improvement
4,786 2646 individual and 428 group total 4786 vulnerable household benefited
through IGA of which 40% are women beneficiaries.
41,712 Total Direct Beneficiary
4.2.5 Third Six Monthly Concurrent Monitoring Report – UDWDP 2 (Sutra Consulting,
March- September, 2018) :
Drainage Line Treatment& Soil Conservation
Under the component of Drainage line treatment works, overall the maximum achievement
was registered in the construction of dry stone and crate wire check dams with 70% and 65%
respectively. Overall the retaining wall progress has reached 41%completion rate However,
looking into the progress is the first six months of this financial year, progress is to pick up in this
component.

160
Status of FIGs in each division and number of meetings held between the members is reflected in
the table below. Uttarkashi has the highest number of FIGs but the number meetings held is lowest
in the division.
Division FIG’s number Meetings held
Pithoragarh 135 503
Almora 121 242
Rudraprayag 188 3998
Uttarkashi 210 139
Bageshwar 181 3177
Vikasnagar 117 1333
PMU 28 124
Thatyur 161 1035
Pauri 193 6035
Total 1334 16586
Table 4.11 Source: Six Monthly Report, Sutra Consulting
Key Concerns and Suggestions (Third Six Monthly Concurrent Monitoring Report)
Particulars Concerns and action areas
Water Discharge Achievement in Water source treatment is good and with the current
rate of progress this will be achieved much before the stipulated
timeframe. Additional water source treatment can be taken up if the
targets are achieved earlier.
The data generated in AWS need to be accessed by WMD and M&E
Agency to check the type of data being generated and their relevance
in MWS. The analysis can then only be made to ascertain the benefits
of DLT structures.
44.6% target has been achieved in case of rejuvenation of traditional
water resources against targeted 1521 sites. The progress reveals that
the remaining targets can be easily achieved and furthermore need
based initiatives on similar lines can be further taken up.
Change in
Productivity Crop cutting data is essential to ascertain the productivity
Social Special focus to be given on Uttarkashi and Rudraprayag for timely
completion of PME. Since these two Divisions under PNGO is non
responsive, the complete Social audit could not be realized. Apart
from this, all other divisions have completed cent percent targets
Attribution of various aspects of women participation to the Project
has to be ascertained.

161
Realization of percentage of proposals implemented against proposed
in Aam Sabha has to be factorized as a complete picture towards
women’s empowerment.
Direct Project
Beneficiary Though there is now systems in place to compile direct beneficiary
data at the MIS level, but its functionality at MIS level need to be
realized fully till all the benefits against the particular beneficiary is
elucidated in the MIS.
Creating Models Focus should be on developing Agriculture, horticulture and dairy
farming models in the region. Supplementing beneficiaries where
there is a possibility of success in creating such models should be
focused. (e.g. if agriculture and dairy are existing on a farm, assist in
horticulture)
Napier grass gives fodder in rainy season. It’s the winter where fodder
scarcity is observed. In terms of grasses Thysolena grass which
produces fodder in winter season should be planted.
Bringing orchard plantations under organic certification (Uttarakhand
Organic & Commodity Board (UOCB) and APEDA can be contacted
for the same).
Horticulture Size of the poly houses needs to be increased from the existing ones
(poly houses provided to the beneficiaries are of very small size which
is only used for seed germination or developing nursery plantations.
In order to grow offseason vegetables under controlled conditions the
size of poly houses needs to be increased)
Educating beneficiaries on IPM, INM practices in horticulture is of
immense importance and should be practised.
Developing the production system - which minimizes wastes and
maximizes re-use of waste; mulching, RWH, drip irrigation to be
introduced through trainings and demonstrations
There is a need for conserving soil moisture security so that “more
crop per drop” can be achieved. There is thus need to encourage
Participatory Irrigation Management (PIM).
Educate the beneficiaries about rain water harvesting and soil
moisture retention. In order to get better results, IPM and INP
practices need taken up in orchard management training and package
of practices for apple and other fruit crops given to be given to
beneficiaries.
Credit flow for water saving devices such as drip and sprinkler
systems, rain water harvesting structures may be encouraged by
support from banking system.
Growing of mixed trees with multiple uses should be encouraged on
degraded and wasteland.
Seed Production Seed storage chains need be developed under public private
partnership/other setup for safe storage and distribution of seeds
Improving seed replacement ratio to 20 -25% by the end of the project
should be one of the projects mandate (for field crops only).

162
Mechanism to subsidise the seeds needs to be developed so that SRR
is brought up.
Bee Keeping Due to lack of flora availability in the hills during winter season the
honey bees need to be moved to better forage grounds in the plains.
There are only a few farmers with these honey bees so the cost of
transporting will be much higher than the actual honey obtained from
this intervention.
Indigenous bees [Apis cerana indica (Apidae)] perform better in such
climatic areas. It would be much better to upgrade the traditionally
used bee boxes in the region.
Poultry In case poultry, training on technical aspects on feed conversion ratio
and preparation of feed at farm level needs to be given to the
beneficiaries.
Given typical cost differences among starter, grower and finisher
diets, (changing diets at earlier stages may have considerable
economic impact. Use of diets of different nutrient content may alter
these recommendations)
Marketing Tie-up with companies like mother Dairy, Kissan and Reliance Fresh
should be looked into. With the scale of production in tomatoes a tie-
up with some above mentioned companies can be made in the region.
At present there is very little production from the unit which cannot
be taken up as an independent enterprise. Tie-up with other
organizations in the State should be made who are already into selling
these oils. The oils instead of being branded and packed should be
supplied as raw material to a bigger organization with a brand like
Chirag in Kumaon, KVIC, Biotique Ayurveda (Poanta Sahib, H.P.)
etc
Efforts need to be encouraged by way of provision for necessary
backward and forward linkages for plantation and horticulture
produce.
Low-cost collection centers and facilities should be created and then
aligned with the terminal market.
FIGs Value chains are localized and production is in small quantities.
Aggregation and marketing of produce is not visible. A horizontal
linkage of FIGs is required for creating a volume.
Drainage Line
Treatments A “weather station” at village Sunna (Simar Khal) was visited and
only one digital rain gauge was installed there. The weather station
should have provision for other important meteorological data such as
evaporation, temperature (minimum and maximum), humidity etc.
which is useful for crop planning, water budgeting, crop water
demands etc. Rainfall data recorded and analyzed (monthly average
basis) giving amount, no. of rainy days, maximum daily rainfall, etc.
should be displayed at the site. All meteorological data should be put
in the public domain in a website for the benefit of users.

163
The rainfall data recorded at the weather station is being directly taken
by the concerned agency (WAPCOS) entrusted with the job.
Currently ,the parameters of rainfall data are being analyzed such as
rainfall amount, duration, intensity and frequency which is important
for the design of soil and water conservation (S&WC) structures, crop
planning and water budgeting. Also rainfall data analysis over a
period can be helpful in knowing the timing and pattern (weather
arrival/withdrawal is normal, delayed or early), intermittent droughts,
excess runoff etc observed. In short there is a need to utilize the data
collected for watershed development activities.
There being acute shortage of water in the area, installation of roof
top water harvesting tanks was found very useful. However, there was
excess water going out from the outlet of the tank in an uncontrolled
manner. It should be either linked to another RWH tank or connected
to a recharge system in order to let the excess water percolate into the
soil profile. Construction of such RWH tanks may be further
augmented in view of water demand.
Water conservation/recharge measures have huge potential estimated
to be over 0.4 million litres/hectare and therefore should be promoted
further. In the sites visited, there is provision to further construct water
recharge and DLT measures (contour trenches, recharge pits, check
dams) in order to saturate the MWS and enhance the effectiveness of
different conservation measures. Contour trenches are low cost, easy
to construct, employment generating and have a huge potential for
water conservation and recharge. Farmers were initially skeptical
about them but now are convinced about their utility. Water storage
facilities may be further augmented wherever feasible. Drip irrigation
may be practiced to the maximum extent possible for better water use
efficiency.
At the sites where DLT structures are constructed, plantation of
locally adapted and hardy soil conservation vegetation species should
be planted along the DLT structures (such as Napier, Vitex, Ipomoea
etc) in order to improve the effectiveness of structures.
For optimal design of the RWH tank at a particular location, the total
runoff contributing surface area of the roof top and rainfall pattern of
the area should be taken into account.
Monitoring of spring water has shown a positive effect of water
recharge measures on the flow regime.
Measurement of the spring discharge showed it to be 5-6 lpm during
the summer, 7-8 lpm during winter and 14-15 lpm during the rainy
season. Monitoring of the spring water also showed a positive effect
of water recharge structures on improving the discharge.
Data management cell to be established at WMD to make good use of
the data collected for further planning process in
agricultural/horticultural activities

164
Economic Analysis Certified seed production can be promoted in other areas. However,
the agribusiness personnel will have to assist the federation to have
buy back agreement with either National Seeds corporation/ State
Seeds Corporation or the State Department of agriculture to make sure
that all the certified seed produced by the federations is sold in time.
Considering fivefold high returns from poly house, expansion of
production under poly house with limited irrigation is suggested.
Considering the marketing problems associated with both broiler as
well as Kuroiler chicken, expansion of small units is not
recommended. It would be better if large units/ or federation of
poultry farmers is formed with linkage with bulk buyer
Animal Husbandry More focus on stall feeding in order to reduce the pressure on existing
biomass.
Table 4.12: Source: Six Monthly Report, Sutra Consulting
4.2.6 STAFF POSITION IN UDWDP 2
S.N. Name of post Sanctioned
Posts
No. of
posts
filled
No. of
vacant
posts
1 Chief project director 1 1 0
2 Chief project director 1 0 1
3 project Director 2 2 0
4 Additional Director 2 2 0
5 Joint Director (Agriculture / Park / Animal
Husbandry)
3 1 2
6 deputy director 1 1 0
7 Deputy Director (Planning / Documents /
Dissemination)
1 1 0
8 Deputy director (administration / training) 1 1 0
9 Deputy Director (Environmental Expert) /
ESA Unit
1 0 1
10 Deputy Director PMU 1 1 0
11 Senior finance and account officer 1 1 0
12 Deputy Project Directo 6 6 0
13 Assistant Director (GIS / MIS) / Project
Economist
1 0 1
14 Assistant director (capacity development /
documentation½
1 0 1
15 Assistant Director (Training) / ESA UNIT 1 0 1
16 assistant director 1 0 1

165
17 Assistant Engineer / Assistant Director 3 2 1
18 Assistant director (project) / assistant forest
guardian
6 1 5
19 Agricultural / garden officer 6 3 3
20 Veterinarian 6 4 2
21 Finance Officer 3 0 3
22 Assistant finance and accounting officer 1 0 1
23 Chief Administrative Officer 4 3 1
24 Senior administrative officer 5 5 0
25 Additional statistical officer 11 5 6
26 Forest collector / subject matter expert / unit
officer
22 16 6
27 Administration officer 2 5 -3
28 Personal officer 1 0 1
29 Senior personal assistant 2 2 0
30 Accountant 4 0 4
Table 4.13: Source: Watershed Management Directorate, Uttarakhand
The position of Deputy Director (Environmental Expert), Assistant Director (GIS/MIS), Assistant
Director (Training), Finance officer are Vacant. 5 out of 6 positions of Assistant Forest guardian
are vacant.
REFERENCES:
Final Impact Assessment Report, GRAMYA 1 ,TERI
Implementation Completion Report, Gramya 1
Project Appraisal Document, UDWDP (Gramya 2)
THIRD SIX MONTHLY CONCURRENT MONITORING REPORT –UDWDP II, Sutra
Consulting
Watershed Management Directorate, Uttarakhand

166
Chapter 5
CURRENT STATUS OF SCHEMES AND
PROGRAMMES OF
PANCHAYATI RAJ DEPARTMENT
Panchayat system has been an integral part of our culture and civilization. After
independence, the participation of local people for development of rural areas was provided in
Indian Constitution. Through 73rd Amendment Panchayati Raj system was made mandatory along
with basic framework for the system. Decentralization is key to promote good governance and to
improve quality and reach of public service delivery at the grassroots. It also leads to enhanced
transparency and accountability. Participatory local budgeting, which involves transfer of
decision-making powers related to local budget allocation from public administrators to local
governments and citizens, tends to accelerate further decentralization. Participatory budgeting,
bestows opportunity to citizens to deliberate over part of the resource allocation in their
communities, opening up possibilities of greater matching of resources with local needs.
The Ministry of Panchayati Raj (MoPR) was created as a separate Ministry on 27th May
2004. It has the primary objective of overseeing the implementation of Part IX of the Constitution,
implementation of the provisions of the PESA Act in the Fifth Schedule areas and District
Planning Committee. Panchayats were made cornerstone of local self-governments and peoples’
participation in governance mandated in Part IX of the Constitution of India. The provisions were
extended to the Fifth Schedule areas through the Provisions of Panchayats (Extension to the
Scheduled Areas) Act, 1996 (PESA).The Ministry strives to reach its goals with regard to
improvements in the functioning of Panchayats primarily through policy interventions, advocacy,
capacity building, persuasion through implementation of scheme, financial support under Central
Finance grants etc. (Source: Panchayat.gov.in)
The vision of Ministry of Panchayati Raj is to attain decentralized & participatory local
self-government through Panchayati Raj Institutions (PRIs).
The Gram Sabhas/Panchayats have the following powers( source: PESA):
Gram Sabha
Safeguard and preserve
o Traditions, customs, cultural identity
o Community Resources
o Customary mode of dispute resolution
Right to mandatory consultation in land acquisition, resettlement and rehabilitation of
displaced persons.
Issuance of UC(Utilization Certificate) of funds utilized by panchayat
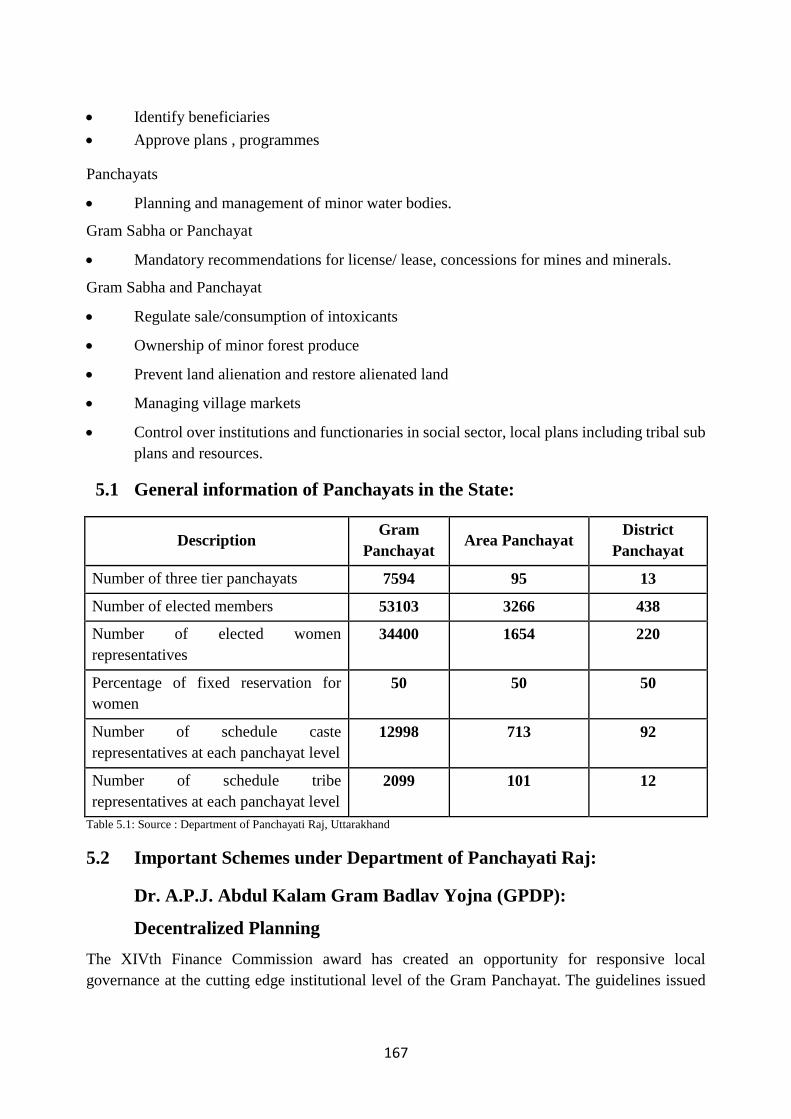
167
Identify beneficiaries
Approve plans , programmes
Panchayats
Planning and management of minor water bodies.
Gram Sabha or Panchayat
Mandatory recommendations for license/ lease, concessions for mines and minerals.
Gram Sabha and Panchayat
Regulate sale/consumption of intoxicants
Ownership of minor forest produce
Prevent land alienation and restore alienated land
Managing village markets
Control over institutions and functionaries in social sector, local plans including tribal sub
plans and resources.
5.1 General information of Panchayats in the State:
Description Gram
Panchayat Area Panchayat
District
Panchayat
Number of three tier panchayats 7594 95 13
Number of elected members 53103 3266 438
Number of elected women
representatives
34400 1654 220
Percentage of fixed reservation for
women
50 50 50
Number of schedule caste
representatives at each panchayat level
12998 713 92
Number of schedule tribe
representatives at each panchayat level
2099 101 12
Table 5.1: Source : Department of Panchayati Raj, Uttarakhand
5.2 Important Schemes under Department of Panchayati Raj:
Dr. A.P.J. Abdul Kalam Gram Badlav Yojna (GPDP):
Decentralized Planning
The XIVth Finance Commission award has created an opportunity for responsive local
governance at the cutting edge institutional level of the Gram Panchayat. The guidelines issued

168
by M/O Finance for the release and utilisation of the local bodies grant stipulate that proper plans
are to be prepared by the gram panchayats for the basic services within the functions devolved to
them as per State laws before incurring expenditure under the FFC award.
In the context of the Constitutional mandate, these plans have to be participatory plans involving
the community, particularly the gram sabha, in the formulation of priorities and projects and will
also have to ensure the mandates of social justice and economic development mentioned in Article
243G. The GP development plan (GPDP) will have to have a clear component addressing
vulnerabilities of poor and marginalised people and their livelihood opportunities through an
integrated poverty reduction plan that converges with the labour budgeting and projectization
exercises under MGNREGS as well.
In the light of the recommendations of the 14 Finance Commission by the Ministry of Panchayati
Raj, Government of India, it was decided to create Village Panchayat Development Plan for the
utilization of the resources received from all the sources for the Gram Panchayats. To implement
the scheme smoothly, the following number of Panchayat representatives and line departments of
state, district, development block and village panchayats clusters have been trained till the year
2016:
Master trainer training has been given to 315 government officials and 1955
representatives of NGOs through Uttarakhand Rural Development and Panchayati Raj
Institute, Rudrapur, 04 state level workshops and district level training programs have been
organised in each district, At the district level 1240 Master Trainers have been trained. At
cluster level, training has been conducted by creating groups of 10 gram panchayats.
Through this, from 800 clusters a total of 26958 representatives/workers have been trained
in 7950 Gram Panchayats.( sense not clear)
Promotion of the scheme through documentary, pamphlet, template, street viewer, bulk
messaging etc.
To prepare the Gram Panchayat Vikas Yojana under the A.P.J. Abdul Kalam Gram Badlav
scheme, till January 2018, 94 Master Trainers and 21919 Panchayat representatives
trained. Refresher training for capacity building of departmental / linear departments.
Under the scheme, in the year 2017-18, for the preparation of Gram Panchayat Vikas
Yojana, all the 7594 Gram Panchayats have created Gram Panchayat Vikas Yojana
through open meetings and 7949 schemes have been uploaded on plan plus whereas in
2018-19, with respect to 7954 gram panchayats, 7136 total meeting of Gram Sabha have
been conducted, 7602 approved plans and 4719 Gram Panchayat Vikas Yojana have been
uploaded on Plan Plus.
On the occasion of 150th anniversary of Mahatma Gandhi ji, in financial year 2019-20,
between 2nd October to December 2018, under "Sabki Yojana, Sabka Vikas"
participatory Gram Panchayat Vikas Yojna preparation was organized. Important

169
Meetings of Gram Sabha have been completed and meeting of Gram Sabha for G.P.D.P is
in process.
5.3 State Finance Commission
Budget allocation is done by the State Finance Commission under Panchayati Raj
Department. At present, the amount of the district-wise amount has been allocated according to
the fourth State Finance Commission (year 2016-17 to 2020-21)
Year Gram
Panchayat (in
lakhs)
Area
Panchayat (in
lakhs)
District Panchayat
(in lakhs)
2016-17 9442.60 3777.00 5714.91
2017-18 9748.21 7311.16 17059.00
2018-19 11327.74 8495.80 17059.37
Table 5.2: Source : Department of Panchayati Raj, Uttarakhand
District Panchayats, Area Panchayats and Gram Panchayats are 35%, 30% and 35% respectively.
Horizontal transfer to different panchayats will be based on the following reliance of various
factors
Panchayat Population Total Area Tax Effort Remoteness
District panchayat 50 20 15 15
Area panchayat 50 30 - 20
Gram Panchayat 60 20 - 20
Table 5.3: Source : Department of Panchayati Raj, Uttarakhand
5.4 Under the 14th Finance Commission, the budget is allocated to Gram Panchayats
by the Government of India. A total of Rs.1694.42 crores has been made for Uttarakhand
state from 2015-16 to 2019-20. Similarly, there is a provision of Rs,188.27 crores in the
form of performance grant till the year 2019-20.
Year Provision
(in crores)
Allocation
(in crores)
Performance
grant
(in crores)
Allocation
(in crores)
2015-16 203.26 203.26 - -
2016-17 281.45 281.45 36.92 36.92

170
2017-18 325.19 325.19 41.78 -
2018-19 376.19 376.19 47.45 -
2019-20 508.31 - 62.13 -
Total 1694.42 1186 188.27 36.92
Table 5.4: Source : Department of Panchayati Raj, Uttarakhand
District wise budget allocation under 14th Finance Commission and 4th State Finance
Commission:
FY-2018-19 (Amt. in Thousands)
NAME OF
DISTRICT
Scheme Year Total
ALMORA 14th FC 2018-19 412778
4th SFC 2018-19 203997
TOTAL 616775
BAGESHWAR 14th FC 2018-19 179520
4th SFC 2018-19 89496
TOTAL 269016
CHAMOLI 14th FC 2018-19 258309
4th SFC 2018-19 155197
TOTAL 413506
CHAMPAWAT 14th FC 2018-19 128235
4th SFC 2018-19 69645
TOTAL 197880
DEHRADUN 14th FC 2018-19 330417
4th SFC 2018-19 176230
TOTAL 506647
HARIDWAR 14th FC 2018-19 400306
4th SFC 2018-19 220436

171
TOTAL 620742
NANITAL 14th FC 2018-19 246119
4th SFC 2018-19 132915
TOTAL 379034
PAURI 14th FC 2018-19 440239
4th SFC 2018-19 223965
TOTAL 664204
PITHORAGARH 14th FC 2018-19 304320
4th SFC 2018-19 160360
TOTAL 464680
RUDRPRAYAG 14th FC 2018-19 143586
4th SFC 2018-19 71691
TOTAL 215277
TEHRI 14th FC 2018-19 353518
4th SFC 2018-19 171982
TOTAL 525500
USN 14th FC 2018-19 373330
4th SFC 2018-19 209374
TOTAL 582704
UTTRAKASHI 14th FC 2018-19 191223
4th SFC 2018-19 97066
TOTAL 288289
Total 14th FC 2018-19 3761900
4th SFC 2018-19 1982354
Grand Total 5744254
Table 5.5:Source: Directorate of Panchayati Raj, Uttarakhand

172
Fig 5.1 Data Source : Department of Panchayati Raj, Uttarakhand
The graph above shows the percentage of Gram Panchayats in every district which were
allocated the minimum budget within the district. It can be seen that for the hill districts this
percentage is substantially high as compared to plain districts. This percentage is highest in
Chamoli and Bageshwar closely followed by Rudraprayag. This shows that though the Minimum
amount in each district does not have a large difference, but the proportion in which the GPs are
allocated the amount is large.
For the plain districts the percentage number of GPs getting the minimum budget is lower
than 2%.
0 10 20 30 40 50 60
Almora
Bageshwar
Chamoli
Champawat
Dehradun
Haridwar
Nainital
Pauri
Pithoragarh
Rudraprayag
Tehri
Udham Singh Nagar
Uttarkashi
Number of Gram Panchayats allocated the minimum amount as per the District
% of GPs allocated minimum amount (4th State Finance Commision)
% of GPs allocated minimum amount( 14th Finance Commission)
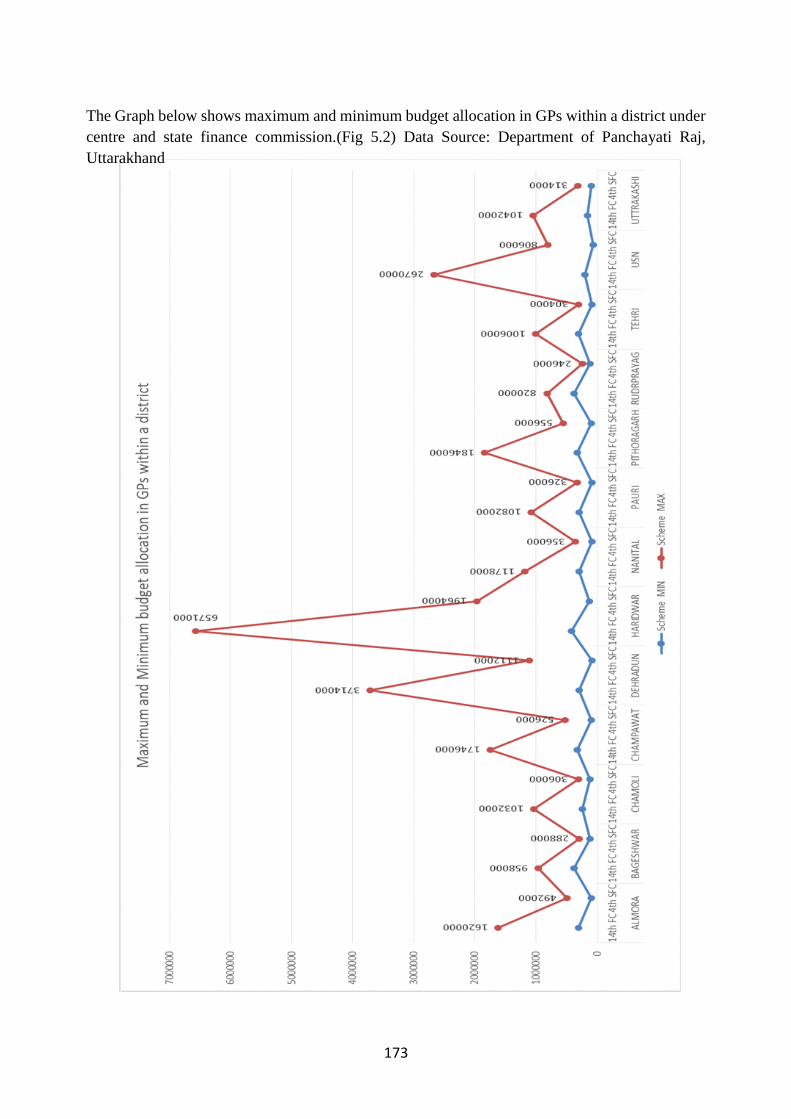
173
The Graph below shows maximum and minimum budget allocation in GPs within a district under
centre and state finance commission.(Fig 5.2) Data Source: Department of Panchayati Raj,
Uttarakhand

174
NAME OF DISTRICT
Scheme 14th FC & 4th SFC Alloted Amount to GP
Minimum Amount No. of Panchayats which were allocated Minimum Amount
Maximum Amount
No. of Panchayats which were allocated Maximum Amount
ALMORA 14th FC 304000 142 1620000 1
4th SFC 90000 146 492000 1
BAGESHWAR 14th FC 378000 203 958000 1
4th SFC 114000 213 288000 1
CHAMOLI 14th FC 378000 316 1032000 1
4th SFC 114000 312 306000 1
CHAMPAWAT 14th FC 324000 12 1746000 1
4th SFC 92000 15 526000 1
DEHRADUN 14th FC 288000 6 3714000 1
4th SFC 88000 7 1112000 1
HARIDWAR 14th FC 418000 2 6571000 1
4th SFC 126000 2 1964000 1
NANITAL 14th FC 288000 53 1178000 1
4th SFC 86000 53 356000 1
PAURI 14th FC 288000 30 1082000 1
4th SFC 86000 30 326000 1
PITHORAGARH 14th FC 314000 34 1846000 1
4th SFC 324000 39 556000 1
RUDRPRAYAG 14th FC 378000 168 820000 1
4th SFC 114000 169 246000 1
TEHRI 14th FC 304000 66 1006000 1
4th SFC 86000 66 304000 1
USN 14th FC 203500 1 2670000 1
4th SFC 61416 1 806000 1
UTTRAKASHI 14th FC 162000 161 1042000 1
4th SFC 98000 182 314000 1
Table 5.6: Source : Department of Panchayati Raj, Uttarakhand
The maximum budget has been allocated to a G.P. in Haridwar (Rs.65,71,000 ) followed by
Dehradun (Rs.37,14,000) by the center under 14th finance commission. In contrast , the maximum

175
budget allocated in Rudraprayag to a particular G.P. is Rs.8,20,000 and in Bageshwar is Rs
9,58,000.
The minumum amount allocated is in Uttarkashi is Rs.1,62,000 which is allocated to a total of
161 GPs in the district followed by Udham singh nagar at Rs.2,03,500 though only one GP was
allocated this budget in the district. Both the districts show significantly large difference within
their G.P.s with maximum budget at Rs.10,42,000 and Rs. 26,70,000 respectively. Districts of
Haridwar and Dehradun which had the highest budget for allocation; the minimum budget
allocation was Rs.4,18,000 to 2 GPs in Dehradun and Rs. 2,88,000 to 6 GPs in Haridwar.
Budget allocated by the state under the fourth state finance commission shows a similar pattern
with Haridwar’s G.P. with maximum allocation with Rs. 19,64,000 followed by Dehradun with
Rs.11,12,000.
Similar variation to 14th finance commission can be seen in 4th State finance commision as the
maximum budget allocated to a G.P. in Rudraprayag is Rs.2,46,000 and that of Bageshwar is Rs.
2,88,000. It is almost one-seventh to that of Haridwar(Rs.19,64,000) and almost one-fourth to that
of Dehradun(Rs.11,12,000).
The minimun amount allocated to a G.P. under the state finance commission is to that of Udham
Singh Nagar allocated to a single GP (Rs. 61,416) followed by Nainital (53 GPs), Dehradun(7
GPs), Tehri(66 GPs) and Pauri(30 GPs) with Rs. 86,000.
The data shows high variance both across districts and minumum and maximum budget allocation
to a G.P. within the district.
5.5 Panchayat Building Construction:
Presently Panchayat Bhawans are available in 6355 Gram Panchayats against 7,554 Gram
Panchayats of Uttarakhand, whereas Panchayat Bhawan is not available in 1599 panchayats. For
the modernization and development of the Gram Panchayat offices in the sequence of "Vision -
2017" of the new government, the State Government proposed in the Annual Plan for the
construction of Panchayat Bhawan in the Panchayats without the Panchayat Bhawan, but the
budget was not allocated.
Under the reconstituted National Grameen Swaraj Abhiyan, 2018-19, the proposal for
construction of 200 panchayat buildings, repair of 150 Panchayat buildings and extension hall for
common service center in 80 Panchayat buildings has been forwarded to the Government of India.
5.6 Area Panchayat Development Fund:
Since 2005-06, every year Panchayats have been allocating funds for development works
of Rs. 25 lakh per development block. In the year 2012-13, per development block amount was
increased to Rs 35 lakhs. In 2012-13, a decision was made to provide a total of Rs.33.25 crore to
the panchayats at the rate of 35 lakh per development block, but in the year 2016-17, a total of

176
only 720 lakh was allocated. In the year 2017-18 and 2018-19, no money has been released under
this head.
5.7 Training of elected representatives and employees and training of women
representatives in three-tier panchayats:
Two schemes for the training of panchayat representatives under the state sector are being
conducted for training of Panchayat representatives and employees respectively and training of
women representatives in three-tier panchayats respectively , in which the Panchayat
representatives are made aware of their rights, obligations and duties by organising trainings.
In the financial year 2017-18, 25 lakh for the training of elected representatives and
employees and Rs 25 lakh for the training of women representatives in three-tier
panchayats, total amount of Rs 50 lakh was allocated. Through this, innovative training
programs for Panchayat representatives were organized. Training and exposure visits on
waste management, women rights, cashless transactions etc were also organised.
The amount allocated for the year 2018-19, was withdrawn. Training started from
December 2018, in which the Panchayati raj representatives training was done on the topic
of solid waste management capacity building training . It also included orientation of
engineers and data entry operators being deployed on the field in the department.
Table 5.7 Details of the training done in the year 2018-19 at the district / development block level.
S.N. District Target Achieved
1 Almora 2771 1810
2 Bageshwar 2102 1449
3 Chamoli 3113 1473
4 Champawat 1551 1218
5 Dehradun 2406 1351
6 Haridwar 3249 2495
7 Nainital 1147 987
8 Pauri 470 405
9 Pithoragarh 4942 4522
10 Rudraprayag 2011 1789
11 Tehri 8047 5598
12 Udham Singh
Nagar
2845 1962
13 Uttarkashi 692 533
Total 35346 25592

177
In Uttarakashi no training was done for GPDP in 2018-19 at both district level and Development
block level. No training for GPDP at Development block level was done in Dehradun.
Table 5.9 Details of trainings done in 2018-19 at district /Block Development level
S.N. District Topic Level Training Duration Target Present
1 Almora Solid Waste Management
District Level 0 0
Development Block
0 0
2 Bageshwar District Level 16 and 17 May 2018 106 97
Development Block
0 0
Table 5.8 Details of trainings done at District/Development Block Level
S.N. District Topic Level Training Duration Target Present
1 Almora
GPDP
District Level 26-09-2018 95 95
Development Block 28-09-2018 642 642
2 Bageshwar District Level 20-08-2018 to 21-08-2018 105 103
Development Block 27-08-2018 to 28-08-2018 141 123
3 Chamoli District Level 25-09-2018 36 36
Development Block 28-09-2018 308 287
4 Champawat District Level 24-09-2018 45 35
Development Block 02-10-2018 to 31-12-2018 313 266
5 Dehradun District Level 27-09-2018 54 54
Development Block 0 0
6 Haridwar District Level 13-09-2018 54 40
Development Block 25] 26 and 27-09-2018 230 170
7 Nainital District Level 24] 25 and 26-09-2018 351 289
Development Block 0 0
8 Pauri District Level 24-09-2018 to 25-09-2018 180 157
Development Block 27-09-2018 to 02-10-2018 15 15
9 Pithoragarh District Level 28-09-2018 102 90
Development Block 02-10-2018 to 31-12-2018 400 350
10 Rudraprayag District Level 26-09-2018 40 40
Development Block 27-09-2018 to 28-09-2018 86 75
11 Tehri District Level 26-09-2018 60 60
Development Block 11-05-2018 1032 940
12 Udham Singh Nagar District Level 28-09-2018 to 29-09-2018 822 378
Development Block 02-10-2018 to 31-10-2018 412 341
13 Uttarkashi District Level 0 0
Development Block 0 0
Total 5523 4586

178
3 Chamoli District Level 14-03-2018 ls 15-03-2018 40 35
Development Block
19-03-2018 ls 21-04-2018 1551 908
4 Champawat District Level 01-11-2018 ls 02-11-2018 86 86
Development Block
23-02-2018 ls 14-03-2018 447 362
5 Dehradun District Level 8 and 9-01-2018 41 12
Development Block
10 and 11-01-2018 897 400
6 Haridwar District Level 16-01-2018 to 20-01-2018 106 93
Development Block
22-01-2018 to 22-02-2018 954 769
7 Nainital District Level - 0 0
Development Block
22-06-2018 to 23-06-2018 26-06-2018 to 27-06-2018
75 57
8 Pauri District Level 09-12-2018 to 20-12-2018 15 15
Development Block
0 0
9 Pithoragarh District Level 28-03-2018 150 135
Development Block
01-02-2018 to 04-02-2018 1400 1298
10 Rudraprayag District Level 26-12-2018 to 27-12-2018 65 60
Development Block
03-01-2018 to 23-01-2018 878 746
11 Tehri District Level 12-12-2018 to 21-12-2018 116 97
Development Block
06-04-2018 to 12-04-2018 2826 1693
12 Udham Singh Nagar
District Level 13-03-2018 38 27
Development Block
02-10-2018 to 31-10-2018 747 634
13 Uttarkashi District Level - 0 0
Development Block
- 0 0
Total 10538 7524
In Almora and Uttarakashi, no trainings for solid waste management was done at district
or block level. At bloclk level no training was done in the districts Pauri and Bageshwar. In
Nainital no training was held at district level.
For District Uttarkashi no training was conducted on GPDP and solid waste management
at either district or block level.

179
5.8 National Gram Swaraj Abhiyan:
National Gram Swaraj campaign is a cent percent centrally sponsored scheme, which was
previously operated from the year 2013-14 in the name of Rajeev Gandhi Panchayat
Empowerment Campaign, in which 75 percent centre and 25 percent states share were prescribed.
In 2017-18, this scheme was made completely centrally sponsored.
In the year 2017-18, under the reorganized national Gram Swaraj campaign, the heads
related to training and infrastructure in the 90:10 ratio, will be covered under centre and states,
while grants/award schemes and e-Panchayatraj schemes, cent percent will be covered through
the centre.
For the educational tour of panchayat representatives and personnels to other statesthe
following tours were organised:
In the month of May-June 2017, the group of 21 people's representatives, visited Himachal
Pradesh and 21 delegates visited educational institutions of Tamil Nadu,
In Uttarakhand to study the Model Panchayats in the month of June, 2017, 6 study teams
of 150 people representatives/ officers was formed.
In 2018, four traveling teams were formed of 217 people representatives/officers and
educational excursion was conducted within the state.
So far, 1120 master trainers were trained under training on solid waste management, while
6500 participants were trained at block level and 1168 participants trained in district level
trainings.
Under cashless transactions, up to November 2017, training of 229 master trainers has
been done. District level training has been given to 1100 participants and 5000 participants in
development block level have been trained.
District Resource centre is approved in 5 districts of the state. Of these, the construction has
been completed in Uttarkashi and Champwat whereas in Tehri, Rudraprayag and Bageshwar the
cetre is under construction. State level Resource cetre is also under construction in Dehradun.
Block level resource centres have been contructed in 29 development blocks. 43 panchayat
bhawans have been constructed in the state.
5.9 I.E.C (Information, education and Communication) Activities
Organizing village level meeting, street play, wall painting, rally with 3746 families of 8
Gram Panchayats of Bhogpur cluster (Bhogpur, Baghi, Sarangdharwala, Ranipokhari
Mauja and Ranipokhari Grant) under Solid waste Management Scheme Public awareness
campaign.

180
Awareness rally , street plays, wall painting etc for solid waste management organised in
Hawalbagh block of districtAlmora, Kalsi Block of district Dehradun and Ramgarh block
of district Nainital.
handbooks prepared for creating awareness about solid waste management. Training given
to gram pradhan, members of panchayat, asha and anganwadi workers , employees of
panchayati raj in training programmes .
Under public awareness, information related to the implementation of solid waste
management policy in every meeting of the area Panchayat is being made mandatory.
5.10 Staff Details of the current working and vacant regarding the sanctioned
posts of the Village Panchayat Development Officers of the Panchayati
Raj Department, Uttarakhand.
District Village Panchayat development officer
Description of attachment in other district relative to the number of positions filled
Total Sanctione
d posts
Positions filled
Vacant
Uttarkashi 71 42 29 -
Tehri 137 120 17 04 Haridwar, 2 dehradun and 1 attached in Uttarkashi
Pauri 219 172 47 05 Haridwar, 01 tehri , 1 pithoragarh and 1 attached in Uttarkashi
Chamoli 77 66 11 01 in Dehradun and 2 attached in Uttarkashi
Rudraprayag 53 44 09 01 attached in Dehradun
Dehradun 62 55 07 -
Haridwar 46 38 08 -
Almora 178 139 39 10 U.S.Nagar,06 Dehradun,02 Uttarkashi and 01 attached in Champawat
Nainital 73 62 11 -
Pithoragarh 119 107 12 -
Bageshwar 69 49 20 01 attached in Uttarkashi
U.S. Nagar 27 22 05 -
Champawat 44 39 05 2 attached in U.S.Nagar and 1 in Pithoragarh
Total 1175 955 220 Total- 42
Table 5.10: Source : Department of Panchayati Raj, Uttarakhand

181
From the table above we can observe that 200 out of 1040 total sanctioned posts are vacant
in the hill districts. 19.2 % posts of Village Panchayat Development officer are lying vacant in the
hill districts. This is the highest in Uttarkashi district with 29 (40.8%) posts vacant against a total
of 71 posts.
It can also be observed that Village Panchayat Development officers from hill districts
have been attached to plain districts. From Almora 10 have been attached in U.S. Nagar district
and 6 in Dehradun, from Tehri 4 have been attached in Haridwar and 2 in Dehradun. There are
cases of attachment to hill districts but are lower compared to one’s to plain districts. Of the total
42 Village Panchayat Development Officer only in 10 cases the attachment is in hill districts.
District Assistant Development Officer
(Panchayat)
Description of
attachment
Total Posts Filled Vacant
Uttarkashi 06 06 00 -
Tehri 09 08 01 -
Pauri 15 14 01 -
Chamoli 09 07 02 -
Rudraprayag 03 02 01 -
Haridwar 06 06 00 -
Dehradun 06 06 00 -
Udham Singh nagar 07 06 01 -
Nainital 08 08 00 -
Almora 11 11 00 -
Bageshwar 03 03 00 -
Pithoragarh 08 07 01 -
Champawat 04 04 00 -
Total 95 87 07 00
Table 5.11: Source : Department of Panchayati Raj, Uttarakhand
The positions vacant of Assistant development officer are comparatively lower than that
of Village Panchayat Development Officer. Only 7 positions are vacant of which 6 are in hill
districts.

182
The devolution Scheme in the 4th finance commission, though has tried to take into
consideration different aspects like remoteness, population, tax effort etc into consideration, the
distribution of budget at GP level shows high disparities. As the population is significantly low in
the hilly areas, the budget share also decreases. This leads to the underdeveloped to continue
remain the same, while the GPs in plain regions with high population move towards development
with high budget share every year. The weightage of remoteness of an area should be increased
so as to facilitate development in the most remote areas.
As per the review report for third Finance commission “On the whole the devolution
formula devised by the SSFC is rather complex and fails the simplicity test. Quite clearly it is
beyond the comprehension of most ULBs(Urban Local Bodies), not to mention the PRIs.”(The
Scheme of Devolution, 3rd finance commission).” The existing legislation for PRIs and ULBs in
Uttarakhand vests far greater responsibilities on the latter than the former. Hence the
municipalities’ needs for funds are also much higher” (3rd State Finance Commission)
The Vacancies which are higher in the hill areas should be filled for better governance and
grass root percolation of benefits.
REFERENCES
https://www.indiabudget.gov.in/es2014-15/echapvol1-10.pdf: The Fourteenth Finance
Commission (FFC) – Implications for Fiscal Federalism in India?
https://fincomindia.nic.in/writereaddata/html_en_files/oldcommission_html/fincom14/others/25.
Department of Panchayati Raj, Uttarakhand

183
Chapter 6
COOPERATIVES
State Sector
6.1 Deen Dayal Upadhyay Cooperative Farmer Welfare Scheme
For the purpose of doubling the income of the farmers, Deendayal Upadhyay Cooperative Farmers
Welfare Scheme was started by the State Government through the Department of Cooperatives on
1st October, 2017, under which the small and marginal farmers of rural areas Members were
provided a loan of up to Rs 1 lakh at two percent interest rate for agricultural and agricultural
allied works .Since the inception of the said scheme till January 2019, a loan of Rs 807 crore was
distributed to a total of 1,65,750 farmers in the state for agriculture and agriculture allied works.
For the purpose of financial empowerment of women from date 14th February 2019, the farmers
and non-agricultural members of the cooperative societies and self-help groups who have been
living below poverty line loans are being made available to all the sectors related to agricultural
sector without any interest to the extent of Rs. 5 lakhs by the State Government in the popular
scheme.
Deendayal Upadhyaya Cooperative Farmer Welfare scheme District wise loan
distribution
S.No. District No. of beneficiary
Short term loan
distribution
No. of beneficiary
Medium term loan
distribution
Total beneficiary
Total Loan distribution
1 Nainital 27126 12606 508 271 27634 12877
2 U.S. Nagar 49409 16160 361 302 49770 16462
3 Almora 13463 5397 1631 1263 15095 6660
4 Bageshwar 5622 2369 875 635 6497 3004
5 Pithoragarh 12334 6748 1683 1365 14017 8113
6 Champawat 5031 3088 641 554 5672 3642
7 Pauri 896 489 2632 2394 3528 2883
8 Dehradun 4441 2988 610 571 5051 3559
9 Haridwar 21322 12310 138 137 21460 12447
10 Tehri 7940 3574 1381 1050 9321 4624
11 Chamoli 2746 1656 451 379 3197 2035

184
12 Rudraprayag 1979 848 205 143 2184 991
13 Uttarkashi 7355 4915 112 78 7467 4993
Total 159664 73148 11228 9142 170892 82290.42
Table 6.1: Source Co-operative Department, Uttarakhand
6.2 Deposit guarantee scheme
Deposit Credit Guarantee Scheme in rural savings centers has been implemented with the
approval of the State government. In order to promote banking trend in rural areas, under the
Corpus Fund scheme and to provide awareness among depositors in the rural savings centers of
Primary Agricultural Credit Co-operative Societies (PACS) and to provide security of deposit.
Under the scheme, deposits (Corpus Fund) of Primary Agricultural Credit Co-operative
Societies (PACS) are kept at the level of the head office of District Co-operative Bank.
The contribution in the deposit growth is as follows:
0.15 percent by the PACs in the Corpus Fund, 0.10 percent of the deposit growth by the
district co-operative bank, 0.05 percent of the deposit growth by the top bank and 0.30 percent by
the State Government.
Amount provided by the state government (in lakhs)
2014-15 2015-16 2016-17 2017-18 2018-19
100 100 120 140 80
Table 6.2: Source Co-operative Department, Uttarakhand
6.3 Proposed New Programs
For the development of agriculture and rural sector through cooperatives in the State.
National Cooperative Development Corporation has been sanctioned a sum of Rs. 3,340
crores in order to start commercial activities in PACs and other cooperative organizations
by National Cooperative Development Corporation, Ministry of Agriculture, Government
of India.
In order to empower the multipurpose agricultural credit co-operatives through co-
operatives, the process of opening petrol pumps in 33 committees and gas agencies in 15
committees is in process. Also, opening up Patanjali stores is in motion in 105 PACs.
Making agricultural hilly areas self-dependent by establishing coordination and
convergence between agriculture, horticulture and cooperatives.

185
For the functioning of District Cooperative Bank in all the districts in the state. To open
District Cooperative Bank in Rudraprayag, Champawat and Bageshwar districts,
registration has already been done. The advance proceeding for the banking license from
the Reserve Bank of India is in motion.
6.4 New Schemes (Source: Outcome Budget 2019-20)
1. Deendayal Upadhyay Farmer Welfare Scheme
To provide short-term / medieval loan at 2% interest up to Rs.1 lakh in the year 2018-19
by the order number 1295 / XIV -1 / 17-5 (19) 2010 dated 27th September, 2017 ; Deendayal
Upadhyaya Cooperative Farmers Welfare Scheme was started by government of Uttarakhand with
effect from 1st ,October 2017 under which credit distribution is given to members of Scheduled
Castes.
2. State integrated cooperative development project
On the call of Hon'ble Prime Minister, "Sankalp se Siddhi" and "doubling the income of
farmers till 2022", with important objectives like improvement of the state's development,
abandonment of livelihood, employment generation in rural areas and improvement of the living
standard of the farmers in consideration, the "State Consolidated Cooperative Development
Project" has been prepared.
6.5 PACS Profit / Loss Details (Source: Cooperative Department,
Uttarakhand)
District Total
PACS in
District
Number of
societies in
profit
Amount No. of
societies
in loss
Amount Total no. of
PACS without
Profit/Loss
Nainital 53 49 14280 4 897 0
U.S.Nagar 35 33 1811 2 145 0
Almora 80 70 13874 5 629 5
Bageshwar 18 18 4115 0 0 0
Pithoragarh 112 112 1826 0 0 0
Champawat 23 23 594 0 0 0
Pauri 132 74 560 58 323 0
Dehradun 39 34 23583 5 4170 0
Haridwar 43 31 41251 12 34528 0

186
Tehri 89 73 1260 15 136 1
Chamoli 54 23 1874 31 1984 0
Rudraprayag 37 30 1310 7 238 0
Uttarkashi 44 21 195 23 224 0
State level 759 591 106533 162 43274 6
Table 6.3: Source: Co-operative Department, Uttarakhand
Graph below shows District wise Primary Agricultural Credit Sociteis with distribution as in the
number of socities in profit and loss (Fig 6.1 Source: Co-operative Department, Uttarakhand)

187
The maximum numbers of societies in loss are in Chamoli district with 31 out of 54 in loss
(57.4%). Uttarkashi has 23 out of 54 PACs in loss (52.27%) . Pauri follows it closely with 58 out
of 132 in loss (43.9 %).
Pithoragarh district which has a total of 112 PACs ( second highest after Pauri ) seems to be
performing well with no PAC in loss.
6.6 Districtwise different Cooperatives in Uttarakhand
S.No.
Name of Cooperative
Nainital
U.S.
Nagar
Almora
Bageshwar
Pithoragarh
Champawat
Pauri
Dehradun
Haridwar
Tehri
Chamoli
Rudrapraya
g
Uttarkashi
Total
1- Multilateral Agricultural
Credit society 53 35 80 18 112 23
132
39 43 89 54 37 44 759
2-- Consumer
cooperative society
29 19 13 2 2 1 8 54 17 6 5 0 5 161
3- Labour
cooperative society
52 26 59 22 42 10 23 162 50 30 13 5 11 525
4- Oilseed
Cooperative society
28 0 0 0 0 0 6 7 0 0 7 0 4 52
5- Wage earners
cooperative society
28 16 9 5 14 4 20 151 38 9 5 0 32 331
6- Miscallenous works cooperative
3 4 0 0 2 1 11 24 2 2 3 2 5 59
7- House
construction cooperative
22 3 0 0 1 1 0 72 10 1 0 0 1 111
8- Transport
cooperative 5 0 2 0 1 0 3 20 0 2 0 0 1 34
9- Poultry
cooperative 0 0 0 0 0 0 1 9 1 0 0 0 0 11
10- Piggery
Cooperative 0 0 0 0 0 0 0 4 0 0 0 0 0 4
11- Agriculture cooperative
8 51 0 0 0 1 9 18 41 0 0 0 0 128
12- Industrial
Cooperative 3 24 47 4 9 0
104
154 5 0 0 0 69 419
13- Fishery
cooperative 1 6 0 0 0 0 0 1 9 0 0 0 0 17
14- Pashu Shav
Vichedan 0 4 0 0 0 0 0 10 18 0 0 0 0 32
15- Silk
Cooperative 13 8 0 5 11 0 0 56 0 0 0 0 0 93

188
Table 6.4: Source: Co-operative Department, Uttarakhand
6.7 Districtwise Agricutural Credit societies
District Number
Nainital 53
Udham Singh Nagar 35
Almora 80
Bageshwar 18
Pithoragarh 112
Champawat 23
Dehradun 39
Pauri 134
Tehri 87
Chamoli 56
Rudraprayag 33
Uttarkashi 44
Haridwar 45
Total 759
Table 6.5: Source: Co-operative Department, Uttarakhand
6.8 Number of district cooperative bank Branches
Nainital 33
Almora 26
Pithoragarh 27
Dehradun 23
16- Horticulture Cooperative
8 2 0 0 0 0 0 2 0 0 0 0 19 31
17- Other
Cooperative 17 30 21 16 31 3 20 46 13 19 6 1 25 248
18- Urban
Cooperative 1 1 1 0 0 0 0 2 0 1 0 0 0 5

189
Pauti (kotdwar) 24
Tehri 34
Chamoli(Gopeshwar) 28
Uttarkashi 17
Haridwar (Roorkee) 23
Udham Singh Nagar 32
Uttarakhand State Cooperative Bank 15
Total 282
Table 6.6: Source: Co-operative Department, Uttarakhand
6.9 Human resources development plan
As a result of change in business’/ works of committees, Vocational training to the officer
/ staff of the department and secretaries of the committees is provided in I.C.M., Dehradun.
Training of Departmental State Supervisor and Co-operative Class-II officers to
implement new schemes efficiently in the department in I.C.M. Dehradun.
Computer training for personnel to increase efficiency in the department
Touring and Training of departmental officers outside the State.
Touring of Secretary / General Managers of District Cooperative Banks outside the State
Training of ICDP Managers and Committee Secretaries in NCDC's Gurgaon Training
Center
Training and travel of Secretaries of the districts of NCDC scheme, in other states
Departmental preliminary training to newly-appointed cooperative government
supervisors
Long-term Half-Year Training for newly-appointed Co-operative Supervisors
TRAININGS
22 postgraduate course training for the students
18 newly appointed co-operative state supervisors were inducted in induction course
Leadership Development Program for 33 Additional Co-operative Officers Inspector-I,
and Assistant Development Officer / Co-Inspector Class-II.
30 trainees are under training under ICDP scheme

190
6.10 Programme for Development of State through Integrated Cooperative
Development Project (ICDP)
The programme has been divided in three Phase:
Phase I: Action Plan for NCDC Funding.
a. Diagnostic study to identify gaps across value chain and recommendation of interventions.
The financial viability of the interventions to be arrived at basis broad cost & revenue
assumptions. This will enable fund provisioning under alternative heads.
Phase II: 3-5 years implementation programme.
a. Specific cost estimates of individual interventions
b. Implementation of the individual interventions
c. Strengthening of the institutions
d. Hand holding support from sector experts for the implementation
e. Building up of Case studies
Phase III: Monitoring & programme impact evaluation.
The current study (part of Phase I) has adopted the approach of assessment of challenges across
value chain in the identified sectors and, has made recommendations along with tentative
provisioning of fund for the relevant and commercially viable interventions to mitigate the
challenges.
The State level ICDP envisages following design principles and approach:
1. Interventions across value chain from farm level till market access for the products
2. Cluster based farming/economic activities
3. Co-operative-collective farming
This shall result in effective and efficient mechanisation of farming activities at
considerably lower cost per farmer due to economies of scale and thus resulting in higher
marketable surplus per farmer. The higher marketable surplus so achieved shall effectively result
in enhancing the farmers’ income.
The mentioned approach of ICDP shall draw references and learning from the already
existing best practices by individual enterprises viz. HARC and Him organic in the hilly state of
Uttarakhand.
The study recommends constituting an advisory committee comprising of promising and
successful social entrepreneurs as part of the programme implementation. The advisory committee
could take up the role of advising the PACS, the Directorate office bearers, the professional
resource pool for assistance on community mobilisations, best practices on collective farming,
and overall project implementation.

191
Key Challenges:
As mentioned earlier, the State level ICDP underlying approach is to identify challenges
across value chain of the identified sectors. The ICDP envisages interventions to address to the
challenges across the value chains. The study followed a step-wise approach as outlined below to
identify the challenges across value chain and recommend commercially viable business plans of
the interventions:
Similarly, a step-wise method has been adopted for developing commercially viable micro
plans of the PACS in the following manner:
Based on the above method, the challenges and interventions identified in respective
sectors across value chains have been presented below.
Sector Key Challenges Interventions
Agriculture and
Horticulture
Scattered and small
landholdings
Lack of workforce due to
migration
Lack of farm mechanisation
Awareness Gap
Lack of training and
certification on best farming
practices specially organic
farming
Lack of primary and secondary
processing
Cooperative Farming
Setting up of Custom Hiring
Centres
Agri-input Store
Warehousing
Marketing
Infrastructure Upgradation of
PACS
Goat and Sheep Low Herd Size
Lower quality breeds
Lack of goat breeding Centres
Seasonality
Lack of availability and
awareness about veterinary
services
Lack of transportation services
Lack of proper holding
capabilities
Unhygenic slaughter practices
Trauma in animals
Lack of organised market access
Promoting Rearing of
sheep/Goat at primary society
level
Setting up aggregation- cum-
breeding farms
Setting-up of Abattoir/
Slaughter house at federation
level(Cooperative corporate
partnership)
Dairy Low level of productions
Low levels of collections and
under utilisation of processing
capacities
Individual Dairy Farm Units
(5 and 19 animal units)
Cooperative Dairy farms(50
animal units)

192
Poor market access due to
product length and breadth and
poor strategies
Input Supply to primary
cooperative societies
Capacity Enhancement of
milk processing units
Total working capital
Requirement
Marketing and branding
Fisheries Dependence of conventional
practices
Absence of commercial
production despite huge
potential in case of trout
Water pollution
Inadequate Breeding and fish
seed production facilities
Inadequate Training and
Capacity Development of fish
farmers
Trout Farming
Trout Indoor hatcheries
Trout Hatchery with Breeding
Farm
Feed Plant
Angling Scheme
Pangasius Farming
Major carp farming
OASIS
Marketing and Branding
Market Place (Mandi)
Retail Shops
Aromatic Low level of land area under
aromatic and herbs
Lemon grass cultivation by
over 500 Ha in Pauri district
Damsk commercial
Gardening
Development of clusters of
mint cultivation over 500 ha
in Dehradun district
Development of cluster of
cultivation of Cinnamon over
500 ha around Kotabagh
Sericulture Lack of access to threads; Lack
of market access
Revolving Fund
Yarn Bank
Processing unit
Marketing Unit/ Centre
Tourism Lack of market access to
promote home stays in rural
Uttarakhand
Lack of know- hows on
hospitality business
Home Stays on Char Dham
Route

193
Sector Interventions
Marketing Societies Augmentation of warehousing infrastructure throughout the state
Co-op Bank Strengthening of infra and modernisation, Financial inclusion
through micro ATMS
UCF Strengthening of logistics and marketing capacities
PCU Training and capacity building
Key points highlighted in the Implementation Plan and Recommendations Framework are:
1. In case of PACS, Micro-plans have been prepared for six PACS as representative sample
and, fund provisioning has been done based on average gross project cost. The current
study includes a Manual for preparation of Micro-plans of PACS and, recommends that
actual fund disbursal for the projects of respective PACS may ideally be based on the
micro-plans prepared during the phase II (implementation phase).
2. Similar assumption has been made for components viz. tourism, UCF, Sericulture and Co-
op Banks. Because the nature of interventions is broadly enabling framework in nature and
actual viability could be ascertained at the time of implementation based on the estimated
area of service penetration.
3. In Sheep& Goat sector, the study recommends undertaking the intervention of Abattoir in
co-operative Corporate Partnership (CCP) Model.
6.11 AANCHAL COOPERATIVE
Uttarakhand Co-operative Dairy Federation Ltd. (abbreviated as UCDF Ltd.) is an apex
level State Federation of District Milk Co-operative Unions in the state of Uttarakhand .It was
established in the year 2001, under registration no; 555, dated12-03-2001, with its head office at
Mangal Parao, Haldwani (Nainital) for the successful implementation of the dairy programme
within the state. Organization has registered brand name, known as “AANCHAL". The
Uttarakhand Co-operative Dairy Federation Ltd. (UCDF Ltd.) came into existence as a successor
body to the Uttar Pradesh Cooperative Dairy Federation Ltd., after the formation of Uttarakhand
as 27th state on 9th Nov 2000. The UCDF Ltd. was registered under the Uttarakhand State Co-
operative act in the year 2001.
Schemes under State and Central Government like IDDP, RKVY,NPDD etc are being
implemented by organization for the economic and social up-liftment of farmers. Other schemes
like Big Dairy, Mini Dairy, Women Dairy Development Programme etc. are also being
successfully conducted. With the help of its own cattle feed factory, organization provide cattle
feed, fodder and seeds to its associate co-operative members at reasonable price. Animal medical
facilities like animal health services, emergency veterinary services, Artificial Insemination,

194
Natural Conception, Vaccination, Deworming, animal feeding knowledge, veterinary medicines,
and other types of technological investments are being served at village level societies with help
of organization’s member milk unions within the state.
RashtriyaKrishi Vikas Yojana (RKVY)
Funding Pattern: 100% Central Grant
District Covered: All districts of Uttarakhand
Project Period: 2013-14 to 2016-17 (4 Years), extended upto 2017-18 by the GOI
Total Project Cost: Rs 1784.93 Lakhs
Activities Perform Under RKVY
1. Strengthening of Dairy Infrastructure at Co-operative Milk Producers Union in
Uttarakhand (2013-14)
2. Renovation of the Dehradun Dairy Plant (2013-14).
3. Strengthening of Dairy Infrastructure of Haridwar Milk Union (2013-14)
4. Modernization of Milk Co-operative Societies in District Nainital and Udham Singh Nagar
(2013-14)
5. Construction of RCC Overhead (18m staging) Water storage Tank, Capacity -150KL and
SMP Godown (Capacity 300MT) at Nainital DUSS Lalkuan.
6. Installation of ATMs- Mobile Milk Vending Machine.
7. Construction of Milk Rooms.
8. Installation of DPMCUs
PERFORMANCE AND ACTIVITIES
All the 13 districts in the state are covered by 11-district level milk unions (District
Rudraprayag and Bageshwar are included with the Srinagar and Almora milk Unions
respectively)
Elected board of members in the district milk unions and state federation.
Infrastructure:- 09 milk Processing plants with processing capacity of 255 TLPD & 44
Chilling centers(including BMC) with a handling capacity of 95 TLPD.
Established Cattle Feed Plant Capacity 100 MT/Day, Compact Feed Block Plant Capacity
10 MT per day & Mineral Mixture Plant Capacity 4 M.T per day at Cattle Feed Factory,
Rudrapur.
UCDF is supplying quality cattle feed, area specific mineral mixture & compact fodder
block to the milk producers manufactured in its owned cattle feed factory at Rudrapur.

195
Nainital Milk Union is ISO 9001 and 200 certified.
Established cheddar & Ricotta cheese plant in Dehradun.
Wide spread dispersal of cross breeds cattle through various govt. and other schemes.
Emphasizing establishment of well-designed energy conservation and eco-friendly
machines and plants to save energy, power, water and fuel.
Successfully implementing Govt. of India sponsored schemes like integrated dairy
development project (IDDP), National Agricultural Development Program (NADP)
,RKVY etc.
Successful implementation of state government aided dairy development programs like
state Sector Yojana, DugdhMulyaProtshanhan Yojana, Ganga Gay Mahila Dairy Yojana
and Mahila Dairy Vikas Pariyozana.
Under STEP Dairy Schemes Women From the weaker Sections of the Society are
organized under the dairy Co-operative Providing them a Platform for upgrading and
strengthening their skills resulting socio-economic well-being (Mahila Dairy Project).
6.12 UTTARAKHAND STATE-COOPERATIVE FEDERATION
History
Uttarakhand State Co-operative Federation Ltd (UCF) is the multipurpose Federation of
Uttarakhand. UCF was registered on 15th July 2002 after bifurcation from U.P. Co-operative
Federation Ltd, (PCF) Lucknow as a result of formation of Uttarakhand State on 9 November
2000. The Federation made a humble start with 16 employees of PCF working on deputation with
a share capital of Rs12000-00 only. The present turnover of the Federation is Rs.20123-00 lacs.
The Federation is working in the following areas:-
2 Distribution of Chemical Fertilizer, Bio fertilizer, certified seeds & pesticides to farmers
through PACS
3 Purchase of wheat & Paddy through PACS.
4 Supply of Consumer Items to state offices/cooperative societies
5 Insurance of farmers through ICICI Prudential life Insurance and IFFCO TOKIO
Insurance Company
6 Warehouse operation viz renting of godowns etc
7 Construction of building, roads, canals etc.
8 Supply of Ayurvedic medicines in the government hospitals all over India. UCF has its
own drug manufacturing unit at Ranikhet (Almora).
9 Working as agent of State Government in the field of mining.

196
Objective And Function
1 Marketing and processing of agriculture produce
2 Distribution of seed, fertilizer and other agricultural inputs to the farmers as per the
government policy.
3 Distribution of coal etc.
4 Supply of consumable items in the government offices as per the procurement policy of
Uttarakhand
5 Construction and operation of ware houses and cold storages.
6 To help and provide consultancy to the member societies of the UCF
7 Production of Ayurvedic Medicines and supply these medicines to the government
hospital of the country
Works being done by UCF
1. Working as largest food grain (wheat and paddy) procurement agency of the state in
cooperative sector through cooperative society.
2. Working as premier warehouse agency of the state for scientific storage of food grains
with heaving 90,300 MT capacity godowns at different location of Uttarakhand.
3. Working as transportation and hoarding agent of IFFCO CA worldwide fertilizer company
in cooperative sector.
4. Distribution of bio fertilizer and chemical fertilizer and pesticides to farmers of
Uttarakhand through cooperative societies.
5. Supply of consumer items at the state offices/ cooperative society.
6. Insurance of farmers through ICICI prudential life insurance and IFFCO TOKIO insurance
company.
7. Working as agent of state government in the field of Supply of Ayurvedic medicines in
the government hospitals across the country through its Ayurvedic medicine
manufacturing units located at Ranikhet and Halduchaur.
6.13 CDF RANIKHET
The Co-operative Drug Factory was established at Ranikhet in the year 1954 & Sstarted
manufacturing of Ayurvedic medicines from the year 1955. The land and building is situated at
free pollution zone of Himalayas. The factory is playing an important role in the economic
progress of the hill area by way of using herbs in preparation of Ayurvedic medicines found in the
Himalayan region as well as providing employment to the people.

197
Despite the temptation to modernize, the Co-operative Drug Factory, cradled in the hills
of Ranikhet continues to prepare drugs the way were originally intended to be prepared.
The science of Ayurveda goes much deeper than prescribing a list of herbs. The method
of formulation is as vital a part of the medicines as the ingredients themselves. At CDF Co-
operative Drug Factory, fully qualified Doctors of Ayurveda rigidly maintain the discipline
required by the sages who developed the drugs.
Discipline in the selection, storage and preparation of the herbs and medicines. They even
do one better equipped with sophisticated laboratory; they spare no pains at scientific tests for
quality control. Quality rather than quantity is the watch word.
The factory today makes about 200 Ayurvedic remedies. Chyawanprash, Drakshasava,
Brahmi & Bhringraj hair oils, Pachanlavan known. Each of them is formulated to get the root
cause of ill health and to promote better effectively..
The Co-operative Drug Factory has completed 53 years of its existence and is dedicated
to keeping alive the wisdom of the golden ages of India.
6.14 UMPL, HALDUCHAUR
With Growing consumer acceptance of 'AYUSH' in the Domestic and Global society,
Uttarakhand Co-operative Federation (UCF) has decided to establish an another “AYUSH”
medicines manufacturing unit at Halduchaur, District- Nainital in the year 2007.Under the name
of UMPL we are using modern manufacturing facilities for the production of two hundred type of
classical Ayurvedic Medicines like Ashva Aristha, Ras Rasayana, Tablets, Pak Avleh, Medicated
Oil etc.
UMPL is a G.M.P certified unit and is enlisted under the ministry of Ayush New Delhi as
a registered supplier vide circular no. R 15011/03/2007 on 18th May 2007. Uttarakhand State Co-
Operatives Medicines and Pharmaceuticals supplies Ayurvedic Medicines to various states Ayush
Departments like M.P, Haryana, U.P etc.
6.15 Business Activities of UCF
Fertilizers
UCF undertakes handling transport and storage of fertilizers of IFFCO. Indian Potash Ltd.
KRIBHCO etc. with the aim of ensuring timely distribution of the fertilizer to the farmers through
the co-operative societies and Krishak Seva Kendra established by UCF. The procurement and
distribution of pesticides and Biofertilizer to the farmers with the help of the societies
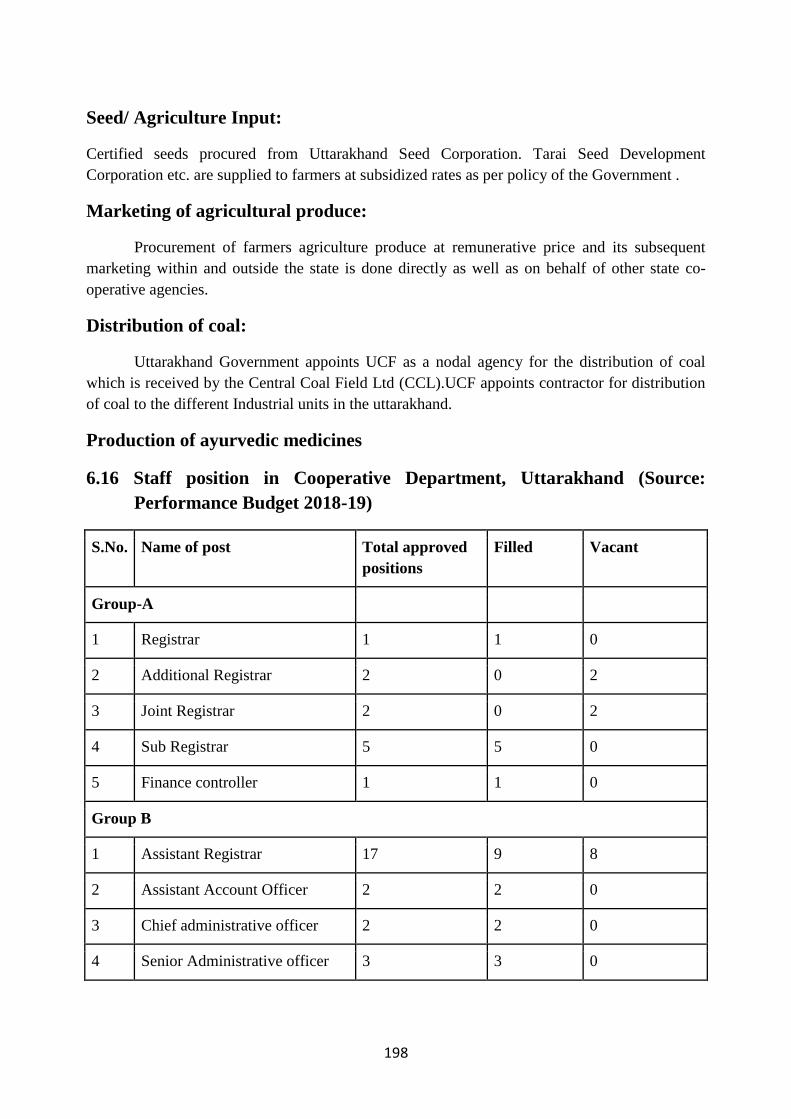
198
Seed/ Agriculture Input:
Certified seeds procured from Uttarakhand Seed Corporation. Tarai Seed Development
Corporation etc. are supplied to farmers at subsidized rates as per policy of the Government .
Marketing of agricultural produce:
Procurement of farmers agriculture produce at remunerative price and its subsequent
marketing within and outside the state is done directly as well as on behalf of other state co-
operative agencies.
Distribution of coal:
Uttarakhand Government appoints UCF as a nodal agency for the distribution of coal
which is received by the Central Coal Field Ltd (CCL).UCF appoints contractor for distribution
of coal to the different Industrial units in the uttarakhand.
Production of ayurvedic medicines
6.16 Staff position in Cooperative Department, Uttarakhand (Source:
Performance Budget 2018-19)
S.No. Name of post Total approved
positions
Filled Vacant
Group-A
1 Registrar 1 1 0
2 Additional Registrar 2 0 2
3 Joint Registrar 2 0 2
4 Sub Registrar 5 5 0
5 Finance controller 1 1 0
Group B
1 Assistant Registrar 17 9 8
2 Assistant Account Officer 2 2 0
3 Chief administrative officer 2 2 0
4 Senior Administrative officer 3 3 0

199
5 Co- inspector
Class 1/ Upper district
cooperative officer
78 73 5
Group -C
1 Personal Officer 1 0 1
2 Senior personal officer 2 1 1
3 Personal Assistant 2 2 0
4 Administrative officer 3 3 0
5 Assistant Development officer 142 116 26
6 Accountant 16 1 15
7 Investigator cum computer 11 0 11
8 Assistant Writer 7 3 4
9 Head assistant 7 7 0
10 Junior engineer 1 0 1
11 Senior assistant 11 4 7
12 State supervisor 176 112 64
5 Junior assistant 13 9 4
5 Computer operator 6 6 0
6 Sangrah Amin 133 63 Dead post:70
Total 644 423 151
Group -D
1 Driver 16 2 14
2 Helper/watchman 28 18 10
3 Jamadar 2 0 2
Total 46 21 26

200
Co-operative Tribunal
1 Director 1 1 0
2 Member 2 2 0
3 Secretary 1 0 1
4 Personal Assisstant 1 0 1
5 Junior Assisstant 1 1 0
6 Driver 1 0 1
7 Helper/ Watchman 2 1 1
8 Process server 1 0 1
Total 10 5 5
Institutional Service Board (Registrar ex- president)
1 Secretary 1 0 1
2 Personal Assistant 1 0 1
Total 02 01 0
Grand Total 702 452 184
Table 6.7: Source: Co-operative Department, Uttarakhand
The total number of sanctioned posts in the department across all groups is 702 of which
184 are vacant. 26.2 % of the sanctioned posts are lying vacant. Group D has the highest
percentage of vacant seats with 56.5 % seats vacant (26 out of 46). In group A, 4 out of 11 are
vacant that is 36.36% seats are vacant. Group C follows Group A closely with, 134 of 398 posts
vacant (33.66%).
REFERENCES
Cooperative Department Uttarakhand
Outcome Budget 2019-20, Cooperative Department Uttarakhand
Performance Budget 2018-19
Programme for Development of State through Integrated Cooperative Development
Project (ICDP)
www.ucdfaanchal.org/

201
Chapter 7
CASE STUDIES
Several successful case studies have been presented in this chapter. These help to focus on
approaches that would be successful in boosting the rural economy, thus mitigating out-migration.
7.1 Mahatma Gandhi National Rural Employment Guarantee Scheme:
Success Stories
7.1.1 District Almora:
1. Fish Pond construction in Patiya- Gita Bisht w/o Virendra Bisht:
Year: 2017
In patiya a fish farm fond (Natural Resource Management) was constructed in financial
year 2017-2018. A total of 236 man-days were generated in the construction.
Under MGNREGS, the beneficiary family did not only get work under the scheme but also
benefited from fish farming. The water that came from the clearance of the farm pond is used for
vegetable production adding further to the benefit. The economic betterment of the beneficiary
family due to the construction under the scheme was appreciated by the governance and other
villagers are also being motivated to start fish farming.
2. Construction of goat shelter in Mandalkot - Manoj Singh/Diwan Singh
Year: 2016-17
A goat shelter was constructed in Mandalkot under Category B (Individual Assets). A total
of 112 mandays were created.
The Gram Panchayat Mandalkot is situated approximately 35 kms from the development block
Tadikhet. The villagers of the village are involved in goat rearing. The beneficiary Manoj Singh
has 8 goats but did not have a shelter to keep them and had to keep them with the cows and
buffaloes. The village development officer gave the information of goat and poultry shed
constructions under the MGNREGS in an open village meeting. Manoj Singh’s son Diwan Singh’s
name was included for the beneficiaries and after some time the shelter was ready.
Benefits: Manoj now has goat shelter so he does not have to keep all his cattles together.
He now has 10 goats and earns well through goat rearing. He also uses the dung produced by goats
as fertilizer in the field.
202
3. Reservoir construction
Place: Gram Panchayat Chamkna Dhadri
Year : 2016-17
Due to no water conservation facility in the gram panchayat Chamkna Dhadri , the farmers had to
face many difficulties for irrigation. In year 2016-17 under MGNREGS an amount of Rs. 2,00,000
was sanctioned for construction of reservoir in the village. Under MNGREGS, registered workers
were provided with work on demand basis for the construction of reservoir. Total 672 mandays
were created and 56 registered labourers were provided work. Post reservoir construction farmers
are able to irrigate their crop regularly which has led to increase in productivity leading to better
financial state of the farmers.
4. Farm Pond
Development Block: Dwarahat
Name of work: Farm Pond ( Individual Asset)
Beneficiary name: Surendra Singh s/o Puran Singh
Gram Panchayat: Basulisera
Mandays created : 278
Outcome / Success story: Through this asset creation the beneficiary is able to conserve
water and is helping in livelihood. Other villagers are also benefiting from the water conservation.
7.1.2 : Pithoragarh
Livelihood improvement through convergence (MGNREGS and Didihat Tea
development Scheme)
Didihat is situated at a distance of 55 km. from the district headquarters. The main occupation of
the villagers in this region is agriculture but it is completely rainfed. Due to lack of irrigation
facilities in the area the production capacity is less. This has led to loss of interest in farming
leaving the cultivable land barren. The villagers have difficulty in day to day errands and also in
education of their children. The lack of livelihood opportunities in the village has led to villagers
migrating to other areas for earning more money. The Uttarakhand tea development board through
convergence is trying to overcome this problem, provide women with more opportunities of
livelihood, managing man animal conflict and trying to help curb migration. 60 hectares of land
which had been lying uncultivated in 14 gram panchayats has been proposed to be brought under
tea plantation.
The main objectives of the scheme are:

203
1. Employment generation
2. Land development
3. Carbon Sequestration
4. Stopping Migration
5. Women Employment
6. Increasing green cover
In development block Didihat, about 31 hectare of land that was lying uncultivated has been
brought under tea development scheme and plantation has been done. 250 people have been
provided with employment for 100 days every year. Under the scheme 36103 mandays have been
generated of which 27120 are of women. Currently work has been done in seven gram panchayats:
Madh, Tiladi, Bhagaon, Bhaisudi, Nanpapon, Leparthi and Bhaluudiyar. Initially 4 to 5 kg /ha tea
production is expected which in the coming 5 years is expected to increase to 100 kg/ha. Farmers
can earn around 3200-Rs. 4000/ha at the rate of Rs. 800 per kg. In the initial 7 years tea board will
provide the farm workers with employment and post that the farmer groups can themselves start
Leaf Plucking and earn their livelihood by selling it.
7.1.5 District Chamoli
Cultivation of Gulab
In block Joshimath, District Chamoli cultivation of gulab is being done with the technical help of
Saghand Dodha Kendra, Selanki, Dehradun under MGNREGS. The total area for cultivation is
81.18 hect. Total 88 farmers are selected for the scheme. Total cost of the project is estimated
17.10 lacs. In year 2017-2018, Rs 6.80 lacs expenditure has been done on this scheme. The
schemes objective is to enhance farmers’ income for a long duration.
7.2 Success story Livelihoods Improvement Project for The Himalayas
7.2.1 Drudgery reduction– first stepping stone to empowerment of women in
Aajeevika
Women form the backbone of the rural economy of Uttarakhand. However, steady
degradation of forests, water, and other common resources has further aggravated manifold the
drudgery of women. In addition to this the high male out migration adds to further stress on them.
The drudgery reduction intervention was made in 618 villages wherein interventions like
vermi composting in 4,975 households (HH), plantation of 0.53 million Napier grass tufts – a high
quality and high productivity ( 7 times more than local grass) nutritious fodder grass by 9,519 HH
and demonstration of 6,842 improved agriculture implements was conducted in 7631 HH. The
agricultural implements were introduced were paddy thresher, finger miller thresher, sickles,
winnowing fan , garden reck etc. All these implements were tested by agriculture research

204
institution as ergonomically superior, which reduces drudgery on the particular activity by 50 to
70%.
Tracking the adoption rate: For this, the project has organized a regular monitoring
within Self Help Groups (SHGs) facilitated by 29 NGO partners.
Learnings : Along with the adoption, there has been mortality of the introduced Napier
grasses in some of dry villages. This has made project more aware to search for drier varieties of
grasses in these areas. Community was also made aware of feeding combination of Napier with
other local grasses as Napier contains oxalate which if consumed singly may lead to calcium
deficiency in animals. The project was able to draw Innovation Grant Project of IFAD based on
the adoption strength of the first year’s field experiment..
7.2.2 Spreading the light
Nestled in the valley of the Bilangana River, above the remote town of Ghuttu is an
example of local entrepreneurship that is bringing benefits to villages in the area. Some 12 years
ago, Umaid Singh’s father constructed a water mill to provide a mill for grinding wheat, finger
millet and amaranthus. Now, he and his brother Mahipal Singh have taken over the mill and added
a 7.5 KW generator to produce electricity for their family members.
A local engineer, Bhim Singh Negi, provides his services to replace belts and maintain the
equipment. The generator successfully powers 30-40 light bulbs and four TVs. “I do not charge
but each household contributes Rs 50 per month towards the running costs”. Compared with the
Rs 300 per month charged for government power supplies, this is a good deal, especially as the
water generator does not have frequent power cuts! Obviously, the brothers have accumulated
considerable social capital from their service.
The mill serves eight villages and processes some 300 kg per day. Umaid Singh also,
joined an exposure visit to see other mills in Rudhraprayag District, organised by Aajeevika. As
a result of what he learned, he has already replaced the penstock with a larger pipe to give a greater
water flow and is now planning to install a 15 KW generator. This illustrates effectiveness of
exposure visits and the enterprise could form a good demonstration for Aajeevika enterprise
development.
7.2.3 Evolving the knowledge base for livelihoods promotion
When the NGO partner started discussing with the villagers on Kuroiler (a hybrid variety
of backyard poultry bird with high productivity than the normal local poultry bird) rearing and
listing the willing target household for the same, Bhup Singh showed willingness to take more
number of Kuroilers. Although being the poorest farmer, seeing the enthusiasm and confidence of
Bhup Singh, the project went out of its way to give 60 chicks to Bhup Singh for which he paid Rs.
7/- per chick. He took the loan and constructed a big poultry shade to accommodate 60 chicks for
rearing. He reared all the birds with great success and would like to take up this activity further as
one of the main source of livelihood. Bhup Singh was very observant of the eating, drinking and
205
sleeping habit of chicks from the first day. His confidence on what he learned from 60 chicks is
clearly reflected in his eyes. Person like Bhup Singh are building blocks of evolving knowledge
base at grassroots for cost effective livelihood promotion. Attending the most vulnerable first in
Aajeevika , the project became conscious that it would fail in its basic objectives if the most
vulnerable people were not brought into the project arena. Aajeevika took up this challenge and
moved strategically since the beginning of 2006 to improve their living condition by linking them
for stable financial and medical support with Social Welfare Department and Health department.
Physical rehabilitation of 84 physically handicapped persons was made possible through
distribution of hearing aid, crèches, Jaipur foot ( artificial limb) from a project under Ministry of
Social Justice.
Learnings : The 1,400 cases identified by the project formed the most vulnerable individuals in
the project villages. Only one district (District-Tehri) could be attended for giving certificate to
the mentally handicapped. This was due to dearth of medical experts required in the panel of
Examination Board for such certification. It was more difficult task to converge for these
categories of vulnerable people with government pension scheme and physical rehabilitation
programmes as compared to attaining convergence in livelihood enhancement activities with
technical line departments. In this case, convergence had to be attended on individual case to case
basis which demanded sensitivity, personal care, valued time and attention of the field
functionaries. Not all the 29 NGO partners of the project were sensitive to the rehabilitation of
vulnerable people. They had to be specially sensitized on this issue.
7.3 Success Story IFAD
7.3.1. Reinstating the modern farming wheel in the hills
In the year 2017, subsidy under the scheme was availed by 131 livelihood collectives. Till
September 2018, 131 FMB centres were operational; one FMB center has been set up per
Livelihood Collective. The target for financial year 2018 is to reach 250 livelihood collectives
having 250 functional FMB centres. The tools purchased for one FMB center approximately
covers 40-50 Ha of farmland. On an average each FMB center caters to around 500 households
and 50 producer groups.
Rekha Bhandari, a 32 year old woman farmer from Jajurali village , Bin Block, Pithoragarh was
able to grow crops just to fulfill few of her family needs 3 years back. Now she is able to earn Rs.
40,000 a year from her fields. She lives in a joint family with the in-laws, has two children and
her husband owns a small grocery store in the village. She says that her 3 year old association with
UGVS since 2015 has improved her socio economic condition. She is president of gurung ghat
aajeevika sahitya sahakarita. An enthusiast farmer, she attended various training programs and
exposure visit about improving agriculture productivity conducted by UGVS. From Farm
Machinery Bank Centres, she regularly uses tools like bush cutter and Power weeder and Wheat
Thresher in her farm. Over time she has learned to operate these machines on her own with some
initial hiccups. She says that use of machines saves considerable amount of time and has made

206
farming easy for her. Seeing her operating the machines, other women from the village also got
inspired and now use these tools.
7.3.2 Indigenous Innovation to secure livelihoods chain link fencing initiative.
One of the many chronic challenges faced by the farmers involved with ILSP UGVS was animal
conflict in the farm fields. In the thirteenth year of operation UGVS took up a pilot discovered the
chain linked fence is an irrefutable solution to keep the wild animals out of farm. The demand of
fence has grown manifold and some farmers who have abandoned these fields are returning.
Villagers in Chamba district said, “We were least interested in farming as wild animals destroyed
our hard work. Whatever little we sow was destroyed by wild boars, porcupines and monkeys.”
one of the villager said that “we had no option but to leave our village and migrate to cities in
search of work so that we can feed our families. But our situation took a U-turn since we started
using FENCE provided by ILSP-UGVS to protect our fields from wild animals”
Rekha Devi lives with her husband, two children and old in-laws in Jujrali village, Pithoragarh.
She relieved after having fenced her farmland. Earlier they had to guard the fields at night, light
fire to scare away the wild boar with limited success. They could not afford fencing. Chain link
fence has successfully kept the wild animals at bay. Now she and her family are able to sleep
peacefully at night. This season she harvested twice the amount of cabbage.
7.3.3 Jamradi : A Rural Industry Mechanization at Source
Nari Ekta Cooperative is a federation of 86 self-help groups, of 881 small to marginal farmers,
spread over 26 villages in remote Saryu valley, which being hot and humid, produces a lot of
spices like Coriander, Turmeric, Chilli, Ginger, Dalchini and Tezpaat. It has set up a rural industry
at Mangalta village of Bhasiyachanna Block in Almora District. Sixty kilometers away from
Almora, it borders Bageshwar and Pithoragarh. The farmers also produce pulses- Soya-beans,
Gahath, Masoor and fruits too: Mango, Malta, Lemon and Walnut.
HILLANS : New brands HILLANS, Almora Bhog, Fresh and Craft were launched in ILSP phase
and all federations are using this brand image in local produces. The center procures spices at
approved prices from the producer groups and processes them, to be sold locally and in bigger
cities too, including Delhi, 400 Km away. At present, this unit is producing 23.5 Quintals of
Mandua flour and 3 quintals of spices every month.
Mandawa biscuits made by women members of Monal Ghati in Bageshwar are high in demand.
On April 26th 2018 , Prime Minister Shri Narendra Modi appreciated these biscuits made of
manduwa floor by women member of livelihood Collective of UGVS in Mann ki baat.
The Cooperative has 787 shareholders, each contributing a one-time membership fee of Rs 110.
Shareholders get preferential rates during procurement and other benefits. Prices are fixed by
getting the regional Mandi rates and adding the transport cost which local farmer will have to bear

207
in addition. The rates have to be competitive enough to discourage existing networks of
middlemen. This creates lot of argument and pressures.
Good returns: Total Investment since September 2013 made in this industry is Rs 44.7 lac. Project
investment was Rs 3.1 Lac out of this. Total turnover has been Rs 57 lac, generating a profit of Rs
5.5 lac. Some of the constraints, which need to be addressed in coming years, are: Not enough
volume of local production. Production has to be increased, to get the maximum out of this unit.
The central scheme of crop insurance has not reached these mountains yet.Price wars: Another
issue is: lack of a fool-proof method to decide procurement rates
7.3.4 New Approaches to Marketing : There is an inverse relationship between
the quantity produced and per-unit fixed costs
Traditionally, productions being small, farmers in the mountains have sold it in the nearby
markets, often at throw-away prices. Mandua, a millet has been sold at Rs 6 per Kg in a remote
village near Chaukhuitia, 100 Km from Almora. This was also because transport facilities are few
in the remote villages.
Economy of Scale: The ILSP project began in 2013 in this region, with social mobilization and
establishment of the producer groups in villages. The project took the initiative of organizing a
Buyer Seller Meet in Chaukhutia block in 2015. Businessmen and traders from Ramnagar,
Haldwani, Ranikhet, Bhatrozkhan etc. were invited. Other livelihood experts, Bank
representatives, Line officer from Agriculture, Horticulture, Animal husbandry departments of the
state government were also invited.
As a result, 20 quintals of Mandua, was collected by the cooperative a few months later in the
winters of 2015, by purchasing it from the producer groups at Rs 13 (not Rs 6) per Kg and sold at
Rs 16 per Kg to outside traders: a decent profit for the farmer as well as the cooperatives.
Collective Marketing: Eighty Kilometers away in Sult block, Seema Molekhi, president of Maa
Lakshmi self-help group in Harda village, decided to do the same. They took out Rs 3500 from
their project support and traded in chilies, generating a profit of Rs 630 in just a week or two. Now
thegroup is feeling so inspired that they have decided to procure 120 Kg Ginger locally and trade
it in Chaukhutia market. The collective marketing of potato seeds was started by some federations
like Pragati SRC Mothiapather in 2015; they procured net potato seeds of Rs. 13 lakh from Manali
(“Kufri Jyoti” brand) collectively at the rate of Rs. 52 per Kg and distributed it to all federations
at the rate of Rs. 56 per Kg.
Existing players: The project has tried to strengthen the linkages with existing players like Anchal
(Dairy cooperative) and the local markets too.
Exhibitions: Vibrant Exhibitions were organized in Dehradun ; it provided one platform to all
traders, buyers, government and private companies, federations, self-help groups, and societies to
display their produce, agricultural equipment & tools, IEC materials and Improved seeds &
pesticides, so that small and marginal farmers can access the innovative and upgraded technology.

208
Two Federations members participated in these Exhibitions and net sale was Rs. 28380.00 and net
margin was Rs. 3160.00.
Local Markets: Some PG/VPGs have been able to reclaim a space for their produce in the local
market. The groups in Garud, approached the civic authorities and they gave them the permission
to set up a Sunday vegetable market in a shed which was made for the purpose but has been lying
unclaimed and unused all this time. They find it more beneficial to set up the weekly shop in this
shed, 6-7 km away, rather than deal with the middlemen.
7.3.5 A Trading Cooperative of Small Producers Harikul Swayatt Sahkarita,
Kulsari, Narayanbagad block of District Chamoli
Harikul cooperative in Kulsari village, about forty kilometers from Karnprayag in Pinder valley,
is a federation of 45 SHGs, spread out in about 16 villages. It has 439 shareholders, of which 383
are women. It is headed by Anita RawatIt was organized in February 2008 and was registered as
a cooperative in 2010. Its unique feature is: it procures a variety of produce from local farmers,
sells them at different outlets and offers the farmers diverse services in return: Tata Tea, seeds,
solar lanterns to drudgery reducing implements and plastic equipment. Second phase (ILSP) began
in 2012, during which the project supported the cooperative continuously; this ensured that the
operations continued smoothly, till the organization is strengthened and self-sufficient. It has a
total capital of about Rs 4.5 lac, with half of it currently being invested in various businesses. The
cooperative sells local produce like Soyabean, Pulses, Cereals, Millets as far as Haldwani 200 Km
away, besides through its own shop (Samriddhi Gramin bazar) under Hilans brand. It also sells
these items at numerous exhibitions and fairs – and sometime, it sells its produce right here in
Kulsari, when it finds a good buyer, saving itself the trouble and expense of exporting the produce
to a mandi.
As part of its convergence strategy, it is able to sell its produce to the Organic Cooperative in
Tharali, which in turn, supplies organic produce to remote consumers elsewhere in the country.
Besides, it trades in Tata Tea, a popular consumer item in villages. It procures the tea and other
items from other Aajivika federations. As part of its networking and attempts to diversify, the
cooperative is working with Reliance, Emmanuel Hospital Association, KVK etc. on various
themes of community.
Coming from a remote village on the periphery of both Garhwal and Kumaon, Anita thinks that
over last one decade, she and her cooperative have achieved a lot more than they could have ever
dreamed of; Having an office and capital in the bank is not the biggest part of this journey; She
thinks that so many women meeting and working together in this fashion is the true highlight of
this long journey.
7.3.6 Crop change in Jaunsar Off season vegetables kick off
Uttarakhand is an agrarian state. The soil conditions are good for the production of fruits and
vegetables. As of today, 101 (out of 254 in the state) OSV producer groups are from Chakrata

209
block alone. This is a big change and a significant trend; It shows that slowly but steadily, the
Jaunsari farmers are waking up to the new crops and the new approach to livelihood.
ILSP began in 2013 with social mobilization in Jaunsar mountains. HARC, as TA, facilitated
formation of 269 producer groups of farmers in 158 villages in Chakrata block. Devendra Singh
Chauhan, 48, from the Tagri Hayau village, in Kalsi block (near Chakrata) is one such farmer. He
belongs to Krantidal Producer group (18 members), which is linked to Khat Saili Federation. Till
eight years ago, he and his joint family of twelve members cropped paddy and potato. Then, he
visited a relative living near Sahia, 23 Km away; he borrowed some seeds of cabbage from him -
and a lot of new information. Since then, he has focused on Ginger, Aravi ('Gagal') and potato.
With other farmers of his group, they hire a transportand take their produce to Vikasnagar
vegetable market 36 Km away – thanks to a 5 km dirt road which links their remote village to the
main Chakrata road. His other five brothers have shifted to the town nearby.
The ginger from the region is being exported even outside India, to countries like Afghanistan,
where ginger is dried and preserved as spice (sonth) for round the year use.
Another farmer from his group- Shamsher Singh, is growing Pea, Tomato, Ginger and Arvi.
Together, their producer group adopted a few helpful practices like sorting and grading the
produce beforehand, trying and reaching the vegetable market before 6 am and selling their
produce collectively to negotiate better prices. Their PG, Krantidal Utpadak Samooh, has
undertaken intervention worth Rs 90,900 in 2014-16, out of which their own contribution was Rs
10,035; This was used for seed procurement, nursery raising and plant protection and for LDPE
Sheet, Shed Net, 150 Mtr Pipe. They have 18 farmers in their group who are very hopeful for a
better future now through collective vegetable farming.
7.3.7 Micro-enterprise based on spices Farmers in a border village aim high
Rajyuda is a border village in Munakot block of Pithoragarh district. There are about 105 families
and most of them survive below poverty level (BPL families). The main livelihood options here
are subsistence agriculture, horticulture and animal husbandry. But since irrigation is not
available, most of it is dependent on rains. This is why many farmers try to increase their
production by using improved seeds, fertilizers and insecticides. The rural community of Rajyuda
set up some SHGs and PGs with help from ILSP in 2014. One of these is Mahakali Self-help
group, consisting of 5 progressive farmers. The group, under the able leadership of Krishnamani
Bhatt, is trying to popularize spice production and Off season vegetables in the area. The group
has started a spice unit for grinding, packaging and marketing locally produced spices like
Turmeric, Ginger, Coriander and Chilli. Many farmers who were harassed by wild animals, are
turning to spices now, since wild boar and monkeys don't destroy spice crop. With the financial
help from the project, the Mahakali group has up-scaled its operations and is now processing and
enriching the local produce like Myrobalan (Amla), Mango, Burans flowers, wild pomegranate
etc. These fruits and flowers were wasted earlier. Now these are being converted into pickles,
juice, jam etc. The farmers in the village are selling their produce to this group now.

210
The group has started a vegetable nursery too, to promote cash cropping of vegetables- like
Tomato, Brinjal, Cabbage, Capsicum etc. All these initiatives have increased the income of the
members and generated interest among other farmers, towards other viable options. Spice unit is
being used by locals, from Majirkanda, Bhatedi, Rajyuda, Dauli etc. to grind their spice. Also,
these villages are providing the raw material- the spices grown locally.
Future plans: The unit has been registered with the state industries department. The group
has plans for starting a Food processing unit soon and getting it registered under the state
department of Micro, Small & Medium Enterprises (MSME).
7.3.8 Large Cardamom in a Narrow valley Matching crop to the climate
Sunita, 44, is the president of a nine women producer group, Nagdev Utpadak Samuh, in
Launga – a small village hugging the steep sides of a narrow valley in Jakholi block of
Rudraprayag district. This group is formed by ASEED, in 2015. ASEED is the technical agency
of ILSP. ILSP is supporting 381 groups in Agustmuni block benefitting 3102 households. This is
what the local medicinal herb experts (Bheshaj Sangh) told the villagers about ten years ago. That
group could not offer more than just the idea – and a few root cutting in the beginning. A few
farmers struggled with it initially. It gets ready for harvesting only after third year. The Technical
agency- ASEED- came to their help by explaining all the technical issues of this crop. They are
growing it organically now and using no insecticide. The group has 4 APL and 5 BPL families in
it. Last year, Sunita sold 25 Kg of Cardamom for Rs 30,000. Next season, the group is planning
to sell 40-50 Kg of large Cardamom at Rs 1200-1300 per Kg in Rudraprayag, 40 km away, on the
popular pilgrimage route. Tilwada and Rishikesh too have a big demand for spices. They save Rs
100 per month per member and have Rs 30,100 in the bank for inter-loaning for various productive
purposes. The group is growing other crops too: Potato, Garlic, Onion and Turmeric in smaller
quantities, which they often barter or sell within their federation- Jagriti Aajivika Swayatta
Sahkarita. One of the constraints faced by this group is the shortage of irrigation facility:
earthquakes, road-building, (Laxmi, Sunita, Mamta and Leela of Nagdev Utpadak Samooh,
Launga Village) (Hidden near the root: Large cardamom is an important spice.) landslides often
disrupt the irrigation channels (Gul) and leave fields dry and dependent on chance rains. The group
has applied for LDP tanks and also for solar powered water lifting pump.
Farming of large Cardamom has been taken up by 99 households, in 15 producer groups
spread over 8 villages under UGVS. There is a big scope for many more farmers to take it up. It
still ranks far below Chilli, Ginger and Garlic in Uttarakhand. Interestingly, Sikkim, another
Himalayan state has seen a big revival of large cardamom in recent years, proving that special
spices do have a place in the repertoire of the mountain farmers.
7.3.9 Off Farm initiatives in Uttarkashi Federations take the charge
Ma Jagdamba PG has sold many Soya badi and Burans juice in the winter festival- Magh
mela, held in Uttarkashi. They organized a Burans festival on 5th April, during which the group
collected Rhododendron flowers, separated the petals, clean and boil it, to make juice, using

211
preservatives, for selling. Appropriate Technology India (ATI), the Technical Agency, for this
region, has already got them an order for 500 bottles at Rs 80 each. Many federations are getting
into the act, very seriously. They are truly acting as owners of the cooperative and its resources.
ILSP aims at convergence between all LCs and state line departments, to leverage state
schemes. At a recent government meeting, the Chief Development Officer (CDO) was so
appreciative that he promised that, just like NABARD groups, ILSP federations too will be given
CCL at 7%, with remaining 5% subsidized by the government. This is a big step in providing low
interest funds to promote entrepreneurship among the farmers of the mountains. Convergence with
the Horticultural department has assured, that federations will be granted 5 polyhouses at only
10% cost, paid as labor. ATI has negotiated with Agricultural department, which was having
difficulty finding beneficiaries, to provide one spraying machine for each Self-help group, at just
Rs 300 each. Hari Maharaj federation has been given a rent free shop at Uttarkashi, by DRDO:
Hilans Bazar. It sells Soya Badi, Burans Juice, handmade Incense sticks, Honey etc. The
federations are trying to come up with more products so that the shop is in business round the
year. Sarojini, 37, a divorcee with three young children, is often asked: What do you get out of all
this running around? She does not care. Having suffered as a young divorcee, she feels and cares
for other women. She is convinced that economic independence is an important step in the
emancipation of rural women. Trying to build up a “collection center” in her village Manpur, she
demonstrated her grit. She was able to get land through donation from Shoor Veer Singh of
thevillage.
7.4 Success Story UDWDP
7.4.1 PARAVET- LIVELIHOOD OPTION
Improving the breed of local cattle through artificial insemination is a challenge for
farmers living in remote areas. Transporting cattle for medication to vetinary hospitals is an
expensive and dangerous proposition. Gramya identified this problem and tried to resolve it by
training a local person as a paravet to be able to provide insemination services at doorstep of the
farmers.
As a part of this initiative an educated unemployed youth, Shri Dipesh Jangpangi, a
resident of village Tirgoli in Pithoragarh district was identified for paravet training. He undertook
training at Pashu Lok, Rishikesh in 2016. He set up an artificial insemination centre in the village.
The centre was provided with a paravet kit which included equipment like liquid nitrogen
container, semen straw, etc which were provided by the project with the technical inputs from
Uttarakhand Livestock Development Board.
In a short span of time the centre has been able to provide its services to a number of
farmers within 4 to 6 km of its periphery. Almost 100 cattle have been inseminated by him with a
success rate of about 83%.
Mr. Dipesh charges 300 rupees for farmers who bring their cattle to his centre and about
600 rupees for home visit. As a paravet his status in society has been elevated and has provided

212
him a secure source of income. For the farmers it is a big bonus to have such a service available
at their doorstep at reasonable rates. This initiative by project has not only generated income for
an individual but has also assisted the farmers to improve the breed of cattle in their remote village.
7.4.2 SOLAR ENERGY BRINGS NEW LEASE OF LIFE IN THE
VILLAGE
Ladoli village in Almora district stands as a case in point of building climate resilience
which is sustainable, environment friendly and low cost. The village caught Gramya’s attention
as agricultural fields were barren, quite contrary to what is expected from a Himalayan village.
“Why are the fields barren?” “We don’t have any irrigation here” came the response.
Women did rain fed farming which was meagre since men had moved out for more
sustainable incomes to towns. They grew wheat and some lentil in Rabi and maduwa, jingora etc
during Kharif, mostly from the seeds saved from the previous year’s harvest as recalled by one of
the farmers.
Discussions with farmers led to the idea that impounding water from the stream and using
solar energy to pump water the agricultural fields up-stream water was impounded by the
construction of a check dam and collected in a sediment tank. A novel idea was conceived to
install solar panels instead of using diesel to operate a pump to lift water from the tank to the
village. The intervention being climate resilient had low carbon foot print too.
The irrigation tank (15000 litres) was constructed. Scientists and technicians from VPKAS
provided on-farm training. 10 solar panels of 3000 watt were established and 21 LDPE tanks were
dug. Approx. 4,35,000 litres of water could be harnessed in all the tanks which was enough to
water their crops. Solar power brought a new lease to life of the farmers.
Similar example is being followed at Dharkot, where 6 solar panels have been installed, which
can now irrigate approx 5 hectares of agricultural land. Yet another example is seen followed in
Kagthum gram panchayat. These interventions led to a considerable increase in the water level in
the water source situated in the lower end of the village. And this water is now being used to
irrigate lands and grow vegetables like mustard, spinach, radish, peas, lady finger, onions, chillies,
garlic, and coriander, etc and for drinking purposes.
Land degradation had become an area of concern in the hills of Uttarakhand which was
leading to a host of problems. However, Gramya addressed the issue of re-generation and revival
of fallow lands. The focus was to address farmer’s issues in a holistic way. Thus interventions had
to be aimed on being feasible and low on input costs, yet practical and scientific for assured
productivity.
7.4.3 SEED PRODUCTION: A Remunerative market in climate change

213
The seed replacement rate for the plains stands at 15-20 percent, while for the hills it is a
mere 3-4 percent. Mountain farmers are in a practice of saving produce of their previous season’s
crop and using the same as seed for the next sowing season. Certified seeds of the agriculture
crops are only available with seed corporations.
Gramya realized the lack of certified seed availability and the opportunity for production
of certified seeds by federating the farmers and giving them technical inputs and handholding.
Gramya motivated, guided and organized the farmers of Dhaula Devi block into FIGs and
subsequently the 17 FIGs were registered as a federation called “ Jagnath Krishi Beej Utpadak
Sangh, Artola”. The inception of the “ Certified Seed Production Programme” took place in the
year 2015. This federation was the first to receive the license to sell certified and foundation seeds
from Tarai Seeds and Development Corporation. The farmers interacted with the officials of the
agriculture department and Uttarakhand State Seed Certification Agency (USSCA) and were
imparted training on the procedures involved in certified seed production. Once the crop was
ready, collection was facilitated by mobile seed processing van provided by TDC.
Achievement
In the first year, nearly 48.8 q paddy, maduwa, madira, gahat, bhatt and ramdana seeds
were processed and tagged. Certified seeds were purchased by Gramya from the federation at two
lakh rupees. During the Rabi season 40.0 ha area was taken up under certified seed programme,
however the crop failed due to lack of rains but the seeds were purchased by the project from the
federation for eighty five thousand rupees.
In the 2016 Kharif season, the federation processed 71.82q of foundation seeds which were
certified after clearing laboratory tests and were purchased by Gramya for three lakh rupees.
In Kharif 2017, breeder seeds of paddy, maduwa, madira, ramdana, gahat and bhatt varieties were
produced from VPKAS, TDC and the state agriculture department at Almora and Nainital.
Federation was successful in producing 132 q of seed in the area, which would cater to the seed
sufficiency. Foundation seeds of Maduwa(VL- 347,324 and 352), Madira (VL-85 and 62),
Ramdana (VL-44), Gahat/Kulthi (VL-19) and Dhaan/Paddy (VL-85 and 62) are ready for sale by
the federation.
7.4.4 HARNESSING WATER TO IMPROVE CROP PRODUCTIVITY
Project initiatives have been geared towards addressing the issue of water conservation
while building resilience towards climate change. The prime focus of the Gramya implemented in
the eight hill districts of Uttarakhand is to increase the productivity of rain-fed areas. With this in
mind project is working to improve agricultural productivity and sustainability of water sources
in the selected watershed.
Kunna village in Dehradun district proposed the construction of a village tank on a
perennial stream which did not have adequate water for irrigation and drinking. Collection of
water in the tank gave substantial and regular supply of water for irrigation. The tank irrigated 2
214
ha of agricultural land enabling the farmers to diversify into off season vegetable production. They
have earned Rs. 3.56 lakhs by producing and marketing 123 quintals of Himsona variety of
tomatoes.
The farmers of Surue Gram Panchayat in Dehradun district, faced severe shortage of water
for irrigation and drinking due to the drying up of the only perennial water source at Chargad tok
which was about 1.5 km from the village. Through the project about 5 ha plantation of oak and
related species were carried out. Recharge pits and contour trenches were built of water
conservation in the area. Once this source rejuvenated, the project assisted in laying of two HDPE
pipelines of 1800 and 100 mts along with two collection chambers. This has brought 2.65 ha
rainfed land under irrigation enabling the farmers to diversify and cultivate crops like peas, beans
and ginger.
Tangibles
Families dependent on rainfed cropping system of sowing corn, paddy and wheat, through
demonstrations and adoption of high yeilding variety seeds, shifted to cash crops of tomatoes,
peas and garlic etc. This increased their incomes substantially and raised their standard of living.
Intangibles
Women who had to walk several kilometers to fetch drinking water, have an assured water
supply now and they are utilising the save time for their household chores.
7.5 Migration Communission Reports
7.5.1 District Pauri (Pauri Report, Migration Commission)
7.5.1.1 Dairying
Shri Prem Singh Bhandari, an Ex-IAF officer, has started a dairy with around 20
cows in Pabao Block.
He has also set up a small milk processing and packaging plant and distribution is
done in local and Pauri market.
There are around 250 birds in his poultry shed and similar number of chicks. He
has 2 ponds and is planning to start fisheries. He has given employment to 4
villagers.
215
7.5.1.2 Agarbatti Manufacturing
Shri Mahesh Ghildiyal, a resident of Rikhnikhal Block, has set an example for
others.
He returned from Mumbai to his village and started a small business of agarbatti
and dhoop (incense stick) making.
He has formed an SHG of 6 women members and use locally sourced materials for
agarbatti and dhoop making.
He wishes to rope in more members and expand his business.
7.5.1.3 Women SHG’s
In Gouri Kot village, Pauri Block, 18 women came together to form a Self Help
Group.
They have brought nearly 4 Hectare of land under cultivation and working as a
cooperative.
They undertake faming of off season vegetables, poultry, fisheries, pulses and
floriculture.
The use of power tiller and other farm implements has made the farming less
cumbersome.
They have made irrigation facilities to their farms with the help of govt.
schemes. They sell their produce in local Pauri market.
This is a good example of land pooling and can be a role model for other villages
too.
7.5.1.4 Story of Nepali origin farmers
Farmers In and around Pauri one can easily see people doing agriculture, especially
vegetable production. These are not local people but the people of Nepali origin. Here in Pauri,
there are a handful of Nepali origin people engaged primarily in daily wages labour, and farming.
Some of them are in Pauri for nearly two generations now and are doing well in agriculture. They
have pooled the land given on rent to them by the local people, with no legal agreement or binding.
Since many local residents do not consider farming as a lucrative option, over the years the land
has become barren. The Nepalese origin people took the barren piece land and turned it into
productive one. Now they are producing vegetables all-round the year and sell in local market.
One can see their temporary huts in the vegetable fields and doing them intercultural operations
in the field whole day, be it a full bright day.

216
7.5.2 Ecotourism report, Migration Commision
7.5.2.1 Dehradun Zoo
Dehradun Zoo was established in 1976, as Malsi deer park which was renamed as
Dehradun Zoo in 2015. It situated in the foothills of Mussoorie and is about 10 kms from
Dehradun. The Zoo is surrounded by Malsi Reserve Forest and is a major wildlife lover‟
sattraction.The Zoo has a total of 419 birds and animals.
There have been many infrastructural development activities in the facility after it became
a zoo. The new infrastructure of the zoo includes a food court building, Aquarium, Aviaries, parks,
building of aquatic world and ticket plaza. Leopard rescue centre and enclosure have also been
developed. The work on development of Safari road is also ongoing.
The revenue of the zoo almost doubled from 25.61(lakh) in 2014-15(as Malsi Deer Park)
to 40.77 (lakh) in 2015-16 (as Dehradun Zoo). The Zoo has already earned a revenue of 62.5
(lakh) in 2018-2019 from April to June.
With a continued increase in the number of tourists the zoo authorities have taken an
innovative approach to manage plastic waste generated by the tourists. It works on the principle
of 3 Rs i.e. Reduce, Reuse and Recycle. For reducing plastic waste, Rs10 is deposited by tourist
per plastic bottle at the entry gate and it is returned to them after collecting the waste at the exit.
This has reduced plastic waste in zoo premises. For recycling, a plastic bottle crushing machine
has been installed at entry gate through which plastic bottles can be crushed into small pieces
which is sold in the market at Rs.16/kg. For this purpose tourists are encouraged by giving them
two redemption points on each bottle they crush. Efforts are also being made for CSR in this
scheme from industries and individuals. In the premises of the zoo, reuse of plastic waste is also
being done. More than 40 metre cube construction has been carried out from this waste.
(Source : Dehradun Zoo, 2018)
7.5.2.2 Rang Tribal Museum
The Rang Tribal Museum in Dharchula has been the result of hard work, persistence and
cooperation of the people from the Rang tribe of the region. Rang Kalyan Sanstha (R.K.S.) is a
leading social organization of the region that has for decades actively worked towards the social-
economic and cultural development of people living in harsh natural conditions. This organization
has played a pivotal role in bringing the dream of the Rang Tribal Museum into reality. The Rang
Tribal Museum offers an extensive view into the lives, customs and culture of the people residing
in the region comprising the Vyans, Darma and Chaundas valleys – the region frequented by
trekkers, pilgrims and tourists from India and abroad. The KMVN has made provisions that a visit
to the Rang Tribal Museum is made mandatory for all the tourists participating in its tour-
itineraries. This helps the tourists understand the region more deeply and encourages them to
behave as responsible visitors. (Source: Uttarakhand Tourism Development Board)

217
7.5.3 DISTRICT ALMORA (District Report Almora, Migration
Commission)
7.5.3.1 Mobile Agri-Clinic Van
Launched in October 2018, this Agri-Clinic Van ensures door step delivery of inputs and
related information from various government line departments like Agriculture, Horticulture,
Animal Husbandry, etc. and to provide market accessibility to farm produce. This van also used
as a medium for extension services like awareness of existing and new govt. schemes. This
initiative has been a great step taken for the farmers and for rural masses as a whole.
The scheme has been proposed for 3 years, 2018-19 to 2021-22 and financially supported
through NMAET, District Scheme, Department of Agriculture, Department of Agriculture,
Department of Youth Welfare and PRD. There is a need of similar such initiatives to be taken in
other hill districts of the state.
REFERENCES
ILSP, Uttarakhand
UDWDP, Uttarakhand
Department of MGNREGA, Uttarakhand
Migration Commission of Uttarakhand

218
Chapter 8
ANALYSIS AND RECOMMENDATIONS
Various schemes and programmes being implemented by different departments in the Rural
Development sector have been analysed on the basis of data primary data based on the survey of
socio-economic impacts of these schemes and secondary data obtained from official sources and
discussions with local staff and communities in the field. Detailed recommendations have been
given which would help in strengthening the rural economy and mitigating the problem of out
migration from the rural areas.
SCHEMES OF RURAL DEVELOPMENT DEPARTMENT
MGNREGA
The current data published on the website of MGNREGA shows that the timely
payments(within 15 days) which were less than 50% for all the districts of the state in
2015-16 has become more than 99% nearing 100% for all the districts in the state.
The average percentage of women given employment in 2018-19 is 51.94. Though the
state average is more than 50% there are differences between districts. Where Tehri district
shows a high percentage of the woman days generated with 73.02% while in Dehradun
and Haridwar is mere 31.79% and 32.92% respectively. In the hill districts of Champawat
,Pithoragarh and Nainital it has been lower than 50% for the last 4 years. Efforts should
be made to maintain the representation of women at more than 50% for all districts,
ensuring equal opportunity and participation.
The total no. of GPs with no expenditure is highest in Dehradun (46 out of 462) followed
by Almora with 72 Gram Panchayats out of 1168.
A clear gender gap can be seen in the number of registered skilled workers across all
districts. The maximum being in Pauri with 20699 male workers and 1251 female workers.
Skilling of women masons should be focused on.
The Completion Rate for year 2017-18 and earlier is on an average more than 90The
number of households from vulnerable communities who got individual assets and stopped
demanding MGNREGA works, in the district of Almora, Pauri and Pithoragarh this
number remains zero. There is still a gap between the asset creation and its potential to
create sustainable livelihood.
For the state of Uttarakhand, while examining the employment demand pattern the
demand for the employment is highest in the months of July and January over last five
years. The demand seems to be comparatively low in the months of November and April.

219
In terms of money spent, expenditure on NRM works in Uttarakhand is only 50% in the
MWC (Mission Water Conservation) blocks against the mandated 65%. Out of the
completed works in 2 groundwater stressed blocks, only 4% of works are related to
groundwater recharge. State definitely needs to take more of NRM works (State
performance report 2017-18 and Action Plan 2018-19)
River rejuvenation works should be taken up.
Total of 39095 works related to NRM activities were taken up of which 22270 works have
been completed. The highest number of works are in land collation/land upgrading (11555)
followed by flood control (6346).
The least number of works have been taken up in Nursery development (15) for
community/individual assets for vulnerable sections of which only 3 have been completed.
Nurseries have a great potential in the state and more works should be taken up and
completion rate should be increased in this.
Of the 27784 Rural Infrastructure works taken up 15773 have been completed which is
almost 56%. Rural infrastructure includes construction of community/anganwadi toilets,
food grain storage, protection wall etc. which are important in the overall development and
access. The completion rate needs to be improved in the category.
The percentage of total number of GPs in the state which have been audited atleast once
is 6.09% which is substantially low. Social audit helps in identifying ground issues hence
efforts should be made to increase the percentage.
Recommendations
The following recommendations are made:
a) Since women account for more than 50% of the beneficiaries under MGNREGA, more
focus should be on works that lead to additional income for women folk. Efforts should be
made to maintain the representation of women at more than 50% for all districts, ensuring
equal opportunity and participation. Skill development of women should be given priority
so that they can benefit as skilled workers rather than as unskilled ones.
b) There is a problem of damage to crops by animals like monkeys and wild boars. Though
walls for protection against wild boars are being constructed in some blocks, this needs to
be done in all districts, A scheme for creating assets for protecting crops against monkeys
be devised with the help of the forest department.
c) Water scarcity is emerging as a major problem in the rural areas of the state, both for
drinking and for irrigation. Works under this scheme may converge with interventions by
other scheme like UDWDP, NRLM to tackle this problem. As multiple schemes in the
state are working with SHGs, common work areas/sheds can be constructed under

220
community assets. This will help in smooth functioning of the activities of SHGs. Work
for construction of common work sheds for DAY-NRLM SHGs was taken up, of the 47
works taken up only 14 have been completed. Looking at the number of SHGs formed
under the scheme, the number of works taken up in itself is very low, further the number
completed it even lower. Work under this can be accelerated, so that they become the
centre for different livelihood activities.
DAY-NRLM
The number of SHGs formed since inception is higher than the target for every financial
year. As a result 21308 SHGs have been formed since inception against a target of 19385.
The achievements are lagging behind in all other step in the capitalization strategy of SHG
(RF, MCP preparation, CIF, VO and CCL).
A total of 14,632 people have been trained under Aajeevika Skills of which 11,420 have
been placed (78.05%). In Bageshwar none were trained against a target of 100. Placement
was considerably lower in Chamoli as compared to other districts, with only 40.66 %
placed of the total trained.
The highest percentage of NPA amount is in blocks Khanpur (Haridwar): 85.34%,
Kaljikhal (Pauri)- 66.49%, Kashipur(Udham Singh Nagar): 61.25%, Haldwani(Nainital):
54.25%, Chinyalisaur(Uttarkashi): 50.61%, Gangolihat (Pithoragarh): 47.57%, Khatima
(Udham Singh Nagar): 46.97% and Champawat (Champawat)- 44.5%.
Maximum number of SHGs are inactive in district Rudraprayag with 678 inactive SHGs
against 714 active SHGs. Almost 50% of SHGs have become inactive. Similarly for Tehri
786 SHGs are inactive with respect to 1347 active. This number is lowest for Udham Singh
Nagar with only 49 inactive SHGs and 3734 active SHGs.
The maximum number of SHGs inactive are identified as Pre NRLM (i.e. SGSY)(2333
SHGs). Other reasons listed for inactive SHGs are bank account not opened (770 SHGs),
not following panchsutra(583 SHGs), not received RF (154 SHGs)or the SHG had less
than 5 members(155 SHGs).
Aajeevika Gramin Express Yojana which had the objective of providing livelihood by
facilitating to operate public transport services in rural backward areas, is now being linked
to the transportation needs of the SHG itself which will give boost to the scheme. It will
directly benefit the SHG as well as also enhance connectivity.
Recommendations:
The following recommendations are made:
a- The gap in achievement of CCL is attributed to different reasons like lack of proper
MCP, unwillingness of community to take loan and bank etc. More focus should

221
be given on Micro credit plan preparation, which is need based. Master trainers
should be increased for smooth functioning of plan preparation. Community
awareness and bank linkages should be strengthened. Bank Linkage of women
SHGs should be enhanced.
b- Medicinal and Aromatic plants have a good potential in Uttarakhand but currently
it has not emerged as a profit making activity in the state. The efforts should be
made to tap the real potential of this in the state and transform it into one of the
important livelihood generation activity.
c- Mushroom Production has proved to be profitable in almost every district in the
state. Supply chain should be strengthened and new market linkages should be
formed to expand mushroom production in the state.
The maximum diversification in the livelihood activities is in the districts of
Dehradun(40) , Haridwar(36) amd Rudrapryag (33). The minimum diversity is
seen in the districts of Tehri(6), Champawat(8) and Almora (7). Diversification in
livelihood activities in thses districts should be a focus.
d- Proper monitoring and review of the SHGs formed is essential. Time to time
evaluation should be done and an understanding of need based and region specific
approach should be developed. Monitoring will not only help in better functioning
of SHGs but also help, in case of SHGs becoming as to why the SHGs is becoming
inactive. It will help in establishing the sustainability of the Self Helf Groups
e- More convergence is required. MGNREGA,ICDS, MID DAY MEAL scheme,
Schemes of Agriculture and allied departments, forest department can play
important role in achieving goals of DAY NRLM of enhancing livelihood
opportunities of targeted group.
f- The state has identified a significant number of Project resource persons from other
states for training purpose, who would lack understanding of state specific
strengths , culture and issues.50 PRPs (Project Resource Persons) have been taken
from SERP Telangana and Jeevika Bihar.60 Teams of CRP are taken from
SERP(Society for Elimination of Rural Poverty)Telangana in old 30 Intensive
Blocks.60 Teams are taken from Jeevika Bihar for new 30 Intensive blocks.Efforts
should be made for enhancing capacity development within the state so as to
overcome communication and cultural barriers.
g- Of the target (by 2018-19) 100 bank sakhis only 43 were trained and 200 krishi
shakhi only 25 were trained. They play an important role in the implementation of
this program, hence there development should be of utmost importance.
h- Quality monitoring and certification for products created by the SHGs should be
done. This would create standardarisation and open up universal market. Marketing

222
plays a very important role. Dynamic online platforms should be developed for
marketing and retail of products. A Social media strategy should be
developed.SHGs for the making sanitary pads can be developed. A unit can be
established in each district as this is both a pressing issue of menstrual hygiene and
livelihood opportunity. Currently, a unit is run in Rudrapur and employees 30
women. This will increase both access and decrease price as compared to otherwise
commercial option available in the market.
i- Some SHG’s are producing take home rations(THR) e.g. Lamgara block. This can
be upscaled at the state level.
ILSP- IFAD
Integrated Livelihood Support Project (ILSP) is a joint initiative of Government of
Uttarakhand and International Fund for Agriculture Development (IFAD) and being
implemented in Uttarakhand by Rural Development Department in 44 blocks of 11 hill
districts.
The monitoring and evaluation in the project has been developed as a continuous process.
It helps in collecting reliable data and information for measuring performance and progress
towards achievement of results. It helps in taking corrective measures for successful
implementation of the project.
For marketing facilities 1 Kisan outlet is functional at state level, 10 at district level and
111 at cluster level. Apart from this 13 haat bazaars (weekly) are also functional.
Marketing facilities play a vital role in the hill areas to ensure market for the produce and
fair produce to the producer.
Brand creation plays an important role in assuring quality and capturing the market.
‘Hilans’ has been developed as the brand under which the produce from the livelihood
collectives is package and sold. Under HILANS brand 12 Kisan outlets are opened and are
functional in 8 districts and earning on an average a profit of INR 1079/ day.
An opportunity for exchange of ideas/technologies/innovations and experiences is
essential for progressive learning. Kisan Melas organized under ILSP provide this
opportunity where various stakeholders can participate. The fair is organized in each
district.
Of the 10 agribusiness plans prepared only one has been implemented by 31st March 2018.
Value chain based cluster development and promotion of value chain activities
accordingly is being done. 5 Value chains are being implemented by the Producer groups
and vulnerable producer groups.

223
The traditional hill variety seed is being produced under the project like Garlic – Variety
Parvati and Zamuna safed seed production in Almora with 15 group members on 0.5 ha
area Onion variety – VL Piyaz - 3 seed Production in Almora with 25 group members on
0.5 ha area. Onion – Traditional hill variety seed production in Chamoli with 55 group
members on 0.5 ha area in Tharali area. Seed production of Finger millet and Hill Paddy
on 10.0 ha areas with 500 group members as a seed cluster development in Pithoragarh
through technical support of KVK Pantnagar, Agriculture Department (ATMA) and
US&TDC. This will help in creating a seed bank and also conserving the hill variety as
currently the maximum seed available is that of plains.
Under skill developments training 2597 youths have been placed.
Convergence has been done with line departments to support the project like insurance
schemes, Krishi Vikas Kendras, sericulture department etc. This helps in more effective
implementation and holistic approach towards livelihood development.
Recommendations
The following recommendations are made:
a. The placement is being offered by VTA usually outside the state with low wages.
Convergence with UPNL, PRD and other govt agency needs to be introduced so that youth
could get employed within the state.
b. The availability of Farm Based Storing Facility through convergence is needed to be
introduced in the scattered mountain regions, so that collective production and its
marketing could get respectable remuneration to the producers.
c. Conserving Natural Resources facilities through convergence is needed to be introduced
in the scattered mountain regions, so that collective production could get improved.
Assets created through convergence should also be monitored and proper maintenance
should be done so that they prove to be beneficial in the region.
d. A strong supply chain is a must for any business to flourish. It should be strengthened with
strategic market linkages and transportation facilities.
e. A direct supply chain should be established for hotels, resorts, government guest houses
etc. which enables them to buy from the local or nearby areas. This will reduce both
transportation price and generate income locally.
f. Organic production should be certified and specific eco-friendly packaging can be
developed from natural material like hemp bags. Packaging which is reusable and locally
available will also help generate alternate source of income. If plastic is to be used bio
degradable plastic (made from natural sources like wheat, potatoes or corn) should be used
to increase the environmental sustainability of the final product.

224
g. Monitoring is done both internally and externally by third party reviews. It can be observed
that externally funded projects have a well-defined, dynamic and interactive monitoring
and evaluation system. This should be adopted by all development schemes even if they
are directly funded by the government.
h. The presence of ‘Hilans’ brand on social media platforms can be increased. The story of
the collective/village can be linked with the product. It can be both included in the
packaging and used to create visibility and awareness through social media.
i. The stakeholders can be connected on an interactive platform like facebook page or any
other social media group so that they can share experiences and stories among themselves
more frequently and intra district even when they are not able to meet physically.
j. Focus should be not only in the preparation of the agribusiness plans but also their
implementation.
k. The value chain for pulses and traditional crops can be strengthened. Value chain of
traditional produce like manduwa, jhangora, red rice which are considered to have
immense health benefits can be created
l. Many success stories of the project have been mentioned earlier in the report. One of the
big successes is the Mandawa biscuit made by women members of Monal Ghati in
Bageshwar which have shown high demand. The success of the initiative found a place in
Pradhan Mantri’s radio programme Mann ki Baat. More avenues like this should be
explored by innovating with the locally available resources and upscaling the production.
PMGSY
A total of 202 habitations were connected under PMGSY in the year 2018-19 with a total
construction of 1,756.269 kms of road. In the year 2017-18 a total of 207 habitations were
connected with a completed length of 1,839.106.
The habitations for the district of Udham Singh Nagar and Haridwar have been completely
saturated as per the norms/eligibility under PMGSY.
1813 of total 2643 eligible habitation were sanctioned in PMGSY 1. 64 are yet to be
sanctioned.778 habitation have been connected through other state schemes. 8 habitations
are not feasible. 508 are balance habitats to be connected.
Total works for 3550.16 kms are in progress under use of new technology. These are using
cold mix technology, nano technology for waterproofing and cement stabilization.
A total of 29 roads (196 km length) are currently under community contracting in the state(
given to 46 women groups)..

225
The percentage of unsatisfactory works is highest for maintenance works in 2018-19. It is
21.31% for the state with 42.86% for Almora, 40% for Pithoragarh and 30% for Pauri.
Recommendations
The following recommendations are made:
a. The quality of maintenance works need to be improved. Off carriage way maintenance can
be done by locals leading to both a sense of ownership and livelihood source. Routine
maintenance activities play an important role in the state as roads through mountainous
areas are prone to landslides and washouts during intense rains and need regular
inspections during this period. Maintenance would ensure functionality of the road
network and prevent loss of asset.
b. More and more local communities/Self Help Groups should be engaged under the Scheme.
Community contracting for maintenance of rural roads especially Off- Carriage
Maintenance should be encouraged.
DDU- GKY
The aim of DDU GKY is placement for atleast 70% of all trained persons. Of the 724
trained in the state, a total of 315 have been placed which is 43.5 percent. It can also be
seen that maximum trainings though being conducted within the district as well, lead to
migration. This is due to lack of employability within the region. The placements shown
are either in the plain areas of Uttarakhand or outside the state. The scheme is targeting
organized sector. This makes placement in the region itself difficult as most of the
business’ running in the region are in the unorganized sector. This leads to non-availability
of pay-slips and tracking of the placed student, which is a mandate in DDU-GKY.
The initial target was of training 5000 youth by 2019. The Project is substantially lagging
behind the set target given to the late implementation.
Main gaps as pointed out by the department are:
Non- availability of industry at the district level.
High Aspiration of candidates
Work force demand in urban areas.

226
Recommendations
The following recommendations are made:
a. There is a need to identify skills that are region specific/ need based in order to arrest
migration.
b. The numbers of PIAs in hilly areas are comparatively less to that in plain areas. More PIAs
should be established in hill districts. Currently one training center is in Bhimtal and one
in Pauri Garhwal rest all are in the plains which in turn is increasing hill-plain disparity.
c. Though the scheme has a well-defined SOP, exemption could be given to hill districts for
few aspects like internet based attendance given to the lack of connectivity in the region.
Convergence with ETCs can be explored as this would not require creating a completely
new infrastructure and already existing infrastructure can be used.
d. There is a need to focus on RSETIs making them vibrant, creating self-employment in the
state. Proper monitoring of how many candidates trained took loan to start a business and
are able to repay the loan should also be maintained.
e. Currently there is no staff available at the block level. This should be addressed and
capacity development should take place.
f. Job fairs that were conducted in 12 districts of the state in the year 2018-19, had 249
employers who participated with 25000 total vacancies. 14967 job seekers had participated
in the fair, of which after multiple shortlisting process only 435 were given the final offer
letter. This reflects that there still continues to be a skill gap between the requirement of
the employer and the job seeker in the state. This needs to be worked on and employability
of the job seeker needs to be increased.
g. The gap study conducted by NSDC has identified employment gaps and potentials in the
state. With respect to gender, girls were more interested in jobs like nursing, healthcare
and teaching. Efforts should be made to conduct more training programs in these fields.
They will also help in arresting migration from the area as healthcare and education sector
job opportunities can be created in the local areas itself.
h. The placement data shows that the maximum number of recruiters for Tourism and
Hospitality industry are maximum from outside the state even though our state itself is an
important tourist destination. Efforts should be made to establish tie ups with hotels and
resorts situated in the state to hire local people who have been trained in the sector. This
will help in ensuring better retention as the salary range is between Rs 7000-9000 p.m.
which is not sufficient for surviving in a metropolitan and will also protect them from
exploitation.

227
i. Not much work is done in establishing Migration Support Centers even though the
maximum candidates trained are being placed outside the local area. Efforts should be
made to strengthen this aspect of DDU-GKY.
PMAY
In maximum number of houses built as per the mandate, toilets have been built. Provision
of providing Gas stove seems to be lagging behind. In 2016-17 of the total 6544 houses
built only 1594 were provided with gas stove. Convergence needs to be strengthened in
the PMAY-G with UJJAWALA (LPG), UREDA (Solar power), Power Dept (electricity)
and drinking water to include basic amenities in the houses built under the scheme
Currently the state convergence report with UJJAWALA shows that a total of 12208
houses are eligible for LPG connection and only 3920 houses have been given LPG
connection.
Recommendations
The following recommendations are made:
a. There is a need for more dynamic and regular updating of data on the central website. The
reports being generated currently are not the updated reports .
b. Timely completion of the sanctioned houses should be ensured and the quality should be
monitored. Every year incomplete houses in the year are carried forward to be completed
in next financial year. 4910 houses were under construction in 2017-18 to be completed in
2018-19. Timely completion should be ensured and monitored.
c. Quality is important in a state like Uttarakhand because it is a multi-disaster prone state
with almost all of the territory lying in Zone 4 and 5 of seismic zone. Hence, risk reduction
needs to be ensured through good quality construction.
d. Number of handicapped people who got house under PMAY-G has remained low with a
total of 2 people registered in the last 5 years. Efforts need to be made to ensure proper
inclusion of PWDs. (People with Disabilities)
e. No house was built for landless households in last 5 years. Efforts should be made for
inclusion of landless households in the scheme.
NSDC Gap Study
The gap study conducted by NSDC has identified employment gaps and potentials in the
state..
Tourism sector has immense potential for local people and trainings should be developed
around it.

228
The training provided in the ITIs were not found to be very useful by both students and
industry, hence the trainings should be better planned keeping in mind the requirement of
the industry and should be more job specific.
Recommendations
a. Need based training for hilly areas continue to be lacking. A more comprehensive region
specific strategy to address skill development should be developed.
b. Clear link between skill development and livelihood needs to be established.
c. There is a need to combine indigenous/ traditional skill with modern technology to enhance
productivity and quality resulting in better profit earning.
d. An integrated training covering agriculture and animal husbandry related skills would
increase their self- employment potential.
e. Greater focus should be on districts which show negative or low growth. Skills that have
capacity to boost local economy should be provided like processing centres, packaging
and nursery development.
f. Awareness camps should be organized locally/ district level to spread awareness about
opportunities in different sectors and also to understand skill need of people in the area
from time to time. This will also help in understanding where the demand has saturated
and which areas still need to be strengthened.
g. Apprenticeship opportunities can be provided through tieups with the industry for hands-
on experience in the industry post skill development.
h. Tie ups can be made with local NGOs, CSRs etc to be encouraged.
i. With respect to gender, girls were more interested in jobs like nursing, healthcare and
teaching. Efforts should be made to conduct more training programs in these fields. They
will also help in arresting migration from the area as healthcare and education sector job
opportunities can be created in the local areas itself. Gender is an important factor which
should be kept in mind while planning skill development programmes
Uttarakhand Skill Development Mission
A total of 12444 people have been trained under the PMKVY 2.0 of which only 2385 have
been placed. The placement is substantially lower than the total number trained. This
suggests that the trainings are not need based or are not able to meet the aspirations of the
candidate.
Of the current ongoing trainings in the state, 16 are in Dehradun, Haridwar and Udham
Singh Nagar; 13 are in Nainital, 1 in Almora, 1 in Pauri and 1 in Tehri. This clearly shows
229
that the maximum numbers of trainings are being conducted in the plain districts of
Uttarakhand, pointing towards skewed regional distribution.
STAFF
In the hill districts the number of posts vacant of Village Development Officer is high both
comparative to the plain districts and individually. More than 50 % of the posts are vacant
in Almora, 50% in Champawat, 40 % in Uttarkashi and 38% in Bageshwar. This points
towards the shortage in the field staff (staff at grassroots level) which effects the
implementation of policies on ground. With more responsibility on the VDO’s in the
region their efficiency also decreases. The posts should be filled as soon as possible so as
to ensure better and efficient implementation on ground.
No Trainings were conducted in the any ETC for newly appointed VDOs since 2015-16
which is a 6 months training. The total VPDOs that attended the training in the ETC
Almora is low, 22 out of 60 that were invited attended the training.
Training of staff of the Rural Development department also needs to be strengthened. The
training should be done on a regular basis after a gap of 6 months. This will help in on
ground productivity of the staff and better implementation.
UTTARAKHAND DECENTRALIZED WATERSHED DEVELOPMENT
PROJECT
UDWDP is being implemented by the directorate of watershed directorate of Uttarakhand
government and is being externally funded by World Bank.
The monitoring process is done through both internal monitoring done by the WMD staff
and external monitoring currently done my Sutra Consulting every 6 months. Time to time
review helps in analyzing the progress with respect to the expected Project outcomes and
timelines that were decided to achieve the same. This helps in critically evaluating the
progress and making changes in the approach wherever required. It also helps in capturing
feedback and suggestions from project stake holders and beneficiaries and also identifies
the problems/constraints in the implementation process. It further helps in identifying new
opportunities.
The concept of women Aam sabhas proved as a useful approach to address gender issues
in a transparent way.
Gramya I initiated pine needle briquetting, which was scaled up by the SLEM. The SLEM
piloted other traditional activities, such as gharat power generation, natural regeneration
of oak, and bamboo basket making, and promoted local plants
In GRAMYA 2, Energy conservation achieved impressive progress in two of its
interventions of solar lantern followed by Bio Gas Plant. Although the Project has

230
exceeded the overall Project target in solar lantern, there has been continuation in this
initiative due to need based demand by the community.
In Gramya-I, 18 Farmer’s Federations that were linked with processing centers and 9
Farmer’s Federations linked with Collection centers. Currently there are seven active
Farmers federations linked with processing units and one with collection center. Previous
interventions and works should be monitored and consolidated wherever possible. As we
move to a new project, it is a general practice of not going back to interventions already
done which needs to be changed for all development schemes.
Under the component of Drainage line treatment works, the maximum achievement was
registered in the construction of dry stone and crate wire check dams with 70% and 65%
respectively. Overall the retaining wall progress has reached 41%completion rate
However, looking into the progress in the first six months of this financial year, progress
needs to pick up in this component.
Size of the poly houses needs to be increased from the existing ones (poly houses provided
to the beneficiaries are of very small size which is only used for seed germination or
developing nursery plantations. In order to grow offseason vegetables under controlled
conditions the size of poly houses needs to be increased)
Developing the production system - which minimizes wastes and maximizes re-use of
waste; mulching, RWH, drip irrigation to be introduced through trainings and demonSeed
storage chains need be developed under public private partnership/other setup for safe
storage and distribution of seeds
Improving seed replacement ratio to 20 -25% by the end of the project should be one of
the projects mandate (for field crops only)
Tie-up with companies like mother Dairy, Kissan and Reliance Fresh should be looked
into. With the scale of production in tomatoes a tie-up with some above mentioned
companies can be made in the region.
In case poultry, training on technical aspects on feed conversion ratio and preparation of
feed at farm level needs to be given to the beneficiaries
For optimal design of the RWH tank at a particular location, the total runoff contributing
surface area of the roof top and rainfall pattern of the area should be taken into account.

231
Recommendations
The following recommendations are made:
a. It is being run in a project mode with well-defined expected project outcomes. This
strengthens the monitoring process of the project progress. Other state run scheme should
borrow from this model and run them in the Project mode with a proper project closing
timelines.
b. Involvement of local population as Accountant assistant helped in enhancing the capacity
at the GP level. This helps in ownership as well as high retention apart from creating
livelihood. Other development schemes can also explore capacity development in similar
direction.
c. A clear withdrawal plan post the completion of the plan helps in smooth functioning of the
interventions made without disruption. This helps in sustainability even after the hand
holding is withdrawn. This should be made imperative in all the interventions being made
under different development schemes.
d. Traditional energy sources are being explored in the project to address climate change
mitigation and contribute to resilience. . More avenues can be explored and potential use
of technology to make them more effective can be looked into.
e. A need based approach which is flexible, needs to be the practice to address the issues of
the community.
f. Simply achieving target based results is not enough, but it’s current functionality and
benefit also needs to be assessed time to time. This will not only help to use learnings from
the field both of success and failure helping to define a better approach but will also ensure
sustainability.
g. Uttarkashi has the highest number of FIGs but the number meetings held is lowest in the
division. Meetings from time to time should be ensured.
h. Efforts need to be encouraged by way of provision for necessary backward and forward
linkages for plantation and horticulture produce.
i. Value chains are localized and production is in small quantities. Aggregation and
marketing of produce is not visible. A horizontal linkage of FIGs is required for creating
a volume in production.

232
PROGRAMMES OF THE PANCHAYATI RAJ DEPARTMENT
The vision of Panchayati Raj is to attain decentralized and participatory local selg
government through Panchayati Raj institutions. The PRIs were to create Gram Panchayat
Development Plan for each GP through community participation formulating priorities
and projects ensuring social justice and economic development. To prepare the Gram
Panchayat Vikas Yojana under the A.P.J. Abdul Kalam Gram Badlav scheme, till January
2018, 94 Master Trainers and 21919 Panchayat representatives trained. All 7602 plans
have been approved and 4719 have been uploaded on Plan Plus in 2018-19.
The budget allocation to the PRIs currently being done through 4th State Finance
Commission and 14th Central Finance Commission.
The devolution Scheme in the 4th finance commission, though has tried to take into
consideration different aspects like remoteness, population, tax effort etc into
consideration, the distribution of budget at GP level shows high disparities. As the
population is significantly low in the hilly areas, the budget share also decreases. This
leads to the underdeveloped regions/areas to continue remain the same, while the GPs in
plain regions with high population move towards development with high budget share
every year.
Presently Panchayat Bhawansare available in 6355 Gram Panchayats against 7,554 Gram
Panchayats of Uttarakhand, whereas Panchayat Bhawan is not available in 1599
panchayats
In 2018-19, training was done on the topic of solid waste management capacity building
training. It also included orientation of engineers and data entry operators being deployed
on the field in the department at District / Development block level. Of the target of 35346,
25592 were trained. No training for GPDP at Development block level was done in
Dehradun. In Almora and Uttarakashi, no trainings for solid waste management was done
at district or block level.At block level no training was done in the districts Pauri and
Bageshwar for solid waste management. In Nainital no training was held at district level.
For District Uttarkashi no training was conducted on GPDP and solid waste management
at either district or block level.
Recommendations
The following recommendations are made:
a. The Minimum amount in each district does not have a large difference, but the proportion
in which the GPs are allocated this amount is large with a very high percentage of GPs in
Hill districts. This percentage is highest in Chamoli and Bageshwar with more than 50%
GPs closely followed by Rudraprayag(almost 50% GPs). For the plain districts the
percentage number of GPs getting the minimum budget is lower than 2%.The weightage

233
of remoteness of an area should be increased and also factors to determine the remoteness
should be evaluated so as to facilitate development in the most remote areas.
b. Efforts should be made to increase the involvement of community in the planning of
activities taken up by the panchayat for the year. This will make it more need based and
inclusive.
c. Approximately 20% of the posts of Village Panchayat development officer are vacant.
Capacity development is important for efficient functioning of the PRIs. The Vacancies
which are higher in the hill areas should be filled for better governance and grass root
percolation of benefits.
d. Regular trainings should be conducted on the works to be done by PRIs. This will ensure
better implementation of the works.
e. Construction of Bhawans in Panchayats where it is not available should be treated as
priority.
f. Training of the staff plays an important role in better implementation of the schemes and
should be done regularly.
PROGRAMMES OF THE DEPARTMENT OF COOPERATIVES
Cooperatives have the potential to play significant role in agriculture and allied sectors for
enhanced welfare of farmers. The co-operatives in Uttarakhand have been made Multi-
Purpose Primary Societies and could be a fulcrum of large spectrum of legal business
activities. They also play an important role in freeing the farmers from money lenders and
creation of self employment.
Co-operatives have been initiated to provide financial assistance by slashing interest rates
on cooperative loans taken by small and marginal farmers and families below poverty line
with the aim of providing dynamism to the cooperative movement. Loan at low interest
rate for small and marginal farmers and farmers below poverty line is being provided.
Interest relief is being provided on loans distributed under the Cooperative partnership
plan
The cooperative credit committees are providing the means for agricultural production
credit, fertilizers, seeds, pesticide drugs, etc. to their farmers ' members.
There is a need to establish organized market access. Cooperative Deal Plan is being
implemented by the Department to provide proper market to the farmers near their village
for their produce, ensuring a fair price to them and protect them from various exploitations
of the market. This is a very important issue that needs to be addressed and work in this
needs to be strengthened.

234
Under the DDU cooperative Farmer Welfare Scheme District wise loan distribution
statistics show that the lowest distribution has been in Rudraprayag with 2184
beneficiaries. It is highest in Haridwar, Udham Singh Nagar and Nainital.
The maximum numbers of societies in loss are in Chamoli district with 31 out of 54 in loss
(57.4%). Uttarkashi has 23 out of 54 PACs in loss (52.27%) . Pauri follows it closely with
58 out of 132 in loss (43.9 %). Pithoragarh district which has a total of 112 PACs (second
highest after Pauri) seems to be performing well with no PAC in loss.
Cooperative training college in Uttarakhand, Rajpur is functioning in Dehradun for
cooperative training to staff, officers and other stakeholders.
Recommendations
The following recommendations are made:
a. Cooperative farming is the need in the state, given the scattered and small land holding.
Efforts should be done to expand this. In order to facilitate this proper systems can be
developed for work and profit sharing. Awareness camps should be organized to enhance
the understanding of people with regards of cooperative farming and its benefits.
b. Training and certification should be strengthened. Though the state boasts of organic
farming the lack of certification limits the market. Certification of organic produce will
help in opening up new markets.
c. With respect to dairy and fishery (especially trout) there is limited/low commercial
production. There is a need for increase in commercial production through capacity
enhancement, access to nutrient rich fodder, creation of market place and proper branding.
d. Warehousing infrastructure need to be developed throughout the state. Steps should be
taken to maintain even distribution of infrastructure in the state.
e. Loaning in hill districts is less given to the less population but other factors also add to this
like unwillingness of banks to give loan due to fear of it turning into an NPA. There is
need to work proactively on this aspect, to ease the process of taking loan.
f. The District Cooperative bank is still not present in Rudraprayag, Bageshwar and
Champawat. The request for licensing has already been sent to the centre. It has been
almost 19 years since the formation of the state. The process should be accelerated with
prime importance.
g. Focus should not be on increasing the number of societies but to make them sustainable.
Cooperative Training Center organizes cooperative seminars and spreads awareness to the
local public about the facilities available to cooperative societies. The outreach of these
programs needs to be increased and efforts should be made to take them till the last mile

235
h. Digital literacy and network building should be strengthened. The Marketing Society
under UCF needs to be strengthened. Cooperatives for efficient marketing and establishing
market linkages can be made. They should be trained in basic management and should be
able to negotiate deals with other industries in the state to provide raw material like Kissan,
Mother Dairy, Marico, Emami etc.

236
Annexure I
IMPACT ASSESSMENT OF SOME RURAL
DEVELOPMENT SCHEMES
Aim: More than 70% of the population in the state of Uttarakhand resides in rural areas. 43.59%
of the rural population is dependent on agriculture, 32.22% on labour, 10.22% on government
service, 2.64% on dairy, 2.11% on horticulture and remaining 8.63% on other works for their
livelihood. Important schemes like MGNREGA, PMGSY, PMAY-G, NRLM, DDU-GKY and
BADP are being implemented by the Department of Rural Development in the state which play a
pivotal role in the socio economic growth of the rural areas. The role of these schemes becomes
more important in the state as it is facing continuous out-migration from its hilly areas.
The main aim of this survey was:
Socio-economic Impact Assessment of various schemes under Rural Development in the
area.
Understand the socio-economy the area.
To understand the extent to which these schemes are capable in decreasing/arresting out-
migration.
Methodology: A cross – sectional survey was conducted for the Impact Assessment of the
schemes being implemented by the Rural Department of Uttarakhand in context of socio economic
development and sustainability. A structured questionnaire was developed by the Commission for
the survey. The first part was aimed to capture the socio-economic profile of the village whereas
the second part was a scheme wise questionnaire with a list of possible indicators that could be
used to assess the socio-economic impacts of the schemes along economic, employment and social
dimensions. Village Development Officers were selected blockwise for conducting the survey.
Training of the selected Village Development Officers for the survey was done in Dehradun on
26th December, 2018 and Kathgodam on 8th January, 2019 to ensure proper data collection and
avoid gaps / disparity in the process. The survey was completed in 3 months.
The VDO’s have visited the villages and carried out a perception based survey, after
which the commission’s team has cross checked the field data randomly.
Sample: A multistage random sampling process was adopted. The survey was conducted in 12
districts of the state. 36 blocks were selected on the basis of intensive, non-intensive and border
blocks. Gram Panchayats which had 2 or more villages where the population had decreased by
more than 50% in last 10 years were selected from these blocks. Further, 156 villages/toks where
the migration was more than 50% in last 10 years were selected in the Gram Panchayats for the
survey.
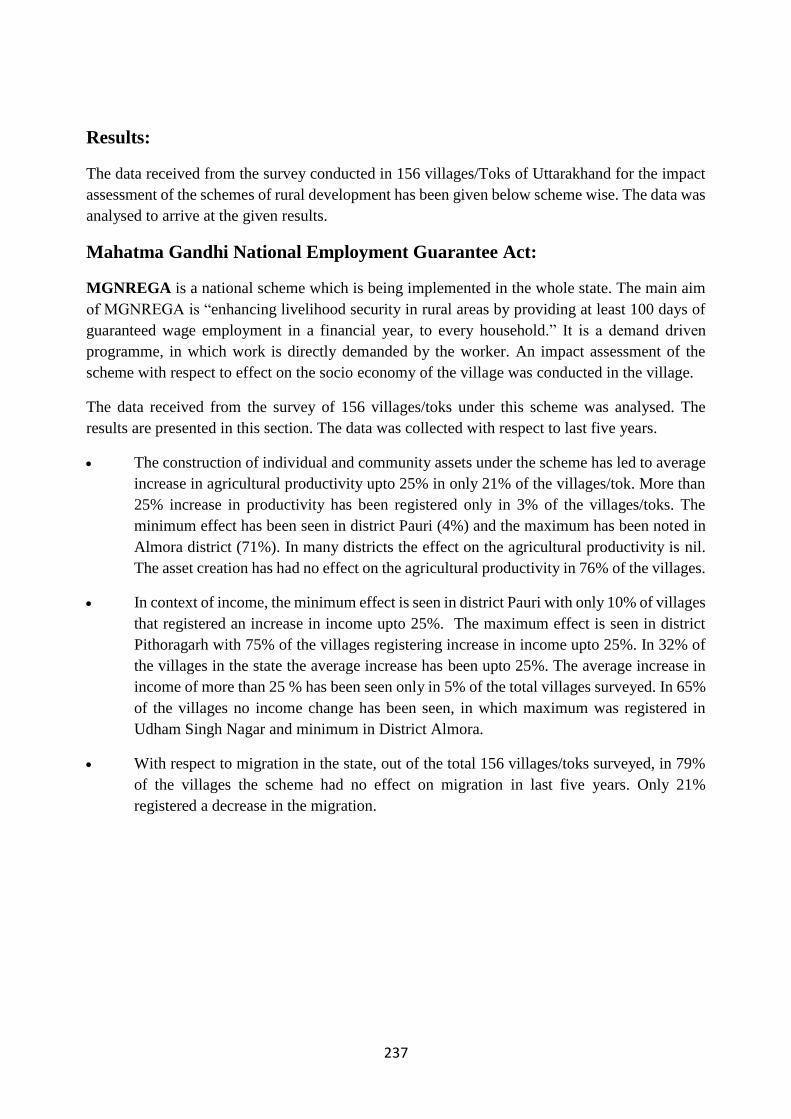
237
Results:
The data received from the survey conducted in 156 villages/Toks of Uttarakhand for the impact
assessment of the schemes of rural development has been given below scheme wise. The data was
analysed to arrive at the given results.
Mahatma Gandhi National Employment Guarantee Act:
MGNREGA is a national scheme which is being implemented in the whole state. The main aim
of MGNREGA is “enhancing livelihood security in rural areas by providing at least 100 days of
guaranteed wage employment in a financial year, to every household.” It is a demand driven
programme, in which work is directly demanded by the worker. An impact assessment of the
scheme with respect to effect on the socio economy of the village was conducted in the village.
The data received from the survey of 156 villages/toks under this scheme was analysed. The
results are presented in this section. The data was collected with respect to last five years.
The construction of individual and community assets under the scheme has led to average
increase in agricultural productivity upto 25% in only 21% of the villages/tok. More than
25% increase in productivity has been registered only in 3% of the villages/toks. The
minimum effect has been seen in district Pauri (4%) and the maximum has been noted in
Almora district (71%). In many districts the effect on the agricultural productivity is nil.
The asset creation has had no effect on the agricultural productivity in 76% of the villages.
In context of income, the minimum effect is seen in district Pauri with only 10% of villages
that registered an increase in income upto 25%. The maximum effect is seen in district
Pithoragarh with 75% of the villages registering increase in income upto 25%. In 32% of
the villages in the state the average increase has been upto 25%. The average increase in
income of more than 25 % has been seen only in 5% of the total villages surveyed. In 65%
of the villages no income change has been seen, in which maximum was registered in
Udham Singh Nagar and minimum in District Almora.
With respect to migration in the state, out of the total 156 villages/toks surveyed, in 79%
of the villages the scheme had no effect on migration in last five years. Only 21%
registered a decrease in the migration.

238
The data has been presented in the table below:
District Number of blocks selected
Number of
villages/ toks
selected
Average increase in the agricultural productivity
(in %)
Average increase in in income (in %)
Effect on migration
Upto 25%
More than 25%
No chang
e
Upto 25%
More than 25%
No chang
e
Decrease
No chang
e
Rudraprayag 2 9 22 0 78 33 11 56 0 100
Bageshwar 2 18 50 0 50 39 6 56 17 83
Pithoragarh 3 20 45 5 50 75 0 25 0 100
Tehri 5 17 18 12 70 36 12 53 0 100
Pauri 10 51 4 0 96 10 0 90 45 55
Udham Singh Nagar
1 2 0 0 100 0 0 100 0 100
Uttarkashi 2 10 30 0 70 70 0 30 0 100
Champawat 3 8 0 0 100 38 0 63 25 75
Chamoli 3 7 14 14 72 28 0 71 0 100
Nainital 2 3 0 33 67 0 33 68 100 0
Almora 2 7 71 0 29 43 43 14 14 86
Dehradun 1 4 0 0 100 0 0 100 0 100
Uttarakhand 36 156 21 3 76 32 5 63 21 79
In the assets created under the scheme, the number of community assets like water
conservation, flood control and land development is more than the individual assets like
nursery, cattle shelter etc.
The assets created under the scheme are mostly being used by the beneficiaries but the
assets are not being used for income generation purpose but only for household use.
In the last five years in the MGNREGA scheme, the lowest work done for livelihood
developmentis in the identified villages / talukas of Nainital , and maximum has been
done in villages/toks of Pithoragarh, whereas in the identified villages/toks of District
Udham Singh, the percentage of the works is zero.
The maintenance of assets created is being done majorly by individuals as opposed of
community or government.
Only in 4% of villages/Toks an increase in water availability could be confirmed through
the assests created for water harvesting and water conservation under MGNREGA.
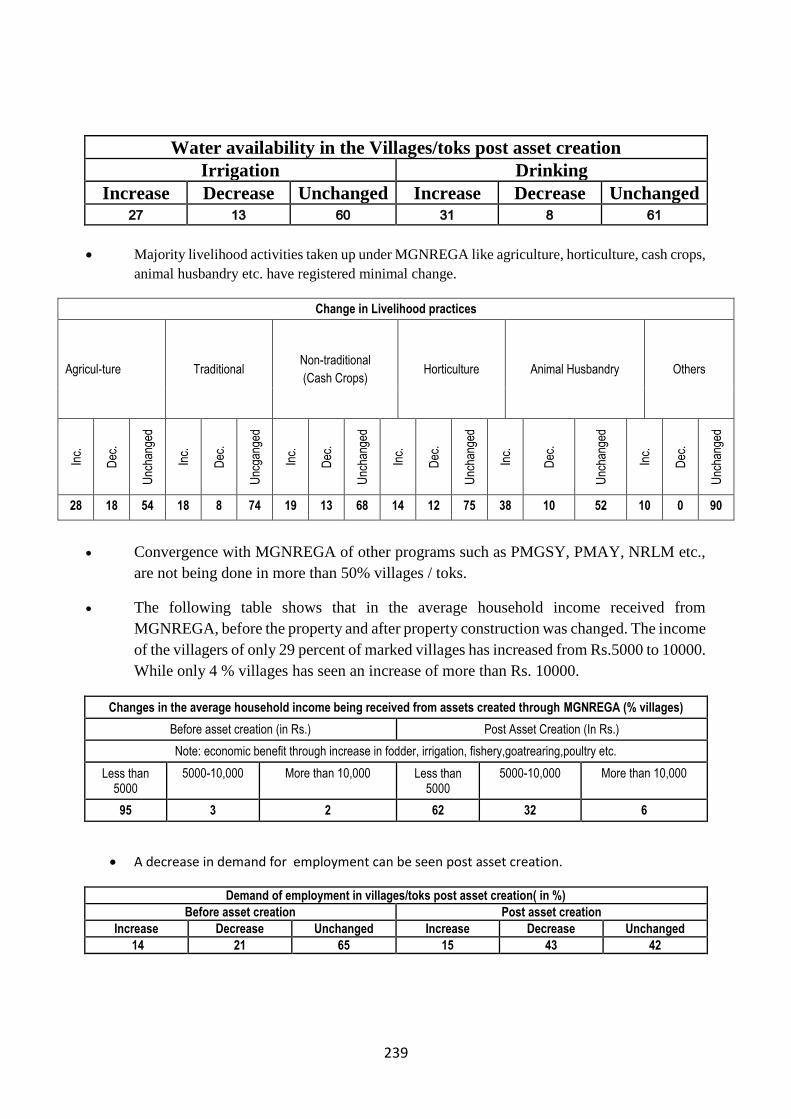
239
Water availability in the Villages/toks post asset creation
Irrigation Drinking
Increase Decrease Unchanged Increase Decrease Unchanged 27 13 60 31 8 61
Majority livelihood activities taken up under MGNREGA like agriculture, horticulture, cash crops,
animal husbandry etc. have registered minimal change.
Change in Livelihood practices
Agricul-ture Traditional Non-traditional
(Cash Crops) Horticulture Animal Husbandry Others
Inc.
Dec
.
Unc
hang
ed
Inc.
Dec
.
Unc
gang
ed
Inc.
Dec
.
Unc
hang
ed
Inc.
Dec
.
Unc
hang
ed
Inc.
Dec
.
Unc
hang
ed
Inc.
Dec
.
Unc
hang
ed
28 18 54 18 8 74 19 13 68 14 12 75 38 10 52 10 0 90
Convergence with MGNREGA of other programs such as PMGSY, PMAY, NRLM etc.,
are not being done in more than 50% villages / toks.
The following table shows that in the average household income received from
MGNREGA, before the property and after property construction was changed. The income
of the villagers of only 29 percent of marked villages has increased from Rs.5000 to 10000.
While only 4 % villages has seen an increase of more than Rs. 10000.
Changes in the average household income being received from assets created through MGNREGA (% villages)
Before asset creation (in Rs.) Post Asset Creation (In Rs.)
Note: economic benefit through increase in fodder, irrigation, fishery,goatrearing,poultry etc.
Less than 5000
5000-10,000 More than 10,000 Less than 5000
5000-10,000 More than 10,000
95 3 2 62 32 6
A decrease in demand for employment can be seen post asset creation.
Demand of employment in villages/toks post asset creation( in %)
Before asset creation Post asset creation
Increase Decrease Unchanged Increase Decrease Unchanged
14 21 65 15 43 42

240
In last five years, in 40 % of the villages/Toks permanent migration and 43% villages/toks
temporary migration by job card holders is seen.
From the months of October to February maximum employment demand is seen.
In the last five years an increase in demand between 2013-14 and year 2017-18 is seen.
Pradhan MantriAwas Yojana- Gramin
Indira Awaas Yojana (IAY), a flagship scheme of the Ministry of Rural Development has
since inception (as a sub-scheme in 1985) been providing assistance to BPL families who are
either houseless or having inadequate housing facilities for constructing a safe and durable shelter.
Rural housing programme, as an independent programme , was started with Indira Awaas Yojana
(IAY) in January 1996. PMAY-G selects beneficiaries using housing deprivation parameters in
the Socio Economic and Caste Census (SECC), 2011 date which is to be verified by the Gram
Sabhas. The data for the contructed houses was taken since the inception of the scheme.After
analyzing the data obtained from the survey under the said scheme by the Commission, the impact
on the rural areas through the scheme has been seen in as follows:
In the 156 villages/Toks selected by the commission the scheme has benefited poor
families only in 13 % of the villages.
In the analysis it was found that in only in 55% of the village/toks the beneficiaries under
the scheme owned land for construction of the house, whereas in 45% of the villages/toks
land is not available for construction of house. This percentage is highest in the villages of
Rudraprayag.
In rural areas, the availability of land in villages identified in the case of non-availability
of land for construction of house is ensured as per the following table.
Compensation for availability of land if there is no land for housing
Beneficiary Government Community Other
45 20 25 10
The maximum amount of land has been made available in district Pauri (6% of village/toks) to the
beneficiaries.
From the analysis of the 13% villages benefitted under the scheme, it was seen that in 95%
of the beneficiaries basic amenities like toilet, drinking water, gas and electricity is present.
The data received from the 13% villages, shows that in 60% of village/Toks the area for
the house is sufficient whereas in 40% of the village/toks the area of the house is not
considered sufficient for the whole family.

241
Only 35% of the 13% marked villages benefited from the scheme consider the funds
received in the form of grants as suitable whereas 65% of identified villages consider it
unsuitable.
From the data received from the 13% villages benefitted from the scheme, it is clear that
no beneficiary has migrated from their village/Tok.
National Rural Livelihood Mission
Aajeevika - National Rural Livelihoods Mission (NRLM) was launched by the Ministry of Rural
Development (MoRD), Government of India in June 2011. It is one of the important schemes
being implemented by Ministry of Rural Development.
Aided in part through investment support by the World Bank, the Mission aims at creating
efficient and effective institutional platforms of the rural poor, enabling them to increase
household income through sustainable livelihood enhancements and improved access to financial
services.
The survey was conducted in 156 selected villages by the commission to assess its impact. The
data was collected for SHGs formed till 2013 and the SHGs that were formed before 2014 which
are still functional (have completed 4 or more years). The data was also collected for the current
SHGs and activities under NRLM. The results of the analysis are as follows:
NRLM scheme was operational in only 26% of the 156 identified villages in because this
scheme was being implemented only in intensive development blocks in the past years.
Of the 26 % villages, in 87.5% villages/toks SHGs have been provided economic support
whereas 12.5% villages are still deprived of financial assistance.
Under NRLM of the 26% villages where the scheme was being implemented, only in
27.5% villages/toks market linkages have been established after getting financial
assistance whereas in 72.4% villages/toks market linkages have not been established.
Of the 26% villages/toks, in 60% of the villages/toks SHGs have been linked with banks.
Under the said scheme, most self-help groups are pursuing activities like dairy and
vegetable production in 26% marked villages whereas self-help groups with interest in
activities like horticulture, sewing weaving, handicrafts, poultry, general store etc. were
less.
Only 35% of the 26% villages identified women of SGHs have been trained under RSETI.
Self-help groups of 72% of villages in 26% villages where the scheme is being
implemented of the total 156 selected villages are benefiting from the internal loaning
within the group while 28% of the villages have not adopted this process.
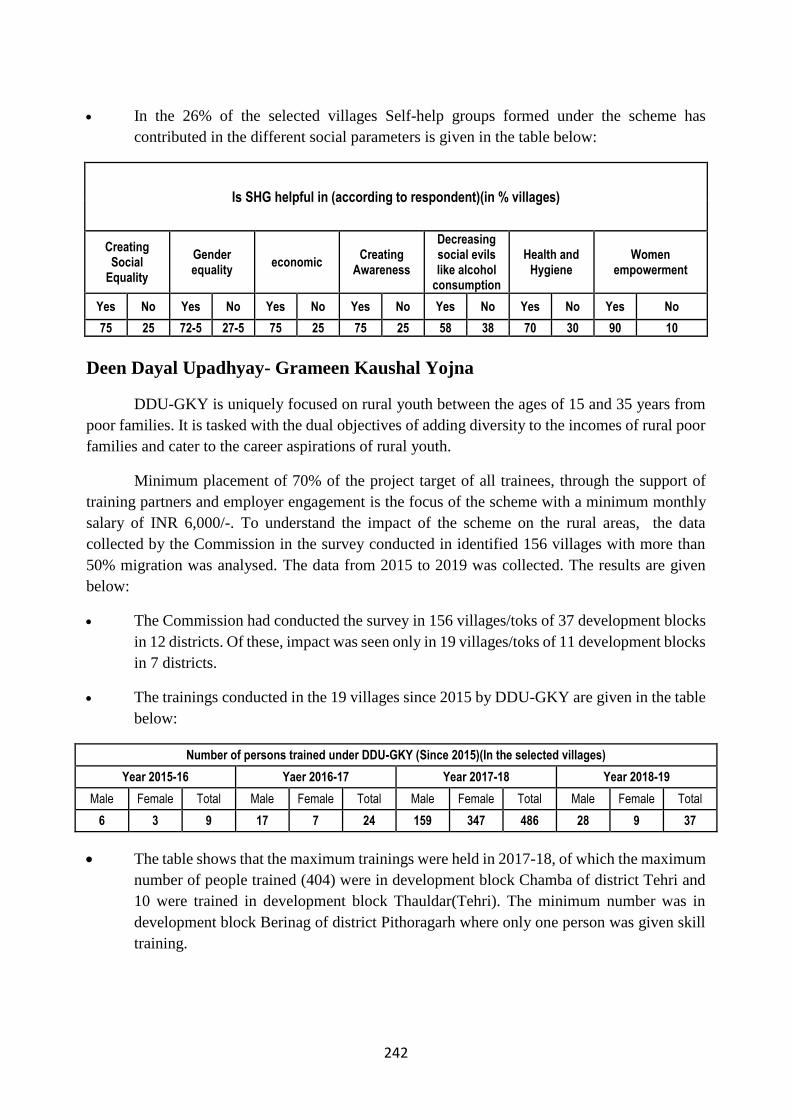
242
In the 26% of the selected villages Self-help groups formed under the scheme has
contributed in the different social parameters is given in the table below:
Is SHG helpful in (according to respondent)(in % villages)
Creating Social
Equality
Gender equality
economic Creating
Awareness
Decreasing social evils like alcohol
consumption
Health and Hygiene
Women empowerment
Yes No Yes No Yes No Yes No Yes No Yes No Yes No
75 25 72-5 27-5 75 25 75 25 58 38 70 30 90 10
Deen Dayal Upadhyay- Grameen Kaushal Yojna
DDU-GKY is uniquely focused on rural youth between the ages of 15 and 35 years from
poor families. It is tasked with the dual objectives of adding diversity to the incomes of rural poor
families and cater to the career aspirations of rural youth.
Minimum placement of 70% of the project target of all trainees, through the support of
training partners and employer engagement is the focus of the scheme with a minimum monthly
salary of INR 6,000/-. To understand the impact of the scheme on the rural areas, the data
collected by the Commission in the survey conducted in identified 156 villages with more than
50% migration was analysed. The data from 2015 to 2019 was collected. The results are given
below:
The Commission had conducted the survey in 156 villages/toks of 37 development blocks
in 12 districts. Of these, impact was seen only in 19 villages/toks of 11 development blocks
in 7 districts.
The trainings conducted in the 19 villages since 2015 by DDU-GKY are given in the table
below:
Number of persons trained under DDU-GKY (Since 2015)(In the selected villages)
Year 2015-16 Yaer 2016-17 Year 2017-18 Year 2018-19
Male Female Total Male Female Total Male Female Total Male Female Total
6 3 9 17 7 24 159 347 486 28 9 37
The table shows that the maximum trainings were held in 2017-18, of which the maximum
number of people trained (404) were in development block Chamba of district Tehri and
10 were trained in development block Thauldar(Tehri). The minimum number was in
development block Berinag of district Pithoragarh where only one person was given skill
training.
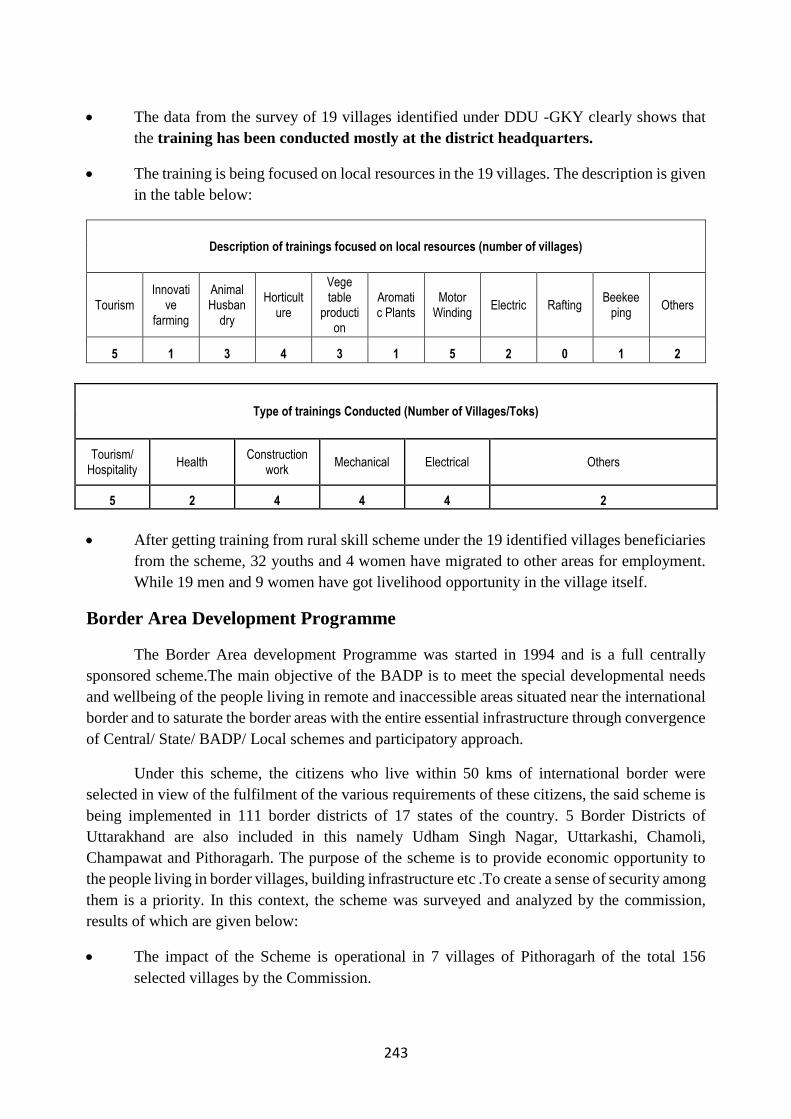
243
The data from the survey of 19 villages identified under DDU -GKY clearly shows that
the training has been conducted mostly at the district headquarters.
The training is being focused on local resources in the 19 villages. The description is given
in the table below:
Description of trainings focused on local resources (number of villages)
Tourism Innovati
ve farming
Animal Husban
dry
Horticulture
Vege table
production
Aromatic Plants
Motor Winding
Electric Rafting Beekee
ping Others
5 1 3 4 3 1 5 2 0 1 2
Type of trainings Conducted (Number of Villages/Toks)
Tourism/ Hospitality
Health Construction
work Mechanical Electrical Others
5 2 4 4 4 2
After getting training from rural skill scheme under the 19 identified villages beneficiaries
from the scheme, 32 youths and 4 women have migrated to other areas for employment.
While 19 men and 9 women have got livelihood opportunity in the village itself.
Border Area Development Programme
The Border Area development Programme was started in 1994 and is a full centrally
sponsored scheme.The main objective of the BADP is to meet the special developmental needs
and wellbeing of the people living in remote and inaccessible areas situated near the international
border and to saturate the border areas with the entire essential infrastructure through convergence
of Central/ State/ BADP/ Local schemes and participatory approach.
Under this scheme, the citizens who live within 50 kms of international border were
selected in view of the fulfilment of the various requirements of these citizens, the said scheme is
being implemented in 111 border districts of 17 states of the country. 5 Border Districts of
Uttarakhand are also included in this namely Udham Singh Nagar, Uttarkashi, Chamoli,
Champawat and Pithoragarh. The purpose of the scheme is to provide economic opportunity to
the people living in border villages, building infrastructure etc .To create a sense of security among
them is a priority. In this context, the scheme was surveyed and analyzed by the commission,
results of which are given below:
The impact of the Scheme is operational in 7 villages of Pithoragarh of the total 156
selected villages by the Commission.
244
In the selected districts under the BADP, villages with more than 50% of the migration
were selected by the Commission, on priority basis. In the 7 villages of Pithoragarh since
2015-16, no work has been done in agriculture / animal husbandry and related areas (Dairy,
fishery, sericulture, poultry, horticulture, land improvement, horticulture, Irrigation
facility, pasture etc.).
In the health sector, no work has been done in the 7 villages since 2015-16. (includes house
construction for doctors and staff, PHC, CHC, HHC building construction, medical
equipments, ambulance, hospital etc)
Statistics show that in the field of education (housing for teachers, school building, hostel,
library, computer lab, toilets for girl students etc.);In the field of sports activities
(playground, adventure sports, mini open stadium, indoor stadium, auditorium,
gymnasium etc.) and in the social sector (community center, elderly and handicap shelter,
toilet facility, rural self-control, capacity skill development, women's Toilets, tourism and
banquet etc) no work has been done.
Under this scheme, the 7 villages of Pithoragarh, under the scheme of development in the
infrastructure sector (clean drinking water, link road, bridge, bridge, ropeway, promoting
rural tourism, conservation of areas, drainage, biogas, small scale industries,
Anganwadicenter etc.) A total of 51 works (maximum) have been carried out in the Jumma
of Dharchula in the year 2016-17.
According to the data recieved from the survey, constructions of houses for teachers in the
education sector has been done in Sankuri village of Dharchula development block and
are also being used. It has not been done in any other village.
Out of the 7 villages of Pithoragarh, under BADP, Jingal, Natati of Kalichiniand Rathi,
Jumma of Dharchula block have been connected by the road but Khel, Chipchipaand
Syankuri villages are still deprived of road connectivity.
The data received from the survey establishes that no change in the income of the villagers
has been seen in the 7 villlages included in BADP.
The maintenance of the assets created under BADP is being done by the community.
Recommendations:
The survey shows that asset creation done under MGNREGA has had no effect on
agricultural productivity in 76% of the villages. With agriculture on a decline in the state
there is a need to focus attention to the assets being created under the scheme and ensure
benefits to agriculture in the hilly areas. This can be done through proper maintenance and
ensuring functionality of the assets.

245
A gap in convergence with other departments like PMGSY, PMAY, NRLM was found in
the survey. Convergence needs to be made stronger to ensure holistic development and
also to link it with livelihood development.
There is a need to strengthen the process for providing houses to landless families under
PMAY which continues to be minimal.
The people benefitted under the scheme (PMAY) have not migrated from their village/tok,
pointing that it is playing an important role in stopping migration from the villages and
people are actually benefitting from the asset (i.e. house) created under the scheme.
Under the NRLM scheme, a considerable gap in establishing market linkages has come
to light. Market linkages play an important role in making livelihood activities sustainable.
They help in creating a value change. Hence, it is of utmost importance to establish market
linkages and ensure a market for the goods created or the agricultural produce.
Interest in horticulture is considerably less. The state has immense potential in horticulture
which should be explored.
The SHGs formed under the scheme have substantially contributed to different social
parameters like creating social equality, gender equality, awareness generation, women
empowerment and health and hygiene. SHGs serve an important role in influencing the
social fabric and overall development.
The impact of DDU-GKY was seen only in 19 villages of 156 selected villages. Outreach
to grassroots level needs to be a focus. It is an important skill development scheme with
an objective to also place the candidates trained under the scheme. The implementation
needs to be strengthened and the beneficiary reach needs to be expanded.
The number of people trained is highest in 2017-18 (486) which has decreased in 2018-19
(37). The spread of trainings is also not equally distributed in the districts. Where on one
hand 404 candidates were trained in development block Chamba only one person was
given training from Berinag Development Block of Pithoragarh. A balance should be
maintained in the regional distribution of people benefitting through the scheme to avoid
further inequality and skewed development.
The trainings need to focus on use of local resources so that people need not migrate to
other areas for jobs.
The Border Area Development Programme was operational in 7 villages of Pithoragarh
that were selected. No work was found to be done under agriculture/animal husbandry and
related areas. The data shows that no works has been done in education, sports or in the
social sector since 2015-16. As the programme aims to provide economic opportunity to
the people living in border villages, building infrastructure, and creating social value, a

246
plan must be developed to drive change and guide the process of development in these
areas under the program.
According to the data received from the survey, construction of houses for teachers in the
education sector has been done in Sankuri village of Dharchula development block and is
also being used. It has not been done in any other village. Similar works can be done in
other areas.
Three villages of the seven BADP villages are still not connected by road. Road
connectivity should be considered on priority as it plays an important role in making socio
economy vibrant. Given the strategical importance of the region, the process should be
accelerated.
From the survey it is also imperative that time to time monitoring and impact assessment
of the different schemes should be done to assess the actual benefit of the schemes at
grassroots level (the real targeted beneficiaries of the scheme) and the problems on the
field. It will also help in guiding the approach of implementation in a more region specific
and need based manner. It is also suggested that a cost benefit analysis can be done to
further understand the real benefit of the schemes and tangible outcomes seen in the socio
economy of the region.

247
Annexure II