runway status lights: takeoff hold lighting system evaluation · the beginning of the runway...
TRANSCRIPT

Runway Status Lights: Takeoff Hold Lighting System Evaluation James Patterson August 2009 DOT/FAA/AR-TN09/25 This document is available to the U.S. public through the National Technical Information Service (NTIS), Springfield, Virginia 22161
U.S. Department of Transportation Federal Aviation Administration
ote
tech
nica
l not
e te
chni
ca

NOTICE
This document is disseminated under the sponsorship of the U.S. Department of Transportation in the interest of information exchange. The United States Government assumes no liability for the contents or use thereof. The United States Government does not endorse products or manufacturers. Trade or manufacturer's names appear herein solely because they are considered essential to the objective of this report. This document does not constitute FAA certification policy. Consult your local FAA airport certification office as to its use. This report is available at the Federal Aviation Administration William J. Hughes Technical Cetner’s Full-Text Technical Reports page: actlibrary.act.faa.gov in Adobe Acrobat portable document format (PDF).
Technical Report Documentation Page 1. Report No.
DOT/FAA/AR-TN09/25
2. Government Accession No. 3. Recipient's Catalog No.
4. Title and Subtitle
RUNWAY STATUS LIGHTS: TAKEOFF HOLD LIGHTING SYSTEM EVALUATION
5. Report Date
August 2009
6. Performing Organization Code
7. Author(s)
James Patterson
8. Performing Organization Report No.
10. Work Unit No. (TRAIS)
9. Performing Organization Name and Address
Federal Aviation Administration William J. Hughes Technical Center Airport and Aircraft Safety Research and Development Division Airport Technology Research and Development Team Atlantic City International Airport, NJ 08405
11. Contract or Grant No.
13. Type of Report and Period Covered
Technical Note
12. Sponsoring Agency Name and Address
U.S. Department of Transportation Federal Aviation Administration Office of Airport Safety and Standards Air Traffic Organization Operations Planning Washington, DC 20591
14. Sponsoring Agency Code
AAS-100
15. Supplementary Notes
Anthony J. Previti, Harold Olson, James Newman, James Zargan, Ozzy Valdivieso, and Nelson Brown of Hi-Tec Systems, Inc. provided technical support throughout the course of this evaluation. 16. Abstract
Takeoff hold lights (THL) are positioned along the runway centerline, and when illuminated, they are visible to an aircraft pilot at the beginning of the runway preparing for takeoff. Normally, these lights are off. A Runway Status Light (RWSL) System monitors the runway occupancy status and conveys this information to the pilots, ground vehicle operators, and others using special lighting components such as the THLs. Specifically, when a runway is occupied, the RWSL System turns on the THLs and provides a conspicuous visual warning to pilots preparing for takeoff that they should not continue. Project personnel from the Federal Aviation Administration (FAA) Airport Safety Technology Research and Development Subteam evaluated four THL configurations on Runway 13 at the Atlantic City International Airport. Three configurations contained a double row of red lights and one contained a single row of red lights. Project personnel collected data on the appearance of each configuration and recorded their findings on questionnaires. The results of this evaluation validated previous findings by the FAA Airport Safety Technology Research and Development Subteam that the double-row THL configuration spaced 6 ft from the runway centerline was more effective than the other three configurations. The 6-ft spacing created very distinct lines that did not, at any time, blend with the runway centerline fixtures. As a result, this configuration created a more conspicuous signal that was easily acquired by the pilots. Using double-row THLs significantly enhanced the THL system. 17. Key Words
Runway status lights, Takeoff hold lights, Runway, Conspicuity
18. Distribution Statement
This document is available to the U.S. public through the National Technical Information Service (NTIS), Springfield, Virginia 22161
19. Security Classif. (of this report) Unclassified
20. Security Classif. (of this page) Unclassified
21. No. of Pages 40
22. Price
Form DOT F 1700.7 (8-72) Reproduction of completed page authorized
TABLE OF CONTENTS Page EXECUTIVE SUMMARY vii
INTRODUCTION 1
Purpose 1 Background 1 Objectives 2 Related Documents 2
EVALUATION APPROACH 3
Phase One: Photometric Tests 3 Phase Two: Field Tests 7
Part One—National Airport Pavement Test Facility Tests 8 Part Two—Main Landing Gear Interaction 8 Part Three—ACY Runway 13 10
RESULTS 19
Question One 22 Question Two 24 Question Three 26 Question Four 28
SUMMARY 31
CONCLUSIONS 32
iii

LIST OF FIGURES Figure Page 1 Plot of Main Gear and THL Separation 10 2 Atlantic City International Airport Diagram 11 3 Actual View of THL Configuration 1 12 4 Schematic of THL Configuration 1 13 5 Actual View of Configuration 2 14 6 Schematic of THL Configuration 2 15 7 Actual View of THL Configuration 3 16 8 Schematic of THL Configuration 3 17 9 Actual View of THL Configuration 4 18 10 Schematic of THL Configuration 4 19 11 Questionnaire to Evaluate Each Lighting Configuration 21 12 Question 1—THL Configuration 1 22 13 Question 1—THL Configuration 2 23 14 Question 1—THL Configuration 3 23 15 Question 1—THL Configuration 4 24 16 Question 2—THL Configuration 1 25 17 Question 2—THL Configuration 2 25 18 Question 2—THL Configuration 3 26 19 Question 2—THL Configuration 4 26 20 Question 3—THL Configuration 1 27 21 Question 3—THL Configuration 2 27 22 Question 3—THL Configuration 3 28 23 Question 3—THL Configuration 4 28 24 Question 4—THL Configuration 1 29 25 Question 4—THL Configuration 2 29 26 Question 4—THL Configuration 3 30 27 Question 4—THL Configuration 4 30
iv
LIST OF TABLES Table Page 1 Takeoff Hold Lights Photometric Measurement Results 3 2 Values Used for Illuminance Thresholds 4 3 Reference Pilot Eye Heights 6 4 Runway Visual Range Versus Observable Distance of the THL Fixtures 6 5 Aircraft Main Landing Gear Widths 9
v

vi
LIST OF ACRONYMS
AC Advisory Circular ACY Atlantic City International Airport AMASS Airport Movement Area Safety System ASDE Airport Surface Detection Equipment DFW Dallas-Fort Worth International Airport FAA Federal Aviation Administration R&D Research and Development RVR Runway visual range RWSL Runway status light THL Takeoff hold light

EXECUTIVE SUMMARY
A Runway Status Light (RWSL) System evaluation was conducted to identify the optimal configuration of red in-pavement lights to perform the function of takeoff hold lights (THL). The THLs are positioned along the runway centerline so they are visible to an aircraft pilot who is at the beginning of the runway preparing to takeoff. When the RWSL System determines that the runway is occupied and that a takeoff should not be conducted, the system activates the THLs to provide a conspicuous visual warning to pilots that they should not continue with the takeoff. The RWSL System conveys the runway occupancy status to the user (pilots, ground vehicle operators, etc.), indicating when a runway is unsafe to takeoff through the use of red in-pavement warning THLs. These lights warn pilots who are about to depart, or are in progress of departing, that another aircraft is on the runway. Four configurations were compared. All four configurations started 375 ft from the runway threshold and ended 1775 ft from the runway threshold, for a total system length of 1400 ft. The first configuration consisted of a single row of red lights placed 2 ft from the runway centerline, and spaced longitudinally 100 ft apart. The second configuration consisted of a double row of red lights placed 2 ft from the runway centerline, and spaced longitudinally 100 ft apart. The third configuration consisted of a double row of red lights placed 4 ft from the runway centerline, and spaced longitudinally 100 ft apart. The fourth configuration contained a double row of red lights placed 6 ft from the runway centerline and spaced longitudinally 100 ft apart. Project personnel from the Federal Aviation Administration (FAA) Airport Safety Technology Research and Development Subteam evaluated the four THL configurations on Runway 13 at the Atlantic City International Airport. Project personnel collected data on the appearance of each configuration and recorded their findings on questionnaires. The results of this evaluation validated previous findings by the FAA Airport Safety Technology Research and Development Subteam that the double-row THL configuration spaced 6 ft from the runway centerline was more effective than the other three configurations. The 6-ft spacing created very distinct lines that did not, at any time, blend with the runway centerline fixtures. As a result, this configuration created a more conspicuous signal that was easily acquired by the pilots. In addition, the 6-ft spacing of the THL fixtures was determined to have no affect on the main gear of typical air carrier type aircraft. Using double-row THLs significantly improved the THL system.
vii/viii

INTRODUCTION
PURPOSE.
This report describes an evaluation conducted by the Federal Aviation Administration (FAA) Airport Safety Technology Research and Development (R&D) Subteam to evaluate the effectiveness of four different takeoff hold light (THL) configurations. The purpose of the research was to select the best configuration that would serve as the final THL configuration for the Runway Status Light (RWSL) System installation at Dallas-Fort Worth International Airport (DFW). BACKGROUND.
The office of Runway Safety and Operational Services sponsored the Air Traffic Organization Technology Development Surface System Team’s evaluation of the RWSL System. The RWSL System conveys the runway occupancy status to the user (pilots, ground vehicle operators, etc.), indicating when a runway is unsafe to enter through the use of in-pavement warning runway entrance lights. The RWSL System further indicates when it is unsafe to takeoff through the use of in-pavement warning THLs. The RWSL System consists of a surveillance data source (surface radar), such as Airport Surface Detection Equipment Model X (ASDE-X) or Airport Movement Area Safety System/Airport Surface Detection Equipment Model 3 (AMASS/ASDE-3), control logic software, airfield lighting fixtures, and the associated power and control hardware. In March 2006, three THL configurations were evaluated by MITRE/CAASD using a computer-based simulator. In the simulator evaluation, a group of participants, including 14 commercial pilots, were directed to taxi the aircraft through a series of evolutions in which they would simulate that they are taxiing from the terminal to a departure runway. Along the runway, the participants would be exposed to one of the THL configurations. After each THL exposure, they were asked a few questions about the particular configuration they just saw. Configuration 1 consisted of a single row of red lights placed 2 ft from the runway centerline lights and spaced longitudinally 100 ft apart. Configuration 2 consisted of a double row of red lights that were placed 10 ft from each side of the runway centerline lights and longitudinally spaced 200 ft apart. Configuration 3 consisted of five lateral rows of six lights perpendicular to the runway centerline that was longitudinally spaced 300 ft apart. The results of the evaluation completed by MITRE/CAASD included the following. 1. Operational issues associated with THL configuration 1 were identified. 2. THL configurations 2 or 3 evidenced no essential operational issues. 3. THL configuration 3 was rated as the most effective. In April 2006, the FAA Airport Safety Technology R&D Subteam demonstrated the three THL configurations from the MITRE/CAASD study on Runway 13 at the Atlantic City International Airport (ACY), colocated with the FAA William J. Hughes Technical Center, using actual lighting fixtures on a large illuminated runway. Configurations 1, 2, and 3 were arranged exactly
1
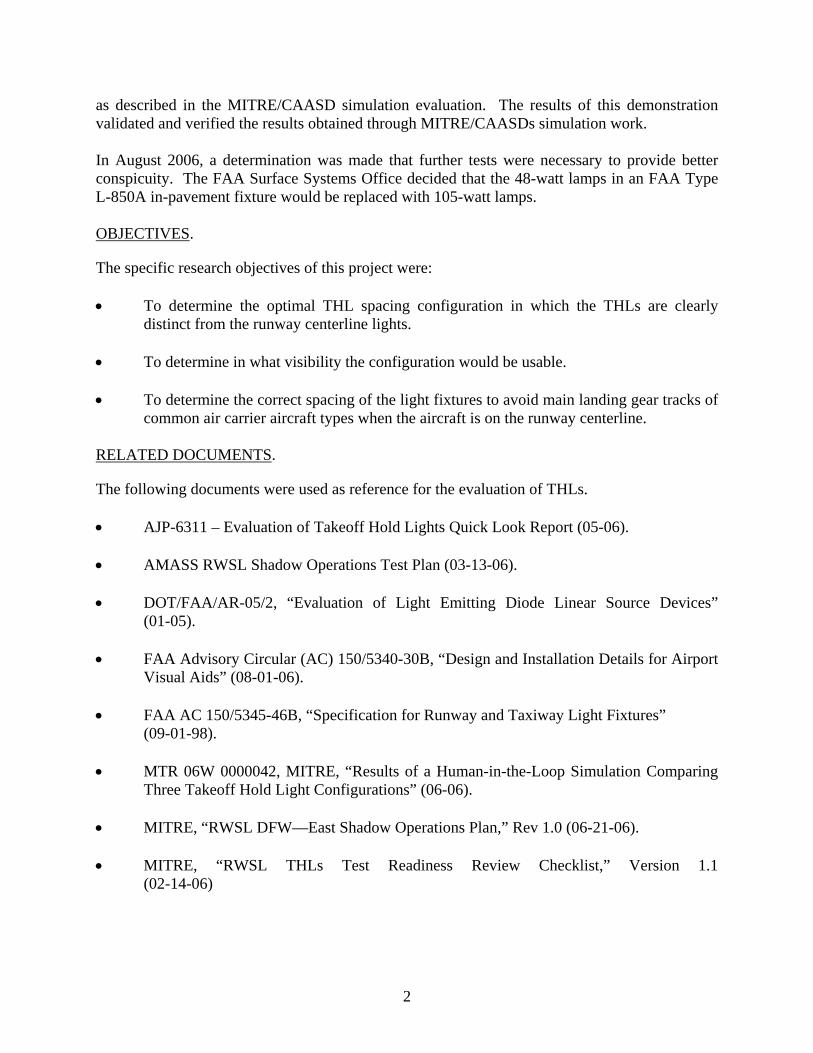
as described in the MITRE/CAASD simulation evaluation. The results of this demonstration validated and verified the results obtained through MITRE/CAASDs simulation work. In August 2006, a determination was made that further tests were necessary to provide better conspicuity. The FAA Surface Systems Office decided that the 48-watt lamps in an FAA Type L-850A in-pavement fixture would be replaced with 105-watt lamps. OBJECTIVES.
The specific research objectives of this project were: • To determine the optimal THL spacing configuration in which the THLs are clearly
distinct from the runway centerline lights. • To determine in what visibility the configuration would be usable. • To determine the correct spacing of the light fixtures to avoid main landing gear tracks of
common air carrier aircraft types when the aircraft is on the runway centerline. RELATED DOCUMENTS.
The following documents were used as reference for the evaluation of THLs. • AJP-6311 – Evaluation of Takeoff Hold Lights Quick Look Report (05-06). • AMASS RWSL Shadow Operations Test Plan (03-13-06). • DOT/FAA/AR-05/2, “Evaluation of Light Emitting Diode Linear Source Devices”
(01-05). • FAA Advisory Circular (AC) 150/5340-30B, “Design and Installation Details for Airport
Visual Aids” (08-01-06). • FAA AC 150/5345-46B, “Specification for Runway and Taxiway Light Fixtures”
(09-01-98). • MTR 06W 0000042, MITRE, “Results of a Human-in-the-Loop Simulation Comparing
Three Takeoff Hold Light Configurations” (06-06). • MITRE, “RWSL DFW—East Shadow Operations Plan,” Rev 1.0 (06-21-06). • MITRE, “RWSL THLs Test Readiness Review Checklist,” Version 1.1
(02-14-06)
2

• Douglas, C.A. and Booker, R.L., Visual Range: Concepts, Instrumental Determination, and Aviation Applications, U.S. Department of Commerce, National Bureau of Standards, Washington, DC, “Theory of Visual Range,” pp. 4-34.
EVALUATION APPROACH
To perform this evaluation, two distinct phases were undertaken. The first phase involved photometric measurements and calculations taken at the Airport Safety Technology R&D Subteam’s Photometric Laboratory, as well as data analysis to determine the impact of THL fixture spacing on the main gear of air carrier type aircraft. In the second phase, field tests were conducted on a runway at ACY. Combined, these two phases were used to validate earlier evaluations performed by the FAA Airport Safety Technology R&D Subteam. PHASE ONE: PHOTOMETRIC TESTS.
On October 5, 2006, photometric measurements were taken of an FAA Type L-850A red in-pavement fixture modified with a 105-watt lamp. The FAA Type L-850A in-pavement fixture was secured to the photometric bench’s alignment platform, with the center of the fixture slightly offset horizontally (as opposed to being perfectly centered) to simulate the angle at which the pilot would be viewing the fixture. The fixture was then energized to 6.57 Amperes for 15 minutes before any readings were taken. At a test distance of 15 ft, a charged-couple device camera was used to take the exposure of the projected light and convert those measurements to candelas. The results of the photometric tests, when plotted in a table format, produce an intensity distribution for the output of the THL fixture. The results are shown in table 1.
Table 1. Takeoff Hold Lights Photometric Measurement Results
Horizontal Vertical -5 -4 -3 -2 -1 0 1 2 3 4 5
13 904 964 1002 993 986 975 928 892 919 873 862 12 1056 1139 1147 1166 1196 1198 1134 1119 1097 1069 949 11 1213 1300 1383 1377 1407 1393 1352 1319 1257 1225 113010 1347 1437 1571 1643 1618 1595 1557 1488 1453 1397 12789 1474 1622 1758 1843 1892 1841 1784 1733 1657 1540 14248 1630 1806 1967 2113 2189 2196 2136 1986 1848 1721 15547 1790 1955 2204 2345 2441 2508 2443 2257 2064 1856 16306 1949 2204 2361 2537 2647 2672 2639 2480 2257 1986 17515 2057 2283 2466 2526 2552 2585 2493 2481 2326 2088 17934 1956 2048 2146 2185 2159 2178 2177 2131 2080 1969 1644
3

Table 1. Takeoff Hold Lights Photometric Measurement Results (Continued)
Horizontal Vertical -5 -4 -3 -2 -1 0 1 2 3 4 5
3 1603 1726 1786 1793 1829 1794 1820 1782 1758 1694 14432 1353 1388 1504 1476 1519 1471 1511 1493 1462 1418 11991 1026 1148 1195 1181 1196 1178 1191 1190 1149 1081 908 0 663 776 866 907 864 890 887 894 789 725 634
The photometric intensity distribution was found to be in accordance with AC 150/5345-46B, “Specification for Runway and Taxiway Light Fixtures.” The intensity distribution for the sample fixture was used to establish the minimum intensity required within the main light beam. Based on operational requirements established by the FAA Office of Flight Standards, this intensity was used in calculations to determine the required visual acquisition distance. These calculations were made using Allard’s Law. This formula is shown in equation 1, where EV = threshold of perceptible illuminance, I = source intensity, α = extinguishing coefficient, and V = visual acquisition distance from the observer. This formula is the industry standard method of calculating visual range.
2VIeE
V
V
α−
= (1)
To use this method, Runway Visual Range (RVR) must first be calculated. RVR is a machine-reported value found using the visual acquisition of runway edge lights with an intensity of 10,000 candela denoted by VRVR. If the illuminance threshold for the particular light condition is known, then in conjunction with RVR, the extinguishing coefficient can be calculated as shown in equation 2.
⎟⎟⎠
⎞⎜⎜⎝
⎛−=
IVE
VRVRt
RVR
2
ln1α (2)
The illuminance threshold used for this project was a set of constants for bright day, day, twilight, and night, as shown in table 2.
Table 2. Values Used for Illuminance Thresholds
Referenced: Et (cd/m2) Bright day 10-3 Day 10-4 Twilight 10-5 Night 8 x 10⁻⁷
4

The intensity of the THL fixture used in these calculations was a representative value, as will be discussed later in this section. This value was an approximation of the intensities inside the main beam measured at +0.2° to +8° vertical angle and ±5° horizontal angle. The values of the intensity of the THL fixture, extinguishing coefficient, and the illuminance thresholds were used to calculate the visual acquisition distance. This was done using and an iterative form of Allard’s Law shown in equation 3.
⎟⎟⎠
⎞⎜⎜⎝
⎛−=+ I
VEV ntn
2
1 ln1α
(3)
If a pilot is not actively engaged in searching for a light source, there could be difficulty attracting the pilot’s attention to the light. Threshold levels were determined in a laboratory environment where subjects had singular focus on one source of light as the intensity was raised. When the subject could see the light, the value of the intensity was recorded as the threshold. A pilot may be distracted by his regular duties and may not retain singular focus on the THL fixtures; thus, threshold levels of illuminance are not sufficient. To simulate the difficulty associated with attracting the pilot’s attention, the illuminance thresholds were raised by a field factor. The modified form of the equation with the field factor F is shown as equation 4.
⎟⎟⎠
⎞⎜⎜⎝
⎛−=+ I
VFEV nt
n
2
1 ln1α
(4)
Field factors ranged from 2 to 20, so the illuminance thresholds were raised by factors of 2 to 20 times their original value. These values were chosen based on information contained in the Douglas report cited in the Related Documents section of this report. Larger values of the field factor result in more conservative estimates of the visual acquisition distance. The visual acquisition distances calculated using equation 4, given enough successive iteration, represent the distance at which the pilot would acquire the THL fixture to the same degree of recognition as the runway edge light fixtures. To ensure that a pilot was within the main beam of the THL fixture, the required visual acquisition distances were compared to the eye heights for pilots sitting in the cockpit of an aircraft, as shown in table 3.
5

Table 3. Reference Pilot Eye Heights
Aircraft Type Eye HeightCessna 172 5′ 6″ MD-80/MD-90 11′ 5″ Boeing 757 15′ 5″ Boeing 767 18′ 2″ Boeing 777 19′ 6″ DC-10/MD-11 20′ 8″ Airbus A380 23′ 6″ Boeing 747 28′ 5″
At a horizontal distance between 300 to 1400 ft from the pilot’s eyes, and at the eye heights given in table 2, the THL fixtures would be viewed at a downward angle ranging from 0.5° to 8.0° and within a horizontal angle of 0° to ±5°. Based on the photometric measurements presented in table 1, a conservative assumption of 1500 candela was made for the intensity of the THL fixture at these observation angles. It is important to note some losses in intensity may occur due to reflection and transmission through the front window of the aircraft. This loss was not included in the calculations. Other assumptions included a field factor of 20, along with the illuminance thresholds shown in table 2. The values in table 4 were generated using these assumptions and the described method based on Allard’s Law for determining the observable distance to the THL fixtures.
Table 4. Runway Visual Range Versus Observable Distance of the THL Fixtures
Category
RVR Minimums
(ft)
Observable Distance – Bright Day
(ft)
Observable Distance –
Day (ft)
Observable Distance – Twilight
(ft)
Observable Distance –
Night (ft)
I 1800 534 792 982 1130 II 1200 421 578 690 778 IIIA 700 291 370 427 471 IIIB 150 84 95 102 109
Even with larger field factors, the visual acquisition distances derived imply the RWSL System, as configured, will be effective in Category II conditions. The RWSL System may be used in Category IIIA conditions, which extend down to 700 ft RVR; in this case, the pilot would be able to see THL fixtures placed approximately 290 to 470 ft ahead, as indicated in table 3, dependent on the level of ambient illuminance. Additional assumptions must be made for the configuration to be visible in Category IIIA conditions. The aircraft must be large enough that the pilot is located between 100 and 150 ft
6
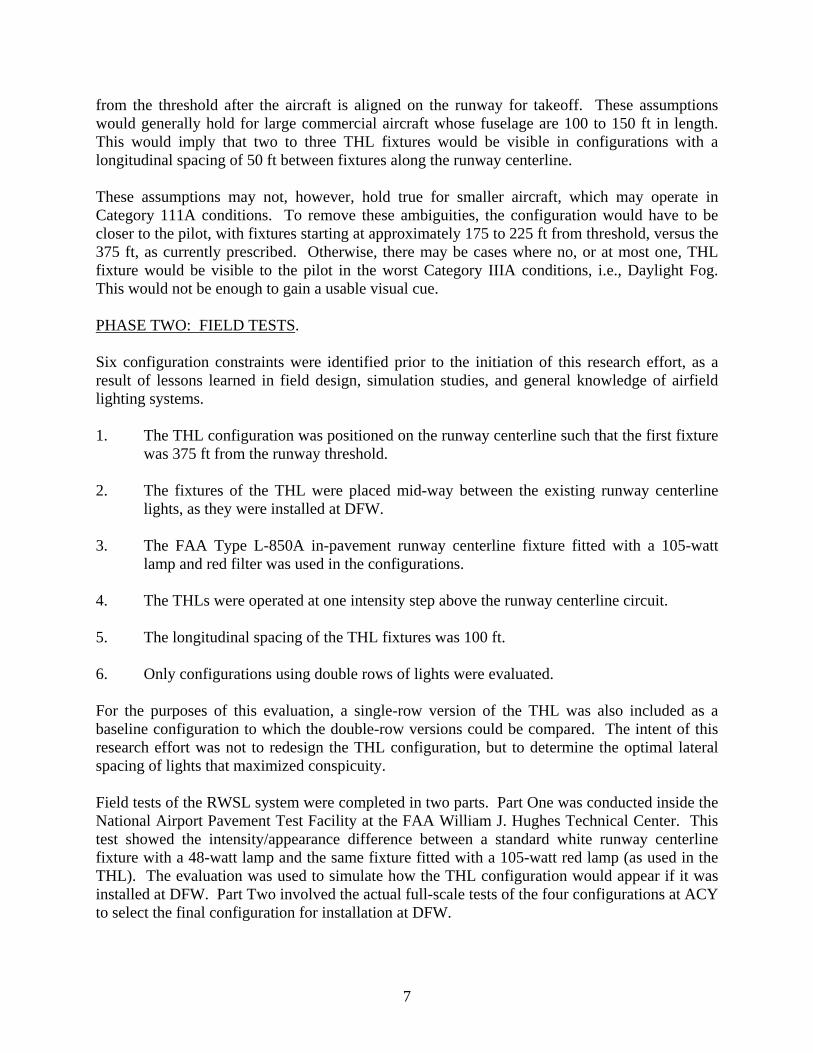
from the threshold after the aircraft is aligned on the runway for takeoff. These assumptions would generally hold for large commercial aircraft whose fuselage are 100 to 150 ft in length. This would imply that two to three THL fixtures would be visible in configurations with a longitudinal spacing of 50 ft between fixtures along the runway centerline. These assumptions may not, however, hold true for smaller aircraft, which may operate in Category 111A conditions. To remove these ambiguities, the configuration would have to be closer to the pilot, with fixtures starting at approximately 175 to 225 ft from threshold, versus the 375 ft, as currently prescribed. Otherwise, there may be cases where no, or at most one, THL fixture would be visible to the pilot in the worst Category IIIA conditions, i.e., Daylight Fog. This would not be enough to gain a usable visual cue. PHASE TWO: FIELD TESTS. Six configuration constraints were identified prior to the initiation of this research effort, as a result of lessons learned in field design, simulation studies, and general knowledge of airfield lighting systems. 1. The THL configuration was positioned on the runway centerline such that the first fixture
was 375 ft from the runway threshold. 2. The fixtures of the THL were placed mid-way between the existing runway centerline
lights, as they were installed at DFW. 3. The FAA Type L-850A in-pavement runway centerline fixture fitted with a 105-watt
lamp and red filter was used in the configurations. 4. The THLs were operated at one intensity step above the runway centerline circuit. 5. The longitudinal spacing of the THL fixtures was 100 ft. 6. Only configurations using double rows of lights were evaluated. For the purposes of this evaluation, a single-row version of the THL was also included as a baseline configuration to which the double-row versions could be compared. The intent of this research effort was not to redesign the THL configuration, but to determine the optimal lateral spacing of lights that maximized conspicuity. Field tests of the RWSL system were completed in two parts. Part One was conducted inside the National Airport Pavement Test Facility at the FAA William J. Hughes Technical Center. This test showed the intensity/appearance difference between a standard white runway centerline fixture with a 48-watt lamp and the same fixture fitted with a 105-watt red lamp (as used in the THL). The evaluation was used to simulate how the THL configuration would appear if it was installed at DFW. Part Two involved the actual full-scale tests of the four configurations at ACY to select the final configuration for installation at DFW.
7

PART ONE—NATIONAL AIRPORT PAVEMENT TEST FACILITY TESTS. Project personnel used the National Airport Pavement Test Facility to conduct indoor comparison tests of a 48-watt white runway centerline fixture and a 105-watt red THL fixture. The building provided ideal conditions for this, as it is 1200 ft long and allows for complete darkness. The purpose of this test was to simulate the configuration currently installed at DFW and to identify any improvement in conspicuity by increasing (or decreasing) the distance between the two fixtures. The initial point of observation was 500 ft from the lamp source at ground level. This initial observation involved placing one red THL fixture 2 ft from the standard white runway centerline fixture (which is the current configuration at DFW). After performing this observation, a second red THL fixture was placed 2 ft on the other side of the white runway centerline, leaving a three-light configuration with the white in the middle, flanked by two red fixtures, each 2 ft from the white fixture. Further observations were taken at 4- and 6-ft separation distances from the white runway centerline fixture. At each separation distance, the light fixture intensity was altered between step level 3 and step level 4 to identify any differences between the two settings. When this was complete, the lower edges of the light fixtures were masked with tape to simulate pavement installation. Typically, the fixtures are installed so low in the ground that the pavement in front of the light channel of the fixture masks some of the light from view. In this exercise, project personnel tried to determine the amount of light blocked by the simulated pavement, which could influence the overall test results. Observations were generally made at ground level, but project personnel also viewed these fixtures from a height of 14 ft to simulate the height of a pilot’s eye inside a typical commercial aircraft cockpit. It was noted that the masking did have a slight affect on the light emitted, but without more than one set of lights, it was difficult to determine if it would affect the pilot’s perception of the entire set of lights and their meaning. It was also determined that the lights were distinguishable from one another at a 2-ft separation, but the further apart the lights were separated, the more effective each light became. The lights tended to blend together less as the separation distance increased. The optimum separation distance between the red and white light fixtures was determined to be 6 ft. The view height did not appear to have any affect on the visibility of the red or white light fixtures. Project personnel concluded that additional tests were necessary to determine the performance effect of masking uninstalled, in-pavement fixtures compared to those actually installed in the pavement. PART TWO—MAIN LANDING GEAR INTERACTION. Project personnel conducted an investigation to determine if a particular spacing of the THL fixtures would be best to minimize impact by the main gear of common aircraft that would use runways equipped with THLs. Pilots typically try to maneuver their aircraft to avoid running over in-pavement light fixtures with their nose or main gear tires, as it causes nuisance vibrations that are uncomfortable to the flight crew and passengers onboard the aircraft. These impacts also affect the life expectancy of the fixture itself, as the repetitive vibration can have an adverse affect on the filament of the lamp inside the fixture, stress the metal structure or glass lens of the fixture, and in some cases, cause extreme hydraulic pressure on the fixture if there is any standing water around the fixture. With the associated cost of a light fixture and loss of revenue due to closure of a runway to repair or replace fixtures, it is important to consider the optimal spacing of the THL fixtures to avoid the main gear impact as much as possible. This will protect the fixtures and the aircraft from unnecessary damage or impact. The RWSL System is designed to be installed on very active
8
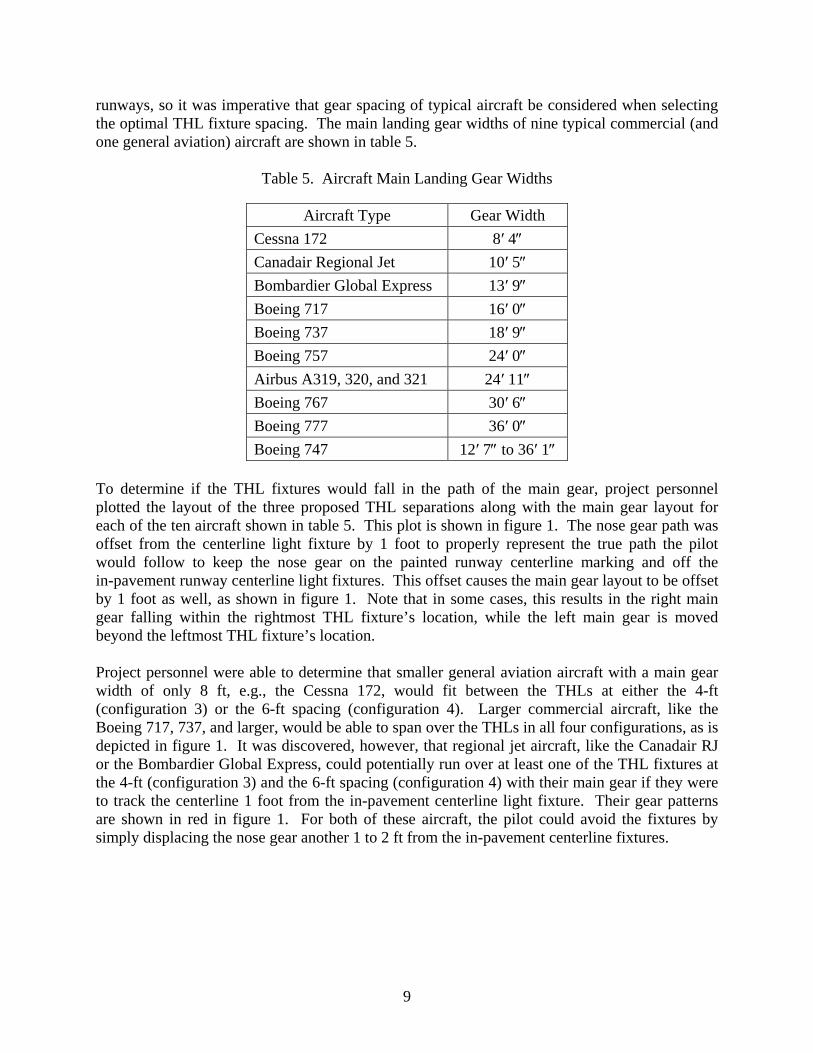
runways, so it was imperative that gear spacing of typical aircraft be considered when selecting the optimal THL fixture spacing. The main landing gear widths of nine typical commercial (and one general aviation) aircraft are shown in table 5.
Table 5. Aircraft Main Landing Gear Widths
Aircraft Type Gear Width Cessna 172 8′ 4″ Canadair Regional Jet 10′ 5″ Bombardier Global Express 13′ 9″ Boeing 717 16′ 0″ Boeing 737 18′ 9″ Boeing 757 24′ 0″ Airbus A319, 320, and 321 24′ 11″ Boeing 767 30′ 6″ Boeing 777 36′ 0″ Boeing 747 12′ 7″ to 36′ 1″
To determine if the THL fixtures would fall in the path of the main gear, project personnel plotted the layout of the three proposed THL separations along with the main gear layout for each of the ten aircraft shown in table 5. This plot is shown in figure 1. The nose gear path was offset from the centerline light fixture by 1 foot to properly represent the true path the pilot would follow to keep the nose gear on the painted runway centerline marking and off the in-pavement runway centerline light fixtures. This offset causes the main gear layout to be offset by 1 foot as well, as shown in figure 1. Note that in some cases, this results in the right main gear falling within the rightmost THL fixture’s location, while the left main gear is moved beyond the leftmost THL fixture’s location. Project personnel were able to determine that smaller general aviation aircraft with a main gear width of only 8 ft, e.g., the Cessna 172, would fit between the THLs at either the 4-ft (configuration 3) or the 6-ft spacing (configuration 4). Larger commercial aircraft, like the Boeing 717, 737, and larger, would be able to span over the THLs in all four configurations, as is depicted in figure 1. It was discovered, however, that regional jet aircraft, like the Canadair RJ or the Bombardier Global Express, could potentially run over at least one of the THL fixtures at the 4-ft (configuration 3) and the 6-ft spacing (configuration 4) with their main gear if they were to track the centerline 1 foot from the in-pavement centerline light fixture. Their gear patterns are shown in red in figure 1. For both of these aircraft, the pilot could avoid the fixtures by simply displacing the nose gear another 1 to 2 ft from the in-pavement centerline fixtures.
9

Figure 1. Plot of Main Gear and THL Separation
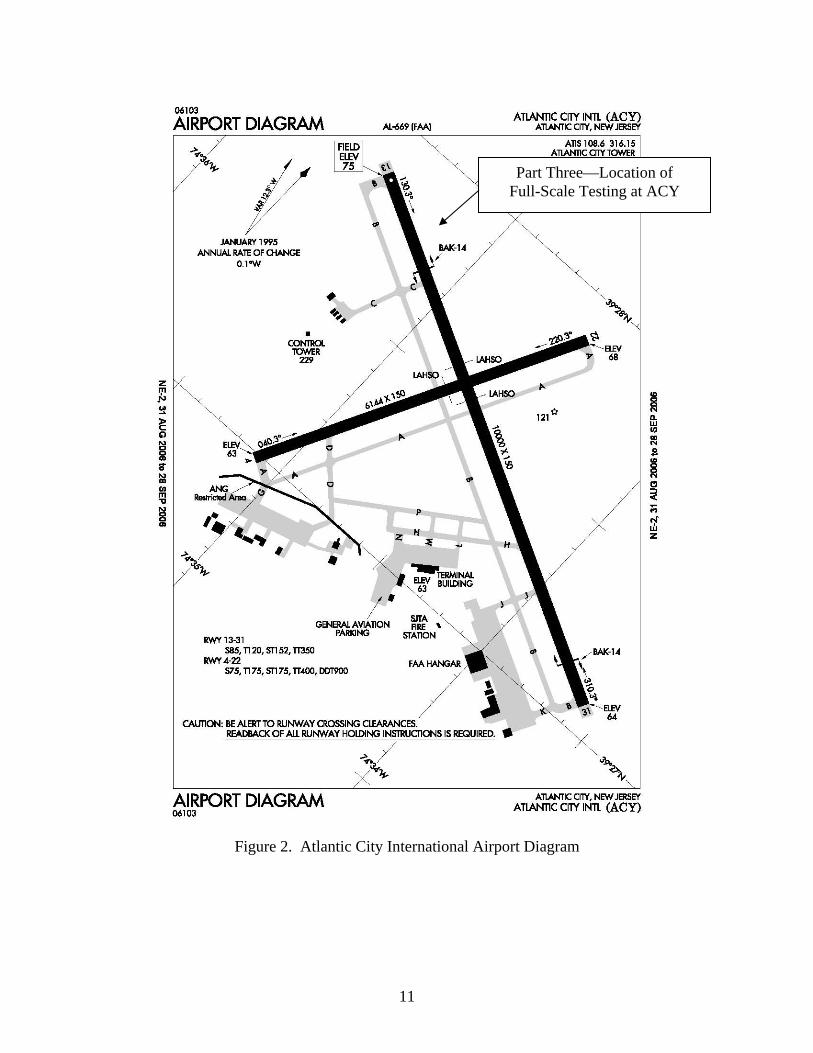
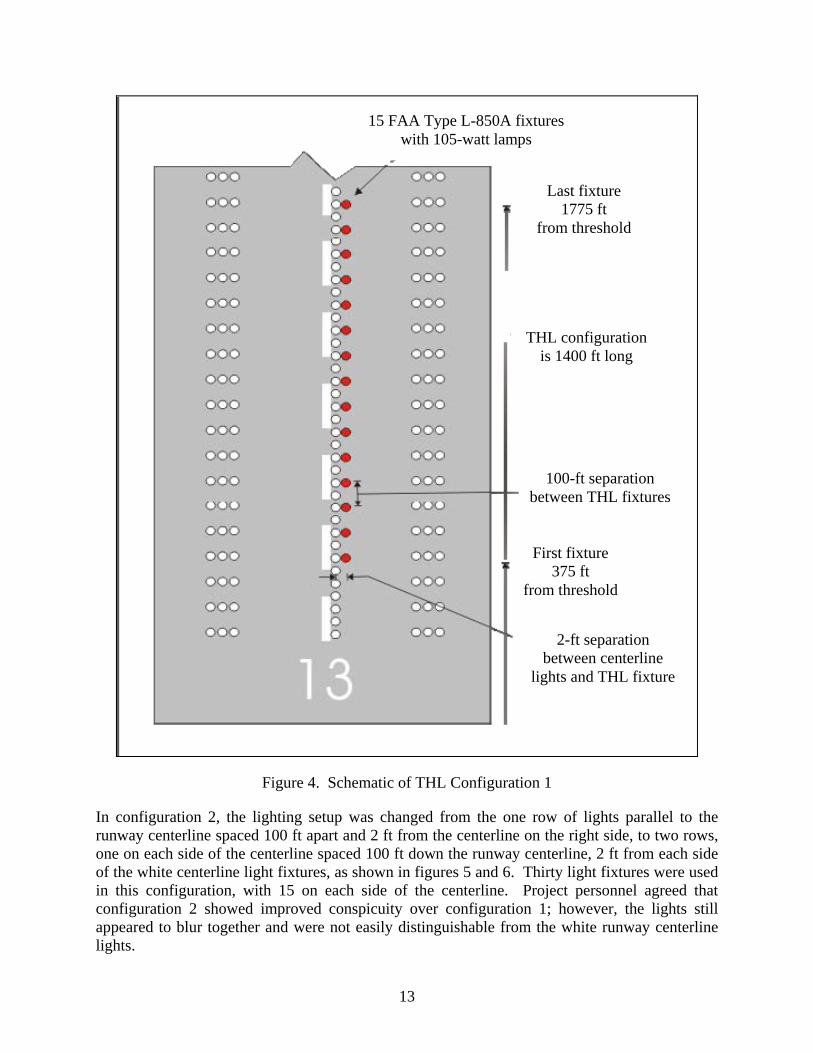
PART THREE—ACY RUNWAY 13. For the second part of the field test effort, project personnel conducted a full-scale test of the four THL configurations on Runway 13 at ACY at night. The purpose of this field test effort was to allow project personnel to evaluate the four configurations in an actual airport environment so that a final configuration could be selected for installation at DFW. The weather during the field test was partly cloudy with good visibility. An ACY airport diagram is shown in figure 2. Four separate configurations were tested using a total of 30 in-pavement light fixtures masked with tape to simulate an in-pavement installation. Configuration 1 simulated the current installation at DFW, which included one row of red lights installed parallel to the runway centerline, spaced 2 ft from the centerline, as depicted in figures 3 and 4. Fifteen in-pavement light fixtures were used for this configuration, placed 2 ft to the right side of the runway centerline lights, at 100-ft spacing down the runway. When configuration 1 was turned on, project personnel noted that the white runway centerline lights and the red THL lights blurred together and were not easily distinguishable from each other. A few project members with pilot certificates and flying experience noted that while the THLs were located at the beginning of the runway, the configuration appeared similar to the FAA-approved runway centerline configuration that indicates the last 3000 ft of usable runway. This configuration is further described in FAA AC 150/5340-30B. The configurations that were tested were limited to a total system length of 1400 ft, starting 375 ft from the runway threshold and ending 1775 ft from the runway threshold. This was due to the limited number of 30 THL fixtures available for the test. Project personnel agreed that this system length was more than sufficient for evaluation purposes. The final configuration length may be longer, depending on the sponsoring offices final decision.
10
Part Three—Location of Full-Scale Testing at ACY
Figure 2. Atlantic City International Airport Diagram
11
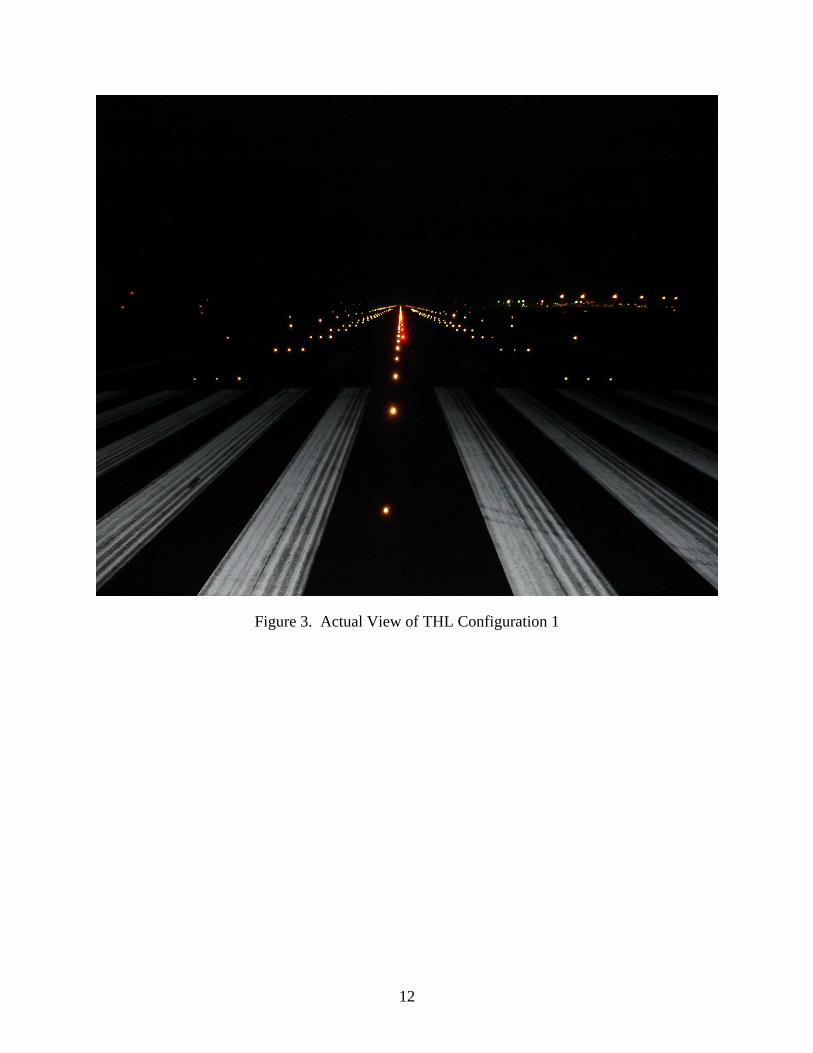
Figure 3. Actual View of THL Configuration 1
12
15 FAA Type L-850A fixtures with 105-watt lamps
Last fixture 1775 ft
from threshold
THL configuration is 1400 ft long
100-ft separation between THL fixtures
First fixture 375 ft
from threshold
2-ft separation between centerline
lights and THL fixture
Figure 4. Schematic of THL Configuration 1
In configuration 2, the lighting setup was changed from the one row of lights parallel to the runway centerline spaced 100 ft apart and 2 ft from the centerline on the right side, to two rows, one on each side of the centerline spaced 100 ft down the runway centerline, 2 ft from each side of the white centerline light fixtures, as shown in figures 5 and 6. Thirty light fixtures were used in this configuration, with 15 on each side of the centerline. Project personnel agreed that configuration 2 showed improved conspicuity over configuration 1; however, the lights still appeared to blur together and were not easily distinguishable from the white runway centerline lights.
13
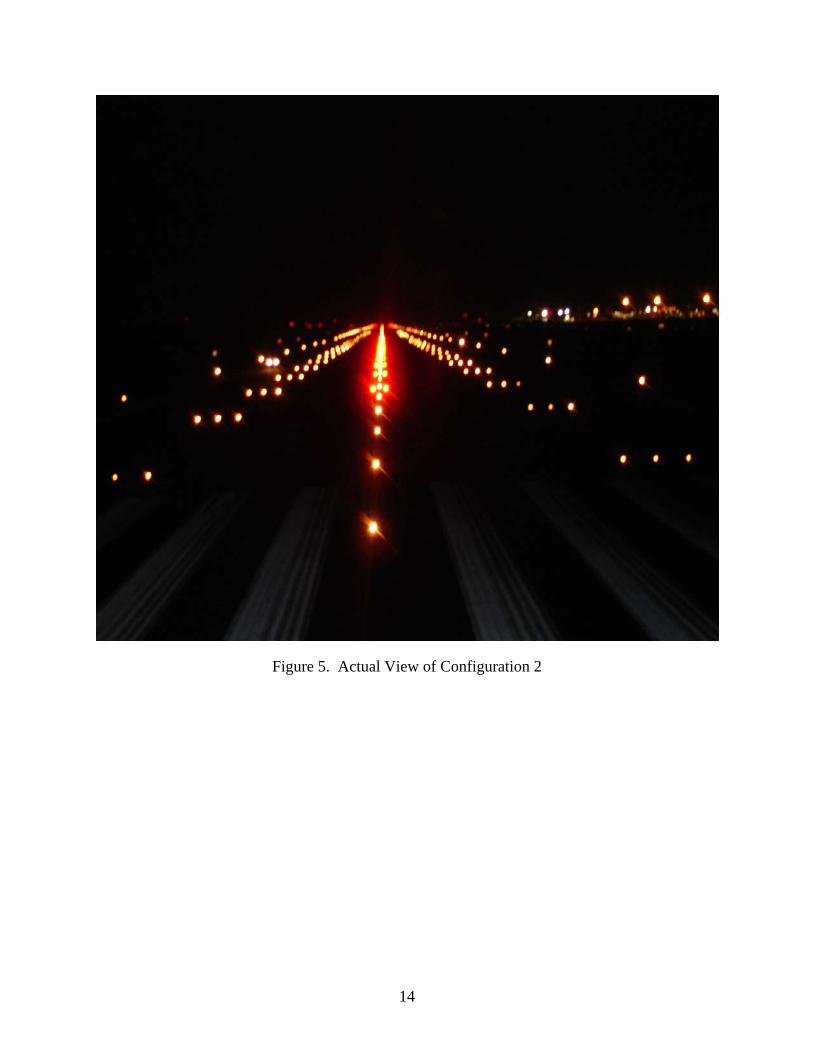
Figure 5. Actual View of Configuration 2
14

30 FAA Type L-850A fixtures with 105-watt lamps
Last fixture 1775 ft
from threshold
THL configuration is 1400 ft long
100-ft separation between THL fixtures
First fixture 375 ft
from threshold
2-ft separation between centerline
lights and THL fixture
Figure 6. Schematic of THL Configuration 2
Configuration 3 involved an increase in lateral spacing of the fixtures to a distance of 4 ft on each side of the runway centerline fixtures. Thirty light fixtures were used to create this configuration, placed alongside the centerline at 100-ft spacing, 15 fixtures on each side of the centerline, as depicted in figures 7 and 8. Project personnel concluded that configuration 3 was an improvement over configurations 1 and 2; however, the last fixtures of configuration 3 THLs (furthest away from observation point) tended to merge with the centerline, creating a potentially ambiguous situation for a pilot. Project personnel agreed that it would be best to eliminate any
15
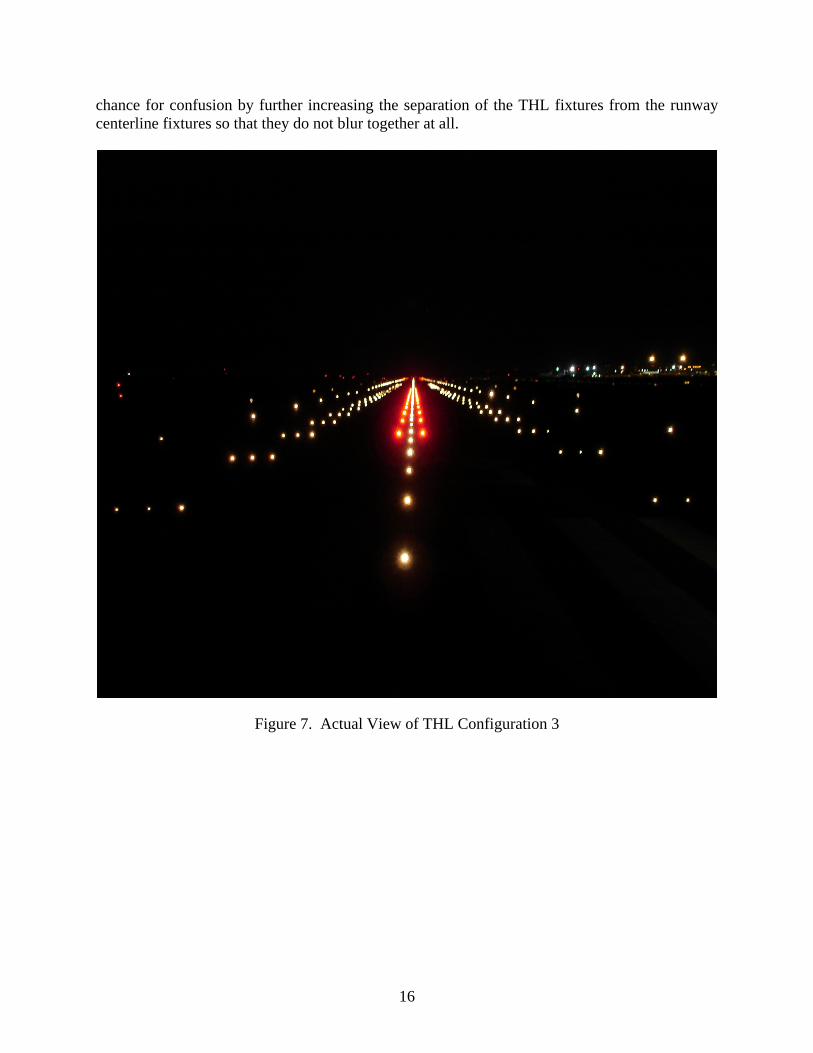
chance for confusion by further increasing the separation of the THL fixtures from the runway centerline fixtures so that they do not blur together at all.
Figure 7. Actual View of THL Configuration 3
16

30 FAA Type L-850A fixtures with 105-watt lamps
Last fixture 1775 ft
from threshold
THL configuration is 1400 ft long
100-ft separation between THL fixtures
First fixture 375 ft
from threshold
4-ft separation between centerline
lights and THL fixture
Figure 8. Schematic of THL Configuration 3
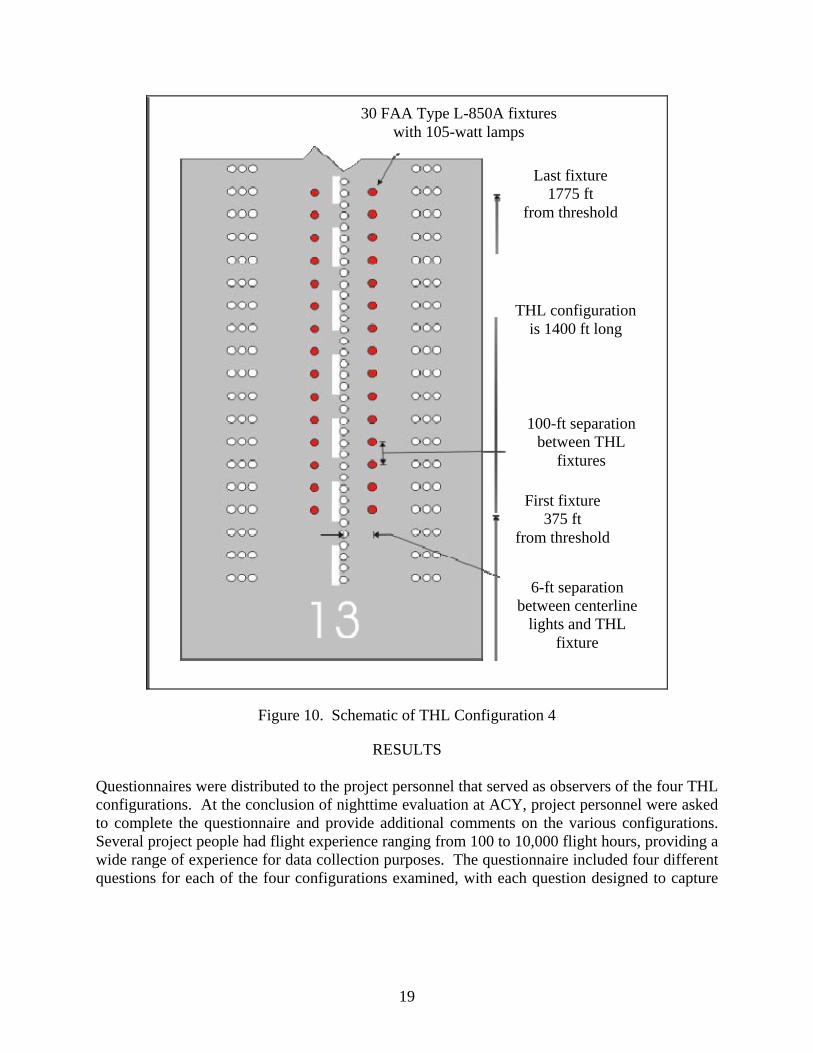
Configuration 4 involved an additional increase of the lateral distance of the fixtures to 6 ft on each side of the runway centerline. Thirty light fixtures were placed alongside the centerline, 15 fixtures on each side, at 6-ft lateral separation from the centerline fixtures, at 100-ft longitudinal spacing down the runway, as shown in figures 9 and 10. Project personnel agreed that configuration 4 provided the clearest visual representation and at no time did the red or white lights interfere, merge, or blend with one another.
17

Figure 9. Actual View of THL Configuration 4
18
30 FAA Type L-850A fixtures with 105-watt lamps
Last fixture 1775 ft
from threshold
THL configuration is 1400 ft long
100-ft separation between THL
fixtures
First fixture 375 ft
from threshold
6-ft separation between centerline
lights and THL fixture
Figure 10. Schematic of THL Configuration 4
RESULTS Questionnaires were distributed to the project personnel that served as observers of the four THL configurations. At the conclusion of nighttime evaluation at ACY, project personnel were asked to complete the questionnaire and provide additional comments on the various configurations. Several project people had flight experience ranging from 100 to 10,000 flight hours, providing a wide range of experience for data collection purposes. The questionnaire included four different questions for each of the four configurations examined, with each question designed to capture
19
various attributes of the THL configurations. The specific attributes evaluated during this study included: • Ease of detection of the illuminated THLs. • Ease of discrimination between the THLs and other airport lights. • Understanding that the THLs indicated the runway was unsafe for an aircraft to operate
on that particular runway. • Conveyance of meaning not to initiate the takeoff while the THLs were illuminated. The responses to the four questions were measured using a seven-point Likert scale where 1 implied “Totally Disagree” and 7 implied “Totally Agree.” Figure 11 shows a sample of the questionnaire that was completed by project personnel for each of the four lighting configurations.
20
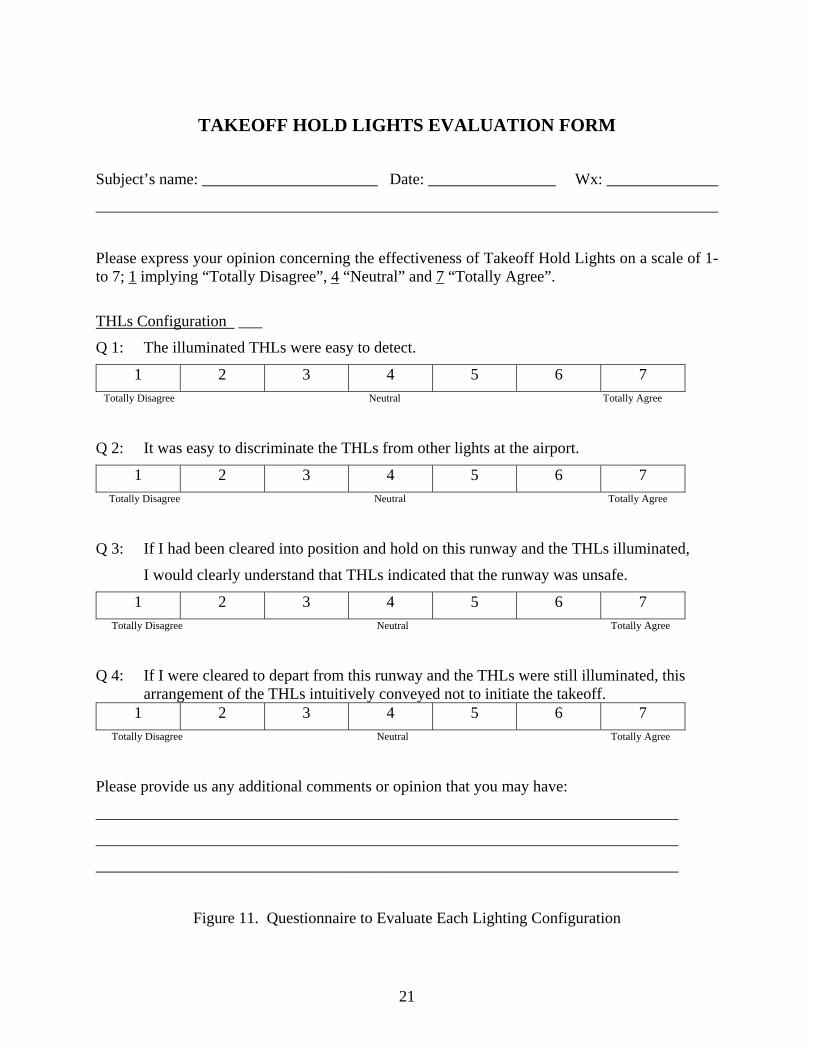
TAKEOFF HOLD LIGHTS EVALUATION FORM
Subject’s name: ______________________ Date: ________________ Wx: ______________
______________________________________________________________________________
Please express your opinion concerning the effectiveness of Takeoff Hold Lights on a scale of 1- to 7; 1 implying “Totally Disagree”, 4 “Neutral” and 7 “Totally Agree”.
THLs Configuration ___
Q 1: The illuminated THLs were easy to detect.
1 2 3 4 5 6 7 Totally Disagree Neutral Totally Agree
Q 2: It was easy to discriminate the THLs from other lights at the airport.
1 2 3 4 5 6 7 Totally Disagree Neutral Totally Agree
Q 3: If I had been cleared into position and hold on this runway and the THLs illuminated,
I would clearly understand that THLs indicated that the runway was unsafe.
1 2 3 4 5 6 7 Totally Disagree Neutral Totally Agree
Q 4: If I were cleared to depart from this runway and the THLs were still illuminated, this arrangement of the THLs intuitively conveyed not to initiate the takeoff.
1 2 3 4 5 6 7 Totally Disagree Neutral Totally Agree
Please provide us any additional comments or opinion that you may have:
_________________________________________________________________________
_________________________________________________________________________
_________________________________________________________________________
Figure 11. Questionnaire to Evaluate Each Lighting Configuration
21
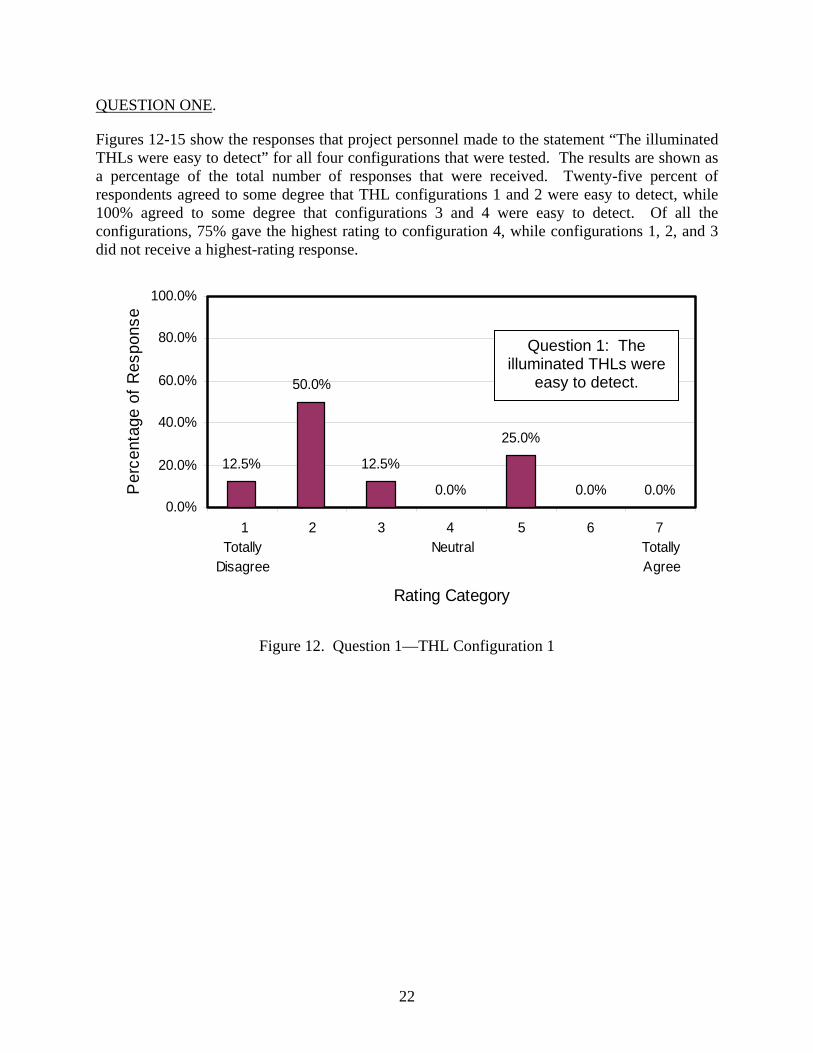
QUESTION ONE.
Figures 12-15 show the responses that project personnel made to the statement “The illuminated THLs were easy to detect” for all four configurations that were tested. The results are shown as a percentage of the total number of responses that were received. Twenty-five percent of respondents agreed to some degree that THL configurations 1 and 2 were easy to detect, while 100% agreed to some degree that configurations 3 and 4 were easy to detect. Of all the configurations, 75% gave the highest rating to configuration 4, while configurations 1, 2, and 3 did not receive a highest-rating response.
12.5%
50.0%
12.5%
0.0%
25.0%
0.0% 0.0%0.0%
20.0%
40.0%
60.0%
80.0%
100.0%
1 Totally
Disagree
2 3 4 Neutral
5 6 7 TotallyAgree
Rating Category
Per
cent
age
of R
espo
nse
Question 1: The illuminated THLs were
easy to detect.
Figure 12. Question 1—THL Configuration 1
22

0.0% 0.0%
62.5%
12.5%
25.0%
0.0% 0.0%0.0%
20.0%
40.0%
60.0%
80.0%
100.0%
1 Totally
Disagree
2 3 4 Neutral
5 6 7 TotallyAgree
Rating Category
Per
cent
age
of R
espo
nse
Question 1: The illuminated THLs were
easy to detect.
Figure 13. Question 1—THL Configuration 2
0% 0% 0% 0%
50% 50%
0%0%
20%
40%
60%
80%
100%
1 Totally
Disagree
2 3 4 Neutral
5 6 7 TotallyAgree
Rating Category
Per
cent
age
of R
espo
nse
Question 1: The illuminated THLs were
easy to detect.
Figure 14. Question 1—THL Configuration 3
23

0% 0% 0% 0% 0%
25%
75%
0%
20%
40%
60%
80%
100%
1 Totally
Disagree
2 3 4 Neutral
5 6 7 TotallyAgree
Rating Category
Per
cent
age
of R
espo
nse
Question 1: The illuminated THLs were
easy to detect.
Figure 15. Question 1—THL Configuration 4
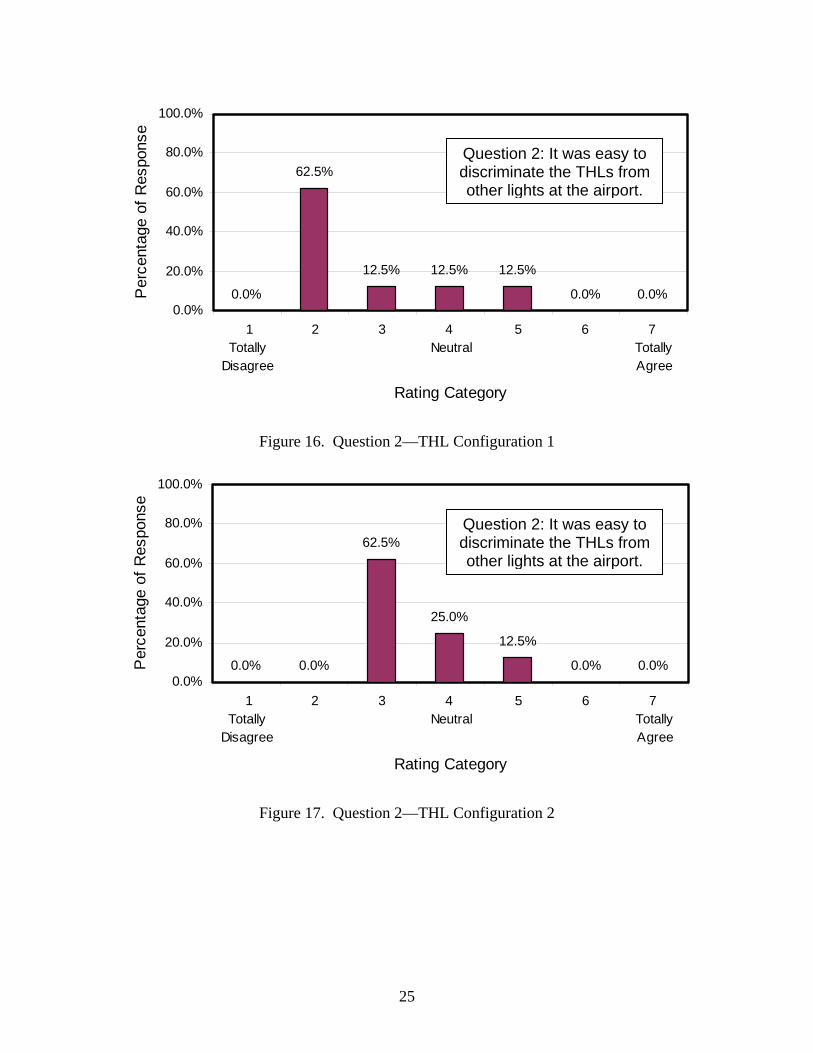
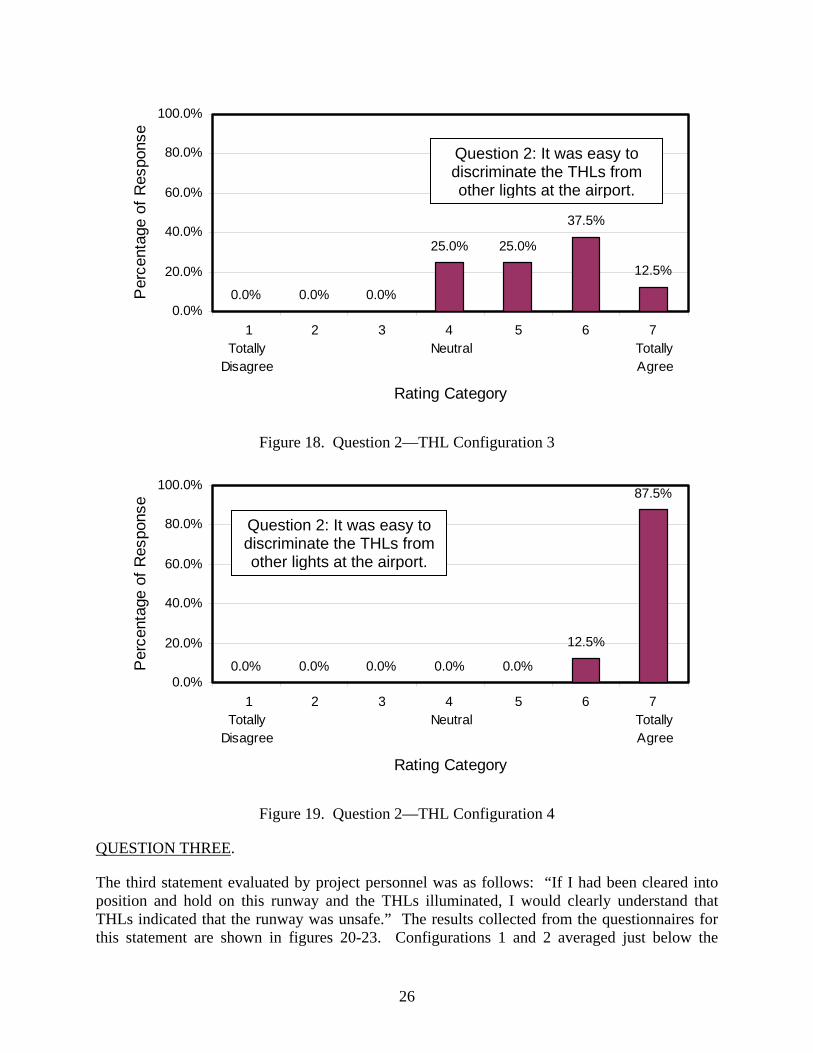
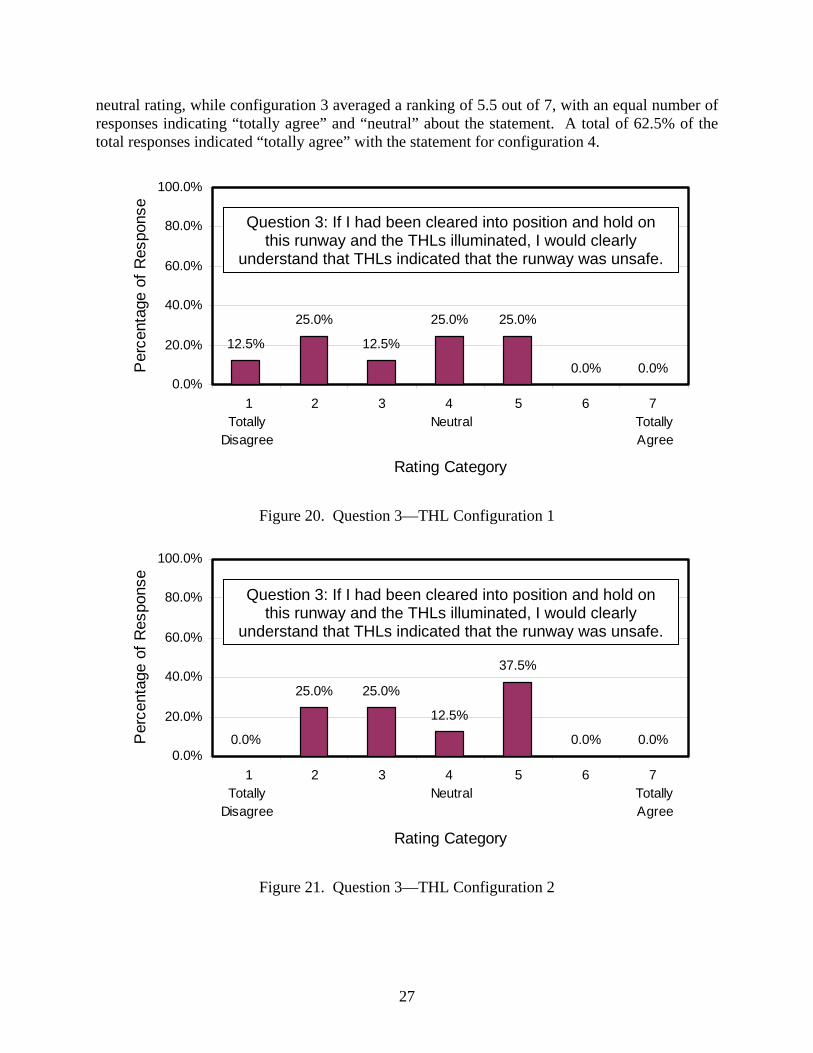
QUESTION TWO.
The second statement evaluated by project personnel was, “It was easy to discriminate the THLs from the other lights at the airport.” The results collected from question 2 on the questionnaire are shown in figures 16-19. The results showed that the “totally disagree” response was not chosen for any of the configurations regarding this statement. The results for configurations 1 and 2 were at or just below “neutral,” with no “totally agreed” or “totally disagree” responses given for this statement. The results were more positive for configurations 3 and 4, with 12.5% indicating “totally agree” with the statement for configuration 3 and 87.5% indicating that they “totally agree” with configuration 4.
24
0.0%
62.5%
12.5% 12.5% 12.5%
0.0% 0.0%0.0%
20.0%
40.0%
60.0%
80.0%
100.0%
1 Totally
Disagree
2 3 4 Neutral
5 6 7 TotallyAgree
Rating Category
Per
cent
age
of R
espo
nse
Question 2: It was easy to discriminate the THLs from other lights at the airport.
Figure 16. Question 2—THL Configuration 1
0.0% 0.0%
62.5%
25.0%
12.5%
0.0% 0.0%0.0%
20.0%
40.0%
60.0%
80.0%
100.0%
1 Totally
Disagree
2 3 4 Neutral
5 6 7 TotallyAgree
Rating Category
Per
cent
age
of R
espo
nse
Question 2: It was easy to discriminate the THLs from other lights at the airport.
Figure 17. Question 2—THL Configuration 2
25
0.0% 0.0% 0.0%
25.0% 25.0%
37.5%
12.5%
0.0%
20.0%
40.0%
60.0%
80.0%
100.0%
1 Totally
Disagree
2 3 4 Neutral
5 6 7 TotallyAgree
Rating Category
Per
cent
age
of R
espo
nse
Question 2: It was easy to discriminate the THLs from other lights at the airport.
Figure 18. Question 2—THL Configuration 3
0.0% 0.0% 0.0% 0.0% 0.0%
12.5%
87.5%
0.0%
20.0%
40.0%
60.0%
80.0%
100.0%
1 Totally
Disagree
2 3 4 Neutral
5 6 7 TotallyAgree
Rating Category
Per
cent
age
of R
espo
nse
Question 2: It was easy to discriminate the THLs from other lights at the airport.
Figure 19. Question 2—THL Configuration 4
QUESTION THREE.
The third statement evaluated by project personnel was as follows: “If I had been cleared into position and hold on this runway and the THLs illuminated, I would clearly understand that THLs indicated that the runway was unsafe.” The results collected from the questionnaires for this statement are shown in figures 20-23. Configurations 1 and 2 averaged just below the
26
neutral rating, while configuration 3 averaged a ranking of 5.5 out of 7, with an equal number of responses indicating “totally agree” and “neutral” about the statement. A total of 62.5% of the total responses indicated “totally agree” with the statement for configuration 4.
12.5%
25.0%
12.5%
25.0% 25.0%
0.0% 0.0%0.0%
20.0%
40.0%
60.0%
80.0%
100.0%
1 Totally
Disagree
2 3 4 Neutral
5 6 7 TotallyAgree
Rating Category
Per
cent
age
of R
espo
nse
Figure 20. Question 3—THL Configuration 1
0.0%
25.0% 25.0%
12.5%
37.5%
0.0% 0.0%0.0%
20.0%
40.0%
60.0%
80.0%
100.0%
1 Totally
Disagree
2 3 4 Neutral
5 6 7 TotallyAgree
Rating Category
Per
cent
age
of R
espo
nse
Question 3: If I had been cleared into position and hold on this runway and the THLs illuminated, I would clearly
understand that THLs indicated that the runway was unsafe.
Question 3: If I had been cleared into position and hold on this runway and the THLs illuminated, I would clearly
understand that THLs indicated that the runway was unsafe.
Figure 21. Question 3—THL Configuration 2
27

0.0% 0.0% 0.0%
12.5%
37.5% 37.5%
12.5%
0.0%
20.0%
40.0%
60.0%
80.0%
100.0%
1 Totally
Disagree
2 3 4 Neutral
5 6 7 TotallyAgree
Rating Category
Per
cent
age
of R
espo
nse
Question 3: If I had been cleared into position and hold on this runway and the THLs illuminated, I would clearly
understand that THLs indicated that the runway was unsafe.
Figure 22. Question 3—THL Configuration 3
0.0% 0.0% 0.0% 0.0% 0.0%
37.5%
62.5%
0.0%
20.0%
40.0%
60.0%
80.0%
100.0%
1 Totally
Disagree
2 3 4 Neutral
5 6 7 TotallyAgree
Rating Category
Per
cent
age
of R
espo
nse
Question 3: If I had been cleared into position and hold on this runway
and the THLs illuminated, I would clearly understand that THLs indicated that the runway was
unsafe.
Figure 23. Question 3—THL Configuration 4
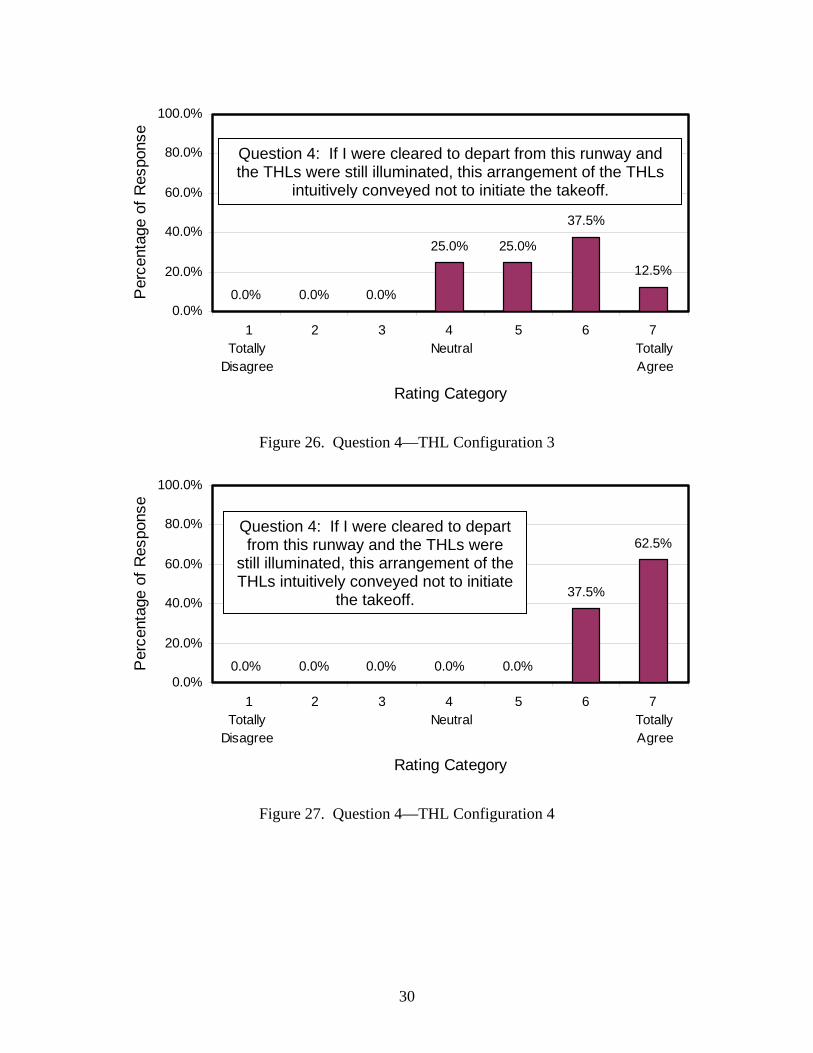
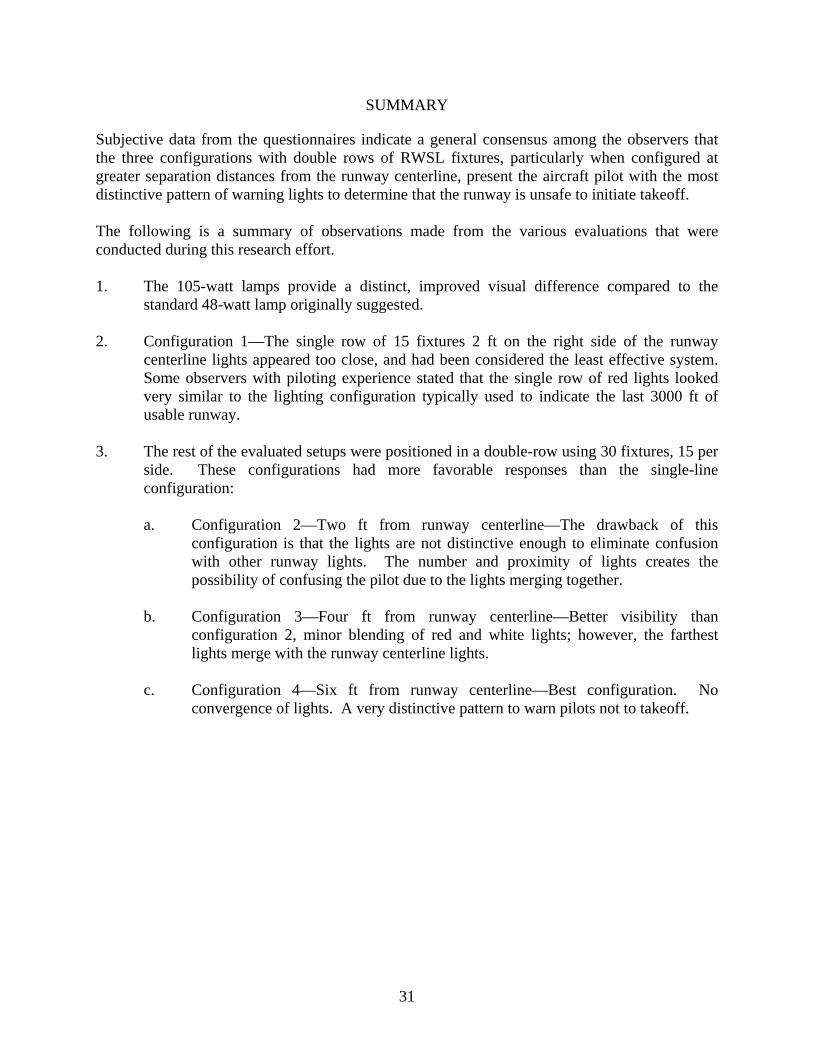
QUESTION FOUR.
The fourth and final statement on the questionnaire was, “If I were cleared to depart from this runway and the THLs were illuminated, this arrangement of the THLs intuitively conveyed not to initiate the takeoff.” The results taken from the questionnaires are summarized in figures 24-27. The data showed that 75% of the responses ranked configuration 1 lower than neutral,
28

while 50% ranked configuration 2 lower than neutral. Over 55% of the total responses were higher than neutral for configurations 3 and 4, with 62.5% giving configuration 4 the highest ranking possible. None of the responses indicated “totally disagree” with this statement for any of the configurations.
0%
50%
25%
0%
25%
0% 0%0%
20%
40%
60%
80%
100%
1 Totally
Disagree
2 3 4 Neutral
5 6 7 TotallyAgree
Rating Category
Per
cent
age
of R
espo
nse
Figure 24. Question 4—THL Configuration 1
0.0%
12.5%
37.5%
25.0% 25.0%
0.0% 0.0%0.0%
20.0%
40.0%
60.0%
80.0%
100.0%
1 Totally
Disagree
2 3 4 Neutral
5 6 7 TotallyAgree
Rating Category
Per
cent
age
of R
espo
nse
Question 4: If I were cleared to depart from this runway and the THLs were still illuminated, this arrangement of the THLs
intuitively conveyed not to initiate the takeoff.
Question 4: If I were cleared to depart from this runway and the THLs were still illuminated, this arrangement of the THLs
intuitively conveyed not to initiate the takeoff.
Figure 25. Question 4—THL Configuration 2
29
0.0% 0.0% 0.0%
25.0% 25.0%
37.5%
12.5%
0.0%
20.0%
40.0%
60.0%
80.0%
100.0%
1 Totally
Disagree
2 3 4 Neutral
5 6 7 TotallyAgree
Rating Category
Per
cent
age
of R
espo
nse
Question 4: If I were cleared to depart from this runway and the THLs were still illuminated, this arrangement of the THLs
intuitively conveyed not to initiate the takeoff.
Figure 26. Question 4—THL Configuration 3
0.0% 0.0% 0.0% 0.0% 0.0%
37.5%
62.5%
0.0%
20.0%
40.0%
60.0%
80.0%
100.0%
1 Totally
Disagree
2 3 4 Neutral
5 6 7 TotallyAgree
Rating Category
Per
cent
age
of R
espo
nse
Question 4: If I were cleared to depart from this runway and the THLs were
still illuminated, this arrangement of the THLs intuitively conveyed not to initiate
the takeoff.
Figure 27. Question 4—THL Configuration 4
30
SUMMARY
Subjective data from the questionnaires indicate a general consensus among the observers that the three configurations with double rows of RWSL fixtures, particularly when configured at greater separation distances from the runway centerline, present the aircraft pilot with the most distinctive pattern of warning lights to determine that the runway is unsafe to initiate takeoff. The following is a summary of observations made from the various evaluations that were conducted during this research effort. 1. The 105-watt lamps provide a distinct, improved visual difference compared to the
standard 48-watt lamp originally suggested. 2. Configuration 1—The single row of 15 fixtures 2 ft on the right side of the runway
centerline lights appeared too close, and had been considered the least effective system. Some observers with piloting experience stated that the single row of red lights looked very similar to the lighting configuration typically used to indicate the last 3000 ft of usable runway.
3. The rest of the evaluated setups were positioned in a double-row using 30 fixtures, 15 per
side. These configurations had more favorable responses than the single-line configuration:
a. Configuration 2—Two ft from runway centerline—The drawback of this
configuration is that the lights are not distinctive enough to eliminate confusion with other runway lights. The number and proximity of lights creates the possibility of confusing the pilot due to the lights merging together.
b. Configuration 3—Four ft from runway centerline—Better visibility than
configuration 2, minor blending of red and white lights; however, the farthest lights merge with the runway centerline lights.
c. Configuration 4—Six ft from runway centerline—Best configuration. No
convergence of lights. A very distinctive pattern to warn pilots not to takeoff.
31
32
CONCLUSIONS
Considering the data collected during this research effort, the following conclusions were made: • Of the four configurations evaluated, the most effective separation distance between the
takeoff hold light (THL) fixtures and the runway centerline fixtures was 6 ft apart. Visual separation of the individual rows of fixtures did not occur until approximately 4 ft. However, a total separation of 6 ft from the runway centerline, as used in configuration 4, was necessary for observers to be able to determine that the double-row of THLs were separate from the runway centerline fixtures.
• The results of the photometric tests showed that the THLs, as proposed in configurations
1 through 4, would
- be visible during Category II criteria. - be visible during Category IIIA criteria, provided the first THL fixtures are placed
175 to 225 ft from the runway threshold.
- not be visible during the lower limits of Category IIIB or IIIC criteria. • Analysis of landing gear width for small general aviation aircraft and large air carrier
aircraft would not be affected by any of the four THL configurations. It was determined that regional jet type aircraft may have to make small adjustments to the left or right of the centerline to avoid running over the THL fixtures with their main gear wheels in configurations 3 and 4.
Configuration 4 was the most effective configuration evaluated. The lateral offset spacing of 6 ft from the runway centerline created very distinct lines that at no time blended with the runway centerline fixtures. As a result, this created a more conspicuous signal that was easily acquired by the pilots using the RWSL System. Using double-row THLs was a significant improvement to the THL system.