running head: predictors of school violence … · david rutkowski is an assistant professor in the...
TRANSCRIPT

Running Head: PREDICTORS OF SCHOOL VIOLENCE INTERNATIONALLY 1
Predictors of School Violence Internationally: The Importance of Immigrant Status and
Other Factors
Authors
David Rutkowski, Indiana University (Corresponding Author)
Leslie Rutkowski, Indiana University
Justin Wild, Indiana University
Biographical note
David Rutkowski is an assistant professor in the Department of Educational Leadership and Policy Studies
at Indiana University, Bloomington. His research is focused in the area of immigrant students, evaluation,
and international large-scale assessment. His interests include the work of international organizations,
how immigrant students operate within schools systems and the production and use of educational
evaluations around the world. Address: 201 N. Rose Ave, Bloomington, IN, 47401, USA; e-mail:
Leslie Rutkowski is an assistant professor of inquiry methodology in the Department of Counseling and
Educational Psychology at Indiana University, Bloomington. Her research is focused in the area of
international large-scale assessment from both methodological and applied perspectives. Her interests
include the impact of background questionnaires on assessment results and examining methods for
comparing heterogeneous populations in international surveys. Address: 201 N. Rose Ave, Bloomington,
IN, 47401, USA; e-mail: [email protected].
Justin Wild is a graduate student pursuing a doctor of philosophy in Education Policy Studies at Indiana
University, Bloomington with a concentration in Comparative and International Education. His research
interests include cross-cultural issues, language of instruction, pedagogy, minority students, and
evaluation in education. Address: 201 N. Rose Ave, Bloomington, IN, 47401, USA; e-mail:
Key Words
Immigrant Students, Violence, TIMSS, School Attachment

PREDICTORS OF SCHOOL VIOLENCE INTERNATIONALLY 2
Abstract
Recent studies have documented differences in achievement between immigrant and native-born
students (Peguero, 2009; Suárez-Orozco, Bang & Onaga, 2010). Further, research has identified
differential impacts of school violence for immigrant students on achievement and that
immigrant students experience more school violence than their native born peers (Rutkowski,
Rutkowski & Engel, 2013); however, the literature is less clear regarding what other factors can
explain differences in violent experiences. The current paper takes up this discussion and uses
TIMSS 2011 data and a multilevel zero-inflated Poisson regression model to examine the
relationship between immigrant status and school violence after controlling for a number of
theoretically important factors. Findings point to the importance of school attachment, sex, and
achievement as explanatory variables. And, ceteris paribus, the effect of immigration remains in
a number of countries after controlling for school and student factors. We discuss our findings as
they relate to international educational policy.
PREDICTORS OF SCHOOL VIOLENCE INTERNATIONALLY 3
Introduction
From conversations about immigration policy in the U.S. to the effects of a rapidly
changing European demographic, international policy discussions around the impacts of
immigration abound. National narratives often focus on the impacts of high levels of
immigration to the labor market, health care, and public safety. Also important to these
discussions are issues around educating students with an immigration background and the ways
in which populations of students are impacted by demographic changes. To that end, a body of
research suggests that, in many countries, immigrant students tend to underperform on academic
achievement assessments when compared to their native born peers (Garcia-Reid, Reid, &
Peterson, 2005; Peguero, 2009; Rutkowski, Rutkowski, & Engel, 2013; Suárez-Orozco, Bang, &
Onaga, 2010). The exact reasons why immigrant students perform lower than non-immigrant
students is not well understood; however, research in this area provides some explanation for
these differences. For example, a number of studies point to language (see Buka, Stichick,
Birdthistle, & Earls, 2001; Kataoka et al., 2009; Liebkind & Jasinskaja-Lahti, 2000; Qin, Way, &
Rana, 2008), cultural differences (see Suárez-Orozco, Pimentel, & Martin, 2009; Suárez-Orozco,
Rhodes, & Milburn, 2009), or lower socio-economic status (see Akiba, 2008; Fuligni, 1997;
Reardon & Galindo, 2009). Another important, yet less researched, explanation for poor
immigrant performance concerns the issue of violence and victimization. For example,
Rutkowski et al. (2013), have found that immigrant students tend to experience higher levels of
violence than native-born students and, when compared to their non-immigrant peers, immigrant
students also exhibit a larger negative effect of violence on educational achievement. In spite of
this finding, there is little empirical evidence to support other correlates of violence for this
international sample. As such, it is important to understand whether higher levels of violent

PREDICTORS OF SCHOOL VIOLENCE INTERNATIONALLY 4
experiences among immigrant students and violent experiences in general within schools can be
explained by other factors. Given that most educational systems are focused on equality and the
success of all students (at least rhetorically), understanding correlates of low achievement and
violence, particularly among vulnerable populations, is important. To that end, the current study
seeks to examine whether an effect for immigrant status remains after accounting for other well-
established predictors of violence in an international context.
Studies have repeatedly shown the negative effects of violence on the psychological and
emotional well-being and overall health of young people (e.g. Bowen & Bowen, 1999; Cooley-
Quille, Turner, & Beidel, 1995; Sampson, Raudenbush, & Earls, 1997). Exposure to violence is
associated with “symptoms of anxiety, depression, and aggressive behaviors” (Osofsky, 1999, p.
37) and developmental problems (Gorman–Smith & Tolan, 1998) in children and adolescents.
The psychological impacts of violence have also been shown to affect test-taking abilities in an
otherwise healthy, young adult sample (Rutkowski, Gonzalez, Joncas, & von Davier, 2010).
Relying on Rutkowski et al. (2013) and Akiba et al. (2002), we view school violence as an
international phenomena that has negative consequences for most students. Similar to Rutkowski
et al. (2013) we draw on a comprehensive definition of violence as including verbal,
psychological, physical, and emotional aggression and abuse, and we understand violence to
exist both on large and small scales in societies or communities (Davies, 2003; Olweus, 1994).
School violence then can be seen as any behavior “intended to harm, physically or emotionally,
persons in school and their property” (Benbenishty & Astor, 2005, p. 8) or more broadly “any
conditions or acts that create a climate in which individual students and teachers feel fear or
intimidation in addition to being the victims of assault, theft, or vandalism” (Batsche & Knoff,
1994, p. 165). These definitions align with the US Centers for Disease Control and Prevention’s
PREDICTORS OF SCHOOL VIOLENCE INTERNATIONALLY 5
(2011) definition of school violence, which is “the intentional use of physical force or power,
against another person, group, or community, with the behavior likely to cause physical or
psychological harm” (para. 2). Examples of such violence include bullying, fighting, use of
weapons, electronic aggression, and gang violence. Of these examples, narrowly defining
bullying proves difficult. For example, Swearer, Espelage, Vaillancourt, and Hymel (2010)
comment that the “lack of consensus regarding how to define bullying continues” however, they
state: “most agree that bullying describes intentionally harmful, aggressive behavior that is
repetitive in nature and in which there is a power differential between the aggressor and victim”
(p. 41). As such, we understand bullying as one sub-set of behaviors that falls under the broader
concept of school violence.
Research question.
Given the deleterious effects of violence on achievement (see Akiba & Han, 2007; Akiba
et al., 2002; Engel, Rutkowski, & Rutkowski, 2009; Ma, Phelps, Lerner, & Lerner, 2009), higher
rates of exposure to school violence for immigrant students (see Eslea & Mukhtar, 2000;
Fandrem, Ertesvåg, Strohmeier, & Roland, 2010; Graham & Juvonen, 2002; Peguero, 2009;
Strohmeier & Spiel, 2003; Suárez-Orozco et al., 2010; Verkuyten & Thijs, 2002), and the
differential impact of violence on achievement for immigrant populations (see Fandrem,
Strohmeier, & Roland, 2009; Graham & Juvonen, 2002; Peguero, 2008; Rutkowski et al., 2013;
Strohmeier & Spiel, 2003; Suárez-Orozco et al., 2010), we examine several factors associated
with violent experiences in school internationally. Further, we test whether immigrant status of
the student continues to account for differences in violent experiences internationally after
controlling for these factors. In other words, based on existing research of violence in schools,
using grade eight Trends in International Mathematics and Science Study (TIMSS) 2011 data

PREDICTORS OF SCHOOL VIOLENCE INTERNATIONALLY 6
and a multilevel modeling approach, we explore the following research question: After
controlling for a number of established predictors of violence, do immigrant students continue to
report different levels of violence than their native born peers in an internationally representative
sample? By controlling for important and possibly confounding variables, we are better able to
estimate differences in violent experiences for immigrant students internationally.
Review of the Literature
In order to determine an appropriate model for our research interest, we examined
existing literature for theoretically relevant predictors of student violent victimization in schools.
Several key studies informed the process of our literature review. First, Motoko Akiba has
produced multiple studies focused on predictors of school violence across several countries using
TIMSS (Akiba et al., 2002; Akiba, 2008) and PISA (Akiba, 2010). Another study that guided our
review was Rutkowski, Rutkowski, and Engel (2013), who also used multilevel models and
TIMSS results to examine school violence and its particular effects on immigrant students and
achievement. Next, a broader literature review of school violence, student victimization, and
immigrants and schools was examined to determine additional predictors.
We recognize the construct of violence may be measured as experience of violence or
fear of violence. While our study will use experience of violence, Akiba (2008) notes that fear of
violence is a valid construct for studies linking violence and achievement: “Students’ fear of
being victimized by school violence affects their school attendance, learning motivation, and
academic achievement” (p. 52). Therefore, when selecting the predictors for our model we
reviewed literature that used either experience or fear of violence in the study.
Violence in schools.
PREDICTORS OF SCHOOL VIOLENCE INTERNATIONALLY 7
Previous research has shown that student demographic factors, such as age, sex, and
socioeconomic status (SES), are important predictors of school violence and victimization (see
Akiba, 2008; Astor et al., 2002; Hong & Espelage, 2012). Specifically, a number of studies have
shown that age contributes to the type of violence students experience at school (see Astor et al.,
2002; Louw & Louw, 2007; Strawhacker, 2002; Sullivan, Cleary, & Sullivan, 2003), and that
younger students act out their aggression more often than older students (see O’Keefe, 1997;
Wilson, Bovet, Viswanathan, & Suris, 2012). Sex of the student has also been shown to predict
violence victimization (see Astor et al., 2002; Eisenberg, Neumark-Sztainer, & Perry, 2009;
Gottfredson, Gottfredson, Payne, & Gottfredson, 2005; Juvonen, Graham, & Schuster, 2003; Ma,
2001; Marachi, Astor, & Benbenishty, 2007; O’Keefe, 1997; Peguero, 2009; Verkuyten & Thijs,
2002; Vervoort, Scholte, & Overbeek, 2010) and the types of school violence students
experienced. Further, studies have shown that boys tend to experience physical victimization
while girls are more likely to experience verbal threats and social exclusion (see Hong &
Espelage, 2012; Owens, Slee, & Shute, 2001; Smith et al., 1999).
Similar to Akiba (2008), we note an inconsistency in the literature regarding the effect of
SES in school violence victimization. For example, Wilson et al. (2012) found that SES was not
significant in a study of bullying in sub-Saharan Africa; however, this study only measured SES
as a binary variable: economic deprivation – yes or no. Chen and Astor (2010) also found that
family SES was non-significant in their study of school violence in Taiwan. Using a more
nuanced composite measure, Akiba (2008) found that high SES was significant in 8 of 33
countries while low SES was predictive in one country (see also Due et al., 2009). Mouttapa et
al. (2004) found that SES was significant only for female Latino and Asian students in Southern
California. In the Midwest, Eisenberg et al. (2009) found SES non-significant overall; however,
PREDICTORS OF SCHOOL VIOLENCE INTERNATIONALLY 8
it was a significant predictor of certain types of violence. In Israel, Khoury-Kassabri,
Benbenishty, Astor, and Zeira (2004) found that SES significantly predicted all types of violence
victimization considered in their study.
Beyond demographic considerations, academic achievement consistently correlates with
violence in schools (see Akiba, 2008, 2010; Kochenderfer & Ladd, 1996; O’Moore & Kirkham,
2001; Peguero, 2009; Suárez-Orozco, Pimentel, et al., 2009). In particular, studies have shown
that higher achievement is associated with lower reports of violence (Thijs & Verkuyten, 2008)
and that violence victimization leads to mediating factors, such as absenteeism (Buhs, Ladd, &
Herald, 2006) loneliness, depression, or low self-worth (Juvonen, Nishina, & Graham, 2000),
which in turn lead to poor achievement. In contrast, Eisenberg et al. (2009) suggest that high and
low achieving students report similar levels of victimization, while mid-achieving students report
the least victimization (see also Hong & Espelage, 2012; Qin et al., 2008).
Predictors of school violence can also be found in research on student mental health (see
Astor, Benbenishty, Vinokur, & Zeira, 2006; Jaycox et al., 2002; Juvonen et al., 2003; Warner,
Weist, & Krulak, 1999; Williams & Veeh, 2012), where self-esteem is an important predictor
(see Haynie et al., 2001; Juvonen et al., 2000; O’Moore & Kirkham, 2001). Specifically, Sharp
(1996) found that while students reporting low self-esteem were as likely to be victims of school
violence as their high self-esteemed peers, their response to violence encouraged further
victimization (see also Smokowski & Kopasz, 2005). Studies of bullying in Europe (Olweus,
2006), Britain (Boulton & Smith, 2011), and Australia (Slee & Rigby, 1993) confirm this
finding.
Research on parental involvement and school violence was a variable considered apart
from Akiba's (2008, 2010) or Rutkowski et al.’s (2013) lines of research, with mixed findings.

PREDICTORS OF SCHOOL VIOLENCE INTERNATIONALLY 9
Ma (2001) mentions that parental involvement in school is often thought to combat the presence
of school violence, yet in his study of schools in Canada, parental involvement was not a
significant predictor of school violence (see also Herrero, Estévez, & Musitu, 2006; Wilson et
al., 2012). Reingle, Maldonado-Molina, Jennings, and Komro (2012), however, found that
parental involvement protected against aggressive behavior of Hispanic youth in Chicago.
Haynie et al. (2001) found a small negative effect for high levels of parental involvement on
school violence. The author theorized that parental involvement may be associated with other
variables thought to buffer against violence including social competence and peer choice. In
contrast, high-level parental involvement was associated with greater levels of violence
victimization (e.g. Nansel & Overpeck, 2001; Olweus, 2006). Similarly, Ladd and Ladd (1998)
found that intrusive and controlling parental behavior led to greater incidence of violence in
school (see also Batsche & Knoff, 1994; Veenstra et al., 2005), theorizing that overbearing
parents limited victimized students’ control over their own social lives, which led to increased
violence.
In addition to student factors, schools and teachers may create environments that
encourage or discourage school violence. Barnes, Brynard, and de Wet (2012) studied the
relationship between school violence and school climate in South Africa, where school climate
refers to students’ and teachers’ perceptions of “safety, teaching and learning, relations and the
environment” (p. 210). Similar to Akiba (2010), better student support and school attachment
were predictive of lower levels of violence. In a study of U.S. schools., Crosnoe, Johnson, and
Elder (2004) found that student support protected against disciplinary problems; however, the
relationship depended on gender and ethnicity. In contrast, Akiba's (2010) U.S. study found no
significant relationship between student support and fear of violence.

PREDICTORS OF SCHOOL VIOLENCE INTERNATIONALLY 10
Evidence shows that school attachment, or a strong sense of school community, is
associated with less school violence (see Barnes et al., 2012; Bryk & Driscoll, 1998; Hong &
Espelage, 2012; Jenkins, 1997; Stewart, 2003), especially after controlling for age, ethnicity, sex,
and school SES (Battistich & Hom, 1997). Similar findings emerged in a U.S. study (Payne,
Gottfredson, & Gottfredson, 2003). Akiba's (2010) also found that students reporting a strong
sense of belonging reported less fear of school violence. Measuring school violence directly,
Eisenberg et al. (2009) found that students reporting more harassment by peers also reported
enjoying school less. Finally, Furlong and Chung (1995) found that multi-victim students
consistently reported lower feelings of belonging in school.
Several studies found that weaker relationships between teachers and students lead to
more school violence (Khoury-Kassabri, Benbenishty, & Astor, 2005; Khoury-Kassabri et al.,
2004; Marachi et al., 2007). This finding was further supported by Akiba (2010), who found that
reports of strong teacher-student relationships were associated with less fear of school violence.
And Furlong and Chung (1995) found that students who were not victimized reported that they
felt comfortable talking to a larger number of teachers than students who were victimized.
Regarding school administration, Gottfredson et al. (2005) found students reported less
violence in schools in which rules were perceived to be fair and clear (see also Khoury-Kassabri
et al., 2004). Ma (2001) also found that fair and clear discipline policies discouraged bullying in
schools. Regarding minority populations, Ruck and Wortley (2002) found that the
implementation of a school’s discipline policy was an important predictor of fear of violence. In
particular, minority students who felt targeted by administration and teachers to receive
disciplinary action reported higher levels of fear of violence.

PREDICTORS OF SCHOOL VIOLENCE INTERNATIONALLY 11
Another important school-level predictor of school violence is school size, yet findings
are mixed. For example, Barnes et al. (2012) identified smaller schools as more violent in a
region of South Africa, while several other studies revealed higher levels of violence in larger
schools in other settings (Gottfredson & Gottfredson, 1985; Ma, 2001; Stewart, 2003; Warner et
al., 1999). In a more recent study in the U.S., Gottfredson et al. (2005) pointed to a possible
interaction between school size and urbanicity. In particular, larger schools in urban areas were
found to be no more violent at the middle school level and less violent at the high school level
than their suburban and rural counterparts. The authors suggested that delinquent youth often
drop out of school by the high school level in urban contexts, resulting in less reported school
violence. Urbanicity was not predictive of student fear of violence in most of the 33 countries
researched by Akiba (2008) or in her study of U.S. schools (Akiba, 2010).
Immigrant students.
Although predictors of school violence in immigrant populations are similar to those
identified above, two additional predictors emerge as important: immigrant status and host
country language proficiency. Examining immigrant status in The Netherlands, Verkuyten and
Thijs (2002) found that ethnic minorities suffer more verbal abuse and exclusion in schools,
while Eisenberg et al. (2009) found that ethnic minorities experience more of all types of peer
harassment measured in their study (see also Espelage & Swearer, 2003; Hong & Espelage,
2012; Marachi et al., 2007; Mouttapa et al., 2004). The authors also found that sex of the student
played a role in how immigrants experienced school violence, with boys being more likely than
girls to experience victimization because of their race/ethnicity. Yet the role of immigrant status
is more complicated. Peguero (2009) found that the generational status of immigrants (e.g. first-
vs. second-generation) mattered when predicting school violence (see also Qin et al., 2008).

PREDICTORS OF SCHOOL VIOLENCE INTERNATIONALLY 12
Similarly, Rutkowski et al. (2013) found that the effect of violence victimization on achievement
differed across generational status depending on the contexts found within different countries.
A review of the literature provides inconsistent results regarding host country language
proficiency and school violence. For example, evidence from certain studies indicates that
increased use of the host-country language resulted in higher levels of either violence exposure
(Kataoka et al., 2009) or discrimination (Liebkind & Jasinskaja-Lahti, 2000) among students or
adolescent youth, respectively. Alternatively, Qin et al.'s (2008) study of Chinese students in the
U.S. found that less proficiency in the native language led to greater discrimination and
harassment.
The literature on school violence and how it pertains to immigrant students provided a
number of theoretically important variables for the current study. We now discuss the data and
the models used answer our research question regarding important predictors of school violence
and whether immigrant status predicts differences in school violence.
Methods
Data.
TIMSS 2011 is the fifth in a continuing cycle of curriculum-based international
assessments in mathematics and science that is administered every four years. The target
population of TIMSS is all students at the end of fourth and eighth grades in participating
educational systems. In addition to assessing mathematics and science achievement of fourth and
eighth graders internationally, TIMSS also collects background data from students, teachers, and
principals of participating schools. The target population of interest is formally defined as the
grade that represents eight years of schooling, counting from the first year of primary education
(Mullis, Martin, Ruddock, O’Sullivan, & Preuschoff, 2009). In 2011, 42 national educational

PREDICTORS OF SCHOOL VIOLENCE INTERNATIONALLY 13
systems participated at eighth grade (Foy, Arora, & Stanco, 2013). For the current study we
consider only 41 systems as Israel did not administer a school violence scale. Descriptive
statistics of the student- and school-level variables can be found in Tables 1 and 2, respectively.
Notable in Table 1 is the variation in counts of violence across countries – from an average of
1.23 in Armenia to 5.75 in Ghana. Further, there is meaningful variation in terms of the
distribution of native and immigrant students. For example, 99 percent of Romanian students
report being native born, while just 37 percent of student in Qatar report that they and their
parents were born in Qatar.
TIMSS 2011 primarily used a two-stage stratified sample design. The first stage
consisted of a sample of schools (in most educational systems about 150), which may have been
stratified on variables of interest, such as geographic location. The second stage consisted of a
sample of one or more classrooms from the target grade in sampled schools. All of the students
in the sampled class(es) were selected to participate in the TIMSS testing (Joncas & Foy, 2012).
Measures.
We used TIMSS 2011 mathematics achievement scores along with student and principal
background questionnaire responses for 41 educational systems. We discuss the selected
variables at each level subsequently.
Student measures.
To answer our research question, we chose from the student questionnaire a set of items
related to our definition of school violence. Five items comprise this scale and the scale stem
asks “During this year, how often have any of the following things happened to you at school?”
The individual items include (1) “I was made fun of or called names;” (2) “I was left out of
games or activities by other students.” (3) “Someone spread lies about me; (4) “I was hit or hurt

PREDICTORS OF SCHOOL VIOLENCE INTERNATIONALLY 14
by other students(s) (e.g. shoving, hitting, kicking);” (5) “I was made to do things I didn’t want
to do by other students;” Students responded to one of four options: “at least once a week”;
“once or twice a month”; “a few times a year”; and “never.” These items were summed to
create a scale from zero (all items were ticked “never”) to 15 (all items were ticked “at least
once a week.” The reliability of this scale in the TIMSS international sample, as measured by
Guttman’s was acceptable ( ). We discuss the distribution of this scale in the Analytic
Methods section.
As a proxy for socioeconomic status, we used the home educational resources scale
provided in the TIMSS international database. This composite variable is a weighted likelihood
estimate of an underlying latent variable that results from applying an item response theory
model to three individual items. The variables that comprise this scale include student responses
to questions about the number of books in the home, whether the student has an internet
connection or their own room, and the highest education level of two parents. According to the
technical documentation, this scale’s reliability, as measured by Cronbach’s , ranged from .38
in Norway to .62 in Iran. We note this low reliability as a limitation. As a measure of perceived
support, we used one item that asks students how much they agree with the following statement:
“My teacher thinks I can do well in mathematics classes with difficult materials.” Responses
options were coded from 0 (Disagree a lot) to 3 (Agree a lot). As a measure of school
attachment, we used the average of two variables that asked students how much they agree that
(1) they like being in school; and (2) they feel like they belong at this school. This short scale
had an estimated international reliability, = .63. As a measure of the degree to which students
have good relationships with their teachers, we used the first principal component score from the
following items that ask students how much they agree that: (1) “I know what my teacher expects
PREDICTORS OF SCHOOL VIOLENCE INTERNATIONALLY 15
me to do”; (2) “My teacher is easy to understand”; (3) “I am interested in what my teacher
says”; and (4) “My teacher gives me interesting things to do.” All items loaded highly (F > 0.30)
on one component and the reliability of this scale in this sample, as measured by Cronbach’s
was acceptable ( ). As a measure of student perception of parental involvement we used
the first principal component score from the following items that ask students how frequently (1)
parents ask what the student is learning in school; (2) the student talks with his/her parents about
schoolwork; (3) parents make sure the student sets aside time for homework; (4) parents check
that homework is complete. All items loaded highly (F > 0.30) on one component and the
reliability of this scale in this sample, as measured by Cronbach’s was acceptable ( ).
As a measure of achievement, we used the mathematics achievement scores provided in the
international database. We also included measures of immigrant status of the student. In
particular, if the student and both parents were born in the country of the test, we considered the
student to be native. If the child was born in the country of the test but at least one parent was
born abroad, we considered the student to be a child of an immigrant. If the child was born
abroad, we considered that child to be foreign born. For students who were born abroad, we also
included when the child immigrated to the country of the test. This variable was coded such that
0 = did not immigrate; 1 = older than 10 years; 2 = 5 to 10 years; and 3 = under 5 years. To
further understand the effect of having an immigration background, we included a single item
that asked how often the student spoke the language of the test at home, where 0 = never to 3 =
always. Finally, we included the student’s sex such that 1=male and 0=female.
School measures.
At the school level, we selected several variables related to the research question. As a
measure of the discipline policy of the school, we used the first principal component scores for
PREDICTORS OF SCHOOL VIOLENCE INTERNATIONALLY 16
the following five items: the frequency (1) that the school informs parents about school rules; (2)
that the school discusses parent’s concerns about the school organization including rules; how
much time the principal has spent in the last year (3) that the principal spends time keeping an
orderly atmosphere in the school; (4) ensuring that there are clear rules for student behavior; and
(5) addressing disruptive student behavior. All items loaded highly (F > 0.30) on one component
with the exception of item (1), which had a loading of .22. The reliability of this scale in the
TIMSS sample, as measured by Cronbach’s was marginally acceptable ( ). As a proxy
for the student body’s attachment to the school, we used the average of the following two items:
(1) how the principal would characterize students’ regard for school property; and (2) students’
desire to do well in school. This short scale had an international reliability estimate of
and was regarded as acceptable. We also used the principal’s report of the total enrollment of
students in the school as a measure of school size. To capture the urbanicity of the school, we
included a variable that asked the principal about the population density of the immediate area in
which the school was located. This item was coded such that 1 = urban; 2 = suburban; 3 =
medium size city or large town; 4 = small town; 5 = rural. Urbanicity was not measured in
Norway or Singapore and is not included in those models. As a second measure of parental
involvement, we included the average of two variables: how the principal would characterize (1)
parental support for student achievement; and (2) parental involvement in school activities. This
two-item scale had an international reliability estimate of and was regarded as
acceptable.
Analytic methods.
Given the inherent multilevel structure of the data (students nested in classes, classes
nested in schools, schools nested in countries), a multilevel approach was clearly warranted.
PREDICTORS OF SCHOOL VIOLENCE INTERNATIONALLY 17
Further, the nature of the school violence scale (frequency of occurrence) resulted in a non-
normal distribution. Rather, the data more closely followed a Poisson distribution, which is
sensible if we assume that the scale roughly represents counts of violent experience. Finally, the
occurrence of violence in schools is, fortunately, a relatively rare occurrence, leading to more
zeros than we would normally expect in a Poisson distribution. Figure 1 is a histogram of the
violence scale with a normal density overlaid. Assuming a Poisson distribution with an overall
empirical mean of 3.20 ( ) and , we would normally expect that the
number of zeros is (Lambert, 1992). Instead, we observed 56,120
zeros. As such, our suspicion regarding too many zeros is confirmed and a typical multilevel
Poisson model will not suffice. Instead, we chose a multilevel zero-inflated Poisson (M-ZIP)
model for our analysis, given the distribution of the outcomes and the structure of the data. In a
single-level ZIP model, it is assumed that there are two separate processes at work: a latent
binomial regression that predicts whether someone is in the zero category (no occurrence) and a
standard count or Poisson regression (frequency of occurrence; Lambert). A convenient feature
of a ZIP model is that the variables that explain the zero part and count part of the model do not
have to be the same. Given that our interest was in the count part of the model, we do not build a
model for the zero part; however, we do estimate the coefficient associated with the odds of
having no violent experiences. The model is a mixture of a Poisson distribution with parameter
and a degenerate distribution with point mass at 0 and probability . When excess zeros are
present a ZIP model is a better fit to the data and is better predictive of both zeros and counts
(Hall, 2000; Lambert, 1992).
______________
Figure 1 about here
PREDICTORS OF SCHOOL VIOLENCE INTERNATIONALLY 18
______________
Although two-level M-ZIP models are theoretically well-established and relatively easy
to implement in commercially available software, there is little practical capacity for higher-level
M-ZIP models. As such, we chose to fit two-level M-ZIP models by country where students are
nested in schools. This approach produces 41 separate models. Although this is clearly an
inefficient use of the data, we argue that being able to more appropriately model the outcome
distribution is a worthwhile trade-off. Further, any consistent patterns across countries in terms
of predictors of violent experiences can provide evidence for further research once advances in
software catch up with theory.
We fit all two-level M-ZIP models in Mplus 7 (Muthén & Muthén, 1998) and we
followed the recommendation of Rutkowski, Gonzalez, von Davier, and Joncas (2010) to apply
sampling weights at the student and school level and to repeat each analysis five times,
combining the estimates according to Rubin’s (1987) rules. To account for the stratified
sampling scheme in each country, we also used explicit stratification variables (Joncas & Foy,
2012), where applicable, via the complex method in Mplus.
The models fit to the TIMSS 2011 data were specified as follows:
The logistic part:
The Poisson part:
.
Then expresses the probability of being in the zero category and the mean
of the Poisson distribution is expressed as with
PREDICTORS OF SCHOOL VIOLENCE INTERNATIONALLY 19
between-country variance in expressed as . The coefficients that express the
relationship between the level-one predictors and the outcome are given as and the level-two
coefficients are given as . The list of level-one and level-two predictor variables can be found
in Appendix A. Given some evidence that immigrant students experience higher levels of
violence (Rutkowski et al., 2013), we note four predictors of particular importance: child of
immigrant, foreign born, language spoken at home, and age of immigration, which collectively
provide information regarding the student’s immigrant status. After controlling for other
demographic variables, we examine whether immigrant status is associated with violent
experiences at school in an international context. Further, we highlight international patterns in
terms of important predictors of interest at both the student- and school-levels.
Coefficients are interpreted similar to those in standard multilevel regression: statistically
significant positive coefficients imply a positive association with counts of violence and
statistically significant negative coefficients imply a negative association with counts of
violence. To put the Poisson regression coefficients in a more intuitive metric, we can
exponentiate them (i.e., ) and directly interpret the multiplicative effect of a one unit
change in the predictor on the outcome.
Results
Given the number of countries in the analysis and the large number of predictors, we
highlight and discuss general patterns and other interesting findings. Full model results are
available in Tables 3 to 7. In terms of the logistic or zero-part of the model, findings vary across
countries: from a low of (95%CI[ ]) in Thailand to .49
(95%CI[ ]) in Armenia. The models suggest that from 10 to 49 percent of students across
PREDICTORS OF SCHOOL VIOLENCE INTERNATIONALLY 20
countries fall into the zero class and report no violent experiences, with an average of 20 percent
across the 41 countries.
With respect to the count or Poisson part of the model, we note the following findings at
the student level. For 8 of 41 countries, perceived support was related to higher counts of violent
experiences. Achievement was negatively associated with violent experiences in 25 of 41
countries, although the typical magnitude of the coefficient was quite small ( ).
With the exception of Romania, Kazakhstan, and Tunisia where the effect was positive, age was
not associated with school violence. In contrast, being a boy was strongly and positively
associated with violent experiences in 33 of 41 countries. Notably, the effect was strongest in
Palestine ( (95%CI[ ]), which suggests that boys report
nearly twice as many violent experiences than girls. In 11 countries, self-esteem was negatively
associated with counts of violent experiences. In just four of 41 countries, the student-teacher
relationship was negatively associated with counts of violence. These countries included
Armenia, Bahrain, Iran, and Malaysia. In nine countries, there was a statistically significant
relationship between parental involvement and violent experiences. Notably, however, the
direction of these coefficients was mixed. In particular, the effect was positive in Hong Kong,
Japan, Singapore, and Thailand. The effect was negative in Armenia, Macedonia, Russia,
Sweden, and the Ukraine.
We found clear, consistent evidence of an effect for student attachment. Specifically, this
effect was negative and statistically significant in 31 of 41 countries, suggesting that students
who are attached to their schools report fewer violent experiences internationally. This effect is
strongest in Lithuania ( ; 95%CI[ ]), providing some evidence that
students who are more attached (by one unit on the scale) report just 71 percent as many counts
PREDICTORS OF SCHOOL VIOLENCE INTERNATIONALLY 21
of school violence as their less-attached classmates. Less important internationally was the effect
of SES, with only six countries reaching statistical significance. Further, the direction of the
coefficients was mixed, with positive effects in Australia, Finland, Japan, New Zealand, and
Sweden and a negative effect in Georgia.
In terms of immigrant status, the effect of being a child of an immigrant was statistically
significant in Georgia, Hong Kong, Indonesia, Lebanon, Oman, and Singapore. In all six
countries, the effect was positive, suggesting that students who are children of immigrants in
these countries, on average, report higher numbers of violent experiences. Violent experiences
for foreign born students were lower than native students in Armenia, Lithuania, and Macedonia.
Whereas in Bahrain, Jordan, Lebanon, Qatar, Sweden, and Syria, foreign-born students report
higher numbers of violent experiences. This effect was not statistically significant in all other
countries, after controlling for other predictors of interest.
In eight of 41 countries, age of immigration was a statistically significant predictor of
violent experiences. In particular, students who immigrate at younger ages into Armenia, Ghana,
Hong Kong, Lithuania, and Macedonia, and UAE report fewer violent experiences while the
opposite is true in Jordan and Sweden. Similarly, in eight countries, speaking the language of the
test more often at home was also negatively associated with the outcome. In particular, the effect
was negative in Bahrain, England, Hungary, Japan, Korea, New Zealand, and Romania, and
USA. This effect is particularly strong in Korea ( ; 95%CI[ ]), which
suggests that violent experiences are just 82 percent as high for a student who is one unit higher
on the language frequency item (e.g., always vs. almost always). In contrast, the effect was
weakly positive in Tunisia ( ; 95%CI[ ]), suggesting that average
PREDICTORS OF SCHOOL VIOLENCE INTERNATIONALLY 22
counts of violent experiences are about 7 percent higher for students who are one unit higher on
the language frequency item compared to their classmates.
We turn now to the results at the school-level (Table 5 and 6), where we found far fewer
patterns in the data. In Jordan and the Ukraine, a small positive effect for school size was found,
suggesting that larger schools are associated with higher average reports of violence while the
opposite was found in Finland. Urbanicity was also associated with violence in seven countries.
In particular, the smaller the community in which a school is located, the higher the number of
reported violent experiences for all countries except Indonesia, where violence is lower in large
communities. The discipline policy of the school was statistically significant in only two
countries: Hong Kong, where the effect is negative, and Hungary, where the effect was positive.
Student-body attachment to the school was not statistically significant in any country considered,
while school perceptions of parental involvement resulted in mixed results for five countries.
This variable was positively associated with higher average reports of violence in Ghana,
Hungary, Japan, and Sweden, and negatively associated with violence in Georgia.
The remaining predictors are school-level aggregates of student-level predictors. In
Russia, Sweden, and Turkey the school-level effect of parental support was positively associated
with average reported violence. In other words, the higher the average level of parental support,
as reported by the students, the higher the average of reported school violence. In six countries
average achievement was associated with average reported violence. In particular, the effect was
negative in Armenia, Chile, Lebanon, Qatar, and UAE and positive in Jordan. Average age of the
eighth grade students was negatively associated with average counts of violence in Ghana and
positively associated with average counts of violence in Korea. In Korea, this average effect was
particularly strong ( ; 95%CI[ ]), suggesting that an eighth grade class
PREDICTORS OF SCHOOL VIOLENCE INTERNATIONALLY 23
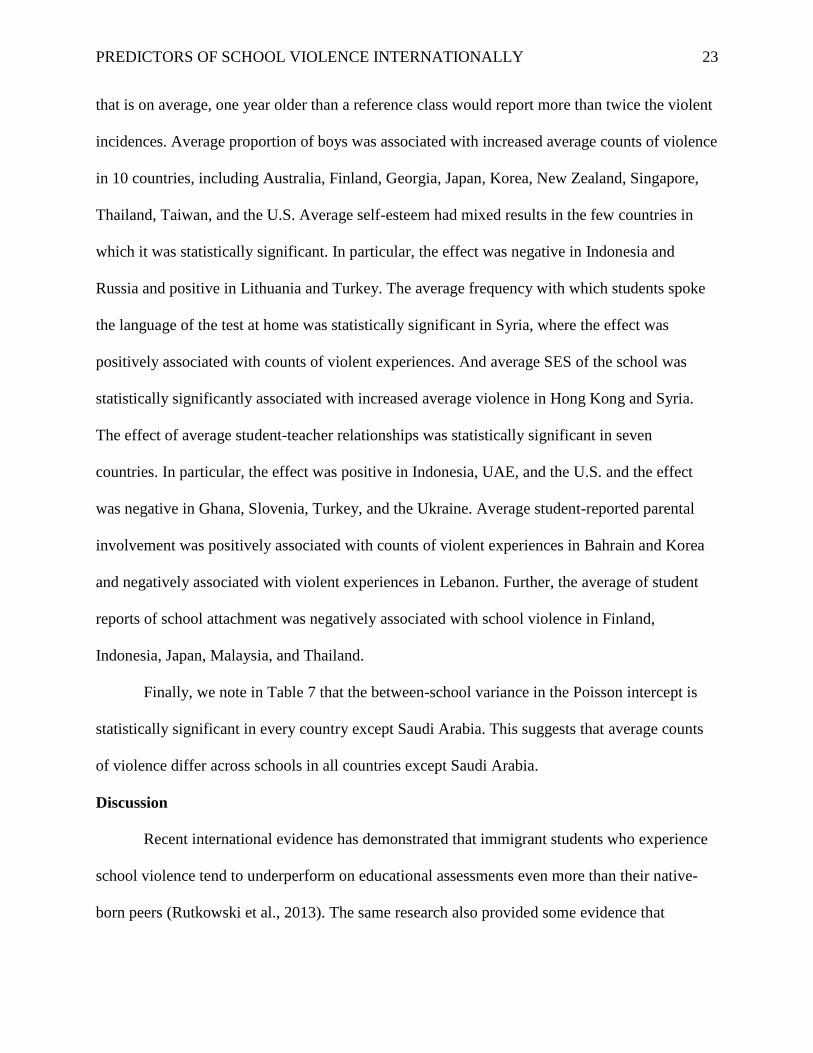
that is on average, one year older than a reference class would report more than twice the violent
incidences. Average proportion of boys was associated with increased average counts of violence
in 10 countries, including Australia, Finland, Georgia, Japan, Korea, New Zealand, Singapore,
Thailand, Taiwan, and the U.S. Average self-esteem had mixed results in the few countries in
which it was statistically significant. In particular, the effect was negative in Indonesia and
Russia and positive in Lithuania and Turkey. The average frequency with which students spoke
the language of the test at home was statistically significant in Syria, where the effect was
positively associated with counts of violent experiences. And average SES of the school was
statistically significantly associated with increased average violence in Hong Kong and Syria.
The effect of average student-teacher relationships was statistically significant in seven
countries. In particular, the effect was positive in Indonesia, UAE, and the U.S. and the effect
was negative in Ghana, Slovenia, Turkey, and the Ukraine. Average student-reported parental
involvement was positively associated with counts of violent experiences in Bahrain and Korea
and negatively associated with violent experiences in Lebanon. Further, the average of student
reports of school attachment was negatively associated with school violence in Finland,
Indonesia, Japan, Malaysia, and Thailand.
Finally, we note in Table 7 that the between-school variance in the Poisson intercept is
statistically significant in every country except Saudi Arabia. This suggests that average counts
of violence differ across schools in all countries except Saudi Arabia.
Discussion
Recent international evidence has demonstrated that immigrant students who experience
school violence tend to underperform on educational assessments even more than their native-
born peers (Rutkowski et al., 2013). The same research also provided some evidence that
PREDICTORS OF SCHOOL VIOLENCE INTERNATIONALLY 24
immigrant students experience more violence in schools than native-born students; however,
reasons for increased exposure to school violence is less understood in this population. In the
current paper, we picked up where Rutkowski et al. left off and developed a model of school
violence that accounted for a number of student variables and school-level factors to explain
differences in school violence. After controlling for theoretically relevant correlates of violence,
our findings indicate that at least one immigrant student variable either (immigrant status, age of
immigration, or language proficiency) was still predictive of violent experiences in most of the
TIMSS-participating countries. For example, in nine countries to include the US, Korea, and
Japan students who spoke the language of the test at home more often reported less school
violence. In the US, this finding falls in line with Qin et al.'s (2008) study; however, in a number
of countries there were low or no language effects. The absence of a language effect in some
countries may be due to the immigrant population composition. For example, in Chile the largest
immigrant population is from Peru and these students would likely speak the language of the test
at home.
Similar to Peguero (2009) and Rutkowski, Rutkowski and Engel (2013), we found that
either being foreign born or a child of an immigrant was a significant predictor school violence
in a number of TIMSS countries. Specifically, where the effects were statistically significant, the
effect was primarily a positive one. That is, an immigrant background usually associated with
more frequent school violence. Surprisingly, only in Lebanon was there an effect for both
foreign-born students and children of immigrants. These findings provides some evidence that
increased levels of violence among immigrant students remain even after accounting for other
theoretically important variables in a number of countries.
PREDICTORS OF SCHOOL VIOLENCE INTERNATIONALLY 25
Another consistent and notable pattern is that higher school attachment was associated
with less school violence in 31 of 41 countries, which is consistent with our review of the
literature. Interpretive caution is warranted, however, since it is not clear whether students who
experience less violence feel a greater sense of belonging, or whether school attachment acts as a
protective factor against victimization. Some studies suggest that students who are frequently
victimized feel a lower sense of belonging (see Akiba, 2010; Furlong & Chung, 1995), while
other studies reported less violence at schools where students report higher school attachment
(see Barnes et al., 2012; Battistich & Hom, 1997; Bryk & Driscoll, 1998; Jenkins, 1997),
suggesting that decreases in school violence are associated with better school attachment.
Nonetheless, the consistency of this finding suggests that school attachment is important and that
further research in this area is justified.
Further, policies for fostering school attachment should approach the issue holistically,
considering both the academic and social aspects of a student’s sense of belonging (Akiba,
2010). Teachers would be integral to any policy (Akiba), as students spend most of their days in
the presence of teachers and schools should support teachers, either through resources, training,
or both, to create a welcoming and safe environment for students. Though school violence often
happens outside the presence of adults, there is evidence that creating a welcoming environment
where students feel that they belong can lead to less violence throughout the school (Payne et al.,
2003).
In line with a number of other studies (see Hong & Espelage, 2012; Owens et al., 2001;
Smith et al., 1999), we found strong evidence of sex differences in school violence. Consistent
with Akiba (2008), we found that boys report more violence than girls in 33 of 41 countries.
Countries with the greatest sex differences are Bahrain, Japan, Jordan, Palestine, Tunisia, and the

PREDICTORS OF SCHOOL VIOLENCE INTERNATIONALLY 26
UAE. With the exception of Japan, these countries share a common dominant language and
religion. Other countries in the Arabic region (Morocco, Palestine, Qatar, Saudi Arabia, and
Syria) also demonstrate large sex differences, with boys reporting more school violence.
Interestingly, all available1 countries in this list rank below 100 of 135 countries included in the
World Economic Forum’s Global Gender Gap Index 2012 (Hausmann, Tyson, & Zahidi, 2012),
suggesting that sex differences are pervasive in these societies. Given the linguistic and cultural
regional similarities of this group of countries, it might prove useful to explore common policy
interventions aimed at alleviating school violence among boys.
Along with Japan, another regional grouping emerged. Specifically, boys from the “Asian
Tiger” countries (Taiwan, South Korea, Singapore, and Hong Kong) report more violence than
girls. This finding falls in line with a regional analysis done by Lai, Ye, and Chang (2008), who
also found higher rates of bullying among males in the same countries. To that end, interventions
that alleviate violence among male students may further improve educational achievement of
these already strong performing countries.
Our study found a negative effect for achievement in 24 of 41 countries. Although the
effect sizes in our study were generally small, the findings are consistent with other studies (see
Akiba, 2008, 2010; Buhs et al., 2006; Eisenberg et al., 2009; Suárez-Orozco, Pimentel, et al.,
2009; Thijs & Verkuyten, 2008). But, the direction of this relationship is unclear. That is,
whether low achieving students experience more violence or if students who experience more
violence suffer academically is not known. Nonetheless, our findings suggest that low
performing students are a population that experience violence more often than mid- and high-
performing students. Given previous evidence that low achievers experience more school
1 Palestine and Tunisia were not ranked.
PREDICTORS OF SCHOOL VIOLENCE INTERNATIONALLY 27
violence, this could be an important policy focus. Additionally, the small effect size should be
considered in conjunction with the scale of achievement. That is, although a one unit change in
achievement predicts a small change in the number of violent experiences, large differences in
achievement will predict more meaningful differences in reported violence. Finally, the
consistency of this finding suggests that the relationship between school violence and
achievement should be further studied. In particular, the causal nature of the relationship should
be understood to better inform policy interventions.
Findings on the predictors of age, SES, self-esteem, parental involvement, teacher-
student relationships, school size, and urbanicity were all consistent with the literature but
significant in a minority of the countries measured in this research. Among these seven variables,
self-esteem was significant in the greatest number of countries followed by parental
involvement, SES and urbanicity, teacher-student relationships, age, and school size. Self-esteem
appeared significant in most Arabic speaking countries that participated in our study including
Jordan, Oman, Suadi Arabia, Syria, Tunisia, and the UAE. This suggests that there may be
culturally specific factors associated with self-esteem in these countries and that policy makers in
the region might work to better understand this phenomenon and explore policy interventions.
Further, parental involvement was associated with more school violence in Hong Kong, Japan,
Singapore, and Thailand while a negative effect existed in some European countries, including
Armenia, Russia, Sweden, and Ukraine. This finding exemplifies that we should always use
caution in interpreting international data and in suggesting uniform policy interventions across
countries. For example, it may be that parent involvement in schools – proven to have many
advantages in the US and Europe (Hill & Tyson, 2009; Karbach, Gottschling, Spengler,
Hegewald, & Spinath, 2013), may be associated with increased victimization of students in some
PREDICTORS OF SCHOOL VIOLENCE INTERNATIONALLY 28
Asian countries. Although our literature review pointed to SES, urbanicity, and teacher-student
relationship as important correlates of school violence, our findings were consistent in just a few
countries. Given a generally null finding for these variables, we do not discuss them further.
Two predictors in this study run contrary to the prevailing literature: student support and
school discipline policies. Student support was a consistent predictor of increased school
violence in 8 of 41 countries, whereas most studies found that support has a negative association.
This finding again points to culture as important in contextualizing relationships in international
studies. To that end, it could be that independent learning is valued in these countries and that
students who receive extra learning attention from teachers are singled out for victimization. In
only two countries school discipline policy was a significant predictor, with mixed findings. In
Hong Kong, clearer rules and more consistent discipline enforcement were associated with less
violence, while these same school characteristics predicted greater incidence of school violence
in Hungary. Although reasons for this mixed finding are unclear, one possibility is the
comparative ethnic homogeneity of Hong Kong, which might provide students with a sense of
fairness with respect to discipline policies (Ruck & Wortley, 2002).
We note several limitations to our study. First, our violence measure includes both
physical and verbal victimization and social exclusion. Further, our study does not differentiate
among types of reported violence nor does it identify the perpetrator; however, this distinction
could result in different findings. For example, if girls often experience verbal harassment from
boys, then policy makers might focus on sensitizing boys and girls on sex similarities and
differences. The TIMSS data is cross-sectional and observational making any conclusions
correlational only. To that end, further research in each of the identified areas is important for
establishing the causal direction of the relationships. Finally, we note that given the state-of-the-

PREDICTORS OF SCHOOL VIOLENCE INTERNATIONALLY 29
art in commercially available software, we made a trade-off between fully capturing the nested
structure of the data (students in classes in schools in countries) and most appropriately modeling
the distribution of school violence. Despite these limitations, we found evidence of several
strong, consistent predictors of school violence internationally. Each of these variables (sex,
school attachment, and achievement) are areas in need of further research and are also possible
candidates for policy intervention aimed at reducing violence in schools.
Summary and Conclusion
The current study used the most recently available TIMSS results along with a cutting-
edge method (multilevel zero-inflated Poisson regression) to better understand correlates of
violence internationally. In particular, after controlling for theoretically relevant predictors of
violence, we examined whether statistically significant differences remained between immigrant
and native-born students in their reports of school violence. In addition to a fairly consistent
picture of the association between immigrant status and violence, we also identified several other
predictors of violence internationally. Further, our research highlighted the importance of
considering the national and cultural context of findings when attempting to study school
violence in an international context.
Our results point to a need by policy makers internationally to work toward fostering a
sense of belonging in school along with creating an atmosphere of equality for all students, but
especially for immigrants. A clear case in point is the recent bombing in Boston, where the
conversation immediately zeroed in on the suspects’ Chechan and immigrant background and the
fact that both men were U.S. educated. Conjecture swirls around whether the educational system
could have played a factor in preventing these events from occurring, given the relatively young
age at which they entered the U.S. And as educational researchers, we are obligated to consider
PREDICTORS OF SCHOOL VIOLENCE INTERNATIONALLY 30
the importance of supporting and integrating new, especially young, residents, who face
numerous challenges in an unfamiliar educational landscape. The international perspective
provided by this study provides both researchers and policy makers with further evidence of the
importance of providing immigrant populations of students with the resources they need to
succeed.
PREDICTORS OF SCHOOL VIOLENCE INTERNATIONALLY 31
References
Akiba, M. (2008). Predictors of student fear of school violence: A comparative study of eighth
graders in 33 countries. School Effectiveness and School Improvement, 19(1), 51–72.
doi:10.1080/09243450801936878
Akiba, M. (2010). What predicts fear of school violence among U.S. adolescents? Teachers
College Record, 112(1), 68–102.
Akiba, M., & Han, S. (2007). Academic differentiation, school achievement and school violence
in the USA and South Korea. Compare: A Journal of Comparative and International
Education, 37(2), 201–219. doi:10.1080/03057920601165561
Akiba, M., LeTendre, G. K., Baker, D. P., & Goesling, B. (2002). Student victimization:
National and school system effects on school violence in 37 nations. American
Educational Research Journal, 39(4), 829–853. doi:10.3102/00028312039004829
Astor, R. A., Benbenishty, R., Marachi, R., Haj-Yahia, M. M., Zeira, A., Perkins-Hart, S., &
Pitner, R. O. (2002). The awareness of risky peer group behaviors on school grounds as
predictors of students’ victimization on school grounds: Part I-elementary schools.
Journal of School Violence, 1, 11–33.
Astor, R. A., Benbenishty, R., Vinokur, A. D., & Zeira, A. (2006). Arab and Jewish elementary
school students’ perceptions of fear and school violence: Understanding the influence of
school context. British Journal of Educational Psychology, 76, 91–118.
Barnes, K., Brynard, S., & de Wet, C. (2012). The school in school violence in the Eastern Cape
Province of South Africa. Journal of Social Science, 31, 209–218.
Batsche, G. M., & Knoff, H. M. (1994). Bullies and their victims: Understanding a pervasive
problem in the schools. School Psychology Review, 23(2), 165.
Battistich, V., & Hom, A. (1997). The relationship between students’ sense of their school as a
community and their involvement in problem behaviors. American Journal of Public
Health, 87(12), 1997–2001.
Benbenishty, R., & Astor, R. A. (2005). School violence in context: Culture, neighborhood,
family, school, and gender (Vol. xxiv). New York, NY, US: Oxford University Press.
Boulton, M. J., & Smith, P. K. (2011). Bully/victim problems in middle-school children:
Stability, self-perceived competence, peer perceptions and peer acceptance. British
Journal of Developmental Psychology, 12, 315–329.
Bowen, N. K., & Bowen, G. L. (1999). Effects of crime and violence in neighborhoods and
schools on the school behavior and performance of adolescents. Journal of Adolescent
Research, 14(3), 319–342. doi:10.1177/0743558499143003
Bryk, A. S., & Driscoll, M. E. (1998). The high school as community: Contextual influences and
consequences for students and teachers. Madison, WI: National Center on Effective
Secondary Schools.
Buhs, E. S., Ladd, G. W., & Herald, S. L. (2006). Peer exclusion and victimization: Processes
that mediate the relation between peer group rejection and children’s classroom
engagement and achievement? Journal of Educational Psychology, 98, 1–13.
Buka, S. L., Stichick, T. L., Birdthistle, I., & Earls, F. J. (2001). Youth exposure to violence:
Prevalence, risks, and consequences. American Journal of Orthopsychiatry, 71, 298–310.
Centers for Disease Control and Prevention. (2011). Injury Prevention & Control. About School
Violence. Retrieved from
http://www.cdc.gov/violenceprevention/youthviolence/schoolviolence/

PREDICTORS OF SCHOOL VIOLENCE INTERNATIONALLY 32
Chen, J.-K., & Astor, R. A. (2010). School violence in Taiwan: Examining how Western risk
factors predict school violence in an Asian culture. Journal of Interpersonal Violence, 25,
1388–1410.
Cooley-Quille, M. R., Turner, S. M., & Beidel, D. C. (1995). Emotional impact of children’s
exposure to community violence: A preliminary study. Journal of the American Academy
of Child & Adolescent Psychiatry, 34(10), 1362–1368. doi:10.1097/00004583-
199510000-00022
Crosnoe, R., Johnson, M. K., & Elder, G. H. (2004). Intergenerational bonding in school: The
behavioral and contextual correlates of student-teacher relationships. Sociology of
Education, 77(1), 60–81. doi:10.2307/3649403
Davies, L. (2003). Education and conflict: Complexity and chaos. New York: Psychology Press.
Due, P., Merlo, J., Harel-Fisch, Y., Damsgaard, M. T., Holstein, B. E., Hetland, J., Currie, C.,
Gabhainn, S. N., de Matos, M. G., & Lynch, J. (2009). Socioeconomic inequality in
exposure to bullying during adolescence: A comparative, cross-sectional, multilevel
study in 35 countries. American Journal of Public Health, 99(5), 907–914.
doi:10.2105/AJPH.2008.139303
Eisenberg, M. E., Neumark-Sztainer, D., & Perry, C. L. (2009). Peer harassment, school
connectedness, and academic achievement. Journal of School Health, 73, 311–316.
Engel, L. C., Rutkowski, D., & Rutkowski, L. (2009). The harsher side of globalisation: Violent
conflict and academic achievement. Globalisation, Societies and Education, 7(4), 433–
456. doi:10.1080/14767720903412242
Eslea, M., & Mukhtar, K. (2000). Bullying and racism among Asian schoolchildren in Britain.
Educational Research, 42(2), 207–217. doi:10.1080/001318800363845
Espelage, D. L., & Swearer, S. M. (2003). Research on school bullying and victimization: What
have we learned and where do we go from here? School Psychology Review, 32, 365–
383.
Fandrem, H., Ertesvåg, S. K., Strohmeier, D., & Roland, E. (2010). Bullying and affiliation: A
study of peer groups in native and immigrant adolescents in Norway. European Journal
of Developmental Psychology, 7(4), 401–418. doi:10.1080/17405620802335075
Fandrem, H., Strohmeier, D., & Roland, E. (2009). Bullying and victimization among native and
immigrant adolescents in Norway: The role of proactive and reactive aggressiveness. The
Journal of Early Adolescence, 29(6), 898–923. doi:10.1177/0272431609332935
Foy, P., Arora, A., & Stanco, G. (Eds.). (2013). TIMSS 2011 user guide for the international
database. Boston: TIMSS & PIRLS International Study Center, Lynch School of
Education, Boston College and International Association for the Evaluation of
Educational Achievement (IEA).
Fuligni, A. J. (1997). The academic achievement of adolescents from immigrant families: The
role of family background, attitudes, and behavior. Child Development, 68(2), 351–363.
Furlong, M. J., & Chung, A. (1995). Who are the victims of school violence? A comparison of
student non-victims and multi-victims. Education & Treatment of Children (ETC), 18(3),
282–298.
Garcia-Reid, P., Reid, R. J., & Peterson, N. A. (2005). School engagement among Latino youth
in an urban middle school context valuing the role of social support. Education and
Urban Society, 37, 257–275.
PREDICTORS OF SCHOOL VIOLENCE INTERNATIONALLY 33
Gorman–Smith, D., & Tolan, P. (1998). The role of exposure to community violence and
developmental problems among inner-city youth. Development and Psychopathology,
10(01), 101–116.
Gottfredson, G. D., & Gottfredson, D. C. (1985). Victimization in schools. New York: Plenum
Press.
Gottfredson, G. D., Gottfredson, D. C., Payne, A. A., & Gottfredson, N. C. (2005). School
climate predictors of school disorder: Results from a national study of delinquency
prevention in schools. Journal of Research in Crime and Delinquency, 42, 412–444.
Graham, S., & Juvonen, J. (2002). Ethnicity, peer harassment, and adjustment in middle school:
An exploratory study. The Journal of Early Adolescence, 22(2), 173–199.
doi:10.1177/0272431602022002003
Hall, D. B. (2000). Zero-inflated Poisson and binomial regression with random effects: A case
study. Biometrics, 56(4), 1030–1039. doi:10.2307/2677034
Hausmann, R., Tyson, L., & Zahidi, S. (2012). The global gender gap report 2012. Geneva:
World Economic Forum.
Haynie, D. L., Nansel, T., Eitel, P., Crump, A. D., Saylor, K., Yu, K., & Simons-Morton, B.
(2001). Bullies, victims, and bully/victims: Distinct groups of at-risk youth. The Journal
of Early Adolescence, 21, 29–49.
Herrero, J., Estévez, E., & Musitu, G. (2006). The relationships of adolescent school-related
deviant behaviour and victimization with psychological distress: Testing a general model
of the mediational role of parents and teachers across groups of gender and age. Journal
of Adolescence, 29, 671–690.
Hill, N. E., & Tyson, D. F. (2009). Parental involvement in middle school: A meta-analytic
assessment of the strategies that promote achievement. Developmental Psychology, 45(3),
740.
Hong, J. S., & Espelage, D. L. (2012). A review of research on bullying and peer victimization in
school: An ecological systems analysis. Aggression and Violent Behavior, 17, 311–322.
Jaycox, L. H., Stein, B. D., Kataoka, S. H., Wong, M., Fink, A., Escudero, P., & Zaragoza, C.
(2002). Violence exposure, posttraumatic stress disorder, and depressive symptoms
among recent immigrant schoolchildren. Journal of the American Academy of Child &
Adolescent Psychiatry, 41, 1104–1110.
Jenkins, P. H. (1997). School delinquency and the school social bond. Journal of Research in
Crime and Delinquency, 34(3), 337–367.
Joncas, M., & Foy, P. (2012). Sample design in TIMSS and PIRLS. In M. O. Martin & I. V. S.
Mullis (Eds.), Methods and procedures in TIMSS and PIRLS 2011. Boston: TIMSS &
PIRLS International Study Center, Lynch School of Education, Boston College.
Juvonen, J., Graham, S., & Schuster, M. A. (2003). Bullying among young adolescents: The
strong, the weak, and the troubled. Pediatrics, 112, 1231–1237.
Juvonen, J., Nishina, A., & Graham, S. (2000). Peer harassment, psychological adjustment, and
school functioning in early adolescence. Journal of Educational Psychology, 92, 349.
Karbach, J., Gottschling, J., Spengler, M., Hegewald, K., & Spinath, F. M. (2013). Parental
involvement and general cognitive ability as predictors of domain-specific academic
achievement in early adolescence. Learning and Instruction, 23, 43–51.
Kataoka, S., Langley, A., Stein, B., Jaycox, L., Zhang, L., Sanchez, N., & Wong, M. (2009).
Violence exposure and PTSD: The role of English language fluency in Latino youth.
Journal of Child and Family Studies, 18, 334–341.

PREDICTORS OF SCHOOL VIOLENCE INTERNATIONALLY 34
Khoury-Kassabri, M., Benbenishty, R., & Astor, R. A. (2005). The effects of school climate,
socioeconomics, and cultural factors on student victimization in Israel. Social Work
Research, 29, 165–180.
Khoury-Kassabri, M., Benbenishty, R., Astor, R. A., & Zeira, A. (2004). The contributions of
community, family, and school variables to student victimization. American Journal of
Community Psychology, 34, 187–204.
Kochenderfer, B. J., & Ladd, G. W. (1996). Peer victimization: Cause or consequence of school
maladjustment? Child Development, 67, 1305–1317.
Ladd, G. W., & Ladd, B. K. (1998). Parenting behaviors and parent–child relationships:
Correlates of peer victimization in kindergarten? Developmental Psychology, 34(6),
1450–1458. doi:10.1037/0012-1649.34.6.1450
Lai, S. L., Ye, R., & Chang, K. P. (2008). Bullying in middle schools: An Asian-Pacific regional
study, 9(4), 503–515. doi:10.1007/BF03025666
Lambert, D. (1992). Zero-Inflated Poisson Regression, with an application to defects in
manufacturing. Technometrics, 34(1), 1–14. doi:10.2307/1269547
Liebkind, K., & Jasinskaja-Lahti, I. (2000). Acculturation and psychological well-being among
immigrant adolescents in Finland: A comparative study of adolescents from different
cultural backgrounds. Journal of Adolescent Research, 15, 446–469.
Louw, D., & Louw, A. (2007). Child and adolescent development. Bloemfontein: ABC Printers.
Ma, L., Phelps, E., Lerner, J. V., & Lerner, R. M. (2009). Academic competence for adolescents
who bully and who are bullied findings from the 4-H study of positive youth
development. The Journal of Early Adolescence, 29(6), 862–897.
doi:10.1177/0272431609332667
Ma, X. (2001). Bullying and being bullied: To what extent are bullies also victims? American
Educational Research Journal, 38(2), 351–370. doi:10.2307/3202462
Marachi, R., Astor, R. A., & Benbenishty, R. (2007). Effects of student participation and teacher
support on victimization in Israeli schools: An examination of gender, culture, and school
type. Journal of Youth and Adolescence, 36, 225–240.
Mouttapa, M., Valente, T., Gallaher, P., Rohrbach, L. A., & Unger, J. B. (2004). Social network
predictors of bullying and victimization. Adolescence, 39, 315–335.
Mullis, I. V. S., Martin, M. O., Ruddock, G. J., O’Sullivan, C. Y., & Preuschoff, C. (2009).
TIMSS 2011 assessment frameworks. Amsterdam: International Association for the
Evaluation of Educational Achievement.
Muthén, L., & Muthén, B. O. (1998). Mplus user’s guide. (Sixth edition.). Los Angeles, CA:
Muthén & Muthén.
Nansel, T., & Overpeck, M. (2001). Bullying behaviors among us youth: Prevalence and
association with psychosocial adjustment. JAMA, 285(16), 2094–2100.
doi:10.1001/jama.285.16.2094
O’Keefe, M. (1997). Adolescents’ exposure to community and school violence: Prevalence and
behavioral correlates. Journal of Adolescent Health, 20, 368–376.
O’Moore, M., & Kirkham, C. (2001). Self-esteem and its relationship to bullying behaviour.
Aggressive Behavior, 27(4), 269–283.
Olweus, D. (1994). Bullying at school: Basic facts and effects of a school based intervention
program. Journal of Child Psychology and Psychiatry, 35(7), 1171–1190.
doi:10.1111/j.1469-7610.1994.tb01229.x
PREDICTORS OF SCHOOL VIOLENCE INTERNATIONALLY 35
Olweus, D. (2006). Bullying at school: Knowledge base and an effective intervention programa.
Annals of the New York Academy of Sciences, 794, 265–276.
Osofsky, J. D. (1999). The impact of violence on children. The Future of Children, 9(3), 33–49.
doi:10.2307/1602780
Owens, L., Slee, P., & Shute, R. (2001). Victimization among teenage girls: What can be done
about indirect harassment? In J. Juvonen & S. Graham (Eds.), Peer harassment in school:
The plight of the vulnerable and victimized (pp. 215–241). New York: The guilford Press.
Payne, A. A., Gottfredson, D. C., & Gottfredson, G. D. (2003). Schools as communities: The
relationships among communal school organization, student bonding, and school
disorder. Criminology, 41(3), 749–778. doi:10.1111/j.1745-9125.2003.tb01003.x
Peguero, A. A. (2008). Is immigrant status relevant in school violence research? An analysis
with Latino students. The Journal of school health, 78(7), 397–404. doi:10.1111/j.1746-
1561.2008.00320.x
Peguero, A. A. (2009). Victimizing the children of immigrants Latino and Asian American
student victimization. Youth & Society, 41, 186–208.
Qin, D. B., Way, N., & Rana, M. (2008). The “model minority” and their discontent: Examining
peer discrimination and harassment of Chinese American immigrant youth. New
Directions for Child and Adolescent Development, 121, 27–42.
Reardon, S. F., & Galindo, C. (2009). The Hispanic-White achievement gap in math and reading
in the elementary grades. American Educational Research Journal, 46(3), 853–891.
doi:10.3102/0002831209333184
Reingle, J. M., Maldonado-Molina, M. M., Jennings, W. G., & Komro, K. A. (2012).
Racial/ethnic differences in trajectories of aggression in a longitudinal sample of high-
risk, urban youth. Journal of Adolescent Health, 51, 45–52.
Rubin, D. B. (1987). Multiple imputation for nonresponse in surveys. New York: Wiley.
Ruck, M. D., & Wortley, S. (2002). Racial and ethnic minority high school students’ perceptions
of school disciplinary practices: A look at some Canadian findings. Journal of Youth and
Adolescence, 31, 185–195.
Rutkowski, L., Gonzalez, E., Joncas, M., & von Davier, M. (2010). International large-scale
assessment data: Issues in secondary analysis and reporting. Educational Researcher,
39(2), 142–151.
Rutkowski, L., Rutkowski, & Engel, L. (2013). Sharp contrasts at the boundaries: School
violence and educational outcomes internationally. Comparative Education Review,
57(2), 232–259. doi:10.1086/669120
Sampson, R. J., Raudenbush, S. W., & Earls, F. (1997). Neighborhoods and violent crime: A
multilevel study of collective efficacy. Science, 277(5328), 918–924.
doi:10.1126/science.277.5328.918
Sharp, S. (1996). Self-esteem, response style and victimization possible ways of preventing
victimization through parenting and school based training programmes. School
Psychology International, 17, 347–357.
Slee, P. T., & Rigby, K. (1993). The relationship of Eysenck’s personality factors and self-
esteem to bully-victim behaviour in Australian schoolboys. Personality and Individual
Differences, 14, 371–373.
Smith, P. K., Morita, Y. E., Junger-Tas, J. E., Olweus, D. E., Catalano, R. F., & Slee, P. E.
(1999). The nature of school bullying: A cross-national perspective. New York: Taylor &
Frances.

PREDICTORS OF SCHOOL VIOLENCE INTERNATIONALLY 36
Smokowski, P. R., & Kopasz, K. H. (2005). Bullying in school: An overview of types, effects,
family characteristics, and intervention strategies. Children & Schools, 27, 101–110.
Stewart, E. A. (2003). School social bonds, school climate, and school misbehavior: A multilevel
analysis. Justice Quarterly, 20, 575–604.
Strawhacker, M. A. T. (2002). School violence: An overview. The Journal of School Nursing,
18, 68–72.
Strohmeier, D., & Spiel, C. (2003). Immigrant children in Austria. Journal of Applied School
Psychology, 19(2), 99–116. doi:10.1300/J008v19n02_07
Suárez-Orozco, C., Bang, H. J., & Onaga, M. (2010). Contributions to variations in academic
trajectories amongst recent immigrant youth. International Journal of Behavioral
Development, 34, 500–510.
Suárez-Orozco, C., Pimentel, A., & Martin, M. (2009). The significance of relationships:
Academic engagement and achievement among newcomer immigrant youth. The
Teachers College Record, 111(3), 712–749.
Suárez-Orozco, C., Rhodes, J., & Milburn, M. (2009). Unraveling the immigrant paradox. Youth
& Society, 41(2), 151–185. doi:10.1177/0044118X09333647
Sullivan, K., Cleary, M. M., & Sullivan, G. (2003). Bullying in secondary schools: What it looks
like and how to manage it. London: Sage Publications Limited.
Swearer, S. M., Espelage, D. L., Vaillancourt, T., & Hymel, S. (2010). What can be done about
school bullying? Linking research to educational practice. Educational Researcher,
39(1), 38–47. doi:10.3102/0013189X09357622
Thijs, J., & Verkuyten, M. (2008). Peer victimization and academic achievement in a multiethnic
sample: The role of perceived academic self-efficacy. Journal of Educational
Psychology, 100, 754–764.
Veenstra, R., Lindenberg, S., Oldehinkel, A. J., De Winter, A. F., Verhulst, F. C., & Ormel, J.
(2005). Bullying and victimization in elementary schools: A comparison of bullies,
victims, bully/victims, and uninvolved preadolescents. Developmental Psychology, 41(4),
672–682. doi:10.1037/0012-1649.41.4.672
Verkuyten, M., & Thijs, J. (2002). Racist victimization among children in the Netherlands: The
effect of ethnic group and school. Ethnic and Racial Studies, 25, 310–331.
Vervoort, M. H. M., Scholte, R. H. J., & Overbeek, G. (2010). Bullying and victimization among
adolescents: The role of ethnicity and ethnic composition of school class. Journal of
Youth and Adolescence, 39, 1–11.
Warner, B. S., Weist, M. D., & Krulak, A. (1999). Risk factors for school violence. Urban
Education, 34, 52–68.
Williams, J. H., & Veeh, C. A. (2012). Continued knowledge development for understanding
bullying and school victimization. Journal of Adolescent Health, 51, 3–5.
Wilson, M. L., Bovet, P., Viswanathan, B., & Suris, J.-C. (2012). Bullying among adolescents in
a sub-Saharan middle-income setting. Journal of Adolescent Health, 51, 96–98.
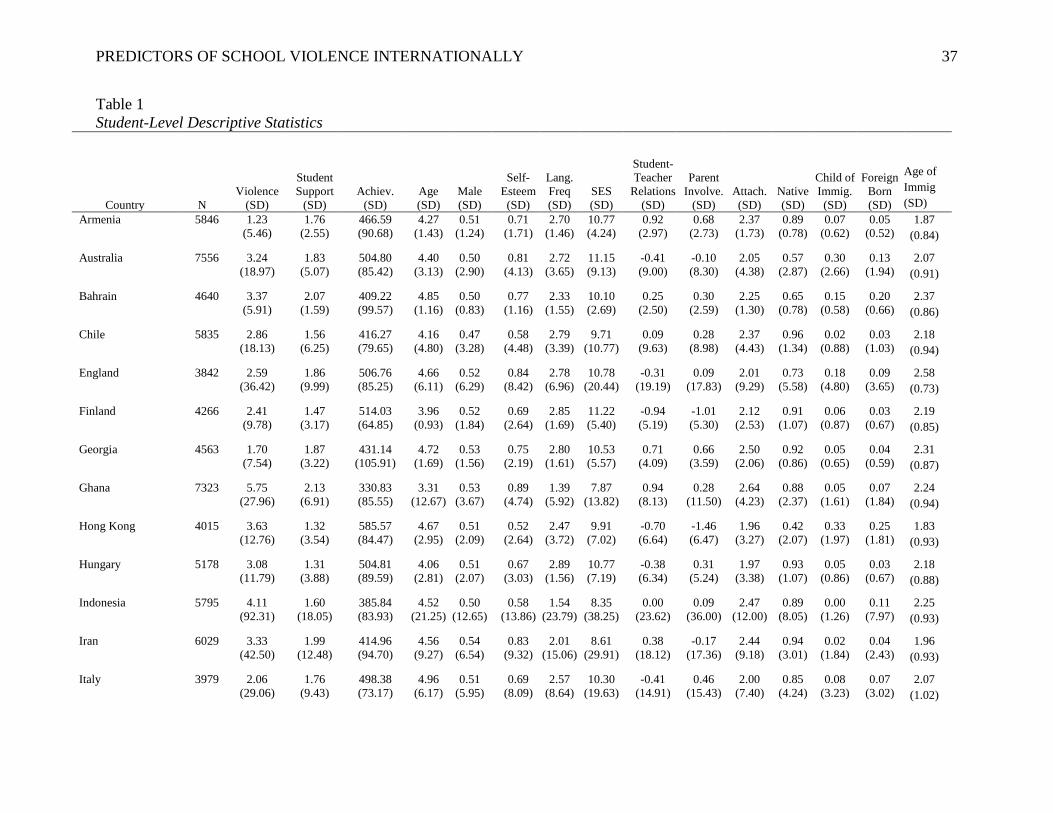
PREDICTORS OF SCHOOL VIOLENCE INTERNATIONALLY 37
Table 1
Student-Level Descriptive Statistics
Country N
Violence
(SD)
Student
Support
(SD)
Achiev.
(SD)
Age
(SD)
Male
(SD)
Self-
Esteem
(SD)
Lang.
Freq
(SD)
SES
(SD)
Student-
Teacher
Relations
(SD)
Parent
Involve.
(SD)
Attach.
(SD)
Native
(SD)
Child of
Immig.
(SD)
Foreign
Born
(SD)
Age of
Immig
(SD)
Armenia 5846 1.23
(5.46)
1.76
(2.55)
466.59
(90.68)
4.27
(1.43)
0.51
(1.24)
0.71
(1.71)
2.70
(1.46)
10.77
(4.24)
0.92
(2.97)
0.68
(2.73)
2.37
(1.73)
0.89
(0.78)
0.07
(0.62)
0.05
(0.52)
1.87
(0.84)
Australia 7556 3.24
(18.97)
1.83
(5.07)
504.80
(85.42)
4.40
(3.13)
0.50
(2.90)
0.81
(4.13)
2.72
(3.65)
11.15
(9.13)
-0.41
(9.00)
-0.10
(8.30)
2.05
(4.38)
0.57
(2.87)
0.30
(2.66)
0.13
(1.94)
2.07
(0.91)
Bahrain 4640 3.37
(5.91)
2.07
(1.59)
409.22
(99.57)
4.85
(1.16)
0.50
(0.83)
0.77
(1.16)
2.33
(1.55)
10.10
(2.69)
0.25
(2.50)
0.30
(2.59)
2.25
(1.30)
0.65
(0.78)
0.15
(0.58)
0.20
(0.66)
2.37
(0.86)
Chile 5835 2.86
(18.13)
1.56
(6.25)
416.27
(79.65)
4.16
(4.80)
0.47
(3.28)
0.58
(4.48)
2.79
(3.39)
9.71
(10.77)
0.09
(9.63)
0.28
(8.98)
2.37
(4.43)
0.96
(1.34)
0.02
(0.88)
0.03
(1.03)
2.18
(0.94)
England 3842 2.59
(36.42)
1.86
(9.99)
506.76
(85.25)
4.66
(6.11)
0.52
(6.29)
0.84
(8.42)
2.78
(6.96)
10.78
(20.44)
-0.31
(19.19)
0.09
(17.83)
2.01
(9.29)
0.73
(5.58)
0.18
(4.80)
0.09
(3.65)
2.58
(0.73)
Finland 4266 2.41
(9.78)
1.47
(3.17)
514.03
(64.85)
3.96
(0.93)
0.52
(1.84)
0.69
(2.64)
2.85
(1.69)
11.22
(5.40)
-0.94
(5.19)
-1.01
(5.30)
2.12
(2.53)
0.91
(1.07)
0.06
(0.87)
0.03
(0.67)
2.19
(0.85)
Georgia 4563 1.70
(7.54)
1.87
(3.22)
431.14
(105.91)
4.72
(1.69)
0.53
(1.56)
0.75
(2.19)
2.80
(1.61)
10.53
(5.57)
0.71
(4.09)
0.66
(3.59)
2.50
(2.06)
0.92
(0.86)
0.05
(0.65)
0.04
(0.59)
2.31
(0.87)
Ghana 7323 5.75
(27.96)
2.13
(6.91)
330.83
(85.55)
3.31
(12.67)
0.53
(3.67)
0.89
(4.74)
1.39
(5.92)
7.87
(13.82)
0.94
(8.13)
0.28
(11.50)
2.64
(4.23)
0.88
(2.37)
0.05
(1.61)
0.07
(1.84)
2.24
(0.94)
Hong Kong 4015 3.63
(12.76)
1.32
(3.54)
585.57
(84.47)
4.67
(2.95)
0.51
(2.09)
0.52
(2.64)
2.47
(3.72)
9.91
(7.02)
-0.70
(6.64)
-1.46
(6.47)
1.96
(3.27)
0.42
(2.07)
0.33
(1.97)
0.25
(1.81)
1.83
(0.93)
Hungary 5178 3.08
(11.79)
1.31
(3.88)
504.81
(89.59)
4.06
(2.81)
0.51
(2.07)
0.67
(3.03)
2.89
(1.56)
10.77
(7.19)
-0.38
(6.34)
0.31
(5.24)
1.97
(3.38)
0.93
(1.07)
0.05
(0.86)
0.03
(0.67)
2.18
(0.88)
Indonesia 5795 4.11
(92.31)
1.60
(18.05)
385.84
(83.93)
4.52
(21.25)
0.50
(12.65)
0.58
(13.86)
1.54
(23.79)
8.35
(38.25)
0.00
(23.62)
0.09
(36.00)
2.47
(12.00)
0.89
(8.05)
0.00
(1.26)
0.11
(7.97)
2.25
(0.93)
Iran 6029 3.33
(42.50)
1.99
(12.48)
414.96
(94.70)
4.56
(9.27)
0.54
(6.54)
0.83
(9.32)
2.01
(15.06)
8.61
(29.91)
0.38
(18.12)
-0.17
(17.36)
2.44
(9.18)
0.94
(3.01)
0.02
(1.84)
0.04
(2.43)
1.96
(0.93)
Italy 3979 2.06
(29.06)
1.76
(9.43)
498.38
(73.17)
4.96
(6.17)
0.51
(5.95)
0.69
(8.09)
2.57
(8.64)
10.30
(19.63)
-0.41
(14.91)
0.46
(15.43)
2.00
(7.40)
0.85
(4.24)
0.08
(3.23)
0.07
(3.02)
2.07
(1.02)

PREDICTORS OF SCHOOL VIOLENCE INTERNATIONALLY 38
Japan 4414 3.06
(52.07)
0.80
(11.34)
569.83
(84.68)
4.24
(7.01)
0.50
(8.18)
0.29
(8.24)
2.94
(5.01)
10.75
(25.64)
-1.75
(23.50)
-1.48
(24.80)
2.09
(11.27)
0.97
(2.57)
0.02
(2.13)
0.01
(1.46)
2.13
(0.83)
Jordan 7694 3.61
(14.16)
2.25
(3.42)
405.88
(99.23)
4.91
(2.09)
0.51
(1.96)
0.98
(2.66)
2.60
(3.05)
9.54
(6.90)
0.78
(5.00)
0.50
(5.82)
2.45
(3.05)
0.65
(1.87)
0.21
(1.61)
0.14
(1.36)
2.42
(0.87)
Kazakhstan 4390 2.13
(19.89)
1.90
(5.49)
486.95
(79.69)
4.22
(4.10)
0.51
(3.49)
0.80
(4.58)
2.71
(4.40)
10.04
(10.99)
0.17
(8.60)
0.79
(7.14)
2.64
(3.44)
0.81
(2.75)
0.08
(1.94)
0.11
(2.16)
1.99
(0.87)
Korea 5166 2.43
(30.47)
1.21
(8.45)
612.79
(89.87)
4.11
(3.69)
0.48
(5.52)
0.40
(6.12)
2.84
(4.24)
11.36
(19.30)
-1.91
(15.02)
-1.37
(16.26)
1.91
(6.79)
0.99
(1.33)
0.01
(0.79)
0.01
(1.07)
2.12
(0.92)
Lebanon 3974 3.62
(13.67)
2.18
(3.46)
449.33
(74.75)
4.55
(3.95)
0.45
(1.91)
0.91
(2.61)
1.11
(2.87)
9.36
(7.29)
0.36
(5.66)
0.50
(5.15)
2.21
(3.00)
0.77
(1.62)
0.07
(0.95)
0.17
(1.43)
2.35
(0.81)
Lithuania 4747 2.92
(7.39)
1.39
(2.33)
502.37
(78.95)
4.05
(1.37)
0.51
(1.31)
0.67
(1.81)
2.78
(1.37)
10.44
(4.01)
-0.35
(3.97)
0.19
(3.34)
2.18
(1.61)
0.92
(0.69)
0.06
(0.63)
0.01
(0.30)
1.89
(0.92)
Macedonia 4062 2.56
(7.69)
1.99
(2.43)
426.14
(108.64)
4.23
(1.14)
0.51
(1.21)
0.70
(1.71)
2.74
(1.64)
9.91
(3.83)
0.57
(3.42)
0.64
(3.07)
2.48
(1.69)
0.85
(0.85)
0.06
(0.57)
0.09
(0.68)
2.42
(1.01)
Malaysia 5733 3.28
(24.54)
1.23
(7.53)
439.82
(91.85)
3.92
(2.32)
0.49
(4.18)
0.45
(4.63)
1.97
(9.32)
9.08
(14.18)
-0.07
(12.02)
-1.02
(12.31)
2.10
(5.25)
0.88
(2.67)
0.05
(1.84)
0.06
(2.05)
1.77
(0.93)
Morocco 8986 3.34
(21.14)
2.05
(6.25)
371.15
(85.55)
4.26
(7.60)
0.53
(3.26)
0.80
(4.24)
2.02
(6.83)
8.04
(14.35)
0.69
(8.15)
0.19
(10.47)
2.71
(3.43)
0.92
(1.79)
0.03
(1.06)
0.05
(1.48)
1.87
(1.02)
New Zealand 5336 3.31
(10.21)
1.79
(2.76)
487.78
(84.78)
4.31
(1.54)
0.53
(1.62)
0.77
(2.28)
2.69
(2.11)
10.94
(5.48)
-0.47
(5.12)
-0.15
(4.78)
2.09
(2.30)
0.58
(1.60)
0.23
(1.36)
0.19
(1.28)
2.15
(0.91)
Norway 3862 1.94
(10.20)
1.74
(3.51)
474.64
(64.73)
4.99
(1.02)
0.51
(2.00)
0.88
(2.96)
2.76
(2.31)
11.59
(6.18)
-0.41
(5.74)
0.19
(5.25)
2.22
(2.88)
0.78
(1.67)
0.14
(1.39)
0.08
(1.11)
1.99
(0.83)
Oman 9542 4.27
(7.47)
2.15
(1.92)
366.15
(108.16)
4.74
(1.62)
0.49
(1.07)
0.93
(1.35)
2.05
(2.17)
9.05
(4.29)
0.50
(2.63)
0.03
(3.23)
2.47
(1.47)
0.74
(0.93)
0.08
(0.59)
0.17
(0.81)
2.36
(0.79)
Palestine 7812 3.58
(11.14)
2.22
(3.15)
404.18
(100.43)
4.95
(1.88)
0.48
(1.68)
0.89
(2.25)
2.75
(2.14)
9.17
(6.23)
0.65
(4.42)
0.21
(5.11)
2.40
(2.54)
0.79
(1.37)
0.11
(1.05)
0.10
(1.02)
2.01
(0.89)
Qatar 4422 3.65
(6.17)
2.10
(1.56)
409.60
(110.16)
4.86
(1.36)
0.50
(0.82)
0.89
(1.12)
2.05
(1.64)
10.67
(2.76)
0.09
(2.72)
0.17
(2.54)
2.08
(1.44)
0.37
(0.79)
0.20
(0.66)
0.43
(0.81)
1.98
(1.11)
Romania 5523 3.66
(20.82)
1.52
(6.65)
457.95
(101.86)
4.07
(3.88)
0.52
(3.18)
0.51
(4.22)
2.91
(2.26)
9.89
(11.06)
-0.05
(9.55)
0.28
(8.40)
2.37
(4.38)
0.99
(0.74)
0.01
(0.47)
0.01
(0.58)
2.14
(1.00)
Russia 4893 2.65
(42.67)
1.84
(13.96)
538.98
(81.13)
4.08
(8.27)
0.51
(7.73)
0.67
(10.52)
2.74
(9.69)
10.84
(23.78)
-0.10
(21.05)
0.56
(18.95)
2.28
(9.58)
0.83
(5.75)
0.12
(5.07)
0.04
(3.16)
2.17
(0.98)
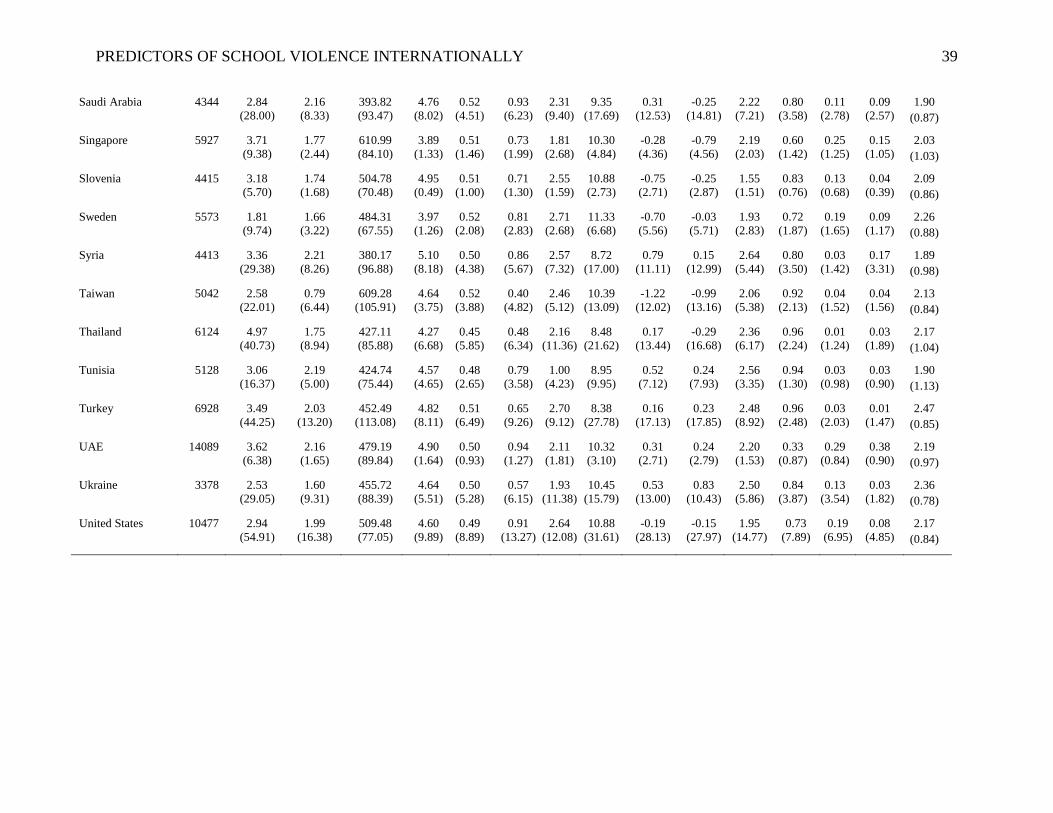
PREDICTORS OF SCHOOL VIOLENCE INTERNATIONALLY 39
Saudi Arabia 4344 2.84
(28.00)
2.16
(8.33)
393.82
(93.47)
4.76
(8.02)
0.52
(4.51)
0.93
(6.23)
2.31
(9.40)
9.35
(17.69)
0.31
(12.53)
-0.25
(14.81)
2.22
(7.21)
0.80
(3.58)
0.11
(2.78)
0.09
(2.57)
1.90
(0.87)
Singapore 5927 3.71
(9.38)
1.77
(2.44)
610.99
(84.10)
3.89
(1.33)
0.51
(1.46)
0.73
(1.99)
1.81
(2.68)
10.30
(4.84)
-0.28
(4.36)
-0.79
(4.56)
2.19
(2.03)
0.60
(1.42)
0.25
(1.25)
0.15
(1.05)
2.03
(1.03)
Slovenia 4415 3.18
(5.70)
1.74
(1.68)
504.78
(70.48)
4.95
(0.49)
0.51
(1.00)
0.71
(1.30)
2.55
(1.59)
10.88
(2.73)
-0.75
(2.71)
-0.25
(2.87)
1.55
(1.51)
0.83
(0.76)
0.13
(0.68)
0.04
(0.39)
2.09
(0.86)
Sweden 5573 1.81
(9.74)
1.66
(3.22)
484.31
(67.55)
3.97
(1.26)
0.52
(2.08)
0.81
(2.83)
2.71
(2.68)
11.33
(6.68)
-0.70
(5.56)
-0.03
(5.71)
1.93
(2.83)
0.72
(1.87)
0.19
(1.65)
0.09
(1.17)
2.26
(0.88)
Syria 4413 3.36
(29.38)
2.21
(8.26)
380.17
(96.88)
5.10
(8.18)
0.50
(4.38)
0.86
(5.67)
2.57
(7.32)
8.72
(17.00)
0.79
(11.11)
0.15
(12.99)
2.64
(5.44)
0.80
(3.50)
0.03
(1.42)
0.17
(3.31)
1.89
(0.98)
Taiwan 5042 2.58
(22.01)
0.79
(6.44)
609.28
(105.91)
4.64
(3.75)
0.52
(3.88)
0.40
(4.82)
2.46
(5.12)
10.39
(13.09)
-1.22
(12.02)
-0.99
(13.16)
2.06
(5.38)
0.92
(2.13)
0.04
(1.52)
0.04
(1.56)
2.13
(0.84)
Thailand 6124 4.97
(40.73)
1.75
(8.94)
427.11
(85.88)
4.27
(6.68)
0.45
(5.85)
0.48
(6.34)
2.16
(11.36)
8.48
(21.62)
0.17
(13.44)
-0.29
(16.68)
2.36
(6.17)
0.96
(2.24)
0.01
(1.24)
0.03
(1.89)
2.17
(1.04)
Tunisia 5128 3.06
(16.37)
2.19
(5.00)
424.74
(75.44)
4.57
(4.65)
0.48
(2.65)
0.79
(3.58)
1.00
(4.23)
8.95
(9.95)
0.52
(7.12)
0.24
(7.93)
2.56
(3.35)
0.94
(1.30)
0.03
(0.98)
0.03
(0.90)
1.90
(1.13)
Turkey 6928 3.49
(44.25)
2.03
(13.20)
452.49
(113.08)
4.82
(8.11)
0.51
(6.49)
0.65
(9.26)
2.70
(9.12)
8.38
(27.78)
0.16
(17.13)
0.23
(17.85)
2.48
(8.92)
0.96
(2.48)
0.03
(2.03)
0.01
(1.47)
2.47
(0.85)
UAE 14089 3.62
(6.38)
2.16
(1.65)
479.19
(89.84)
4.90
(1.64)
0.50
(0.93)
0.94
(1.27)
2.11
(1.81)
10.32
(3.10)
0.31
(2.71)
0.24
(2.79)
2.20
(1.53)
0.33
(0.87)
0.29
(0.84)
0.38
(0.90)
2.19
(0.97)
Ukraine 3378 2.53
(29.05)
1.60
(9.31)
455.72
(88.39)
4.64
(5.51)
0.50
(5.28)
0.57
(6.15)
1.93
(11.38)
10.45
(15.79)
0.53
(13.00)
0.83
(10.43)
2.50
(5.86)
0.84
(3.87)
0.13
(3.54)
0.03
(1.82)
2.36
(0.78)
United States 10477 2.94
(54.91)
1.99
(16.38)
509.48
(77.05)
4.60
(9.89)
0.49
(8.89)
0.91
(13.27)
2.64
(12.08)
10.88
(31.61)
-0.19
(28.13)
-0.15
(27.97)
1.95
(14.77)
0.73
(7.89)
0.19
(6.95)
0.08
(4.85)
2.17
(0.84)
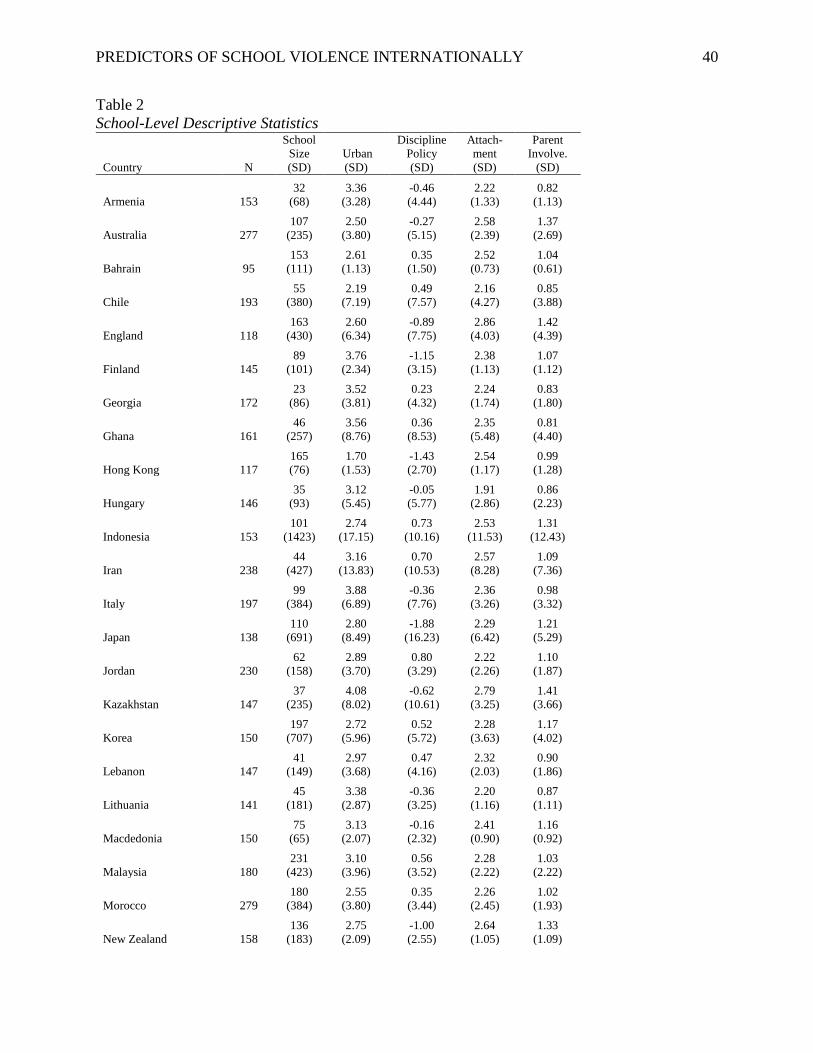
PREDICTORS OF SCHOOL VIOLENCE INTERNATIONALLY 40
Table 2
School-Level Descriptive Statistics
Country N
School
Size
(SD)
Urban
(SD)
Discipline
Policy
(SD)
Attach-
ment
(SD)
Parent
Involve.
(SD)
Armenia 153
32
(68)
3.36
(3.28)
-0.46
(4.44)
2.22
(1.33)
0.82
(1.13)
Australia 277
107
(235)
2.50
(3.80)
-0.27
(5.15)
2.58
(2.39)
1.37
(2.69)
Bahrain 95
153
(111)
2.61
(1.13)
0.35
(1.50)
2.52
(0.73)
1.04
(0.61)
Chile 193
55
(380)
2.19
(7.19)
0.49
(7.57)
2.16
(4.27)
0.85
(3.88)
England 118
163
(430)
2.60
(6.34)
-0.89
(7.75)
2.86
(4.03)
1.42
(4.39)
Finland 145
89
(101)
3.76
(2.34)
-1.15
(3.15)
2.38
(1.13)
1.07
(1.12)
Georgia 172
23
(86)
3.52
(3.81)
0.23
(4.32)
2.24
(1.74)
0.83
(1.80)
Ghana 161
46
(257)
3.56
(8.76)
0.36
(8.53)
2.35
(5.48)
0.81
(4.40)
Hong Kong 117
165
(76)
1.70
(1.53)
-1.43
(2.70)
2.54
(1.17)
0.99
(1.28)
Hungary 146
35
(93)
3.12
(5.45)
-0.05
(5.77)
1.91
(2.86)
0.86
(2.23)
Indonesia 153
101
(1423)
2.74
(17.15)
0.73
(10.16)
2.53
(11.53)
1.31
(12.43)
Iran 238
44
(427)
3.16
(13.83)
0.70
(10.53)
2.57
(8.28)
1.09
(7.36)
Italy 197
99
(384)
3.88
(6.89)
-0.36
(7.76)
2.36
(3.26)
0.98
(3.32)
Japan 138
110
(691)
2.80
(8.49)
-1.88
(16.23)
2.29
(6.42)
1.21
(5.29)
Jordan 230
62
(158)
2.89
(3.70)
0.80
(3.29)
2.22
(2.26)
1.10
(1.87)
Kazakhstan 147
37
(235)
4.08
(8.02)
-0.62
(10.61)
2.79
(3.25)
1.41
(3.66)
Korea 150
197
(707)
2.72
(5.96)
0.52
(5.72)
2.28
(3.63)
1.17
(4.02)
Lebanon 147
41
(149)
2.97
(3.68)
0.47
(4.16)
2.32
(2.03)
0.90
(1.86)
Lithuania 141
45
(181)
3.38
(2.87)
-0.36
(3.25)
2.20
(1.16)
0.87
(1.11)
Macdedonia 150
75
(65)
3.13
(2.07)
-0.16
(2.32)
2.41
(0.90)
1.16
(0.92)
Malaysia 180
231
(423)
3.10
(3.96)
0.56
(3.52)
2.28
(2.22)
1.03
(2.22)
Morocco 279
180
(384)
2.55
(3.80)
0.35
(3.44)
2.26
(2.45)
1.02
(1.93)
New Zealand 158
136
(183)
2.75
(2.09)
-1.00
(2.55)
2.64
(1.05)
1.33
(1.09)
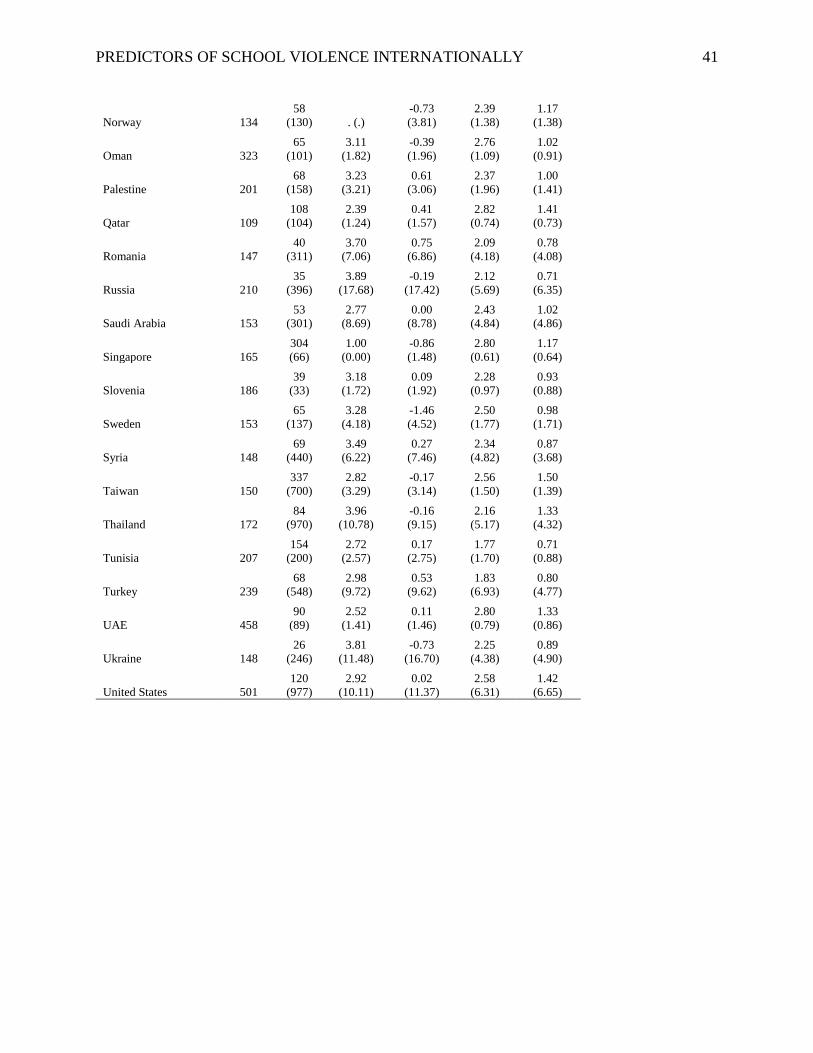
PREDICTORS OF SCHOOL VIOLENCE INTERNATIONALLY 41
Norway 134
58
(130) . (.)
-0.73
(3.81)
2.39
(1.38)
1.17
(1.38)
Oman 323
65
(101)
3.11
(1.82)
-0.39
(1.96)
2.76
(1.09)
1.02
(0.91)
Palestine 201
68
(158)
3.23
(3.21)
0.61
(3.06)
2.37
(1.96)
1.00
(1.41)
Qatar 109
108
(104)
2.39
(1.24)
0.41
(1.57)
2.82
(0.74)
1.41
(0.73)
Romania 147
40
(311)
3.70
(7.06)
0.75
(6.86)
2.09
(4.18)
0.78
(4.08)
Russia 210
35
(396)
3.89
(17.68)
-0.19
(17.42)
2.12
(5.69)
0.71
(6.35)
Saudi Arabia 153
53
(301)
2.77
(8.69)
0.00
(8.78)
2.43
(4.84)
1.02
(4.86)
Singapore 165
304
(66)
1.00
(0.00)
-0.86
(1.48)
2.80
(0.61)
1.17
(0.64)
Slovenia 186
39
(33)
3.18
(1.72)
0.09
(1.92)
2.28
(0.97)
0.93
(0.88)
Sweden 153
65
(137)
3.28
(4.18)
-1.46
(4.52)
2.50
(1.77)
0.98
(1.71)
Syria 148
69
(440)
3.49
(6.22)
0.27
(7.46)
2.34
(4.82)
0.87
(3.68)
Taiwan 150
337
(700)
2.82
(3.29)
-0.17
(3.14)
2.56
(1.50)
1.50
(1.39)
Thailand 172
84
(970)
3.96
(10.78)
-0.16
(9.15)
2.16
(5.17)
1.33
(4.32)
Tunisia 207
154
(200)
2.72
(2.57)
0.17
(2.75)
1.77
(1.70)
0.71
(0.88)
Turkey 239
68
(548)
2.98
(9.72)
0.53
(9.62)
1.83
(6.93)
0.80
(4.77)
UAE 458
90
(89)
2.52
(1.41)
0.11
(1.46)
2.80
(0.79)
1.33
(0.86)
Ukraine 148
26
(246)
3.81
(11.48)
-0.73
(16.70)
2.25
(4.38)
0.89
(4.90)
United States 501
120
(977)
2.92
(10.11)
0.02
(11.37)
2.58
(6.31)
1.42
(6.65)

PREDICTORS OF SCHOOL VIOLENCE INTERNATIONALLY 42
Table 3
Within-School Parameter Estimates (Set I) Country 0-PARM
(SE) INT (SE)
SUPP
(SE) ACH (SE) AGE (SE)
MALE
(SE)
SLFEST
(SE)
Armenia
-0.054
(0.058)
3.691*
(1.851)
0.060
(0.031)
-0.002*
(0.000)
-0.038
(0.050)
0.202*
(0.062)
-0.041
(0.056)
Australia -1.535*
(0.092)
1.897*
(0.516)
0.022
(0.026)
-0.001*
(0.000)
0.007
(0.049)
0.197*
(0.058)
-0.041
(0.034)
Bahrain -1.124*
(0.063)
3.197*
(0.514)
0.021
(0.020)
-0.001*
(0.000)
0.012
(0.023)
0.301*
(0.065)
-0.001
(0.033)
Chile -1.934*
(0.081)
1.594*
(0.759)
0.075*
(0.023)
0.000
(0.001)
0.018
(0.034)
0.293*
(0.042)
-0.122*
(0.036)
England -1.129*
(0.073)
-0.059
(1.212)
0.050
(0.031)
0.000
(0.001)
0.061
(0.047)
0.100*
(0.042)
-0.071
(0.048)
Finland -1.188*
(0.066)
1.626
(1.643)
0.048
(0.031)
-0.001
(0.001)
-0.030
(0.092)
0.231*
(0.050)
0.016
(0.043)
Ghana -2.190*
(0.106)
2.031*
(0.456)
0.020
(0.012)
-0.001*
(0.000)
0.003
(0.006)
0.047*
(0.021)
-0.045*
(0.018)
Georgia -0.222*
(0.066)
3.303*
(1.570)
0.037
(0.033)
-0.001*
(0.000)
0.067
(0.057)
0.115
(0.064)
-0.040
(0.063)
Hong Kong -2.054*
(0.070)
0.794
(0.451)
0.047
(0.024)
0.000
(0.000)
-0.014
(0.027)
0.269*
(0.033)
0.001
(0.033)
Hungary -1.761*
(0.072)
2.568*
(0.633)
0.024
(0.029)
0.000
(0.000)
-0.017
(0.025)
0.037
(0.034)
-0.019
(0.034)
Indonesia -1.191*
(0.081)
2.560*
(0.632)
0.019
(0.028)
0.000
(0.000)
-0.029
(0.022)
0.006
(0.031)
-0.024
(0.031)
Iran -1.206*
(0.062)
1.554*
(0.716)
0.015
(0.022)
-0.001*
(0.000)
-0.004
(0.023)
0.146
(0.192)
-0.048
(0.037)
Italy -1.199*
(0.092)
1.898
(1.037)
0.025
(0.036)
-0.001
(0.001)
0.059
(0.059)
0.080
(0.057)
-0.057
(0.064)
Japan -1.062*
(0.057)
3.759*
(1.239)
-0.010
(0.031)
-0.001*
(0.000)
-0.030
(0.036)
0.328*
(0.046)
0.032
(0.039)
Jordan -1.215*
(0.066)
3.193*
(1.173)
0.068*
(0.025)
-0.002*
(0.000)
-0.020
(0.033)
0.284*
(0.086)
-0.108*
(0.030)
Korea -1.029*
(0.056)
-0.482
(2.135)
0.009
(0.047)
0.000
(0.000)
-0.067
(0.053)
0.212*
(0.099)
-0.012
(0.059)
Kazakhstan -0.251*
(0.071)
2.128
(1.138)
-0.009
(0.037)
-0.001
(0.001)
0.076*
(0.034)
0.177*
(0.043)
-0.040
(0.049)
Lebanon -1.585*
(0.109)
2.554*
(0.508)
0.012
(0.026)
-0.001*
(0.000)
0.032
(0.019)
0.288*
(0.044)
-0.024
(0.031)
Lithuania -1.844*
(0.083)
1.925
(1.786)
0.071*
(0.028)
-0.001*
(0.000)
0.034
(0.038)
0.018
(0.038)
-0.064
(0.046)
Macedonia -0.913*
(0.063)
1.088
(1.224)
0.015
(0.025)
-0.002*
(0.001)
0.001
(0.059)
0.062
(0.054)
-0.061
(0.049)
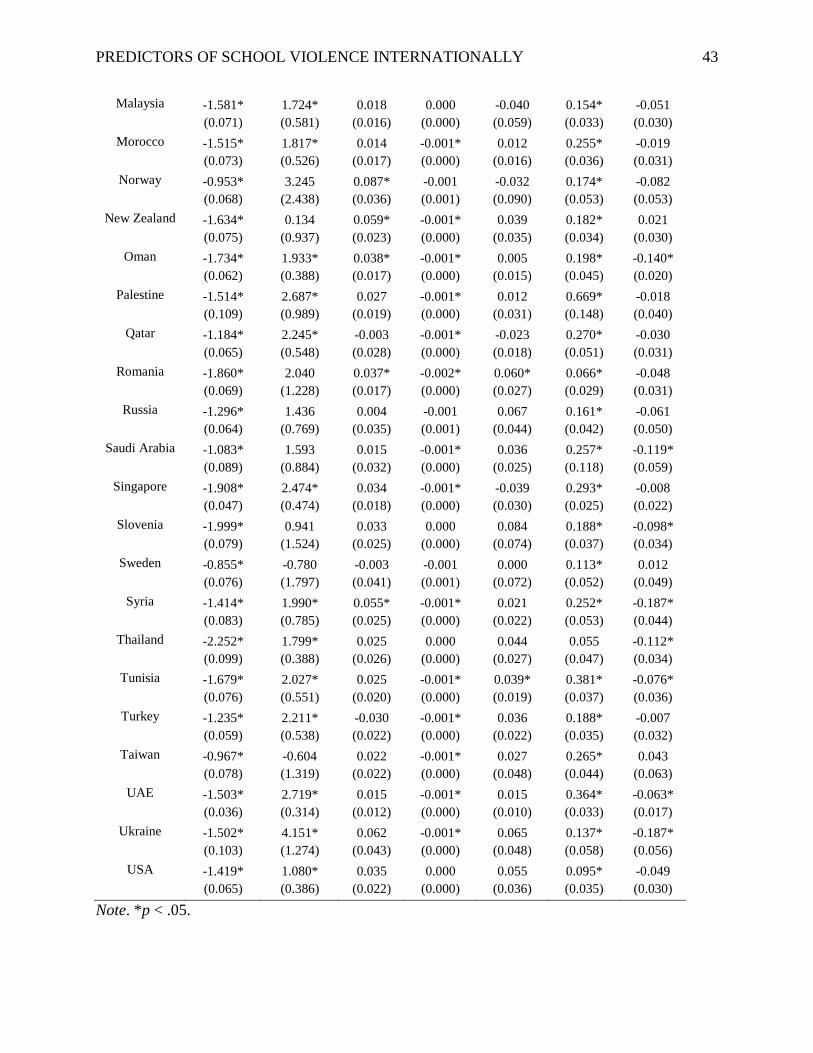
PREDICTORS OF SCHOOL VIOLENCE INTERNATIONALLY 43
Malaysia -1.581*
(0.071)
1.724*
(0.581)
0.018
(0.016)
0.000
(0.000)
-0.040
(0.059)
0.154*
(0.033)
-0.051
(0.030)
Morocco -1.515*
(0.073)
1.817*
(0.526)
0.014
(0.017)
-0.001*
(0.000)
0.012
(0.016)
0.255*
(0.036)
-0.019
(0.031)
Norway -0.953*
(0.068)
3.245
(2.438)
0.087*
(0.036)
-0.001
(0.001)
-0.032
(0.090)
0.174*
(0.053)
-0.082
(0.053)
New Zealand -1.634*
(0.075)
0.134
(0.937)
0.059*
(0.023)
-0.001*
(0.000)
0.039
(0.035)
0.182*
(0.034)
0.021
(0.030)
Oman -1.734*
(0.062)
1.933*
(0.388)
0.038*
(0.017)
-0.001*
(0.000)
0.005
(0.015)
0.198*
(0.045)
-0.140*
(0.020)
Palestine -1.514*
(0.109)
2.687*
(0.989)
0.027
(0.019)
-0.001*
(0.000)
0.012
(0.031)
0.669*
(0.148)
-0.018
(0.040)
Qatar -1.184*
(0.065)
2.245*
(0.548)
-0.003
(0.028)
-0.001*
(0.000)
-0.023
(0.018)
0.270*
(0.051)
-0.030
(0.031)
Romania -1.860*
(0.069)
2.040
(1.228)
0.037*
(0.017)
-0.002*
(0.000)
0.060*
(0.027)
0.066*
(0.029)
-0.048
(0.031)
Russia -1.296*
(0.064)
1.436
(0.769)
0.004
(0.035)
-0.001
(0.001)
0.067
(0.044)
0.161*
(0.042)
-0.061
(0.050)
Saudi Arabia -1.083*
(0.089)
1.593
(0.884)
0.015
(0.032)
-0.001*
(0.000)
0.036
(0.025)
0.257*
(0.118)
-0.119*
(0.059)
Singapore -1.908*
(0.047)
2.474*
(0.474)
0.034
(0.018)
-0.001*
(0.000)
-0.039
(0.030)
0.293*
(0.025)
-0.008
(0.022)
Slovenia -1.999*
(0.079)
0.941
(1.524)
0.033
(0.025)
0.000
(0.000)
0.084
(0.074)
0.188*
(0.037)
-0.098*
(0.034)
Sweden -0.855*
(0.076)
-0.780
(1.797)
-0.003
(0.041)
-0.001
(0.001)
0.000
(0.072)
0.113*
(0.052)
0.012
(0.049)
Syria -1.414*
(0.083)
1.990*
(0.785)
0.055*
(0.025)
-0.001*
(0.000)
0.021
(0.022)
0.252*
(0.053)
-0.187*
(0.044)
Thailand -2.252*
(0.099)
1.799*
(0.388)
0.025
(0.026)
0.000
(0.000)
0.044
(0.027)
0.055
(0.047)
-0.112*
(0.034)
Tunisia -1.679*
(0.076)
2.027*
(0.551)
0.025
(0.020)
-0.001*
(0.000)
0.039*
(0.019)
0.381*
(0.037)
-0.076*
(0.036)
Turkey -1.235*
(0.059)
2.211*
(0.538)
-0.030
(0.022)
-0.001*
(0.000)
0.036
(0.022)
0.188*
(0.035)
-0.007
(0.032)
Taiwan -0.967*
(0.078)
-0.604
(1.319)
0.022
(0.022)
-0.001*
(0.000)
0.027
(0.048)
0.265*
(0.044)
0.043
(0.063)
UAE -1.503*
(0.036)
2.719*
(0.314)
0.015
(0.012)
-0.001*
(0.000)
0.015
(0.010)
0.364*
(0.033)
-0.063*
(0.017)
Ukraine -1.502*
(0.103)
4.151*
(1.274)
0.062
(0.043)
-0.001*
(0.000)
0.065
(0.048)
0.137*
(0.058)
-0.187*
(0.056)
USA -1.419*
(0.065)
1.080*
(0.386)
0.035
(0.022)
0.000
(0.000)
0.055
(0.036)
0.095*
(0.035)
-0.049
(0.030)
Note. *p < .05.

PREDICTORS OF SCHOOL VIOLENCE INTERNATIONALLY 44
Table 4
Within-School Parameter Estimates (Set II) Country TEAREL
(SE)
PINV
(SE)
SATCH
(SE) SES (SE)
CHIMM
(SE)
FGNBOR
(SE)
AGEIMM
(SE)
LANG
(SE)
Armenia -0.111*
(0.029)
-0.059*
(0.027)
0.003
(0.041)
-0.019
(0.023)
0.121
(0.096)
-0.770*
(0.390)
0.315*
(0.127)
0.046
(0.051)
Australia -0.004
(0.021)
0.017
(0.013)
-0.185*
(0.028)
0.048*
(0.016)
-0.076
(0.058)
-0.161
(0.173)
0.034
(0.069)
-0.063
(0.041)
Bahrain -0.035*
(0.012)
0.003
(0.010)
-0.046*
(0.019)
-0.011
(0.010)
0.042
(0.053)
0.225*
(0.074)
-0.036
(0.033)
-0.045*
(0.017)
Chile -0.003
(0.015)
0.013
(0.014)
-0.186*
(0.023)
-0.009
(0.016)
0.203
(0.114)
0.182
(0.319)
0.019
(0.128)
-0.043
(0.037)
England -0.003
(0.018)
-0.014
(0.015)
-0.185*
(0.026)
0.024
(0.016)
-0.004
(0.069)
-0.028
(0.167)
0.032
(0.070)
-0.104*
(0.044)
Finland -0.003
(0.022)
0.023
(0.015)
-0.279*
(0.027)
0.042*
(0.016)
0.050
(0.079)
0.400
(0.303)
-0.156
(0.112)
-0.070
(0.044)
Ghana -0.011
(0.010)
0.016
(0.009)
-0.026
(0.018)
0.009
(0.005)
0.007
(0.038)
-0.147
(0.080)
0.099*
(0.034)
0.023
(0.014)
Georgia -0.023
(0.034)
-0.026
(0.025)
-0.082*
(0.039)
-0.051*
(0.019)
0.228*
(0.105)
0.282
(0.232)
-0.053
(0.105)
-0.086
(0.059)
Hong Kong -0.023
(0.015)
0.041*
(0.010)
-0.060*
(0.024)
-0.012
(0.009)
0.121*
(0.035)
-0.122
(0.083)
0.071*
(0.033)
-0.027
(0.027)
Hungary 0.006
(0.015)
0.011
(0.014)
-0.116*
(0.022)
-0.004
(0.013)
-0.012
(0.070)
-0.185
(0.209)
0.061
(0.087)
-0.163*
(0.047)
Indonesia 0.005
(0.016)
0.015
(0.011)
-0.011
(0.030)
0.010
(0.012)
0.176*
(0.059)
0.067
(0.112)
0.020
(0.057)
-0.016
(0.022)
Iran -0.031*
(0.012)
-0.012
(0.016)
-0.032
(0.027)
-0.015
(0.010)
-0.048
(0.076)
0.209
(0.152)
-0.035
(0.066)
-0.008
(0.023)
Italy 0.019
(0.028)
0.012
(0.023)
-0.200*
(0.050)
0.018
(0.021)
-0.003
(0.093)
0.257
(0.254)
-0.015
(0.091)
-0.025
(0.042)
Japan -0.010
(0.024)
0.058*
(0.012)
-0.163*
(0.020)
0.053*
(0.014)
0.130
(0.122)
-0.037
(0.401)
-0.053
(0.163)
-0.129*
(0.050)
Jordan -0.021
(0.017)
0.008
(0.015)
-0.076*
(0.030)
-0.013
(0.012)
0.032
(0.049)
0.372*
(0.084)
-0.081*
(0.037)
-0.008
(0.024)
Korea 0.001
(0.015)
0.016
(0.015)
-0.183*
(0.034)
0.031
(0.023)
-0.060
(0.117)
-0.197
(0.579)
0.073
(0.248)
-0.195*
(0.063)
Kazakhstan 0.029
(0.021)
-0.019
(0.021)
-0.218*
(0.042)
0.007
(0.015)
-0.083
(0.069)
0.003
(0.145)
0.015
(0.072)
0.028
(0.040)
Lebanon -0.026
(0.015)
0.035
(0.019)
0.020
(0.023)
-0.004
(0.014)
0.147*
(0.074)
0.243*
(0.101)
-0.047
(0.039)
-0.011
(0.024)
Lithuania 0.004
(0.016)
0.002
(0.018)
-0.339*
(0.026)
-0.004
(0.015)
0.023
(0.104)
-1.449*
(0.568)
0.526*
(0.217)
0.003
(0.039)
Macedonia 0.020
(0.020)
-0.062*
(0.020)
-0.120*
(0.043)
-0.014
(0.022)
-0.031
(0.080)
-0.338*
(0.159)
0.252*
(0.075)
-0.002
(0.045)
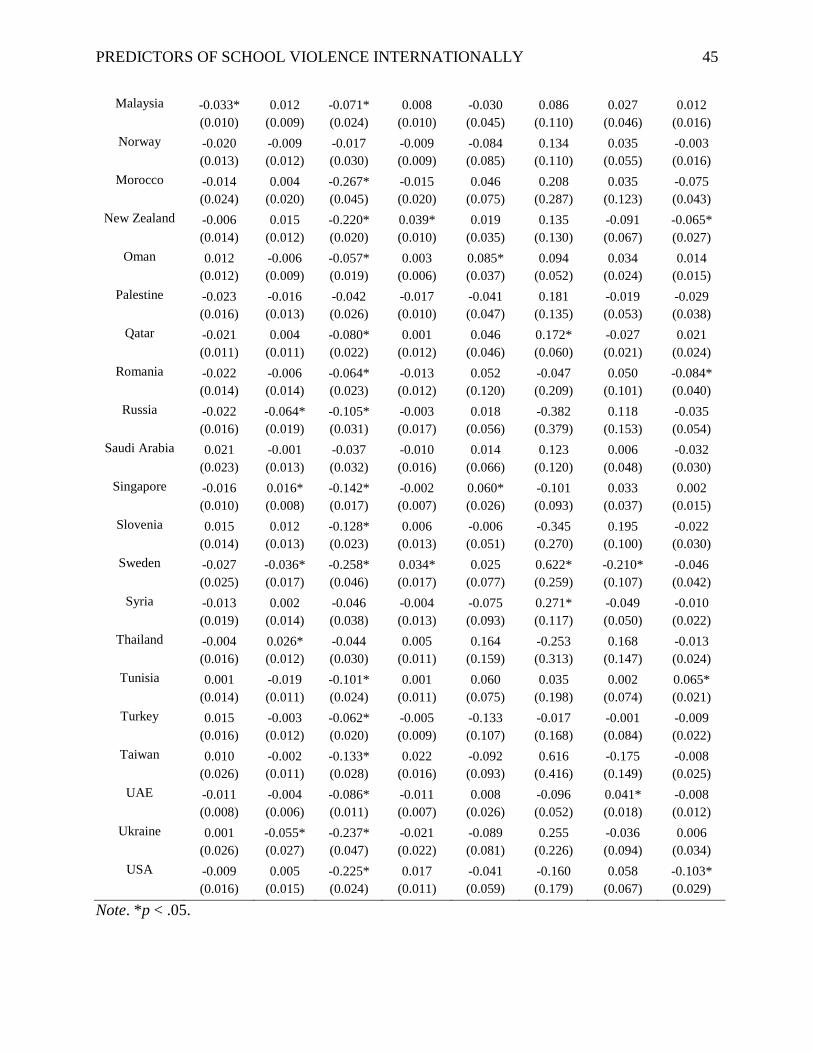
PREDICTORS OF SCHOOL VIOLENCE INTERNATIONALLY 45
Malaysia -0.033*
(0.010)
0.012
(0.009)
-0.071*
(0.024)
0.008
(0.010)
-0.030
(0.045)
0.086
(0.110)
0.027
(0.046)
0.012
(0.016)
Norway -0.020
(0.013)
-0.009
(0.012)
-0.017
(0.030)
-0.009
(0.009)
-0.084
(0.085)
0.134
(0.110)
0.035
(0.055)
-0.003
(0.016)
Morocco -0.014
(0.024)
0.004
(0.020)
-0.267*
(0.045)
-0.015
(0.020)
0.046
(0.075)
0.208
(0.287)
0.035
(0.123)
-0.075
(0.043)
New Zealand -0.006
(0.014)
0.015
(0.012)
-0.220*
(0.020)
0.039*
(0.010)
0.019
(0.035)
0.135
(0.130)
-0.091
(0.067)
-0.065*
(0.027)
Oman 0.012
(0.012)
-0.006
(0.009)
-0.057*
(0.019)
0.003
(0.006)
0.085*
(0.037)
0.094
(0.052)
0.034
(0.024)
0.014
(0.015)
Palestine -0.023
(0.016)
-0.016
(0.013)
-0.042
(0.026)
-0.017
(0.010)
-0.041
(0.047)
0.181
(0.135)
-0.019
(0.053)
-0.029
(0.038)
Qatar -0.021
(0.011)
0.004
(0.011)
-0.080*
(0.022)
0.001
(0.012)
0.046
(0.046)
0.172*
(0.060)
-0.027
(0.021)
0.021
(0.024)
Romania -0.022
(0.014)
-0.006
(0.014)
-0.064*
(0.023)
-0.013
(0.012)
0.052
(0.120)
-0.047
(0.209)
0.050
(0.101)
-0.084*
(0.040)
Russia -0.022
(0.016)
-0.064*
(0.019)
-0.105*
(0.031)
-0.003
(0.017)
0.018
(0.056)
-0.382
(0.379)
0.118
(0.153)
-0.035
(0.054)
Saudi Arabia 0.021
(0.023)
-0.001
(0.013)
-0.037
(0.032)
-0.010
(0.016)
0.014
(0.066)
0.123
(0.120)
0.006
(0.048)
-0.032
(0.030)
Singapore -0.016
(0.010)
0.016*
(0.008)
-0.142*
(0.017)
-0.002
(0.007)
0.060*
(0.026)
-0.101
(0.093)
0.033
(0.037)
0.002
(0.015)
Slovenia 0.015
(0.014)
0.012
(0.013)
-0.128*
(0.023)
0.006
(0.013)
-0.006
(0.051)
-0.345
(0.270)
0.195
(0.100)
-0.022
(0.030)
Sweden -0.027
(0.025)
-0.036*
(0.017)
-0.258*
(0.046)
0.034*
(0.017)
0.025
(0.077)
0.622*
(0.259)
-0.210*
(0.107)
-0.046
(0.042)
Syria -0.013
(0.019)
0.002
(0.014)
-0.046
(0.038)
-0.004
(0.013)
-0.075
(0.093)
0.271*
(0.117)
-0.049
(0.050)
-0.010
(0.022)
Thailand -0.004
(0.016)
0.026*
(0.012)
-0.044
(0.030)
0.005
(0.011)
0.164
(0.159)
-0.253
(0.313)
0.168
(0.147)
-0.013
(0.024)
Tunisia 0.001
(0.014)
-0.019
(0.011)
-0.101*
(0.024)
0.001
(0.011)
0.060
(0.075)
0.035
(0.198)
0.002
(0.074)
0.065*
(0.021)
Turkey 0.015
(0.016)
-0.003
(0.012)
-0.062*
(0.020)
-0.005
(0.009)
-0.133
(0.107)
-0.017
(0.168)
-0.001
(0.084)
-0.009
(0.022)
Taiwan 0.010
(0.026)
-0.002
(0.011)
-0.133*
(0.028)
0.022
(0.016)
-0.092
(0.093)
0.616
(0.416)
-0.175
(0.149)
-0.008
(0.025)
UAE -0.011
(0.008)
-0.004
(0.006)
-0.086*
(0.011)
-0.011
(0.007)
0.008
(0.026)
-0.096
(0.052)
0.041*
(0.018)
-0.008
(0.012)
Ukraine 0.001
(0.026)
-0.055*
(0.027)
-0.237*
(0.047)
-0.021
(0.022)
-0.089
(0.081)
0.255
(0.226)
-0.036
(0.094)
0.006
(0.034)
USA -0.009
(0.016)
0.005
(0.015)
-0.225*
(0.024)
0.017
(0.011)
-0.041
(0.059)
-0.160
(0.179)
0.058
(0.067)
-0.103*
(0.029)
Note. *p < .05.
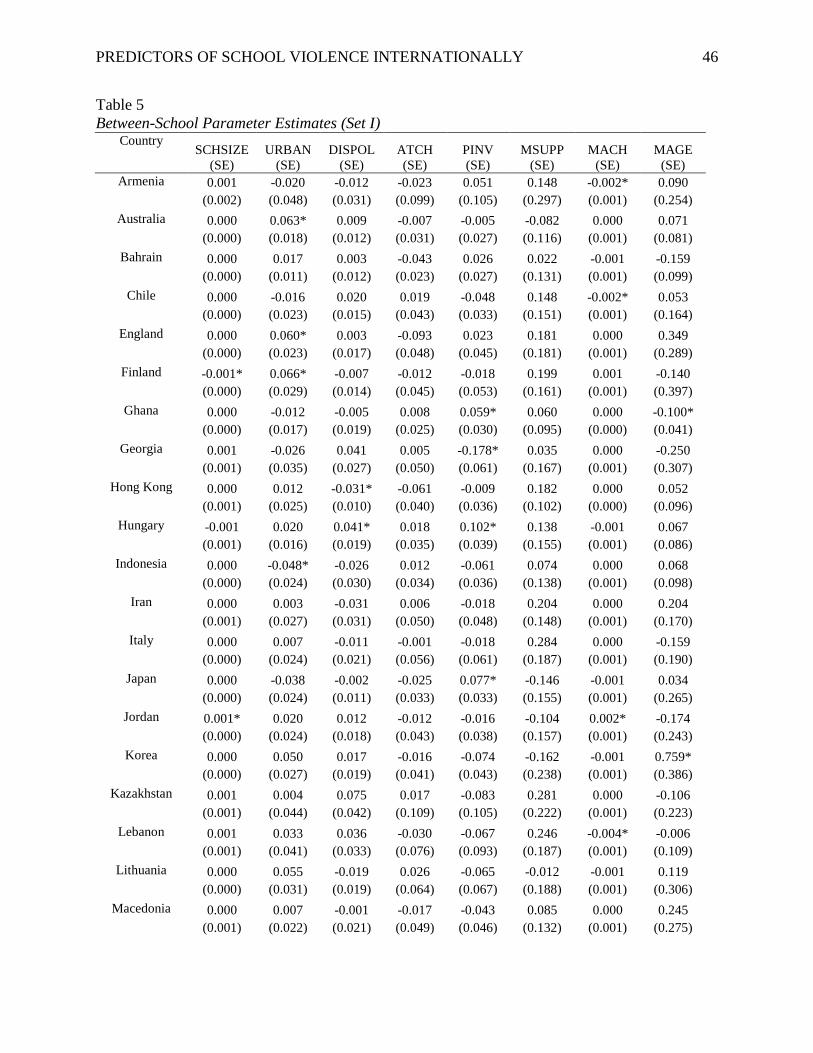
PREDICTORS OF SCHOOL VIOLENCE INTERNATIONALLY 46
Table 5
Between-School Parameter Estimates (Set I) Country
SCHSIZE
(SE)
URBAN
(SE)
DISPOL
(SE)
ATCH
(SE)
PINV
(SE)
MSUPP
(SE)
MACH
(SE)
MAGE
(SE)
Armenia 0.001
(0.002)
-0.020
(0.048)
-0.012
(0.031)
-0.023
(0.099)
0.051
(0.105)
0.148
(0.297)
-0.002*
(0.001)
0.090
(0.254)
Australia 0.000
(0.000)
0.063*
(0.018)
0.009
(0.012)
-0.007
(0.031)
-0.005
(0.027)
-0.082
(0.116)
0.000
(0.001)
0.071
(0.081)
Bahrain 0.000
(0.000)
0.017
(0.011)
0.003
(0.012)
-0.043
(0.023)
0.026
(0.027)
0.022
(0.131)
-0.001
(0.001)
-0.159
(0.099)
Chile 0.000
(0.000)
-0.016
(0.023)
0.020
(0.015)
0.019
(0.043)
-0.048
(0.033)
0.148
(0.151)
-0.002*
(0.001)
0.053
(0.164)
England 0.000
(0.000)
0.060*
(0.023)
0.003
(0.017)
-0.093
(0.048)
0.023
(0.045)
0.181
(0.181)
0.000
(0.001)
0.349
(0.289)
Finland -0.001*
(0.000)
0.066*
(0.029)
-0.007
(0.014)
-0.012
(0.045)
-0.018
(0.053)
0.199
(0.161)
0.001
(0.001)
-0.140
(0.397)
Ghana 0.000
(0.000)
-0.012
(0.017)
-0.005
(0.019)
0.008
(0.025)
0.059*
(0.030)
0.060
(0.095)
0.000
(0.000)
-0.100*
(0.041)
Georgia 0.001
(0.001)
-0.026
(0.035)
0.041
(0.027)
0.005
(0.050)
-0.178*
(0.061)
0.035
(0.167)
0.000
(0.001)
-0.250
(0.307)
Hong Kong 0.000
(0.001)
0.012
(0.025)
-0.031*
(0.010)
-0.061
(0.040)
-0.009
(0.036)
0.182
(0.102)
0.000
(0.000)
0.052
(0.096)
Hungary -0.001
(0.001)
0.020
(0.016)
0.041*
(0.019)
0.018
(0.035)
0.102*
(0.039)
0.138
(0.155)
-0.001
(0.001)
0.067
(0.086)
Indonesia 0.000
(0.000)
-0.048*
(0.024)
-0.026
(0.030)
0.012
(0.034)
-0.061
(0.036)
0.074
(0.138)
0.000
(0.001)
0.068
(0.098)
Iran 0.000
(0.001)
0.003
(0.027)
-0.031
(0.031)
0.006
(0.050)
-0.018
(0.048)
0.204
(0.148)
0.000
(0.001)
0.204
(0.170)
Italy 0.000
(0.000)
0.007
(0.024)
-0.011
(0.021)
-0.001
(0.056)
-0.018
(0.061)
0.284
(0.187)
0.000
(0.001)
-0.159
(0.190)
Japan 0.000
(0.000)
-0.038
(0.024)
-0.002
(0.011)
-0.025
(0.033)
0.077*
(0.033)
-0.146
(0.155)
-0.001
(0.001)
0.034
(0.265)
Jordan 0.001*
(0.000)
0.020
(0.024)
0.012
(0.018)
-0.012
(0.043)
-0.016
(0.038)
-0.104
(0.157)
0.002*
(0.001)
-0.174
(0.243)
Korea 0.000
(0.000)
0.050
(0.027)
0.017
(0.019)
-0.016
(0.041)
-0.074
(0.043)
-0.162
(0.238)
-0.001
(0.001)
0.759*
(0.386)
Kazakhstan 0.001
(0.001)
0.004
(0.044)
0.075
(0.042)
0.017
(0.109)
-0.083
(0.105)
0.281
(0.222)
0.000
(0.001)
-0.106
(0.223)
Lebanon 0.001
(0.001)
0.033
(0.041)
0.036
(0.033)
-0.030
(0.076)
-0.067
(0.093)
0.246
(0.187)
-0.004*
(0.001)
-0.006
(0.109)
Lithuania 0.000
(0.000)
0.055
(0.031)
-0.019
(0.019)
0.026
(0.064)
-0.065
(0.067)
-0.012
(0.188)
-0.001
(0.001)
0.119
(0.306)
Macedonia 0.000
(0.001)
0.007
(0.022)
-0.001
(0.021)
-0.017
(0.049)
-0.043
(0.046)
0.085
(0.132)
0.000
(0.001)
0.245
(0.275)
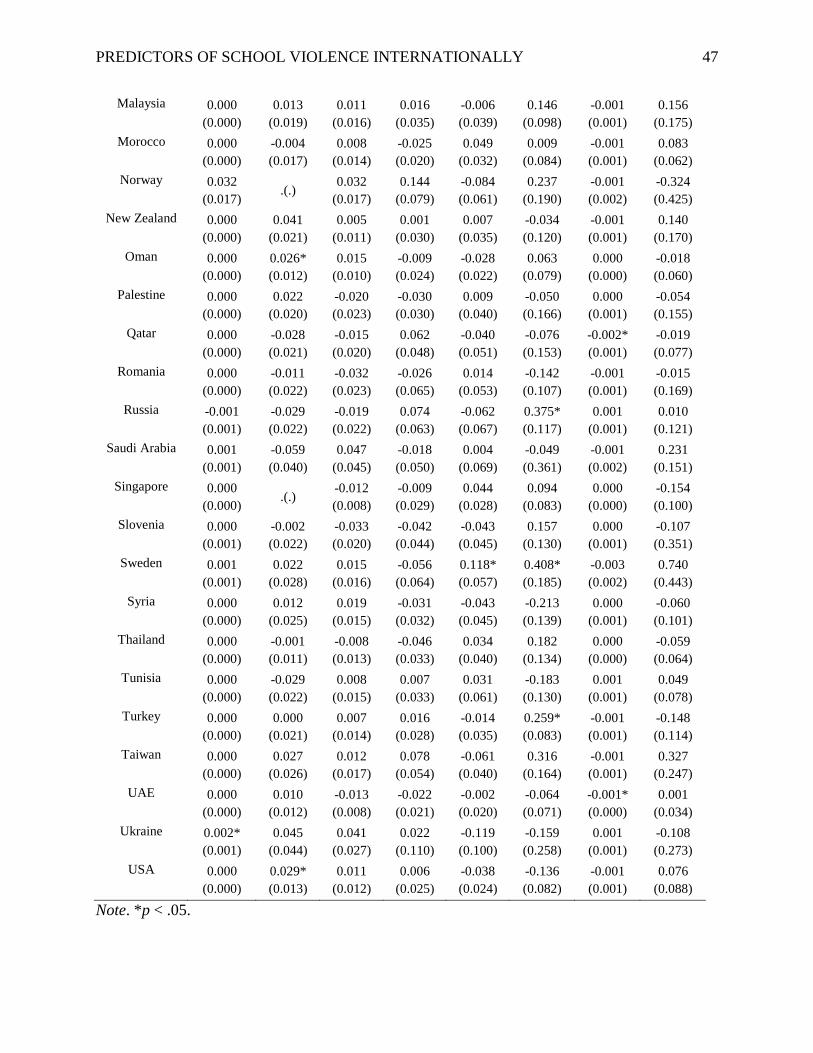
PREDICTORS OF SCHOOL VIOLENCE INTERNATIONALLY 47
Malaysia 0.000
(0.000)
0.013
(0.019)
0.011
(0.016)
0.016
(0.035)
-0.006
(0.039)
0.146
(0.098)
-0.001
(0.001)
0.156
(0.175)
Morocco 0.000
(0.000)
-0.004
(0.017)
0.008
(0.014)
-0.025
(0.020)
0.049
(0.032)
0.009
(0.084)
-0.001
(0.001)
0.083
(0.062)
Norway 0.032
(0.017) .(.)
0.032
(0.017)
0.144
(0.079)
-0.084
(0.061)
0.237
(0.190)
-0.001
(0.002)
-0.324
(0.425)
New Zealand 0.000
(0.000)
0.041
(0.021)
0.005
(0.011)
0.001
(0.030)
0.007
(0.035)
-0.034
(0.120)
-0.001
(0.001)
0.140
(0.170)
Oman 0.000
(0.000)
0.026*
(0.012)
0.015
(0.010)
-0.009
(0.024)
-0.028
(0.022)
0.063
(0.079)
0.000
(0.000)
-0.018
(0.060)
Palestine 0.000
(0.000)
0.022
(0.020)
-0.020
(0.023)
-0.030
(0.030)
0.009
(0.040)
-0.050
(0.166)
0.000
(0.001)
-0.054
(0.155)
Qatar 0.000
(0.000)
-0.028
(0.021)
-0.015
(0.020)
0.062
(0.048)
-0.040
(0.051)
-0.076
(0.153)
-0.002*
(0.001)
-0.019
(0.077)
Romania 0.000
(0.000)
-0.011
(0.022)
-0.032
(0.023)
-0.026
(0.065)
0.014
(0.053)
-0.142
(0.107)
-0.001
(0.001)
-0.015
(0.169)
Russia -0.001
(0.001)
-0.029
(0.022)
-0.019
(0.022)
0.074
(0.063)
-0.062
(0.067)
0.375*
(0.117)
0.001
(0.001)
0.010
(0.121)
Saudi Arabia 0.001
(0.001)
-0.059
(0.040)
0.047
(0.045)
-0.018
(0.050)
0.004
(0.069)
-0.049
(0.361)
-0.001
(0.002)
0.231
(0.151)
Singapore 0.000
(0.000) .(.)
-0.012
(0.008)
-0.009
(0.029)
0.044
(0.028)
0.094
(0.083)
0.000
(0.000)
-0.154
(0.100)
Slovenia 0.000
(0.001)
-0.002
(0.022)
-0.033
(0.020)
-0.042
(0.044)
-0.043
(0.045)
0.157
(0.130)
0.000
(0.001)
-0.107
(0.351)
Sweden 0.001
(0.001)
0.022
(0.028)
0.015
(0.016)
-0.056
(0.064)
0.118*
(0.057)
0.408*
(0.185)
-0.003
(0.002)
0.740
(0.443)
Syria 0.000
(0.000)
0.012
(0.025)
0.019
(0.015)
-0.031
(0.032)
-0.043
(0.045)
-0.213
(0.139)
0.000
(0.001)
-0.060
(0.101)
Thailand 0.000
(0.000)
-0.001
(0.011)
-0.008
(0.013)
-0.046
(0.033)
0.034
(0.040)
0.182
(0.134)
0.000
(0.000)
-0.059
(0.064)
Tunisia 0.000
(0.000)
-0.029
(0.022)
0.008
(0.015)
0.007
(0.033)
0.031
(0.061)
-0.183
(0.130)
0.001
(0.001)
0.049
(0.078)
Turkey 0.000
(0.000)
0.000
(0.021)
0.007
(0.014)
0.016
(0.028)
-0.014
(0.035)
0.259*
(0.083)
-0.001
(0.001)
-0.148
(0.114)
Taiwan 0.000
(0.000)
0.027
(0.026)
0.012
(0.017)
0.078
(0.054)
-0.061
(0.040)
0.316
(0.164)
-0.001
(0.001)
0.327
(0.247)
UAE 0.000
(0.000)
0.010
(0.012)
-0.013
(0.008)
-0.022
(0.021)
-0.002
(0.020)
-0.064
(0.071)
-0.001*
(0.000)
0.001
(0.034)
Ukraine 0.002*
(0.001)
0.045
(0.044)
0.041
(0.027)
0.022
(0.110)
-0.119
(0.100)
-0.159
(0.258)
0.001
(0.001)
-0.108
(0.273)
USA 0.000
(0.000)
0.029*
(0.013)
0.011
(0.012)
0.006
(0.025)
-0.038
(0.024)
-0.136
(0.082)
-0.001
(0.001)
0.076
(0.088)
Note. *p < .05.
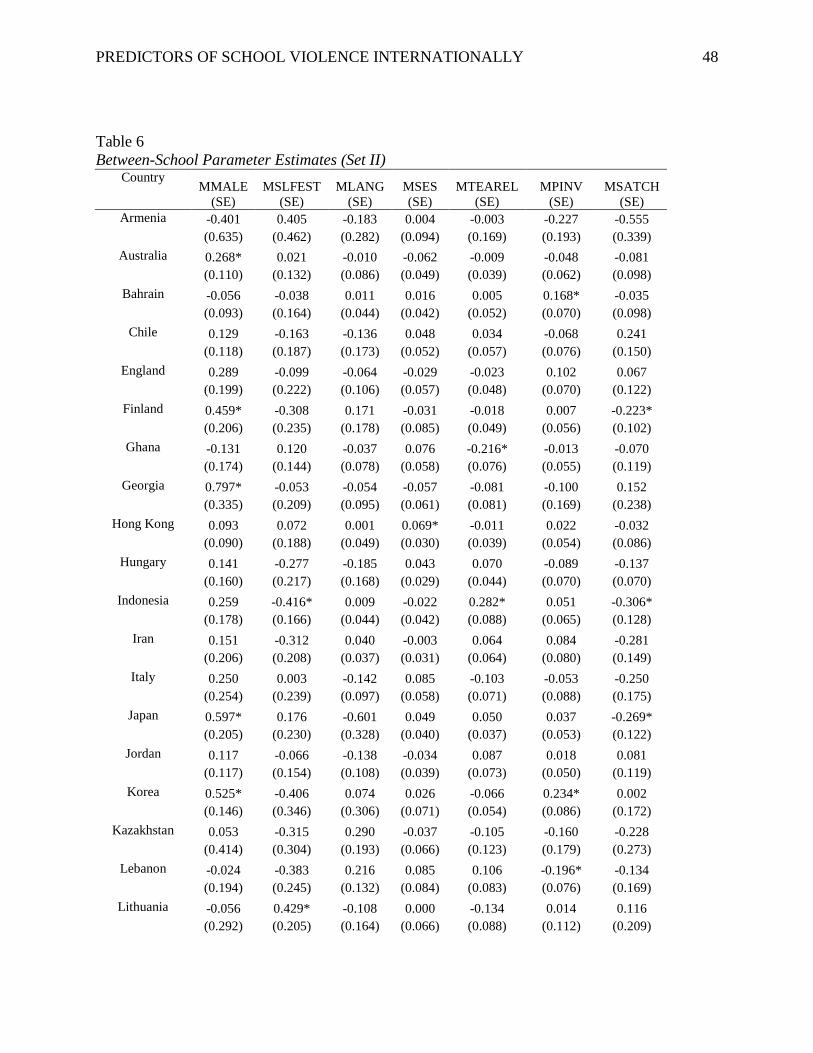
PREDICTORS OF SCHOOL VIOLENCE INTERNATIONALLY 48
Table 6
Between-School Parameter Estimates (Set II) Country
MMALE
(SE)
MSLFEST
(SE)
MLANG
(SE)
MSES
(SE)
MTEAREL
(SE)
MPINV
(SE)
MSATCH
(SE)
Armenia -0.401
(0.635)
0.405
(0.462)
-0.183
(0.282)
0.004
(0.094)
-0.003
(0.169)
-0.227
(0.193)
-0.555
(0.339)
Australia 0.268*
(0.110)
0.021
(0.132)
-0.010
(0.086)
-0.062
(0.049)
-0.009
(0.039)
-0.048
(0.062)
-0.081
(0.098)
Bahrain -0.056
(0.093)
-0.038
(0.164)
0.011
(0.044)
0.016
(0.042)
0.005
(0.052)
0.168*
(0.070)
-0.035
(0.098)
Chile 0.129
(0.118)
-0.163
(0.187)
-0.136
(0.173)
0.048
(0.052)
0.034
(0.057)
-0.068
(0.076)
0.241
(0.150)
England 0.289
(0.199)
-0.099
(0.222)
-0.064
(0.106)
-0.029
(0.057)
-0.023
(0.048)
0.102
(0.070)
0.067
(0.122)
Finland 0.459*
(0.206)
-0.308
(0.235)
0.171
(0.178)
-0.031
(0.085)
-0.018
(0.049)
0.007
(0.056)
-0.223*
(0.102)
Ghana -0.131
(0.174)
0.120
(0.144)
-0.037
(0.078)
0.076
(0.058)
-0.216*
(0.076)
-0.013
(0.055)
-0.070
(0.119)
Georgia 0.797*
(0.335)
-0.053
(0.209)
-0.054
(0.095)
-0.057
(0.061)
-0.081
(0.081)
-0.100
(0.169)
0.152
(0.238)
Hong Kong 0.093
(0.090)
0.072
(0.188)
0.001
(0.049)
0.069*
(0.030)
-0.011
(0.039)
0.022
(0.054)
-0.032
(0.086)
Hungary 0.141
(0.160)
-0.277
(0.217)
-0.185
(0.168)
0.043
(0.029)
0.070
(0.044)
-0.089
(0.070)
-0.137
(0.070)
Indonesia 0.259
(0.178)
-0.416*
(0.166)
0.009
(0.044)
-0.022
(0.042)
0.282*
(0.088)
0.051
(0.065)
-0.306*
(0.128)
Iran 0.151
(0.206)
-0.312
(0.208)
0.040
(0.037)
-0.003
(0.031)
0.064
(0.064)
0.084
(0.080)
-0.281
(0.149)
Italy 0.250
(0.254)
0.003
(0.239)
-0.142
(0.097)
0.085
(0.058)
-0.103
(0.071)
-0.053
(0.088)
-0.250
(0.175)
Japan 0.597*
(0.205)
0.176
(0.230)
-0.601
(0.328)
0.049
(0.040)
0.050
(0.037)
0.037
(0.053)
-0.269*
(0.122)
Jordan 0.117
(0.117)
-0.066
(0.154)
-0.138
(0.108)
-0.034
(0.039)
0.087
(0.073)
0.018
(0.050)
0.081
(0.119)
Korea 0.525*
(0.146)
-0.406
(0.346)
0.074
(0.306)
0.026
(0.071)
-0.066
(0.054)
0.234*
(0.086)
0.002
(0.172)
Kazakhstan 0.053
(0.414)
-0.315
(0.304)
0.290
(0.193)
-0.037
(0.066)
-0.105
(0.123)
-0.160
(0.179)
-0.228
(0.273)
Lebanon -0.024
(0.194)
-0.383
(0.245)
0.216
(0.132)
0.085
(0.084)
0.106
(0.083)
-0.196*
(0.076)
-0.134
(0.169)
Lithuania -0.056
(0.292)
0.429*
(0.205)
-0.108
(0.164)
0.000
(0.066)
-0.134
(0.088)
0.014
(0.112)
0.116
(0.209)
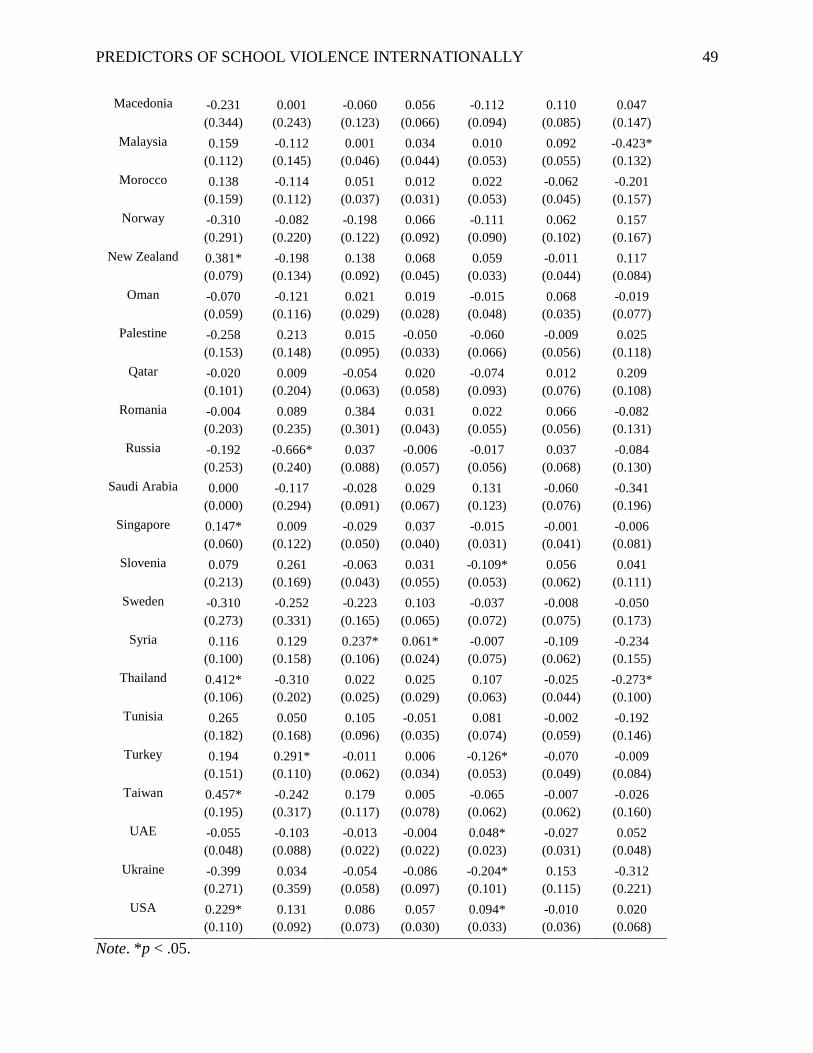
PREDICTORS OF SCHOOL VIOLENCE INTERNATIONALLY 49
Macedonia -0.231
(0.344)
0.001
(0.243)
-0.060
(0.123)
0.056
(0.066)
-0.112
(0.094)
0.110
(0.085)
0.047
(0.147)
Malaysia 0.159
(0.112)
-0.112
(0.145)
0.001
(0.046)
0.034
(0.044)
0.010
(0.053)
0.092
(0.055)
-0.423*
(0.132)
Morocco 0.138
(0.159)
-0.114
(0.112)
0.051
(0.037)
0.012
(0.031)
0.022
(0.053)
-0.062
(0.045)
-0.201
(0.157)
Norway -0.310
(0.291)
-0.082
(0.220)
-0.198
(0.122)
0.066
(0.092)
-0.111
(0.090)
0.062
(0.102)
0.157
(0.167)
New Zealand 0.381*
(0.079)
-0.198
(0.134)
0.138
(0.092)
0.068
(0.045)
0.059
(0.033)
-0.011
(0.044)
0.117
(0.084)
Oman -0.070
(0.059)
-0.121
(0.116)
0.021
(0.029)
0.019
(0.028)
-0.015
(0.048)
0.068
(0.035)
-0.019
(0.077)
Palestine -0.258
(0.153)
0.213
(0.148)
0.015
(0.095)
-0.050
(0.033)
-0.060
(0.066)
-0.009
(0.056)
0.025
(0.118)
Qatar -0.020
(0.101)
0.009
(0.204)
-0.054
(0.063)
0.020
(0.058)
-0.074
(0.093)
0.012
(0.076)
0.209
(0.108)
Romania -0.004
(0.203)
0.089
(0.235)
0.384
(0.301)
0.031
(0.043)
0.022
(0.055)
0.066
(0.056)
-0.082
(0.131)
Russia -0.192
(0.253)
-0.666*
(0.240)
0.037
(0.088)
-0.006
(0.057)
-0.017
(0.056)
0.037
(0.068)
-0.084
(0.130)
Saudi Arabia 0.000
(0.000)
-0.117
(0.294)
-0.028
(0.091)
0.029
(0.067)
0.131
(0.123)
-0.060
(0.076)
-0.341
(0.196)
Singapore 0.147*
(0.060)
0.009
(0.122)
-0.029
(0.050)
0.037
(0.040)
-0.015
(0.031)
-0.001
(0.041)
-0.006
(0.081)
Slovenia 0.079
(0.213)
0.261
(0.169)
-0.063
(0.043)
0.031
(0.055)
-0.109*
(0.053)
0.056
(0.062)
0.041
(0.111)
Sweden -0.310
(0.273)
-0.252
(0.331)
-0.223
(0.165)
0.103
(0.065)
-0.037
(0.072)
-0.008
(0.075)
-0.050
(0.173)
Syria 0.116
(0.100)
0.129
(0.158)
0.237*
(0.106)
0.061*
(0.024)
-0.007
(0.075)
-0.109
(0.062)
-0.234
(0.155)
Thailand 0.412*
(0.106)
-0.310
(0.202)
0.022
(0.025)
0.025
(0.029)
0.107
(0.063)
-0.025
(0.044)
-0.273*
(0.100)
Tunisia 0.265
(0.182)
0.050
(0.168)
0.105
(0.096)
-0.051
(0.035)
0.081
(0.074)
-0.002
(0.059)
-0.192
(0.146)
Turkey 0.194
(0.151)
0.291*
(0.110)
-0.011
(0.062)
0.006
(0.034)
-0.126*
(0.053)
-0.070
(0.049)
-0.009
(0.084)
Taiwan 0.457*
(0.195)
-0.242
(0.317)
0.179
(0.117)
0.005
(0.078)
-0.065
(0.062)
-0.007
(0.062)
-0.026
(0.160)
UAE -0.055
(0.048)
-0.103
(0.088)
-0.013
(0.022)
-0.004
(0.022)
0.048*
(0.023)
-0.027
(0.031)
0.052
(0.048)
Ukraine -0.399
(0.271)
0.034
(0.359)
-0.054
(0.058)
-0.086
(0.097)
-0.204*
(0.101)
0.153
(0.115)
-0.312
(0.221)
USA 0.229*
(0.110)
0.131
(0.092)
0.086
(0.073)
0.057
(0.030)
0.094*
(0.033)
-0.010
(0.036)
0.020
(0.068)
Note. *p < .05.

PREDICTORS OF SCHOOL VIOLENCE INTERNATIONALLY 50
Table 7
Between-School Variance in Poisson Intercept
Country EST (SE) Country EST (SE)
Armenia 0.131* (0.040) Morocco 0.027* (0.006)
Australia 0.028* (0.005) Norway 0.047* (0.012)
Bahrain 0.009* (0.003) New Zealand 0.016* (0.003)
Chile 0.040* (0.008) Oman 0.027* (0.005)
England 0.025* (0.007) Palestine 0.035* (0.008)
Finland 0.025* (0.008) Qatar 0.037* (0.008)
Ghana 0.041* (0.018) Romania 0.028* (0.010)
Georgia 0.048* (0.017) Russia 0.046* (0.012)
Hong Kong 0.019* (0.004) Saudi Arabia 0.090 (0.065)
Hungary 0.020* (0.005) Singapore 0.011* (0.002)
Indonesia 0.028* (0.005) Slovenia 0.032* (0.006)
Iran 0.064* (0.020) Sweden 0.028* (0.008)
Italy 0.067* (0.015) Syria 0.035* (0.009)
Japan 0.021* (0.005) Thailand 0.011* (0.003)
Jordan 0.031* (0.009) Tunisia 0.052* (0.010)
Korea 0.026* (0.006) Turkey 0.032* (0.005)
Kazakhstan 0.095* (0.045) Taiwan 0.038* (0.012)
Lebanon 0.099* (0.017) UAE 0.028* (0.004)
Lithuania 0.035* (0.012) Ukraine 0.071* (0.021)
Macedonia 0.044* (0.011) USA 0.026* (0.005)
Malaysia 0.036* (0.008)
Note. *p < .05.
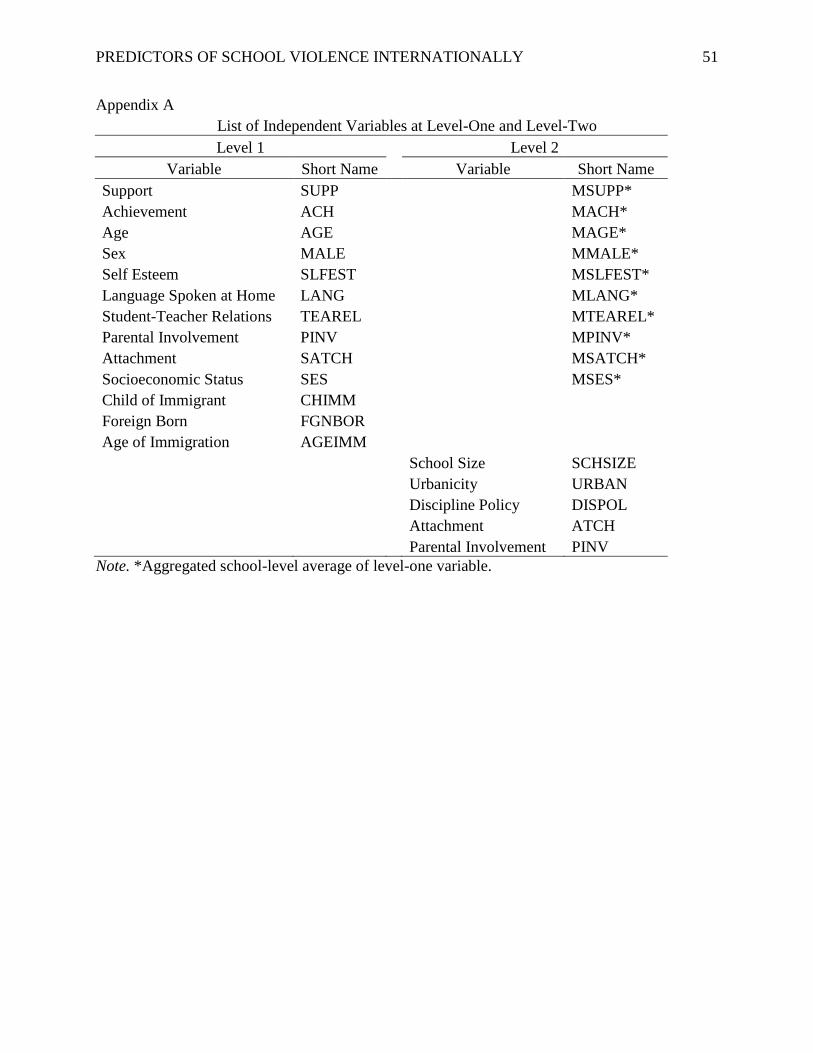
PREDICTORS OF SCHOOL VIOLENCE INTERNATIONALLY 51
Appendix A
List of Independent Variables at Level-One and Level-Two
Level 1 Level 2
Variable Short Name Variable Short Name
Support SUPP
MSUPP*
Achievement ACH
MACH*
Age AGE
MAGE*
Sex MALE
MMALE*
Self Esteem SLFEST
MSLFEST*
Language Spoken at Home LANG
MLANG*
Student-Teacher Relations TEAREL
MTEAREL*
Parental Involvement PINV
MPINV*
Attachment SATCH
MSATCH*
Socioeconomic Status SES
MSES*
Child of Immigrant CHIMM
Foreign Born FGNBOR
Age of Immigration AGEIMM
School Size SCHSIZE
Urbanicity URBAN
Discipline Policy DISPOL
Attachment ATCH
Parental Involvement PINV
Note. *Aggregated school-level average of level-one variable.
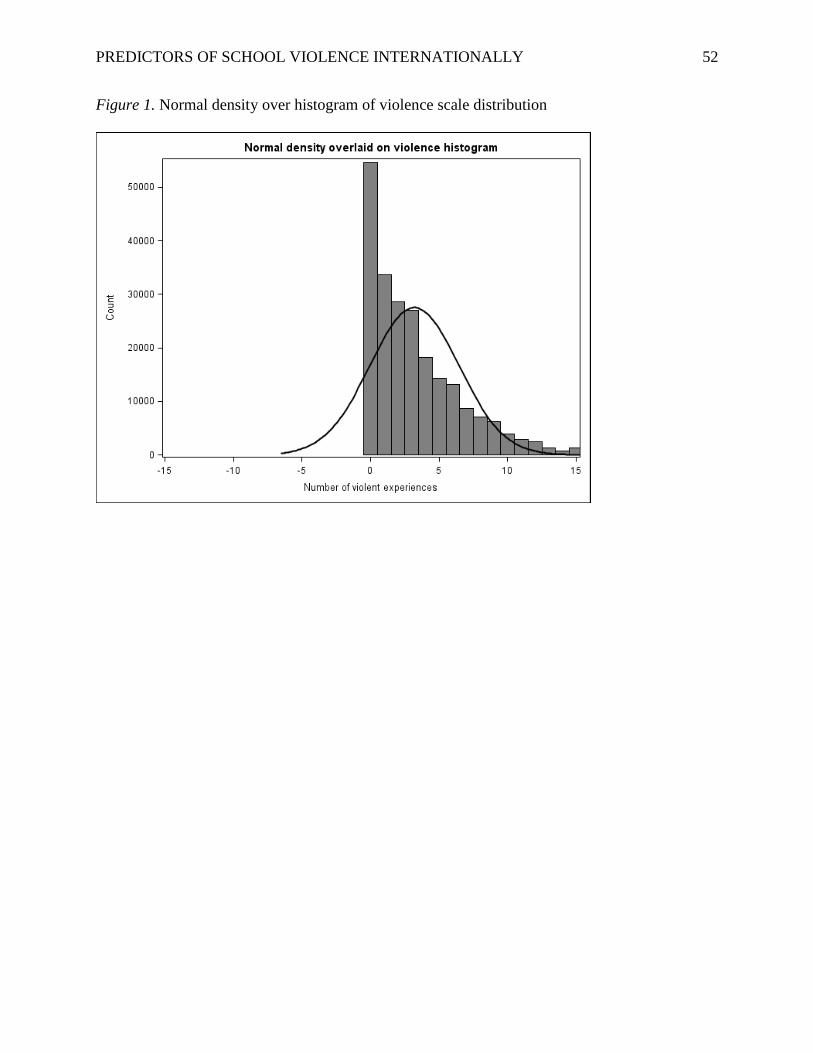
PREDICTORS OF SCHOOL VIOLENCE INTERNATIONALLY 52
Figure 1. Normal density over histogram of violence scale distribution