rtt-elc qris evaluation summary - child development (ca dept
TRANSCRIPT

Independent Evaluation of California’s Race to the Top-Early Learning Challenge Quality Rating and Improvement System:
Cumulative Technical Report Executive Summary
Submitted to:
California Department of Education Early Education and Support Division
Submitted by:
American Institutes for Research RAND Corporation
August 2016


Independent Evaluation of California’s Race to the Top-Early Learning Challenge Quality Rating and Improvement System:
Cumulative Technical Report Executive Summary
August 2016
Project Leadership: Heather E. Quick, Project Manager Laura E. Hawkinson, Analysis Lead Aleksandra Holod, Analysis Lead Susan Muenchow, Senior Advisor Deborah Parrish, Senior Advisor
Jill S. Cannon, RAND Project Manager Susannah Faxon-Mills, RAND Deputy
Project Manager Lynn A. Karoly, RAND Senior Advisor Gail L. Zellman, RAND Senior Advisor
Report Authors: AIR team: Heather E. Quick, Laura E. Hawkinson, Aleksandra Holod, Jennifer Anthony, Susan Muenchow, Deborah Parrish, Alejandra Martin, Emily Weinberg, and Dong Hoon Lee
RAND team: Jill S. Cannon, Lynn A. Karoly, Gail L. Zellman, Susannah Faxon-Mills, Ashley Muchow, and Tiffany Tsai
Allen, Shea & Associates team: Mechele Small Haggard
2800 Campus Drive, Suite 200 San Mateo, CA 94403 650.843.8100 | TTY 877.334.3499 www.air.org
1776 Main Street Santa Monica, CA 90401-3208 310.393.0411 www.rand.org
Copyright © 2016 American Institutes for Research. All rights reserved.

Contents Overview of the RTT-ELC QRIS Evaluation ................................................................................. 1
How did the study come about? ........................................................................................................... 1 What is the study approach? ................................................................................................................. 2 What are the limitations of the study? ................................................................................................. 4
RTT-ELC System Implementation ................................................................................................. 5 What is the status of RTT-ELC implementation? .............................................................................. 5 How do participating providers and parents in California perceive the QRIS? ................................ 7
The Validity of the California QRIS Ratings ................................................................................. 8 How well does the QRIS perform as a measure of quality? .............................................................. 8 How do QRIS ratings align with other measures of quality? ........................................................... 10 How do QRIS ratings relate to child outcomes? ............................................................................... 11 What is the role and validity of each element in the QRIS rating? .................................................. 12 How do alternative rating methods affect the validity of ratings? ................................................... 13
Use of QI Activities Among Programs Participating in California’s QRIS and Their Outcomes 14 How are QI activities used by program staff? ................................................................................... 15 How do QI activities relate to program quality outcomes? .............................................................. 16 How do QI activities relate to child outcomes? ................................................................................ 17 What is the cost of different types of QI activities? .......................................................................... 18
Summary and Conclusions ........................................................................................................... 19 Key Takeaway Messages ................................................................................................................... 19 Policy Options for Consideration ....................................................................................................... 21
References ..................................................................................................................................... 24

Independent Evaluation of California’s RTT-ELC QRIS: Executive Summary 1
Overview of the RTT-ELC QRIS Evaluation The purpose of the Independent Evaluation of California’s Race to the Top–Early Learning Challenge (RTT–ELC) Quality Rating and Improvement System (QRIS) is to inform California stakeholders about the ability of the QRIS to accurately measure program quality, differentiate programs with better learning outcomes for children, and provide quality improvement (QI) supports that meet program improvement needs. Findings from the two-year study conducted by American Institutes for Research (AIR), the RAND Corporation, and other partners are presented in the Cumulative Technical Report and summarized in this executive summary. These findings can be used to make revisions to improve the QRIS as a measure of program quality and to identify promising ways to support QI efforts among early childhood programs.
How did the study come about?
In 2012, California was awarded a competitive four-year federal RTT–ELC grant to develop a locally administered, state-supported QRIS (see definitions box on the following page). The California Department of Education (CDE) has co-led a state implementation team with First 5 California to support county-based Consortia in developing and implementing the Hybrid Rating Matrix, the state’s QRIS rating criteria. In January 2013, 17 Consortia began implementing QRISs to expand and strengthen preexisting QI initiatives in 16 counties. California’s locally based approach sets common goals for workforce development, program assessment, and child assessment for school readiness, but allows for some flexibility in quality benchmarks. The Consortia have voluntarily adopted the Hybrid Rating Matrix, which allows for local adaptation of rating criteria for two of the five rating tiers. There also is variability among counties in the supports and incentives for QI that are part of the QRIS.
Study Highlights
• Implementation of the RTT-ELC QRIS was in an early stage at the time the study began, but significant progress has been made over the course of the system’s development, from 2012 to 2015.
• The dissemination of QRIS ratings has been limited, but analyses of the ratings as well as community input suggest that providing detailed quality element scores in addition to the overall rating may be beneficial.
• The study provides some evidence of the validity of California’s QRIS ratings, though it is too early in the system’s implementation to draw many conclusions.
• Study analyses reveal high levels of participation in QI activities by program staff and point to coaching as a promising approach to improving quality.

Independent Evaluation of California’s RTT-ELC QRIS: Executive Summary 2
The RTT–ELC grant requires an independent evaluation of each state’s QRIS. Validation studies of existing QRISs are important as they assess the extent to which ratings within the systems are meaningful and accurate and successfully differentiate low-quality programs from high-quality ones. Such studies also assess the degree to which ratings predict children’s learning and developmental outcomes. Evaluation studies of QRISs also are needed to demonstrate that the system is successful at promoting QI in early learning programs. In January 2014, CDE contracted with AIR and its partners at RAND, Survey Research Management, and Allen, Shea & Associates to conduct a two-year independent evaluation of California’s QRIS during its pilot phase (through 2015).
What is the study approach?
The independent evaluation of California’s QRIS uses multiple data sources and analytic methods to examine implementation of the RTT-ELC grant and the QRIS, assess the validity of the QRIS ratings, and describe the usage and outcomes of QI activities among programs participating in the QRIS. Below, we describe our general approach to each of these study components, illustrated in exhibit 1.
To examine the implementation of the RTT-ELC grant and the QRIS, we used qualitative analysis methods to summarize the status of implementation at the start of the study, describe progress of the rollout of the QRIS and other components of the RTT-ELC grant over the course of the study, and assess public perceptions of the QRIS among early childhood program staff and parents of young children in California. To collect qualitative data on implementation, we conducted interviews with administrators from each of the 17 regional Consortia and 25 early childhood providers across the state, and we also conducted a total of 17 focus groups with parents in counties administering the QRIS.
To assess the validity of the QRIS ratings, we used statistical analysis methods to evaluate how well the QRIS ratings perform as a measure of program quality, determine how the QRIS ratings align with scores on other measures of program quality, and examine the relationship between QRIS ratings and child developmental outcomes. In addition, we examined the role and validity of each element of the QRIS ratings, and explored how alternative rating methods using the same data would affect the validity of the ratings. These analyses drew from existing state data on program characteristics and scores on the QRIS, as well as two sources of data collected for the study in early learning sites in 11 focal Consortia: independent
Definitions of Key Terms
QRIS: A quality rating and improvement system (QRIS) is a uniform set of ratings, graduated by level of quality, used to assess and improve early learning and care programs.
RTT–ELC: Race to the Top–Early Learning Challenge is a federal grant program focused on improving state early learning systems in California and other states that received an award.
CDE: California Department of Education; RTT–ELC grantee in California in partnership with Consortia and First 5 California.
Consortia: Early Learning Challenge Regional Leadership Consortia are county-based agencies that administer the QRIS locally as part of RTT–ELC in California.
Element: An aspect of early childhood program quality measured as part of California’s RTT-ELC QRIS, which includes up to seven elements depending on program type.
Hybrid Rating Matrix: California’s RTT-ELC QRIS rating guidelines, which define the criteria for earning points on each QRIS element, specify the minimum total points across elements for each rating level, and identify options for local adaptation of the QRIS criteria by Consortia.

Independent Evaluation of California’s RTT-ELC QRIS: Executive Summary 3
observations of program quality and direct assessments of child development in multiple domains of early learning.
Exhibit 1. Components of the Evaluation of California’s QRIS
System Implementation
• What is the status of RTT-ELC implementation?
• How do participating providers and parents in California perceive the QRIS?
Validity of the QRIS Ratings
• How well does the QRISperform as a measure ofquality?
• How do QRIS ratings align withother measures of quality?
• How do QRIS ratings relate tochild outcomes?
• What is the role and validity ofeach element in the QRISratings?
• How do alternative ratingmethods affect the validity ofratings?
Usage and Outcomes of QI Activities
• How are QI activities usedby program staff?
• How do QI activities relateto program qualityoutcomes?
• How do QI activities relateto child outcomes?
• What is the cost ofdifferent types of QIactivities?
For the independent observations of program quality, we use scores on the Classroom Assessment Scoring System (CLASS; La Paro and others 2012) and the Program Quality Assessment (PQA; HighScope Educational Research Foundation 2003) instruments for 175 fully rated sites. The direct assessments of child development include measures of preliteracy skills (Woodcock-Johnson Letter-Word Identification subtest [Woodcock, McGrew, and Mather 2007] and Story and Print Concepts [Zill and Resnick 2000]), mathematics skills (Woodcock-Johnson Applied Problems subtest [Woodcock, McGrew, and Mather 2007]), and executive function (Peg Tapping task [Diamond and Taylor 1996]) for 1,501 to 1,611 three- and four-year-old children in 132 programs.
To describe the usage and outcomes of QI activities among programs participating in the QRIS, we first use descriptive statistics to provide a profile of QI activities among teachers and program directors, and then use statistical analysis methods to assess the relationship between QI activities and program quality outcomes as well as child developmental outcomes. We also examine the costs associated with each type of QI activity. These analyses drew from four

Independent Evaluation of California’s RTT-ELC QRIS: Executive Summary 4
sources of study data: independent observations of program quality and direct assessments of child development (described above), completed surveys from 306 program staff and 93 directors designed to characterize teacher and director use of QI supports, and data provided by 11 Consortia on the costs of QI activities.
Detailed information about study methodology is provided in Appendix 1A of the Cumulative Technical Report.
What are the limitations of the study?
Several limitations to the study are important to highlight before we summarize study findings. First, participation in the RTT-ELC QRIS was voluntary, and a relatively low percentage of California’s early childhood programs participated; in 2014, 12 percent of centers and 1 percent of FCCHs in the 16 RTT-ELC counties participated in the QRIS. Furthermore, California prioritized publicly funded programs serving low-income children for early recruitment to the QRIS, as part of the state’s strategy for meeting RTT-ELC priorities related to serving high-need children. Thus, a majority of the participating programs at the time of this study were publicly contracted programs already accustomed to meeting many of the measures in the Hybrid Rating Matrix; few programs serving exclusively private fee-paying or voucher-supported families participated at that time. The lack of variation in the programs participating, as might be expected, contributed to the limited variation in ratings across programs.
Second, among those sites participating in the QRIS, only a little more than a third had a full, nonprovisional rating soon enough to be included in the study analyses. These fully rated sites differ from those without full ratings in some ways, limiting how much the validation study results presented in this report can be generalized. Although examining the system and how it is performing at this early stage has value and can help the state consider possible revisions to the QRIS, results presented in this report should be interpreted within the context of the system’s stage of development and current participants, and conclusions should be considered preliminary.
Third, the delayed start to the study due to extended negotiations with the Consortia contributed to lower than expected participation rates for classroom observations, further limiting the number of sites available for analysis, especially family child care homes (FCCHs). As a result of the smaller sample size, analyses that have nonsignificant results cannot be considered conclusive because the small sample size limits our ability to detect small differences.
Finally, the study used classroom observation scores that were collected by Consortia for QRIS rating purposes for some programs that recently received observations and did not wish to have two CLASS observations within the same program year. There may be systematic differences in the way classrooms score on observations for the QRIS rating (which could directly affect family choices or funding opportunities) and the way they might score on observations for an evaluation (which is not expected to directly affect the program), so results of the analyses using these data should be interpreted in light of this limitation.

Independent Evaluation of California’s RTT-ELC QRIS: Executive Summary 5
RTT-ELC System Implementation To understand the status of the RTT-ELC QRIS implementation, it is important to stress a critical point at the outset: The system is still under development and refinement. Although some Consortia had longstanding, integrated systems in place prior to receipt of the RTT-ELC grant, others had minimal experience with key components of QRIS implementation, such as the conduct of valid, reliable, and independent CLASS and Environment Rating Scales (ERS) observations. The differences in the prior history of the Consortia have implications not only for the status of the system implementation itself, but also for how many and which types of programs were eligible to participate in this study.
In addition, ratings were not, for the most part, made publicly available during the study period. However, providers and parents noted their approval of the quality elements addressed by the rating matrix, and parents expressed their interest in gaining access to the detailed element scores that comprise the overall rating to inform their decisions.
What is the status of RTT-ELC implementation?
California is near the completion of its RTT-ELC QRIS pilot, and the system continues to grow and change. For example, the Consortia have done a considerable amount of work implementing the Hybrid Rating Matrix and fine-tuning and modifying it based on lessons learned.
The majority of the Consortia had implemented most of their planned QRIS activities as of summer 2015. Site and classroom assessments were one integral piece of these planned activities. The majority of the Consortia were following the RTT-ELC’s requirements for the frequency and sampling of classroom assessments, although several went beyond the minimum requirements and were conducting annual observations or expanding the sample size of observed classrooms at a site. Challenges related to finding, training, and retaining qualified classroom assessors, particularly for the ERS, lessened between 2014 and 2015 because the Consortia that had initially struggled had found ways to make observations more affordable and manageable. The state also provided support in this regard through its assessor management system and state anchors.
In addition, most Consortia had reached their target goals for the total anticipated number of QRIS participants as of summer 2015. Although the pilot system did include privately funded centers and FCCHs, most of the participating sites were publicly contracted programs, such as State Preschool and Head Start. As anticipated, the participating sites represented only a small fraction of the overall number of licensed centers and an even smaller percentage of licensed FCCHs in the counties participating in the RTT-ELC QRIS. By comparison, according to the online QRIS Compendium, updated through 2015, in states such as Illinois, New Hampshire, and Oklahoma, 100 percent of licensed centers and FCCHs participate in a QRIS. In effect, obtaining a license automatically awards a program one “star” in these states. In Tennessee, all licensed programs through its Department of Human Services are required to be rated, and those that receive at least one star may choose to participate in the Star-Quality program and receive QI supports and other incentives. In Wisconsin, participation is mandatory for programs receiving federal and state subsidies, with 82 percent of licensed centers and 75 percent of licensed FCCHs participating.

Independent Evaluation of California’s RTT-ELC QRIS: Executive Summary 6
During this QRIS pilot, the Consortia have largely focused on conducting quality assessments and QI activities to help raise program quality. Although ratings have been provided internally to providers, most Consortia had not publicized ratings by summer 2015; hence, we were not able to evaluate the impact of publicizing ratings on QI and parent access to quality programs. Many of the Consortia were still working on a plan for rolling out the ratings, though according to the state Implementation Team, all Consortia made ratings publicly available by December 2015.
In terms of validation, it is important to reiterate that California’s QRIS is not one uniform system. For example, although all of the Consortia use a common, five-tiered Hybrid Rating Matrix, each Consortium can elect to block Tier 2 (meaning that a site much achieve two points on all elements before moving to the next tier) and make local modifications to elements within Tier 5. This allowance for local modifications, in addition to the changes made at the three-point level and five-point level of the ERS element of the rating matrix in May 2015, sheds light on elements that particular Consortia deem most important, but also complicates attempts to validate the system.
Finally, it may be difficult to expand—and possibly even to sustain—the work done as part of the QRIS pilot without changes in the requirements for participation in the system and/or other financial resources to help rated sites improve. Although the California State Preschool Program (CSPP) QRIS Block Grant and First 5 IMPACT grants are expected to make large contributions to early care and education (ECE) in California, and the 17 pilot Consortia in particular (a total of more than $60 million to the 17 pilot Consortia from both IMPACT grants and CSPP QRIS Block Grants), it is unclear whether more private providers and voucher providers will participate in the QRIS system without a requirement that they do so. In addition, now that the pilot counties appear to be publicizing ratings, it will be important to assess the extent to which ratings either inform parents or motivate QI. In a voluntary system, the issue of participation might be particularly tenuous for private providers if they are expected to be assessed without receiving sufficient QI supports.
In a state as large and diverse as California, wisdom suggests the benefits of conducting a pilot before considering statewide implementation. However, without the authority to require all licensed programs to participate in the pilot or the resources to encourage their participation within the 16 counties, the pilot QRISs have focused on publicly contracted programs, with limited outreach to private centers or FCCHs with fee-paying parents. As a result, the evaluation results may not tell us much about how a QRIS with a broader spectrum of programs participating would function. For example, if more private programs participated, it might be more difficult and expensive to conduct the kind of program quality assessments that have been implemented by the Consortia. But if all licensed programs received a publicized one star as a condition of licensure, there might be far more incentive for private programs to participate in the system to obtain whatever QI supports were available to help them rise to a higher publicized level.
Although there are issues to be addressed, as noted above, within the limitations of the RTT-ELC grant, the Consortia have accomplished a great deal in the four years since the grant was awarded. Many of the QRISs in other states have taken more than a decade to reach full implementation, and even some of the best-known systems, such as North Carolina’s, regard refinement of the system as an ongoing effort. The fact that all 58 counties in California are now

Independent Evaluation of California’s RTT-ELC QRIS: Executive Summary 7
participating in some aspects of the QRIS provides tangible evidence of the growing interest in the system.
How do participating providers and parents in California perceive the QRIS?
To examine provider and parent perceptions of the QRIS, we conducted qualitative analyses using two sources of data collected for the study in the spring and summer of 2015: interviews with 25 early learning and care providers—including center teachers and directors and FCCH providers—in 11 focal Consortia, and focus groups with parents in all 17 Consortia.
Providers and parents generally agreed that the QRIS rating elements included the important aspects of quality. (See exhibit 2 for the seven elements on which centers are evaluated and the five elements used with FCCHs.) Although they did not necessarily agree with how all of the elements were specified, and providers indicated a desire for more flexibility in the QRIS standards, they did not think that any element should be eliminated.
Exhibit 2. Quality Elements Comprising the RTT-ELC Hybrid Rating Matrix
Centers FCCHs
CORE I: Child Development and School Readiness
Child Observation
Developmental and Health Screenings
CORE II: Teachers and Teaching
Minimum Qualifications for Lead Teacher/FCCH
Effective Teacher-Child Interactions: CLASS Assessments
CORE III: Program and Environment—Administration and Leadership
Ratios and Group Size
Program Environment Rating Scale(s)
Director Qualifications
Parents indicated an interest in having access to the QRIS rating information, and, for the most part, wanted detailed rating information rather than a single summary rating. On the other hand, although some providers see the benefits to informing parents about the ratings, others question the accuracy of the ratings in the pilot phase and are hesitant to publicize them.
Parents rely on a variety of sources to inform their choices about early learning programs, including recommendations from family and friends, and online resources. Parents described comfort with the site and staff as an important factor in selecting a program for their child. Parents also identified convenience of the site to their home or work, the program schedule, and cost of the care as key factors in their decisions.
Providers and parents also discussed additional quality factors—beyond those delineated in the rating matrix—that influenced their perceptions of child care. Parents’ observations of these characteristics were often based on what happened after their child began care rather than as part of their selection process. Providers and parents both highlighted the importance of family engagement as an indicator of program quality. Many parents pointed to child outcomes—their

Independent Evaluation of California’s RTT-ELC QRIS: Executive Summary 8
children’s learning and happiness—as important indicators of a quality program, with a particular focus on their child’s positive experiences at the site as well as development of school readiness skills. Although parents often did not know how to evaluate the curriculum, they valued the importance of a good curriculum as well.
The Validity of the California QRIS Ratings We examined the validity of the California QRIS ratings for three different purposes: to serve as reliable and meaningful ratings to inform parents about program quality, to differentiate programs according to the quality of program structures and adult-child interactions, and to identify programs with larger gains in child skills over the course of the program year. However, the study was limited in its ability to detect such differences because of the narrow range of QRIS ratings among the programs participating in early implementation of the system. The study provides some evidence of the validity of California’s QRIS ratings, although it is too early in the system’s implementation to draw many conclusions.
How well does the QRIS perform as a measure of quality?
To determine how well California’s QRIS ratings function as a measure of program quality, we analyzed QRIS rating data, including rating levels and element scores, from programs across the state with full QRIS ratings as of January 2014. The analysis included an examination of the distribution of ratings and element scores, the internal consistency of the ratings, and how element scores relate to each other.
Results indicate that, first, the distribution of ratings in the limited sample of fully rated programs is truncated; it does not span all five possible QRIS rating levels. Among the sample of 472 programs with full ratings (365 centers and 107 FCCHs), no programs were rated at Tier 1 using California’s QRIS criteria. Ratings of fully rated programs were generally high, with half of all sites rated at Tier 4 or 5. In addition, the distribution of ratings differs markedly for fully rated centers and FCCHs (see exhibit 3). Although the most common rating for centers is Tier 4, with 86 percent of centers rated at Tier 3 or 4, the most common rating for FCCHs is Tier 2, with 85 percent of FCCHs rated at Tier 2 or 3.
Exhibit 3. Distribution of California QRIS Ratings for Centers and FCCHs With Full Ratings in January 2014
020
124
189
32
0
50
100
150
200
250
Tier 1 Tier 2 Tier 3 Tier 4 Tier 5
California QRIS Ratings, Centers
0
57
34
11 50
25
50
75
100
Tier 1 Tier 2 Tier 3 Tier 4 Tier 5
California QRIS Ratings, FCCHs

Independent Evaluation of California’s RTT-ELC QRIS: Executive Summary 9
In centers, element scores based on structural characteristics of programs (such as child assessment and screening practices, adult-child ratios, and staff qualifications) have limited variation, with most scoring high on these elements, and thus may not differentiate centers well, while element scores based on independent classroom observations have more variation. In contrast, FCCHs have more variability in element scores based on structural characteristics, but less variability in one of the two element scores based on independent classroom observations.
Examining how elements relate to each other, we found that none of the element scores were redundant, indicating that the elements capture different aspects of program quality. The correlations between elements were low among both centers and FCCHs (Spearman’s ρ of .01 to .46), particularly among centers for element scores with limited variability, such as the Ratios and Group Size and Developmental and Health Screening elements. These correlations are low, but the QRIS is designed to measure diverse aspects of quality, and programs are expected to earn different scores on rating elements.
The low correlations are reflected in relatively low internal consistency of the QRIS ratings (.54 for centers and .63 for FCCHs). The low levels of internal consistency confirm that the QRIS ratings do not measure a unidimensional program quality construct, especially among centers. In other words, the overall QRIS ratings do not represent a single dimension of quality, but rather represent diverse types of program quality. Thus, programs with the same rating could have very different strengths and limitations. This enables a diversity of programs to achieve high ratings, providing more options for high quality, but parents will not be able to identify which programs at a specific rating level match their priorities for high-quality care. See exhibit 4 for an example demonstrating how two centers with a Tier 4 rating could receive very different scores on specific elements.
Exhibit 4. Example Element Score Variation for Two Tier 4 Centers
Center A Center B Overall Rating **** **** Elements Child Observation *** ***** Developmental and Health Screenings ***** ** Minimum Qualifications for Lead Teacher/FCCH *** ***** Effective Teacher–Child Interactions ** ***** Ratios and Group Size ***** ** Program Environment Rating Scale(s) *** ***** Director Qualifications ***** ***
The relatively low internal consistency also makes it more difficult to find strong relationships between QRIS ratings and the observed quality measures or child outcome measures collected for the study.

Independent Evaluation of California’s RTT-ELC QRIS: Executive Summary 10
How do QRIS ratings align with other measures of quality?
To assess how QRIS ratings align with other measures of quality, we compared the scores from independent observations of quality at each QRIS rating level, using analysis of variance (ANOVA). Our analyses compare QRIS rating levels from 175 fully rated programs with their scores on the CLASS and PQA. The domains of quality measured in these validated, independent observation tools overlap with those measured in California’s QRIS, so we would expect to see positive relationships between QRIS ratings and scores on the independent observations.
Results find that the California QRIS ratings are positively related to some, but not all, scores on the independent observations among preschool classrooms in centers. In particular, California QRIS ratings positively and significantly predict CLASS instructional support scores (exhibit 5) and PQA adult-child interaction scores (exhibit 6), although both of these relationships are small in magnitude. There are no significant relationships between the QRIS ratings and any of the other CLASS or PQA subscores. Sample sizes for toddler classrooms and FCCHs were not sufficient to produce reliable conclusions for these settings.
Exhibit 5. Average Pre-K CLASS Domain Scores by California QRIS Rating Level: Centers
2.9
5.85.4
3.0
6.05.6
3.7
6.25.9
1
2
3
4
5
6
7
Instructional Support* Emotional Support Classroom Organization
Mea
n Sc
ores
CLASS
Tier 3 (n=55) Tier 4 (n=66) Tier 5 (n=12)
NOTE: Excludes the two centers in the Pre-K CLASS sample that were rated at Tier 2 because average CLASS score data are not reliable for rating levels with fewer than five observations.

Independent Evaluation of California’s RTT-ELC QRIS: Executive Summary 11
Exhibit 6. Average Preschool PQA Form A Domain Scores by California QRIS Rating Level: Centers
NOTE: Excludes the one center in the preschool PQA sample that was rated at Tier 2 because average PQA score data are not reliable for rating levels with fewer than five observations.
How do QRIS ratings relate to child outcomes?
To assess the validity of the QRIS ratings for the purpose of identifying programs with larger gains in child skills over the course of the program year, we compared children’s developmental outcomes in spring 2015 for children enrolled in sites at different rating levels, while controlling for children’s skills in the fall as well as child and program characteristics. For these analyses, we draw on direct assessments of 1,612 three- and four-year-old children in 132 fully rated sites who were assessed in the fall and spring of the 2014–15 program year. The direct child assessments include two measures of early literacy (Woodcock-Johnson Letter-Word Identification and Story and Print Concepts), one measure of early mathematics (Woodcock-Johnson Applied Problems), and one measure of executive function (Peg Tapping task).
First, it is important to note that children showed growth from fall to spring across all outcome measures. This was true for children in programs at each of the four tiers represented in the data (Tier 2, Tier 3, Tier 4, and Tier 5). However, as shown in exhibit 7, developmental outcomes in literacy, mathematics, and executive function do not increase steadily as California QRIS rating levels increase among children in the study sample. Compared with children in Tier 3 sites, children in Tier 5 sites had slightly higher executive function, on average, but mathematics skills are comparable for children across all tier levels, as are early literacy skills measured by the letter-word identification subtest. In addition, children in the five Tier 2 sites had higher scores, on average, than children in the Tier 3 sites on another early literacy measure, Story and Print Concepts. However, differences between children in Tier 2 and higher rated sites may not be estimated reliably in these analyses due to the small number of Tier 2 sites in the study sample. In addition, the Tier 2 sites differed from other sites in terms of their funding sources and populations served. They are less likely to be state-funded programs and more likely to serve private-pay families, factors that may underlie some of the differences in outcomes observed.
3.53.3 3.2
4.13.7
3.33.6
4.24.03.4
3.9 3.9
1
2
3
4
5
Learning Environment Daily Routine Adult-ChildInteraction*
Curriculum Planningand Assessment
Mea
n Sc
ores
PQA
Tier 3 (n=53) Tier 4 (n=68) Tier 5 (n=12)

Independent Evaluation of California’s RTT-ELC QRIS: Executive Summary 12
Exhibit 7. Adjusted Mean Scores on Child Assessments by California QRIS Rating Level: Centers
+ p < .10, * p < .05; ** p < .01.
NOTE: Sites with a rating of 3 were the reference category. Scores should not be compared across assessments; age-equivalent scores are presented for Letter-Word Identification and Applied Problems, and raw scores are presented for Peg Tapping and Story and Print Concepts.
Overall, among our limited pool of fully rated sites, we find limited evidence of predictive relationships between the QRIS ratings or element scores and child outcomes. At this early stage of QRIS implementation and given the study limitations, it is not surprising that the study does not find strong evidence of predictive relationships with child outcomes. Indeed, previous studies have found limited utility of associations between QRIS ratings and child outcomes measured during a single program year (Elicker and Thornburg 2011; Lahti and others 2014). Future research is needed on the extent to which programs rated at Tier 2 may have different child outcomes than those at higher tiers, as the quality differences may be most meaningful in comparing programs at Tier 2 and higher tiers.
What is the role and validity of each element in the QRIS rating?
Looking more closely at the elements that comprise the overall rating, we find evidence supporting the validity of the Effective Teacher-Child Interactions element for the purpose of differentiating programs according to the quality of interactions. As expected, scores on this element, which are based on independent observations using the CLASS instrument, are significantly and positively related to scores on each of the CLASS domains and three domains of the PQA—Adult-Child Interactions, Learning Environment, and Curriculum Planning and Assessment—but not with child developmental outcomes.
Second, there is some evidence for the validity of the Minimum Qualifications for Lead Teacher/FCCH element for the purpose of identifying programs that have larger gains in child outcomes over the course of the program year. The child outcome data show a positive pattern of
8.3
5.1*** 5.1+
3.8
9.1
4.6 4.93.8
8.7
4.44.9
3.7
9.4**
4.9 5.1+
3.9
0.0
2.0
4.0
6.0
8.0
10.0
12.0
Peg Tapping Task Story and Print Concepts Letter-Word Identification Applied Problems
Mea
n Sc
ore
Child Outcomes by QRIS Rating Level
Tier 2 (n = 82) Tier 3 (n = 574) Tier 4 (n = 808) Tier 5 (n = 148)

Independent Evaluation of California’s RTT-ELC QRIS: Executive Summary 13
relationships, such that children in sites receiving more points on this element have higher assessment scores. We do not find any statistically significant relationships between the Minimum Qualifications element score and our quality measures.
Third, least evidence supports the validity of the Child Observation element, and, in fact, we find some negative relationships between this element and our measures of classroom quality and child outcomes. On two quality measures—the Curriculum Planning and Assessment domain of the PQA and the Parent Involvement and Family Services domain of the PQA Form B—sites with four points on the Child Observation element score higher than sites with five points. The feature that distinguishes the five-point Child Observation level from the four-point level is a specific aspect of practice related to assessment: the use of the Desired Results Developmental Profile data system, the DRDP Tech. To receive four points, staff must use the DRDP twice a year to inform curriculum planning; to receive five points, staff also must upload their data into DRDP Tech. It may be that the use of DRDP Tech is not helping teachers to better use or share the assessment data, or it might be that sites that can afford to use this tool (given the technology infrastructure needed) are different in other ways that affect their curriculum planning, assessment, and family involvement practices. The pattern of relationships between this element and child assessment scores is fairly consistent, with lower assessment scores at higher point levels on the Child Observation element, and there are statistically significant negative associations with Story and Print Concepts and the Peg Tapping task. Given the definition of the point levels on this element and that the use of the DRDP is so tied to its funding source, this element does not appear to be successfully differentiating programs based on quality and children’s outcomes.
How do alternative rating methods affect the validity of ratings?
Ratings for a QRIS can be calculated many different ways; California’s hybrid method is one approach. To explore how ratings and validity would change under different rating approaches, we tested three alternative rating approaches using the same element scores collected for the California QRIS ratings (shown in exhibit 8). The state currently uses the two-level block as a possible local adaptation to the statewide rating approach; the other two approaches are not currently used in the state. A block approach to ratings means that sites must achieve all elements within a level before advancing to the next level; in a point-based system, sites earn points for each element and they are added together to determine the overall rating.
First, we calculated ratings for each of the alternative rating approaches using the existing program element score data, and then examined changes in the distribution of ratings with each alternative approach. To assess the validity of these approaches, we examined the relationship between each alternative rating approach and program-level CLASS and PQA scores as well as child developmental outcomes in multiple domains. We then compared the validity analysis results with those for the California QRIS ratings.
We also examined how ratings would change under the different rating calculation approaches. First, we found that the distribution of rating levels varies substantially by rating approach. The largest changes in the distribution of ratings occur when ratings rely on block designs, in comparison with the California QRIS rating approach. Also, ratings using blocks appear to be less effective than California QRIS ratings at differentiating centers by CLASS scores, although

Independent Evaluation of California’s RTT-ELC QRIS: Executive Summary 14
five-level blocks are more effective than California QRIS ratings at differentiating centers according to the PQA observation scores.
Exhibit 8. Alternative Rating Approaches Examined in This Study Rating Type Rating Definition
California QRIS Tier 1 is blocked; Tiers 2–5 are point-based for programs meeting block criteria for Tier 1. The rating is determined by total points earned across elements. As noted above, local Consortia have the autonomy to make some modifications to the rating structure. This is California’s rating approach without local adaptations to the way the ratings are calculated using the element scores.
Two-Level Block Tiers 1 and 2 are blocked, and Tiers 3–5 are point-based for programs meeting block criteria for Tier 2. Some Consortia have revised California’s rating approach in this way.
Five-Level Block Tiers 1–5 are blocked.
Element Average Scores are determined by taking the average of all applicable rating elements. Averages are rounded to whole numbers (rounded up for 0.5 and greater; rounded down for less than 0.5).
However, we found that element average ratings (calculated by taking an average across all element scores) are more effective than California QRIS ratings (which sum scores across all elements) at differentiating centers by CLASS and PQA classroom observation scores. The element average ratings also do a somewhat better job of predicting children’s developmental outcomes, in particular in terms of children’s literacy and mathematics skills.
It is important to remember when interpreting these analyses using alternative rating approaches that they are specific to the small sample of centers included in the study that are not representative of the entire population of programs in California. Relationships between alternative rating approaches and observed quality scores may differ for a more diverse group of programs in California.
Use of QI Activities Among Programs Participating in California’s QRIS and Their Outcomes We present a descriptive summary of the types and amount of QI activities that staff engage in among programs participating in the QRIS, and an analysis of the relationships between participation in specific QI activities and classroom quality and child outcomes. Stakeholders in California may use this information to identify promising practices and inform closer examination of these QI activities in the future. Study analyses found the most support for coaching as a QI activity, with positive associations between the dosage of coaching and some program quality and child developmental outcomes.

Independent Evaluation of California’s RTT-ELC QRIS: Executive Summary 15
How are QI activities used by program staff?
To describe how program staff use QI activities among programs participating in the QRIS, we present summary statistics of QI survey data collected for the study, with information about staff participation in four types of QI support: coaching or mentoring; noncredit courses, seminars, workshops, or training programs; peer support activities; and credit-bearing college or university courses. We also collected information about financial incentives and other factors affecting participation in these QI activities. Analyses include 306 lead and assistant staff in 170 center classrooms and 17 FCCHs, and 93 administrators representing 102 sites in 11 Consortia. Below, we report results for 279 staff in centers only because the number of FCCH respondents was too low to provide reliable estimates.
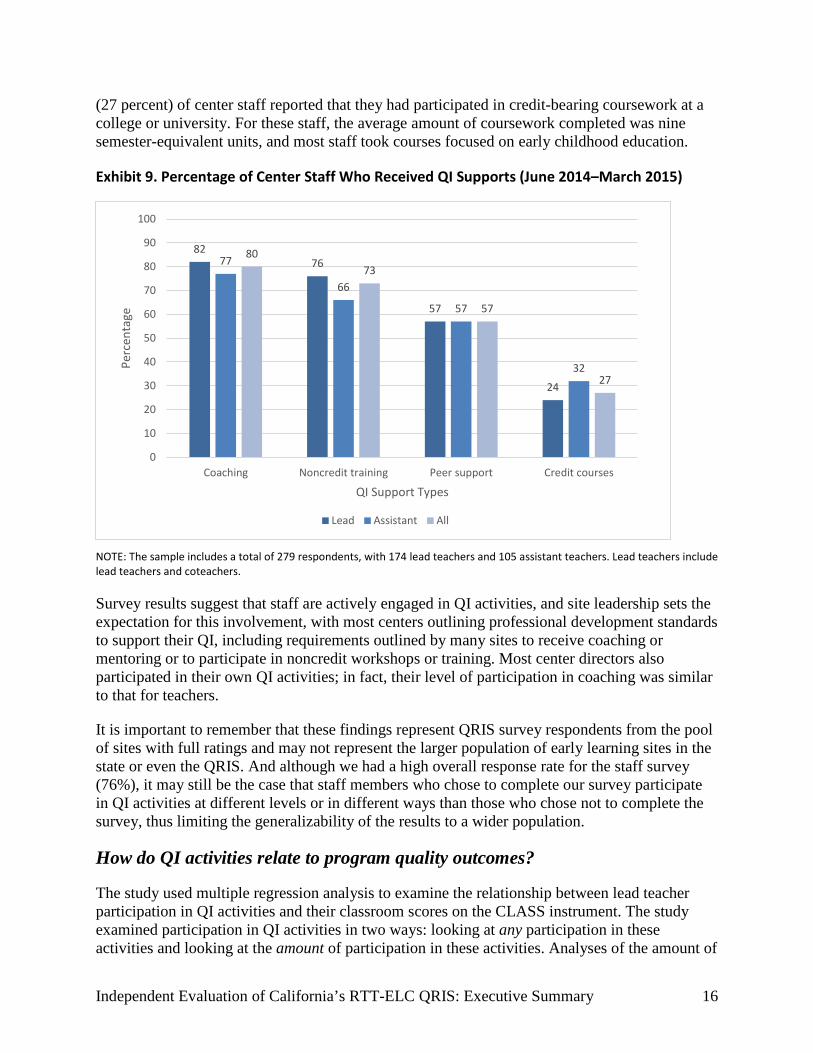
Center-based staff surveyed reported substantial engagement in QI activities, and many teachers reported consistent QI activity participation over the school year. Of the four activity types they were asked about on the survey, center-based teachers reported the highest level of engagement with coaching and mentoring (exhibit 9). About one third of staff (33 percent) reported receiving a financial incentive to promote their participation in QI efforts.
The majority of center staff (80 percent) reported receiving coaching and mentoring supports, with staff reporting an average frequency of 18.3 coaching interactions over 10 months. Approximately three quarters (73 percent) of lead and assistant teachers in centers reported that they participated in noncredit workshops or training during the year, and the average total hours across that time period was 28 hours for both lead and assistant teachers. Almost all center staff reported spending some coaching and training time on language development and literacy, math/cognitive development, and social and emotional development; other commonly reported content areas included topics related to classroom environment, teacher-child interactions, and child behavior and classroom management.
More than half (57 percent) of center staff reported that they participated in formal peer support activities, such as learning communities, peer support networks, or reciprocal peer coaching, with an average of 22.8 total hours of peer support time over 10 months. Just over one quarter
QI Support Definitions Respondents were asked about these types of QI support, defined in the survey as follows: • Coaching or mentoring supports: Supports
for individualized professional development, usually one-on-one or as part of a classroom team, provided by a coach, mentor, or advisor to help improve staff practice or promote QI more generally.
• Noncredit courses, seminars, workshops, or training programs: A training activity that may be one time or part of a series (including courses that provide continuing education units, but not including courses taken for formal college credit through a college or university). This QI type is identified as “workshops or training” throughout the remainder of the chapter.
• Peer support activities: Formal arrangements, such as learning communities, peer support networks, or reciprocal peer coaching, to discuss shared experiences and exchange ideas, information, and strategies for professional development or program improvement more generally. Informal or occasional discussions with colleagues were not included.
• Credit-bearing college or university courses: Course(s) completed for unit credit at a two- or four-year college or university.
Independent Evaluation of California’s RTT-ELC QRIS: Executive Summary 16
(27 percent) of center staff reported that they had participated in credit-bearing coursework at a college or university. For these staff, the average amount of coursework completed was nine semester-equivalent units, and most staff took courses focused on early childhood education.
Exhibit 9. Percentage of Center Staff Who Received QI Supports (June 2014–March 2015)
8276
57
24
77
66
57
32
8073
57
27
0
10
20
30
40
50
60
70
80
90
100
Coaching Noncredit training Peer support Credit courses
Perc
enta
ge
QI Support Types
Lead Assistant All
NOTE: The sample includes a total of 279 respondents, with 174 lead teachers and 105 assistant teachers. Lead teachers include lead teachers and coteachers.
Survey results suggest that staff are actively engaged in QI activities, and site leadership sets the expectation for this involvement, with most centers outlining professional development standards to support their QI, including requirements outlined by many sites to receive coaching or mentoring or to participate in noncredit workshops or training. Most center directors also participated in their own QI activities; in fact, their level of participation in coaching was similar to that for teachers.
It is important to remember that these findings represent QRIS survey respondents from the pool of sites with full ratings and may not represent the larger population of early learning sites in the state or even the QRIS. And although we had a high overall response rate for the staff survey (76%), it may still be the case that staff members who chose to complete our survey participate in QI activities at different levels or in different ways than those who chose not to complete the survey, thus limiting the generalizability of the results to a wider population.
How do QI activities relate to program quality outcomes?
The study used multiple regression analysis to examine the relationship between lead teacher participation in QI activities and their classroom scores on the CLASS instrument. The study examined participation in QI activities in two ways: looking at any participation in these activities and looking at the amount of participation in these activities. Analyses of the amount of
Independent Evaluation of California’s RTT-ELC QRIS: Executive Summary 17
participation included the total hours of coaching and mentoring, workshops or training, and peer supports as well as participation in sustained coaching, defined as receiving at least two hours of coaching per month for seven of the 10 months covered in the survey. Analysis models include a sample of 147 teachers in 98 centers and a sample of 161 teachers in 112 programs combining centers and FCCHs.
Although we did not find significant associations between overall participation in coaching activities and teachers’ CLASS scores, the amount of coaching appears to matter. We found a positive association between teachers’ total hours of coaching and the Classroom Organization domain of the Pre-K CLASS instrument. Increased hours of coaching are associated with only a small increase in CLASS scores; on average, an additional 58 hours of coaching is associated with a half-point increase on the Classroom Organization score. The relationships between hours of coaching and scores on the other Pre-K CLASS domains are positive, but not statistically significant. Also, the study found some suggestion of a positive relationship between sustained coaching over the year and the Emotional Support domain of Pre-K CLASS. However, this relationship was only marginally significant after controlling for participation in coaching in the prior program year. There was no relationship between participation in sustained coaching and scores on other Pre-K CLASS domains.
For peer supports, there was an observed positive relationship between any level of participation in this type of activity and all Pre-K CLASS domains; however, that relationship became smaller and nonsignificant in most cases after controlling for prior participation in QI activities and receipt of financial incentives. The study found no relationship between hours of peer supports and child outcomes. We also found no relationship between participation in or total hours of workshops or training and any CLASS outcomes, or between participation in ECE coursework and CLASS scores.
In all analyses in this study, we cannot identify cause-and-effect relationships because we are unable to account for all meaningful differences between teachers who did and did not participate in different types or amounts of QI, or between children who attend programs in which the teachers receive differing amounts of QI. Although the study analyses control for some teacher and child characteristics, there may be other differences between teachers or children that could explain the observed relationships. In addition, the teachers participating in the study had a relatively high level of education, and most taught in high-rated programs with standards-based public funding. Thus, the relationships observed in this sample may not apply to all early childhood teachers in the state or to all children in ECE programs in the state.
How do QI activities relate to child outcomes?
To examine the relationship between QI activities and child outcomes, we conducted multilevel regression analysis to describe associations between QI activities and children’s developmental outcomes in the spring, controlling for fall scores and site and child characteristics. Analysis models include a sample of 1,489 to 1,552 children in 113 centers and a sample of 1,547 to 1,611 children in 132 programs combining centers and FCCHs.
We found that teacher participation in coaching was positively associated with children’s letter-word identification skills but not executive function or mathematics skills. Although the study

Independent Evaluation of California’s RTT-ELC QRIS: Executive Summary 18
largely found positive relationships between coaching and child outcomes, the outcome related to Story and Print Concepts was an exception. Study analyses found a negative association between participation in any coaching and child scores on this measure. This finding may be an indication that coaching deemphasized these kinds of basic book knowledge skills (for example, identifying the author and title of a book).
When we consider the intensity of participation in—or “dosage” of—QI activities, we find more consistent relationships with child outcomes. For example, we found positive associations between the total hours of coaching that teachers received and letter-word identification, executive function, and early mathematics skills, and positive associations between participation in sustained coaching over the year and letter-word identification and executive function skills. Thus, although coaching was consistently associated with improved letter-word identification, only more intensive coaching was associated with improvements in executive function and mathematics, suggesting that small amounts of coaching may not be adequate to support teachers in helping children learn in these more challenging areas of child development.
We did not find consistently positive associations between participation in noncredit workshops or ECE coursework and children’s outcomes. In fact, some negative associations emerged, which may reflect the targeting of this support to teachers who need it. The study also did not find a relationship between participation in or hours of peer supports and child outcomes.
What is the cost of different types of QI activities?
Using information gathered directly from 11 Consortia on the economic costs associated with the main types of QI strategies employed by local Consortia in California, we examined the per-unit cost of various QI activities. Among the five Consortia with the most reliable data, the Consortia cost per participant averaged $3,400 for coaching and mentoring. On average, the cost per participant for noncredit workshops or trainings was just over $300 (based on data from four Consortia) and $1,350 for credit-bearing courses (based on data from three Consortia). This pattern reflects the efficiency in delivering a single workshop to multiple participants as compared with coaching/mentoring, which is typically a one-on-one activity for each available hour. Two Consortia provided reliable data on peer supports; the average annual cost per participant for this type of QI activity was just over $2,400. Thus, coaching, the type of QI activity that was most consistently related to both quality outcomes (higher CLASS scores) and children’s developmental outcomes, also was the most expensive. This is not surprising given that coaching, unlike the other types of QI activities, is typically conducted one-on-one and thus is more labor intensive. Peer supports, which were associated with classroom quality outcomes but not child outcomes, was somewhat less expensive, although still much more costly than group-administered workshops, which did not show positive associations with quality or children’s developmental outcomes.
Such information may be of interest in its own right to improve understanding of the resources required to provide various QI supports in the context of a QRIS. In addition, such cost information may provide the basis for undertaking a cost-effectiveness analysis to understand which QI activities produce the largest impacts on program quality improvement or children’s developmental gains for every dollar spent. For purposes of this study, it was not possible to conduct this type of comparative cost-effectiveness analysis as, apart from coaching, estimates of

Independent Evaluation of California’s RTT-ELC QRIS: Executive Summary 19
QI activity impacts do not show consistent expected impacts across more than one QI activity. Thus, we could calculate a cost-effectiveness ratio for coaching, but not for other QI activities. Without multiple ratios, a comparative cost-effectiveness analysis cannot be conducted.
In addition, given the limitations on the cost information provided by the Consortia, the estimated cost figures should be viewed as approximations of the true economic cost. Most of the Consortia conduct multiple QI activities, and it often was challenging to allocate the shared cost of administration and other overhead activities across each of the QI components. In addition, the QI supports in each local Consortium typically involved some combination of state-funded and locally funded activities, whereas the state-funded activities may be administered at the state or local level. This made it difficult to ensure alignment between the expenditure amounts reported for any given QI support on the part of the local Consortia and the level of QI outputs, which may include activities supported with state funds. Furthermore, there is considerable variation across Consortia in the resulting cost estimates. We would expect some variation given that the Consortia approach QI activities in different ways and face varied costs for labor and other inputs in their local community. But some of the variation may reflect the challenge of calculating such costs in a consistent manner. Future research might seek to understand and document the reasons behind the variations in reported costs by Consortia. This would allow for more meaningful cost-estimate comparisons across Consortia and would produce the most reliable cost-effectiveness analyses.
Summary and Conclusions
Key Takeaway Messages
Several key takeaway messages emerge from the study of California's RTT-ELC QRIS and are described below. Limitations of the study—including the early stage of implementation of the QRIS, the small sample of sites with limited variability in ratings and program characteristics included in the study, and the exploratory design of the study—should be considered in interpreting the study findings.
Implementation of the RTT-ELC QRIS was in an early stage at the time the study began, but significant progress has been made over the course of the system’s development, from 2012 to 2015.
Overall, Consortia exceeded their goals for enrolling sites over the RTT-ELC QRIS grant term. In this pilot phase, California successfully targeted publicly funded programs serving high needs children for the earliest implementation of the QRIS. In addition, Consortia made significant progress in conducting ratings and supporting QI in participating sites.\
Few programs had complete QRIS ratings at the start of the study, however. And given the focus on prioritizing enrollment for publicly funded programs (which must meet minimum quality standards), there was limited variability in program scores among the rated sites, with most sites receiving a score of 3 or 4. These factors limit the applicability of the study findings to the broader set of programs that currently participates in the QRIS.

Independent Evaluation of California’s RTT-ELC QRIS: Executive Summary 20
The dissemination of QRIS ratings has been limited, but analyses of the ratings as well as community input suggest that providing detailed quality element scores may be beneficial.
Parents and providers who participated in the study generally agreed that the ratings capture the right information about program quality, and parents are eager to have access to the ratings, including information about each measured aspect of quality. As of summer 2015, ratings were used internally for QI and planning purposes, but were not yet publicly available to parents in most counties. However, counties had plans to release them, and, according to the state Implementation Team, did so by the end of 2015.
Analyses of rating elements and their relationship to overall program ratings indicate that QRIS ratings do not represent a single dimension of quality; programs with the same QRIS rating had very different element score patterns. The best information about quality comes from providing element ratings in addition to the overall program rating.
The study provides some evidence of the validity of California’s QRIS ratings, although it is too early in the system’s implementation to draw many conclusions.
California QRIS ratings are positively related to the quality of classroom interactions in early childhood programs, at least for the limited sample of sites with full ratings. Specifically, higher rated programs were observed to have higher scores on independent measures of the types of teacher-child interactions that are most supportive of children’s developmental outcomes.
In addition, among programs participating in the QRIS, children had higher average scores on measures of literacy, mathematics, and executive function at the end of the year than at the beginning of the year. This was true for each QRIS rating level. However, as might be expected with the small number of fully rated sites, the limited range in QRIS ratings, and the different populations served by programs at different rating levels, the study found only a small positive relationship between tier ratings and executive function (one of four child outcome measures examined). On measures of early mathematics and literacy skills, analyses did not reveal larger gains among children attending higher rated programs (Tier 4 or 5) compared with children in Tier 3 programs. Comparisons could not be made with lower rating tiers due to the small number of lower rated programs in the study. These mixed results are consistent with other states’ QRIS evaluations.
Using a slightly different approach to calculating ratings—averaging (instead of summing) scores on the individual quality elements—yielded slightly stronger relationships with child outcomes. That is, children in sites rated at Tier 4 or Tier 5 using the averaging approach show stronger mathematics and literacy skills at the end of one program year compared with children in Tier 3 sites.
These results cannot be used to draw firm conclusions about the validity of the system given its early stage of implementation. Once the system is more mature and programs representing a wider ratings distribution are enrolled, further evaluation will be necessary to draw conclusions about the relationship between attending a higher rated program and children’s developmental outcomes. Study results also cannot be used to assess the causal relationship between program quality and child outcomes, given the observational nature of the study design. To do so would
Independent Evaluation of California’s RTT-ELC QRIS: Executive Summary 21
require an experimental approach where children are randomly assigned to programs with different levels of quality. This was not possible for this study, whose primary purpose was to assess the validity of the rating system and the status of the improvement activities.
Study analyses reveal high levels of participation in QI activities by program staff and point to coaching as a promising approach to improving quality.
Large numbers of program staff in rated sites reported participating in a range of QI and supportive activities, including coaching and mentoring, workshops and training, peer supports, and credit-bearing courses. Staff reported that coaching was the most helpful strategy for their professional learning, although coaching is relatively expensive compared with other types of QI supports. In addition, more intensive or sustained coaching is positively linked to program quality and children’s developmental outcomes.
Policy Options for Consideration
Although there are limitations to the study results, and conclusions should be interpreted in the context of those limitations, our analyses do suggest some directions that may be worth consideration by the state. In this section, we offer some suggestions for modifications to the system or next steps that the state might want to consider in light of the evidence and other contextual factors.
1. Consider presenting detailed rating information to parents.
Although ratings had not been widely disseminated at the time of the study, our conversations with parents in RTT-ELC counties suggest that parents would like to have information about program scores on different aspects of quality. Our examination of QRIS rating validity provides evidence to support dissemination of element scores, in addition to an overall rating because programs at the same level may have very different element scores. More detailed rating information that includes element scores may help parents find programs that meet their own specific preferences in terms of quality.
In addition to providing element scores or subratings, the state and Consortia should continue to think carefully about how best to present and explain the scores to parents. Focus groups with parents revealed a lack of clarity on some of the elements, suggesting a need for additional guidance to help parents understand the value of the quality elements and identify those that are most meaningful to them. The state may wish to consider conducting a pilot phase for releasing rating data to identify the best communication strategies and learn more about the program options and decision processes used by parents in selecting ECE programs.
2. Consider alternative rating strategies to strengthen validity.
Although some evidence supports the validity of the Hybrid Rating Matrix in its current form, an element average rating approach appears to hold the most promise from among the alternative rating approaches tested. Ratings calculated by taking an average score across elements have somewhat stronger relationships with other measures of program quality and with child literacy

Independent Evaluation of California’s RTT-ELC QRIS: Executive Summary 22
and mathematics outcomes, in comparison with the California QRIS ratings based on the Hybrid Rating Matrix.
There may be other approaches to consider as well, such as modifying cut points on the element scores, which might improve the validity of the rating. The data available for the current study did not permit us to evaluate these kinds of refinements, but they may be worth exploring in the future as a way of strengthening the rating to ensure that it is truly differentiating programs based on quality and children’s learning outcomes.
3. Consider a coaching model that offers sustained support over the course of the year.
Study analyses found consistent evidence that coaching in larger amounts, or sustained over the course of the program year, is related to better classroom quality and more positive developmental outcomes for children. The findings provide preliminary support for sustained coaching as a professional development model, but the exploratory design of this study does not allow us to determine whether the coaching itself caused better outcomes. For example, the programs that received sustained or large amounts of coaching could have other resources and advantages that lead to better outcomes independent of the coaching itself.
4. Consider exploring the types of peer supports that are available to staff to learn more about effective approaches to this type of QI activity.
In addition to coaching, we found some limited evidence of the benefits of formal peer support activities for teachers’ classroom quality, although we found no relationships with child outcomes. Peer supports were defined for staff as formal arrangements, such as learning communities, peer support networks, or reciprocal peer coaching arrangements, which were intended to provide opportunities for staff to discuss shared experiences, exchange ideas, and learn from each other. This support could include structured arrangements, such as professional learning communities, or less formal, center-based support groups, such as weekly meetings or presentations among site staff or family child care networks. Defined in this way, peer supports represent a broad set of activities in which early learning staff may have participated. Given the breadth of this QI support, it would be useful to explore peer support activities in more detail to better understand what staff are actually doing in these collaborative interactions and how they may support their classroom practice. Depending on how these activities are organized, they could mimic the coaching or mentoring relationships described above yet provide a less costly option for Consortia, especially as the funding landscape changes. Some attention to what these experiences entail and under what conditions they appear to be more or less effective is warranted.
5. Consider ways to encourage or require more providers to participate in the system.
The state also may consider how to encourage or require a broader range of programs to participate in and be rated through the QRIS. Limited variation in programs presented some challenges for the evaluation, but also signals a limitation for parents who may wish to use the QRIS ratings in making decisions about program quality. The narrow range of programs participating also limits the potential impact of the QRIS in helping families choose rated
Independent Evaluation of California’s RTT-ELC QRIS: Executive Summary 23
programs that suit their own needs and preferences, particularly if few private programs (such as those receiving vouchers that are not part of state preschool programs) participate in the system.
6. Consider another validation phase once the system is further developed.
As noted throughout this report, data limitations, due in part to the QRIS’s stage of development, constrain the analyses and limit the generalizability of the results. To address this constraint, the state might consider revisiting system validation once refinements currently under discussion are made and once the system is expanded to include a more diverse array of programs. If further analyses are to be conducted, it would be essential for Consortia to collect, maintain, and share with the state additional classroom- and site-level data. Such data would enable additional analyses and suggest evidence-based refinements. In particular, it would be helpful to have raw element-level data (for example, ratios and ERS scores). In addition to being useful for accountability purposes, retaining these data would permit the examination of element score cut points and the simulation of ratings based on modified cut points to refine the element scoring criteria. Any refinements that strengthen the reliability and validity of the ratings would help make the QRIS a more meaningful signal of quality for parents and a more effective tool for targeting QI resources.

Independent Evaluation of California’s RTT-ELC QRIS: Executive Summary 24
References Diamond, A., & C. Taylor. (1996). “Development of an aspect of executive control:
Development of the abilities to remember what I said and to ‘Do as I say, not as I do.’” Developmental Psychobiology 29, 315–34.
Elicker, J., and others. 2011. Evaluation of Paths to QUALITY, Indiana’s Child Care Quality Rating and Improvement System: Final Report. West Lafayette, IN: Purdue University. http://www.cfs.purdue.edu/cff/documents/project_reports/PTQFinalReportRev11012.pdf (accessed March 15, 2013).
HighScope Educational Research Foundation. 2003. Preschool Program Quality Assessment, Second Edition (PQA) Administration Manual. Ypsilanti, MI: HighScope Press.
Lahti, M., and others. 2013. Validation of Quality Rating and Improvement Systems (QRIS): Examples from Four States (OPRE 2013-036). Washington, DC: Office of Planning, Research and Evaluation, Administration for Children and Families, U.S. Department of Health and Human Services. http://www.researchconnections.org/childcare/resources/26590/pdf (Accessed April 3, 2015).
La Paro, K. M., B. K. Hamre, and R. C. Pianta.2012. Classroom Assessment Scoring System (CLASS) Manual: Toddler. Baltimore, MD: Brookes.
Woodcock, R., W., K. S. McGrew, F. A. Schrank, N. and Mather. 2007. Woodcok-Johnson III Normative Update. Rolling Meadows, IL: Riverside.
Zill, N. & G. Resnick, 2000. FACES Story and Print Concepts – Version 2. Rockville, MD: Westat, Inc.