rtm assignment 2
TRANSCRIPT

RTM ASSIGNMENT 2: THE WATER EQUIVALENCE OF LIF TLDS

i
TABLE OF CONTENTS
TABLE OF CONTENTS ................................................................................................................................................... i
ABSTRACT ................................................................................................................................................................... ii
INTRODUCTION .......................................................................................................................................................... 1
METHODOLOGY ......................................................................................................................................................... 2
Clinical measurements ........................................................................................................................................... 2
Equipment .............................................................................................................................................................. 2
Entrance dose calibration ...................................................................................................................................... 2
Midline dose determination .................................................................................................................................. 3
RESULTS AND DISCUSSION ......................................................................................................................................... 4
CONCLUSION .............................................................................................................................................................. 8
References ................................................................................................................................................................. 9

ii
ABSTRACT
The dosimetry was carried out for radiotherapy patients, and measurements were performed using
LiF and thermoluminescent dosimeters (TLDs). Evaluations were done for water-equivalent
(effective) thicknesses and target dose with transmission data. Considerations were made for the
accuracy of the parameter for the ratio of measured to expected value for each quantity. The
entrance dose was estimated as 1.01 ± 0.07. The mean ratio of effective to contour depth was 1.00
± 0.13, showing a wide distribution reflecting the influence of contour inaccuracies. The mean
ratio of the measured contour dose prescription was 1.00 ± 0.07. The difference in depths that is
patient and effective depth is a reflection of target dose discrepancies. Graphical simulations were
done using Monte-Carlo Simulations and presented.
1
INTRODUCTION
Probability relationship approximates the control of local tumor and normal tissue injury (Leunens,
et al., 1990; Leunens, et al., 1990). Thus procedural therapy for weak point determination is key
to treatment. The most and effective method for this probabilistic determination weak point is in
vivo dosimetry. The commonly used method is thermoluminescent dosimeter (TLD) (Tung, et al.,
2004). This application si popular since it permits the use of small dependencies on dose rate,
temperature, energy and high spatial sensitivity, and resolution (Moscovitch, 1999). TLDs are
popular also since they are unattached to the bias voltage and electrometer though they are passive
and their answers are not prompt.
In vivo dosimetry are in various levels: intracavity dose; entrance dose and exit dose. The coherent
objective of dosimetry is the determination of value of doses. Therefore, the study is first-quality
assurance program for determination of target dose based on water-equivalent (effective) diameter.
This was done for comparison with the actual contour diameter for investigation of the effect of
the corresponding variation of the delivered dose to the target.
Photons on the other hand interacts with atoms in many ways (Corvan, et al., 2014): the multi-
MeV regime, where photoionization occurs, electron-positron pair production and compton
scattering. There are also a number of ways of detection of MeV gamma rays which in most cases
exploits quantum electromagnetic cascade initiated by photon solidification and compton
scattering.

2
METHODOLOGY
Clinical measurements
The study was forced on the Source Axis Distance (SAD) since the study is focused on the midline.
Measurements were taken for dosage at the entrance and exit doses. TLDs of 50 𝑚𝑚 build up was
used to cover material for placement of the surface perpendicular to the beam central axis at each
measuring point. Shadow effect was avoided by either the entrance detector or the exit detector by
shifting the beam slightly out of his axis. Accuracy of the treatment procedure is the ratio of the
measured to the expected values.
Equipment
Since TLD is water equivalent, the analysis of TLDs were done with the Harshaw-3500 manual
reader. With an absorbed dose of 1 Gy at the center of a 10 × 10 cm2 field size and 95 cm source-
skin distance (SSD), the residual signal was noted to be < 1%. Thus batch uniformity = 3.5%
which is equivalent to 1 SD.
Entrance dose calibration
TLDs were positioned on phantom surface for measurement of entrance dose (Den) measurement
and calibration were done for the determination of dose inside the phantom at a depth of the
maximum dose (𝑑𝑚).
Sensitivity loss factor was estimated by:
𝑆𝑓 =
(�̅�𝑟𝑒𝑓
𝐼𝐶 𝑎𝑏𝑠𝑜𝑟𝑏𝑒𝑑 𝑑𝑜𝑠𝑒)1
(�̅�𝑟𝑒𝑓
𝐼𝐶 𝑎𝑏𝑠𝑜𝑟𝑏𝑒𝑑 𝑑𝑜𝑠𝑒)𝑓

3
Midline dose determination
Determination of Midline dose was based on measurements taken during transmission. From the
theory, 𝑇𝑒𝑥 =𝐷𝑒𝑥
𝐷𝑒𝑛, while 𝑇𝑚𝑖𝑑 =
𝐷𝑚𝑖𝑑
𝐷𝑒𝑛. However, 𝑇𝑒𝑥 and 𝑇𝑚𝑖𝑑 could be calculated from
𝑇𝑒𝑥(𝐴′, 𝑑𝑧−𝑒𝑛) =𝑇𝑀𝑅(𝐴′, 𝑑𝑧−𝑑𝑒𝑛
) (𝑆𝑆𝐷 + 𝑑𝑚
𝑆𝑆𝐷 + 𝑍 − 𝑑𝑚)
2
𝐵𝑆𝐹(𝐴′)
𝐵𝑆𝐹(𝐴0)
𝑇𝑚𝑖𝑑 (𝐴, 𝑑𝑍2
) =
𝑇𝑀𝑅 (𝐴′, 𝑑𝑍2
) (𝑆𝑆𝐷 + 𝑑𝑚
𝑆𝑆𝐷 +𝑍
𝑑𝑚
)
2
𝐵𝑆𝐹(𝐴)
𝐵𝑆𝐹(𝐴0)
where 𝐴0, 𝐴, and 𝐴′ are the field sizes at the entrance, midline ((𝑆𝑆𝐷+
𝑍
2
𝑆𝑆𝐷+𝑑𝑚) 𝐴0) and exit levels
((𝑆𝑆𝐷 + 𝑧 − 𝑑𝑚
𝑆𝑆𝐷 + 𝑑𝑚) 𝐴0)
and 𝑍 is the water-equivalent (effective) depth, 𝑑𝑚 maximum dose depth.

4
RESULTS AND DISCUSSION
Correction factors
Correction factors have to be determined when irradiation geometry differs from the reference
geometry used in the calibration procedure. These variations in TLDs’ response were examined in
different SSDs and field sizes. Correction factor (CF) is defined as
𝐶𝐹 =
�̅�𝑟𝑒𝑓
𝐼𝐶 (𝑎𝑏𝑠𝑜𝑟𝑏𝑒𝑑 𝑑𝑜𝑠𝑒)𝑟𝑒𝑓𝑒𝑟𝑒𝑛𝑐𝑒 𝑔𝑒𝑜𝑔𝑚𝑒𝑡𝑟𝑦
�̅�𝑟𝑒𝑓
𝐼𝐶 (𝑎𝑏𝑠𝑜𝑟𝑏𝑒𝑑 𝑑𝑜𝑠𝑒)𝑔𝑒𝑜𝑔𝑚𝑒𝑡𝑟𝑦 𝑜𝑓 𝑖𝑛𝑡𝑒𝑟𝑒𝑠𝑡
The attention of the experiment was focused on the LiF, a material of the lowest value of Z. Based
on the database, the Compton scattering was noted as the overriding interaction between
mechanisms for a multi-MeV gamma-ray beam up to energies of 20 MeV as shown in the figure
below.
Figure 1: Energy loss for a multi-MeV gamma ray beam as it interacts with LiF.

5
The lines in the square corresponds to nuclear filed while the blue is for diamond for Compton
scattering. Compton scattering is dominant up to around 1.5 MeV, after which pair production
dominates.
To estimate the effect of LiF on the spectrum of the electrons, simulation was done using the
Monte-Carlo code FLUKA and the simulation present in the figure below.
Figure 2: Spectra of the electrons generated.
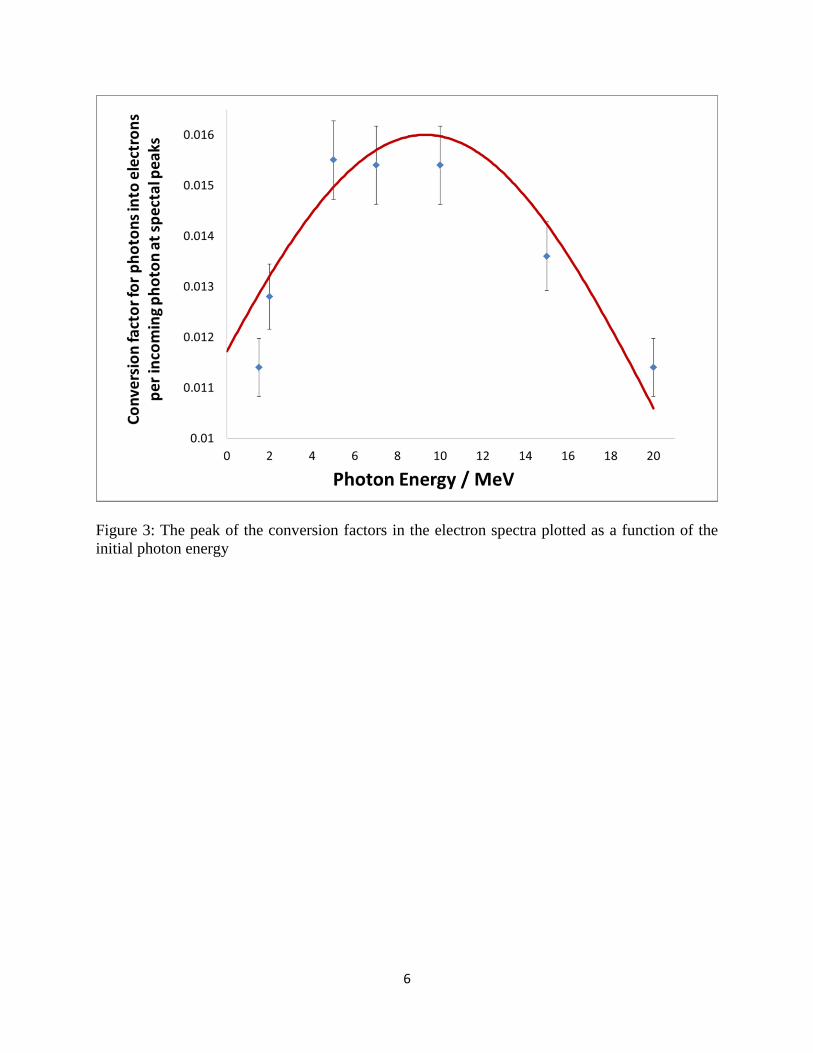
However, the Gaussian gave appropriate estimation of the relationship between the peak values of
the conversion factor and is show in the Figure 3 below. Furthermore, the peak of the conversion
factors in the electron spectra plotted as a function of the initial photon energy. The peaks rise in
magnitude up to 5 MeV where the peaks remain endless up to 10 MeV after which they start to
decrease again. This shown in Figure 4.
6
Figure 3: The peak of the conversion factors in the electron spectra plotted as a function of the
initial photon energy

7
Figure 4: Fluka simulations.

8
CONCLUSION
Lif and TLD was used to carry a compressive series evaluation of in vivo dosimetry measurements.
Determination of water-equivalent depth and midline dose showed a close association between the
midline dose imprecision and discrepancy of water-equivalent and contour depths.
Furthermore, the modification of compact gamma-ray spectrometer for in vivo dosimetry for
treatment presented showed that for energy windows around 20 MeV, using Monte-Carlo
simulations, the performance of the system can be checked. The results of this experiments were
in line with other conducted by Aad, et al., (2014).
9
References
Aad, G. a. A. T. a. A. B. a. A. J. a. K. S. A. a. A. A. et al., 2014. Measurement of the inclusive
isolated prompt photons cross section in p p collisions at s= 7 TeV with the ATLAS
detector using 4.6 fb- 1. hysical Review D, 89(5), p. 052004.
Corvan, D. J., Sarri, G. & Zepf, M., 2014. Design of a compact spectrometer for high-flux MeV
gamma-ray beams. Review of Scientific Instruments, 85(6), p. 065119.
Leunens, G., Van Dam, J., Dutreix, A. & Van der Schueren, E., 1990. Quality assurance in
radiotherapy by in vivo dosimetry. 1. Entrance dose measurements, a reliable procedure.
Radiotherapy and Oncology, 17(2), pp. 141-151.
Leunens, G., Van Dam, J., Dutreix, A. & Van der Schueren, E., 1990. Quality assurance in
radiotherapy by in vivo dosimetry. 2. Determination of the target absorbed dose.
Radiotherapy and Oncology, 19(1), pp. 73-87.
Moscovitch, M., 1999. Personnel dosimetry using LiF: Mg, Cu, P. Radiation protection
dosimetry, 85(1-4), pp. 49-56.
Tung, C. et al., 2004. In vivo dosimetry for external photon treatments of head and neck cancers
by diodes and TLDS. Radiation protection dosimetry, 111(1), pp. 45-50.