row-detection on an agricultural field using ...408052/fulltext01.pdf1 shows the mobile robot on a...
TRANSCRIPT

Row-detection on an agricultural field using omnidirectional camera.
Stefan Ericson and Bjorn Astrand
Abstract— This paper describes a method of detecting par-allel rows on an agricultural field using an omnidirectionalcamera. The method works both on cameras with a fisheyelens and cameras with a catadioptric lens. A combination of anedge based method and a Hough transform method is suggestedto find the rows. The vanishing point of several parallel rowsis estimated using a second Hough transform. The method isevaluated on synthetic images generated with calibration datafrom real lenses. Scenes with several rows are produced, whereeach plant is positioned with a specified error. Experimentsare performed on these synthetic images and on real fieldimages. The result shows that good accuracy is obtained on thevanishing point once it is detected correctly. Further it showsthat the edge based method works best when the rows consistsof solid lines, and the Hough method works best when the rowsconsists of individual plants. The experiments also show thatthe combined method provides better detection than using themethods separately.
I. INTRODUCTION
Mobile robots for use on an agricultural field require reli-able sensors for both localization and perception. Today, oneof the most common used sensors for agricultural machineryis the RTK-GPS. It is mainly used as position measurementfor tractor autopilots, where the farmer can drive in straightrows with minimum of overlap between rows. It is also usedon autonomous agricultural robots but only for research.The drawbacks of the RTK-GPS are the dropouts and therequirement of clear view of the sky. The cost has alsomentioned as an issue, but promising work shows a way ofbuilding low-cost RTK-GPS using open source library [1].
The use of cameras for localization has been seen moreas a complementary method to GPS. However, advantagesof using camera are that it can be used for simultaneouslylocalization and mapping (SLAM) and obstacle avoidance. Itcould also provide low-cost system. In the case of navigationon an agricultural structured field, one of the most importanttasks is to keep track of the rows and to separate the cropsfrom weed and soil. Several agricultural robots has beenpresented in the literature, some navigating using only GPS[2], others with vision [3], [4], [5], and some with sensorfusion between several sensors [6]. In [7] a mobile robotfor automated weed control is presented where perspectivecameras are the main sensor. In own previous work [8]a mobile robot was presented using row-following fromperspective camera and visual odometry for navigation. Fig.
S. Ericson is with School of Tecnology and Society, University of Skovde,Skovde, Sweden [email protected]
B. Astrand is with the School of Information Science, Computerand Electrical Engineering, Halmstad University, Halmstad, Sweden,[email protected]
1 shows the mobile robot on a row-structured agriculturalfield.
Fig. 1: Mobile experimental robot on a row-structured agri-cultural field
The vision guided robots introduced so far have usedperspective cameras. There are several advantages of usingan omnidirectional camera instead. First more and longerrows can be captured, i.e. more robust to weed pressureand missing crops and rows. Second, it sees plants besidethe robot which may give better estimate of alignment error.Finally it sees behind the robot which gives the opportunityto achieve better row-guidance at end of row, and enablesmonitoring of field operations. Among the omnidirectionalcameras there are both cameras with catadioptric lens andwith fisheye lens. The major difference is the range ofazimuthal view. A fisheye lens starts from zero which meansit sees straight ahead, and end somewhere above 90◦. Thecatadioptric lens on the other side cannot see straight aheaddue to its construction, but it has a wider range above90◦. The image analysis on omnidirectional images can becategorized in two groups, those who require the image tobe unwrapped and those who are applied directly on theomnidirectional image. The unwrapping is a time consumingprocess and for real-time applications on a mobile robot thelatter is to prefer. The algorithms used in this work do notneed the images to be unwrapped.
Successful work on omnidirectional images has recentlybeen presented in [9] where lines vertical to the camera isextracted. A SIFT-like descriptor is used for matching andtracking these lines between frames. This method is used forlocalization of a mobile robot [10], and it provides accurateheading information as well as translation. A drawback ofthe system is that it does not deal with tilt. In an agricultural
The 2010 IEEE/RSJ International Conference on Intelligent Robots and Systems October 18-22, 2010, Taipei, Taiwan
978-1-4244-6676-4/10/$25.00 ©2010 IEEE 4982

scene the robot is moving in uneven terrain and the tilt isrequired to estimate the position of the row. Further moreonly a few lines can be expected to be radial to the cameraon a field consisting of parallel rows. At the beginning ofa row there will be one line ahead of the robot and whiledriving along a row, radial lines can be found in front andbehind the robot. This is too few lines and hence this methodis not suitable for this application.
In [11] the authors present a novel edge-based method tofind lines and further rectangles in catadioptric images. Thelines are extracted using edge detection on a grayscale image.All connected edge points are grouped, and the endpoints arefound. Lines shorter than a specified threshold are rejected.The authors use a method where the points are mapped viaa sphere. In that way all straight lines in the omnidirectionalimage can be represented by a great circle on the sphere.Each line is then splitted so all points on the same line canbe projected on one great circle. The last step in the algorithmis to merge all lines which can be represented by the samegreat circle. This method is applied in finding the attitudeof an UAV [12] and to navigate in urban environment byfinding and tracking the vanishing point [13]. However, thismethod requires well defined edges, consisting of connectededge points in the direction of the lines.
In an agricultural scene the rows consist of single plantsplaced on a line with different distance. Plants close to therobot, or in this case close to the camera, hold importantinformation about the robot’s position relative the row. Inthis particular area the rows may not be viewed as solid,rather as individual plants. The method presented in [11]uses edge detection such as Canny for extracting line. Thismethod is expected to work in areas far away from the robot,where the rows will be seen as solid lines. In the areas closeto the robot, the rows may only consist of the shapes ofthe individual plants. In this area the Hough transform ispotentially better to use. A method for detecting lines incatadioptric images using Hough transform is presented in[14].
This paper contributes with a method of detecting parallelrows on an agricultural field using an omnidirectional cam-era. The rows can consist of either solid lines or individualplants. Both catadioptric and fisheye lens are supported, andthe algorithm extracts the vanishing point which containsinformation about both heading and tilt. This work evaluatesthe two methods to find lines on agricultural scenes andsuggests a method that combines the Hough transform andthe edge method.
II. METHOD
This work differs from the work done in [11] in threeways. First, the calibration of the omnidirectional camerauses the Taylor model [15] which allows both catadioptricand fisheye lenses. Second, a Hough transform step is addedto find rows consisting of individual plants. Finally a secondHough transform is applied to find the vanishing point of theparallel row structure.
A. Camera calibration
It is assumed that the camera uses a lens/mirror combina-tion that provides a single effective viewpoint, which meansthat all incoming rays can be modeled to intersect the centerpoint of a unit sphere. Then each ray can be represented bya unit vector on this sphere as shown in Fig. 2. Further it isassumed that the lenses and mirrors are symmetric and thatthe sensor plane is perpendicular to the optical axis. In [16]it is shown that both fisheye and catadioptric cameras can beprojected onto the image plane using two functions g and has shown in (1).
α′′p′′ =[h(‖u′′‖)u′′g(‖u′′‖)
]= P′′X (1)
where α′′ > 0 is factor, u′′ is the point on sensor plane,P′′ ∈ <3×4 is projection matrix and X is the scene point. In[15] a unified method to calibrate both fisheye and catadiop-tric camera is presented. This is done by rewriting the twofunctions (g and h) as one function g/h. By representing thisfunction with a Taylor approximation, the relation between ascene point and a point in the sensor plane can be expressedas shown in (2).
α′′p′′ =[
u′′
a0 + a2 ‖u′′‖2 + . . .+ aN ‖u′′‖N]
= P′′X
(2)where an is coefficients of the Taylor polynomials. Theadvantage of using this representation is that it is valid forboth catadioptric and fisheye lenses. Hence the method canbe used for both types. The Matlab toolbox described in[17] is used for the calibration procedure, which providesthe relation between an image point in pixels with a unitvector from the single effective view point.
B. Row model
Rows in the scene can be represented by a plane cuttingthe unit sphere in the camera model, i.e. each point on therow can be expressed as a vector lying both on the planeand the sphere. The plane can further be expressed by itsnormal, which means each row can be expressed as thisnormal. From here on normal is used for denoting the normalvector perpendicular to the plane. Fig. 2 shows how a row ofplants is projected on the sensor plane and the correspondingimage.
C. Edge method
Crop rows far away from the camera will be viewed assolid lines. Hence they can be modeled as lines which canbe detected with an edge method. This part is similar tothe method described in [11]. The first step is to applythe Canny algorithm to the image. Then a mask is appliedto remove points not of interest. It can be structures fromcamera mounting or points close to the edge of visible field.Further each line is divided into sections where each sectioncan be represented by one normal vector on the unit sphere.That means only points in the same direction are kept in one
4983

n
Senor plane
row
Fig. 2: Projection through the lens on to the sensor plane bya unit sphere model.
line. Minimum line length is specified and line shorter thanthis threshold is removed. The last step is a merging stepthat merges lines describing the same row. The orthogonaldistance between all normals is calculated. Normals closeto each other, i.e. the distance is shorter than a specifiedthreshold, are considered to be the same normal. The newnormal is estimated by using singular value decompositionof all points.
D. Hough method
The Hough method consists of a Hough transform fol-lowed by a non linear optimization step. The original imageis used as input. Hence a separate mask can be used tospecify the area of interest. First a Gaussian smooth filteris applied to reduce noise in the image. Then an adaptivethreshold is applied to produce a binary image, wherecorresponding unit vectors can be calculated for each point.The threshold is tuned to allow a certain number of points tobe selected. In this way the computation time of the Houghtransform can be controlled. The parameters selected for theHough transform is spherical coordinates of the normal tothe plane representing the rows.
~nr = [sin(ϕr)cos(θr) sin(ϕr)cos(θr) cos(ϕr) ]T
(3)where 0 < ϕr < π and 0 < θr < 2π. Let ~nr =
[nx ny nz]T denote the normal to the plane. Then thepoints on a row will satisfy (4).
nx ·sin(ϕ)cos(θ)+ny ·sin(ϕ)cos(θ)+nz ·cos(ϕ) = 0 (4)
The size of the accumulator is kept small to increase theprocessing speed. Experiments in this paper uses accumula-tor of size 90×90. The accuracy of the normal describing theplane is increased by applying a line fitting step as suggestedin [14].
E. Finding vanishing point
The vanishing point contains information about the head-ing of the robot and also tilt. Similar to how points on a
row produce vectors that lies on a plane, several parallelrows will produce normals that define a plane. Hence thesame method can be used to find the major direction of allrows. The normal to the multiple planes will point out thevanishing point in the image. The method used is the same asthe Hough transform used for finding normals representingthe rows. The number of rows is generally low which meansthe second Hough transform will execute fast. The range ofϕ and θ is selected to correspond to the range of expectedvanishing points. For the case with a mobile robot in anagricultural field, the vanishing point is expected to be alongthe horizon. Hence points too high in the sky are rejected.
The output from the second Hough transform is used asinput in a non linear optimization which gives the resultingvector describing the vanishing point. Fig. 3 shows the vectordescribing vanishing point, vectors describing the rows andfinally each individual point that is seen in the image plane.
1 0.500.51 1
01
1
0.5
0
0.5
1
yx
z
Fig. 3: Normals and planes in unit sphere describing van-ishing point(red) and rows (blue). Projections of individualplants are marked in green.
F. Combined method
The combined method takes advantage of both edgemethod and the Hough method by feeding the second Houghtransform with normals from both methods. These normalsare weighted according to how many points on the row thathave contributed to the normal. This leads to higher weightfor rows that were built from many points. For the edgemethod this corresponds to longer connected edges, and forHough method the value in the accumulator, i.e number ofpoints contributing to the line. This step reduces the use ofthe merging step in the edge method since two short lineson the same great circle contributes to the same cell in thesecond Hough transform. To adjust the balance between themethods, a general weight w is applied, where 0 < w < 1.
4984

Then the normals are weighted according to (5).
~ncomb =
w · ~nedge for edge normals
(1− w) · ~nhough for Hough normals(5)
The weight w is determined by experiments and in this paper0.7 is used.
III. EXPERIMENTS
Experiments are performed on synthetic images to evaluatealgorithm performance and on real field images to validatethe result.
A. Hardware setup
The camera used for the experiment is a ProsilicaGC2450C, which provides images with 2540x2040 pixels.It is connected using Gigabit Ethernet, and lens is of c-mount type. Two different lenses are used, one fisheyeand one catadioptric. The fisheye lens is a FE185C057HAfrom fujinon, and the catadioptric is a PAL-S25G3817-27Cfrom American Accurate Components, Inc. The camera ismounted on a stand with the camera pointing downwards.The camera and the two lenses are calibrated using multiplechessboard images, and the calibration data is stored for usein the generation of synthetic images.
B. Synthetic images
The synthetic images are generated by projecting rowsonto the sphere. The rows are specified by the distancebetween rows and the distance between each individual plant.The position of a plant is then projected onto the sensor planeby using real calibration data from different lenses. A plantis build of a model with four leaves. All plants in the imageare similar, i.e no scaling is applied. The camera position isdefined by setting the yaw, pitch and roll relative the planewith the rows. From these two orthogonal vanishing pointis calculated, one along the rows, and one perpendicular tothe rows. Hence a true value for the vanishing point exists,which will be used as reference to the estimated vanishingpoint. Further, background noise is added to the image and acircular mask is applied. Fig. 4 shows two synthetic imageswith random yaw and pitch. One use calibration data from afisheye camera and the other from a camera with catadioptriclens. The level of the background noise is 0.2 and 0.5.
There are three types of noise that can be added to theimages. First, there is background noise as mentioned above,which is created by adding salt and pepper noise followedby Gaussian filtering. Second there is a noise on the positionof each individual plant. It is introduced as an error in plantdistance or row distance. The latter affects how straight therows are. The last type of noise is created by adding plantsat random position. This corresponds to weed in agriculturalimages.
(a) Fisheye lens (b) Catadioptric lens
Fig. 4: Synthetic images with different camera tilt andbackground noise level.
(a) Fisheye lens (b) Catadioptric lens
Fig. 5: Images of row structure on real field.
C. Evaluation on real field images
The methods are validated by using images from a realfield. Typical images are shown in Fig. 5. The green partsof the image is used. The main difference from the syntheticimages is that these images have visible areas above thefield. This area has to be removed before the analysis, whichis done by tracing the boundary of the regions and thencalculate a mask from the result.
IV. RESULTS
A. Evaluation on synthetic images
Rows are detected in each image using both Edge andHough method. Fig. 6 and Fig. 7 show the result for a fisheyeimage and an omnidirectional image. Rows detected by theEdge method are marked in blue and by Hough method inred. It can be seen that the Hough method captures the centerof the row while the edge method detects the two edge linesof the row, i.e. row boundary.
First test evaluates the accuracy of estimated vanishingpoint by calculating the angle between true value and theestimated. This test is done on 100 randomly generatedimages, where yaw, pitch and lens type are varied. Henceboth on fisheye and catadioptric images are used. The onlynoise added is background noise with density 0.1. The plantdistance is low so almost solid lines are generated. The resultis shown in Table I. It shows that the mean error is very
4985
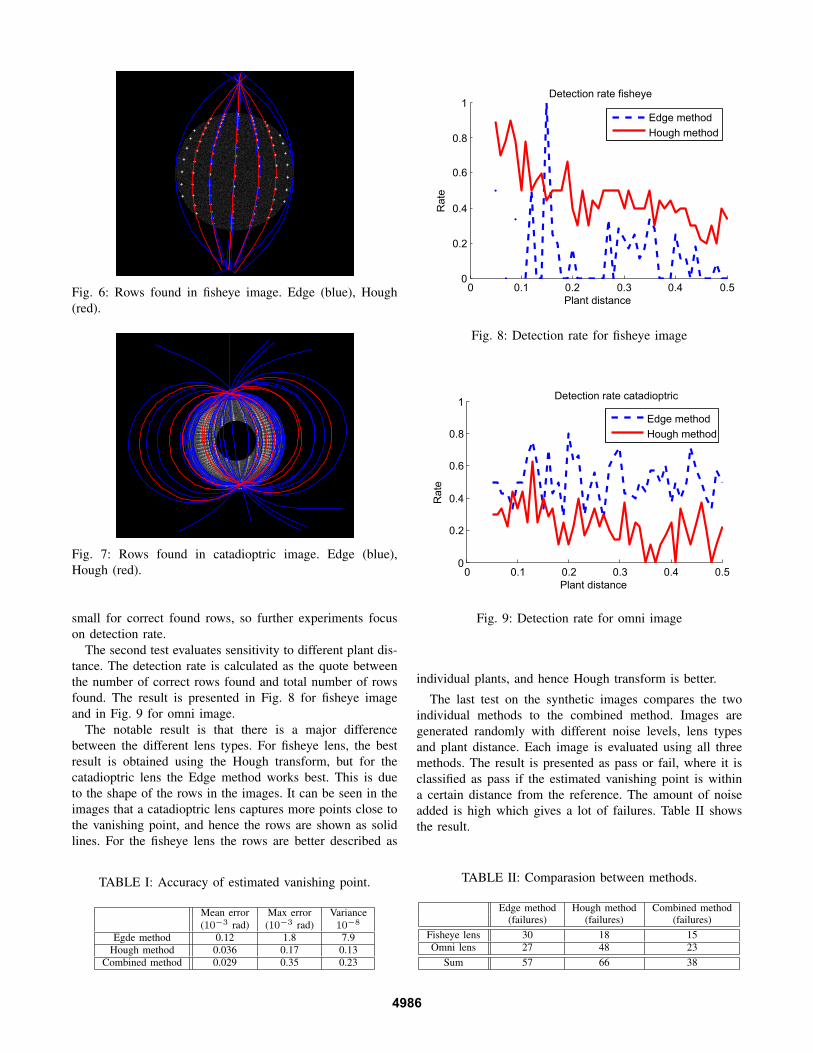
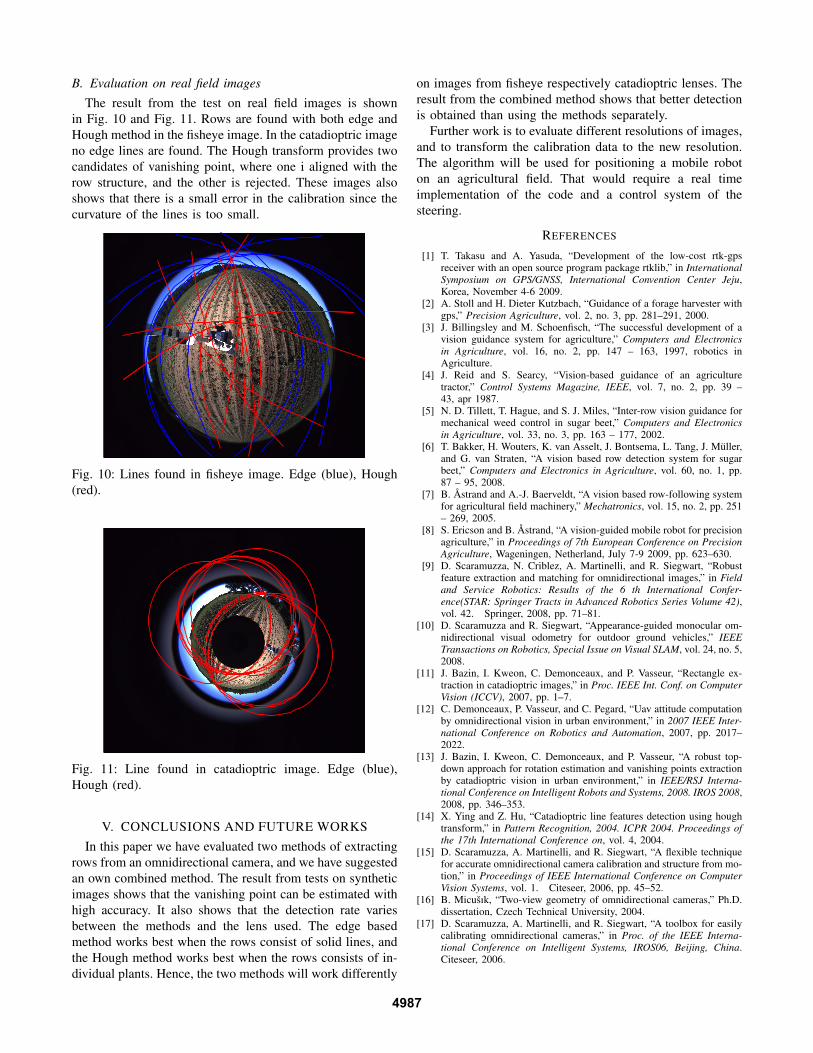
Fig. 6: Rows found in fisheye image. Edge (blue), Hough(red).
Fig. 7: Rows found in catadioptric image. Edge (blue),Hough (red).
small for correct found rows, so further experiments focuson detection rate.
The second test evaluates sensitivity to different plant dis-tance. The detection rate is calculated as the quote betweenthe number of correct rows found and total number of rowsfound. The result is presented in Fig. 8 for fisheye imageand in Fig. 9 for omni image.
The notable result is that there is a major differencebetween the different lens types. For fisheye lens, the bestresult is obtained using the Hough transform, but for thecatadioptric lens the Edge method works best. This is dueto the shape of the rows in the images. It can be seen in theimages that a catadioptric lens captures more points close tothe vanishing point, and hence the rows are shown as solidlines. For the fisheye lens the rows are better described as
TABLE I: Accuracy of estimated vanishing point.
Mean error Max error Variance(10−3 rad) (10−3 rad) 10−8
Egde method 0.12 1.8 7.9Hough method 0.036 0.17 0.13
Combined method 0.029 0.35 0.23
0 0.1 0.2 0.3 0.4 0.50
0.2
0.4
0.6
0.8
1Detection rate fisheye
Plant distance
Rat
e
Edge methodHough method
Fig. 8: Detection rate for fisheye image
0 0.1 0.2 0.3 0.4 0.50
0.2
0.4
0.6
0.8
1 Detection rate catadioptric
Plant distance
Rat
e
Edge methodHough method
Fig. 9: Detection rate for omni image
individual plants, and hence Hough transform is better.
The last test on the synthetic images compares the twoindividual methods to the combined method. Images aregenerated randomly with different noise levels, lens typesand plant distance. Each image is evaluated using all threemethods. The result is presented as pass or fail, where it isclassified as pass if the estimated vanishing point is withina certain distance from the reference. The amount of noiseadded is high which gives a lot of failures. Table II showsthe result.
TABLE II: Comparasion between methods.
Edge method Hough method Combined method(failures) (failures) (failures)
Fisheye lens 30 18 15Omni lens 27 48 23
Sum 57 66 38
4986
B. Evaluation on real field imagesThe result from the test on real field images is shown
in Fig. 10 and Fig. 11. Rows are found with both edge andHough method in the fisheye image. In the catadioptric imageno edge lines are found. The Hough transform provides twocandidates of vanishing point, where one i aligned with therow structure, and the other is rejected. These images alsoshows that there is a small error in the calibration since thecurvature of the lines is too small.
Fig. 10: Lines found in fisheye image. Edge (blue), Hough(red).
Fig. 11: Line found in catadioptric image. Edge (blue),Hough (red).
V. CONCLUSIONS AND FUTURE WORKSIn this paper we have evaluated two methods of extracting
rows from an omnidirectional camera, and we have suggestedan own combined method. The result from tests on syntheticimages shows that the vanishing point can be estimated withhigh accuracy. It also shows that the detection rate variesbetween the methods and the lens used. The edge basedmethod works best when the rows consist of solid lines, andthe Hough method works best when the rows consists of in-dividual plants. Hence, the two methods will work differently
on images from fisheye respectively catadioptric lenses. Theresult from the combined method shows that better detectionis obtained than using the methods separately.
Further work is to evaluate different resolutions of images,and to transform the calibration data to the new resolution.The algorithm will be used for positioning a mobile roboton an agricultural field. That would require a real timeimplementation of the code and a control system of thesteering.
REFERENCES
[1] T. Takasu and A. Yasuda, “Development of the low-cost rtk-gpsreceiver with an open source program package rtklib,” in InternationalSymposium on GPS/GNSS, International Convention Center Jeju,Korea, November 4-6 2009.
[2] A. Stoll and H. Dieter Kutzbach, “Guidance of a forage harvester withgps,” Precision Agriculture, vol. 2, no. 3, pp. 281–291, 2000.
[3] J. Billingsley and M. Schoenfisch, “The successful development of avision guidance system for agriculture,” Computers and Electronicsin Agriculture, vol. 16, no. 2, pp. 147 – 163, 1997, robotics inAgriculture.
[4] J. Reid and S. Searcy, “Vision-based guidance of an agriculturetractor,” Control Systems Magazine, IEEE, vol. 7, no. 2, pp. 39 –43, apr 1987.
[5] N. D. Tillett, T. Hague, and S. J. Miles, “Inter-row vision guidance formechanical weed control in sugar beet,” Computers and Electronicsin Agriculture, vol. 33, no. 3, pp. 163 – 177, 2002.
[6] T. Bakker, H. Wouters, K. van Asselt, J. Bontsema, L. Tang, J. Muller,and G. van Straten, “A vision based row detection system for sugarbeet,” Computers and Electronics in Agriculture, vol. 60, no. 1, pp.87 – 95, 2008.
[7] B. Astrand and A.-J. Baerveldt, “A vision based row-following systemfor agricultural field machinery,” Mechatronics, vol. 15, no. 2, pp. 251– 269, 2005.
[8] S. Ericson and B. Astrand, “A vision-guided mobile robot for precisionagriculture,” in Proceedings of 7th European Conference on PrecisionAgriculture, Wageningen, Netherland, July 7-9 2009, pp. 623–630.
[9] D. Scaramuzza, N. Criblez, A. Martinelli, and R. Siegwart, “Robustfeature extraction and matching for omnidirectional images,” in Fieldand Service Robotics: Results of the 6 th International Confer-ence(STAR: Springer Tracts in Advanced Robotics Series Volume 42),vol. 42. Springer, 2008, pp. 71–81.
[10] D. Scaramuzza and R. Siegwart, “Appearance-guided monocular om-nidirectional visual odometry for outdoor ground vehicles,” IEEETransactions on Robotics, Special Issue on Visual SLAM, vol. 24, no. 5,2008.
[11] J. Bazin, I. Kweon, C. Demonceaux, and P. Vasseur, “Rectangle ex-traction in catadioptric images,” in Proc. IEEE Int. Conf. on ComputerVision (ICCV), 2007, pp. 1–7.
[12] C. Demonceaux, P. Vasseur, and C. Pegard, “Uav attitude computationby omnidirectional vision in urban environment,” in 2007 IEEE Inter-national Conference on Robotics and Automation, 2007, pp. 2017–2022.
[13] J. Bazin, I. Kweon, C. Demonceaux, and P. Vasseur, “A robust top-down approach for rotation estimation and vanishing points extractionby catadioptric vision in urban environment,” in IEEE/RSJ Interna-tional Conference on Intelligent Robots and Systems, 2008. IROS 2008,2008, pp. 346–353.
[14] X. Ying and Z. Hu, “Catadioptric line features detection using houghtransform,” in Pattern Recognition, 2004. ICPR 2004. Proceedings ofthe 17th International Conference on, vol. 4, 2004.
[15] D. Scaramuzza, A. Martinelli, and R. Siegwart, “A flexible techniquefor accurate omnidirectional camera calibration and structure from mo-tion,” in Proceedings of IEEE International Conference on ComputerVision Systems, vol. 1. Citeseer, 2006, pp. 45–52.
[16] B. Micusık, “Two-view geometry of omnidirectional cameras,” Ph.D.dissertation, Czech Technical University, 2004.
[17] D. Scaramuzza, A. Martinelli, and R. Siegwart, “A toolbox for easilycalibrating omnidirectional cameras,” in Proc. of the IEEE Interna-tional Conference on Intelligent Systems, IROS06, Beijing, China.Citeseer, 2006.
4987