root system plasticity to drought influences grain yield in bread wheat
TRANSCRIPT

Root system plasticity to drought influences grain yieldin bread wheat
Bahman Ehdaie • Andrew P. Layne •
J. Giles Waines
Received: 22 June 2011 / Accepted: 11 November 2011 / Published online: 22 November 2011
� Springer Science+Business Media B.V. 2011
Abstract Crop productivity in semiarid regions is
mainly limited by water availability. Root character-
istics and plasticity to drought may reduce the negative
impact of drought on crop yield. A set of near-isogenic
wheat-rye translocation lines was used to test the
hypothesis that root system plasticity to drought
influences grain yield in wheat. Bread wheat
Pavon 76 and 1RS translocation lines, namely Pavon
1RS.1AL, Pavon 1RS.1BL, and Pavon 1RS.1DL were
evaluated for root allocation and plasticity in sand-
tube experiments under well-watered and droughted
conditions across 2 years using factorial treatments in
a randomized complete block design with four repli-
cates. The 1RS translocation lines had greater root
biomass per plant ranging from 7.37 to 8.6 compared
to 5.81 g for Pavon 76. Only Pavon 76 showed a
positive response to drought by producing more
shallow roots (roots developed between 0 and
30 cm) and deep roots (roots developed below
30 cm) in droughted conditions than in well-watered
conditions. Thus at drought intensity of 19% (mea-
sured as overall reduction in grain yield), grain yield in
Pavon 76 was reduced only by 11% compared to the
other genotypes with yield reductions ranging from
18 to 24%. However, at drought intensity of 36%,
grain yield in Pavon 76 showed maximum reduction
indicating that greater root production under drought
is advantageous only when plant-available water is
enough to support grain production. Grain yield was
positively correlated with shallow and deep root
weight and root biomass under terminal drought.
Correlation coefficients between root system compo-
nents (shallow and deep root weight and root biomass)
and phenological periods were not significant. Our
study indicated that genes influencing adaptive phe-
notypic plasticity of the root system to drought in
Pavon 76 are located on chromosome 1BS.
Keywords Biomass allocation � Deep roots �Drought intensity � Shallow roots � Triticum aestivum
Introduction
A major function of the root system in common wheat
(Triticum aestivum L.) is to absorb water and nutrients
for plant growth, development, and ultimately pro-
duction of grains.
Water deficit significantly decreases plant growth;
which results in reduced shoot biomass including grain
yield (Gallagher et al. 1975; Ehdaie et al. 2008) and
root biomass (Ehdaie et al. 1991). However, there is
significant variation in response of wheat genotypes to
drought in regard to root production (Ehdaie et al.
2001). This phenotypic plasticity to drought depends
on the genotype, year to year variation in growing
conditions, drought timing and intensity (Ehdaie et al.
B. Ehdaie (&) � A. P. Layne � J. G. Waines
Department of Botany and Plant Sciences,
University of California, Riverside, CA 92521-0124, USA
e-mail: [email protected]
123
Euphytica (2012) 186:219–232
DOI 10.1007/s10681-011-0585-9

1991, 2001; Kano et al. 2011). Whereas the response
of root biomass to drought might be negative, or
positive, or no response, shoot biomass including grain
yield is consistently reduced under drought.
Blum (2009) concluded that enhancement of bio-
mass production and grain yield stability under
drought stress can be achieved primarily by maximiz-
ing soil water capture while diverting the largest part
of the available soil moisture toward stomatal tran-
spiration during the grain filling period. He defined
this system as crop ‘effective water use’. An effective
means of achieving satisfactory grain production
under terminal drought stress is soil moisture capture
by a vigorous deep root system where deep soil
moisture is available (Kirkegaard et al. 2007; Blum
2009). Therefore, the root system and its response to
drought play an important role in crop adaptation to
drought conditions. A shallow root system might also
be important to capture soil moisture during occa-
sional spring rainstorms when only the top layers of
soil are replenished with moisture during grain filling.
Based on a modeling technique, it was estimated that
each additional millimeter of water extracted by the
root system during grain filling may generate an extra
55 kg ha-1 of grain in Australian dry environments
(Manschadi et al. 2006). Furthermore, a vigorous
shallow root system is required for absorption of
nutrients that are mostly concentrated in the upper
layers of soil (Manske and Vlek 2002).
Increases in root system traits in response to
drought stress were first reported in plants by
Muller-Thurgau (1875); and subsequently there were
specific reports for maize (Zea mays L.) (Sharp and
Davies 1979), wheat (Sharma and Ghildyal 1977), and
soybean (Glycine max L.) (Huck et al. 1983).
Relatively little effort has been devoted to the
selection of desirable root traits in cereal breeding
programs, mainly due to lack of appropriate screening
techniques to evaluate large segregating populations
or recombinant inbred lines (RILs) and also due to
significant genotype 9 environment interactions
referred to as phenotypic plasticity of the root system
(Bradshaw 1965; Schlichting 1986). Phenotypic plas-
ticity is the ability of an individual organism to alter its
physiology/morphology to changes in environmental
conditions (Schlichting 1986). Of particular impor-
tance is adaptive phenotypic plasticity that increases
fitness or survival or reduces the negative impacts of
stressful environments (Nicotra and Davidson 2010).
Consistent and desirable genotype 9 environment
interactions or adaptive phenotypic plasticity such as
production of a relatively larger root system in
response to drought might be desirable to stabilize
grain production or reduce the negative impacts of
drought on grain yield by capturing more soil water.
Genetic variation for root characteristics such as
root biomass at the seedling stage and at maturity, and
for the pattern of root growth, development and length
was reported (Hurd 1964). The number of seminal
roots and nodal roots varied among bread cultivars
(Derera et al. 1969). Significant differences were
found in growth angle and number of seminal roots
among 27 Australian wheat genotypes (Manschadi
et al. 2008) and in assimilate partitioning to deep roots
among eight near ‘isomorphic’ wheat genotypes
(Lopes and Reynolds 2010).
Interest in phenotypic plasticity of wheat roots was
increased by results of field experiments in 1999 and
2000 with Pavon 76 and its 1RS translocation lines
(Ehdaie et al. 2003). In these experiments in well-
watered treatments, grain yield of the 1RS transloca-
tion lines was significantly greater than Pavon 76, as
was expected from glasshouse studies. In the drough-
ted treatments, however, grain yield of Pavon 76 was
similar to that of the translocation lines. A possible
explanation of these results is that Pavon 76 may show
adaptive root plasticity to drought.
Literature on the wheat root system and how it
responds to different environmental conditions is
scarce. We used a set of near-isogenic wheat-rye
translocation lines to: (1) characterize root allocation
and vertical distribution under well-watered and
droughted conditions, (2) determine the response of
the root system to terminal drought as related to
stability of grain yield, and (3) quantify the correlation
between root components and shoot traits including
grain yield and its components.
Materials and methods
Genotypes and growth conditions
The selection of wheat genotypes for this study was
based on results from pot and field studies conducted
by Ehdaie et al. (2003) in 1997 and 1998, where root
biomass in spring bread wheat ‘Pavon 76’ and its 1RS
translocation lines, namely Pavon 1RS.1AL, Pavon
220 Euphytica (2012) 186:219–232
123

1RS.1BL, and Pavon 1RS.1DL, was evaluated under
well-watered and droughted pot conditions. Root
biomass, averaged across the irrigation treatments
and years, was 2.7 g plant-1 for Pavon 76, 3.5 g
plant-1 for Pavon 1RS.1AL, 3.0 g plant-1 for Pavon
1RS.1BL, and 3.4 g plant-1 for Pavon 1RS.1DL. The
development of these genotypes (Lukaszewski 2000)
and their use as a genetic model to study the wheat root
system was reported in detail (Ehdaie et al. 2003).
Briefly, the same short arm of chromosome 1 of rye
(Secale cereale L.) (1RS) was translocated for the
short arm of chromosomes 1A, 1B, and 1D in the
genetic background of common wheat Pavon 76
to develop a set of near-isogenic lines as described
above. Since these genotypes were planted in pots
17.0 cm deep in 1997 and 1998, it was not possible
to determine whether increased root biomass in the
translocation lines was due to increases in shallow
roots or deep roots or in both components of root
biomass. Furthermore, it was not possible to determine
the response of these two components of the root
system to terminal drought.
These four near-isogenic genotypes were grown in
sand-tube experiments in 2008 and 2009 under well-
watered and terminal drought in an unheated, air cooled
glasshouse at the University of California, Riverside,
using factorial treatments in a randomized complete
block design with four replicates (blocks). Grains of
similar size from each genotype were treated in 3.5%
Clorox for 5 min then washed by tap water for 10 min
before being soaked in water for 24 h. Grains were
germinated in petri dishes on 17 January 2008 and on 15
January 2009. Seven days later, seedlings with similar
growth were transplanted in polyethylene tubing bags
sleeved into polyvinyl chloride (PVC) tubes, 80 cm
long and 10 cm in diameter. Two drainage holes made at
the bottom of each bag were covered with a filter paper
before being filled with 8.5 kg of dry silica sand #30
with 24% field capacity (w/w). Each bag was brought to
water-holding capacity for 3 consecutive days for sand
settlement using half-strength Hoagland solution pro-
vided in the glasshouse and also before transplanting a
seedling into it. Throughout the study, tubes were
irrigated with the same solution.
In the well-watered treatment, each tube was
brought to water-holding capacity daily by adding
irrigation solution until water started draining from the
bottom of the tube. The amount of irrigation solution
added was recorded. Irrigation was continued until
plants reached physiological maturity when the main
tiller was devoid of green color. Each plant in the well-
watered treatment received, on average, 46.35 and
49.45 l of irrigation solution in 2008 and 2009,
respectively. In the drought treatment, drought was
initiated at the booting stage by providing 50 and 60%
of the irrigation solution given to the tubes under well-
watered treatment in 2008 and 2009, respectively,
until plants reached physiological maturity. The
average irrigation solution received by each plant
under drought was 22.35 l in 2008 and 30.15 l in 2009.
Drought intensity (DI) in each year was calculated as
follows:
DI ¼ 1��YD
�YW
;
where, �YD and �YW are overall genotypic mean grain
yield under drought and well-watered treatments,
respectively.
Average monthly maximum, minimum and average
air temperature during the growing season in 2008
ranged from 16.6 to 24.9�C, from 5.6 to 11.9�C, and
from 10.9 to 18.0�C. In the same season average air
relative humidity varied from 41 to 52%. In 2009, these
averages ranged from 18.1 to 27.7�C, from 6.6 to
14.5�C, and from 11.9 to 19.7�C, respectively, and air
relative humidity ranged from 36 to 58%. Thus, plants
in 2009 were exposed to relatively higher temperatures
and used more water than in 2008. Maximum photon-
flux density during the day was*l900 mol m-2 s-1 in
2008 and 2009.
Phenological periods such as days from germina-
tion to booting, to heading, to anthesis, and to maturity
were recorded. At maturity, morphological traits such
as plant height, number of tillers and spikes were
recorded for each plant. The phenological period and
morphological traits were measured to determine if
these traits have significant confounding effects on
root system components. Shoots were excised at the
root/shoot interface. Shoot materials were dried in a
forced-air drier for 24 h at 80�C and weighed. Shoot
biomass (including grains), grain yield, number of
grains and grain weight were measured for each plant.
Root system collection and measurements
To retrieve intact root systems, each polyethylene bag
was pulled from the PVC tube and was laid on a screen
frame in a tub half-filled with water and cut length
Euphytica (2012) 186:219–232 221
123

wise without damaging the roots; then the plastic sheet
was pulled out leaving the sand core with root system
on the screen frame. The frame was moved gently in
the tub to separate sand from the roots. The intact root
system was floated to the water surface and washed
carefully by hand to remove attached sand without
damaging the root system. The washed roots were laid
out on a plastic surface; the maximum root length was
measured and then the whole root system was cut into
two parts, the roots developed between 0 and 30 cm
(shallow roots) and those below 30 cm (deep roots).
Shallow roots included the seminal, nodal and lateral
roots. Deep roots comprised mainly the seminal roots
and their laterals. Roots were dried in a forced-air drier
for 24 h at 80�C. Shallow and deep root weight and
total root biomass (sum of shallow and deep root
weights) were determined. Plant biomass was also
calculated (sum of root biomass and shoot biomass).
The ratio of shoot biomass to root biomass and the
percent of root biomass to plant biomass (sum of root
and shoot dry weight) were calculated.
Statistical analysis
Analysis of variance (ANOVA) was performed for
each character measured or calculated for each year
(Steel et al. 1997). A combined ANOVA was also
performed across years, treating irrigation and geno-
type as fixed effects and year, replication, and their
interactions with irrigation and genotype as random
effects. Tests of significance of fixed effects were
accomplished using appropriate mean squares (Steel
et al. 1997). Mean values were compared using the
F-protected LSD test. Associations between charac-
ters were examined by correlation analysis.
Results
General
The combined ANOVA (not shown) indicated significant
main effects of years on all 18 characters measured or
calculated, except number of days from grain germina-
tion to heading, number of tillers per plant, and number of
grains per plant. The main effect of irrigation was not
significant for days from grain germination to booting, to
heading, and to anthesis, plant height, shallow root
weight, and maximum root length. Year 9 irrigation
interaction was significant only for five characters. The
genotype main effect was significant for all the characters
examined or calculated, except for maximum root length
and grain weight. The genotype 9 year interactions and
genotype 9 irrigation interactions were significant
for ten and nine characters, respectively. Genotype 9
year 9 irrigation interactions were only significant for
deep root weight and number of grains per plant. When
the three-way interaction was examined for number of
grains per plant, in both years the genotypes examined
produced greater numbers of grains per plant under well-
watered than droughted conditions, except for Pavon
1RS.1BL that had similar numbers of grains per plant in
both irrigation regimes in 2008. The responses of deep
root weight to irrigation treatments among the genotypes
were different in 2008 and in 2009. In the first season,
Pavon 1RS.1AL and Pavon 1RS.1DL had less deep root
weight under droughted than well-watered conditions,
whereas deep root weights for Pavon 1RS.1BL were
similar, and Pavon 76 had a greater deep root weight
under droughted than well-watered conditions. In the
second year, all genotypes had lower deep root weights
under droughted than well-watered conditions, except
Pavon 76 that showed a greater deep root weight under
droughted than under well-watered conditions. Since
both two-way interactions involving genotypes were
significant for most characters, only means either aver-
aged across irrigation treatments or across years are
reported.
Phenological and morphological characters
2008 Season
Although there were significant differences among
the genotypes for the phenological periods, the ranges
were relatively small (Table 1). All the genotypes
examined reached days to anthesis within 3 days and
days to maturity within a week. Plant heights varied
from 95 cm (Pavon 1RS.1DL) to 99 cm (Pavon 76),
numbers of tillers per plant ranged from 14
(Pavon 1RS.1BL and Pavon 1RS.1DL) to 16 (Pavon
1RS.1AL), and numbers of spikes per pant ranged
from 12 (1RS.1BL) to 14 (Pavon 1RS.1AL).
2009 Season
Genotypic variation for plant phenology was rela-
tively small; genotypes reached anthesis and maturity
222 Euphytica (2012) 186:219–232
123

within 3 days (Table 1). Plant heights, numbers of
tillers and spikes per plant varied from 93 cm (Pavon
1RS.1DL) to 94 cm (Pavon 76 and Pavon 1RS.1BL),
from 13 (Pavon 1RS.1BL) to 15 tillers (Pavon
1RS.1AL), and from 11 (Pavon 1RS.1BL) to 14 spikes
(Pavon 1RS.1AL), respectively (Table 1).
The genotypic means for days to anthesis, plant
height and number of spikes per plant were greater in
2008 than in 2009; however, the differences were
small (Table 1).
Well-watered treatment
Relatively, small variation was found among Pavon 76
and its 1RS translocation lines for phenological
periods and plant height. Numbers of days to maturity
were reached within a week and plant heights varied
from 94 (Pavon 1RS.1DL) to 98 cm (Pavon 76).
However, Pavon 1RS.1AL produced more tillers and
spikes per plant than other genotypes which had
similar values for the two traits (Table 2).
Droughted treatment
Similar trends for days to booting, heading, and
maturity were found among the genotypes under
droughted conditions (Table 2). Plant height in Pavon
1RS.1AL (91 cm) was significantly shorter than those
of Pavon 1RS.1BL (97 cm) and Pavon 76 (95 cm).
However, variation for plant height was relatively
small among Pavon 76 and its 1RS translocation lines
and there were no significant differences among the
lines for numbers of tillers and spikes under droughted
conditions (Table 2).
The genotypic means for days to booting, heading,
and anthesis were similar under both irrigation
regimes, whereas days to maturity were longer and
number of tillers and spikes per plant were greater
under well-watered than under droughted conditions
(Table 2).
Root and shoot biomass and their components
2008 Season
Root biomass in Pavon 76 was smaller than that for
Pavon 1RS.1AL, Pavon 1RS.1BL and Pavon 1RS.1DL
(Table 3). All genotypes had similar shallow root
weights ranging from 3.72 g plant-1 for Pavon 76 to
4.25 g plant-1 for Pavon 1RS.1AL. Deep root weight
was significantly lower in Pavon 76 compared to other
genotypes which showed similar deep root weights
ranging from 1.67 g plant-1 for Pavon 1RS.1BL to
1.90 g plant-1 for Pavon 1RS.1DL (Table 3).
Shoot biomass and plant biomass of Pavon
1RS.1AL were greater than those of other genotypes
(Table 3). Shoot biomass ranged from 59.8 g plant-1
for Pavon 1RS.1AL to 51.0 g plant-1 for Pavon 76.
Table 1 Mean values for number of days from seed germination to booting (DB), heading (DH), anthesis (DA), and maturity (DM),
plant height (PH), number of tillers (NT) and spikes (NS) per plant for Pavon 76 and its 1RS translocation lines in 2008 and 2009
Genotype DB (d)a DH (d) DA (d) DM (d) PH (cm) NT (n) NS (n)
2008
Pavon 76 62 a 68 a 76 ab 134 a 99 a 15 ab 13 a
1RS.1AL 61 a 66 b 74 b 127 c 96 a 16 a 14 a
1RS.1BL 61 a 65 b 77 a 130 ab 98 a 14 b 12 a
1RS.1DL 62 a 69 a 76 ab 133 a 95 a 14 b 13 a
Mean 61 A 68 A 76 A 131 A 97 A 14 A 13 A
2009
Pavon 76 61 a 66 b 73 b 131 a 94 a 14 a 12 b
1RS.1AL 62 a 69 a 74 ab 128 a 90 b 15 a 14 a
1RS.1BL 61 a 68 a 76 a 129 a 94 a 13 a 11 b
1RS.1DL 61 a 68 a 75 ab 131 a 93 ab 14 a 12 ab
Mean 61 A 67 A 74 B 130 A 93 B 14 A 12 B
In each column, means followed by the same uppercase letters are not significantly different (P \ 0.05)a For each section, means in a column followed by the same lowercase letter are not significantly different (P \ 0.05)
Euphytica (2012) 186:219–232 223
123

The same genotypes had maximum and minimum
plant biomasses, respectively (Table 3). Numbers of
grains per plant were highest for Pavon 1RS.1AL and
lowest in Pavon 1RS.1DL. Grain weights for 1RS
translocation lines were similar, but significantly
greater than that of Pavon 76. Pavon 1RS.1AL and
Pavon 76 produced the highest and lowest grain yields,
respectively (Table 3). The ratio of shoot to root
biomass in Pavon 76 was greater than those for the
1RS translocation lines. Root biomass as a percentage
of plant biomass was similar among the genotypes
(Table 3).
Table 2 Mean values for numbers of days from seed germi-
nation to booting (DB), heading (DH), anthesis (DA), and
maturity (DM), plant height (PH), number of tillers (NT) and
spikes (NS) per plant for Pavon 76 and its 1RS translocation
lines under well-watered and droughted treatments
Genotype DB (d)a DH (d) DA (d) DM (d) PH (cm) NT (n) NS (n)
Well-watered
Pavon 76 61 a 67 b 74 a 136 a 98 a 15 b 13 b
1RS.1AL 61 a 68 ab 74 a 129 b 95 ab 18 a 16 a
1RS.1BL 61 a 67 b 75 a 132 ab 95 ab 15 b 13 b
1RS.1DL 62 a 69 a 75 a 136 a 94 b 15 b 14 b
Mean 61 A 67 A 74 A 133 A 95 A 15 A 14 A
Droughted
Pavon 76 62 a 68 ab 74 b 128 b 95 a 14 a 11 a
1RS.1AL 62 a 67 b 74 b 127 b 91 b 13 a 11 a
1RS.1BL 61 a 67 b 77 a 128 b 97 a 12 a 11 a
1RS.1DL 62 a 69 a 76 ab 127 b 94 ab 12 a 11 a
Mean 62 A 67 A 75 A 127 B 94 A 13 B 11 B
In each column, means followed by the same uppercase letters are not significantly different (P \ 0.05)a For each section, means in a column followed by the same lowercase letters are not significantly different (P \ 0.05)
Table 3 Mean values for root and shoot traits including the ratio of shoot to root biomass (S/R) and root biomass as a percentage of
plant biomass (R/P) for Pavon 76 and its 1RS translocation lines in 2008 and 2009
Genotype Root
biomass
(g)a
Shallow
root (g)
Deep
root (g)
Shoot
biomass
(g)
Plant
biomass
(g)
No. of
grains (n)
Grain
weight
(mg)
Grain
yield (g)
S/R R/P
(%)
2008
Pavon 76 4.71 b 3.72 a 1.00 b 51.0 b 55.7 b 567 bc 41.8 b 24.3 c 10.8 a 8.5 a
1RS.1AL 6.00 a 4.25 a 1.75 a 59.8 a 65.8 a 648 a 48.5 a 31.7 a 10.0 ab 9.1 a
1RS.1BL 5.91 a 4.24 a 1.67 a 53.3 b 59.2 b 623 ab 46.1 a 28.6 b 9.0 b 10.0 a
1RS.1DL 5.86 a 3.96 a 1.90 a 53.2 b 59.1 b 565 c 48.4 a 27.4 b 9.1 b 9.9 a
Mean 5.62 B 4.04 B 1.57 B 54.3 B 59.9 B 601 A 46.2 B 27.9 B 9.9 A 9.5 B
2009
Pavon 76 6.90 c 4.07 b 2.83 b 56.5 a 63.4 b 587 b 52.3 a 31.1 b 8.2 a 10.9 c
1RS.1AL 11.23 a 6.86 a 4.37 a 61.3 a 72.6 a 688 a 49.5 a 33.8 a 5.5 b 15.5 a
1RS.1BL 9.08 b 6.12 a 2.96 b 58.8 a 67.9 ab 623 b 50.9 a 31.8 ab 6.5 b 13.4 b
1RS.1DL 8.88 b 6.11 a 2.76 b 56.9 a 65.8 b 573 b 51.8 a 29.6 ab 6.4 b 13.5 b
Mean 9.02 A 5.79 A 3.23 A 58.4 A 67.4 A 618 A 51.1 B 31.5 A 6.8 B 13.4 A
In each column, means followed by the same uppercase letters are not significantly different (P \ 0.05)a For each section, means in a column followed by the same lowercase letters are not significantly different (P \ 0.05)
224 Euphytica (2012) 186:219–232
123

2009 Season
There were significant differences among the geno-
types for root biomass, shallow root weight, and deep
root weight in 2009. Pavon 1RS.1AL had the highest
root biomass and shallow root weight, whereas Pavon
76 had the lowest values for these traits (Table 3).
Also, Pavon 1RS.1AL had a significantly greater deep
root weight than the other genotypes which had similar
deep root weights.
The highest shoot biomass and plant biomass
belonged to Pavon 1RS.1AL and the lowest belonged
to Pavon 76. Numbers of grains per plant were
significantly higher in Pavon 1RS.1AL than in other
genotypes, which had similar values (Table 3). Grain
weights were similar. The maximum and minimum
grain yields belonged to Pavon 1RS.1AL and Pavon
76, respectively (Table 3). Pavon 76 had a higher ratio
of shoot to root biomass than the translocation lines. In
contrast, root biomass as a percentage of plant biomass
was greater in 1RS translocation lines than in Pavon 76
(Table 3).
The genotypic means for root biomass, shallow
root weight, deep root weight, shoot biomass, plant
biomass, grain weight, grain yield, and the ratio of root
biomass as percentages of plant biomass were smaller
in 2008 than in 2009 (Table 3). Genotypic means for
number of grains per plant were similar in 2008 and
2009, whereas the ratio of shoot to root biomass was
greater in 2008 than in 2009 (Table 3).
Well-watered treatment
Root biomass of Pavon 76 under well-watered condi-
tions was significantly lower than those for Pavon
1RS.1AL, Pavon 1RS.1DL, and Pavon 1RS.1BL
(Table 4). This was due to relatively smaller shallow
and deep root weight in Pavon 76. Among the 1RS
translocation lines Pavon 1RS.1AL had the highest
deep root weight. Shoot biomass and plant biomass of
Pavon 1RS.1AL were greater than for other genotypes
which had similar values (Table 4).
Numbers of grains per plant were significantly
greater in Pavon 1RS.1AL compared to other geno-
types which had similar values (Table 4). All geno-
types had similar grain weights under well-watered
conditions. Grain yield of Pavon 1RS.1AL (38.2 g
plant-1) was significantly greater than those of other
genotypes ranging from 32.7 g plant-1 (Pavon 76) to
34.2 g plant-1 (Pavon 1RS.1BL) (Table 4). The ratio
of shoot to root biomass was significantly lower for
1RS translocation lines compared to those of Pavon
76. In contrast, root biomass as a percentage of plant
biomass was greater in 1RS translocation lines than in
Pavon 76 (Table 4).
Table 4 Mean values for root and shoot traits including the ratios of shoot to root biomass (S/R) and root biomass as a percentages
of plant biomass (R/P) for Pavon 76 and its 1RS translocation lines under well-watered and droughted conditions
Genotype Root
biomass
(g)a
Shallow
root (g)
Deep
root (g)
Shoot
biomass
(g)
Plant
biomass
(g)
No. of
grains
(n)
Grain
weight
(mg)
Grain
yield (g)
S/R R/P
(%)
Well-watered
Pavon 76 5.28 c 3.68 b 1.60 c 59.5 b 64.7 b 661 b 49.6 a 32.7 b 11.3 a 8 b
1RS.1AL 8.49 a 5.26 a 3.23 a 68.3 a 76.8 a 772 a 49.6 a 38.2 a 8.0 b 11 a
1RS.1BL 7.74 a 5.23 a 2.50 b 60.9 b 68.7 b 650 b 52.8 a 34.2 b 7.9 b 11 a
1RS.1DL 8.37 a 5.36 a 3.00 ab 61.2 b 69.6 b 621 b 52.8 a 32.8 b 7.3 b 12 a
Mean 7.47 A 4.89 A 2.58 A 62.5 A 69.9 A 676 A 51.2 A 34.5 A 9.1 A 11 B
Droughted
Pavon 76 6.34 b 4.11 c 2.23 b 48.0 a 54.3 b 493 c 44.5 b 22.7 c 7.6 a 12 b
1RS.1AL 8.74 a 5.85 a 2.89 a 52.9 a 61.6 a 564 ab 48.4 a 27.3 a 6.0 a 14 a
1RS.1BL 7.26 b 5.13 ab 2.12 b 51.2 a 58.4 ab 596 a 44.2 b 26.0 ab 7.0 a 12 b
1RS.1DL 6.37 b 4.71 bc 1.66 b 48.9 a 55.3 b 516 bc 47.3 ab 24.2 bc 7.7 a 12 b
Mean 7.18 A 4.95 A 2.23 B 50.2 B 57.4 B 542 B 46.1 B 25.0 B 7.5 B 12 A
In each column, means followed by the same uppercase letters are not significantly different (P \ 0.05)a For each section, means in a column followed by the same lowercase letters are not significantly different (P \ 0.05)
Euphytica (2012) 186:219–232 225
123

Droughted treatment
Root biomass of Pavon 1RS.1AL (8.74 g plant-1) was
significantly greater than those of other genotypes
which varied from 6.34 g plant-1 (Pavon 76) to 7.26 g
plant-1 (Pavon 1RS.1BL) (Table 4). Pavon 1RS.1AL
also had the highest shallow root weight followed
by Pavon 1RS.1BL, Pavon 1RS.1DL, and Pavon 76.
Deep root weight of Pavon 1RS.1AL (2.89 g plant-1)
was significantly greater than those of other genotypes
which had similar deep root weights ranging from
1.66 g plant-1 (Pavon 1RS.1DL) to 2.23 g plant-1
(Pavon 76) (Table 4).
Pavon 76 and its 1RS translocation lines produced
similar shoot biomasses under drought conditions
(Table 4). Plant biomass of Pavon 1RS.1AL was
greater than those for other genotypes which had
similar values for this trait.
The highest numbers of grains per plant belonged to
Pavon 1RS.1BL and Pavon 1RS.1AL, and the lowest
to Pavon 76 (Table 4). Maximum grain weight and
grain yield under drought belonged to Pavon 1RS.1AL,
whereas Pavon 1RS.1BL and Pavon 76, respectively,
had the lowest values for grain weight and for grain
yield. Ratios of shoot biomass to root biomass were
similar among the genotypes under drought conditions.
Root biomass as a percentage of plant biomass was
highest in Pavon 1RS.1AL compared to other genotypes
which had similar values for this trait (Table 4).
The genotypic means for deep root weight, shoot
biomass, plant biomass, number of grains, grain weight,
grain yield, and ratio of shoot biomass to root biomass
were lower under droughted than under well-watered
conditions. In contrast, the genotypic mean for root
biomass as a percentage of plant biomass was greater
under droughted than under well-watered conditions.
Root biomass and shallow root weight had similar
genotypic means under both irrigation regimes (Table 4).
Response of root biomass and grain yield
to drought
The plasticity response of root biomass and its
components to drought stress in terms of percent
increase or decrease in mean values and their effects
on genotypic performance for grain yield in 2008 are
shown in Fig. 1. Shallow root weight showed a
negative response to drought in Pavon 1RS.1BL
(-14%) and Pavon 1RS.1DL (-12%), whereas a
positive response was shown by Pavon 76 (10%) and
Pavon 1RS.1AL (4%) by producing greater shallow
root weight under drought compared to well-watered
treatment (Fig. 1a). Under droughted conditions in
2008, absolute shallow root weight in Pavon 1RS.1AL
was the highest (4.3 g plant-1), whereas that for Pavon
1RS.1DL was the lowest (3.7 g plant-1).
Deep root weight also showed a mixed response to
drought in 2008 (Fig. 1b). Pavon 1RS.1AL and Pavon
1RS.1DL showed a negative response to drought with
regard to deep root weight (-18 and -8%, respec-
tively), whereas Pavon 76 and Pavon 1RS.1BL had
positive responses (42 and 11%, respectively). Under
droughted conditions in 2008, Pavon 1RS.1DL and
Pavon 76 had the highest and lowest absolute deep
root weights, respectively (Fig. 1b).
The response of root biomass to drought in 2008 was
negative for Pavon 1RS.1AL (-3%), Pavon 1RS.1BL
(-7%), and Pavon 1RS.1DL (-11%). Only Pavon 76
showed a positive response to drought (14%) with
regard to root biomass (Fig. 1c). This was due to a
positive response in both shallow and deep root weight
in this genotype. The highest absolute root biomass
under droughted conditions of 2008 belonged to Pavon
1RS.1AL and the lowest to Pavon 76 (Fig. 1c).
Grain yield under drought in 2008 was significantly
decreased for all genotypes compared to well-watered
conditions (Fig. 1d). Pavon 76 showed the maximum
reduction in grain yield (50%) under drought in
2008, whereas reductions for other genotypes varied
between 31 and 33% (Fig. 1d).
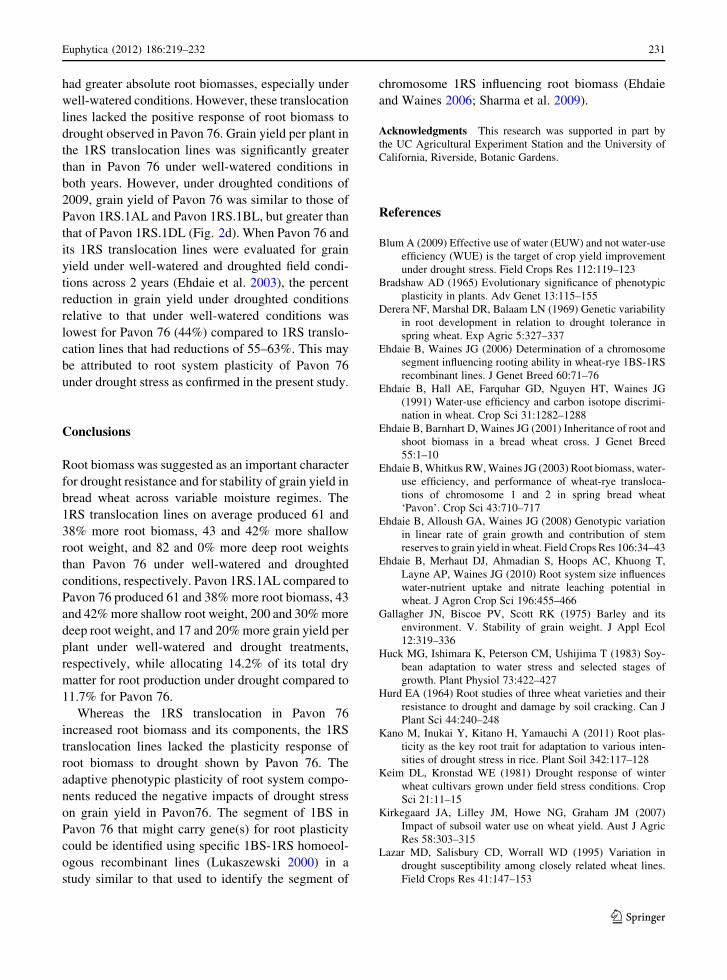
In 2009, Pavon 1RS.1AL, Pavon 1RS.1BL, and
Pavon 76 responded positively to drought with regard to
shallow root weight (16, 7, and 16%, respectively),
whereas Pavon 1RS.1DL responded negatively (-12%)
(Fig. 2a). Drought in 2009 reduced deep root weight in
Pavon 1RS.1AL by 7%, in 1RS.1BL by 27%, and in
Pavon 1RS.1DL by 51% (Fig. 2b). Only Pavon 76 had a
positive response (39%) to drought for deep root weight
(Fig. 2b). Therefore, root biomass in 2009 showed a
mixed response between genotypes; Pavon 1RS.1AL
and Pavon 76 had positive responses (6 and 25%,
respectively), whereas Pavon 1RS.1BL and Pavon
1RS.1DL had negative responses (-5 and -31%,
respectively) (Fig. 2c). Pavon 76 again showed a
positive response to drought in 2009 for both shallow
and deep root weight. In well-watered conditions
of 2009, absolute shallow root weight, deep root
weight, and root biomass was the lowest in Pavon 76
226 Euphytica (2012) 186:219–232
123

(Fig. 2a–c). However, under droughted conditions of
2009, absolute deep root weight in Pavon 76 was greater
than that in Pavon 1RS.1DL and Pavon 1RS.1BL, and
absolute root biomass in Pavon 76 was greater than that
in Pavon 1RS.1DL (Fig. 2b, c).
Genotypic grain yield under drought in 2009
was again reduced significantly (Fig. 2d). The lowest
reduction in grain yield due to drought in 2009
belonged to Pavon 76 (11%) and the highest reduction
belonged to Pavon 1RS.1AL (24%).
Correlations between root and shoot traits
Root biomass and its components were not correlated
with phenological periods. Simple correlation coeffi-
cients between root and shoot traits are presented in
Table 5. Shallow root weight had a negative correlation
with plant height under both irrigation regimes and
with number of tillers per plant only under droughted
conditions. Shallow root weight had a positive correla-
tion with shoot biomass under both irrigation regimes
and with grain weight and grain yield only under
droughted conditions (Table 5).
Deep root weight was negatively correlated with
plant height under both irrigation regimes and with
number of tillers per plant under droughted conditions
(Table 5). There was a positive correlation between
shoot biomass and deep root weight under well-watered
and droughted conditions. Grain weight and grain yield
were correlated with deep root weight only under
droughted conditions. The direction and magnitude of
the correlations between root biomass and shoot traits
were similar to those between shallow and deep root
weight and shoot traits (Table 5).
a
Genotype
1RS.1AL 1RS.1BL 1RS.1DL Pavon 76
Shal
low
roo
t w
eigh
t (g
pla
nt-1
)
0
1
2
3
4
5Well-wateredDroughted
Genotype
1RS.1AL 1RS.1BL 1RS.1DL Pavon 76
Dee
p ro
ot w
eigh
t (g
pla
nt-1
)
0.0
0.5
1.0
1.5
2.0
2.5Well-wateredDroughted
b
Genotype
1RS.1AL 1RS.1BL 1RS.1DL Pavon 76
Tot
al r
oot
biom
ass
(g p
lant
-1)
0
2
4
6
8Well-wateredDroughted
c
Genotype
1RS.1AL 1RS.1BL 1RS.1DL Pavon 76
Gra
in y
ield
(g
plan
t-1 )
0
10
20
30
40 Well-wateredDroughted
d
Fig. 1 Responses of shallow root weight (a), deep root weight (b), root biomass (c), and grain yield (d) to drought intensity of 36%
based on grain yield performance for Pavon 76 and its 1RS translocation lines in 2008. Bar represent S.E. of a mean (n = 4)
Euphytica (2012) 186:219–232 227
123

Grain yield per plant was positively correlated
with number of grains per plant under well-watered
(r = 0.85, P \ 0.01) and droughted (r = 0.50,
P \ 0.01) conditions, whereas it was correlated with
grain weight only under droughted conditions
(r = 0.78, P \ 0.01). Number of grains per plant and
Genotype
1RS.1AL 1RS.1BL 1RS.1DL Pavon 76
Shal
low
roo
t w
eigh
t (g
pla
nt-1
)
0
2
4
6
8Well-wateredDroughted
a
Genotype
1RS.1AL 1RS.1BL 1RS.1DL Pavon 76
Dee
p ro
ot w
eigh
t (g
pla
nt-1
)
0
1
2
3
4
5Well-wateredDroughted
b
Genotype1RS.1AL 1RS.1BL 1RS.1DL Pavon 76
Tot
al r
oot
biom
ass
(g p
lant
-1)
0
2
4
6
8
10
12 Well-wateredDroughted
c d
Genotype1RS.1AL 1RS.1BL 1RS.1DL Pavon 76
Gra
in y
ield
(g
plan
t-1 )
0
10
20
30
40
50
Well-wateredDroughted
Fig. 2 Responses of shallow root weight (a), deep root weight (b), root biomass (c), and grain yield (d) to drought intensity of 19%
based on grain yield performance for Pavon 76 and its 1RS translocation lines in 2009. Bar represent S.E. of a mean (n = 4)
Table 5 Simple correlation coefficients between root traits and shoot traits for spring bread wheat Pavon 76 and its 1RS translo-
cation lines (n = 8) under well-watered and droughted treatments
Treatment Plant height Number of tillers Shoot
biomass
Number of grains Grain weight Grain yield
Shallow root wt. Well-watered -0.89** 0.41 0.62? 0.39 -0.24 0.39
Droughted -0.64? -0.74* 0.59? 0.11 0.70* 0.65*
Deep root wt. Well-watered -0.94** 0.49 0.71* 0.48 -0.32 0.46
Droughted -0.80* -0.55? 0.68* 0.31 0.64? 0.74*
Root biomass Well-watered -0.93** 0.46 0.68* 0.45 -0.29 0.43
Droughted -0.78* -0.72* 0.69* 0.22 0.74* 0.76*
?, *, ** Significant at P = 0.10, 0.05, and 0.01, respectively
228 Euphytica (2012) 186:219–232
123

grain weight were negatively correlated only under
well-watered conditions (r = -0.60, P \ 0.01).
Discussion
Most recent root studies have characterized the wheat
root system during seedling stage and that may not
reflect the adult plant root system. Furthermore, in
those studies it was not possible to examine the
relationship between root and shoot traits, including
grain yield, the most important trait. In this study, we
measured the root system and its components at plant
maturity and examined their relationship with shoot
traits under both well-watered and droughted condi-
tions across 2 years.
A relatively small variation was observed for the
phenological periods and morphological traits such as
plant height and numbers of tillers and spikes per plant
among Pavon 76 and its 1RS translocations in both
years. The same traits also showed a small variation
under well-watered and droughted conditions, except
for number of tillers and spikes per plant which were
higher under well-watered conditions. These result
indicated that the phenological periods, and to some
extent the morphological traits measured were not
confounded with the genotypic differences observed
for root traits nor for grain yield and its components.
These observations concur with results reported earlier
for the same genotypes (Ehdaie et al. 2003, 2010).
Lopes and Reynolds (2010) reported a set of near
isomorphic lines in bread wheat that differed signif-
icantly for root biomass at depth with only small
variation in days to flowering and plant height.
In the 2008 season, plants on average received less
irrigation solution than in the 2009 season. As a result,
the drought intensity was more severe in 2008 season
(36%) than in 2009 season (19%). Therefore, the
genotypic means for root traits, shoot and plant biomass,
grain yield, and grain weight were less in 2008 than in
2009. These observations are in agreement with results
reported by Ehdaie et al. (2003) when Pavon 76 and its
1RS translocation lines were grown in pot experiments.
Only the ratio of shoot to root biomass was greater in
2008 than in 2009; with a reverse trend for root biomass
as a percentage of plant biomass.
Root biomass, averaged across water regimes
and years, was 5.8 g plant-1 for Pavon 76, 8.6 g
plant-1 for Pavon 1RS.1AL, 7.5 g plant-1 for Pavon
1RS.1BL, and 7.4 g plant-1 for Pavon 1RS.1DL. The
greater root biomass per plant observed in 1RS
translocation lines compared to Pavon 76 under
well-watered conditions was due to both greater
shallow and deep root weights in 1RS translocation
lines (Table 4). Under droughted conditions, the
greater root biomass in the 1RS translocation lines
compared to Pavon 76 was mainly due to shallow root
weight. The greater deep root weights for the 1RS
translocation lines compared to Pavon 76 under well-
watered conditions could be due to more root branch-
ing (lateral roots) and/or more roots reaching deep soil
(Ehdaie and Waines 2006).
Drought, on average, reduced root biomass by 4%,
shoot biomass by 20%, plant biomass by 11%, and
grain yield by 28% (Table 4). Similar trends were
reported for the repressing effects of drought on plant
growth and grain yield (Gallagher et al. 1975; Keim
and Kronstad 1981; Ehdaie et al. 1991; Lazar et al.
1995; Van den Boogaard et al. 1996; Van Ginkel et al.
1998), on grain growth and development (Ehdaie et al.
2008), and on root and shoot traits (Ehdaie et al. 2003).
In this study, reduction in shoot biomass including
grain yield was more than the reduction in root
biomass indicating that under drought stress relatively
more assimilates are transported to roots for develop-
ment of a more vigorous root system required for
water and nutrient uptake. As a result, the ratio of
shoot to root biomass decreases under drought com-
pared to that under well-watered conditions (Table 4).
However, there was significant genotypic variation for
this trait. The 1RS translocation lines allocated more
assimilates for root production than Pavon 76 under
well-watered conditions. Under droughted conditions,
Pavon 1RS.1AL allocated the highest percentage of
plant total dry matter (14.2%) for root production
while producing the highest grain yield under both
irrigation regimes (Table 4). These results support our
earlier conclusion (Ehdaie et al. 2010) that it is
possible to enhance the root system in wheat without
compromising grain yield production or harvest index.
Genotypes responded differently to drought with
regard to production of root biomass. Three types
of response were observed; a positive response
by increasing root biomass, a negative response by
decreasing root biomass, or no response as shown by
no significant change in root biomass under droughted
conditions (Figs. 1c, 2c). Root biomass, averaged
across years, showed a positive response to drought in
Euphytica (2012) 186:219–232 229
123

Pavon 76, a negative response in Pavon 1RS.1DL and
no significant responses in Pavon 1RS.1AL and Pavon
1RS.1BL. The positive response of root biomass to
drought in Pavon 76 was due to increases in both
shallow and deep root weights in both years (Figs. 1
and 2).
The plasticity response of root biomass to drought
could be considered adaptive (Nicotra and Davidson
2010) if a positive response results in maintaining
grain yield or in reducing the negative impact of
drought on grain production. In 2008, the positive
response of root biomass to drought in Pavon 76
(Fig. 1c) was associated with the highest reduction in
grain yield under drought (Fig. 1d). Under severe
drought intensity of 36% in 2008, Pavon 76 used a
large portion of plant-available water to increase its
root biomass, thus leaving a small portion during grain
filling to support or stabilize grain yield. In 2009, the
drought intensity was 19% and the increase in root
biomass observed in Pavon 76 under drought did not
deplete the plant-available water, therefore it could
use the moisture available to stabilize its grain yield by
showing the least reduction (11%) under drought
compared to other genotypes (Fig. 2d). These
observations indicate that adaptive plasticity in root
biomass by responding positively to drought depends
on soil moisture status during the grain filling period.
If there is moisture available in the subsoil during
grain filling, the positive response of root biomass to
drought might result in stabilizing grain yield by
reducing the negative impact of drought; otherwise
increased root biomass under drought might result in
severely depressed grain production. Kano et al.
(2011) studied the phenotypic plasticity of total root
length in rice (Oryza sativa L.) seedlings under
different drought intensities. Only under mild drought
intensity was total root length increased significantly
and the greater plant shoot dry matter observed was
attributed to greater total root length.
The phenological periods measured had no signif-
icant correlations with root biomass and its compo-
nents. Root biomass and its components consistently
showed a negative correlation with plant height under
both irrigation regimes (Table 5). The root traits also
consistently showed negative correlations with num-
bers of tillers per plant under droughted conditions.
These negative correlations between root traits and
shoot traits could be due to competition for assimilates
between these traits for growth and development.
Based on field evaluations, Richards et al. (2007)
recommended wheat cultivars with restricted numbers
of tillers per plant for cultivation in drought-prone
environments. In this study, shallow root weight
showed a non significant positive correlation with
number of tillers per plant under well-watered condi-
tions. Under droughted conditions, there was a signif-
icant negative correlation between these two traits
(Table 5). It seems that the nodal root weight in Pavon
76 and its 1RS translocation lines constitute a small
portion of the shallow root weight and extensive
branching (lateral roots) of the seminal roots make up
a major portion of shallow root weight under drough-
ted conditions.
Root biomass in wheat is a function of number,
length, and diameter of seminal and nodal roots and of
lateral roots. Therefore, increased root biomass might be
due to increases in one or of combinations of these root
system components. Since the numbers of seminal roots
were already established prior to initiation of drought
treatment at the early boot stage and the maximum root
lengths were the same under both irrigation regimes, the
greater shallow and deep roots observed in Pavon 76 in
response to drought might be mainly due to develop-
ment of more lateral roots than other root traits. Lateral
roots were reported to be the main root system
component for water and nutrient absorption (McCully
and Canny 1988) as they increase root surface area and
contact with soil media. Morita and Okuda (1994)
reported that soil moisture stress first promoted the
production of first-order lateral roots per seminal root in
a winter wheat and then increased the average length of
lateral roots. Root biomass and its components had
positive correlations with shoot biomass under both
well-watered and droughted conditions and with grain
weight and grain yield under droughted conditions.
This study indicated that a positive response of the
root system to drought is advantageous provided there
is enough moisture in the soil during grain filling to
support grain growth and to stabilize grain yield. If the
positive response to drought is mainly due to increased
numbers and/or lengths of lateral roots either in
shallow or deep roots, uptake of soil resources will be
greatly elevated despite the existence of hardpans in
deep soil layers. Therefore, a positive response of the
root system to drought might be beneficial in envi-
ronments with soils lacking or having hardpans in
the deep layers. The results indicated that the 1RS
translocations in the genetic background of Pavon 76
230 Euphytica (2012) 186:219–232
123
had greater absolute root biomasses, especially under
well-watered conditions. However, these translocation
lines lacked the positive response of root biomass to
drought observed in Pavon 76. Grain yield per plant in
the 1RS translocation lines was significantly greater
than in Pavon 76 under well-watered conditions in
both years. However, under droughted conditions of
2009, grain yield of Pavon 76 was similar to those of
Pavon 1RS.1AL and Pavon 1RS.1BL, but greater than
that of Pavon 1RS.1DL (Fig. 2d). When Pavon 76 and
its 1RS translocation lines were evaluated for grain
yield under well-watered and droughted field condi-
tions across 2 years (Ehdaie et al. 2003), the percent
reduction in grain yield under droughted conditions
relative to that under well-watered conditions was
lowest for Pavon 76 (44%) compared to 1RS translo-
cation lines that had reductions of 55–63%. This may
be attributed to root system plasticity of Pavon 76
under drought stress as confirmed in the present study.
Conclusions
Root biomass was suggested as an important character
for drought resistance and for stability of grain yield in
bread wheat across variable moisture regimes. The
1RS translocation lines on average produced 61 and
38% more root biomass, 43 and 42% more shallow
root weight, and 82 and 0% more deep root weights
than Pavon 76 under well-watered and droughted
conditions, respectively. Pavon 1RS.1AL compared to
Pavon 76 produced 61 and 38% more root biomass, 43
and 42% more shallow root weight, 200 and 30% more
deep root weight, and 17 and 20% more grain yield per
plant under well-watered and drought treatments,
respectively, while allocating 14.2% of its total dry
matter for root production under drought compared to
11.7% for Pavon 76.
Whereas the 1RS translocation in Pavon 76
increased root biomass and its components, the 1RS
translocation lines lacked the plasticity response of
root biomass to drought shown by Pavon 76. The
adaptive phenotypic plasticity of root system compo-
nents reduced the negative impacts of drought stress
on grain yield in Pavon76. The segment of 1BS in
Pavon 76 that might carry gene(s) for root plasticity
could be identified using specific 1BS-1RS homoeol-
ogous recombinant lines (Lukaszewski 2000) in a
study similar to that used to identify the segment of
chromosome 1RS influencing root biomass (Ehdaie
and Waines 2006; Sharma et al. 2009).
Acknowledgments This research was supported in part by
the UC Agricultural Experiment Station and the University of
California, Riverside, Botanic Gardens.
References
Blum A (2009) Effective use of water (EUW) and not water-use
efficiency (WUE) is the target of crop yield improvement
under drought stress. Field Crops Res 112:119–123
Bradshaw AD (1965) Evolutionary significance of phenotypic
plasticity in plants. Adv Genet 13:115–155
Derera NF, Marshal DR, Balaam LN (1969) Genetic variability
in root development in relation to drought tolerance in
spring wheat. Exp Agric 5:327–337
Ehdaie B, Waines JG (2006) Determination of a chromosome
segment influencing rooting ability in wheat-rye 1BS-1RS
recombinant lines. J Genet Breed 60:71–76
Ehdaie B, Hall AE, Farquhar GD, Nguyen HT, Waines JG
(1991) Water-use efficiency and carbon isotope discrimi-
nation in wheat. Crop Sci 31:1282–1288
Ehdaie B, Barnhart D, Waines JG (2001) Inheritance of root and
shoot biomass in a bread wheat cross. J Genet Breed
55:1–10
Ehdaie B, Whitkus RW, Waines JG (2003) Root biomass, water-
use efficiency, and performance of wheat-rye transloca-
tions of chromosome 1 and 2 in spring bread wheat
‘Pavon’. Crop Sci 43:710–717
Ehdaie B, Alloush GA, Waines JG (2008) Genotypic variation
in linear rate of grain growth and contribution of stem
reserves to grain yield in wheat. Field Crops Res 106:34–43
Ehdaie B, Merhaut DJ, Ahmadian S, Hoops AC, Khuong T,
Layne AP, Waines JG (2010) Root system size influences
water-nutrient uptake and nitrate leaching potential in
wheat. J Agron Crop Sci 196:455–466
Gallagher JN, Biscoe PV, Scott RK (1975) Barley and its
environment. V. Stability of grain weight. J Appl Ecol
12:319–336
Huck MG, Ishimara K, Peterson CM, Ushijima T (1983) Soy-
bean adaptation to water stress and selected stages of
growth. Plant Physiol 73:422–427
Hurd EA (1964) Root studies of three wheat varieties and their
resistance to drought and damage by soil cracking. Can J
Plant Sci 44:240–248
Kano M, Inukai Y, Kitano H, Yamauchi A (2011) Root plas-
ticity as the key root trait for adaptation to various inten-
sities of drought stress in rice. Plant Soil 342:117–128
Keim DL, Kronstad WE (1981) Drought response of winter
wheat cultivars grown under field stress conditions. Crop
Sci 21:11–15
Kirkegaard JA, Lilley JM, Howe NG, Graham JM (2007)
Impact of subsoil water use on wheat yield. Aust J Agric
Res 58:303–315
Lazar MD, Salisbury CD, Worrall WD (1995) Variation in
drought susceptibility among closely related wheat lines.
Field Crops Res 41:147–153
Euphytica (2012) 186:219–232 231
123

Lopes MS, Reynolds MP (2010) Partitioning of assimilates to
deeper roots is associated with cooler canopies and
increased yield under drought in wheat. Funct Plant Biol
37:147–156
Lukaszewski AJ (2000) Manipulation of the 1RS.1BL translo-
cation in wheat by induced homoeologous recombination.
Crop Sci 40:216–225
Manschadi AM, Christopher J, de Voil P, Hammer GH (2006)
The role of root architectural traits in adaptation of wheat to
water-limited environment. Funct Plant Biol 33:823–837
Manschadi AM, Hammer GL, Christopher JT, de Voil P (2008)
Genotypic variation in seedling root architectural traits and
implications for drought adaptation in wheat (Triticumaestivum L.). Plant Soil 303:115–129
Manske GGB, Vlek PLG (2002) Root architecture—wheat as a
model plant. In: Waisel Y et al (eds) Plant roots: the hidden
half. Marcel Dekker, New York, pp 249–259
McCully ME, Canny MJ (1988) Pathway and processes of water
and nutrient movement in roots. Plant Soil 111:159–170
Morita S, Okuda H (1994) Effects of soil condition on root
development of wheat seedling with special reference to
branching of primary seminal root. Jpn J Crop Sci
63:418–422
Muller-Thurgau H (1875) Uber wachstum und bedeutung der
Wurzeln. Landwirtschraftliche Jahrbucher 4:999
Nicotra AB, Davidson A (2010) Adaptive phenotypic plasticity
and plant water use. Funct Plant Biol 37:117–127
Richards RA, Watt M, Rebetzke GJ (2007) Physiological traits
and cereal germplasm for sustainable agricultural systems.
Euphytica 154:409–425
Schlichting CD (1986) The evolution of phenotypic plasticity in
plants. Ann Rev Ecol Syst 17:667–693
Sharma RB, Ghildyal BP (1977) Soil water-root relations in
wheat: water extraction rates of wheat roots that developed
under dry and moist conditions. Agron J 69:231–233
Sharma S, Bhat PR, Ehdaie B, Close TJ, Lukaszewski AJ,
Waines JG (2009) Integrated genetic map and genetic
analysis of a region associated with root traits on the short
arm of rye chromosome 1 in bread wheat. Theor Appl
Genet 119:783–793
Sharp RE, Davies WJ (1979) Solute regulation and growth by
roots and shoots of water-stressed maize plants. Planta
147:43–49
Steel RGD, Torrie JH, Dickey DA (1997) Principles and pro-
cedures of statistics: a biometrical approach, 3rd edn.
McGraw-Hill, New York
Van den Boogaard R, Veneklaas EJ, Peacock JM, Lambers H
(1996) Yield and water use of wheat (Triticum aestivum) in
a Mediterranean environment: cultivars differences and
sowing density effects. Plant Soil 181:251–262
Van Ginkel M, Calhoun DS, Gebeyehu G, Miranda A, Tian-you C,
Pargas Lara R, Trethowan RM, Sayre K, Crossa J, Rajaram S
(1998) Plant traits related to yield of wheat in early, late, or
continuous drought conditions. Euphytica 100:109–121
232 Euphytica (2012) 186:219–232
123