role of the cluster analysis in logfacies and depositional ... · interactive petrophysics software...
TRANSCRIPT
International Journal of Engineering Research & Science (IJOER) ISSN: [2395-6992] [Vol-3, Issue-12, December- 2017]
Page | 35
Role of the Cluster Analysis in Logfacies and Depositional
Environments Recognition from Well Log Response for Mishrif
Formation in Southeast Iraq. Jawad K. Radhy AlBahadily
1*, Medhat E. Nasser
2
Department of geology, college of science, Baghdad University, Baghdad, Iraq.
*Corresponding Author Email: [email protected]
Abstract—The recognition of depositional environments from well logs is based on the principle that well log responses are
related to changes in thickness, texture, grain size and lithology along the well path. The variations in sedimentary rock
response are due to reservoir heterogeneity. A similar set of log responses that characterizes a specific rock type and allows
it to be distinguished from others, have defined an electrofacies.Cluster analysis includes a broad suite of techniques
designed to find groups of similar items within a data set. Partitioning methods divide the data set into a number of groups
predesignated by the user. Hierarchical cluster methods produce a hierarchy of clusters from small clusters of very similar
items to large clusters that include more dissimilar items. Hierarchical methods usually produce a graphical output known
as a dendrogram or tree that shows this hierarchical clustering structure.The method has tested on a 398.5 m thick interval
of Carbonate deposits in a vertical well from Amara field, located in southeast Iraq. Modal data have collected from both
core and cutting samples. Cluster analysis and electrofacies classification have performed using advance interpretation in
Interactive Petrophysics software version 3.6.Carbonate microfacies and marine depositional environments studied for
Mishrif Formation depended on the available thin sections though they were not enough to cover all the depositional
environments of Mishrif Formation. Therefore, previous studies and well logs were also depended in this study.Correlation
of determined logfacies with those defined from cores and cuttings is fundamental to check the reliability of used methods
and to define a meaningful cut off level for wells from which no cores or cuttings are available.
Keywords—Cluster analysis, Mishrif Formation, Logfacies, Well Logs response,
I. INTRODUCTION
The identification of depositional environments from well logs is based on the principle that well log responses are related to
changes in thickness, texture, grain size and lithology along the well path. The variations in sedimentary rock response are
due to reservoir heterogeneity. The description of a rock in terms of its type, origin, and depositional environment is called a
Lithofacies description. This can be done by direct observation of the rocks or inferred from analysis and interpretation of
well log data. Determining lithofacies from well logs requires calibration to known rocks (cores, samples, or outcrops).
Understanding the rock facies is the only way to reconstruct the paleogeography of a lithologic succession, rock sequence,
which in turn provides clues as to a potential reservoir quality and lateral extent(Crain, d. g.).
The purpose of well log cluster analysis is to look for similarities/dissimilarities between data points in the multivariate space
of logs, in order to group them into classes also called electrofacies(Euzen, T., Delamaide, E., Feuchtwanger, T., &
Kingsmith, 2010).
An electrofacies is defined by a similar set of log responses that characterizes a specific rock type and allows it to be
distinguished from others. Electrofacies are obviously influenced by geology and often can be assigned to one or another
lithofacies, although the correspondence is not universal(Doveton, J. H., & Prensky, 1992).
International Journal of Engineering Research & Science (IJOER) ISSN: [2395-6992] [Vol-3, Issue-12, December- 2017]
Page | 36
Electrofacies are primarily observational in nature, and the classification procedure is based on three steps: principal
component analysis, cluster analysis, and discriminant analysis. Principal component analysis is used to summarize the data
and to reduce the dimensionality of the data without any significant loss of information. The method displays the data as a
function of new variables, called principal components, that are simple linear combination of the well logs. The aim of
cluster analysis is to classify the well-log data into groups that are internally homogeneous and externally isolated on the
basis of a measure of similarity or dissimilarity between the groups. The clusters define electrofacies on the basis of the
unique characteristics of well-log measurements reflecting minerals and lithofacies within the loggedinterval.Once the
electrofacies are identified, we can use discrimi- nant analysis, a multivariate statistical method, to assign an individual
observation vector to one of the predefined electrofacies(Perez, Datta-Gupta, & Mishra, 2005).
II. BASIC CONCEPTS
Cluster analysis includes a broad suite of techniques designed to find groups of similar items within a data set. Partitioning
methods divide the data set into a number of groups predesignated by the user. Hierarchical cluster methods produce a
hierarchy of clusters from small clusters of very similar items to large clusters that include more dissimilar items.
Hierarchical methods usually produce a graphical output known as a dendrogram or tree that shows this hierarchical
clustering structure. Some hierarchical methods are divisive, that progressively divide the one large cluster comprising all of
the data into two smaller clusters and repeat this process until all clusters have been divided. Other hierarchical methods are
agglomerative and work in the opposite direction by first finding the clusters of the most similar items and progressively
adding less similar items until all items have been included into a single large cluster. Cluster analysis can be run in the Q-
mode in which clusters of samples are sought or in the R-mode, where clusters of variables are desired(Holland, 2006)
The clusters define electrofacies on the basis of the unique characteristics of well-log measurements reflecting minerals and
lithofacies within the logged interval. Once the electrofacies are identified, we can use discriminant analysis, a multivariate
statistical method, to assign an individual observation vector to one of the predefined electrofacies (Perez et al., 2005).
The Cluster Analysis module uses standard statistical routines to allow the user to cluster the data into groups to produce an
electrical facies log. This log can then hopefully be used to correlate to geological facies (Senergy, 2008) .
III. METHODOLOGY
The theory of Cluster Analysis is the module works in two stages. Firstly, the data is divided up into manageable data
clusters. The number of clusters should be enough to cover all the different data ranges seen on the logs.15 to 20 clusters
would appear to be a reasonable number for most data sets. The second step, which is more manual, is to take these 15 to 20
clusters and group them into a manageable number of geological facies. This may involve reducing the data to 4 to 5 clusters.
(Stage-1 K-mean clustering) The first stage of Facies Clustering uses the K-mean statistical technique to cluster the data into
a known entered number of clusters. For this to work an initial guess has to be made of the mean value of each cluster for
each input log. The initial guess can affect the results and in order to get good results the initial values should cover the total
range of the logs. K-mean clustering works by assigning each input data point to a cluster. The routine tries to minimize the
within-cluster sums of squares of the difference between the data point and the cluster mean value. The routine works by
calculating the sum of the squares difference for a data point and each cluster mean and assigning the point to the cluster with
the minimum difference. Once all the data points have been assigned to the clusters the new mean values in each cluster are
calculated. Using the new mean values the routines starts again re-assigning the data to the clusters. This loop continues until
the mean values do not change between loops. These then become the results.
International Journal of Engineering Research & Science (IJOER) ISSN: [2395-6992] [Vol-3, Issue-12, December- 2017]
Page | 37
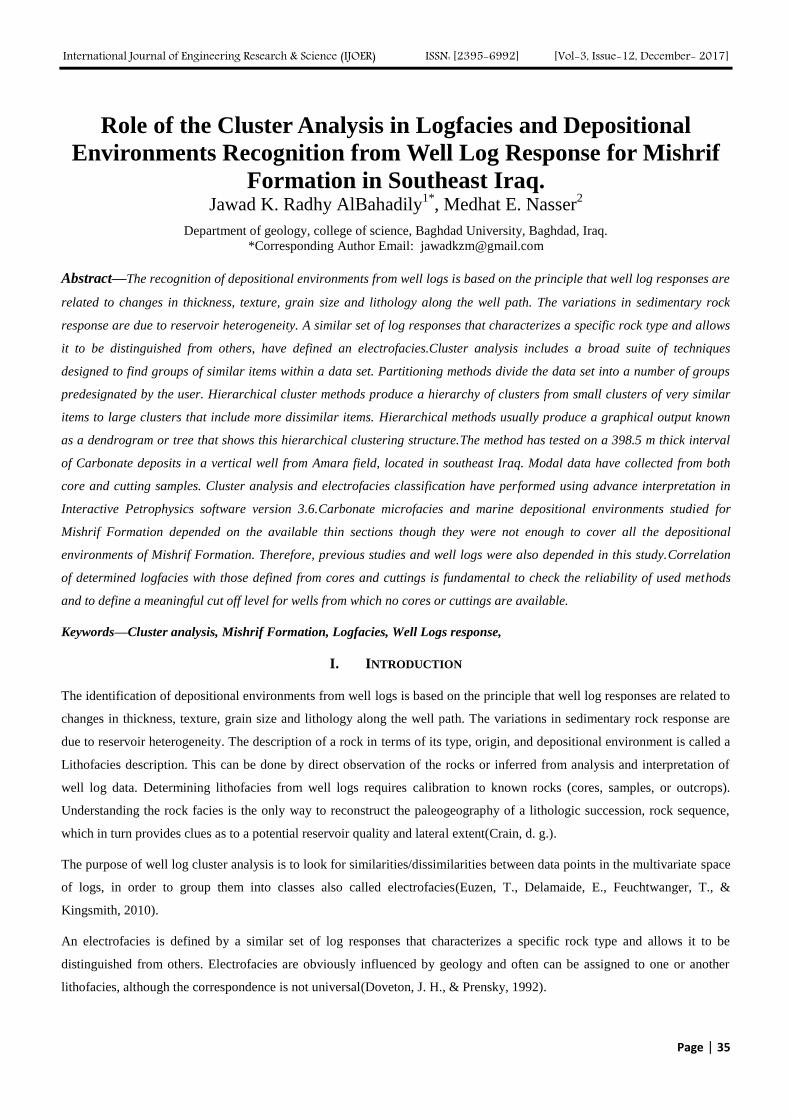
FIGURE (1): CROSSPLOTS AND HISTOGRAMS BETWEEN (RHOB, NPHI, DT, GR, LLD AND MSFL)AS
GENERATED BY K-MEANS CLUSTER ANALYSIS FOR GROUPS OF MISHRIF FORMATION
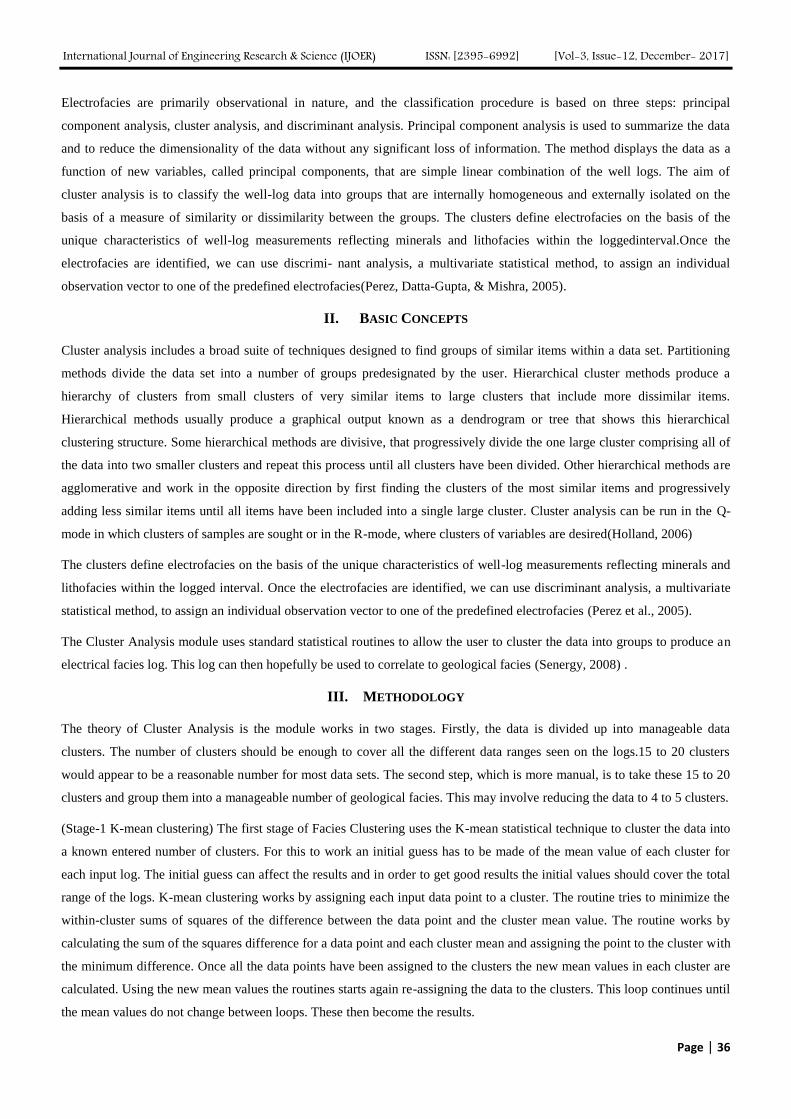
(Stage-2 Cluster Consolidation) Cluster consolidation can be done completely manually by using the crossplot and log plot
output to group data, or a hierarchical cluster technique can be used to group the data. Hierarchical clustering works by
computing the distances between all clusters and then merging the two clusters closest together. The new cluster distance to
all other clusters is then recomputed and the two closest clusters merged again. This process continues until you have only
one cluster. The results can be plotted as a dendrogram, which IP displays. The dendrogram shows how the clusters were
merged and the order they were merged (Senergy, 2010).
FIGURE (2): CLUSTER GROUPING DENDROGRAM OF MISHRIF FORMATION
Cluster grouping dendrogram
International Journal of Engineering Research & Science (IJOER) ISSN: [2395-6992] [Vol-3, Issue-12, December- 2017]
Page | 38
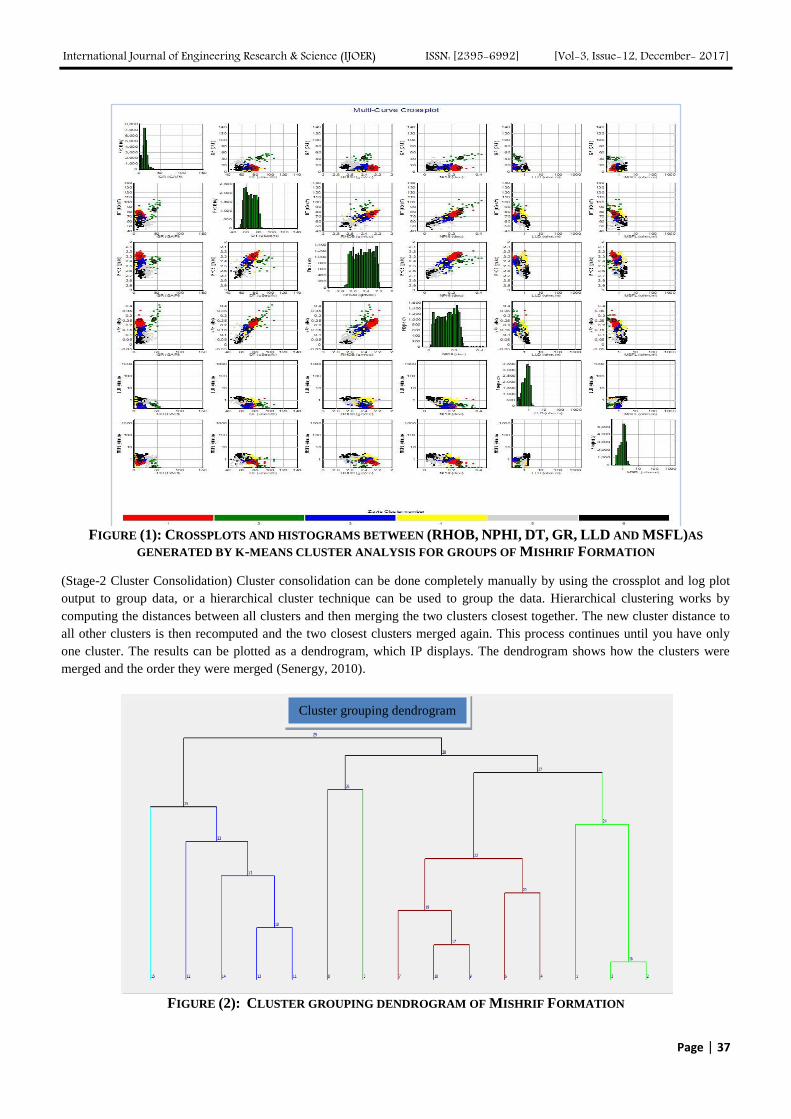
FIGURE (3): CLUSTER GROUPS RANDOMNESS OF MISHRIF FORMATION
TABLE 1
THE PROPERTIES FOR GROUPS OF CLUSTERS AND ENVIRONMENT
Zones Clusters of group Environment
MISHRIF 6 Lagoon
MA 4 Rudist Biostrome+ Shoal
BAR-2 3 Lagoon
MB11 2.3 Rudist Biostrome+ Shoal
BAR-3 3.4 Lagoon
MB12 3.2 Rudist Biostrome
BAR-4 4.2.3 Lagoon
MB13 2.3 Back Shoal
BAR-5 6 Basin
MB21 1.2 Slope
BAR-6 6.5.3 Basin
MC1 2.1.3 Slope
BAR-7 3.2 Basin
MC2 3.2. Slope
IV. RESULTS AND DISCUSSIONS
The method has tested on a 398.5 m thick interval of Carbonate deposits in a vertical well from Amara field, located in
southeast Iraq. Modal data have collected from both core and cutting samples. Cluster analysis and electrofacies
classification have performed using advance interpretation in Interactive Petrophysics software version 3.6.

International Journal of Engineering Research & Science (IJOER) ISSN: [2395-6992] [Vol-3, Issue-12, December- 2017]
Page | 39
Recognition of Logfacies is a common practice in drilled wells where suitable well logs and core samples are available.
Cluster analysis techniques such as hierarchical and k-means cluster analysis can be used for classifying well log data into
discrete classes.
However , studying this part was made through two trends. The first trend includes the petrography and microfacies analysis
of Mishrif Formation have been studied on the basis more than ( 120 ) thin sections of core samples and the previous
microfacies studies for Mishrif Formation. The second trend includes the Mishrif depositional environments in studied wells
depending on the available well logs utilizing cluster analysis technique.
4.1 Carbonate Microfacies and Depositional Environments
Carbonate microfacies and marine depositional environments studied for Mishrif Formation depended on the available thin
sections though they were not enough to cover all the depositional environments of Mishrif Formation. Therefore, previous
studies and well logs were also depended in this study.
4.2 Mishrif Facies Associations
The Mishrif Formation carbonates were classified following Dunham’s (1962) classification (modified by Embry and
Klovan, 1971 ) into mud- or grain-supported textural types. Each type consists of three principal microfacies,(Aqrawi,
Thehni, Sherwani, & Kareem, 1998) as follows:
4.2.1 Mud-supported microfacies
4.2.1.1 Pelagic mudstone/wackestone
This microfacies occurs at various levels in Mishrif Formation , but was existing in the lower parts. Micrite is the main
component, but planktonic foraminifera also occur . in various proportions usually less than 5O%. This microfacies
dominates the underlying Rumaila Formation (Aqrawi, 1983: Aqrawi and Khaiwka, 1986 and 1989). Pelagic lime
mudstone/wackestones are usually interpreted as outer- shelf or basinal deposits (Wilson, 1975).
4.2.1.2 Bioclastic wackestone
Bioclastic wackestones comprise one of the most common microfacies in the Mishrif Formation carbonates. Bioclasts (such
as Praealveolinids, algae and echinoderms) comprise between 10 and 40% of the lithology, and limited pelagic foraminifera
also occur. The microfacies is characteristic of shallow, open-marine environments (Flugel, 1982).
4.2.1.3 Wackestone/packstone
Wackestones/packstones are quite common in Mshrif formation. Benthic foraminifera (such as Miliolids and Textularia),
sponge spicules, algae, small mollusc fragments and echinoderms occur in this microfacies in proportions up to about 50%.
The microfacies is typical of lagoons (Flugel, 1982) or restricted subtidal zones with warm shallow waters and moderate
circulation (Tucker, 1985).
4.2.2 Grain-supported microfacies
4.2.2.1 Peloidal packstone
This microfacies is principally composed of peloids of various sizes, many of which have an uncertain internal structure.In
addition, benthic foraminifera, rudist fragments and ostracods also occur. The microfacies is common in the upper parts of
the Mishrif Formation, and is interpreted to indicate shoals and subtidal zones .

International Journal of Engineering Research & Science (IJOER) ISSN: [2395-6992] [Vol-3, Issue-12, December- 2017]
Page | 40
4.2.2.2 Rudistid packstone/grainstone
This microfacies is characterised by a high content of rudist fragments, which are associated with other bioclasts such as
algal debris, benthic foraminifera and peloids (in smaller proportions). It is one of the two principal reservoir facies of the
Mishrif Formation. Rudist grainstones are interpreted to be a reef-bank or shoal deposit, and rudist packstones to be a back-
reef deposit.
4.2.2.3 Rudstone
Rudstones are composed of rudist fragments, most of which are larger than sand-grade, in addition to coral fragments of a
similar size. This microfacies is interpreted to be a fore-reef slope deposit (Wilson, 1975) . The rudstones and rudistid
packstone/grainstones are generally over- and underlain by subtidal and outer-shelf facies, respectively, in the boreholes
studied. These two microfacies are characterised by high primary and secondary porosities and permeabilities; together, they
form the most important reservoir units in the Mishrif Formation throughout the Mesopotamian Basin (Aqrawi et al., 1998).
FIGURE (4): HISTOGRAM OF LOGFACIES FOR ZONES OF MISHRIF FORMATION

International Journal of Engineering Research & Science (IJOER) ISSN: [2395-6992] [Vol-3, Issue-12, December- 2017]
Page | 41
Mishrif platform carbonates throughout the southern Iraq and especially in southeast Iraq can be divided into the following
facies associations (Figure 4):
FIGURE (5): A-SCHEMATIC CROSS SECTION OF MISHRIF PLATFORM SHOWING THE ENVIRONMENTS OF
DEPOSITION OF MICROFACIES ASSOCIATION. B-BLOCK DIAGRAM SHOWING DEPOSITIONAL ENVIRONMENTS
OF MISHRIF FORMATION AND THE DISTRIBUTION OF MICROFACIES ASSOCIATIONS (CIRCLED NUMBERS).
(FIGURES A & B ARE MODIFIED AFTER(BURCHETTE, 1993).
4.3 Mishrif Depositional Environments
4.3.1 Basin Environment
Basinal environment is simply the end of the marine environmental spectrum that began at the strandline and ended at the
deepest part of that particular sedimentary basin (Figure 4). There is not even a rigid definition of basinal environment or
International Journal of Engineering Research & Science (IJOER) ISSN: [2395-6992] [Vol-3, Issue-12, December- 2017]
Page | 42
basinal facies. In fact, the greatest depth that exists in one basin may be the same measured depth as the shallow subtidal
regime in another basin (Ahr, 2008).
4.3.2 Slope Environment
Slopes are commonly sites for upwelling, initiation of density or turbidity currents, and initiation of slumps, rock falls, and
debris flows triggered by slope failures (Figure 4). Environmental processes on slopes are dominated by gravitational forces
and pounding from waves. Upper slope zones in relatively shallow water may be subject to wind or storm waves, oceanic
currents, and tides. Middle slope and base of slope zones are typically below fair - weather wave base, below the influence of
surface currents, and relatively less influenced by tidal currents than the upper slope zone. Deeper parts of slope zones are
sites where rocks and sediments swept off the slope by shallow - water processes come to rest (Ahr, 2008).
The succession, coarsening upward from basinal limestone to shallow marine packstone, reflects shallowing of the
depositional environment in response to progradation of carbonate slope (Burchette, 1993).
4.3.3 Shoal Environment
Shoal forms a barrier that absorbs most of the wave energy from the open ocean (Nichols, 2009). This is the most
widespread coarse-grained facies association of Mishrif Formation. The shoal association is composed of off-white, poorly
sorted bioclastic packstone, grainstone, and rudstone. Bioclasts are predominantly molluscan, mostly rudistid. It represents
the deposits of low energy shoals and banks along the platform margin (Burchette, 1993).
4.3.4 Rudist Biostrome Environment
This facies association represents the most important reservoir rock in Mishrif Formation. The diverse fauna, distribution,
and context of this facies at the top of a coarsening upward succession all indicate an origin as biostromes within the
prograding margin (Burchette, 1993).
4.3.5 Back Shoal Environment
Thin to medium-bedded, fine to very coarse-grained bioclastic packstone, wackestone, and grainstone characterize this
association. The sediments are more varied, indurated, and stylolitized than other coarse facies. These deposits represent a
zone of sediment mixing between shoal and interior lagoon. They overlie the coarsening upward succession and are
interbedded in several-meter-thick intervals with lagoonal sediments (Burchette, 1993).
4.3.6 Lagoon Environment
Shallow elongate body of water between the mainland and a barrier island where circulation is commonly restricted and
access to marine waters is only through inlets (Hughes, 1999). The lagoon association is characterized by indistinctly bedded
benthonic foraminiferal and peloidal lime mudstone and wackestone. Molluscan (including rudist) debris, echinoderm, and
ostracodes are locally important (Burchette, 1993).
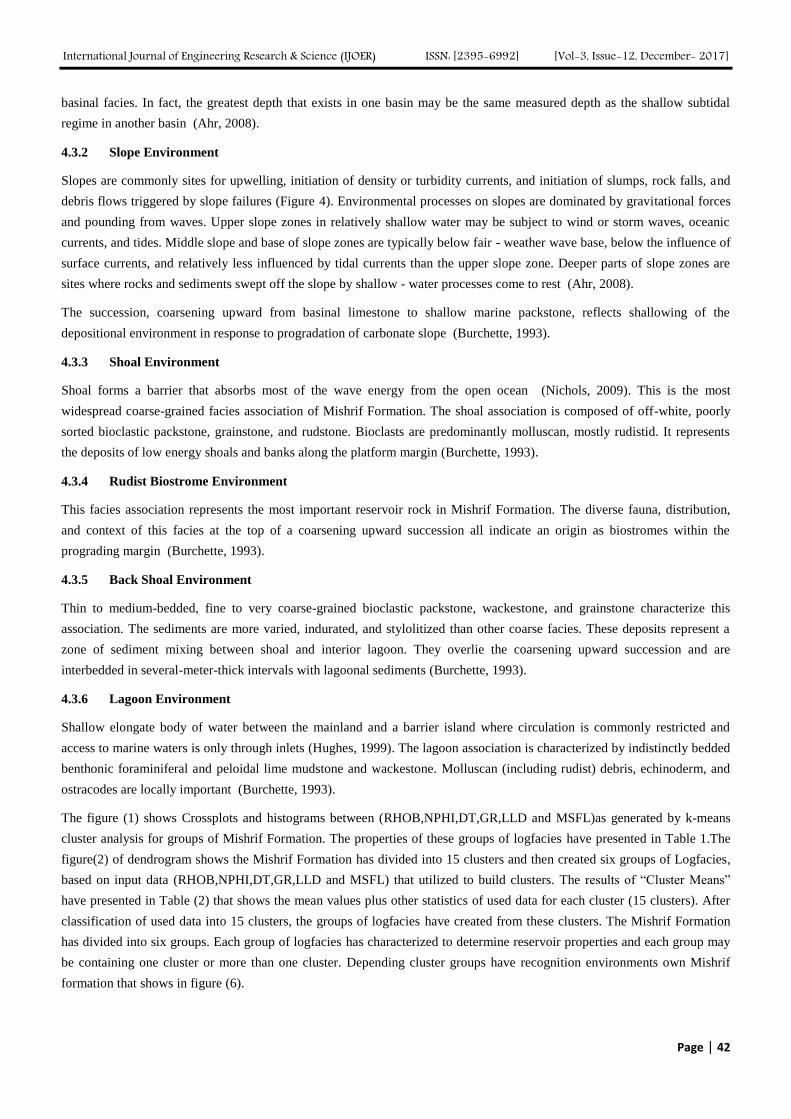
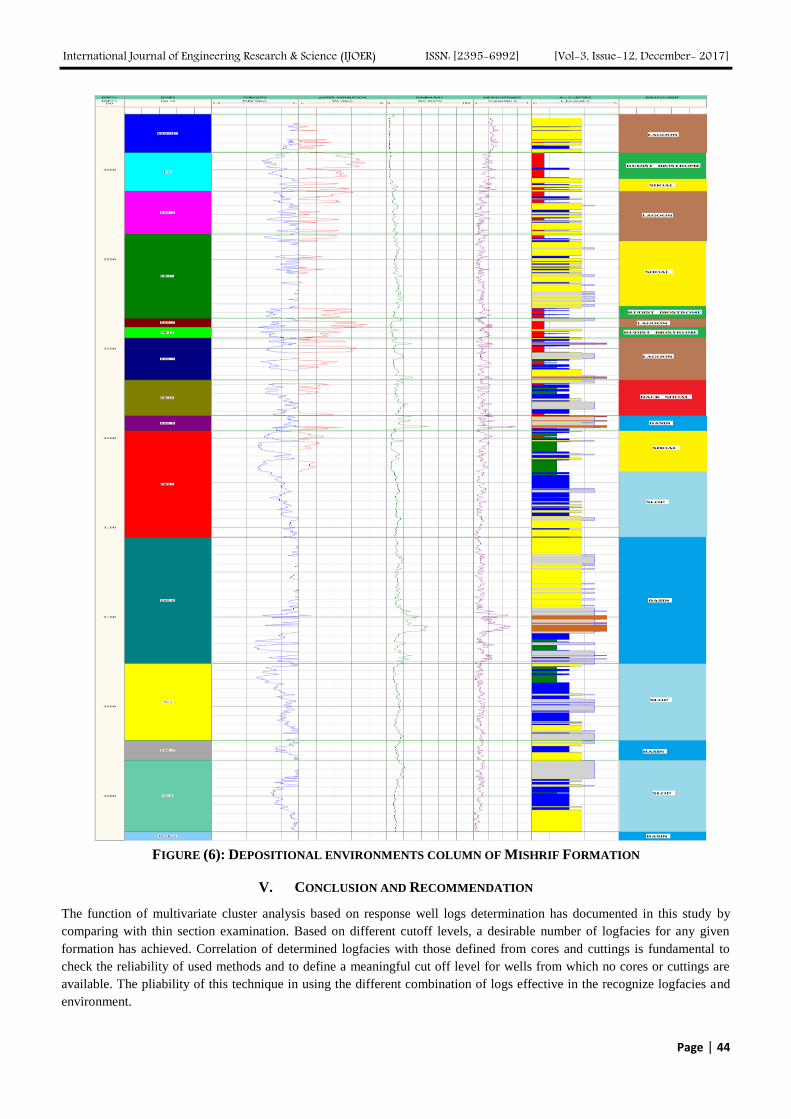
The figure (1) shows Crossplots and histograms between (RHOB,NPHI,DT,GR,LLD and MSFL)as generated by k-means
cluster analysis for groups of Mishrif Formation. The properties of these groups of logfacies have presented in Table 1.The
figure(2) of dendrogram shows the Mishrif Formation has divided into 15 clusters and then created six groups of Logfacies,
based on input data (RHOB,NPHI,DT,GR,LLD and MSFL) that utilized to build clusters. The results of “Cluster Means”
have presented in Table (2) that shows the mean values plus other statistics of used data for each cluster (15 clusters). After
classification of used data into 15 clusters, the groups of logfacies have created from these clusters. The Mishrif Formation
has divided into six groups. Each group of logfacies has characterized to determine reservoir properties and each group may
be containing one cluster or more than one cluster. Depending cluster groups have recognition environments own Mishrif
formation that shows in figure (6).

International Journal of Engineering Research & Science (IJOER) ISSN: [2395-6992] [Vol-3, Issue-12, December- 2017]
Page | 43
TABLE 2
THE RESULTS OF “CLUSTER MEANS” PLUS OTHER STATISTICS OF USED DATA FOR EACH CLUSTER K-Mean Clustering Results
Cluster # Cluster RHOB NPHI DT GR LLD MSFL
# Points Spread Mean Std. Dev. Mean Std. Dev. Mean Std. Dev. Mean Std. Dev. Mean Std. Dev. Mean Std. Dev.
0 863 0.5285 0.35413 0.00535 -0.64666 0.02324 1.8958 0.01248 0.79103 0.08191 -0.06746 0.07126 0.50984 0.08867
1 2841 0.7332 0.35496 0.00849 -0.61898 0.04001 1.8975 0.02257 1.193 0.1611 -0.01268 0.1367 0.48738 0.1577
2 3006 0.5053 0.36542 0.00508 -0.69029 0.03384 1.8691 0.01151 1.1211 0.0746 0.09248 0.08215 0.67196 0.07628
3 1392 0.8542 0.37293 0.00863 -0.71496 0.05205 1.861 0.02549 0.9327 0.08081 0.56225 0.2242 0.94635 0.1842
4 868 0.9621 0.36789 0.01118 -0.71437 0.0496 1.8778 0.02252 0.58838 0.09861 0.89645 0.202 1.1223 0.244
5 2540 0.6502 0.38125 0.0071 -0.77627 0.0497 1.8411 0.01493 1.1551 0.08541 0.33415 0.113 0.85991 0.1148
6 1369 0.8896 0.38716 0.00909 -0.8296 0.05832 1.8286 0.022 1.1391 0.1034 0.77388 0.1888 1.2675 0.1886
7 1505 1.054 0.3881 0.00961 -0.84366 0.07606 1.8279 0.02742 0.68786 0.09804 1.2183 0.1988 1.5468 0.273
8 2085 0.7369 0.40306 0.00845 -0.94258 0.1017 1.7939 0.01734 1.1063 0.06373 0.56012 0.1152 1.1127 0.132
9 1121 0.9448 0.39313 0.00906 -0.88176 0.08404 1.8032 0.03249 1.3128 0.09857 0.55189 0.1346 0.97268 0.253
10 1902 0.8349 0.40623 0.00781 -1.0181 0.07272 1.7834 0.02132 1.2926 0.09426 0.82135 0.1637 1.3836 0.1577
11 1282 1.069 0.40772 0.00669 -1.1102 0.1122 1.7706 0.025 1.0659 0.1332 1.1813 0.1651 1.7578 0.279
12 2050 0.7118 0.41812 0.00546 -1.2165 0.09504 1.7649 0.0154 1.1552 0.07663 0.87929 0.1545 1.2424 0.148
13 1280 0.9076 0.42119 0.00678 -1.3004 0.1209 1.7503 0.02054 1.3899 0.09345 1.0236 0.1413 1.3301 0.2084
14 2061 0.8811 0.42384 0.00513 -1.5124 0.1085 1.7413 0.01735 1.1805 0.1283 1.2795 0.1933 1.549 0.2124
Output Curves Cluster Values All Cluster User set 1
Crv Name L_FaciesAll L_Facies Cluster Value Value
0 1 1 1 2 1 2 3 1 3 4 2 4 5 3 5 6 2 6 7 2 7 8 4 8 9 2 9 10 2
10 11 5 11 12 5 12 13 5 13 14 5 14 15 6
International Journal of Engineering Research & Science (IJOER) ISSN: [2395-6992] [Vol-3, Issue-12, December- 2017]
Page | 44
FIGURE (6): DEPOSITIONAL ENVIRONMENTS COLUMN OF MISHRIF FORMATION
V. CONCLUSION AND RECOMMENDATION
The function of multivariate cluster analysis based on response well logs determination has documented in this study by
comparing with thin section examination. Based on different cutoff levels, a desirable number of logfacies for any given
formation has achieved. Correlation of determined logfacies with those defined from cores and cuttings is fundamental to
check the reliability of used methods and to define a meaningful cut off level for wells from which no cores or cuttings are
available. The pliability of this technique in using the different combination of logs effective in the recognize logfacies and
environment.

International Journal of Engineering Research & Science (IJOER) ISSN: [2395-6992] [Vol-3, Issue-12, December- 2017]
Page | 45
REFERENCES
[1] Ahr, W. M. (2008). Geology of Carbonate Reservoirs: The Identification, Description, and Characterization of Hydrocarbon
Reservoirs in Carbonate Rocks. Geology of Carbonate Reservoirs: The Identification, Description, and Characterization of
Hydrocarbon Reservoirs in Carbonate Rocks. https://doi.org/10.1002/9780470370650
[2] Aqrawi, A. A. M., Thehni, G. A., Sherwani, G. H., & Kareem, B. M. A. (1998). Mid-cretaceous rudist-bearing carbonates of the
Mishrif formation: An important reservoir sequence in the Mesopotamian Basin, Iraq. Journal of Petroleum Geology, 21(1), 57–82.
https://doi.org/10.1111/j.1747-5457.1998.tb00646.x
[3] Burchette, T. P. (1993). Mishrif Formation (Cenomanian-Turonian), Southern Arabian Gulf: Carbonate Platform Growth Along a
Cratonic Basin Margin, 2.
[4] Crain, E. R. (Ross). (d. g.). Crain Petrophysics Handbook. Berreskuratua -(e)tik https://www.spec2000.net/21-strat1.htm
[5] Doveton, J. H., & Prensky, S. E. (1992). Geological applications of wireline logs: a synopsis of developments and trends. The Log
Analyst, 286–303.
[6] Euzen, T., Delamaide, E., Feuchtwanger, T., & Kingsmith, K. D. (2010). Well Log Cluster Analysis: An Innovative Tool for
Unconventional Exploration. Society of Petroleum Engineers. https://doi.org/10.2118/137822-MS
[7] Holland, S. M. (2006). Cluster analysis, (January), 7. https://doi.org/http://dx.doi.org/10.4135/9781412983648
[8] Hughes, B. (1999). Petroleum Geology.Science (New York, N.Y.).
[9] Nichols, G. (2009). Sedimentology and Stratigraphy. Blackwell.
[10] Perez, H., Datta-Gupta, A., & Mishra, S. (2005). The Role of Electrofacies, Lithofacies, and Hydraulic Flow Units in Permeability
Predictions From Well Logs: A Comparative Analysis Using Classification Trees. SPE Reservoir Evaluation & Engineering, 8(2), 5–
8. https://doi.org/10.2118/84301-PA
[11] Senergy. (2008). Interactive Petrophysics Users Manual.
[12] Senergy. (2010). Interactive Petrophysics V3.6 Online Help Interactive.
[13] Wilson, J. L. (1975). Carbonate facies in geologic history. Springer Science & Business Media.