role of heor in decision making: global knowledge for
TRANSCRIPT

Role of HEOR in Decision Making: Global Knowledge for Local Application
September 20, 2018

Role of HEOR in Decision Making: Global Knowledge for Local Application
Ola Ghaleb Al Ahdab, PhDMinistry of Health and Prevention
United Arab Emirates
Dan Malone, RPh, PhD, FAMCPUniversity of Arizona
Tucson, AZ, USA
Darrin Baines, PhDBournemouth UniversityPoole, United Kingdom
Sherif Abaza, MBASyreon Middle East
Egypt

Role of HEOR in Decision Making: Global Knowledge for Local Application
Dan Malone, RPh, PhD, FAMCPUniversity of Arizona
Tucson, AZ, USA
United States Pharmaceutical Value Frameworks
Daniel C Malone, PhD, FAMCP
Professor, University of Arizona

United States Healthcare Spending


In 2015, growth in oncology expenditures was 23.7% due to increases in utilization (9.3%) and unit costs (14.4%)1
Median Monthly Cost for New Cancer Drugs at Time of Approval2
1. Express Scripts. 2015 Drug Trend Report, March 2016. http://lab.express-scripts.com/lab/drug-trend-report.
2. ASCO. The State of Cancer Care in America, 2016: A Report by the American Society of Clinical Oncology.
Journal of Oncology Practice. 2016;12(4):339-383.
3. Tefferi A, et al. Mayo Clin Proc. 2015;90(8):996-1000.
3
High Costs of Oncology Drugs

99
Harvard Business Review
Can we afford drugs for rare diseases?
$750,000 per year for SMA treatment
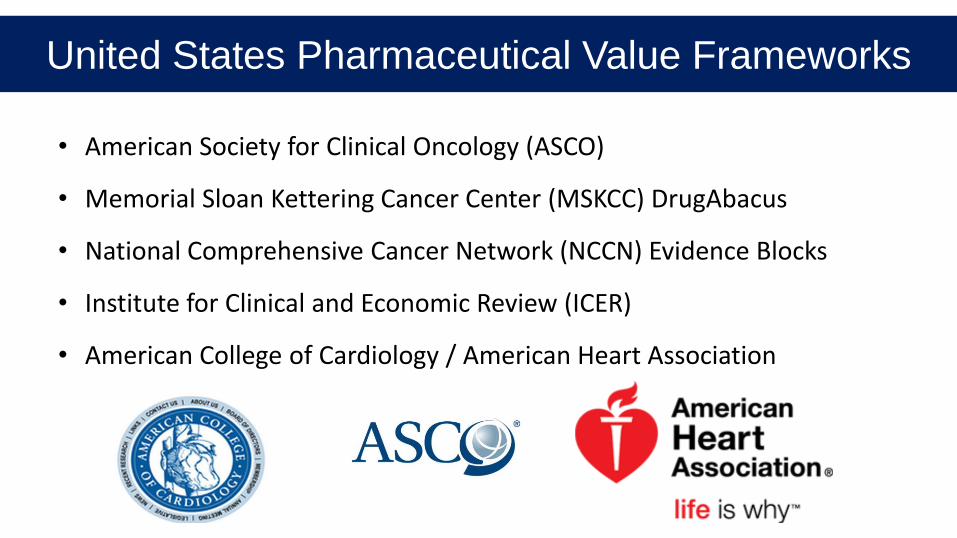
• American Society for Clinical Oncology (ASCO)
• Memorial Sloan Kettering Cancer Center (MSKCC) DrugAbacus
• National Comprehensive Cancer Network (NCCN) Evidence Blocks
• Institute for Clinical and Economic Review (ICER)
• American College of Cardiology / American Heart Association
United States Pharmaceutical Value Frameworks

ACC/AHA Framework
Label Thresholds Qualifying Statements
High < $50,000 / QALY gained Better outcomes at lower cost
(dominant) or threshold value
Intermediate $50,000 to $150,000 / QALY
gained
Low > $150,000 / QALY gained
Uncertain Insufficient data to draw
conclusions
Not
assessed
Value not assessed by guideline
committeeSource: Journal of the American College of Cardiology 2014; 63(21):2305-2322

• Association developed framework
• Focusses on guidelines to drive physician/patient
decision making
• Limited to cardiovascular conditions
• Not drug specific
ACC/AHA Framework

Source: Journal of Clinical Oncology: Published Ahead of Print on May 31, 2016 as 10.1200/JCO.2016.68.2518
American Society of Clinical Oncology ( ASCO) Framework –
Version 2.0

ASCO Value Framework: Summary
Schematic based on Schnipper LE, et al. J Clin Oncol. 2016;10.1200/JCO.2016.68.2518.
HR for death reported?
Median OS reported?
RR reported?
No
Yes
Yes
Yes
No
Calculate HR Score for death
Calculate OS Score
Calculate RR Score
Number of grade 1/2 AEs• <10% (0.5 pts)
• ≥10% (1 pt)
Number of grade 3/4 AEs• <5% (1.5 pts)
• ≥5% (2 pts)
Calculate Score• % difference between
regimens x 20 (20 pt max)
• Subtract from clinical benefit if more toxic, add if less toxic
Clinical Benefit (pts vary)
Symptomatic unresolved toxicities at
1 year (deduct 5 points)
Toxicity (20 pt max) Bonus (pts vary)
Data showingQoL benefit or long-
term survival advantage?
Apply bonus points:1. Tail of the curve (20 pt
max)
2. Palliation bonus (10 pts)
3. QoL bonus (10 pts)
4. Treatment-free interval bonus (no max)
Yes
No
ReportResults
AE = adverse event; OS = overall survival; PFS = progression-free survival; RR = response rate.
HR for PFS reported?
Calculate HR Score for PFS
Median PFS reported?
Calculate PFS Score
No
No
Yes
Yes
100 pt max
No max
80 pt max
No max
70 pt max
ASCO Value Framework: SummaryAdvanced disease scoring schematic

• Focus on Provider – Patient decision process
• Goal:• “standardized approach to assist physicians and patients in assessing value of
a new drug treatment for cancer as compared to one or several prevailing standards of care”
• Limited to oncology directed treatments (“pharmaceuticals”)
• Sophisticated algorithm to calculate “net health benefit score”
Source: Journal of Clinical Oncology: Published Ahead of Print on May 31, 2016 as 10.1200/JCO.2016.68.2518
ASCO Framework

• Net Health Benefits (Advanced Cancer)
• Clinical benefits• Hazard ratio for death• Median overall survival• Hazard ratio for progression-
free survival• Median progression-free
survival• Response rate
• Toxicity• Bonus points
• Tail of the curve• Palliation of symptoms• Quality of Life• Treatment-free interval
• Cost
• Net Health Benefits (Adjuvant Cancer)
• Clinical benefits• Hazard ratio for death
• Median overall survival
• Hazard ratio for disease-free survival
• Median disease-free survival
• Toxicity
• Bonus points
• Tail of the curve
• Cost
ASCO Frameworks

Outcome Calculation method
Hazard ratio for death 1-HR X 100
Overall survival (OS) Difference in percentage survival X 100
Hazard ratio for progression-free survival (PFS)
1-HR X 100 X 0.8
Median progression-free survival (PFS)
Difference in percentage PFS X 100 X 0.8
Response rate (complete response + partial response)
RR X 100 X 0.7
Note: Only one attribute is allowed
Source: Journal of Clinical Oncology: Published Ahead of Print on May 31, 2016 as 10.1200/JCO.2016.68.2518
Clinical Benefits (Advanced Disease)

Grade 1 or 2 Toxicity Grade 3 or 4 Toxicity
Frequency < 10% > 10% < 5% > 5%
Points 0.5 points 1.0 points 1.5 points 2.0 points
Calculate toxicity for each relevant adverse event from clinical trial experience
• Sum all toxicity scores across the events for each treatment arm
• Toxicity score = Difference in toxicity scores X 20
• If treatment is more toxic than comparator – subtract score from clinical benefit score
• If treatment is less toxic than comparator – add score to clinical benefit score
Source: Journal of Clinical Oncology: Published Ahead of Print on May 31, 2016 as 10.1200/JCO.2016.68.2518
Toxicity

• Identify the time point on the survival curve that is 2X the median OS or PFS of the comparator regimen.
• If >50% improvement in patients alive at this time point• Assuming > 20% survival with comparator
• + 20 points if Overall Survival (OS)• + 16 points if Progression-Free Survival (PFS)
Source: Journal of Clinical Oncology: Published Ahead of Print on May 31, 2016 as 10.1200/JCO.2016.68.2518
Tail of the Curve Bonus Points (Advanced Disease)

• Results
• Clinical benefit, not score
• Toxicity (points for each regimen), not score
• Net Health Benefit (NHB) score
• Bonus points are not included
• Cost (for each regimen)
• There is no single measure of value (eg, value-based price, ICER)
ASCO results reflect a cost-consequence analysis
Schnipper LE, et al. J Clin Oncol. 2016;10.1200/JCO.2016.68.2518.
ASCO Value Framework: Presentation of Results

ASCO Value Framework: Pros and Cons
• Methodological transparency, algorithm available
• User can conduct own analysis, not reliant upon framework developer
• May encourage cost discussion between providers and patients
• Includes points for patient QOL
• Includes patient out-of-pocket costs (in addition to total acquisition costs)
• Calculator not yet available (only score sheet, which is more challenging to use)
• Trial comparator and endpoints can have a significant impact on clinical benefit score
• NHB score not meaningful by itself and cannot be compared across drugs
• Toxicity points may not capture value
• Does not include medical costs
• Difficult to use with single-arm trials
Pros Cons

The DrugAbacus price is a value-based price based on the user’s preferences regarding the price components
Dollars per life year
Toxicity NoveltyCost of
develop-ment
RarityPopulation burden of
disease
Unmet need
Prognosis
Life year gain (LYG)
from clinical trial
Frequency and
severity of AEs
High,medium, or low based on MOA
Measure of cost based on size of
clinical trials
Measure based on incidence of disease
Measure of LYs lost due
to the disease
Measure based on
# of treatments
in NCCN guidelines
Measure based on median survival
without the treatment
User WTP per LYG:
$12,000 –$300,000
User max discount
from 0% –30%
Usermultiplierfrom 1.0 –
3.0
Usermultiplierfrom 1.0 –
3.0
Usermultiplierfrom 1.0 –
3.0
Usermultiplierfrom 1.0 –
3.0
Usermultiplierfrom 1.0 –
3.0
Usermultiplierfrom 1.0 –
3.0
Patient treatment outcomes
Product development characteristics
Diseasecharacteristics
Patientneed
Price Component
Non-modifiable
Price Component
(MSKCC)
Modifiable Price
Component(user)
Lower Price
Higher Price
Actual Price
Abacus price
(poor value if actual price higher than
Abacus price)
Abacus price
(good value if actual price lower than
Abacus price)
X X X X X X X =
MSKCC DrugAbacus: Summary

• Lack of methodological transparency, not easy to replicate analyses
• Not up to date, new drugs on market have not been incorporated
• Toxicities are underweighted
• Does not include QOL
• Does not include full regimen costs (only costs of listed drug)
• User preferences can be modified to justify almost any price
Pros Cons
MSKCC DrugAbacus: Pros and Cons
• Online availability and easy-to-use user-friendly tool
• Focus on value-based price potentially useful to payers and policymakers
• Wide range of value metrics included in the tool, captures broader societal perspective
• Allows users to conduct an analysis reflective of their own preferences regarding the value metrics

A non-profit organization that evaluates evidence on the value of medical tests, treatments and delivery system innovations and moves that evidence into
action to improve the health care system.
Source: https://icer-review.org/
ICER – Institute for Clinical and Economic Review

ICER’s Evaluation ProcessICER’s Evaluation Process
Figure 1. New Conceptual structure of the ICER value assessment framework

Specifics of ICER’s Methods
• Replacement of ”care value” with “long-term value for money”
• Incremental cost-effectiveness ratios• Threshold values • $50,000 to $150,000 / QALY
• Based on:• 1-3x GDP
• Similar to ACC/AHA stated thresholds
• Willingness to pay studies suggest $90,000 / QALY
Specifics of ICER’s Methods
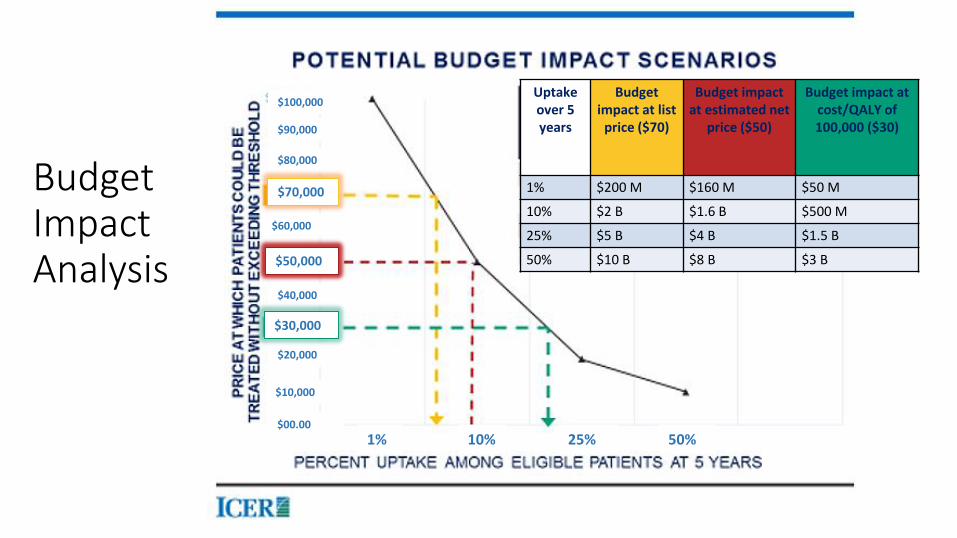
BudgetImpactAnalysis
$100,000
$90,000
$80,000
$70,000
$60,000
$40,000
$20,000
$10,000
$00.00
$50,000
$30,000
1% 10% 25% 50%
Uptakeover 5 years
Budget impact at list
price ($70)
Budget impact at estimated net
price ($50)
Budget impact atcost/QALY of 100,000 ($30)
1% $200 M $160 M $50 M
10% $2 B $1.6 B $500 M
25% $5 B $4 B $1.5 B
50% $10 B $8 B $3 B

Source: https://icer-review.org/materials/ - PCSK9 Final report
ICER Evaluation of PCSK9 Cholesterol Lowering Agents
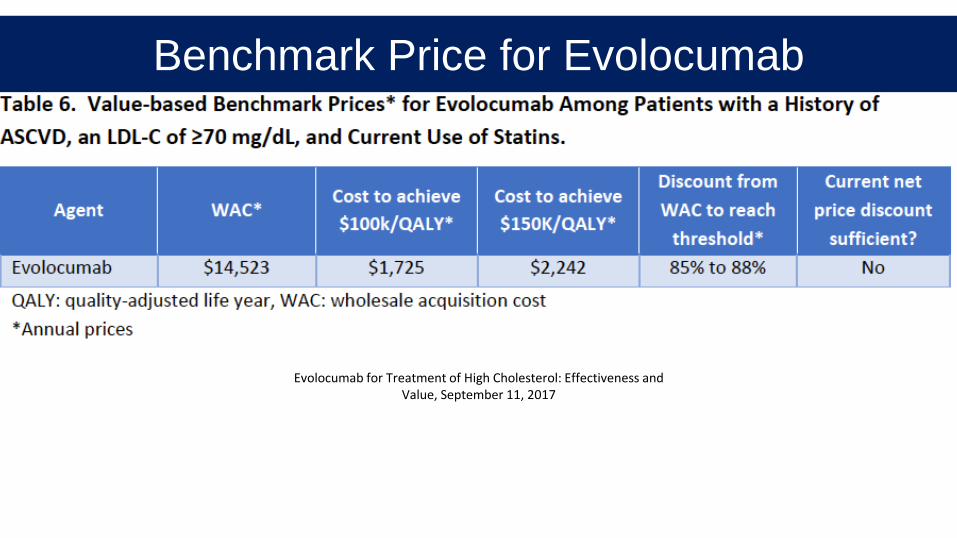
Evolocumab for Treatment of High Cholesterol: Effectiveness and Value, September 11, 2017
Benchmark Price for Evolocumab

Attribute ACC-AHA ASCO 2.0 DrugAbacus ICER NCCN
Type of method
Cost-utility analysis
New –multiple criteria
New –multiplecriteria
Cost-effectiveness
/ budget impact
New
Evidence provided by manufacture
r
No –preference
for published studies
No No No Yes
Discussion/inclusion of
sensitivity analysis
No No NoYes –
depends on analysis
No
Comparisons Across Frameworks – Methods

Attribute ACC-AHA ASCO 2.0 DrugAbacus ICER NCCN
Is cost included?
Yes-part of cost-
effectiveness
Yes –reported
separately
Yes – user determines “weight” of
cost
Yes – part of cost-
effectiveness analysis
Yes –reported
separately
How to value technology
cost
Not discussed
Acquisitioncost /patient cost sharing
Medicare fee schedule/cost
Not specified – market price /fee schedules
Ordinal scale(1-5) rated
by members
Other costs included/ allowed?
Yes No No Yes No
Comparisons Across Frameworks – Costs

• Numerous ”Value-Frameworks”
• High cost of medications driving the desire to use value frameworks
• Some managed care organizations “love” the ICER work• CVS supports ICER’s approach @ $100,000 / QALY
• Numerous issues with the existing value frameworks
• Defining ”value” is challenging
Summary Summary

Role of HEOR in Decision Making: Global Knowledge for Local Application
Darrin Baines, PhDBournemouth UniversityPoole, United Kingdom

Role of HEOR in Decisions – a UK Perspective
Professor Darrin Baines
@darrinbaines

Contact details
Darrin Baines
Professor of Health Economics
@darrinbaines
darrinbaines.net

UK structure
• The United Kingdom has a population of 66.57million (2018) and consists of England,
Scotland, Wales and Northern Ireland
• The National Health Service (NHS) provides the majority of health services throughout
the UK, and each country has its own structure and budget for organising the NHS
• The National Institute for Health and Care Excellence (NICE) was established in
legislation during the late-1990s.
• NICE guidance is officially England-only. However, there are agreements to provide
certain NICE products and services to Wales, Scotland and Northern Ireland.
• Decisions on how NICE guidance applies in these countries are made by the devolved
administrations, who are often involved and consulted with in the development of NICE
guidance.

NHS in ENGLAND
• Almost all NHS revenue comes from taxes, with a small proportion from charges for
prescriptions
• Population of England = 55.33million (2018).
• The government spent about £122 billion on health in England in 2017/18, or roughly £2,200
per person. About £108 billion was spent on the day-to-day running of the NHS. Estimated
total NHS spending on medicines in England has grown from £13 billion in 2010/11 to £17.4
billion in 2016/17 (an average growth of around 5 per cent a year).
• Much of the recent growth in medicines spending has been in the hospital sector, where
estimated costs have grown at around 12 per cent a year on average since 2010/11. Today
hospitals account for nearly half of total NHS spending on medicines.
• In primary care, spending growth has been much lower. Although the volume of prescription
items provided to patients increased by almost half in the decade to 2016 (to 1.1 billion items),
which was offset by a reduction of nearly a quarter in the average cost per prescription item (to
£8.34).

NHS in SCOTLAND
• Health spending in Scotland was about £13.2 billion in 2017/18, or around £2,500 per person.
• Population: 5.4million (2018).
• The Scottish Medicines Consortium (SMC) decides whether new medicines should be
routinely available for prescribing by the NHS in Scotland based on its assessment of the
value for money of those new medicines.

NHS in WALES
• Almost all from Welsh government . No charges for prescription but they are charges for
dentist and opticians
• Population: 3.1million 2018
• Health spending in Wales is planned to be £7.3 billion in 2017/18, or roughly £2,300 per
person. Like Scotland, this includes some money for sport as well as health
• The Welsh Assembly Government has an agreement in place with NICE covering the
Institute's technology appraisals, clinical guidelines and interventional procedure guidance,
which all continue to apply in Wales.
NHS in NORTHERN IRELAND
• NORTHERN IRELAND In Northern Ireland the NHS is referred to as the Health and Social
Care Service (HSC) and includes hospitals, GP services, and community health and social
services.
• Population: 1.8million
• Health spending in Northern Ireland in 2016/17 was £5 billion, or roughly £2,700 per person.

HTA in UK
• National Institute for Health and Care Excellence (NICE) in England
• Scottish Medicines Consortium (SMC) in Scotland
• All Wales Medicines Strategy Group (AWMSG) in Wales.
• There is no separate Health Technology Appraisal (HTA) body in Northern Ireland that assesses
medicines for use within the HSC. Northern Ireland essentially adopts NICE guidance

NICE’s role
To improve outcomes for people using the NHS and other public health and social care services by:
● Producing evidence-based guidance and advice for health, public health and social care practitioners.
● Developing quality standards and performance metrics for those providing and commissioning health, public health
and social care services.
● Providing a range of information services for commissioners, practitioners and managers across the spectrum of
health and social care.

nice.org.uk

NICE processes

Section V.
Health Research

Health Research in UK
• Each UK nation has its own government department that oversees health and care research:
• The National Institute for Social Care and Health Research (NISCHR) is the Welsh
Government body that develops strategy and policy for research in the NHS and social care in
Wales.
• The Chief Scientist Office (CSO), part of the Scottish Government's Health and Social Care
Directorate, supports and promotes high quality research aimed at improving the quality and
cost-effectiveness of services offered by NHS Scotland and securing lasting improvements to
the health of the people of Scotland.
• The Health and Social Care Public Health Agency (HSC PHA) is the major regional
organisation for health protection wit in Northern Ireland, with a mandate to protect public
health, improve public health and social wellbeing, and reduce inequalities in health and social
wellbeing.
• The Department of Health and Social Care in England funds a Policy Research Programme to
provide the evidence-base for robust policy development, as well as funding health and care
research through the National Institute for Health Research.
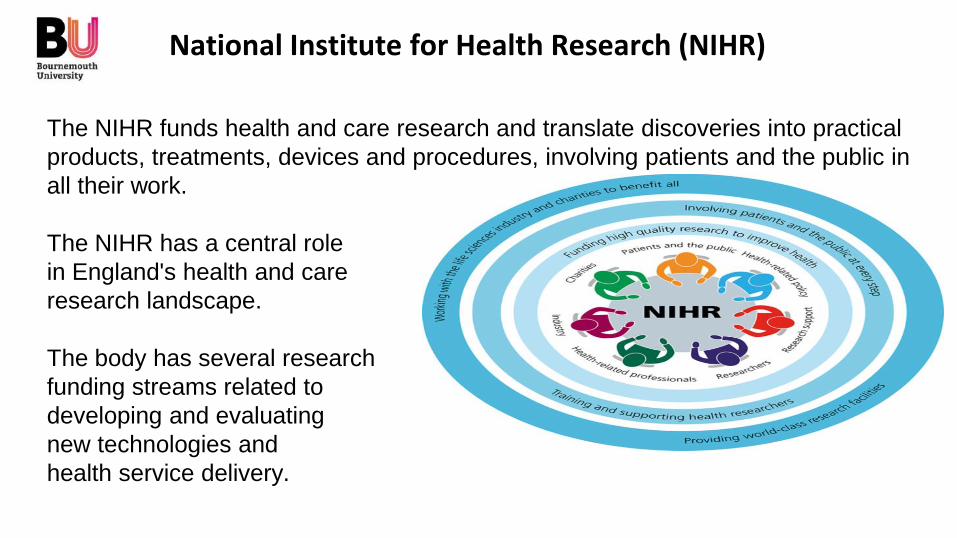
National Institute for Health Research (NIHR)
The NIHR funds health and care research and translate discoveries into practical
products, treatments, devices and procedures, involving patients and the public in
all their work.
The NIHR has a central role
in England's health and care
research landscape.
The body has several research
funding streams related to
developing and evaluating
new technologies and
health service delivery.
Its Health Technology Assessment (HTA) Programme funds research about the
Key messages
1. Formal HTA is often treated as a “one-off”,
summative evaluation of new technologies
2. UK’s NHS has many institutional mechanisms for
promoting cost-effective, affordable service
provision
3. There is a growing need for formative, continual
processes for supporting NHS decisions

Role of HEOR in Decision Making: Global Knowledge for Local Application
Sherif Abaza, MBASyreon Middle East
Egypt

Today’s research for tomorrow’s health
Role of HEOR in Decision-Making: Global Knowledge for Local Application
in EgyptSherif Abaza
President Elect ISPOR Egypt Chapter
General Manager MENA at Syreon

Today’s research for tomorrow’s health
Starting points
• HTA was introduced in high income countries
• HTA implementation requires investment
• How to transfer knowledge form high income countries?

Today’s research for tomorrow’s health
Middle income countries (Egypt)
• Compared to high income countries
• worse health status
• even more limited health care resources
• Middle income countries need HEOR more than high income countries.

Today’s research for tomorrow’s health
Investment needed for implementation
• Human capacities
• Financial resources
• Local data (IT infrastructure; patient registries)
• Political commitment
• Consistency in implementation

Today’s research for tomorrow’s health
Development Of Health Economics Education in Egypt
First Workshop
for Health
Economics For
Governmental
Sector
First Master in
Health Economics
at Cairo
University
First Diploma
in Health
Economics at
Arab Academy
2010 2012 2014

Today’s research for tomorrow’s health
Recent Health Economics Education and Activities in
Cairo

Today’s research for tomorrow’s health
ISPOR Egypt 2nd Annual Conference 2017

Today’s research for tomorrow’s health
ISPOR Egypt 2nd Annual Conference 2017
Today’s research for tomorrow’s health
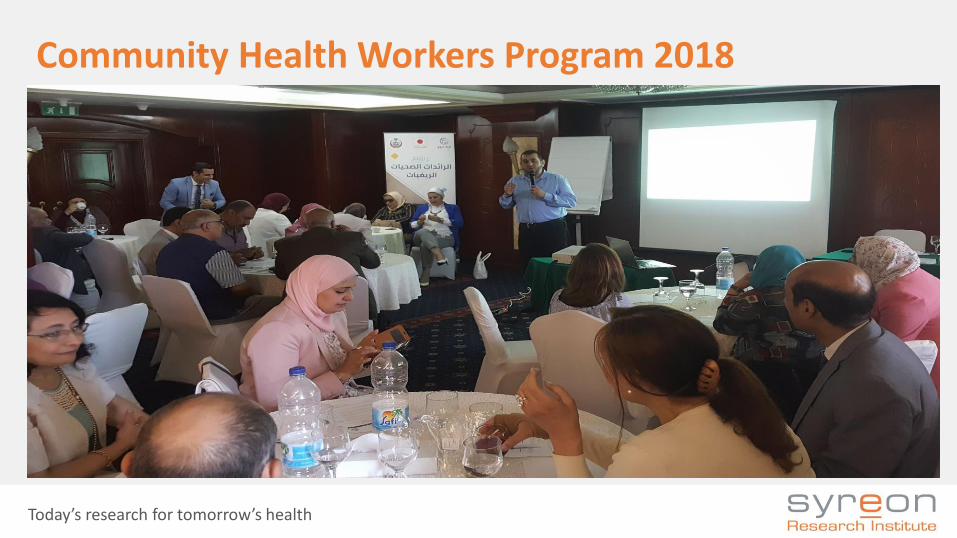
Community Health Workers Program 2018

Today’s research for tomorrow’s health
Community Health Workers Program 2018

Today’s research for tomorrow’s health
HTA Summit 2018

Today’s research for tomorrow’s health
Health Insurance Organization 3 days workshop 2018

Today’s research for tomorrow’s health
Pharmaco-Economic Unit
Vision:
Provide scientific guidance of the value of drugs in delivering expected outcomes to decision makers, health professionals and the public.
Source: Elsisi Gihan
5- years in Egypt
Today’s research for tomorrow’s health
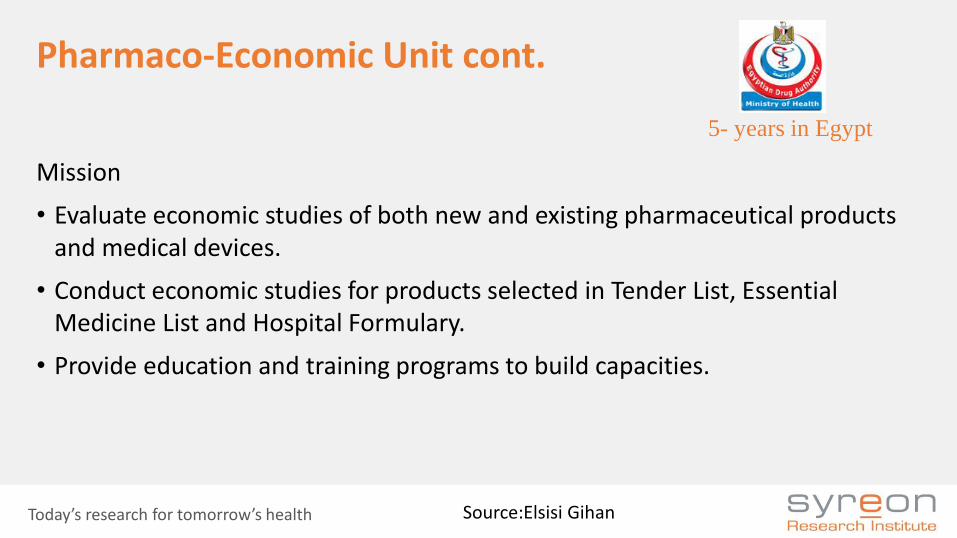
Pharmaco-Economic Unit cont.
Mission
• Evaluate economic studies of both new and existing pharmaceutical products and medical devices.
• Conduct economic studies for products selected in Tender List, Essential Medicine List and Hospital Formulary.
• Provide education and training programs to build capacities.
Source:Elsisi Gihan
5- years in Egypt

Today’s research for tomorrow’s health
Pharmaco-Economic Unit cont.
Objectives
• Lowering the pharmaceutical expenditure .
• Improvement in accessibility of patients to medicines.
Source:Elsisi Gihan
5- years in Egypt
Today’s research for tomorrow’s health
Recommendations for Reporting Pharmacoeconomic Evaluation in Egypt

Today’s research for tomorrow’s health
Future: Moving towards Universal Health Care Coverage (SHI)
HIO
(payer/ provider)
MoH-SMCs
“Sickness Fund”
& Private HospitalsPublic Hospitals
Gov. Single Payer
Accreditation Body
(Regulator)
Provider System
Law was published in Jan 2018 and implementation plan on May 2018New SHI law include creation of HTA department within payer body

Today’s research for tomorrow’s health
THANK YOU

Role of HEOR in Decision Making: Global Knowledge for Local Application
Ola Ghaleb Al Ahdab, PhDMinistry of Health and Prevention
United Arab Emirates

Health Economics & Outcomes Research(HEOR) In The UAE:
Current Challenges And Potential Opportunities
Ola Ghaleb Al Ahdab, PhD. − Pharmaceutical Advisor, Drug Department, MOHAP, UAE − President, ISPOR United Arab Emirates Chapter− President, ISPOR Arabic Network − Adjunct Assistant Professor, Colleges of Pharmacy, UAE− Vice-President FIP Social & Administrative Pharmacy Section− Vice-President for Pharmacy Society, EMA

AGENDA
▪ INTRODUCTION
▪ THE UAE FACTS & FIGURES
▪ CURRENT STATUS & CHALLENGES
▪ PROPOSED PLANS &RECOMMENDATIONS
▪ SUMMARY
ISPOR DUBAI Regional Conference 70

Introduction: Access to MedicinesMedicines: The Journey
Innovation & Pre-Registration• Pre-clinical testing: Lab or Animal • Clinical testing in Human: (3 Phases)
1: volunteers, 2 patients, 3 multi-centre Registration/Market Authorization
• Safety, Quality & Efficacy, Affordability Post registration➢ Outcomes Research➢ PV Reporting/ Post Marketing Surveillance/ Good Pharmacovigilance
Practices
ISPOR DUBAI Regional Conference 71

PharmacoEconomic (PE) HealthEconomic (HE) INTRO: Current Status Development in the UAE
▪ Pharmacoeconomics applications do not compromise clinical care.▪ Using economic evaluation methods as decision making tools shall support rational
Health Care (HC) spending and promoting/facilitating patient's access to HC services/ pharmacotherapy.
▪ Expensive health care is not always the best health care ▪ CEA, CUA, CBA, Budget Impact Analysis, and Risk sharing agreement are an example for
HEOR methodologies that promote rational patient access to medicines▪ The ISPOR UAE Chapter team provides PE /HEOR Education for UG/PG in Academia ▪ The ISPOR UAE Chapter start providing HEOR Training▪ Few Pharma Industry start to bring expert speakers with HEOR
ISPOR DUBAI Regional Conference 72
OECD’s Health at a Glance

Introduction: ISPOR ARABIC NETWORKS
Available Chapters1. Algeria2. Egypt3. Jordan4. Kuwait 5. Qatar6. Lebanon7. Saudi Arabia8. United Arab Emirates
Coming Shortly • Oman• Sudan• Iraq
ISPOR DUBAI Regional Conference 73
Key Achievements • ISPOR Arabic Network established = 2014• ISPOR Arabic Network: 6 forums in ISPOR Meetings• ISPOR BOT Arabic translation• ERP publication with CEE*• Wrote Chapter IV in Book**
* Zoltán Kaló, Ibrahim Alabbadi, Ola Ghaleb Al Ahdab, Maryam Alowayesh, Mahmoud Elmahdawy, Abdulaziz H Al-Saggabi, Vito Luigi Tanzi, Daoud Al-Badriyeh, Hamad S Alsultan, Faleh Mohamed Hussain Ali, Gihan H Elsisi, Kasem S Akhras, Zoltán Vokóa & Panos Kanavos (June/2015). Implications of external price referencing of pharmaceuticals in Middle East countries. Expert Review of Pharmacoeconomics & Outcomes Research. DOI:10.1586/14737167.2015.1048227**Güvenç Koçkaya, Albert Wertheimer; Ola Al Ahdab & et al. Pharmaceutical Market Access in Emerging Markets book, (Chapter 6: Market Access in the United Arab Emirates and selected Middle Eastern Countries -Pages 129-162)

Key Information About The UAE
▪ Population: 9.12 million population (Dec 2016)▪ Total GDP $bn379 )2016 : 2nd in GCC (<KSA ) 3rd in MENA region▪ Total life expectancy at birth = 76.9 years ▪ Industry is fuelled with latest technology▪ International service providers manage many facilities in the UAE with
high standards▪ MOHAP has mandated all facilities to achieve International accreditation
by 2021.▪ Health Insurance models becoming the dominant way of health funding.
ISPOR DUBAI Regional Conference 74

UAE 7th most competitive in the worldJump from Position 10 to Position 7 in 2018
ISPOR DUBAI Regional Conference75
https://www.imd.org/wcc/world-competitiveness-center-rankings/world-competitiveness-ranking-2018

Pharma-Regulatory Culture
▪ The Intellectual Property Protection in the UAE considered strong (UAE is WTO member and signatory to TRIPS)
▪ ≈ 85% of pharmaceuticals are imported▪ MOHAP regulates Conventional & Complementary Medicines ; Medical Devices and
Veterinary Medicines▪ MOHAP regulates Drug Price▪ Fast Track: Accelerated Approval and Availability of life saving and innovative drugs in
the UAE. ▪ PV/ Risk management plan for each registered medicine mandatory within
registration process▪ GCC Price Dollarization and CIF Unification rational and promote patient access to
innovative drugs in the GCC.▪ Quality healthcare services, Quality Education and capacity building are at the top of
the UAE government agenda & 2021 Vision.
ISPOR DUBAI Regional Conference 76
*MOHAP (Ministry of Health and Prevention)

Pharmaceutical Sales Data in the UAE in USDbn ( Historical & Forecast)
ISPOR DUBAI Regional Conference 77
2014
2015
2016
2017
2018F
2019F
2020F
2021F
2022F
BMI Report Q4/2018

Health Expenditure Data in the UAE in USDbn ( Historical & Forecast)
ISPOR DUBAI Regional Conference 78
14.634
15.336
16.104
16.96
17.887
18.907
20.033
21.277
22.654
2014
2015
2016
2017
2018F
2019F
2020F
2021F
2022F
BMI Report Q4/2018

Pharma& Healthcare Expenditure $bn
ISPOR DUBAI Regional Conference 79
BMI Report Q4/2018
0 5 10 15 20 25
2016
2017
2018F
2019F
2020F
2021F
2022F
Health Spending USDbn Pharma Sele USDbn

Pharmaceutical Sale % of Health Expenditure
15
15.5
16
16.5
17
17.5
18
18.5
2016 2017 2018F 2019F 2020F 2021F 2022F
ISPOR DUBAI Regional Conference 80
BMI Report Q4/2018

Pharmaceutical Market Sale (2017 2.841 USDbn)
By Sub Sector
ISPOR DUBAI Regional Conference 81
BMI Q4-2018
1.914
0.528
0.399
Patent Generics OTC
Patent 67% Generics 19%OTC 14%

MOHAP MilestonesFor Pricing Medicines
ISPOR DUBAI Regional Conference 82
SN Initiatives Year
1 1st Pricing system: Total margin = 70% of CIF price(27.5% local agent and 42.5% Pharmacy) followed by 2 changes 2004 & 2005 affecting local margins
1985
2 Complains published in the media about high prices of medicines in the UAE 2009
3 CIF Price comparison study ( MOH study) 2010
4 As a result of the above study MOH start Price Reduction waves initiatives from 2011-2017 ( 7 waves)
2011
5 Current Pricing System-Key Changes (June 2013) 2013
6 MENA External Price Referencing (EPR) Survey, conducted by ISPOR Regional Chapters in the region
2014
7 GCC Price Harmonization: Dollarization & CIF Unification 2015
Continue
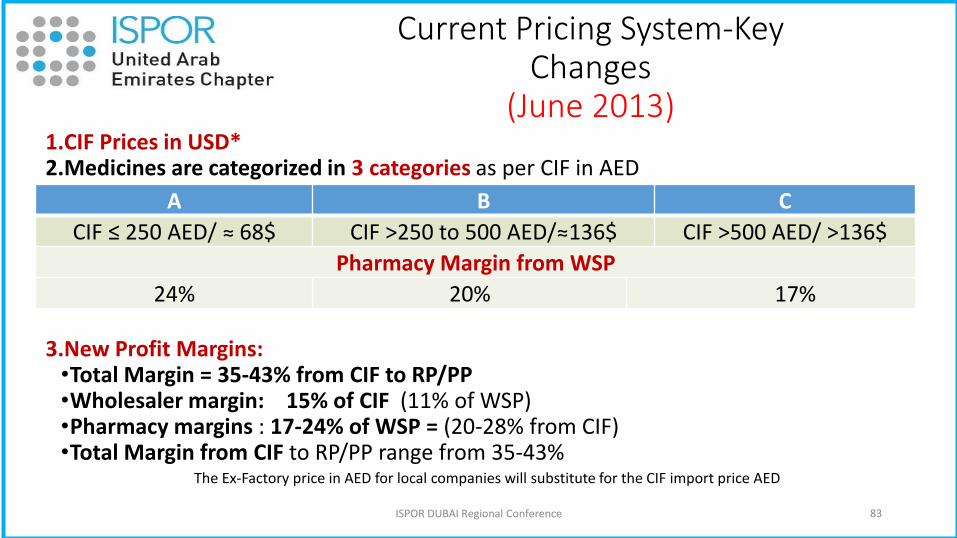
Current Pricing System-Key Changes
(June 2013) 1.CIF Prices in USD*2.Medicines are categorized in 3 categories as per CIF in AED
3.New Profit Margins: •Total Margin = 35-43% from CIF to RP/PP •Wholesaler margin: 15% of CIF (11% of WSP)•Pharmacy margins : 17-24% of WSP = (20-28% from CIF)•Total Margin from CIF to RP/PP range from 35-43%
ISPOR DUBAI Regional Conference 83
A B C
CIF ≤ 250 AED/ ≈ 68$ CIF >250 to 500 AED/≈136$ CIF >500 AED/ >136$
Pharmacy Margin from WSP
24% 20% 17%
The Ex-Factory price in AED for local companies will substitute for the CIF import price AED

▪ Pricing medication is controlled by government
▪ Public Pharmaceutical market procured by tendering
▪ >140 pharmaceutical factories operating across the region
▪ Local production dominated by Generic Manufacturers
▪ Strong dependence on imported finished products
▪ Strong dependence on imported raw materials
▪ There is a slowdown in the GDP growth as a result of low oil prices (regional challenges)
MENA Region : An Overview
ISPOR DUBAI Regional Conference 84

Are We Ready: For Using Economic Evaluation Formally?
ISPOR DUBAI Regional Conference 85
▪ Cost Effective Analysis (CEA); Budget Impact Analysis (BIA); HTA; Value Based Pricing & Pay for Performance/Managed Entry Agreement (MEAs) are an example for decision making tools that promote rational access to innovated medicines and facilitate the rational reimbursement decision
▪ However, Middle East countries & the UAE are relatively underdeveloped in applying PE/HE & HTA for formulary inclusion and reimbursement decisions
▪ Barriers to the use of economic evaluation are existing

The Situation In The UAE
▪ HCPs from around the world & mix education background▪ High potential for irrational use & wastage of HC resources ▪ Lack of updated Standard Treatment Guidelines for many diseases ▪ Lack of appropriate service training and education▪ Gaps in academic syllabus and the practice needs▪ Lack of valid willingness to pay per QALY▪ Lack of active communications between partners & Stakeholders▪ Relatively new health insurance & reimbursement system ▪ Lack of related regulations and mandates▪ Lack of healthcare data base▪ Lack of related drug use study and outcomes research▪ Lack of HE, PE & HTA infrastructure ▪ Lack of experts in HE, PE and Health Technology Assessment
ISPOR DUBAI Regional Conference 86

Challenges Towards Implementing HEOR, PE/HE & HTA
Major challenges need to get the right strong recommendations are:1. Lack of data & Lack of publication 2. Lack of professional manpower3. Budget impact analysis may provide more useful tool, needs how could promoted for
use4. Availability of HTA is long term objectives that need a strong infrastructure5. Quality healthcare services, Quality Education and capacity building are at the top of
the UAE government agenda in order to be among top countries as per UAE vision 20216. Value Assessment in Hospital Based-Formulary Management; within this, issues such as
the following may be elicited:• Multiple decision makers in these hospitals/Healthcare organisations may have
different evidence needs.• How could Rapid Review of evidence provide timely decision making in a dynamic
environment, yet relevant to all decision makers.
ISPOR DUBAI Regional Conference 87

What We Need ?
1. Active communication/collaboration2. Appropriate education for decision makers, healthcare professionals and the public3. HE, PE & HTA infrastructure:
• Independent HTA Agency• Related regulations and mandates • Pharmaceutical/ HCS Database• Implemented PE/HE Guideline• Valid willing to pay value per QALY/LYG • Related studies & outcomes research• Dynamic Clinical Guideline(s) • Education and training for decision makers, healthcare professionals and the public• Develop UAE patients advocate
ISPOR DUBAI Regional Conference 88

Proposed Strategic Plan: Implementing PE/HTA
I. Short Term Plan ( 1-5 years)
II. Long Term Plan ( >5years)
ISPOR DUBAI Regional Conference 89
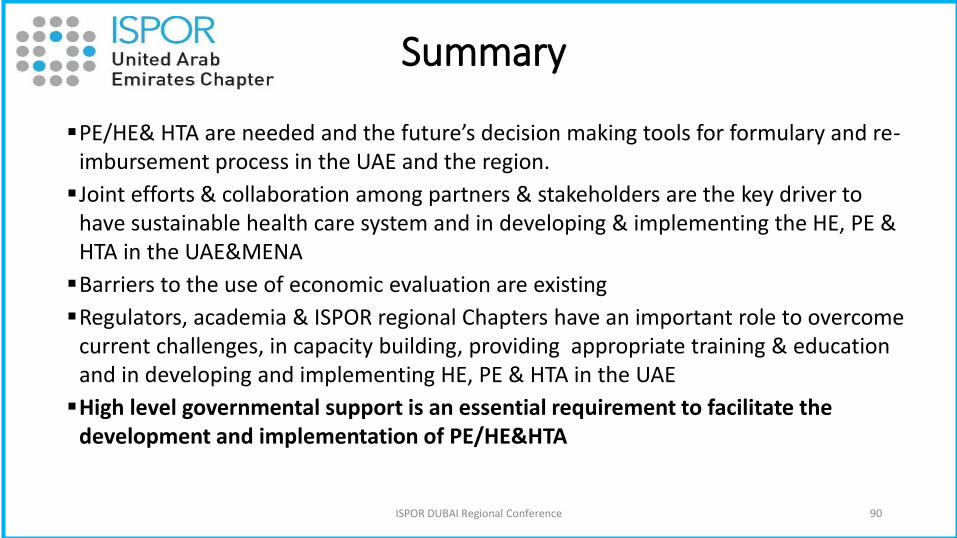
Summary
▪PE/HE& HTA are needed and the future’s decision making tools for formulary and re-imbursement process in the UAE and the region.
▪Joint efforts & collaboration among partners & stakeholders are the key driver to have sustainable health care system and in developing & implementing the HE, PE & HTA in the UAE&MENA
▪Barriers to the use of economic evaluation are existing
▪Regulators, academia & ISPOR regional Chapters have an important role to overcome current challenges, in capacity building, providing appropriate training & education and in developing and implementing HE, PE & HTA in the UAE
▪High level governmental support is an essential requirement to facilitate the development and implementation of PE/HE&HTA
ISPOR DUBAI Regional Conference 90

The Way Forward: UAE VISION 2021
ISPOR DUBAI Regional Conference 91
“With our Citizens at the
heart of development,
we strive to become one
of the most competitive
countries in the world”
His Highness Sheikh
Mohammed Bin Rashid
Al Maktoom

22-26 Sep 2019FIP Congress in ABU Dhabi
9/20/2018 ISPOR DUBAI Regional Conference 92
SAVE THIS DAYS

Key Resources▪ Ministry of Economy www.economy.gov.ae▪ UAE Statistics www.uaestatistics.gov.ae▪ BMI Q4-2018 report▪ MOHAP Data www.mohap.gov.ae▪ World Bank Reports www.worldbank.org▪ The IMD World Competitiveness Centre https://www.imd.org/wcc/world-competitiveness-center-
rankings/world-competitiveness-ranking-2018▪ www.ispor.org• Jomkwan Yothasamut, Sripen Tantivess, Yot Teerawattananon. Using Economic Evaluation in Policy
Decision-Making in Asian Countries: Mission Impossible or Mission Probable? (ISPOR) 1098-3015/09/S26• Güvenç Koçkaya, Albert Wertheimer; Ola Al Ahdab & et al. Pharmaceutical Market Access in Emerging
Markets book, (Chapter 6: Market Access in the United Arab Emirates and selected Middle Eastern Countries -Pages 129-162)
• Al Ahdab, O. (2008). Role of Pharmacoeconomics in Clinical Pharmacy Service Development. PhD thesis, Queen's University, School of Pharmacy.
ISPOR DUBAI Regional Conference 93

Role of HEOR in Decision Making: Global Knowledge for Local Application
Ola Ghaleb Al Ahdab, PhDMinistry of Health and Prevention
United Arab Emirates
Dan Malone, RPh, PhD, FAMCPUniversity of Arizona
Tucson, AZ, USA
Darrin Baines, PhDBournemouth UniversityPoole, United Kingdom
Sherif Abaza, MBASyreon Middle East
Egypt