rockonomics: economics & public policy in the rock & roll industry economics of ticket...
TRANSCRIPT

Rockonomics: Economics & Public Policy in the Rock & Roll Industry
• Economics of Ticket Pricing
• Industry Trends
• Long-Run Explanations Superstar Model
Baumol & Bowen’s Disease Wealth Effects• Short-Run Explanations
Concentration Complimentary Goods Under Priced Asset
Alan B. Krueger

“Somebody said to me, ‘But the Beatles were antimaterialistic.’ That’s a huge myth. John and I literally used to sit down and say, ‘Now, let’s write a swimming pool.”
-- Paul McCartney
“[I]n some fashion, I help people hold on to their own humanity, if I'm doing my job right.”
-- Bruce Springsteen
“I don’t see how carving out the best seats and charging a lot more for them has anything to do with rock & roll.”
-- Tom Petty
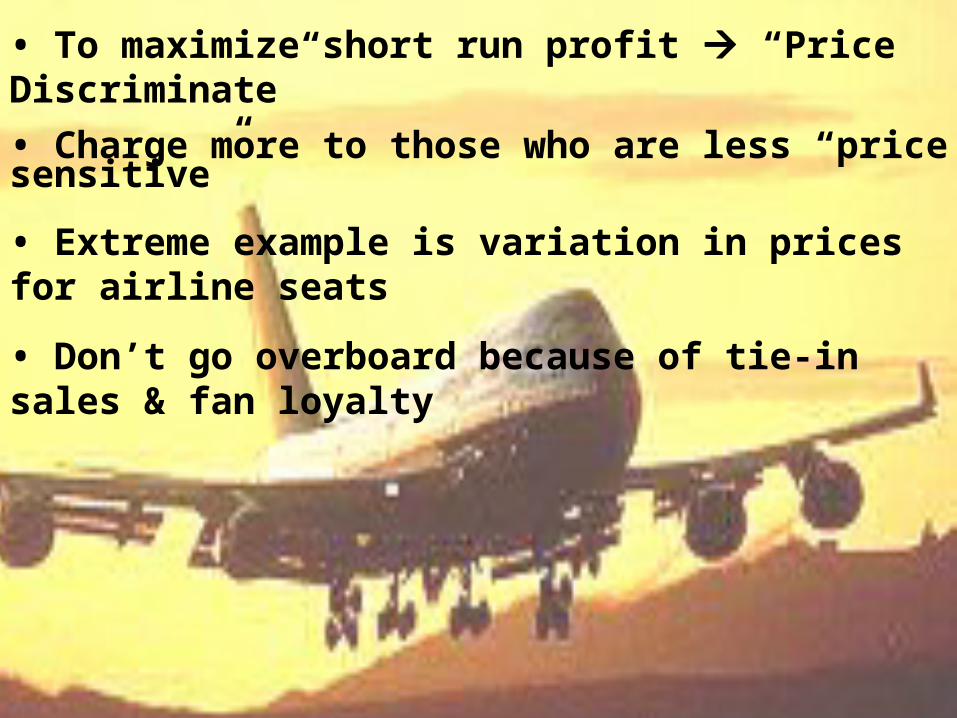
• To maximize short run profit “Price Discriminate”
• Charge more to those who are less “price sensitive”
• Extreme example is variation in prices for airline seats
• Don’t go overboard because of tie-in sales & fan loyalty

Seven Lessons from Super Bowl SundayNew York Times
• List price was $325 in 2000; market price was around $2,500
• Secondary market develops if price too low, but its size can be exaggerated (20%)
• Endowment effect
• NFL could raise short-run profit by raising prices
• But NFL wants to reward loyal fans to build enterprise
• Besides, 60% of $4 billion of football revenue from TV
• “Gift Exchange”


Figure 1: Average Price per Ticket and Overall Infl ation Rate, 1981-2003
10
20
30
40
50
60
1981 1982 1983 1984 1985 1986 1987 1988 1989 1990 1991 1992 1993 1994 1995 1996 1997 1998 1999 2000 2001 2002 2003
CPI
Avg.Price
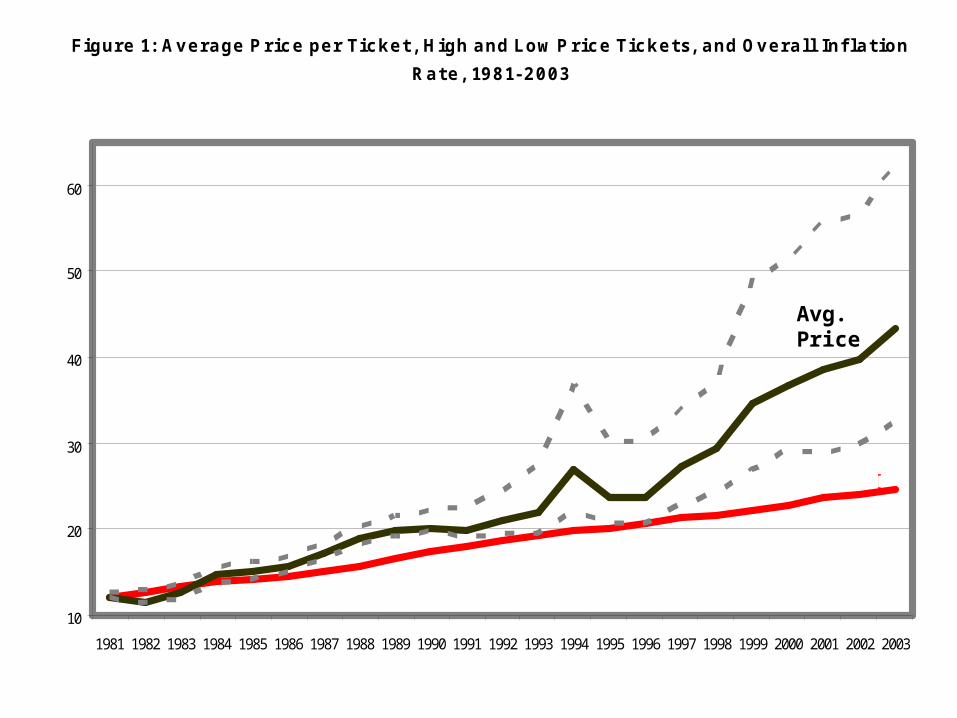
Figure 1: Average Price per Ticket, High and Low Price Tickets, and Overall Infl ation
Rate, 1981-2003
10
20
30
40
50
60
1981 1982 1983 1984 1985 1986 1987 1988 1989 1990 1991 1992 1993 1994 1995 1996 1997 1998 1999 2000 2001 2002 2003
CPI
Avg.Price

0.301
0.255
0.207
0.620
0.206
0.243
0.1520.128
0.000
0.100
0.200
0.300
0.400
0.500
0.600
0.700
1981-86 1986-91 1991-96 1996-01Per iod
Avg. Ticket
CPI
Ticket Prices Soared Relative to Overall Price Inflation the Last 5 Years Proportionate Price Growth
Pro
port
iona
te G
row
th
© Alan B. Krueger, 2002.
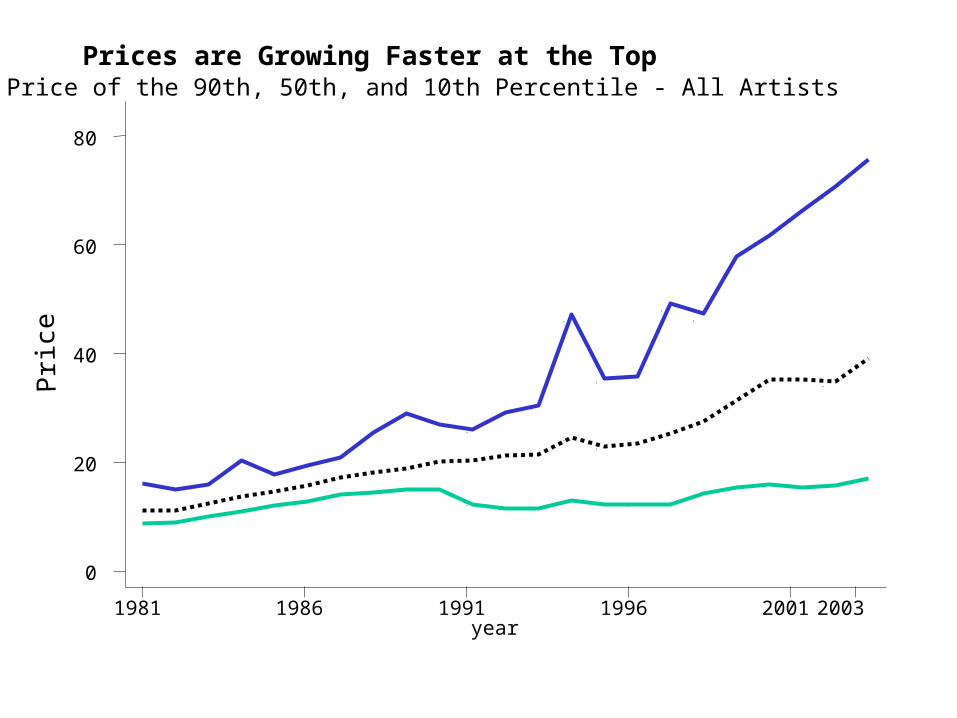
Price of the 90th, 50th, and 10th Percentile - All Artists
year1981 1986 1991 1996 2001 2003
0
20
40
60
80
Pri
cePrices are Growing Faster at the Top
Further Analysis
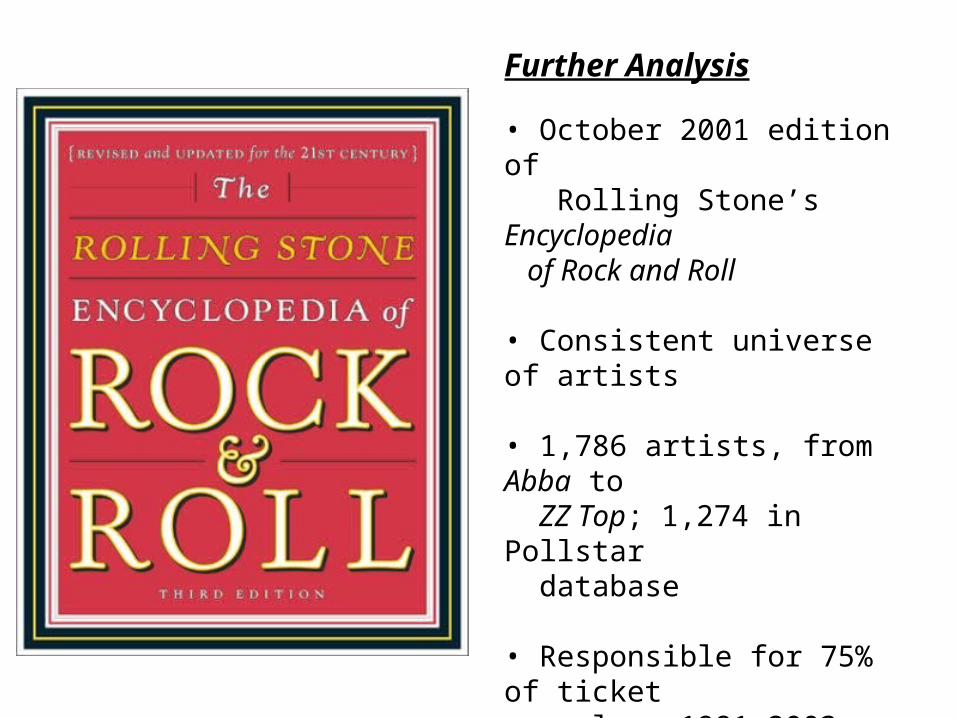
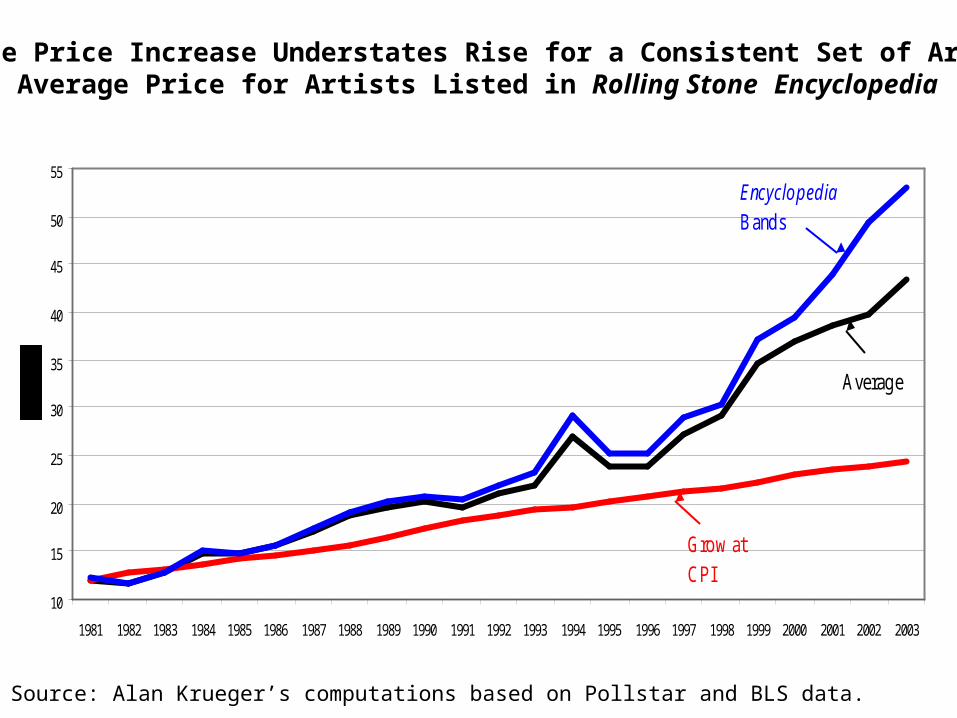
• October 2001 edition of Rolling Stone’s Encyclopedia of Rock and Roll
• Consistent universe of artists
• 1,786 artists, from Abba to ZZ Top; 1,274 in Pollstar database
• Responsible for 75% of ticket sales, 1981-2003.
• Merged on additional data: year formed; gender; genre; prominence (mm)
10
15
20
25
30
35
40
45
50
55
1981 1982 1983 1984 1985 1986 1987 1988 1989 1990 1991 1992 1993 1994 1995 1996 1997 1998 1999 2000 2001 2002 2003
EncyclopediaBands
Average
Grow atCPI
Average Price Increase Understates Rise for a Consistent Set of Artists Average Price for Artists Listed in Rolling Stone Encyclopedia
Source: Alan Krueger’s computations based on Pollstar and BLS data.

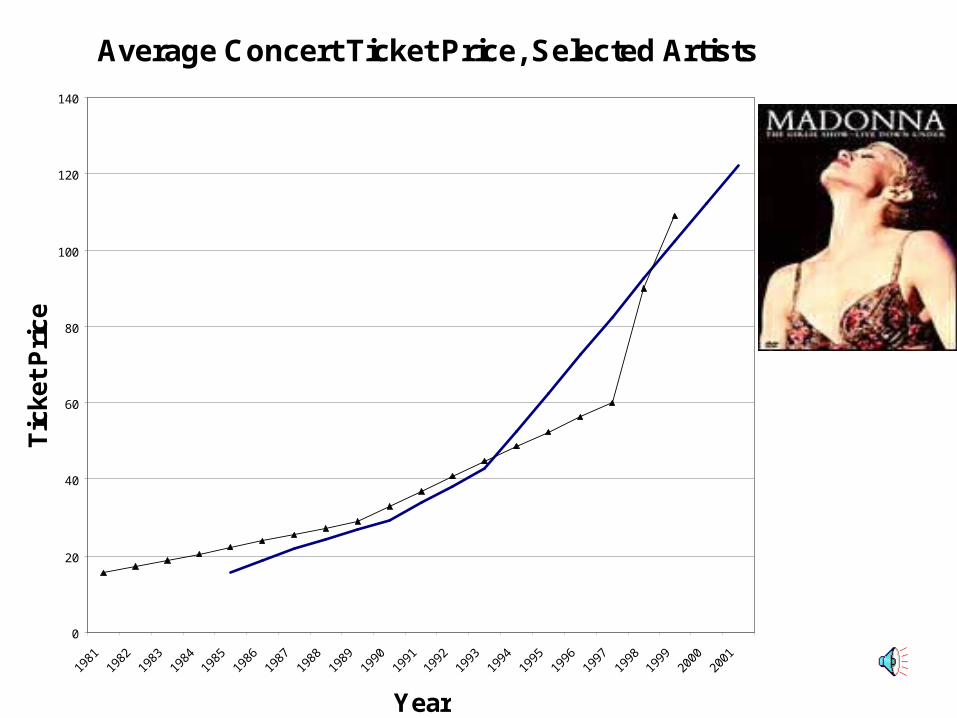
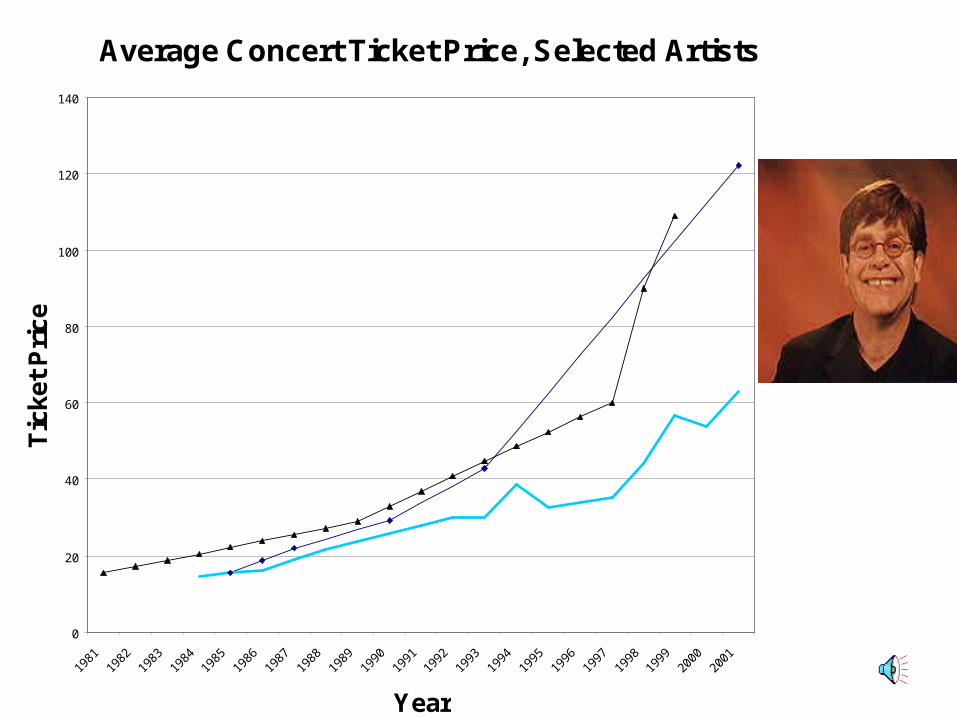
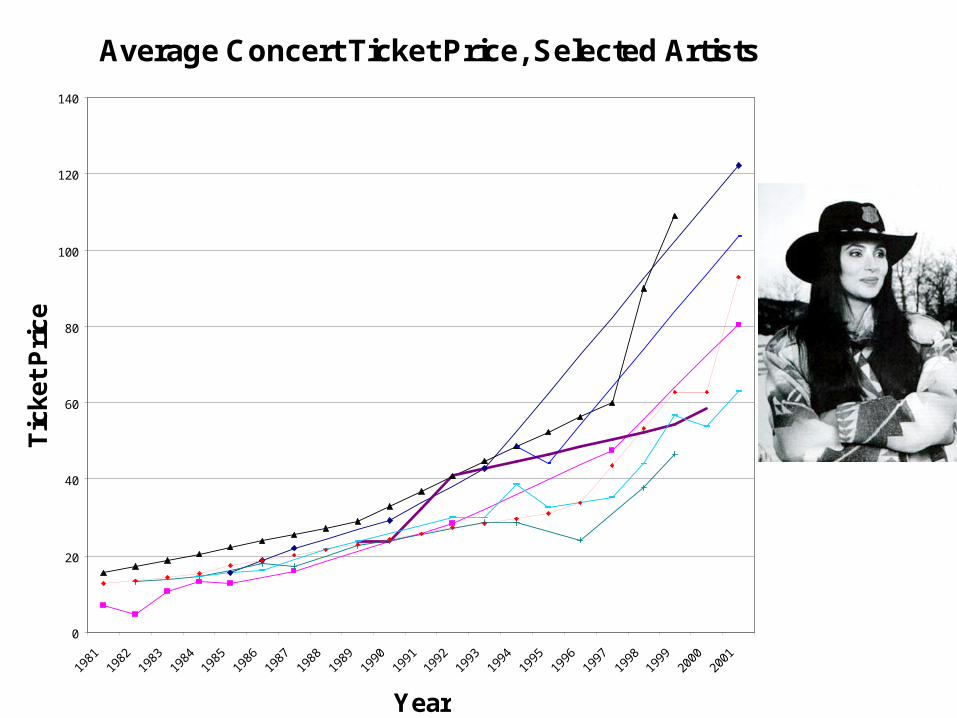
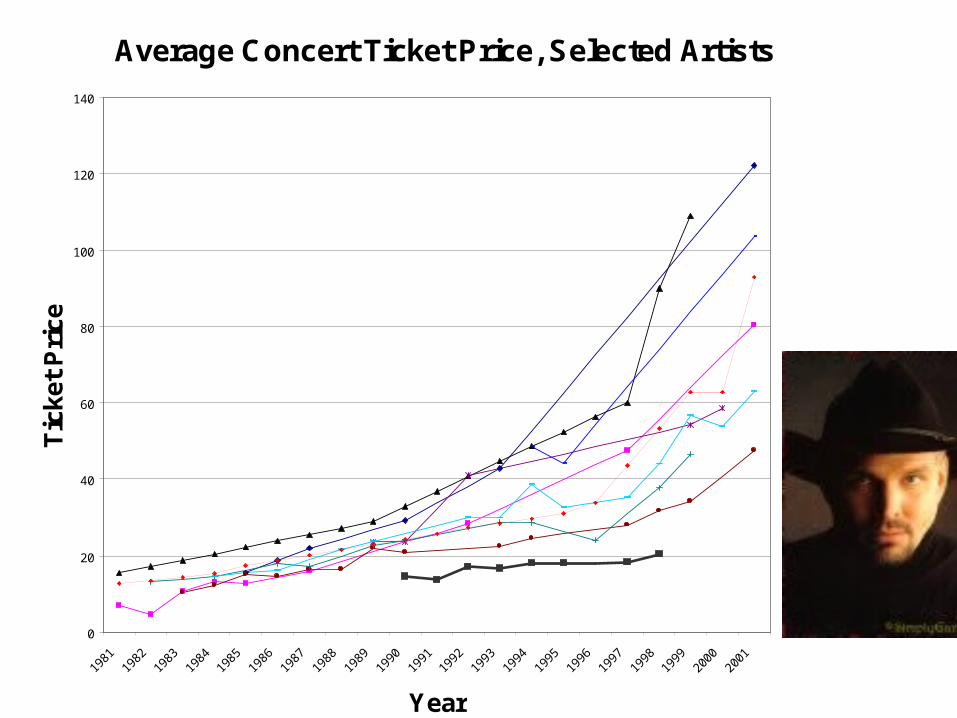
Average Concert Ticket Price, Selected Artists
0
20
40
60
80
100
120
140
1981
1982
1983
1984
1985
1986
1987
1988
1989
1990
1991
1992
1993
1994
1995
1996
1997
1998
1999
2000
2001
Year
Tic
ket
Pri
ce
Average Concert Ticket Price, Selected Artists
0
20
40
60
80
100
120
140
1981
1982
1983
1984
1985
1986
1987
1988
1989
1990
1991
1992
1993
1994
1995
1996
1997
1998
1999
2000
2001
Year
Tic
ket
Pri
ce
Average Concert Ticket Price, Selected Artists
0
20
40
60
80
100
120
140
1981
1982
1983
1984
1985
1986
1987
1988
1989
1990
1991
1992
1993
1994
1995
1996
1997
1998
1999
2000
2001
Year
Tic
ket
Pri
ce

Average Concert Ticket Price, Selected Artists
0
20
40
60
80
100
120
140
1981
1982
1983
1984
1985
1986
1987
1988
1989
1990
1991
1992
1993
1994
1995
1996
1997
1998
1999
2000
2001
Year
Tic
ket
Pri
ce

Average Concert Ticket Price, Selected Artists
0
20
40
60
80
100
120
140
1981
1982
1983
1984
1985
1986
1987
1988
1989
1990
1991
1992
1993
1994
1995
1996
1997
1998
1999
2000
2001
Year
Tic
ket
Pri
ce

Average Concert Ticket Price, Selected Artists
0
20
40
60
80
100
120
140
1981
1982
1983
1984
1985
1986
1987
1988
1989
1990
1991
1992
1993
1994
1995
1996
1997
1998
1999
2000
2001
Year
Tic
ket
Pri
ce

Average Concert Ticket Price, Selected Artists
0
20
40
60
80
100
120
140
1981
1982
1983
1984
1985
1986
1987
1988
1989
1990
1991
1992
1993
1994
1995
1996
1997
1998
1999
2000
2001
Year
Tic
ket
Pri
ce
Average Concert Ticket Price, Selected Artists
0
20
40
60
80
100
120
140
1981
1982
1983
1984
1985
1986
1987
1988
1989
1990
1991
1992
1993
1994
1995
1996
1997
1998
1999
2000
2001
Year
Tic
ket
Pri
ce

Average Concert Ticket Price, Selected Artists
0
20
40
60
80
100
120
140
1981
1982
1983
1984
1985
1986
1987
1988
1989
1990
1991
1992
1993
1994
1995
1996
1997
1998
1999
2000
2001
Year
Tic
ket
Pri
ce
Average Concert Ticket Price, Selected Artists
0
20
40
60
80
100
120
140
1981
1982
1983
1984
1985
1986
1987
1988
1989
1990
1991
1992
1993
1994
1995
1996
1997
1998
1999
2000
2001
Year
Tic
ket
Pri
ce
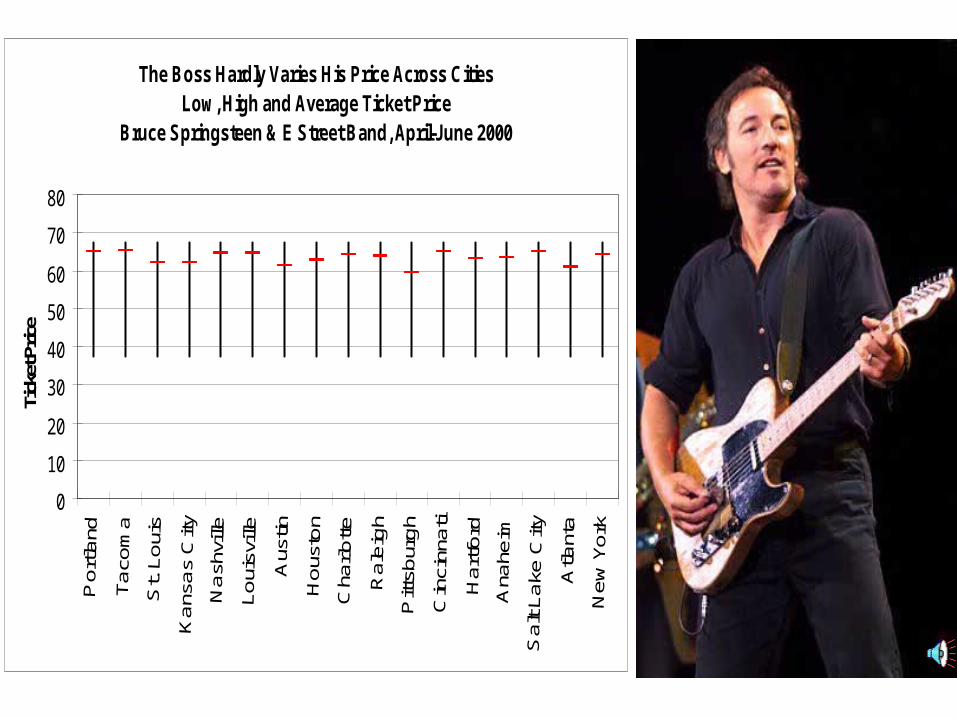
The Boss Hardly Varies His Price Across CitiesLow, High and Average Ticket Price
Bruce Springsteen & E Street Band, April-J une 2000
0
10
20
30
40
50
60
70
80
Tick
et P
rice

Figure 4a: Number of Shows Each YearRolling Stone Encyclopedia Artists
0
1000
2000
3000
4000
5000
6000
7000
8000
1982 1983 1984 1985 1986 1987 1988 1989 1990 1991 1992 1993 1994 1995 1996 1997 1998 1999 2000 2001 2002 2003
Num
ber
of S
how
s
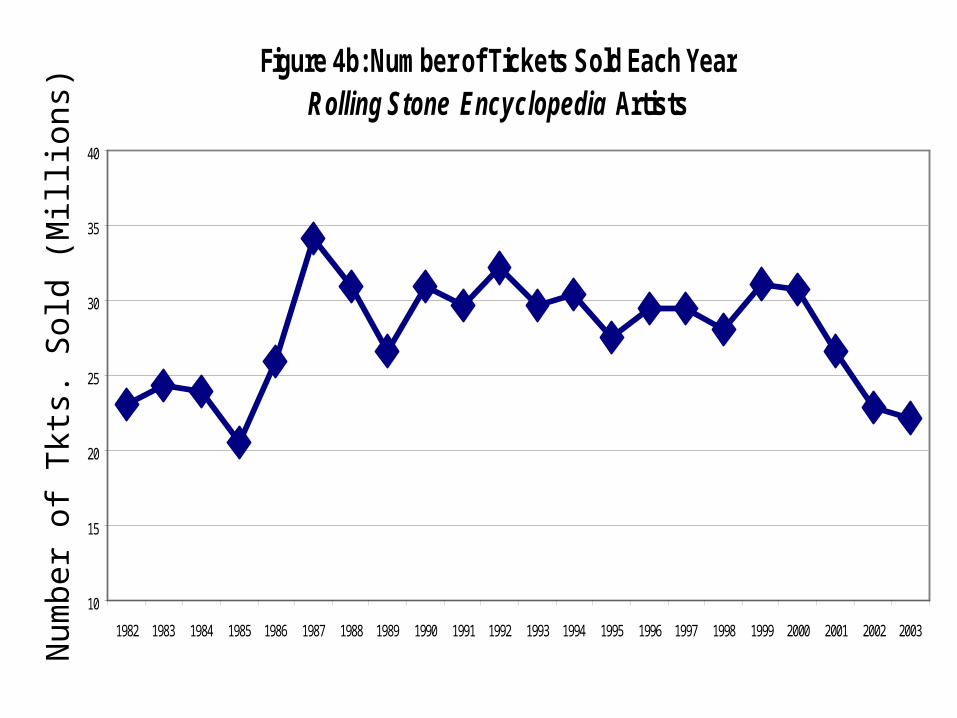
Figure 4b: Number of Tickets Sold Each YearRolling Stone Encyclopedia Artists
10
15
20
25
30
35
40
1982 1983 1984 1985 1986 1987 1988 1989 1990 1991 1992 1993 1994 1995 1996 1997 1998 1999 2000 2001 2002 2003
Num
ber
of T
kts.
Sol
d (M
illi
ons)
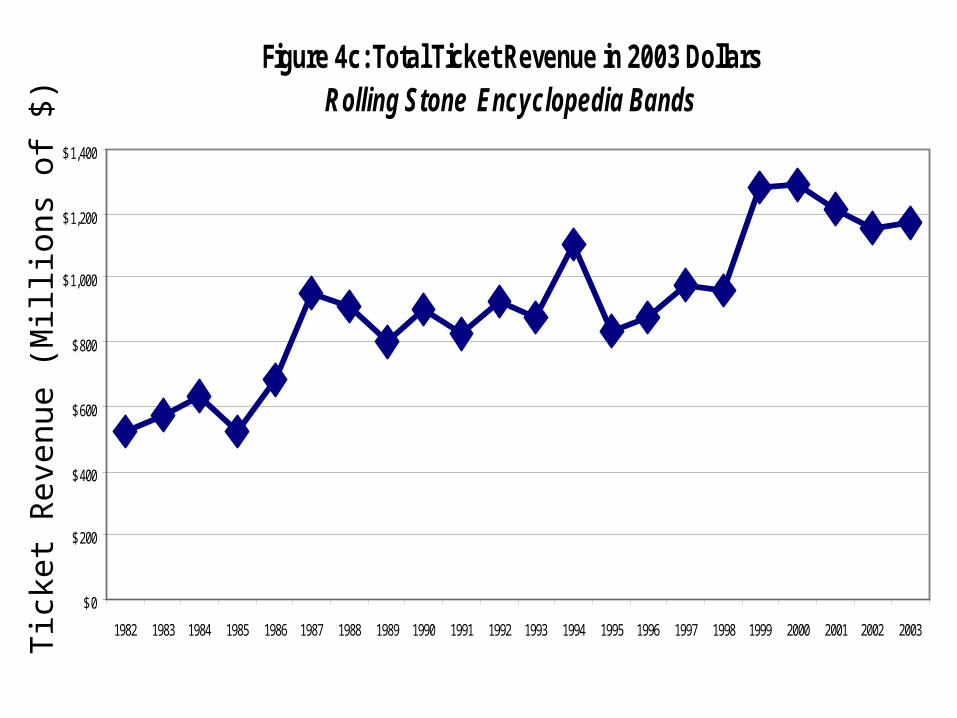
Figure 4c: Total Ticket Revenue in 2003 DollarsRolling Stone Encyclopedia Bands
$0
$200
$400
$600
$800
$1,000
$1,200
$1,400
1982 1983 1984 1985 1986 1987 1988 1989 1990 1991 1992 1993 1994 1995 1996 1997 1998 1999 2000 2001 2002 2003
Tic
ket R
even
ue (
Mil
lion
s of
$)
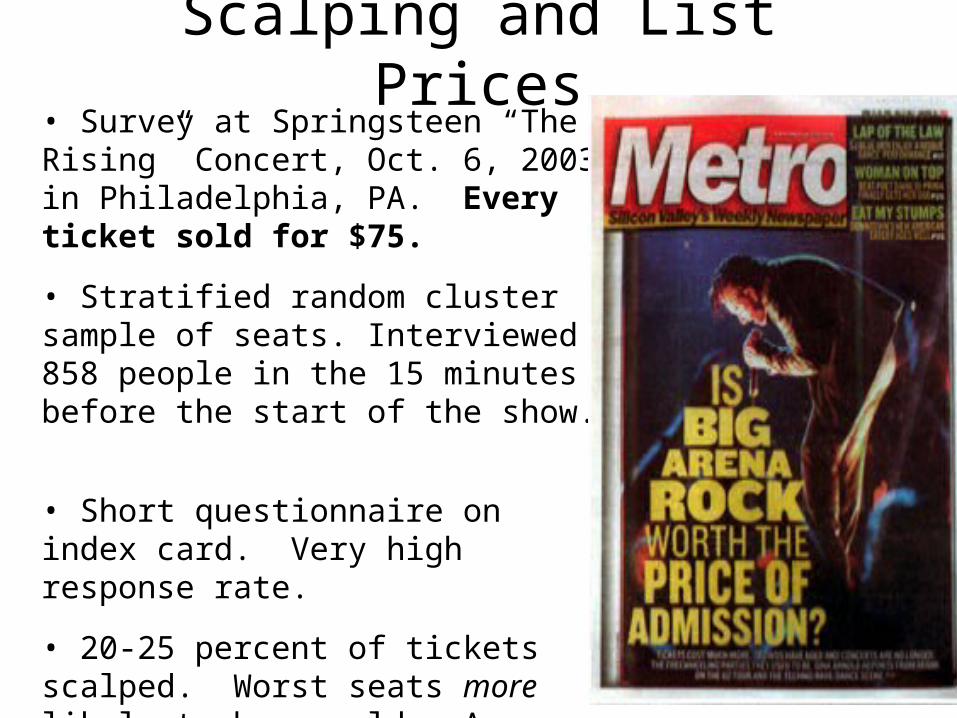
Scalping and List Prices• Survey at Springsteen “The Rising” Concert, Oct. 6, 2003 in Philadelphia, PA. Every ticket sold for $75.
• Stratified random cluster sample of seats. Interviewed 858 people in the 15 minutes before the start of the show.
• Short questionnaire on index card. Very high response rate.
• 20-25 percent of tickets scalped. Worst seats more likely to be resold. Average resale price was $300.
• Springsteen gave away $3 million in consumer surplus
Explanations For Two Key Facts Need To Be Found:
• Long run faster growth in concert prices than inflation
• Short-run acceleration in prices the last 5 years
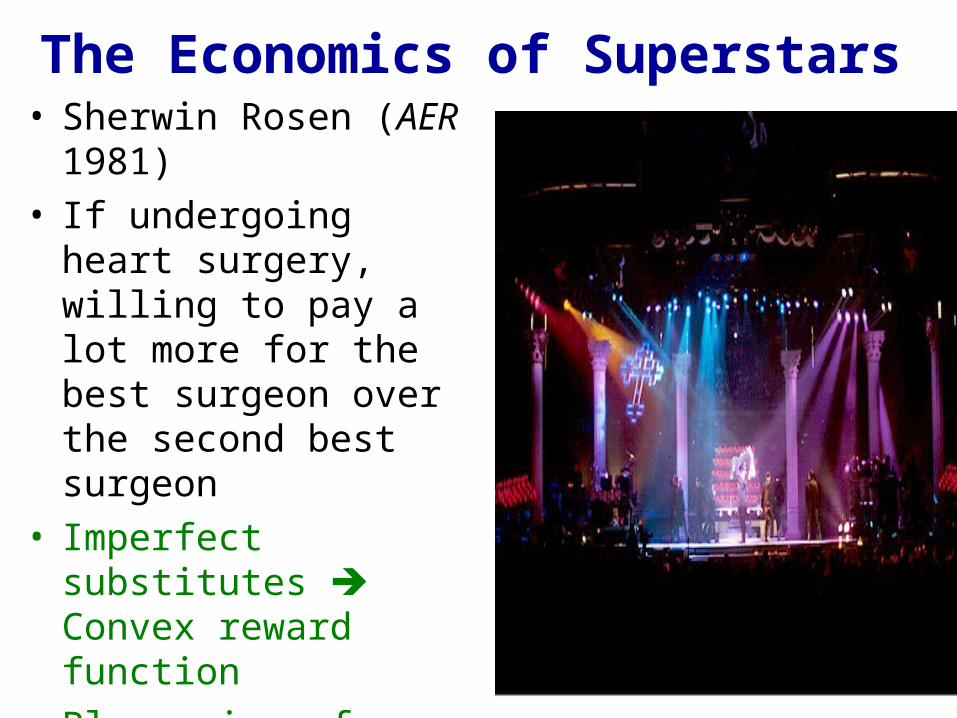
The Economics of Superstars • Sherwin Rosen (AER 1981) • If undergoing heart surgery,
willing to pay a lot more for the best surgeon over the second best surgeon
• Imperfect substitutes Convex reward function
• Plus, size of market Best can reach more customers
• Human capital would not have a linear effect – twice as good paid more than twice as much

• Superstars are known to a broader audience because of technology
• Improved technology differentiates the best from the rest and permits bigger audience (unlike Ms. Billington)
• Demand to hear the very best is higher
• Rewards for the best should rise
Apply to Rock & Roll
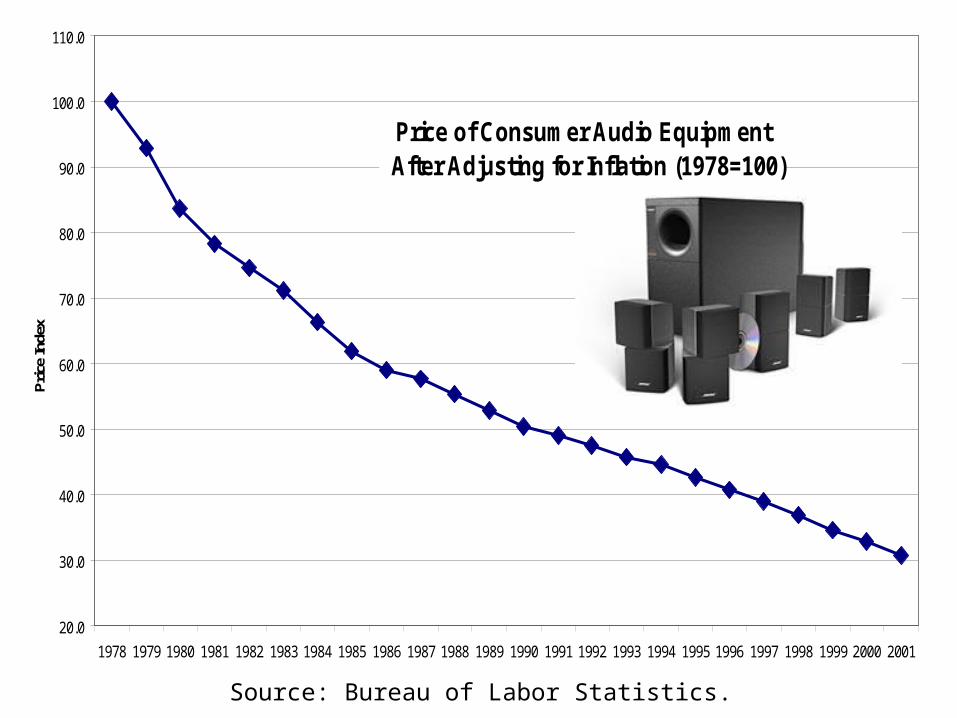
Price of Consumer Audio Equipment After Adjusting for Inflation (1978=100)
20.0
30.0
40.0
50.0
60.0
70.0
80.0
90.0
100.0
110.0
1978 1979 1980 1981 1982 1983 1984 1985 1986 1987 1988 1989 1990 1991 1992 1993 1994 1995 1996 1997 1998 1999 2000 2001
Pri
ce In
dex
Source: Bureau of Labor Statistics.

0%
20%
40%
60%
80%
100%
1982 1983 1984 1985 1986 1987 1988 1989 1990 1991 1992 1993 1994 1995 1996 1997 1998 1999 2000 2001 2002 2003
Year
The Top Artists are Getting a Larger Share of Total Ticket Revenue
Top 1 Percent
Top 2-5 Percent
Everybody Else
84%
Source: Calculated by Alan Krueger based on Pollstar data.
56%
Top 1% 14.6%
26%
62%

Novel measure of “Star Quality”:
Amount written about artist in Rolling Stone’sEncyclopedia of Rock & Roll
Measured in millimeters to be scientific

399 mm
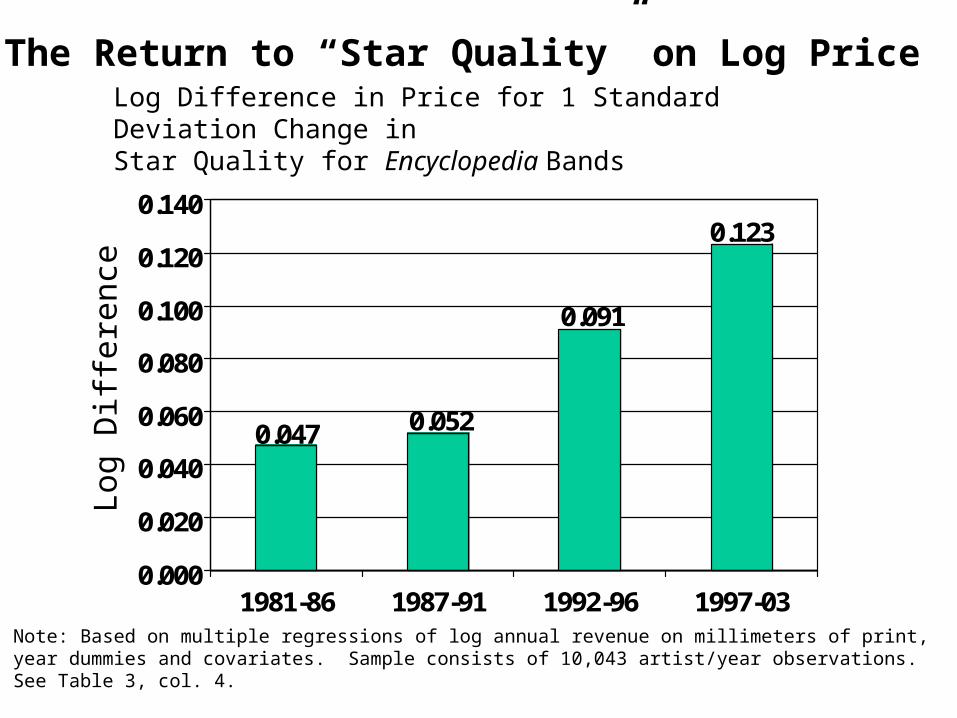
0.047 0.052
0.091
0.123
0.000
0.020
0.040
0.060
0.080
0.100
0.120
0.140
1981-86 1987-91 1992-96 1997-03
Log Difference in Price for 1 Standard Deviation Change in Star Quality for Encyclopedia Bands
The Return to “Star Quality” on Log PriceL
og D
iffe
renc
e
Note: Based on multiple regressions of log annual revenue on millimeters of print, year dummies and covariates. Sample consists of 10,043 artist/year observations. See Table 3, col. 4.
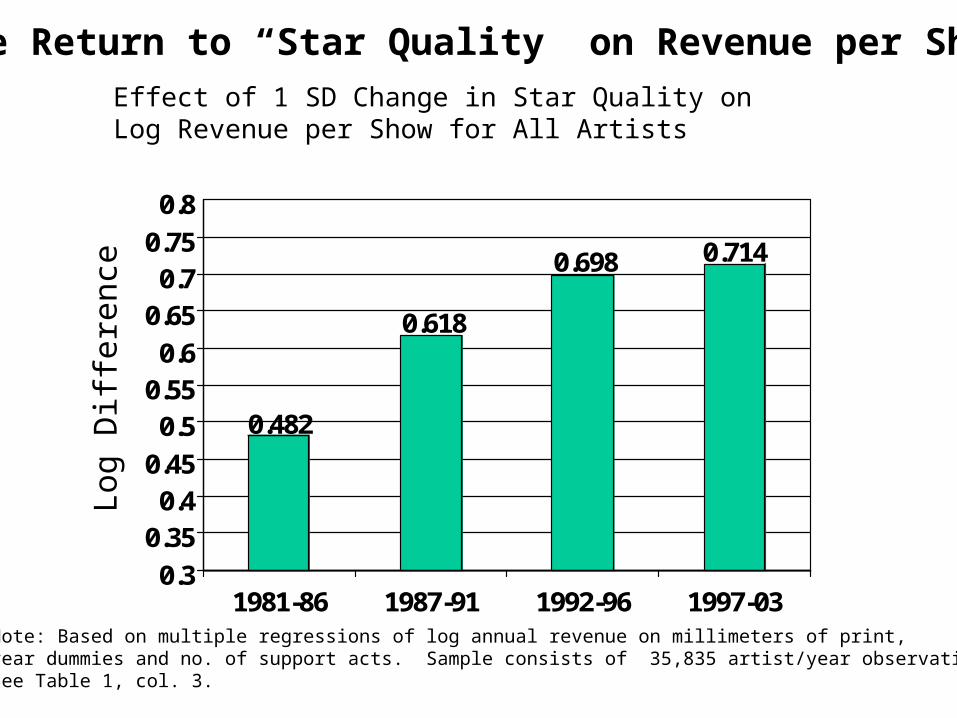
0.482
0.618
0.698 0.714
0.3
0.350.4
0.45
0.50.550.6
0.650.7
0.75
0.8
1981-86 1987-91 1992-96 1997-03
Effect of 1 SD Change in Star Quality on Log Revenue per Show for All Artists
The Return to “Star Quality” on Revenue per Show
Log
Dif
fere
nce
Note: Based on multiple regressions of log annual revenue on millimeters of print, year dummies and no. of support acts. Sample consists of 35,835 artist/year observations. See Table 1, col. 3.

0.492
0.532 0.528
0.440
0.3
0.35
0.4
0.45
0.5
0.55
0.6
1981-86 1987-91 1992-96 1997-03
Effect of 1 SD Change in Star Quality on Log Revenue per Show for Encyclopedia Bands
The Return to “Star Quality” on Revenue per Show
Log
Dif
fere
nce
Note: Based on multiple regressions of log annual revenue on millimeters of print, year dummies and covariates. Sample consists of 10,043 artist/year observations. \See Table 3, col. 6.
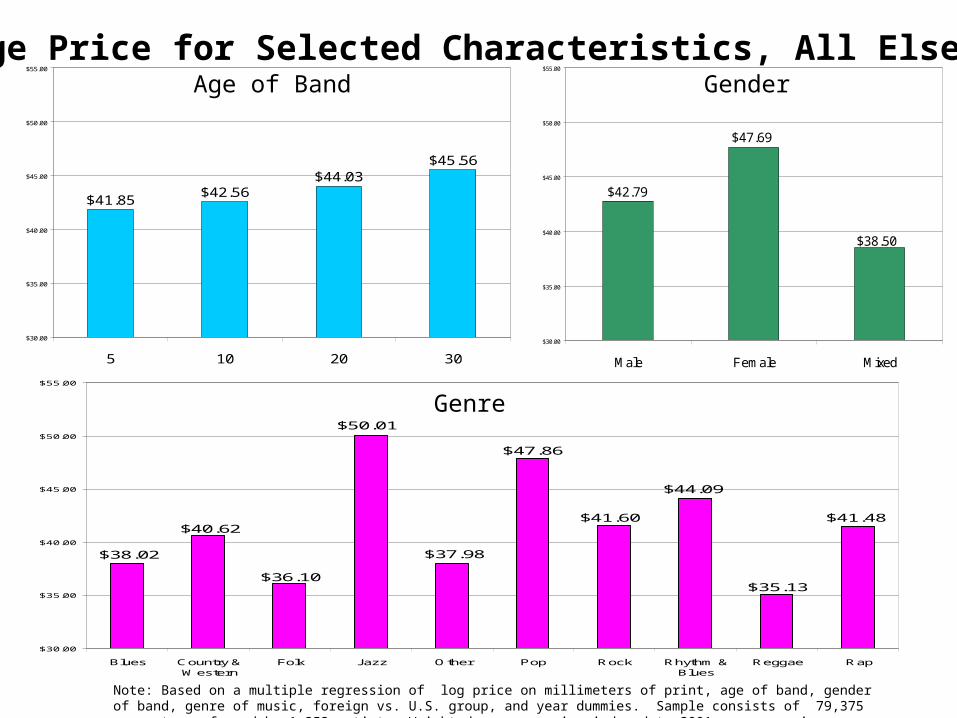
$42.79
$47.69
$38.50
$30.00
$35.00
$40.00
$45.00
$50.00
$55.00
Male Female Mixed
GenderAge of Band
Genre
Note: Based on a multiple regression of log price on millimeters of print, age of band, gender of band, genre of music, foreign vs. U.S. group, and year dummies. Sample consists of 79,375 concerts performed by 1,253 artists. Weighted average price indexed to 2001 average price.
Average Price for Selected Characteristics, All Else Equal
$41.85$42.56
$44.03$45.56
$30.00
$35.00
$40.00
$45.00
$50.00
$55.00
5 10 20 30
$36.10
$40.62
$38.02
$50.01
$37.98
$47.86
$41.60
$44.09
$35.13
$41.48
$30.00
$35.00
$40.00
$45.00
$50.00
$55.00
Blues Country &Western
Folk Jazz Other Pop Rock Rhythm &Blues
Reggae Rap

Tina Turner: What’s Age Got to Do With It?As Artists Age, the High-Low Ticket Price Ratio Rises
Rat
io o
f H
igh
to L
ow
Pric
e
1982 1986 1991 1996 2000
1
1.5
2
2.5

Baumol and Bowen’s Disease• Takes same amount of time
and input to play Free Bird
• Concerts are a low productivity growth sector (modular technological change)
• Would expect prices in low productivity growth sectors to grow relatively quickly
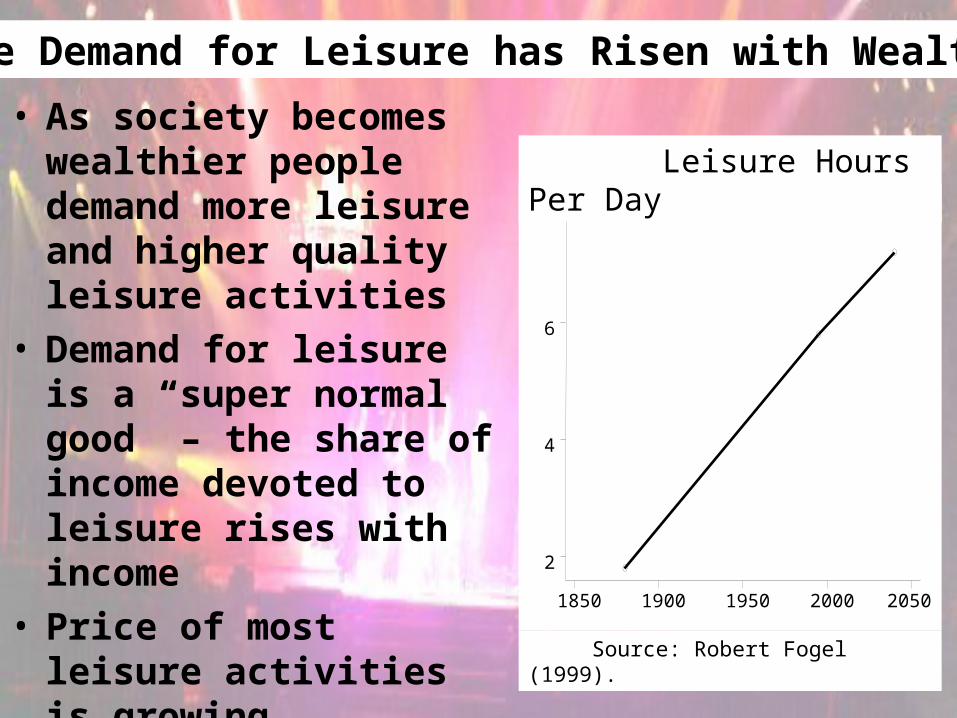
• As society becomes wealthier people demand more leisure and higher quality leisure activities
• Demand for leisure is a “super normal good” – the share of income devoted to leisure rises with income
• Price of most leisure activities is growing relatively fast
• The demand for leisure is likely to continue to grow
The Demand for Leisure has Risen with Wealth
1850 1900 1950 2000 2050
2
4
6
8
Leisure Hours Per Day
Source: Robert Fogel (1999).


Concert Tickets versus Movie, Theater, and Sports TicketsConcert Venue Price Index versus CPI for Movie, Theater and Sports Events
0.427
0.278
0.207
0.546
0.3320.358
0.252 0.241
0.000
0.100
0.200
0.300
0.400
0.500
0.600
1981-86 1986-91 1991-96 1996-01
Per iod
Concerts
Movies, Sports & Theater
Prop
orti
onat
e G
row
th in
Pri
ce
© Alan B. Krueger, 2002.

What Explains Recent Price Growth?
• Production Costs Increased
• Consolidation
• Decline in Complementary Revenue Source: Record Sales
• Undervalued Asset

Industry Consolidation
• Vertical Concentration
- Venues
- Radio
- Marketing, etc.• Horizontal
Concentration - SFX, Clear Channel
ClearChannel

Telecommunications Act of 1996• Signed Feb. 8, 1996• Prior to 1996 Act, radio
stations could own just 40 stations nationally, and 2 in a market
• Cap eliminated nationwide, and raised to 8 in a market
• Since 1996, 10,000 radio station transactions worth $100 billion
• Further legislation could lead to consolidation with TV and newspapers
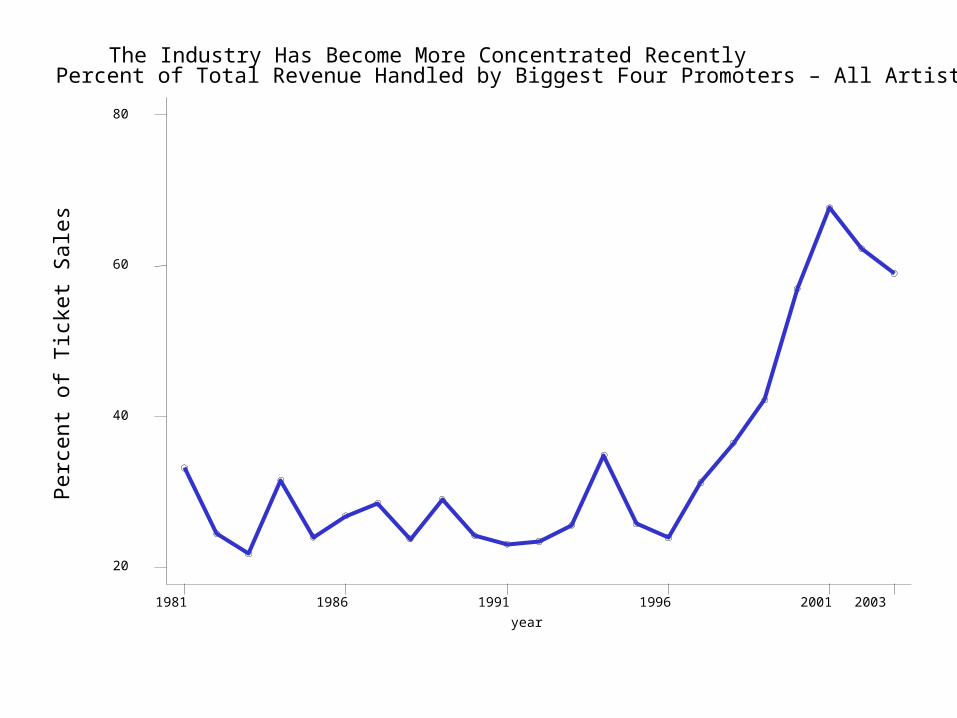
The Industry Has Become More Concentrated RecentlyPercent of Total Revenue Handled by Biggest Four Promoters – All Artists
year
1981 1986 1991 1996 2001 2003
20
40
60
80
Per
cent
of T
icke
t Sal
es

1981 1986 1991 1996 2001 2003
20
40
60
80
Nationally, the Industry Has Become More Concentrated RecentlyPercent of Total Revenue Handled by Biggest Four Promoters - Top Artists
Per
cent
of T
icke
t Sal
es
Source: Calculated by Alan Krueger based on Pollstar data. Only concerts performed in theU.S. are included in the analysis. Sample consists of artists listed in Rolling Stone Encyclopedia.
41%CC

Figure 4a: Number of Shows Each YearRolling Stone Encyclopedia Artists
0
1000
2000
3000
4000
5000
6000
7000
8000
1982 1983 1984 1985 1986 1987 1988 1989 1990 1991 1992 1993 1994 1995 1996 1997 1998 1999 2000 2001 2002 2003
Num
ber
of S
how
s
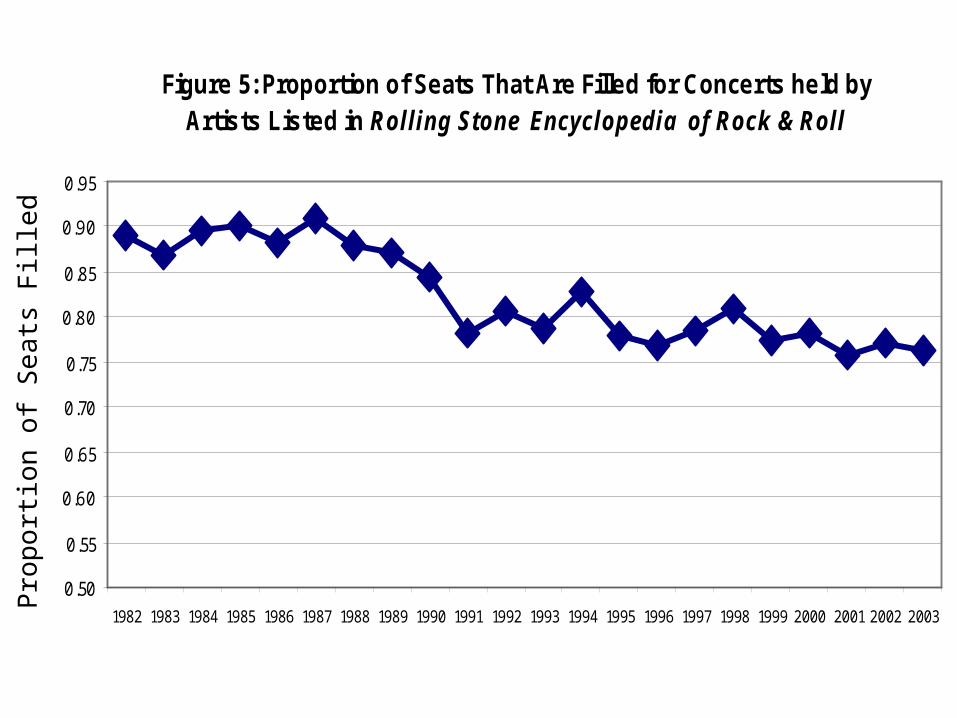
Figure 5: Proportion of Seats That Are Filled for Concerts held byArtists Listed in Rolling Stone Encyclopedia of Rock & Roll
0.50
0.55
0.60
0.65
0.70
0.75
0.80
0.85
0.90
0.95
1982 1983 1984 1985 1986 1987 1988 1989 1990 1991 1992 1993 1994 1995 1996 1997 1998 1999 2000 2001 2002 2003
Pro
port
ion
of S
eats
Fill
ed
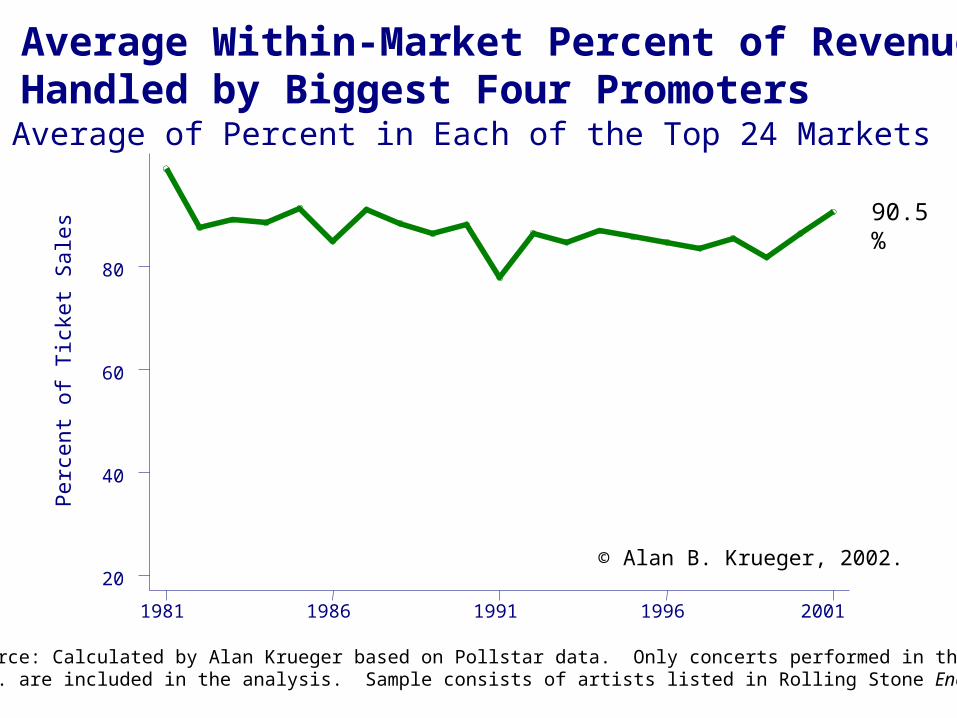
90.5%
Average Within-Market Percent of Revenue Handled by Biggest Four Promoters
Average of Percent in Each of the Top 24 Markets
Per
cent
of
Tic
ket S
ales
1981 1986 1991 1996 2001
20
40
60
80
Source: Calculated by Alan Krueger based on Pollstar data. Only concerts performed in theU.S. are included in the analysis. Sample consists of artists listed in Rolling Stone Encyclopedia.
© Alan B. Krueger, 2002.
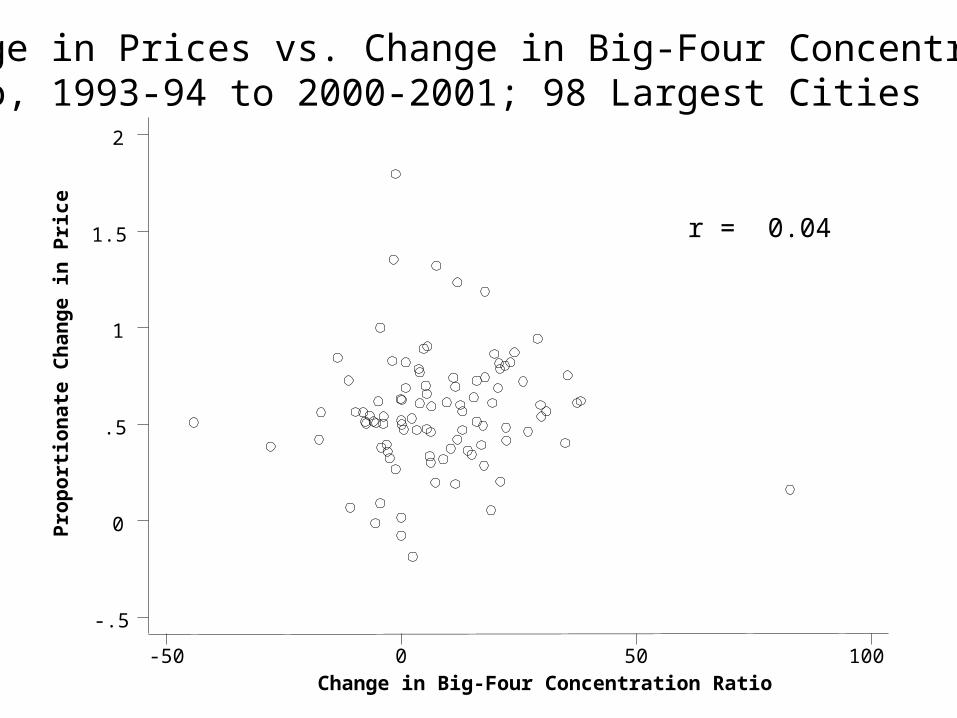
Change in Big-Four Concentration Ratio
-50 0 50 100
-.5
0
.5
1
1.5
2
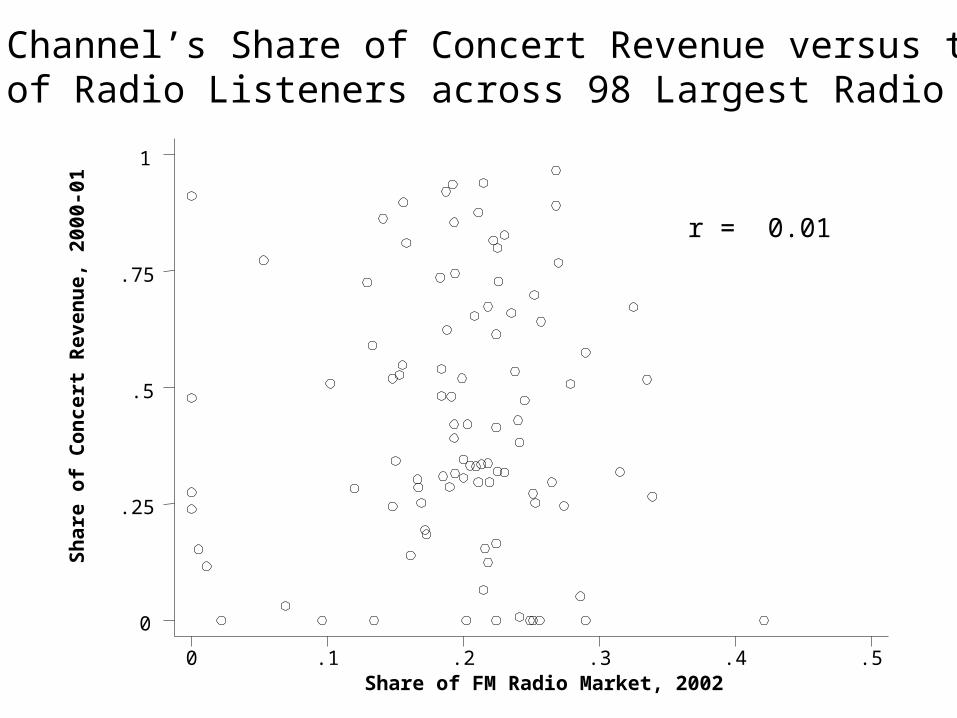
r = 0.04
Change in Prices vs. Change in Big-Four Concentration Ratio, 1993-94 to 2000-2001; 98 Largest Cities
Pro
po
rtio
na
te C
ha
ng
e i
n P
ric
e
Sh
are
of
Co
nc
ert
Re
ve
nu
e,
20
00
-01
Share of FM Radio Market, 20020 .1 .2 .3 .4 .5
0
.25
.5
.75
1
Clear Channel’s Share of Concert Revenue versus theirShare of Radio Listeners across 98 Largest Radio Markets
r = 0.01

1986 1991 1996 2001
1000
2000
3000
4000
5000
6000
Herfindahl-Hirschman Index for Venues, 1986-2001
Note: Venues that are exclusively used by one promoter in a year in a particular cityare pooled together into one conglomerate. An industry with an HHI above 1,8000is considered highly concentrated according to the Justice Department Merger Guidelines.
Average Across 24 Largest CitiesA
vera
ge H
HI

$0
$10
$20
$30
$40
$50
1982 1983 1984 1985 1986 1987 1988 1989 1990 1991 1992 1993 1994 1995 1996 1997 1998 1999 2000 2001
Pric
e (U
S D
olla
rs)
Surge in Average Price Per Concert Ticket in Canada is Similar to that in the United States – 67% Nominal Growth from 1996 to 2001
Grow at U.S. CPI
Avg.Price
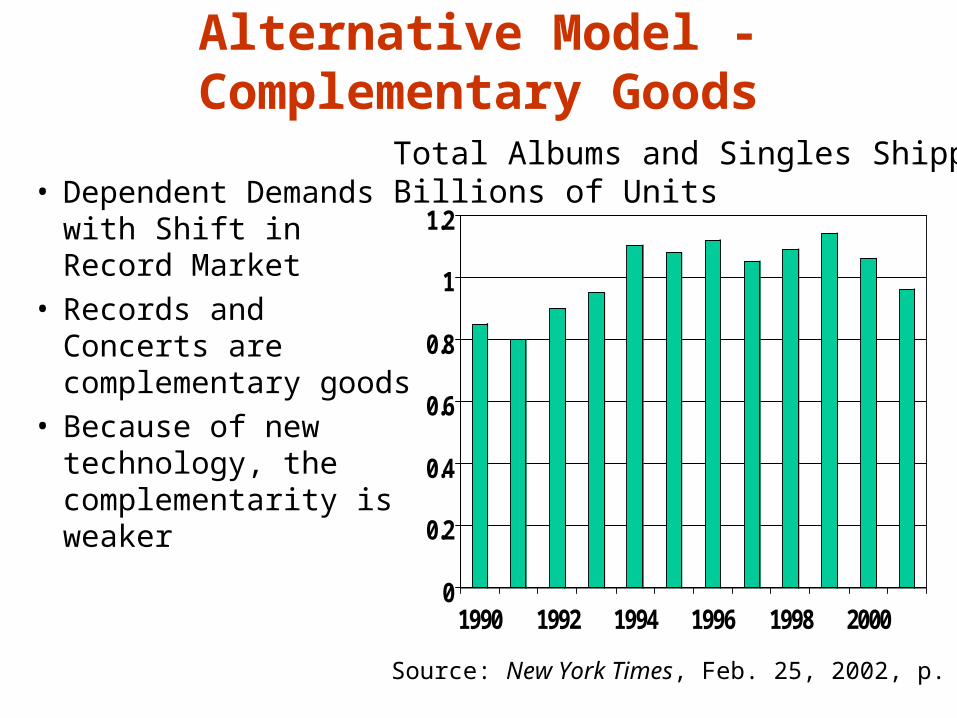
Alternative Model - Complementary Goods
• Dependent Demands with Shift in Record Market
• Records and Concerts are complementary goods
• Because of new technology, the complementarity is weaker 0
0.2
0.4
0.6
0.8
1
1.2
1990 1992 1994 1996 1998 2000
Source: New York Times, Feb. 25, 2002, p. C1.
Total Albums and Singles Shipped Billions of Units
Music shipments were down an estimated 9.6 percent last year, after declining 7 percent in 2000. Sales were flat 1994 to2000.

pDCpDCpDpDp 22112211 pmax
11
122'22
111
'11 1
11 Dp DCp
pCp
Bands Produce 2 Complementary Goods with Market Power
Good 1: Concert TicketsGood 2: Record Sales

“Music itself is going to become like running water or electricity. So it’s like, just take advantage of these lastfew years because none of this is ever going to happen again. You’d better be prepared for doing a lot of touring because that’s really the only unique situation that’s going to be left. It’s terribly exciting. But on the other hand it doesn’t matter if you think it’s exciting or not; it’s what’s going to happen.”
David Bowie The New York Times
June 9, 2002
11
122'22
111
'11 1
11Dp DCp
pCp
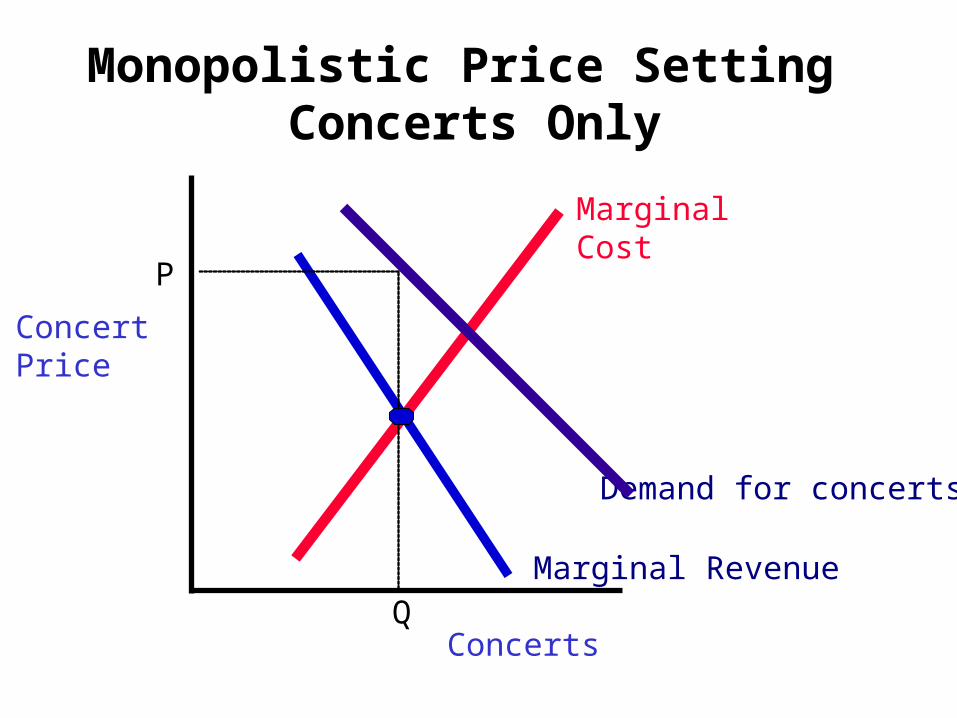
Monopolistic Price Setting Concerts Only
Marginal Cost
Concerts
ConcertPrice
Demand for concerts
Marginal Revenue
P
Q

Marginal Cost
Concerts
ConcertPrice
Demand for concerts
Marginal Revenue
P
Q
P’
Q’
Monopolistic Price Setting with Complementary Product: Records
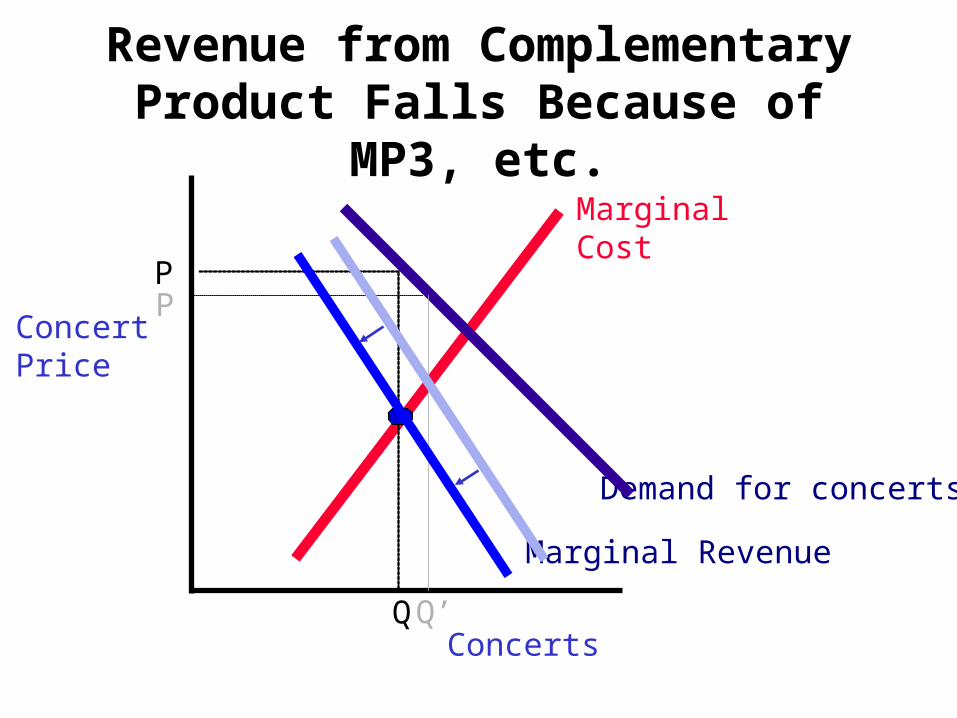
Marginal Cost
Concerts
ConcertPrice
Demand for concerts
Marginal Revenue
Q
P
Q’
Revenue from Complementary Product Falls Because of MP3, etc.
P

Price Growth by Genre,1996-2001
23.4%
45.0% 47.7%55.6%
74.1%
0%
10%
20%
30%
40%
50%
60%
70%
80%
Jazz &Blues
Reggae &Other
Folk &Country
Rap & R&B Pop & Rock
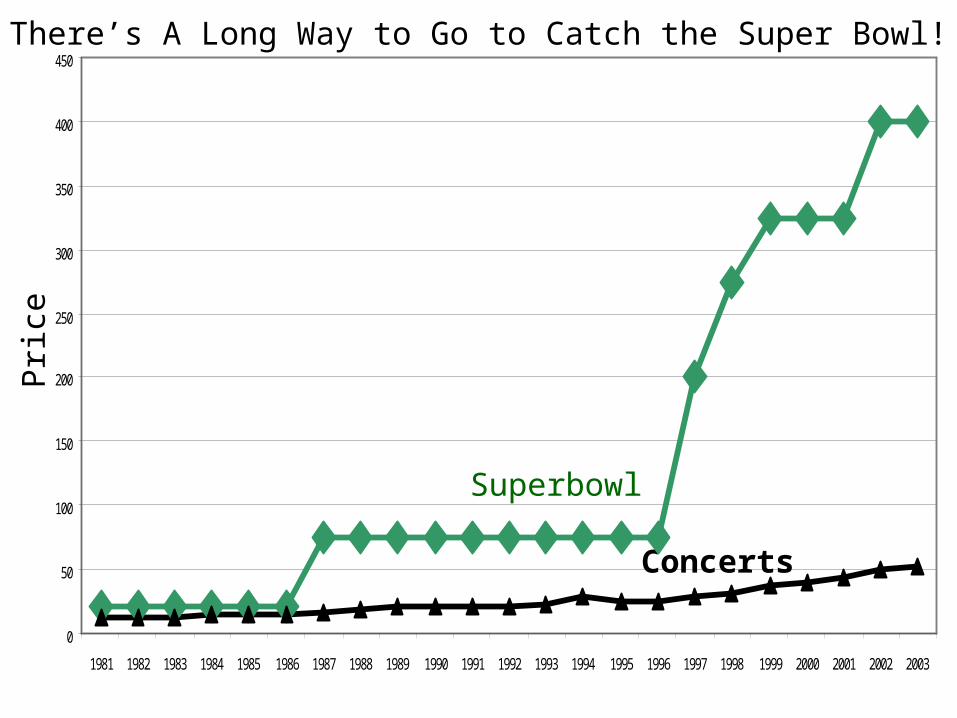
Superbowl
Concerts
There’s A Long Way to Go to Catch the Super Bowl!P
rice
0
50
100
150
200
250
300
350
400
450
1981 1982 1983 1984 1985 1986 1987 1988 1989 1990 1991 1992 1993 1994 1995 1996 1997 1998 1999 2000 2001 2002 2003
Conclusions• Rising superstar effects, but
not accelerating
• To understand the market must understand industrial organization and technology
• Legal changes that allowed Clear Channel to dominate industry may be overrated
• Antitrust action in future? Revised Telecom Act?
• Complementarities between concerts and album sales key to market for Rock Stars?