rock stresses, its controls and associated ground ... · the deposit comprises several concordant...
TRANSCRIPT

Deep Mining 2017: Eighth International Conference on Deep and High Stress Mining – J Wesseloo (ed.) © 2017 Australian Centre for Geomechanics, Perth, ISBN 978-0-9924810-6-3
Deep Mining 2017, Perth, Australia 901
Rock stresses, its controls and associated ground behaviour at the Rosebery mine, Tasmania
MF Lee Monash University, Australia
R de Vries MMG Limited, Australia
CF Moller MMG Limited, Australia
Abstract The Rosebery mine, on the west coast of Tasmania, is currently one of Australia’s deepest mines. The orebodies dip moderately (45°) and mining is currently about 1,800 m below Mount Black. As might be expected, ground conditions are challenging regarding rock stresses versus the strength of the rock mass.
Over 22 years, from 1983 to 2015, in situ rock stress measurements have been made at 16 sites at varying depths from about 500 to 1,800 m below surface. This data is documented and summarised, with depth and possible geologic and structural controls, to provide an understanding of what locally controls Rosebery’s rock stresses.
This understanding has been used to better appreciate some aspects of the mine’s challenging ground conditions.
Keywords: rock stress measurement, rock stresses, structures, ground behaviour, ground support
1 Introduction Rock stresses are a necessary and critical input to the assessment of ground behaviour (understanding and prediction). This is particularly true for deep underground mines such as Rosebery where stresses around openings can be similar to the strength of the intact rock.
Unfortunately, the measurement of rock stresses is not always straight‐forward nor cheap. Data is often only collected at ‘points’, which for practical engineering purposes must be considered to be representative of much larger volumes of rock mass. Results can be variable, especially between widely‐spaced ‘point’ measurements, and, therefore, their validity and direct applicability to design issues is often questioned.
This paper documents what is presently known about rock stresses at Rosebery. Reasons for variability, between some sites, is also discussed along with the confidence that can be placed in the data, particularly as it applies to the current deep mining areas from 2,300 to 2,000 mRL (approximately 1,500–1,800 m below surface.
2 Setting and ground behaviour Mineralisation at Rosebery was discovered in 1893. Mining commenced in about 1912, but full‐scale production only started in 1936 after the Electrolytic Zinc Company of Australasia acquired the deposit. MMG Limited gained control of the operation in 2009 as part of the purchase of the Australian assets of Zinifex. The extent of past mining, and proposed future resources, beneath Mount Black are illustrated in Figure 1.

Rock stresses, its controls and associated ground behaviour at the Rosebery mine, Tasmania MF Lee et al.
902 Deep Mining 2017, Perth, Australia
Mine North
(11.3° West of AMG North)
Figure 1 Perspective view of the Rosebery township and Mount Black to the north, with historical underground mining operations and drillhole traces (looking down and towards the northwest)
2.1 Geology The Rosebery Zn‐Pb‐Ag massive sulphide deposit is hosted by the Mount Read Volcanics, Cambrian sediments within the Dundas Trough of western and north‐western Tasmania (Martin 2004). In the immediate vicinity of the deposit, the mine sequence rocks (MS rocks) of the Mount Read Volcanics strike approximately 005°, with respect to Mine North, and dip 45° towards Mine East beneath Mount Black (Figures 2 and 3).
Note that unless specifically mentioned, all references to north are Mine North = 11.3° west of Map Grid of Australia (MGA) north.
Figure 2 Top right: typical cross-section (looking north) through the Rosebery deposit, showing multiple ore lenses and the two regional bounding faults; Mount Black Fault in the hanging wall and Rosebery Fault in the footwall. Bottom left: idealised stratigraphic column for the mine sequence rocks with details of rock units
Managing challenging conditions
Deep Mining 2017, Perth, Australia 903
Mine North
foliation and joints faults
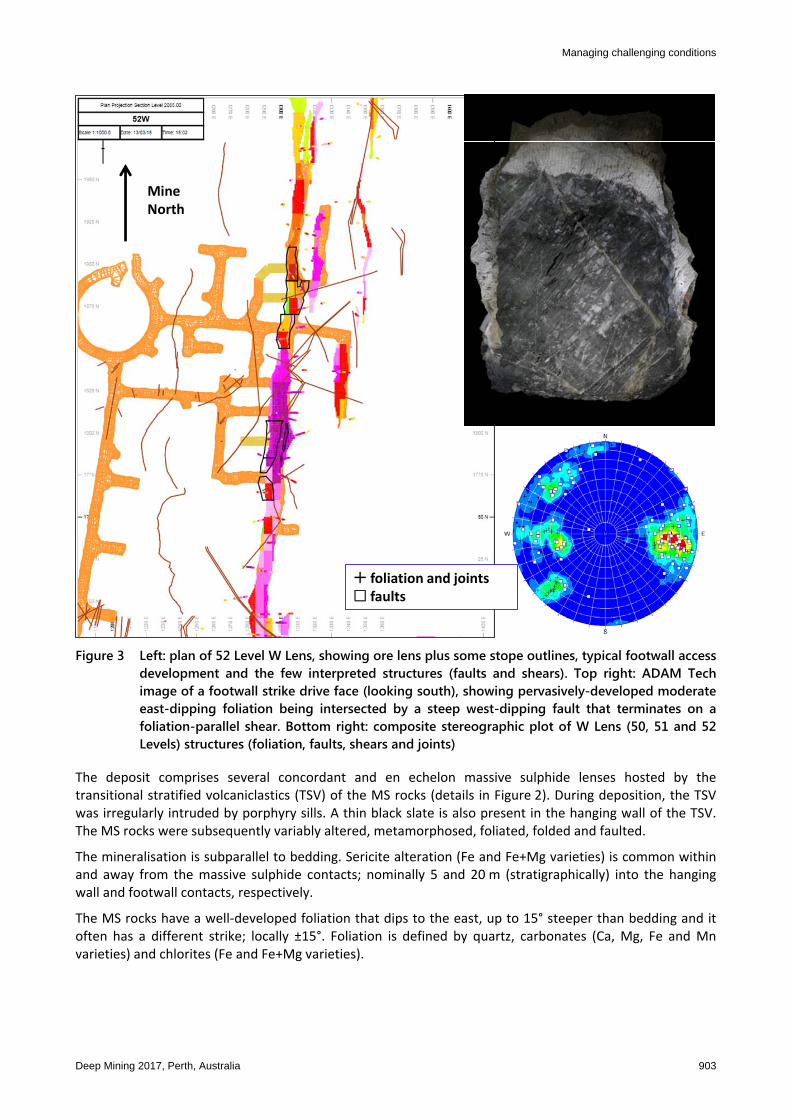
Figure 3 Left: plan of 52 Level W Lens, showing ore lens plus some stope outlines, typical footwall access development and the few interpreted structures (faults and shears). Top right: ADAM Tech image of a footwall strike drive face (looking south), showing pervasively-developed moderate east-dipping foliation being intersected by a steep west-dipping fault that terminates on a foliation-parallel shear. Bottom right: composite stereographic plot of W Lens (50, 51 and 52 Levels) structures (foliation, faults, shears and joints)
The deposit comprises several concordant and en echelon massive sulphide lenses hosted by the transitional stratified volcaniclastics (TSV) of the MS rocks (details in Figure 2). During deposition, the TSV was irregularly intruded by porphyry sills. A thin black slate is also present in the hanging wall of the TSV. The MS rocks were subsequently variably altered, metamorphosed, foliated, folded and faulted.
The mineralisation is subparallel to bedding. Sericite alteration (Fe and Fe+Mg varieties) is common within and away from the massive sulphide contacts; nominally 5 and 20 m (stratigraphically) into the hanging wall and footwall contacts, respectively.
The MS rocks have a well‐developed foliation that dips to the east, up to 15° steeper than bedding and it often has a different strike; locally ±15°. Foliation is defined by quartz, carbonates (Ca, Mg, Fe and Mn varieties) and chlorites (Fe and Fe+Mg varieties).

Rock stresses, its controls and associated ground behaviour at the Rosebery mine, Tasmania MF Lee et al.
904 Deep Mining 2017, Perth, Australia
2.2 Specific structures Large regionally developed bedding‐parallel faults bound the MS rocks (Figure 2). Mount Black Fault, in the hanging wall, is a thick altered cataclastic breccia, but healed. Rosebery Fault, in the footwall, is a thick re‐activated shear‐foliation, gouge infill with clay‐pug.
Other significant structures are rare at Rosebery and they are discontinuous along‐strike and down‐dip. Within the immediate vicinity of ore lenses, structure continuity are typically < 50 m (Figure 3). Bedding plus five cross‐cutting orientation sets are loosely recognised:
1. Steep east‐dipping (subparallel to foliation).
2. Steep northeast‐striking shears.
3. Steep northwest‐striking shears.
4. Moderate to steep west‐dipping faults.
5. Random (mostly flat‐dipping joints).
Orientation Sets 1, 2 and 3 are widely spaced and are not ubiquitously developed on the scale of stoping blocks. In the vicinity of the ore lenses, and along with occasional bedding‐parallel structures, their infill minerals are typically sericite plus chlorite, and associated slickensides tend to be sub‐horizontal.
The west‐dipping faults (Set 4) and flat‐dipping joints (Set 5) are more common that the other sets, but they are also widely‐spaced and often occur as en echelon arrays. Infill minerals are typically quartz plus chlorite, and associated slickensides tend to plunge steeply. West‐dipping faults and moderate east‐dipping structures (e.g. bedding or foliation) potentially define high ‘cathedral’ wedges in the back of strike drives. Drives must, therefore, be appropriately shaped and adequately supported.
2.3 General ground conditions — blockiness When it has not been otherwise disturbed by mining, the Rosebery rock mass is competent for all common TSV rock types, including the porphyry sills and mineralisation. Typical rock mass quality parameters according to the Q‐system (Barton et al. 1974) are given in Table 1.
Table 1 Typical rock mass parameters for common TSV rock types at Rosebery
Host rocks and mineralisation Comment (for average conditions)
Worst Average Best
RQD 75 90 100 Good to excellent.
Jn 6 3 2 Foliation + discontinuous random joints.
Jr 1.5 2 4 Worst joint = foliation; smooth undulating, sometimes planar.
Ja 3 2 0.75 Worst joint = foliation; non‐softening infill (quartz, carbonate, chlorite +/‐ sericite).
Jw 1 1 1 Drained and dry.
SRF 20 15 10 Current mining areas; high stress and moderate squeezing. Only rarely or locally influenced by a fault or weak contact.
Q' 6 30 267
Q 0.3 2.0 27
GSI 60 70 80
In the current mining areas, the general blockiness of the rock mass does not dictate ground behaviour.
Managing challenging conditions
Deep Mining 2017, Perth, Australia 905
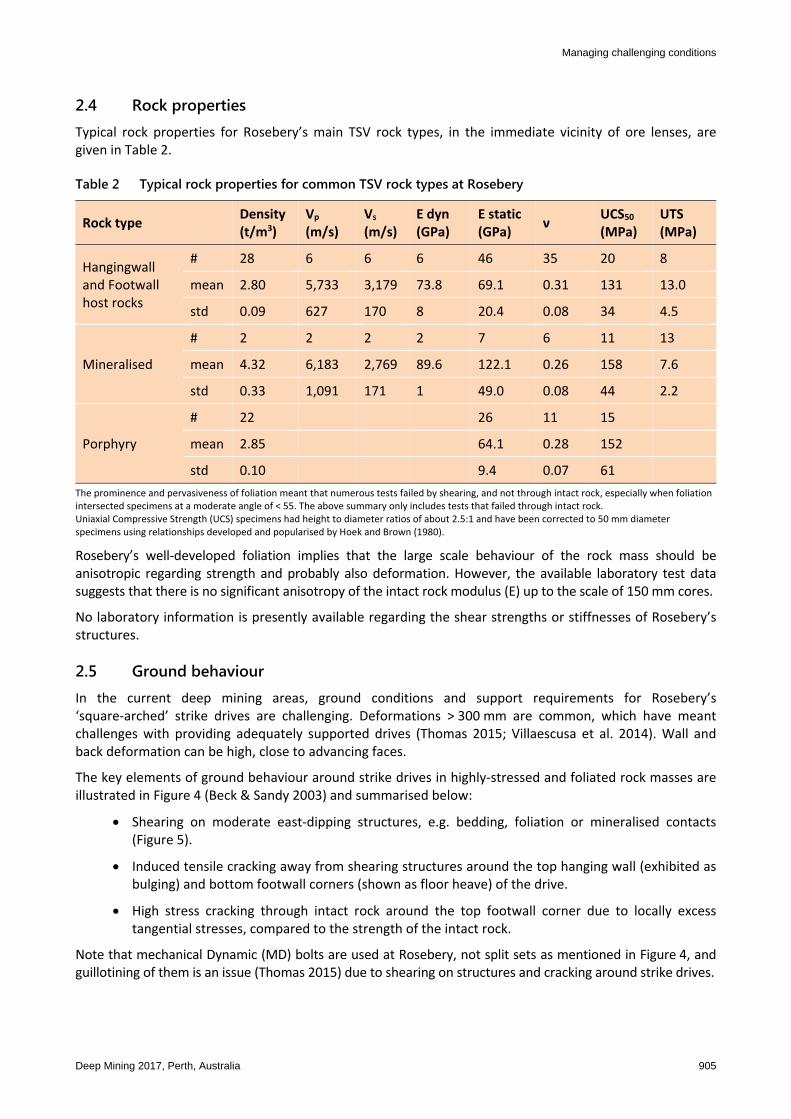
2.4 Rock properties Typical rock properties for Rosebery’s main TSV rock types, in the immediate vicinity of ore lenses, are given in Table 2.
Table 2 Typical rock properties for common TSV rock types at Rosebery
Rock type Density
(t/m3) Vp (m/s)
Vs (m/s)
E dyn (GPa)
E static (GPa)
ν UCS50 (MPa)
UTS (MPa)
Hangingwall and Footwall host rocks
# 28 6 6 6 46 35 20 8
mean 2.80 5,733 3,179 73.8 69.1 0.31 131 13.0
std 0.09 627 170 8 20.4 0.08 34 4.5
Mineralised
# 2 2 2 2 7 6 11 13
mean 4.32 6,183 2,769 89.6 122.1 0.26 158 7.6
std 0.33 1,091 171 1 49.0 0.08 44 2.2
Porphyry
# 22 26 11 15
mean 2.85 64.1 0.28 152
std 0.10 9.4 0.07 61
The prominence and pervasiveness of foliation meant that numerous tests failed by shearing, and not through intact rock, especially when foliation intersected specimens at a moderate angle of < 55. The above summary only includes tests that failed through intact rock. Uniaxial Compressive Strength (UCS) specimens had height to diameter ratios of about 2.5:1 and have been corrected to 50 mm diameter specimens using relationships developed and popularised by Hoek and Brown (1980).
Rosebery’s well‐developed foliation implies that the large scale behaviour of the rock mass should be anisotropic regarding strength and probably also deformation. However, the available laboratory test data suggests that there is no significant anisotropy of the intact rock modulus (E) up to the scale of 150 mm cores.
No laboratory information is presently available regarding the shear strengths or stiffnesses of Rosebery’s structures.
2.5 Ground behaviour In the current deep mining areas, ground conditions and support requirements for Rosebery’s ‘square‐arched’ strike drives are challenging. Deformations > 300 mm are common, which have meant challenges with providing adequately supported drives (Thomas 2015; Villaescusa et al. 2014). Wall and back deformation can be high, close to advancing faces.
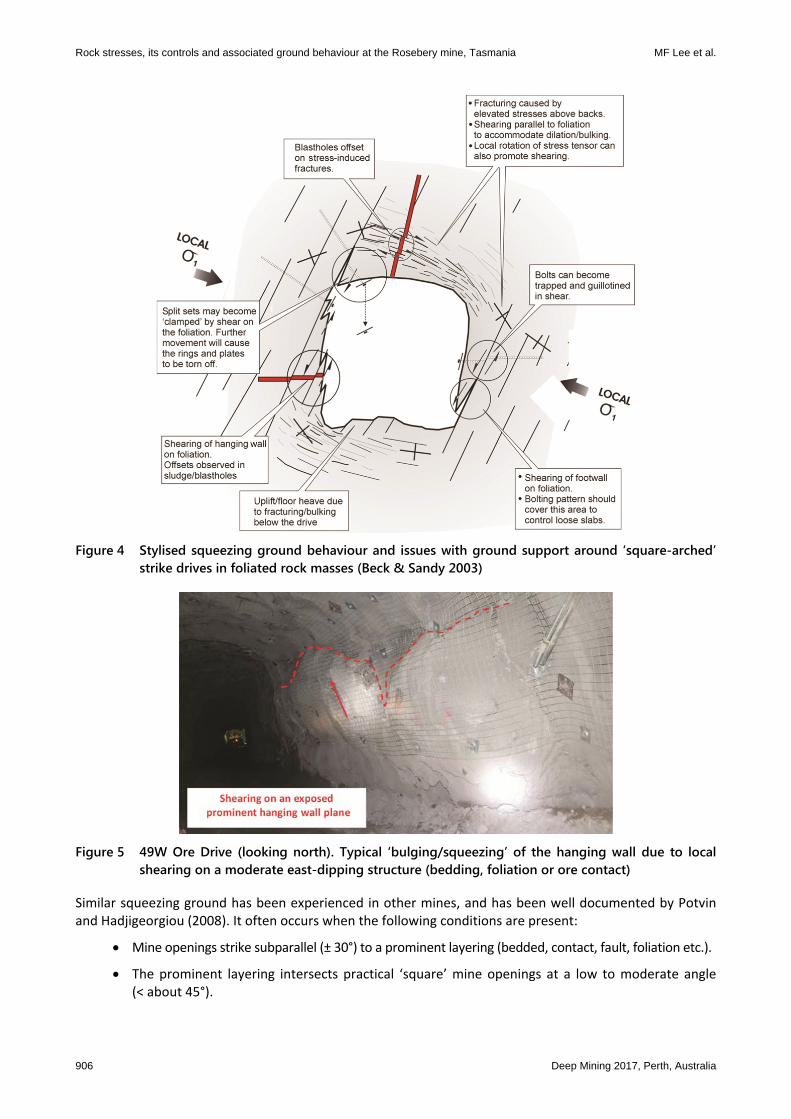
The key elements of ground behaviour around strike drives in highly‐stressed and foliated rock masses are illustrated in Figure 4 (Beck & Sandy 2003) and summarised below:
Shearing on moderate east‐dipping structures, e.g. bedding, foliation or mineralised contacts (Figure 5).
Induced tensile cracking away from shearing structures around the top hanging wall (exhibited as bulging) and bottom footwall corners (shown as floor heave) of the drive.
High stress cracking through intact rock around the top footwall corner due to locally excess tangential stresses, compared to the strength of the intact rock.
Note that mechanical Dynamic (MD) bolts are used at Rosebery, not split sets as mentioned in Figure 4, and guillotining of them is an issue (Thomas 2015) due to shearing on structures and cracking around strike drives.
Rock stresses, its controls and associated ground behaviour at the Rosebery mine, Tasmania MF Lee et al.
906 Deep Mining 2017, Perth, Australia
Figure 4 Stylised squeezing ground behaviour and issues with ground support around ‘square-arched’ strike drives in foliated rock masses (Beck & Sandy 2003)
Figure 5 49W Ore Drive (looking north). Typical ‘bulging/squeezing’ of the hanging wall due to local shearing on a moderate east-dipping structure (bedding, foliation or ore contact)
Similar squeezing ground has been experienced in other mines, and has been well documented by Potvin and Hadjigeorgiou (2008). It often occurs when the following conditions are present:
Mine openings strike subparallel (± 30°) to a prominent layering (bedded, contact, fault, foliation etc.).
The prominent layering intersects practical ‘square’ mine openings at a low to moderate angle (< about 45°).
Managing challenging conditions
Deep Mining 2017, Perth, Australia 907
The layering is weak in shear.
Stresses are high and/or deviatoric.
To better‐understand and predict (i.e. model) the severity of this style of ground behaviour on drive stability, it is important to have a good understanding of the following:
Local stresses: principal stress magnitudes, ratios and their orientations.
Intact rock properties for the main rock types: compressive and tensile strengths, plus deformability (E and ν).
Shear strengths and stiffnesses of the prominent layering (structures).
Despite high measured stresses in the current mining areas at Rosebery, cross‐cuts and raise‐bored ventilation shafts (remote from mining) do not exhibit adverse behaviour, or any other high stress behaviour, unlike the strike drives. However, discing of diamond drill core is common in sub‐horizontal boreholes oriented east–west (± 45°), especially in the zone up to 15 m away from the development drives and stub cross‐cuts.
3 Rock stresses
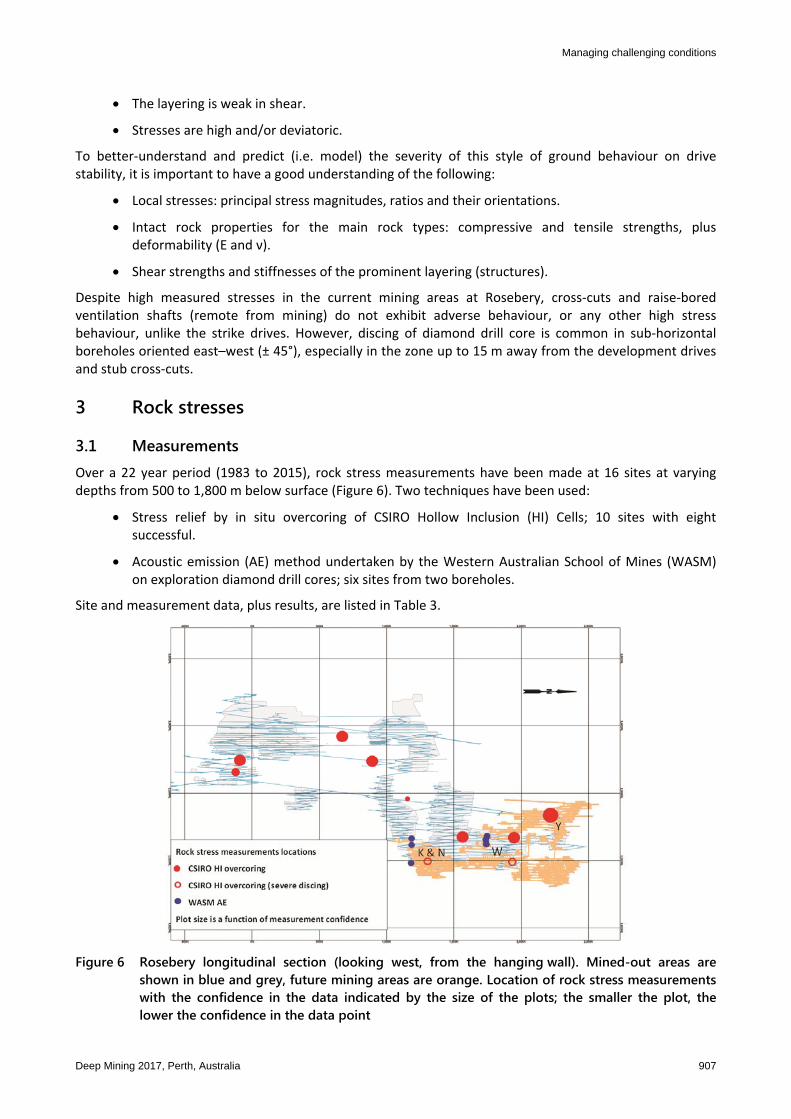
3.1 Measurements Over a 22 year period (1983 to 2015), rock stress measurements have been made at 16 sites at varying depths from 500 to 1,800 m below surface (Figure 6). Two techniques have been used:
Stress relief by in situ overcoring of CSIRO Hollow Inclusion (HI) Cells; 10 sites with eight successful.
Acoustic emission (AE) method undertaken by the Western Australian School of Mines (WASM) on exploration diamond drill cores; six sites from two boreholes.
Site and measurement data, plus results, are listed in Table 3.
Figure 6 Rosebery longitudinal section (looking west, from the hanging wall). Mined-out areas are shown in blue and grey, future mining areas are orange. Location of rock stress measurements with the confidence in the data indicated by the size of the plots; the smaller the plot, the lower the confidence in the data point

Table 3 Compilation of Rosebery’s rock stress measurements Source Location Rock Technique Rock properties Principal stresses
Normal vertical stress (MPa)
Author Site N (m)
E (m)
mRL (m)
Type Temp (°C)
Type Gauges/ tests used
(#)
Confidence rating
E (GPa)
ν
Major Intermediate Minor
Magn (MPa)
Dip (°)
Brg (°)
Magn (MPa)
Dip (°)
Brg (°)
Magn (MPa)
Dip (°)
Brg (°)
BFP 1983 15 Level Main North Drive; ‐99 mRL
645 255 2950 Chloritic sericitic siliceous tuff
20 CSIRO HI cell overcoring
41 Good 65.5 0.41 30.2 18 227 24.1 00 318 12.0 72 048 13.7
BFP 1984 19 ‘F1’ Sublevel Main Decline
‐145 490 2760 Footwall pyroclastics
27 CSIRO HI cell overcoring
50 Good 84.9 0.35 61.9 21 279 34.8 34 173 22.2 48 034 31.3
Mindata 1994 19 Level B Haulage 839 429 2750 Footwall schist 26 CSIRO HI cell overcoring
36 Good 76.9 0.30 32.2 21 336 22.7 53 216 11.0 30 079 21.1
Mindata 1994 21 Level J Lens, 162 Cross‐cut
‐165 677 2654 Footwall schist 26 CSIRO HI cell overcoring
19 Fair 75.4 0.16 56.5 30 237 41.2 07 330 20.1 59 072 29.3
BFP 1999 NED 1120 SP 1121 713 2450 Footwall volcanics (foliated)
26 CSIRO HI cell overcoring
24 Poor 70.0 0.25 58.0 28 313 39.1 39 197 30.1 38 068 40.0
MMS re‐analysis 2014
47K Drill Drive — K Lens
1540 1006 2147 Host footwall pummic breccia (foliated)
46 CSIRO HI cell overcoring
32 Good 72.7 0.29 50.1 20 135 42.0 28 236 22.1 54 015 29.9
MMS re‐analysis 2014
47W Decline 1906 1135 2140 Host footwall pummic breccia (foliated)
44 CSIRO HI cell overcoring
36 Good 81.3 0.30 78.5 31 243 60.3 14 342 39.3 56 093 50.7
WASM 2006 W Decline DDC; R8583 24.6–27.5 m
1717 1055 2160 Quartz sericite schist
WASM AE 18 No rating 56.9 13 219 45.1 16 125 37.1 69 347 38.7
WASM 2006 W Decline DDC; R8583 101.9–105.0 m
1710 1120 2135 Quartz sericite schist
WASM AE 30 No rating 53.7 02 209 43.4 01 119 39.7 88 369 39.7
WASM 2006 W Decline DDC; R8583 151.0–154.0 m
1708 1180 2118 Quartz sericite schist
WASM AE 31 No rating 54.5 01 195 42.5 02 105 40.0 88 326 40.0
WASM 2007 47P DDC; R8801 47.1–50.7 m
1145 1120 2136 Siliceous chloritic footwall host
WASM AE 36 No rating 62.9 06 148 50.8 03 058 42.0 83 305 42.2
WASM 2007 47P DDC; R8801 125.1–128.8 m
1147 1178 2082 Siliceous chloritic footwall host
WASM AE 42 No rating 67.8 03 314 53.9 05 214 43.3 85 078 43.4
WASM 2007 47P DDC; R8801 352.8–356.0 m
1151 1350 1931 Siliceous chloritic footwall host
WASM AE 34 No rating 69.8 10 320 55.1 02 229 47.9 80 128 48.6
MMS 2015 02 55K_SP1310 1264 1183 1950 Host footwall schist
CSIRO HI cell overcoring
Severe discing
MMS 2015 03 41Y_VED2250 2243 1103 2320 Host footwall schist /tuff, foliated
41 CSIRO HI cell overcoring
36 Excellent 68.0 0.35 71.9 26 273 41.4 10 008 35.8 62 117 42.7
MMS 2015 03 57W_VED1950 1916 1355 1960 Host footwall schist /tuff, foliated
50 CSIRO HI cell overcoring
0 Severe discing
N, E and mRLs are with respect to Rosebery's mine co‐ordinates. Dips are positive down. Bearings are positive clockwise from Mine North = 11.3° AMG North. Note: No useful overcore data was obtained from the two deepest 2015 attempts to measure stresses. For core diameters of 74 and 150 mm, severe core discing was experienced for all sub‐horizontal drilling directions. It would seem that for Rosebery’s rock mass, the practical limit of conventional rock stress measurement by overcoring has been reached.

Managing challenging conditions
Deep Mining 2017, Perth, Australia 909
All of the measurements were done in variably foliated and sericitised TSV rocks; sometimes pyritic. The overcoring and WASM AE measurements were done, respectively, in footwall and hanging wall rocks.
For the overcored CSIRO HI cells, the orientation of the measurement boreholes varied for each site, as did the number of cells overcored. All of the measurements were done at sufficient depths from the development openings (typically > 1.5 opening diameters), so the results would not be significantly influenced by stress‐concentrations from the nearby openings.
All of the overcore testing was also done by former CSIRO Division of Geomechanics personnel who were employed at division when the HI cell was developed (late 1960s). Consequently, standard overcoring, data collection techniques and analysis procedures were used for all of the overcore measurements. Numerous QA/QC checks were routinely undertaken, redundant data was collected and standard statistical analysis and data acceptance/rejection procedures were used.
However, for a number of reasons, not all of the overcore measurements deserve the same confidence and weighting during subsequent analysis.
Table 4 outlines the experience‐based qualitative criteria used to empirically rate and weight the confidence that can be placed in each site result. It is a combination of the quality and quantity of the strain and rock property data collected, which is then used to calculate each site result quoted in Table 3. In all of the following plots, the size of the symbol reflects the confidence rating of the particular site rock stress measurement.
Table 4 Experience-based qualitative criteria used to rate and weight the confidence of rock stress measurements, by overcoring CSIRO HI Cells (from Lee 1997)
Rating Weighting Comments
Excellent 8
At least three good individual overcores of CSIRO HI cells ( 33 strains), good rock property data for each, and no experimental difficulties.
Variable results between adjacent cells are not considered to be an issue, rather, a characteristic of the local rock mass.
Good rock property data is required, and ideally not significantly different between adjacent cells.
Data collection from two or more boreholes is considered to be better than from one borehole.
Good 6
At least two good individual overcores (24 to 32 strains).
A third cell may have had gluing and/or electrical problems.
Significantly different rock properties between some cells, and/or anisotropic or micro‐cracked rock.
It is difficult for stress measurements using the borehole slotting or individual tests by hydraulic fracturing to be rated any higher than good.
Fair 3
Only two overcores and incomplete due to some gluing and/or electrical problems (16 to 23 strains).
Technical difficulties with the overcoring, e.g. groundwater, glue bonding, discing problems, transient temperature effects, but with good rock property data.
Alternatively, poor rock property data and up to 24 good overcore strains.
Poor 1
Only one overcore or poor data from two overcores and associated biaxial tests (< 15 strains).
High variability between individual tests. Poor glue bonding.
Rock stresses, its controls and associated ground behaviour at the Rosebery mine, Tasmania MF Lee et al.
910 Deep Mining 2017, Perth, Australia
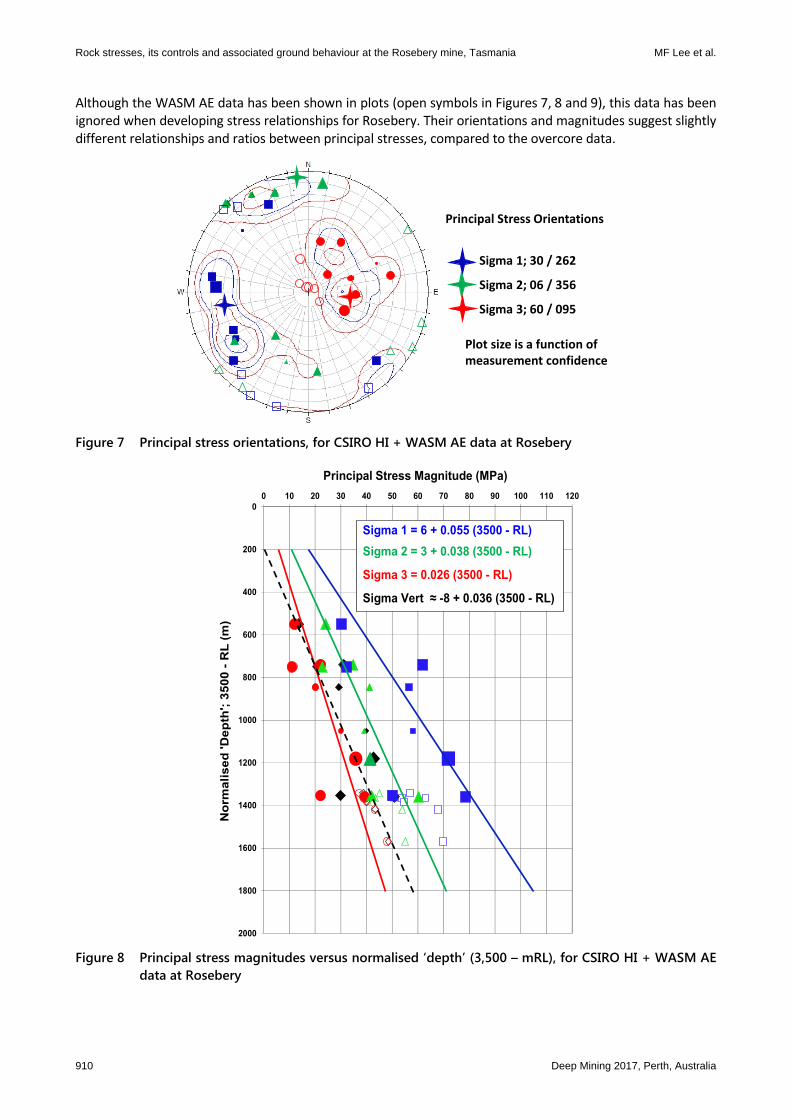
Although the WASM AE data has been shown in plots (open symbols in Figures 7, 8 and 9), this data has been ignored when developing stress relationships for Rosebery. Their orientations and magnitudes suggest slightly different relationships and ratios between principal stresses, compared to the overcore data.
Principal Stress Orientations
Sigma 1; 30 / 262
Sigma 2; 06 / 356
Sigma 3; 60 / 095
Plot size is a function of measurement confidence
Figure 7 Principal stress orientations, for CSIRO HI + WASM AE data at Rosebery
0
200
400
600
800
1000
1200
1400
1600
1800
2000
0 10 20 30 40 50 60 70 80 90 100 110 120
No
rmali
sed
'Dep
th';
3500 -
RL
(m
)
Principal Stress Magnitude (MPa)
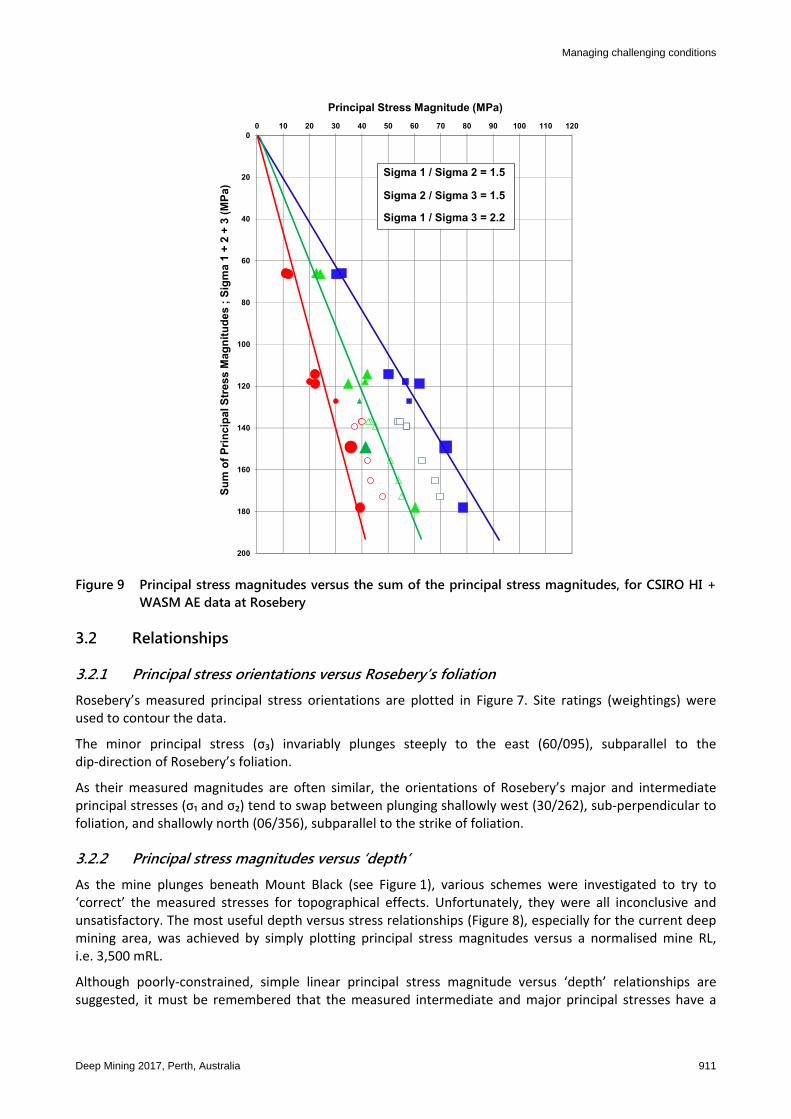
Sigma 1 = 6 + 0.055 (3500 - RL)
Sigma 2 = 3 + 0.038 (3500 - RL)
Sigma 3 = 0.026 (3500 - RL)
Sigma Vert ≈ -8 + 0.036 (3500 - RL)
Figure 8 Principal stress magnitudes versus normalised ‘depth’ (3,500 – mRL), for CSIRO HI + WASM AE data at Rosebery
Managing challenging conditions
Deep Mining 2017, Perth, Australia 911
0
20
40
60
80
100
120
140
160
180
200
0 10 20 30 40 50 60 70 80 90 100 110 120
Su
m o
f P
rin
cip
al S
tres
s M
agn
itu
des
; S
igm
a 1
+ 2
+ 3
(M
Pa)
Principal Stress Magnitude (MPa)
Sigma 1 / Sigma 2 = 1.5
Sigma 2 / Sigma 3 = 1.5
Sigma 1 / Sigma 3 = 2.2
Figure 9 Principal stress magnitudes versus the sum of the principal stress magnitudes, for CSIRO HI + WASM AE data at Rosebery
3.2 Relationships
3.2.1 Principal stress orientations versus Rosebery’s foliation
Rosebery’s measured principal stress orientations are plotted in Figure 7. Site ratings (weightings) were used to contour the data.
The minor principal stress (σ₃) invariably plunges steeply to the east (60/095), subparallel to the dip‐direction of Rosebery’s foliation.
As their measured magnitudes are often similar, the orientations of Rosebery’s major and intermediate principal stresses (σ₁ and σ₂) tend to swap between plunging shallowly west (30/262), sub‐perpendicular to foliation, and shallowly north (06/356), subparallel to the strike of foliation.
3.2.2 Principal stress magnitudes versus ‘depth’
As the mine plunges beneath Mount Black (see Figure 1), various schemes were investigated to try to ‘correct’ the measured stresses for topographical effects. Unfortunately, they were all inconclusive and unsatisfactory. The most useful depth versus stress relationships (Figure 8), especially for the current deep mining area, was achieved by simply plotting principal stress magnitudes versus a normalised mine RL, i.e. 3,500 mRL.
Although poorly‐constrained, simple linear principal stress magnitude versus ‘depth’ relationships are suggested, it must be remembered that the measured intermediate and major principal stresses have a

Rock stresses, its controls and associated ground behaviour at the Rosebery mine, Tasmania MF Lee et al.
912 Deep Mining 2017, Perth, Australia
tendency to swap orientations. Care is, therefore, necessary when applying these relationships to assess engineering designs.
The shallow westerly dip of the major principal stress and its high magnitude in the current mining areas, compared to the strength of the rock mass, imply excessive stresses and cracking through intact rock around the top footwall corner of Rosebery’s strike drives, as is commonly observed. However, stress concentrations in the walls of cross‐cuts and raises are not yet high enough to initiate cracking, as is also observed.
3.2.3 Principal stress magnitude ratios
Despite extensive validation of in situ rock stress measurements by overcoring, at numerous operations against observed ground behaviour, doubt is invariably voiced about their validity when results do not neatly fit theoretical or text‐book ideas about rock stresses.
One method of checking the consistency of a set of rock stress measurement data, from a similar geotechnical domain, is to plot principal stress magnitudes versus their sum (σ₁ + σ₂ + σ₃). This is a normalisation process. It often gives well‐constrained linear relationships between the principal stresses, as is suggested in Figure 9, irrespective of their orientations or variations with depth and along strike.
Harrison et al. (2007) noted that these ratios are not a mathematical obscurity of tensors and that slightly different principal stress ratios occur in different geological (i.e. geotechnical) environments.
3.2.4 Stresses versus structures
Given the active loading of tectonic plates and the fixed structural character of the Rosebery rock mass, it is argued that there are only certain maximum principal stress ratios that the rock mass can sustain. The ‘dynamic’ process involves shearing on structures in geologic‐time, i.e. re‐activation of structures (as aseismic creep, or perhaps earthquakes), redistribution of loads and the modification of local stresses to the maximum principal stress ratios that the local rock mass can sustain. Those ratios are very likely to be a function of the orientation and character (shear strengths and stiffnesses) of the local structures.
‘Structures’ are often cited as the reason why measured stresses are different to expected well‐behaved text‐book trends. It is argued in the following section that this is true at Rosebery.
3.2.4.1 Rosebery Fault
For each of the measured stresses, pre‐mining normal and shear stresses acting on Rosebery Fault are plotted in Figure 10. Note that to calculate pre‐mining normal and shear stresses, which were presumably at‐least at limiting equilibrium with external loads prior to mining (gravitational, tectonic etc.), water pressures corrections are required. Mining effectively drains and depressurises the rock mass, thereby making it a little stronger and less prone to shearing on structures.
Figure 10 Pre-mining normal versus shear stresses, per overcore rock stress measurement at Rosebery Fault
Managing challenging conditions
Deep Mining 2017, Perth, Australia 913
The upper limit of the data suggests a low long‐term (geologic) shear strength for Rosebery Fault (cohesion, c = 4 MPa and friction angle, φ = 10°), which, given its weak clay‐pug infilled nature, is not a surprise.
The WNW‐ESE tectonic loading (with respect to true north) of the Australian Tectonic Plate through Tasmania (Hillis & Reynolds 2003) acts at about 45° to Rosebery Fault’s strike and dip. There should, therefore, be no surprise about the importance and control of Rosebery Fault, and other similar regionally‐developed structures, on the style of the mine’s stress field. The local stresses must be sub‐aligned with Rosebery Fault.
Measurements at three of the overcore sites have ‘high’ combinations of pre‐mining normal and shear stresses; i.e. the shallow 15 Level and 19 ‘F1’ Sublevel sites, and the deep 47K site. It’s therefore also no surprise that occasional seismicity has been monitored near Rosebery Fault opposite the 47K measurement site in response to mining in the adjacent K, N and P Lens.
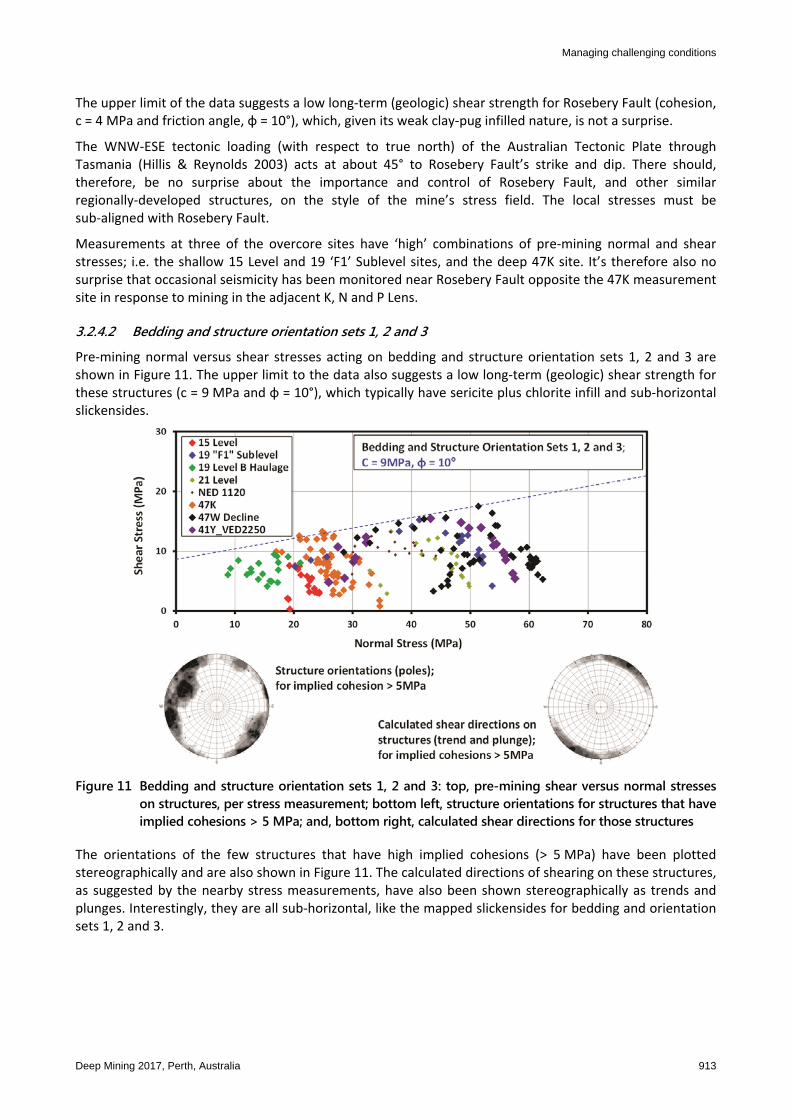
3.2.4.2 Bedding and structure orientation sets 1, 2 and 3
Pre‐mining normal versus shear stresses acting on bedding and structure orientation sets 1, 2 and 3 are shown in Figure 11. The upper limit to the data also suggests a low long‐term (geologic) shear strength for these structures (c = 9 MPa and φ = 10°), which typically have sericite plus chlorite infill and sub‐horizontal slickensides.
Figure 11 Bedding and structure orientation sets 1, 2 and 3: top, pre-mining shear versus normal stresses on structures, per stress measurement; bottom left, structure orientations for structures that have implied cohesions > 5 MPa; and, bottom right, calculated shear directions for those structures
The orientations of the few structures that have high implied cohesions (> 5 MPa) have been plotted stereographically and are also shown in Figure 11. The calculated directions of shearing on these structures, as suggested by the nearby stress measurements, have also been shown stereographically as trends and plunges. Interestingly, they are all sub‐horizontal, like the mapped slickensides for bedding and orientation sets 1, 2 and 3.
Rock stresses, its controls and associated ground behaviour at the Rosebery mine, Tasmania MF Lee et al.
914 Deep Mining 2017, Perth, Australia
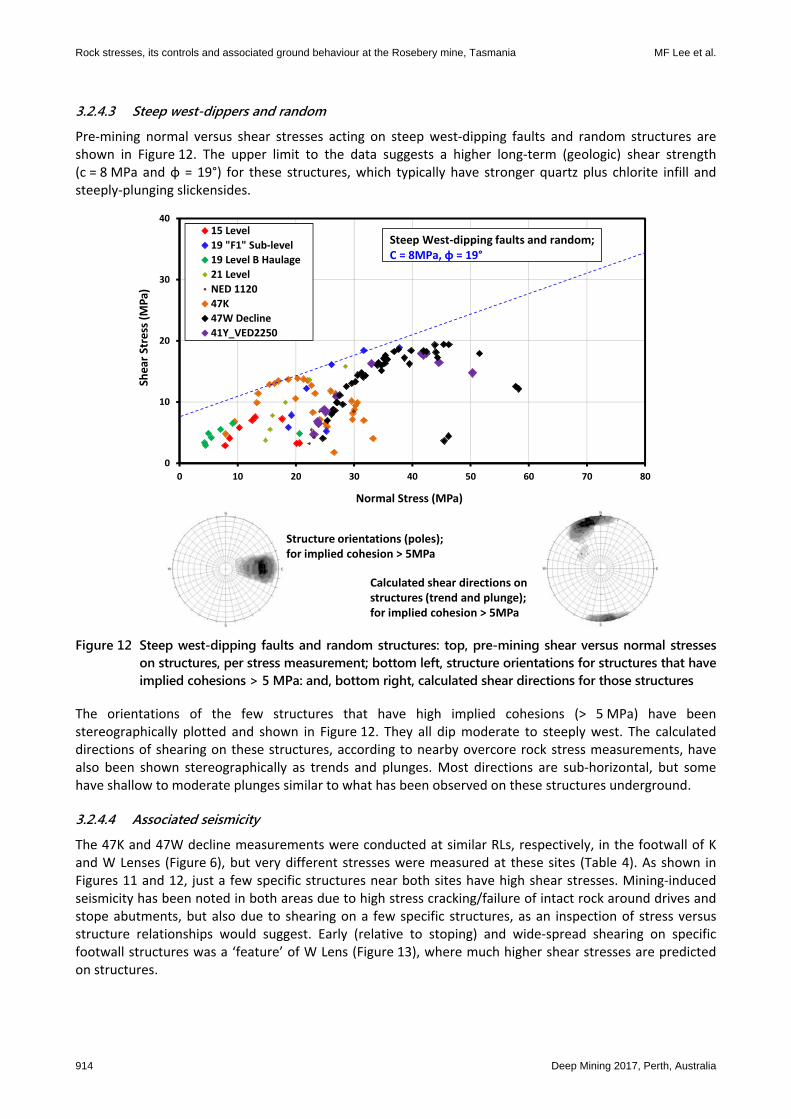
3.2.4.3 Steep west-dippers and random
Pre‐mining normal versus shear stresses acting on steep west‐dipping faults and random structures are shown in Figure 12. The upper limit to the data suggests a higher long‐term (geologic) shear strength (c = 8 MPa and φ = 19°) for these structures, which typically have stronger quartz plus chlorite infill and steeply‐plunging slickensides.
Structure orientations (poles); for implied cohesion > 5MPa
Calculated shear directions on structures (trend and plunge); for implied cohesion > 5MPa
0
10
20
30
40
0 10 20 30 40 50 60 70 80
Shear Stress (MPa)
Normal Stress (MPa)
15 Level
19 "F1" Sub‐level
19 Level B Haulage
21 Level
NED 1120
47K
47W Decline
41Y_VED2250
Steep West‐dipping faults and random; C = 8MPa, φ = 19°
Figure 12 Steep west-dipping faults and random structures: top, pre-mining shear versus normal stresses on structures, per stress measurement; bottom left, structure orientations for structures that have implied cohesions > 5 MPa: and, bottom right, calculated shear directions for those structures
The orientations of the few structures that have high implied cohesions (> 5 MPa) have been stereographically plotted and shown in Figure 12. They all dip moderate to steeply west. The calculated directions of shearing on these structures, according to nearby overcore rock stress measurements, have also been shown stereographically as trends and plunges. Most directions are sub‐horizontal, but some have shallow to moderate plunges similar to what has been observed on these structures underground.
3.2.4.4 Associated seismicity
The 47K and 47W decline measurements were conducted at similar RLs, respectively, in the footwall of K and W Lenses (Figure 6), but very different stresses were measured at these sites (Table 4). As shown in Figures 11 and 12, just a few specific structures near both sites have high shear stresses. Mining‐induced seismicity has been noted in both areas due to high stress cracking/failure of intact rock around drives and stope abutments, but also due to shearing on a few specific structures, as an inspection of stress versus structure relationships would suggest. Early (relative to stoping) and wide‐spread shearing on specific footwall structures was a ‘feature’ of W Lens (Figure 13), where much higher shear stresses are predicted on structures.

Managing challenging conditions
Deep Mining 2017, Perth, Australia 915
Figure 13 W Lens ≈ 100 m into the footwall (52W EXD 1820, looking south). Tight foliation dips moderately east, shearing has occurred on a steep west-dipping fault
4 Conclusion Over the past 22 years, the Rosebery mine has progressively invested in the collection of rock stress measurement data to assist with understanding key elements of ground behaviour and as input to stope and regional stability assessments. As often happens at some mines, the data is variable with depth and along strike, and it does not conform to simple ‘text‐book’ ideas of what rock stress trends should be. It has, therefore, been tempting to dismiss and ignore some of the measurements, by citing any number of unsubstantiated reasons.
The Rosebery rock stress measurements, by overcoring CSIRO HI cells, have been reviewed and empirically rated as to the confidence that can be placed in each measurement (Table 4). This data was then used to investigate and make the following general conclusions about principal stress relationships at Rosebery, with depth and interactions with structures.
Depth versus principal stress orientation and magnitude relationships for the current (deep) mining areas are (normalised with respect to Mine mRL):
○ σ₁ = 6 + 0.055 (3,500 ‐ mRL) MPa; plunging shallowly west (30/262).
○ σ₂ = 3 + 0.038 (3,500 ‐ mRL) MPa; plunging shallowly north (06/356).
○ σ₃ = 0.026 (3,500 ‐ mRL) MPa; plunging steeply to the east (60/095).
The principal stress orientations are aligned with Rosebery’s ubiquitous foliation (60/090). The σ₁ and σ₂ orientations often swap, probably in response to the local presence, or absence, of specific cross‐cutting structures. A suitable method of accounting for the effect of Mount Black was not found, but at the current mining depths its influence is not considered to be significant.
Unlike the depth relationships, ratios between the principal stress magnitudes are well‐constrained:
○ σ₁/ σ₂ = σ₂/ σ₃ = 1.5.
○ σ₁/ σ₃ = 2.2.
Rock stresses, its controls and associated ground behaviour at the Rosebery mine, Tasmania MF Lee et al.
916 Deep Mining 2017, Perth, Australia
The footwall Rosebery Fault (thick with clay‐pug infilled), in association with perhaps similar regionally‐developed faults, is likely to be the main controlling influence on the style of rock stresses at Rosebery. The data suggests a long‐term (geologic) shear strength for the fault of c = 4 MPa, φ = 10°.
Locally specific and discontinuous cross‐cutting structures have a secondary control on Rosebery’s stresses. Their specific presence/absence and orientations are likely to dictate local principal stress orientations, magnitudes and ratios. The data implies the following long‐term (geologic) shear strengths for these structures, for different infill materials:
○ Bedding and orientation sets 1, 2 and 3 (sericite plus chlorite); c = 9 MPa, φ = 10°.
○ Steep west‐dipping faults and random structures (quartz plus chlorite); c = 8 MPa, φ = 19°.
Mapped slickensides on these structures favourably correlate with shear directions predicted by nearby rock stress measurements.
Recent mining‐induced seismicity (style and position) in the footwall of the current mining blocks (K and W Lenses), correlates well with specific structures that have high shear stresses.
The above stress relationships explain the challenging squeezing ground behaviour experienced in Rosebery’s strike drives, and the lack of adverse ground behaviour in cross‐cuts and raises.
The implied long‐term shear strengths of Rosebery’s structures should be used to further‐investigate the chance of shearing on particular structures around development and stoping blocks.
The WASM AE results indicated that there was slightly different relationships and different ratios between the principal stresses compared to the overcore data. The WASM AE results were not used to assess relationships.
Of course, similar reviews and analyses of rock stress measurement data, versus geology, at other mines is likely to lead to similar useful insights into local controls on rock stresses and ground behaviour.
Acknowledgement The authors wish to express their appreciation to MMG Limited for permission to publish and present this paper.
References Barton, N, Lien, R & Lunde, J 1974, ‘Engineering classification of rock masses for the design of tunnel support’, Rock Mechanics,
vol. 6, no. 4, pp. 189–236. Beck, D & Sandy, M 2003, ‘Mine sequencing for high recovery in Western Australian mines’, Proceedings of the 12th International
Symposium on Mine Planning and Equipment Selection, The Australasian Institute of Mining and Metallurgy, Carlton South, Victoria, pp. 137–144.
Harrison, JP, Hudson, JA & Carter, JN 2007, ‘Is there a relation between the in situ principal stress magnitudes in rock masses?’, in E Eberhardt, D Stead & T Morrison (eds), Proceedings of the 1st Canada‐US Rock Mechanics Symposium, 27–31 May 2007, Vancouver, CRC Press.
Hillis, RR & Reynolds, SD 2003, ‘In situ stress field of Australia’, Geological Society of Australia Special Publication, vol. 22, pp. 43–52. Hoek, E & Brown, ET 1980, Underground Excavations in Rock, The Institution of Mining and Metallurgy, London. Lee, MF 1997, Confidence‐Rating System for Rock Stress Measurements, AMC Consultants Pty Ltd (unpublished). Martin, NK 2004, Genesis of the Rosebery Massive Sulphide Deposit, PhD thesis, University of Tasmania, Hobart. Potvin, YH & Hadjigeorgiou, J 2008, ‘Ground support strategies to control large deformations in mining excavations’, The Journal of
the Southern African Institute of Mining and Metallurgy, vol. 108, July 2008, pp. 393–400. Thomas, S 2015, Resin Bolt Projectiles and Hazard Control, Rosebery Mine, Eastern Australian Ground Control Workshop,
Launceston, March. Villaescusa, E, Player, JR & Thompson, AG 2014, ‘A reinforcement design methodology for highly stressed rock masses’, Proceedings
of the 8th Asian Rock Mechanics Symposium, Sapporo, Japan.