rock phosphate fertilizer - the mosaic company · · 2011-07-05mmt dap+map+tsp+mes top five...
TRANSCRIPT

0
2
4
6
8
10
12
14MMT DAP+MAP+TSP+MES
Top Five Phosphate Fertilizer Producers by Capacity
Phosphate Fertilizer Capacity 2004
OCP
PotashCorp
PhosAgro
CF Industri
esMosa
ic
Mosaic 18%
PotashCorp 4%PhosAgro 3%
CF Industries 3%
Other 68%
OCP 4%
James Carville, the highly successful and outspoken campaign strategist and nowCNN political analyst, helped guide Bill Clinton to an upset victory over a popularGeorge H. W. Bush in the 1992 U.S. presidential election. Carville gained notoriety by hanging a hand-written sign that read “It’s the economy, stupid!” at headquarters in Little Rock in order to keep the campaign on message.
The phosphate market is a little less complicated than a presidential cam-paign, but if I asked Carville to analyze this market I suspect he would adviseme, “It’s the rock, stupid!” Analysts sometimes overlook or ignore phosphaterock for a variety of reasons, but phosphate supply is determined by the quan-tity and quality of rock mined from the earth each year. Some producers arebuilding phosphoric acid and granulation capacity, but few new rock mines areunder development today. In fact, many rock producers will need to invest sig-
nificant capital just to maintain output or enhance rock quality for theproduction of higher analysis products in these new downstream plants.As a result, phosphate demand looks like it will outpace supply comingfrom the world’s rock mines during the next five years.
World Rock Production
Rock output likely increased to almost 147 million tonnes in 2004, based onstatistics published by the International Fertilizer Industry Association (IFA) andMosaic estimates. That is up 11 percent from a cyclicallow of 132 million tonnes in 2001. Assuming averagephosphate content and normal recovery rates, the increasein world rock output appears in line with the growth infertilizer and non-fertilizer demand during this period.
Based on our estimates of mine capacities, the averagemine operating rate increased from approximately 73percent in 2001 to more than 80 percent in 2004, a highrate by historical standards. Furthermore, the averageoperating rate is forecast to increase to the 85 percentrange during the next five years assuming moderategrowth in phosphate demand as well as new mine devel-opment later this decade.
Vol. 1 No. 1
February 2005
Market Mosaic is a quarterly newsletter published for our customers and suppliers each February, May,August and November by the Market Analysis & Strategic Planning group of The Mosaic Company. The newsletter pieces together small tiles of information to create a picture of the market – a MarketMosaic, so to speak. The analysis draws on external sources of statistical information and from diverseinternal resources that span both the globe as well as all links along the value chain. The first issue of Market Mosaic describes the phosphate operations of The Mosaic Company and assesses the mediumterm outlook for phosphate by examining recent and likely future developments in the global rock market.
Market Mosaic
Top 10 Rock Producers 2003 MMT Rock Cumulative Percent
0
5
10
15
20
25
30
35
40
20
30
40
50
60
70
80
90
100
04E030201009998979695
Source: IFA and Mosaic.
U.S.
China
China
Morocco
Morocco
Russia
Russia
Tunisia
Tunisia
Jordan
Jordan
Brazil
Brazil
Israel
Israel
South Africa
S. Africa
Syria
Syria
— continued inside
It’s the Rock
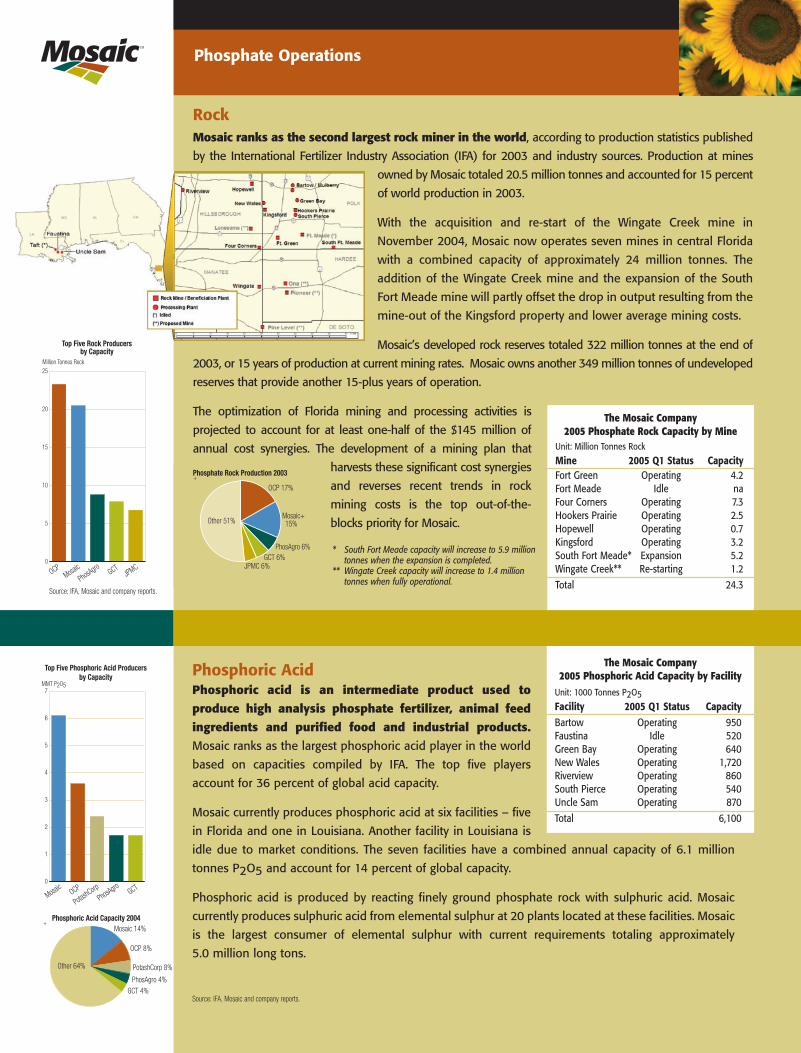
RockMosaic ranks as the second largest rock miner in the world, according to production statistics published
by the International Fertilizer Industry Association (IFA) for 2003 and industry sources. Production at mines
owned by Mosaic totaled 20.5 million tonnes and accounted for 15 percent
of world production in 2003.
With the acquisition and re-start of the Wingate Creek mine in
November 2004, Mosaic now operates seven mines in central Florida
with a combined capacity of approximately 24 million tonnes. The
addition of the Wingate Creek mine and the expansion of the South
Fort Meade mine will partly offset the drop in output resulting from the
mine-out of the Kingsford property and lower average mining costs.
Mosaic’s developed rock reserves totaled 322 million tonnes at the end
of 2003, or 15 years of production at current mining rates. Mosaic owns another 349 million tonnes of
undeveloped reserves.
The optimization of Florida mining and processing activities is
projected to account for approximately one-half of the $145 million
of annual cost synergies. The development of a mining plan that
harvests these significant cost synergies
and reverses recent trends in rock
mining costs is the top out-of-the-
blocks priority for Mosaic.
Phosphate FertilizerMosaic is the largest producer of the three most widely used
high-analysis solid phosphate fertilizer products – namely
diammonium phosphate (DAP), monoammonium phosphate (MAP)
and triple superphosphate (TSP) – based on current capacities
compiled by IFA. Mosaic currently produces DAP, MAP and TSP as well
as its line of branded specialty products, MicroEssentials™ (MES), at six
facilities – five in Florida and one in Louisiana. A seventh granulation
plant in Louisiana is idle due to market conditions. The seven plants
have a combined annual capacity of 12.6 million tonnes of product
and account for 18 percent of the world total.
Seven of Mosaic’s 15 granulation plants can produce either DAP or
MAP (or MES). The table provides a breakdown of capacity by product
based on the 2004 production mix, but Mosaic can adjust these
capacities in response to changes in market demand.
Mosaic accounts for a larger share of phosphate fertilizer capacity
because many of the North African players export a significant share
of their phosphoric acid to producers who also import ammonia and
then fabricate DAP at granulation plants located at port facilities.
DAP and MAP are produced by neutralizing phosphoric acid with
anhydrous ammonia. Mosaic ranks as the largest ammonia buyer in
the world with current requirements totaling 1.8 million tonnes.
Mosaic imports ammonia mostly from Caribbean, Russian and
Ukrainian suppliers for its Florida operations. Mosaic also manufac-
tures ammonia at its Faustina, LA facility. Ammonia production at
Faustina exceeds on-site requirements and excess output is sold to
agricultural and industrial users or exchanged for product delivered to
its phosphate plants in central Florida.
Phosphate Operations Phosphate Operations
World Rock Production and Phosphate Use MMT Rock MMT P2O5
Rock Production Phosphate Use
120
125
130
135
140
145
150
28.0000
29.5833
31.1666
32.7499
34.3332
35.9165
37.0
28.0000
29.5833
31.1666
32.7499
34.3332
35.9165
37.4998
04E030201009998979695
Source: IFA and Mosaic.
37.0
35.5
34.0
32.5
31.0
29.5
29.5
28.0
0
5
10
15
20
25
Million Tonnes Rock
Top Five Rock Producers by Capacity
Phosphate Rock Production 2003
OCPGCT
JPMCMosa
ic
PhosAgro
OCP 17%
PhosAgro 6%GCT 6%
JPMC 6%
Other 51%Mosaic 15%
The Mosaic Company2005 Phosphate Fertilizer Capacity
by FacilityUnit: 1000 Tonnes of Product
Facility Product CapacityBartow DAP 1,910
MAP 310MES 60Phosphate Fertilizer 2,280
Faustina DAP 1,560MAP 440Phosphate Fertilizer 2,000
Green Bay DAP 100MAP 1,160Phosphate Fertilizer 1,260
New Wales DAP 2,050MAP 1,240MAP Powder 320Phosphate Fertilizer 3,610
Riverview DAP 1,210MAP 560MES 190Phosphate Fertilizer 1,960
South Pierce TSP 730
Taft DAP 730
Total DAP 7,560MAP 3,710MAP Powder 320MES 250TSP 730Phosphate Fertilizer 12,570
Michael. R. RahmMarket Analysis & Strategic PlanningThe Mosaic [email protected]
Joseph FungMarket Analysis & Strategic PlanningThe Mosaic [email protected]
The Mosaic Company2005 Phosphate Rock Capacity by Mine
Unit: Million Tonnes Rock
Mine 2005 Q1 Status CapacityFort Green Operating 4.2Fort Meade Idle naFour Corners Operating 7.3Hookers Prairie Operating 2.5Hopewell Operating 0.7Kingsford Operating 3.2South Fort Meade* Expansion 5.2Wingate Creek** Re-starting 1.2Total 24.3
0
5
10
15
20
25
Million Tonnes Rock
Top Five Rock Producers by Capacity
Phosphate Rock Production 2003
OCPGCT
JPMCMosa
ic
PhosAgro
OCP 17%
PhosAgro 6%GCT 6%
JPMC 6%
Other 51%Mosaic 15%
* South Fort Meade capacity will increase to 5.9 million tonnes when the expansion is completed.
** Wingate Creek capacity will increase to 1.4 million tonnes when fully operational.
Certain statements contained herein constitute “forward-looking statements” as that term is defined under the Private Securities LitigationReform Act of 1995. Although we believe that the assumptions made in connection with the forward-looking statements are reasonable,such forward-looking statements involve known and unknown risks, uncertainties and other factors that may cause the actual results, per-formance or achievements of The Mosaic Company, or industry results, to be materially different from those contemplated or projected,forecast, estimated or budgeted in or expressed or implied by such forward-looking statements. Such factors include, among others, thefollowing: the effect of legislative or regulatory changes in jurisdictions in which Mosaic’s businesses are engaged; the ability of Mosaic toobtain the regulatory permits necessary for continued operations of its businesses in a manner consistent with their current operation andfor expansion of those operations; contingencies related to environmental liability under U.S. federal and state and foreign environmentallaws and regulations.
This publication may not be distributed, reproduced, or used without the express written consent of Mosaic. This publication contains opin-ions, interpretations and predictions of The Mosaic Company. The Mosaic Company makes no representations or warranties with respectto the accuracy, reliability or completeness of the information contained in this publication. It is not intended that any party rely, in any way,on the information contained in this publication. The Mosaic Company disclaims any liability with respect to any claims arising out of or relat-ing to reliance on any information contained in this publication.
This issue of Market Mosaic is available at www.mosaicco.com.
The Mosaic Company12800 Whitewater Drive, MS 190Minnetonka, MN 55343USA
(800) 918-8270
Source: IFA, Mosaic and company reports.
Source: IFA, Mosaic and company reports.
Phosphoric AcidPhosphoric acid is an intermediate product used to
produce high analysis phosphate fertilizer, animal feed
ingredients and purified food and industrial products.
Mosaic ranks as the largest phosphoric acid player in the world
based on capacities compiled by IFA. The top five players
account for 36 percent of global acid capacity.
Mosaic currently produces phosphoric acid at six facilities – five
in Florida and one in Louisiana. Another facility in Louisiana is
idle due to market conditions. The seven facilities have a combined annual capacity of 6.1 million
tonnes P2O5 and account for 14 percent of global capacity.
Phosphoric acid is produced by reacting finely ground phosphate rock with sulphuric acid. Mosaic
currently produces sulphuric acid from elemental sulphur at 20 plants located at these facilities. Mosaic
is the largest consumer of elemental sulphur with current requirements totaling approximately
5.0 million long tons.
0
1
2
3
4
5
6
7
MMT P2O5
Top Five Phosphoric Acid Producers by Capacity
Phosphoric Acid Capacity 2004
OCP GCT
PotashCorp
Mosaic
PhosAgro
Mosaic 14%
PotashCorp 8%
PhosAgro 4%GCT 4%
Other 64%
OCP 8%
The Mosaic Company2005 Phosphoric Acid Capacity by Facility
Unit: 1000 Tonnes P2O5Facility 2005 Q1 Status CapacityBartow Operating 950Faustina Idle 520Green Bay Operating 640New Wales Operating 1,720Riverview Operating 860South Pierce Operating 540Uncle Sam Operating 870Total 6,100
Source: IFA, Mosaic and company reports.

Phosphate rock production, much like potash pro-duction, is concentrated in a small number of countries.IFA statistics show that 30 countries mined phosphaterock in 2003, but the top five accounted for nearlythree-quarters of total output and the top 10 countriesaccounted for almost 90 percent of world production.By comparison, the top five potash producing countriesaccounted for 85 percent of total output and the top 10accounted for 97 percent of world production.
Global Rock Trade
Rock trade totaled more than 30 million tonnes ormore than one-fifth of global production in 2004,according to IFA statistics and Mosaic estimates. Thetop five exporters account for 80 percent of totalexports and the top 10 countries account for morethan 95 percent. Morocco sits high atop the list of rockexporting countries, accounting for almost 40 percentof total exports. Morocco shipped 11.8 million tonnesof rock or roughly 45 percent of its production to off-shore customers in 2004. The United States is thelargest destination for Moroccan rock.
Rock trade is trending downward, however. Afterclimbing to 34 million tonnes in 1997 rock trade hasdropped to the 30 million tonne mark today. Thattrend is expected to accelerate because two of the threelargest exporters – namely Morocco and China – are
building or planning to build additional phosphoricacid capacity and will upgrade more of their rock intohigher analysis fertilizer such as diammonium phos-phate (DAP) and monoammonium phosphate (MAP).The economics of upgrading ore into higher analysisproducts at larger scale facilities at the source of rocksimply beat the economics of shipping rock far distances to smaller scale plants that produce mainlylower analysis products such as single superphosphate(SSP) or NPK compounds.
Demand Pull Pressure
The global phosphate market is expected to tightenduring the next five years as demand outpaces supplyand pulls mine operating rates up to or beyond theupper end of the historical range. World phosphate useis growing again following six years of dormancy. Usestalled at approximately 33 million tonnes P2O5 from1997 to 2002, but recent statistics indicate that abroad-based recovery in world phosphate demand isunderway. According to estimates released by IFA inDecember, world phosphate use increased 2.5 percentor 860,000 tonnes P2O5 in 2003 and another 2.8 percent or almost 1.0 million tonnes to 35.6 milliontonnes P2O5 in 2004. Although Brazil has led thisrecovery, IFA statistics show that nine of 13 regionsregistered increases in phosphate use in 2004.
A number of the key producers will face challenges justto maintain output or enhance rock quality let alone gear-up output to match demand during the next five years.
U.S. Rock Challenges
The United States still ranks as the largest phosphaterock producer in the world, but recent trends illustratethe challenges facing U.S. rock producers. U.S. rockoutput has declined more than 20 percent from 45 million tonnes in the mid-1990s to approximately 35 million tonnes in 2004. The U.S. share of worldrock production has declined nine percentage pointsfrom 33 percent to 24 percent during the last 10 years.
U.S. rock costs also have escalated during the last 10years. The Fertilizer Institute’s (TFI) annual cost ofproduction surveys show that the average unit costincreased approximately 40 percent from $17 per tonin the mid-1990s to more than $24 per ton in 2003.Rock costs no doubt increased again in 2004. In addition, rock quality also has deteriorated during thisperiod. The average phosphate content as measured byBPL (or Bone Phosphate of Lime) has dropped frommore than 66 percent in 1995 to less than 63 percentin 2003, according to TFI survey data.
Mark Twain, the American author and humorist,once quipped, “the reports of my death are greatlyexaggerated!” Despite these sobering trends, the samecould be said of the U.S. phosphate industry. Sometrends no doubt will continue. U.S. rock productionwill continue to trend down as reserves are exhaustedor as the cost of mining the last spoonful of ore at aproperty becomes prohibitive.
The U.S. phosphate industry today is smaller than10 years ago and the industry five years from now likely will be smaller than today. Surviving producers,however, will reverse other trends. For example, thekey value driver pulling together IMC Global andCargill Crop Nutrition to form The Mosaic Company isthe potential cost synergies from optimizing rock min-ing operations in central Florida. The combination ofthese side-by-side operations provides a unique oppor-tunity to reduce mining costs.
U.S. phosphate producers also face challenges such asdeveloping more efficient methods to process lower qualityrock and building new mines in an increasingly stringentregulatory environment. But no one should sign the U.S.phosphate industry’s death certificate just yet. Location,scale and configuration advantages will keep the U.S.phosphate industry at the low end of the global costcurve. A smaller U.S. industry still will remain a large andformidable force.
The Transition of China’s Phosphate Industry
China’s phosphate industry is undergoing a significanttransition today. Large players with access to rock arebuilding significant new phosphoric acid and granulationcapacity at mine sites in the main phosphate rock producing provinces of Guizhou, Hubei and Yunnan.These producers plan to upgrade more of the local rockinto higher quality and higher analysis products such asDAP and MAP rather than export rock or ship the orefar distances to domestic buyers who operate smallerscale plants and manufacture lower analysis productssuch as fused calcium magnesium phosphate (FCMP),SSP or NPK compounds. High international fob prices,record ocean freight and an undervalued RMB are boost-ing the profitability of the China phosphate industry andaccelerating this transition.
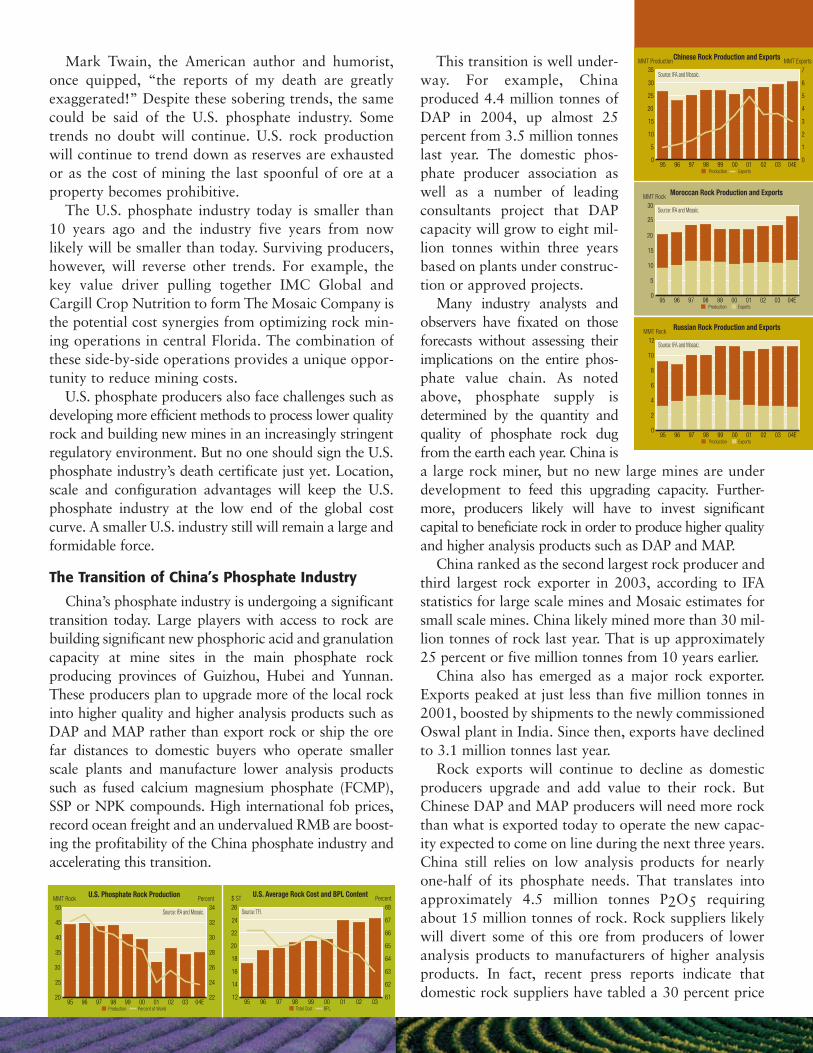
This transition is well under-way. For example, China produced 4.4 million tonnes ofDAP in 2004, up almost 25 percent from 3.5 million tonneslast year. The domestic phos-phate producer association aswell as a number of leadingconsultants project that DAPcapacity will grow to eight mil-lion tonnes within three yearsbased on plants under construc-tion or approved projects.
Many industry analysts andobservers have fixated on thoseforecasts without assessing theirimplications on the entire phos-phate value chain. As notedabove, phosphate supply isdetermined by the quantity andquality of phosphate rock dugfrom the earth each year. China isa large rock miner, but no new large mines are underdevelopment to feed this upgrading capacity. Further-more, producers likely will have to invest significant capital to beneficiate rock in order to produce higher qualityand higher analysis products such as DAP and MAP.
China ranked as the second largest rock producer andthird largest rock exporter in 2003, according to IFAstatistics for large scale mines and Mosaic estimates forsmall scale mines. China likely mined more than 30 mil-lion tonnes of rock last year. That is up approximately25 percent or five million tonnes from 10 years earlier.
China also has emerged as a major rock exporter.Exports peaked at just less than five million tonnes in2001, boosted by shipments to the newly commissionedOswal plant in India. Since then, exports have declinedto 3.1 million tonnes last year.
Rock exports will continue to decline as domesticproducers upgrade and add value to their rock. ButChinese DAP and MAP producers will need more rockthan what is exported today to operate the new capac-ity expected to come on line during the next three years.China still relies on low analysis products for nearlyone-half of its phosphate needs. That translates intoapproximately 4.5 million tonnes P2O5 requiringabout 15 million tonnes of rock. Rock suppliers likelywill divert some of this ore from producers of loweranalysis products to manufacturers of higher analysisproducts. In fact, recent press reports indicate thatdomestic rock suppliers have tabled a 30 percent price
increase for the first quarter of this year, making SSPor NPK compound production less profitable oruneconomic at smaller scale plants in the hinterlands.The same sources report that some of these manufac-turers are exploring the economics of rock imports.
A Re-Configuration of Moroccan Industry
Morocco currently ranks as the third largest rockproducer and the largest rock exporter. Rock produc-tion averaged about 23 million tonnes per year from1997 to 2003, but then jumped to about 26 milliontonnes in 2004.
Morocco is the only major producer who marketssignificant quantities of phosphate at all stages of pro-cessing – as a raw material (rock), as an intermediateproduct (acid) and as a final product (DAP, MAP andTSP). In the past, Morocco typically exported rough-ly one-half of its rock and upgraded the other one-halfinto phosphoric acid. Approximately one-half to two-thirds of its acid was exported with the remainderupgraded into finished fertilizer.
Morocco is re-configuring its phosphate operationsto upgrade more rock into acid and more acid intofinished fertilizer, but no new large mine develop-ments are planned to feed these facilities. In particu-lar, Morocco is debottlenecking existing granulationlines and building a new granulation plant at Jorf
Lasfar. Morocco also is constructing a new joint ven-ture phosphoric acid plant at the same complex andevaluating a large scale joint venture project withBunge to develop new acid and granulation capacity.
The re-configuration provides insurance againstchanges in the DAP subsidy policy in India, the majordestination for phosphoric acid, and results in a better product mix to supply rapidly growing marketsin South America.
Stable Russian Output at a Cost
Russia rounds out the top four rock producers.Russia mined just more than 11 million tonnes of highquality rock in 2004. Output has remained steady atthis level since 1999. Rock exports, however, peakedat 4.8 million tonnes in 1998 and then declined to 3.2million tonnes in 2004. Russian manufacturers alsoare upgrading more rock into DAP, MAP and NPKsthan just a few years ago.
Prospects for Russian rock production look flat atbest. In fact, both Russian rock producers have indi-cated that substantial capital investment is requiredjust to maintain output at the 11 million tonnemark. Furthermore, exports of rock and phosphatefertilizer could fall further if domestic demandbegins to recover.
It’s the rock.n
The Mosaic Company reports financial results for four
operating segments: Phosphates, Potash, Nitrogen and
Offshore. This issue of Market Mosaic describes the opera-
tions of the Phosphates segment. Future issues will provide
similar descriptions of the other three segments.
Large U.S. mining and processing operations anchor the
Phosphates reporting segment, but the unit also includes
North American phosphate distribution and equity earnings
from South Fort Meade Partnership, L.P. and Gulf Sulphur
Services Ltd., LLLP. Only the U.S. mining and processing
operations are highlighted in this description.
Top 10 Rock Exporters 2003 MMT Rock Cumulative Percent
0
2
4
6
8
10
12
14
30
40
50
60
70
80
90
100Source: IFA.
China
Morocco Russia Tunisia
Jordan
Israel
AlgeriaEgyptTog
oSyria
U.S. Phosphate Rock ProductionMMT Rock Percent
Production Percent of World
20
25
30
35
40
45
50
22
24
26
28
30
32
34
04E030201009998979695
Source: IFA and Mosaic.
U.S. Average Rock Cost and BPL Content$ ST Percent
Total Cost BPL
12
14
16
18
20
22
24
26
61
62
63
64
65
66
67
68
030201009998979695
Source: TFI.
Chinese Rock Production and ExportsMMT Production MMT Exports
Production Exports
0
5
10
15
20
25
30
35 35
0
1
2
3
4
5
6
7
04E030201009998979695
Source: IFA and Mosaic.
Moroccan Rock Production and ExportsMMT Rock
Production Exports
0
5
10
15
20
25
30
04E030201009998979695
Source: IFA and Mosaic.
Russian Rock Production and ExportsMMT Rock
Production Exports
0
2
4
6
8
10
12
04E030201009998979695
Source: IFA and Mosaic.
World Phosphate Rock Trade MMT Rock Percent
Trade Percent of Production
2526272829303132333435
1516171819202122232425
04E030201009998979695
Source: IFA and Mosaic.
Phosphate Operations
0.00
0.25
0.50
0.75
1.00
1.25
1.50MMT
Top Five Feed Phosphate Producers by Capacity
Feed Phosphate Capacity 2004
OCPBunge
PotashCorp
Mosaic
Tessen
derlo Lomon
Potash Corp 17%
Tessenderlo 12%
Bunge 6% Lomon 7%
Other 44% Mosaic 14%
Feed PhosphateMosaic is the second largest feed phosphate player in the
world, based on current capacity estimates. Mosaic pro-
duces feed phosphate at its Riverview and New Wales facilities
in Florida as well as at its Cubatao complex in Brazil. The three
facilities have a combined capacity of 1.1 million tonnes of prod-
uct and account for 14 percent of global capacity. The top five
feed players account for just less than 60 percent of world feed
phosphate capacity.
The New Wales complex produces dicalcium phosphate (Dical),
monocalcium phosphate (Monocal), monoammonium phosphate and defluorinated rock phosphate (DFP).
The Riverview operations produce Dical and Monocal. The Riverview complex provides ready access to the
growing international market for feed phosphate. The Cubatao facility produces Dical for the rapidly expanding
local market.
Mosaic markets all of its U.S. feed phosphate production under long-established and well-respected
brands. Dical is marketed under the brand name Dynafos and Monocal is sold under the brand name
Biofos. DFP is marketed under the brand name Multifos.
The Mosaic Company2005 Feed Phosphate Capacity
by FacilityUnit: 1000 Tonnes of Product
Facility Product CapacityNew Wales Calcium Phosphate 580
Defluorinated Rock 170Riverview Calcium Phosphate 250Cubatao Calcium Phosphate 110Total Calcium Phosphate 940
Defluorinated Rock 170Feed Phosphate 1,110
Source: IFA, Mosaic and company reports.
Mosaic Phosphate Operations
Phosphate rock production, much like potash pro-duction, is concentrated in a small number of countries.IFA statistics show that 30 countries mined phosphaterock in 2003, but the top five accounted for nearlythree-quarters of total output and the top 10 countriesaccounted for almost 90 percent of world production.By comparison, the top five potash producing countriesaccounted for 85 percent of total output and the top 10accounted for 97 percent of world production.
Global Rock Trade
Rock trade totaled more than 30 million tonnes ormore than one-fifth of global production in 2004,according to IFA statistics and Mosaic estimates. Thetop five exporters account for 80 percent of totalexports and the top 10 countries account for morethan 95 percent. Morocco sits high atop the list of rockexporting countries, accounting for almost 40 percentof total exports. Morocco shipped 11.8 million tonnesof rock or roughly 45 percent of its production to off-shore customers in 2004. The United States is thelargest destination for Moroccan rock.
Rock trade is trending downward, however. Afterclimbing to 34 million tonnes in 1997 rock trade hasdropped to the 30 million tonne mark today. Thattrend is expected to accelerate because two of the threelargest exporters – namely Morocco and China – are
building or planning to build additional phosphoricacid capacity and will upgrade more of their rock intohigher analysis fertilizer such as diammonium phos-phate (DAP) and monoammonium phosphate (MAP).The economics of upgrading ore into higher analysisproducts at larger scale facilities at the source of rocksimply beat the economics of shipping rock far distances to smaller scale plants that produce mainlylower analysis products such as single superphosphate(SSP) or NPK compounds.
Demand Pull Pressure
The global phosphate market is expected to tightenduring the next five years as demand outpaces supplyand pulls mine operating rates up to or beyond theupper end of the historical range. World phosphate useis growing again following six years of dormancy. Usestalled at approximately 33 million tonnes P2O5 from1997 to 2002, but recent statistics indicate that abroad-based recovery in world phosphate demand isunderway. According to estimates released by IFA inDecember, world phosphate use increased 2.5 percentor 860,000 tonnes P2O5 in 2003 and another 2.8 percent or almost 1.0 million tonnes to 35.6 milliontonnes P2O5 in 2004. Although Brazil has led thisrecovery, IFA statistics show that nine of 13 regionsregistered increases in phosphate use in 2004.
A number of the key producers will face challenges justto maintain output or enhance rock quality let alone gear-up output to match demand during the next five years.
U.S. Rock Challenges
The United States still ranks as the largest phosphaterock producer in the world, but recent trends illustratethe challenges facing U.S. rock producers. U.S. rockoutput has declined more than 20 percent from 45 million tonnes in the mid-1990s to approximately 35 million tonnes in 2004. The U.S. share of worldrock production has declined nine percentage pointsfrom 33 percent to 24 percent during the last 10 years.
U.S. rock costs also have escalated during the last 10years. The Fertilizer Institute’s (TFI) annual cost ofproduction surveys show that the average unit costincreased approximately 40 percent from $17 per tonin the mid-1990s to more than $24 per ton in 2003.Rock costs no doubt increased again in 2004. In addition, rock quality also has deteriorated during thisperiod. The average phosphate content as measured byBPL (or Bone Phosphate of Lime) has dropped frommore than 66 percent in 1995 to less than 63 percentin 2003, according to TFI survey data.
Mark Twain, the American author and humorist,once quipped, “the reports of my death are greatlyexaggerated!” Despite these sobering trends, the samecould be said of the U.S. phosphate industry. Sometrends no doubt will continue. U.S. rock productionwill continue to trend down as reserves are exhaustedor as the cost of mining the last spoonful of ore at aproperty becomes prohibitive.
The U.S. phosphate industry today is smaller than10 years ago and the industry five years from now likely will be smaller than today. Surviving producers,however, will reverse other trends. For example, thekey value driver pulling together IMC Global andCargill Crop Nutrition to form The Mosaic Company isthe potential cost synergies from optimizing rock min-ing operations in central Florida. The combination ofthese side-by-side operations provides a unique oppor-tunity to reduce mining costs.
U.S. phosphate producers also face challenges such asdeveloping more efficient methods to process lower qualityrock and building new mines in an increasingly stringentregulatory environment. But no one should sign the U.S.phosphate industry’s death certificate just yet. Location,scale and configuration advantages will keep the U.S.phosphate industry at the low end of the global costcurve. A smaller U.S. industry still will remain a large andformidable force.
The Transition of China’s Phosphate Industry
China’s phosphate industry is undergoing a significanttransition today. Large players with access to rock arebuilding significant new phosphoric acid and granulationcapacity at mine sites in the main phosphate rock producing provinces of Guizhou, Hubei and Yunnan.These producers plan to upgrade more of the local rockinto higher quality and higher analysis products such asDAP and MAP rather than export rock or ship the orefar distances to domestic buyers who operate smallerscale plants and manufacture lower analysis productssuch as fused calcium magnesium phosphate (FCMP),SSP or NPK compounds. High international fob prices,record ocean freight and an undervalued RMB are boost-ing the profitability of the China phosphate industry andaccelerating this transition.
This transition is well under-way. For example, China produced 4.4 million tonnes ofDAP in 2004, up almost 25 percent from 3.5 million tonneslast year. The domestic phos-phate producer association aswell as a number of leadingconsultants project that DAPcapacity will grow to eight mil-lion tonnes within three yearsbased on plants under construc-tion or approved projects.
Many industry analysts andobservers have fixated on thoseforecasts without assessing theirimplications on the entire phos-phate value chain. As notedabove, phosphate supply isdetermined by the quantity andquality of phosphate rock dugfrom the earth each year. China isa large rock miner, but no new large mines are underdevelopment to feed this upgrading capacity. Further-more, producers likely will have to invest significant capital to beneficiate rock in order to produce higher qualityand higher analysis products such as DAP and MAP.
China ranked as the second largest rock producer andthird largest rock exporter in 2003, according to IFAstatistics for large scale mines and Mosaic estimates forsmall scale mines. China likely mined more than 30 mil-lion tonnes of rock last year. That is up approximately25 percent or five million tonnes from 10 years earlier.
China also has emerged as a major rock exporter.Exports peaked at just less than five million tonnes in2001, boosted by shipments to the newly commissionedOswal plant in India. Since then, exports have declinedto 3.1 million tonnes last year.
Rock exports will continue to decline as domesticproducers upgrade and add value to their rock. ButChinese DAP and MAP producers will need more rockthan what is exported today to operate the new capac-ity expected to come on line during the next three years.China still relies on low analysis products for nearlyone-half of its phosphate needs. That translates intoapproximately 4.5 million tonnes P2O5 requiringabout 15 million tonnes of rock. Rock suppliers likelywill divert some of this ore from producers of loweranalysis products to manufacturers of higher analysisproducts. In fact, recent press reports indicate thatdomestic rock suppliers have tabled a 30 percent price
increase for the first quarter of this year, making SSPor NPK compound production less profitable oruneconomic at smaller scale plants in the hinterlands.The same sources report that some of these manufac-turers are exploring the economics of rock imports.
A Re-Configuration of Moroccan Industry
Morocco currently ranks as the third largest rockproducer and the largest rock exporter. Rock produc-tion averaged about 23 million tonnes per year from1997 to 2003, but then jumped to about 26 milliontonnes in 2004.
Morocco is the only major producer who marketssignificant quantities of phosphate at all stages of pro-cessing – as a raw material (rock), as an intermediateproduct (acid) and as a final product (DAP, MAP andTSP). In the past, Morocco typically exported rough-ly one-half of its rock and upgraded the other one-halfinto phosphoric acid. Approximately one-half to two-thirds of its acid was exported with the remainderupgraded into finished fertilizer.
Morocco is re-configuring its phosphate operationsto upgrade more rock into acid and more acid intofinished fertilizer, but no new large mine develop-ments are planned to feed these facilities. In particu-lar, Morocco is debottlenecking existing granulationlines and building a new granulation plant at Jorf
Lasfar. Morocco also is constructing a new joint ven-ture phosphoric acid plant at the same complex andevaluating a large scale joint venture project withBunge to develop new acid and granulation capacity.
The re-configuration provides insurance againstchanges in the DAP subsidy policy in India, the majordestination for phosphoric acid, and results in a better product mix to supply rapidly growing marketsin South America.
Stable Russian Output at a Cost
Russia rounds out the top four rock producers.Russia mined just more than 11 million tonnes of highquality rock in 2004. Output has remained steady atthis level since 1999. Rock exports, however, peakedat 4.8 million tonnes in 1998 and then declined to 3.2million tonnes in 2004. Russian manufacturers alsoare upgrading more rock into DAP, MAP and NPKsthan just a few years ago.
Prospects for Russian rock production look flat atbest. In fact, both Russian rock producers have indi-cated that substantial capital investment is requiredjust to maintain output at the 11 million tonnemark. Furthermore, exports of rock and phosphatefertilizer could fall further if domestic demandbegins to recover.
It’s the rock.n
The Mosaic Company reports financial results for four
operating segments: Phosphates, Potash, Nitrogen and
Offshore. This issue of Market Mosaic describes the opera-
tions of the Phosphates segment. Future issues will provide
similar descriptions of the other three segments.
Large U.S. mining and processing operations anchor the
Phosphates reporting segment, but the unit also includes
North American phosphate distribution and equity earnings
from South Fort Meade Partnership, L.P. and Gulf Sulphur
Services Ltd., LLLP. Only the U.S. mining and processing
operations are highlighted in this description.
Top 10 Rock Exporters 2003 MMT Rock Cumulative Percent
0
2
4
6
8
10
12
14
30
40
50
60
70
80
90
100Source: IFA.
China
Morocco Russia Tunisia
Jordan
Israel
AlgeriaEgyptTog
oSyria
U.S. Phosphate Rock ProductionMMT Rock Percent
Production Percent of World
20
25
30
35
40
45
50
22
24
26
28
30
32
34
04E030201009998979695
Source: IFA and Mosaic.
U.S. Average Rock Cost and BPL Content$ ST Percent
Total Cost BPL
12
14
16
18
20
22
24
26
61
62
63
64
65
66
67
68
030201009998979695
Source: TFI.
Chinese Rock Production and ExportsMMT Production MMT Exports
Production Exports
0
5
10
15
20
25
30
35 35
0
1
2
3
4
5
6
7
04E030201009998979695
Source: IFA and Mosaic.
Moroccan Rock Production and ExportsMMT Rock
Production Exports
0
5
10
15
20
25
30
04E030201009998979695
Source: IFA and Mosaic.
Russian Rock Production and ExportsMMT Rock
Production Exports
0
2
4
6
8
10
12
04E030201009998979695
Source: IFA and Mosaic.
World Phosphate Rock Trade MMT Rock Percent
Trade Percent of Production
2526272829303132333435
1516171819202122232425
04E030201009998979695
Source: IFA and Mosaic.
Phosphate Operations
0.00
0.25
0.50
0.75
1.00
1.25
1.50MMT
Top Five Feed Phosphate Producers by Capacity
Feed Phosphate Capacity 2004
OCPBunge
PotashCorp
Mosaic
Tessen
derlo Lomon
Potash Corp 17%
Tessenderlo 12%
Bunge 6% Lomon 7%
Other 44% Mosaic 14%
Feed PhosphateMosaic is the second largest feed phosphate player in the
world, based on current capacity estimates. Mosaic pro-
duces feed phosphate at its Riverview and New Wales facilities
in Florida as well as at its Cubatao complex in Brazil. The three
facilities have a combined capacity of 1.1 million tonnes of prod-
uct and account for 14 percent of global capacity. The top five
feed players account for just less than 60 percent of world feed
phosphate capacity.
The New Wales complex produces dicalcium phosphate (Dical),
monocalcium phosphate (Monocal), monoammonium phosphate and defluorinated rock phosphate (DFP).
The Riverview operations produce Dical and Monocal. The Riverview complex provides ready access to the
growing international market for feed phosphate. The Cubatao facility produces Dical for the rapidly expanding
local market.
Mosaic markets all of its U.S. feed phosphate production under long-established and well-respected
brands. Dical is marketed under the brand name Dynafos and Monocal is sold under the brand name
Biofos. DFP is marketed under the brand name Multifos.
The Mosaic Company2005 Feed Phosphate Capacity
by FacilityUnit: 1000 Tonnes of Product
Facility Product CapacityNew Wales Calcium Phosphate 580
Defluorinated Rock 170Riverview Calcium Phosphate 250Cubatao Calcium Phosphate 110Total Calcium Phosphate 940
Defluorinated Rock 170Feed Phosphate 1,110
Source: IFA, Mosaic and company reports.
Mosaic Phosphate Operations
0
2
4
6
8
10
12
14MMT DAP+MAP+TSP+MES
Top Five Phosphate Fertilizer Producers by Capacity
Phosphate Fertilizer Capacity 2004
OCP
PotashCorp
PhosAgro
CF Industri
esMosa
ic
Mosaic 18%
PotashCorp 4%PhosAgro 3%
CF Industries 3%
Other 68%
OCP 4%
James Carville, the highly successful and outspoken campaign strategist and nowCNN political analyst, helped guide Bill Clinton to an upset victory over a popularGeorge H. W. Bush in the 1992 U.S. presidential election. Carville gained notoriety by hanging a hand-written sign that read “It’s the economy, stupid!” at headquarters in Little Rock in order to keep the campaign on message.
The phosphate market is a little less complicated than a presidential cam-paign, but if I asked Carville to analyze this market I suspect he would adviseme, “It’s the rock, stupid!” Analysts sometimes overlook or ignore phosphaterock for a variety of reasons, but phosphate supply is determined by the quan-tity and quality of rock mined from the earth each year. Some producers arebuilding phosphoric acid and granulation capacity, but few new rock mines areunder development today. In fact, many rock producers will need to invest sig-
nificant capital just to maintain output or enhance rock quality for theproduction of higher analysis products in these new downstream plants.As a result, phosphate demand looks like it will outpace supply comingfrom the world’s rock mines during the next five years.
World Rock Production
Rock output likely increased to almost 147 million tonnes in 2004, based onstatistics published by the International Fertilizer Industry Association (IFA) andMosaic estimates. That is up 11 percent from a cyclicallow of 132 million tonnes in 2001. Assuming averagephosphate content and normal recovery rates, the increasein world rock output appears in line with the growth infertilizer and non-fertilizer demand during this period.
Based on our estimates of mine capacities, the averagemine operating rate increased from approximately 73percent in 2001 to more than 80 percent in 2004, a highrate by historical standards. Furthermore, the averageoperating rate is forecast to increase to the 85 percentrange during the next five years assuming moderategrowth in phosphate demand as well as new mine devel-opment later this decade.
Vol. 1 No. 1
February 2005
Market Mosaic is a quarterly newsletter published for our customers and suppliers each February, May,August and November by the Market Analysis & Strategic Planning group of The Mosaic Company. The newsletter pieces together small tiles of information to create a picture of the market – a MarketMosaic, so to speak. The analysis draws on external sources of statistical information and from diverseinternal resources that span both the globe as well as all links along the value chain. The first issue of Market Mosaic describes the phosphate operations of The Mosaic Company and assesses the mediumterm outlook for phosphate by examining recent and likely future developments in the global rock market.
Market Mosaic
Top 10 Rock Producers 2003 MMT Rock Cumulative Percent
0
5
10
15
20
25
30
35
40
20
30
40
50
60
70
80
90
100
04E030201009998979695
Source: IFA and Mosaic.
U.S.
China
China
Morocco
Morocco
Russia
Russia
Tunisia
Tunisia
Jordan
Jordan
Brazil
Brazil
Israel
Israel
South Africa
S. Africa
Syria
Syria
— continued inside
It’s the Rock
RockMosaic ranks as the second largest rock miner in the world, according to production statistics published
by the International Fertilizer Industry Association (IFA) for 2003 and industry sources. Production at mines
owned by Mosaic totaled 20.5 million tonnes and accounted for 15 percent
of world production in 2003.
With the acquisition and re-start of the Wingate Creek mine in
November 2004, Mosaic now operates seven mines in central Florida
with a combined capacity of approximately 24 million tonnes. The
addition of the Wingate Creek mine and the expansion of the South
Fort Meade mine will partly offset the drop in output resulting from the
mine-out of the Kingsford property and lower average mining costs.
Mosaic’s developed rock reserves totaled 322 million tonnes at the end of
2003, or 15 years of production at current mining rates. Mosaic owns another 349 million tonnes of undeveloped
reserves that provide another 15-plus years of operation.
The optimization of Florida mining and processing activities is
projected to account for at least one-half of the $145 million of
annual cost synergies. The development of a mining plan that
harvests these significant cost synergies
and reverses recent trends in rock
mining costs is the top out-of-the-
blocks priority for Mosaic.
Phosphate FertilizerMosaic is the largest producer of the three most widely used
high-analysis solid phosphate fertilizer products – namely
diammonium phosphate (DAP), monoammonium phosphate (MAP)
and triple superphosphate (TSP) – based on current capacities com-
piled by IFA. Mosaic currently produces DAP, MAP and TSP as well as
its line of branded specialty products, MicroEssentials (MES), at six
facilities – five in Florida and one in Louisiana. A seventh granulation
plant in Louisiana is idle due to market conditions. The seven plants
have a combined annual capacity of 12.6 million tonnes of product
and account for 18 percent of the world total.
Seven of Mosaic’s 15 granulation plants can produce either DAP or
MAP (or MES). The table provides a breakdown of capacity by product
based on the 2004 production mix, but Mosaic can adjust these
capacities in response to changes in market demand.
Mosaic accounts for a larger share of phosphate fertilizer capacity
because many of the North African players export a significant share
of their phosphoric acid to producers who also import ammonia and
then fabricate DAP at granulation plants located at port facilities.
DAP and MAP are produced by neutralizing phosphoric acid with
anhydrous ammonia. Mosaic ranks as the largest ammonia buyer in
the world with current requirements totaling 1.8 million tonnes.
Mosaic imports ammonia mostly from Caribbean, Russian and
Ukrainian suppliers for its Florida operations. Mosaic also manufac-
tures ammonia at its Faustina, LA facility. Ammonia production at
Faustina exceeds on-site requirements and excess output is sold to
agricultural and industrial users or exchanged for product delivered to
its phosphate plants in central Florida.
Phosphate Operations Phosphate Operations
World Rock Production and Phosphate Use MMT Rock MMT P2O5
Rock Production Phosphate Use
120
125
130
135
140
145
150
28.0000
29.5833
31.1666
32.7499
34.3332
35.9165
37.0
28.0000
29.5833
31.1666
32.7499
34.3332
35.9165
37.4998
04E030201009998979695
Source: IFA and Mosaic.
37.0
35.5
34.0
32.5
31.0
29.5
29.5
28.0
0
5
10
15
20
25
Million Tonnes Rock
Top Five Rock Producers by Capacity
Phosphate Rock Production 2003
OCPGCT
JPMCMosa
ic
PhosAgro
OCP 17%
PhosAgro 6%GCT 6%
JPMC 6%
Other 51%Mosaic 15%
The Mosaic Company2005 Phosphate Fertilizer Capacity
by FacilityUnit: 1000 Tonnes of Product
Facility Product CapacityBartow DAP 1,910
MAP 310MES 60Phosphate Fertilizer 2,280
Faustina DAP 1,560MAP 440Phosphate Fertilizer 2,000
Green Bay DAP 100MAP 1,160Phosphate Fertilizer 1,260
New Wales DAP 2,050MAP 1,240MAP Powder 320Phosphate Fertilizer 3,610
Riverview DAP 1,210MAP 560MES 190Phosphate Fertilizer 1,960
South Pierce TSP 730
Taft DAP 730
Total DAP 7,560MAP 3,710MAP Powder 320MES 250TSP 730Phosphate Fertilizer 12,570
Michael. R. RahmMarket Analysis & Strategic PlanningThe Mosaic [email protected]
Joseph FungMarket Analysis & Strategic PlanningThe Mosaic [email protected]
The Mosaic Company2005 Phosphate Rock Capacity by Mine
Unit: Million Tonnes Rock
Mine 2005 Q1 Status CapacityFort Green Operating 4.2Fort Meade Idle naFour Corners Operating 7.3Hookers Prairie Operating 2.5Hopewell Operating 0.7Kingsford Operating 3.2South Fort Meade* Expansion 5.2Wingate Creek** Re-starting 1.2Total 24.3
0
5
10
15
20
25
Million Tonnes Rock
Top Five Rock Producers by Capacity
Phosphate Rock Production 2003
OCPGCT
JPMCMosa
ic
PhosAgro
OCP 17%
PhosAgro 6%GCT 6%
JPMC 6%
Other 51%Mosaic 15%
* South Fort Meade capacity will increase to 5.9 million tonnes when the expansion is completed.
** Wingate Creek capacity will increase to 1.4 million tonnes when fully operational.
This publication contains opinions, interpretations and predictions of The MosaicCompany. The Mosaic Company makes no representations or warranties with respect tothe accuracy, reliability or completeness of the information contained in this publication.It is not intended that any party rely, in any way, on the information contained in this publication. The Mosaic Company disclaims any liability with respect to any claims arisingout of or relating to reliance on any information contained in this publication.
This issue of Market Mosaic is available at www.mosaicco.com.
The Mosaic Company12800 Whitewater Drive, MS 190Minnetonka, MN 55343USA
(800) 918-8270
Source: IFA, Mosaic and company reports.
Source: IFA, Mosaic and company reports.
Phosphoric AcidPhosphoric acid is an intermediate product used to
produce high analysis phosphate fertilizer, animal feed
ingredients and purified food and industrial products.
Mosaic ranks as the largest phosphoric acid player in the world
based on capacities compiled by IFA. The top five players
account for 36 percent of global acid capacity.
Mosaic currently produces phosphoric acid at six facilities – five
in Florida and one in Louisiana. Another facility in Louisiana is
idle due to market conditions. The seven facilities have a combined annual capacity of 6.1 million
tonnes P2O5 and account for 14 percent of global capacity.
Phosphoric acid is produced by reacting finely ground phosphate rock with sulphuric acid. Mosaic
currently produces sulphuric acid from elemental sulphur at 20 plants located at these facilities. Mosaic
is the largest consumer of elemental sulphur with current requirements totaling approximately
5.0 million long tons.
0
1
2
3
4
5
6
7
MMT P2O5
Top Five Phosphoric Acid Producers by Capacity
Phosphoric Acid Capacity 2004
OCP GCT
PotashCorp
Mosaic
PhosAgro
Mosaic 14%
PotashCorp 8%
PhosAgro 4%GCT 4%
Other 64%
OCP 8%
The Mosaic Company2005 Phosphoric Acid Capacity by Facility
Unit: 1000 Tonnes P2O5Facility 2005 Q1 Status CapacityBartow Operating 950Faustina Idle 520Green Bay Operating 640New Wales Operating 1,720Riverview Operating 860South Pierce Operating 540Uncle Sam Operating 870Total 6,100
Source: IFA, Mosaic and company reports.

0
2
4
6
8
10
12
14MMT DAP+MAP+TSP+MES
Top Five Phosphate Fertilizer Producers by Capacity
Phosphate Fertilizer Capacity 2004
OCP
PotashCorp
PhosAgro
CF Industri
esMosa
ic
Mosaic 18%
PotashCorp 4%PhosAgro 3%
CF Industries 3%
Other 68%
OCP 4%
James Carville, the highly successful and outspoken campaign strategist and nowCNN political analyst, helped guide Bill Clinton to an upset victory over a popularGeorge H. W. Bush in the 1992 U.S. presidential election. Carville gained notoriety by hanging a hand-written sign that read “It’s the economy, stupid!” at headquarters in Little Rock in order to keep the campaign on message.
The phosphate market is a little less complicated than a presidential cam-paign, but if I asked Carville to analyze this market I suspect he would adviseme, “It’s the rock, stupid!” Analysts sometimes overlook or ignore phosphaterock for a variety of reasons, but phosphate supply is determined by the quan-tity and quality of rock mined from the earth each year. Some producers arebuilding phosphoric acid and granulation capacity, but few new rock mines areunder development today. In fact, many rock producers will need to invest sig-
nificant capital just to maintain output or enhance rock quality for theproduction of higher analysis products in these new downstream plants.As a result, phosphate demand looks like it will outpace supply comingfrom the world’s rock mines during the next five years.
World Rock Production
Rock output likely increased to almost 147 million tonnes in 2004, based onstatistics published by the International Fertilizer Industry Association (IFA) andMosaic estimates. That is up 11 percent from a cyclicallow of 132 million tonnes in 2001. Assuming averagephosphate content and normal recovery rates, the increasein world rock output appears in line with the growth infertilizer and non-fertilizer demand during this period.
Based on our estimates of mine capacities, the averagemine operating rate increased from approximately 73percent in 2001 to more than 80 percent in 2004, a highrate by historical standards. Furthermore, the averageoperating rate is forecast to increase to the 85 percentrange during the next five years assuming moderategrowth in phosphate demand as well as new mine devel-opment later this decade.
Vol. 1 No. 1
February 2005
Market Mosaic is a quarterly newsletter published for our customers and suppliers each February, May,August and November by the Market Analysis & Strategic Planning group of The Mosaic Company. The newsletter pieces together small tiles of information to create a picture of the market – a MarketMosaic, so to speak. The analysis draws on external sources of statistical information and from diverseinternal resources that span both the globe as well as all links along the value chain. The first issue of Market Mosaic describes the phosphate operations of The Mosaic Company and assesses the mediumterm outlook for phosphate by examining recent and likely future developments in the global rock market.
Market Mosaic
Top 10 Rock Producers 2003 MMT Rock Cumulative Percent
0
5
10
15
20
25
30
35
40
20
30
40
50
60
70
80
90
100
04E030201009998979695
Source: IFA and Mosaic.
U.S.
China
China
Morocco
Morocco
Russia
Russia
Tunisia
Tunisia
Jordan
Jordan
Brazil
Brazil
Israel
Israel
South Africa
S. Africa
Syria
Syria
— continued inside
It’s the Rock
RockMosaic ranks as the second largest rock miner in the world, according to production statistics published
by the International Fertilizer Industry Association (IFA) for 2003 and industry sources. Production at mines
owned by Mosaic totaled 20.5 million tonnes and accounted for 15 percent
of world production in 2003.
With the acquisition and re-start of the Wingate Creek mine in
November 2004, Mosaic now operates seven mines in central Florida
with a combined capacity of approximately 24 million tonnes. The
addition of the Wingate Creek mine and the expansion of the South
Fort Meade mine will partly offset the drop in output resulting from the
mine-out of the Kingsford property and lower average mining costs.
Mosaic’s developed rock reserves totaled 322 million tonnes at the end
of 2003, or 15 years of production at current mining rates. Mosaic owns another 349 million tonnes of
undeveloped reserves.
The optimization of Florida mining and processing activities is
projected to account for approximately one-half of the $145 million
of annual cost synergies. The development of a mining plan that
harvests these significant cost synergies
and reverses recent trends in rock
mining costs is the top out-of-the-
blocks priority for Mosaic.
Phosphate FertilizerMosaic is the largest producer of the three most widely used
high-analysis solid phosphate fertilizer products – namely
diammonium phosphate (DAP), monoammonium phosphate (MAP)
and triple superphosphate (TSP) – based on current capacities
compiled by IFA. Mosaic currently produces DAP, MAP and TSP as well
as its line of branded specialty products, MicroEssentials™ (MES), at six
facilities – five in Florida and one in Louisiana. A seventh granulation
plant in Louisiana is idle due to market conditions. The seven plants
have a combined annual capacity of 12.6 million tonnes of product
and account for 18 percent of the world total.
Seven of Mosaic’s 15 granulation plants can produce either DAP or
MAP (or MES). The table provides a breakdown of capacity by product
based on the 2004 production mix, but Mosaic can adjust these
capacities in response to changes in market demand.
Mosaic accounts for a larger share of phosphate fertilizer capacity
because many of the North African players export a significant share
of their phosphoric acid to producers who also import ammonia and
then fabricate DAP at granulation plants located at port facilities.
DAP and MAP are produced by neutralizing phosphoric acid with
anhydrous ammonia. Mosaic ranks as the largest ammonia buyer in
the world with current requirements totaling 1.8 million tonnes.
Mosaic imports ammonia mostly from Caribbean, Russian and
Ukrainian suppliers for its Florida operations. Mosaic also manufac-
tures ammonia at its Faustina, LA facility. Ammonia production at
Faustina exceeds on-site requirements and excess output is sold to
agricultural and industrial users or exchanged for product delivered to
its phosphate plants in central Florida.
Phosphate Operations Phosphate Operations
World Rock Production and Phosphate Use MMT Rock MMT P2O5
Rock Production Phosphate Use
120
125
130
135
140
145
150
28.0000
29.5833
31.1666
32.7499
34.3332
35.9165
37.0
28.0000
29.5833
31.1666
32.7499
34.3332
35.9165
37.4998
04E030201009998979695
Source: IFA and Mosaic.
37.0
35.5
34.0
32.5
31.0
29.5
29.5
28.0
0
5
10
15
20
25
Million Tonnes Rock
Top Five Rock Producers by Capacity
Phosphate Rock Production 2003
OCPGCT
JPMCMosa
ic
PhosAgro
OCP 17%
PhosAgro 6%GCT 6%
JPMC 6%
Other 51%Mosaic 15%
The Mosaic Company2005 Phosphate Fertilizer Capacity
by FacilityUnit: 1000 Tonnes of Product
Facility Product CapacityBartow DAP 1,910
MAP 310MES 60Phosphate Fertilizer 2,280
Faustina DAP 1,560MAP 440Phosphate Fertilizer 2,000
Green Bay DAP 100MAP 1,160Phosphate Fertilizer 1,260
New Wales DAP 2,050MAP 1,240MAP Powder 320Phosphate Fertilizer 3,610
Riverview DAP 1,210MAP 560MES 190Phosphate Fertilizer 1,960
South Pierce TSP 730
Taft DAP 730
Total DAP 7,560MAP 3,710MAP Powder 320MES 250TSP 730Phosphate Fertilizer 12,570
Michael. R. RahmMarket Analysis & Strategic PlanningThe Mosaic [email protected]
Joseph FungMarket Analysis & Strategic PlanningThe Mosaic [email protected]
The Mosaic Company2005 Phosphate Rock Capacity by Mine
Unit: Million Tonnes Rock
Mine 2005 Q1 Status CapacityFort Green Operating 4.2Fort Meade Idle naFour Corners Operating 7.3Hookers Prairie Operating 2.5Hopewell Operating 0.7Kingsford Operating 3.2South Fort Meade* Expansion 5.2Wingate Creek** Re-starting 1.2Total 24.3
0
5
10
15
20
25
Million Tonnes Rock
Top Five Rock Producers by Capacity
Phosphate Rock Production 2003
OCPGCT
JPMCMosa
ic
PhosAgro
OCP 17%
PhosAgro 6%GCT 6%
JPMC 6%
Other 51%Mosaic 15%
* South Fort Meade capacity will increase to 5.9 million tonnes when the expansion is completed.
** Wingate Creek capacity will increase to 1.4 million tonnes when fully operational.
Certain statements contained herein constitute “forward-looking statements” as that term is defined under the Private Securities LitigationReform Act of 1995. Although we believe that the assumptions made in connection with the forward-looking statements are reasonable,such forward-looking statements involve known and unknown risks, uncertainties and other factors that may cause the actual results, per-formance or achievements of The Mosaic Company, or industry results, to be materially different from those contemplated or projected,forecast, estimated or budgeted in or expressed or implied by such forward-looking statements. Such factors include, among others, thefollowing: the effect of legislative or regulatory changes in jurisdictions in which Mosaic’s businesses are engaged; the ability of Mosaic toobtain the regulatory permits necessary for continued operations of its businesses in a manner consistent with their current operation andfor expansion of those operations; contingencies related to environmental liability under U.S. federal and state and foreign environmentallaws and regulations.
This publication may not be distributed, reproduced, or used without the express written consent of Mosaic. This publication contains opin-ions, interpretations and predictions of The Mosaic Company. The Mosaic Company makes no representations or warranties with respectto the accuracy, reliability or completeness of the information contained in this publication. It is not intended that any party rely, in any way,on the information contained in this publication. The Mosaic Company disclaims any liability with respect to any claims arising out of or relat-ing to reliance on any information contained in this publication.
This issue of Market Mosaic is available at www.mosaicco.com.
The Mosaic Company12800 Whitewater Drive, MS 190Minnetonka, MN 55343USA
(800) 918-8270
Source: IFA, Mosaic and company reports.
Source: IFA, Mosaic and company reports.
Phosphoric AcidPhosphoric acid is an intermediate product used to
produce high analysis phosphate fertilizer, animal feed
ingredients and purified food and industrial products.
Mosaic ranks as the largest phosphoric acid player in the world
based on capacities compiled by IFA. The top five players
account for 36 percent of global acid capacity.
Mosaic currently produces phosphoric acid at six facilities – five
in Florida and one in Louisiana. Another facility in Louisiana is
idle due to market conditions. The seven facilities have a combined annual capacity of 6.1 million
tonnes P2O5 and account for 14 percent of global capacity.
Phosphoric acid is produced by reacting finely ground phosphate rock with sulphuric acid. Mosaic
currently produces sulphuric acid from elemental sulphur at 20 plants located at these facilities. Mosaic
is the largest consumer of elemental sulphur with current requirements totaling approximately
5.0 million long tons.
0
1
2
3
4
5
6
7
MMT P2O5
Top Five Phosphoric Acid Producers by Capacity
Phosphoric Acid Capacity 2004
OCP GCT
PotashCorp
Mosaic
PhosAgro
Mosaic 14%
PotashCorp 8%
PhosAgro 4%GCT 4%
Other 64%
OCP 8%
The Mosaic Company2005 Phosphoric Acid Capacity by Facility
Unit: 1000 Tonnes P2O5Facility 2005 Q1 Status CapacityBartow Operating 950Faustina Idle 520Green Bay Operating 640New Wales Operating 1,720Riverview Operating 860South Pierce Operating 540Uncle Sam Operating 870Total 6,100
Source: IFA, Mosaic and company reports.