rock mass deformational behaviors during the …
TRANSCRIPT
J. Geotech. Eng., JSCE, No. 764/111 67, 1-10, 2004 June
ROCK MASS DEFORMATIONAL BEHAVIORS DURING
THE EXCAVATION OF THE LARGE-SCALE NATM CAVERN
IN SOFT SEDIMENTARY FORMATION
Pornkasem JONGPRADIST1, Kunifumi TAKEUCHI1, Tomoyuki SHIMURA2 and
Hideyuki HORII3
1Member of JSCE, Ph. D., Civil Eng. Technology Div., Obayashi Corporation
(Konan 2-15-2, Minato-ku, Tokyo 108-8502, Japan) 2Member of JSCE, Civil Eng. Technology Div., Obayashi Corporation
(Konan 2-15-2, Minato-ku, Tokyo 108-8502, Japan) 3Member of JSCE, Ph. D., Professor, Dept. of Civil Eng., University of Tokyo
(Hongo 7-3-1, Bunkyo-ku, Tokyo 113-8656, Japan)
During excavation of a large-scale water storage tunnel in soft mudstone, rock deformations at the tunnel
side wall have unexpectedly increased corresponding to the stepwise bench excavation. The conventional
numerical analysis for designing tunnel supports could not predict such behaviors in advance. In this paper,
some different numerical analyses for tunnel excavation in soft rock will be employed as the methods that
can reasonably represent such rock mass mechanical behaviors. Analyses of large-scale cavern excavation in
soft sedimentary rock will be carried out by them and all analysis results will be compared together with the
measurement data in order to improve the prediction of tunnel deformational behaviors.
Key Words: large-scale cavern, soft sedimentary rock, NATM, numerical analyses, deformational behaviors
1. INTRODUCTION
Many efforts to make effective use of land in urban areas of Japan have been piled up and one solution is to utilize underground space, particularly in the metropolitan Tokyo. This requires advanced
planning, design and construction technologies of various large-scale underground structures. One typical example is to challenge for constructing larger NATM caverns in soft rock. This is a good opportunity to establish the design requirements and methodologies for such an underground construction and numerous studies have been carried out from
viewpoints of both design and construction 1), 2), 3), 4) A key issue is to evaluate the stability of
underground structures and rock masses during excavation, which needs to develop an innovative analysis methodology applying to a diverse range of
geological conditions. Such an analysis requires techniques that can accurately predict the behavior of
rock masses as excavation proceeds. Analysis
methods have gradually shifted from a conventional elastic analysis to non-linear or other more sophisticated ones.
The large-scale tunnel with the cross section area of 254 m2 in soft mudstone was excavated so as to work for a flood control project during severe rainfall in the metropolitan Tokyo11'5). During excavation, rock deformations at the tunnel side wall in some sections had unexpectedly increased corresponding to stepwise bench excavations. Such behaviors could not be predicted by a conventional numerical analysis for designing tunnel supports in advance of actual excavation. Further research of
post numerical analyses is important in order to improve an analysis of rock mass behaviors.
In this paper, to fulfill that purpose, analysis methods for tunnel excavation in soft rock are developed and all results are then compared with the measured data during excavation.
1

2. OUTLINE OF THE LARGE-SCALE NATM TUNNEL
(1) Overview of the project The large-scale tunnel-shaped underground
reservoir was constructed in urban area of Japan. It consists of an inlet shaft, a main tunnel, and a connecting drift. The tunnel is totally 593. 3 m in length for two different cross section tunnels, A and B. In this study, only the tunnel A with the cross sectional area of 254. 1 m2 is considered. The longitudinal tunnel profile with geological conditions and typical cross-section are respectively illustrated in Fig. 1 and 2.
(2) Geological conditions As shown in Fig. 1, the geology consists of, from
the top to bottom, fill materials by the former river channel and alternating layers of mudstone (Ozm) and unconsolidated sand (Ozs), which belong to the Ozenji formation of Quaternary Kazusa group. The main tunnel was excavated in an approximately 40m-thick mudstone formation (Ozm2), avoiding water-bearing sand layer above. Their material and geological properties are listed in Table 1.
(3) Important features Only a few similar projects which have such extra
large section have existed in Japan. The dimensions of tunnel cross section are 17 m in width and 18. 2 m in height, while its overburden depth is around 28 m. Besides, as indicated in Fig. 1, the most significant and critical geological feature encountered during excavation was the existence of unconsolidated and water-bearing sand layer located above the tunnel,
Fig. 1 Longitudinal profile of the NATM cavern and geological conditions
Table 1 Material properties of the sand layer and mudstone
Fig. 2 Typical cross section, support system and excavation sequences of the main tunnel
(tunnel A)
2

which may lead to a collapse of tunnel as the worst case. Moreover, the tunnel is located at highly populated urban area. To ensure the stability of those housing structures during construction, the strict controlling criteria of surface settlement and convergence were designed and applied2 3.
(4) Measuring system and excavation controlling criteria Tunneling in difficult ground conditions,
particularly in case of shallow overburden, relies greatly on daily displacement measurements to check rock mass stability and to continuously confirm excavation and support strategies. In such an excavation work, the observational construction technique of monitoring both tunnel deformations (crown settlement, side wall convergence and radial displacement of surrounding ground) and stresses in lining section and rock bolt has been normally employed. Fig. 3 illustrates the measurement items and locations for this tunnel during construction. Observational and measuring results will be utilized for rational design and construction suitable for the ground conditions. To this end, the behavior of rock masses and tunnel supports will be determined and then evaluated in accordance with the controlling
Table 2 Excavation controlling criteria (Unit = mm)
Fig. 3 Locations and items of observational measurements
▲ Ground displacement
■ Rock bolt axial force
● Steel support stress
● Shortcrete stress
● Load cell axial force
★ Secondary lining stress
◇ Pore water pressure
behind the concrete lining
Fig. 4 Comparison between the results ofconventional analysis
and the measurement data at tunnel section TD 125
(b) Upper half convergence
(c) First bench convergence
(d) Second bench convergence
3

criteria. The controlling criteria of this tunnel deformation
were established from the preliminary numerical results by an elasto-plastic analysis considering the critical strain. Table 2 summarizes the deformational criteria at each measuring location. In this table, the level 3 requires to stop excavation and then to carry out countermeasures against rock instability.
In this study, the emphasis will be placed on the measurement items of crown settlement and horizontal convergence at upper half, first bench and second bench excavation (1-4 excavation shown in Fig. 2).
(5) Design and construction Large-scale cavern excavation in sedimentary
soft rock to be controlled by strict criteria demands a sophisticated strategy to ensure the safety and stability of both cavern itself and existing surface structures. Since almost no tunnel with such a large-scale excavation in soft rock has existed in Japan, the standard design under similar conditions has not existed and thus the tunnel support design and selection of excavation method were determined by an analytical method. Tunnel behaviors by different excavation methods, which are side heading, top heading and center diaphragm, were first numerically analyzed and all of those results were compared before determining the final excavation method and support design. Moreover, the first 50 m of tunnel construction was experimentally monitored as a pilot tunnel (see Fig. 1) by different excavation methods and support patterns to check the appropriateness of the supports. Based on those monitoring results, the mechanical properties of rock masses and analysis method were reviewed and adjusted for the design of both supports and excavation procedure (the reference 2 summarizes the detailed information). The tunnel support system was finally determined
as NATM plain shotcrete and H-section steel arch (H2O0). Furthermore, during upper drift advancing (step 1 and 2), the temporary shotcrete with H-section steel structure (H150) reinforcement was installed. The upper-center drift advancing method was applied in this cavern and multi-step bench cuts followed as illustrated in Fig. 2.
(6) Measurement results during excavation and comparison with analysis results Fig. 4 shows an example of the comparison
between the measurement data of tunnel deformations at tunnel section TD125 and the results of the preliminary elasto-plastic analysis. It is recognized that the preliminary analysis could
predict tunnel deformational behaviors until the end of the 4th excavation step which corresponds to the first bench. After that, the measurements indicate unexpected increases of tunnel lateral deformations. The mechanism of this behavior needs to be identified to properly apply numerical methods for designing tunnel supports in future.
In the comparison between the measurement data and analysis results, the excavation step n-0. 5 denotes the condition of excavation number n in Fig. 2, when the excavation face reaches the considered section and the traction forces are released 50% in the analysis. Excavation step n denotes the completion of that excavation part referring to when the excavation face moved forward 50 m from the considered section and another 50% of traction forces are released in the analysis.
3. NUMERICAL ANALYSES OF EXCAVATING UNDERGROUND CAVERN IN SEDIMENTARY SOFT ROCK FORMATION
Post numerical study (after actual excavation) on the deformational behaviors of large-scale cavern excavated in soft rock is explained in this chapter. It intends to get some insight into the mechanical behavior of rock masses for future improvement of the prediction during excavation.
(1) Experimental results at laboratory A series of triaxial experiments and creep tests
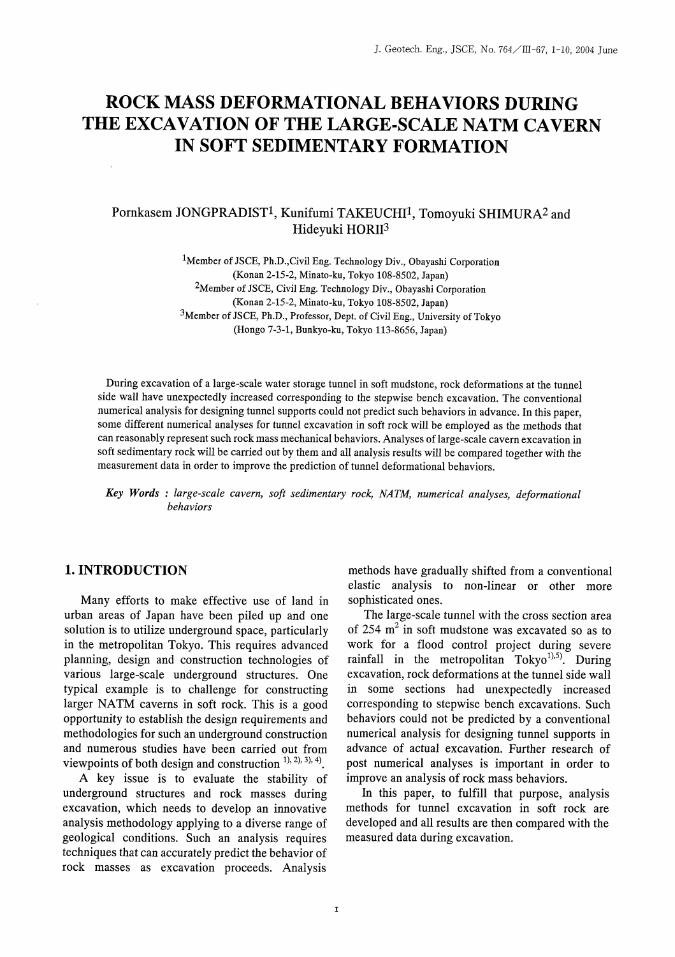
were conducted in order to investigate behaviors of soft mudstone. All specimens were obtained by boring from the construction site. Fig. 5 is the
photographs of deformed specimens after finishing the triaxial experiments. It is clear that different failure modes were observed. Fig. 5 (a) shows a typical shear failure, which is usually observed in triaxial compression test. Whereas, a number of mudstone specimens loaded under confining
pressure of 0. 0-0. 2 MPa exhibit a splitting failure mode as observed in Fig. 5(b). It should be noted that its failure strength by tensile splitting becomes smaller than one failed by shearing. In tunnel excavation, the stress in the radius direction is released and that in the hoop direction is increased. From the study on stress states around tunnel wall computed by an elasto-plastic analysis, it was found that the radial stress at many locations often exists in the range of 0-0. 2MPa during and after excavation.
4
Moreover, a stress at post failure behavior suddenly decreases in low confining stress state. In contrast, a ductile behavior is observed in case of the confining pressure larger than 0.2 MPa. This could suggest that the behavior of soft rock under low confining pressure should be taken into account in prediction of soft rock behaviors.
In creep test, the results reveal that soft mudstone exhibits time dependent behaviors. During 4 days under constant loading (03, at)=(0. 4, 3) MPa, the axial creep strain of 0.2% was measured as illustrated in Fig. 8. Therefore, creep is also one scenario of tunnel deformation and a study on creep by a numerical analysis is explained in the next subsection.
(2) Analysis conditions Plane strain condition and symmetry about
vertical axis are assumed. The half analytical mesh with the size of 60 m width and 80 m height (overburden depth=28m) is thus modeled. Fixed displacement boundary condition in horizontal direction is assumed for both side boundaries while bottom displacement boundary is assumed to be vertically fixed. Rock properties are assumed to be homogenous in all domain and the gravity loading is applied on each element. a) Models of tunnel supports
The tunnel support system in the analyses are shotcrete, H-section steel arch and rock bolts. Shotcrete and steel arch are modeled to be 2D beam
elements with the equivalent sectional properties, while 2D truss elements are assumed for rock bolts. The properties of both shotcrete+steel arch and rock bolts are considered to remain in elastic range.
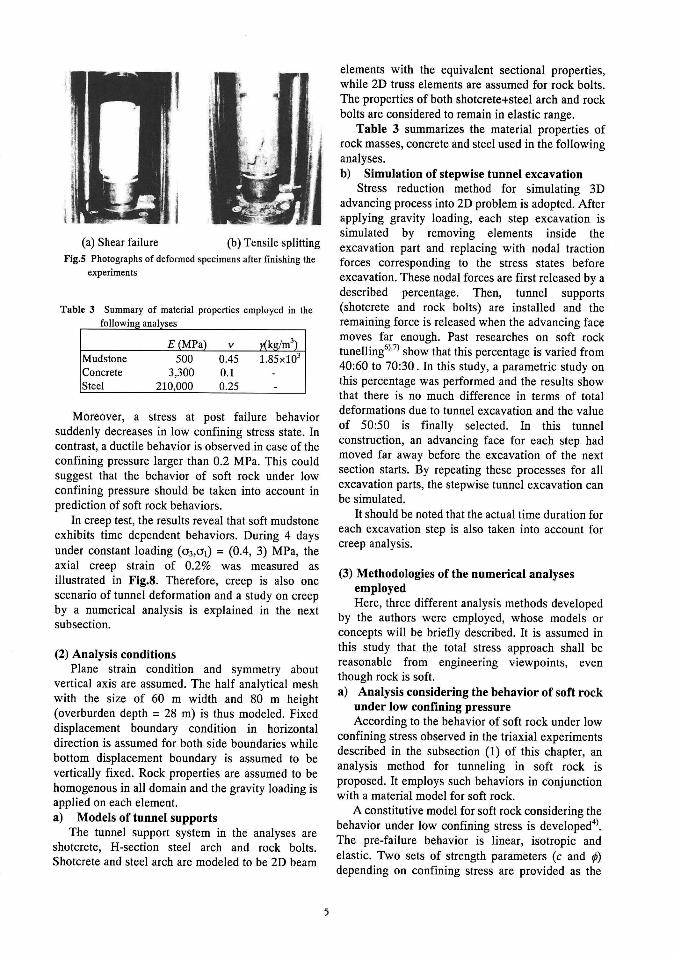
Table 3 summarizes the material properties of rock masses, concrete and steel used in the following analyses.b) Simulation of stepwise tunnel excavation
Stress reduction method for simulating 3D advancing process into 2D problem is adopted. After applying gravity loading, each step excavation is simulated by removing elements inside the excavation part and replacing with nodal traction forces corresponding to the stress states before excavation. These nodal forces are first released by a described percentage. Then, tunnel supports
(shotcrete and rock bolts) are installed and the remaining force is released when the advancing face moves far enough. Past researches on soft rock tunellingbl'7 show that this percentage is varied from 40: 60 to 70: 30. In this study, a parametric study on this percentage was performed and the results show that there is no much difference in terms of total deformations due to tunnel excavation and the value of 50: 50 is finally selected. In this tunnel construction, an advancing face for each step had moved far away before the excavation of the next section starts. By repeating these processes for all excavation parts, the stepwise tunnel excavation can be simulated.
It should be noted that the actual time duration for each excavation step is also taken into account for creep analysis.
(3) Methodologies of the numerical analyses employed
Here, three different analysis methods developed by the authors were employed, whose models or concepts will be briefly described. It is assumed in this study that the total stress approach shall be reasonable from engineering viewpoints, even though rock is soft. a) Analysis considering the behavior of soft rock
under low confining pressure According to the behavior of soft rock under low
confining stress observed in the triaxial experiments described in the subsection (1) of this chapter, an analysis method for tunneling in soft rock is
proposed. It employs such behaviors in conjunction with a material model for soft rock.
A constitutive model for soft rock considering the behavior under low confining stress is developed4)
. The pre-failure behavior is linear, isotropic and elastic. Two sets of strength parameters (c and 0) depending on confining stress are provided as the
Fig. S Photographs of deformed specimens after finishing the
experiments
(a) Shear failure (b) Tensile splitting
Table 3 Summary of material properties employed in the
following analyses
5
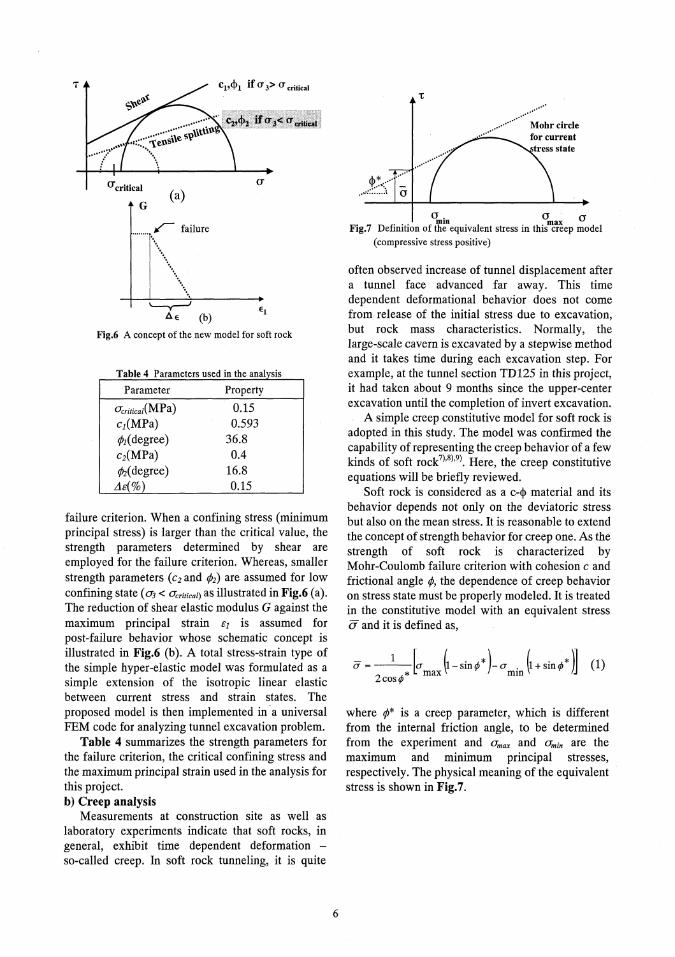
failure criterion. When a confining stress (minimum principal stress) is larger than the critical value, the strength parameters determined by shear are employed for the failure criterion. Whereas, smaller strength parameters (c2 and 02) are assumed for low confining state (O < Ocrital) as illustrated in Fig. 6 (a). The reduction of shear elastic modulus G against the maximum principal strain s1 is assumed for
post-failure behavior whose schematic concept is illustrated in Fig. 6 (b). A total stress-strain type of the simple hyper-elastic model was formulated as a simple extension of the isotropic linear elastic between current stress and strain states. The proposed model is then implemented in a universal FEM code for analyzing tunnel excavation problem.
Table 4 summarizes the strength parameters for the failure criterion, the critical confining stress and the maximum principal strain used in the analysis for this project.b) Creep analysis Measurements at construction site as well as
laboratory experiments indicate that soft rocks, in general, exhibit time dependent deformation -so-called creep. In soft rock tunneling, it is quite
often observed increase of tunnel displacement after a tunnel face advanced far away. This time dependent deformational behavior does not come from release of the initial stress due to excavation, but rock mass characteristics. Normally, the large-scale cavern is excavated by a stepwise method and it takes time during each excavation step. For example, at the tunnel section TD125 in this project, it had taken about 9 months since the upper-center excavation until the completion of invert excavation.
A simple creep constitutive model for soft rock is adopted in this study. The model was confirmed the capability of representing the creep behavior of a few kinds of soft rock8)9). Here, the creep constitutive equations will be briefly reviewed.
Soft rock is considered as a c- material and its behavior depends not only on the deviatoric stress but also on the mean stress. It is reasonable to extend the concept of strength behavior for creep one. As the strength of soft rock is characterized by Mohr-Coulomb failure criterion with cohesion c and frictional angle , the dependence of creep behavior on stress state must be properly modeled. It is treated in the constitutive model with an equivalent stress Q and it is defined as,
(1)
where * is a creep parameter, which is different
from the internal friction angle, to be determined
from the experiment and Umax and Umin are the
maximum and minimum principal stresses,
respectively. The physical meaning of the equivalent
stress is shown in Fig. 7.
Fig. 6 A concept of the new model for soft rock
(a)
c1, 41 if T3>7 critical
(b)
Table 4 Parameters used in the analysis
Fig. 7 Definition of the equivalent stress in this creep model
(compressive stress positive)
Mohr circle for current
tress state
6

To formulate a creep constitutive equation, an
equivalent creep strain has to be defined in addition
to the equivalent stress. Here, the equivalent creep
strain rate is defined as,
(2)
Similar to the flow rule in the theory of plasticity,
the creep flow rule is given by:
(3)
where ) is a scalar function which represents the dependence of creep strain rate on stress, strain and time. The mechanism of creep behavior is considered to be similar to that of plastic deformation, the second invariant of deviatoric stress, J2, is selected for the creep potential g.
g=J2 (4)
A power creep law is introduced as a relationship among equivalent creep strain, equivalent stress and time. The creep law provides the evolution of creep strain in laboratory tests under constant stress. The following simple relationship is adopted in this study.
C=AQmtn (5)
where t stands for creep time which is the time passed after the constant load is applied, A, m and n are material parameters. Equation (5) is for constant stress. To derive the
constitutive relationship under arbitrary loading history, a hardening rule has to be employed. In this study, a time hardening rule (a hardening depending on time) is adopted for simplicity. It is shown that experimental results in this study can be represented by this simple relationship as follows.
C=nA 5 mtn-1 (6)
By substituting Eq. (3) and Eq. (4) into Eq. (2), the equivalent creep strain rate can be expressed as:
(7)
where stands for the deviatoric stress tensor. From Eq. (7) and Eq. (6), A is expressed in terms of current stress, current creep strain and time. Substituting it into the flow rule, the following creep constitutive equation is obtained:
(8)
The above equation is easily implemented into
finite element codes.
Since there is no enough creep test data for this
soft mudstone, it is not possible to find the necessary
parameters used in the creep analysis. Thus, creep
parameters were set from creep tests on a soft mudstone in previous study. Parametric studies on
creep analysis of tunnel excavation were carried out
Table 5 Parameters used in the creep analysis
Fig. 8 Example of creep test on soft mudstone and prediction from
the creep model
Fig. 9 Definition of the parameter RID
Mohr circle
for current
stress state
7

and the values of creep parameters are modified. The values used in this analysis are listed in Table 5 andthe prediction by those parameters are plotted in Fig.8 compared with creep test results. c) Progressive failure analysis considering the
failure behavior under low confining stress According to the results of triaxial tests at low
confining stress, rock sepcimens fail with tensile splitting mode under lower strength. As illustrated inFig.5(b), one clear localized failure plane could be observed. In this subsection, it is assumed that the mechanism of such an increase of tunnel convergence shall be caused by the occurrence of failure plane at tunnel side wall and a method of numerical analysis for underground cavern excavation is developed10 to represent tunnel deformational behaviors. Such a behavior under low confining stress is taken into consideration as the failure criterion before progressive discontinuity will be taken place.
A simplified method is introduced to analyze a strain localization problem which assumes a sub-vertical failure plane at tunnel side wall. Along this plane, slip starts when the failure condition shall be satisfied. It is assumed that the failure is initiated when the shear stress exceeds the Mohr-Coulomb shear strength as follow:
VzC+otanb (9)
The failure behavior of soft rock under low confining stress is taken into account by providing two different sets of strength parameters (c and tb) for this assumed plane. The critical confining stress is assumed to be equal to 0.15 MPa.
To predict the failure path, the starting point of failure plane at the tunnel wall is first determined.
Parameters defined by the shear stress-strength ratio (RID) at any locations along excavation wall are calculated based on the relation (10) at any excavation step.
(10)
The location which has the maximum value of that parameter RID is selected as the starting point of the predicted failure plane. Then, the directions of failure plane at any location are calculated from the stress state at that excavation step based on Mohr-Coulomb criteria. The assumed slip plane can then be estimated from that starting point following those direction vectors calculated. In this analysis case, the maximum value of RID occures at the lower edge of the first bench soon after excavation. By following the above mentioned procedure, the predicted failure plane is obtained as shown in Fig.10.
The interface contact elements having the Mohr-Coulomb criteria are embedded along the assumed failure plane. A sticking behavior is employed to the interface contact elements as the pre-failure state. After sliding starts, the relation between shear stress and shear displacement is satisfied by the interface contact element. In this study, the post-failure shear stress is assumed to depend solely on friction due to normal pressure, which can be defined by Eq (11).
V=atan (11)
The parameter q is assumed to keep the value before failure takes place. In other words, it is equal to 2 if the failure occurs under low confining stress while it will be equal to b1 under larger confining one. For the purpose of comparing all analysis results, material parameters related to the concept of soft rock behavior under low confining stress are selected to be the same as use in the previous analysis method,which are already listed in Table 4.
(4) Comparison of analysis results and measured data at the site All analysis results computed by those above
three analysis methods are compared in Fig.11. The measurement data at the tunnel section TD125 and results from elasto-plastic analysis are also included.
As seen in Fig.11(a), crown settlements by all analysis methods are reasonably close to the measured one although the differences during the
Fig.10 Mesh model included the predicted slip line for the
analysis
8

excavation step 2 are observed. For the upper half convergence, all numerical
results obtained by three developed analysis methods are in good agreement with the measured one, which could not be predicted by an elasto-plastic analysis as shown in Fig. 11(b). In Fig. 11(c), it is seen that better predictions of the convergence of the first bench could be obtained from all developed analysis methods. However, there are still some discrepancies with the measured one. It is noted that the measured convergence of the first bench at the tunnel section TD125 is the largest one among the data available for the entire length of tunnel.
The results of conconvergence at second bench are illustrated in Fig. 11(d). From this figure, the creep analysis and analysis considering the behavior of soft rock under low confining pressure could improve the prediction of tunnel convergence at the second excavation bench, while no significant improvement is observed by the progressive failure analysis.
4. CONCLUSIONS
In this paper, an attempt to improve the prediction of rock mass deformational behaviors during the excavation of the large-scale cavern, which could not be well done by the conventional numerical analysis, is carried out by the post numerical analyses after obtaining measurements during excavation. Three different analysis methods developed for the tunnel excavation in soft rock are employed to analyse the problem and all analysis results are compared with the measured data at the site.
The results of numerical analyses indicate that
prediction of tunnel deformational behaviors could be improved by all analysis methods employed in this study, although there are some discrepancies in quantitative aspect. It should be noted, however, that the measured data from only one tunnel section with corresponding geological properties has been studied in this paper. Further studies for other tunnel sections shall be necessary to validate the models developed here.
In this paper, only studies on tunnel deformations are considered and other measurement items, such as stresses in support members, are not carried out. It is worth doing these in future task.
Fig. 11 Comparison between the measurement data and each
analysis results
(a) Crown settlement
(b) Upper half convergence
(c) First bench convergence
(d) Second bench convergence
9
REFERENCES
1) The Japanese Technical Association of Tunnel: Special Committee Report of the Second Meeting on Onmawashi Water Storage Project December 1999. (Japanese)
2) Himura, H., Gyouda, R., Yamasaki, T. and Goshima, H. NATM for large-scale urban underground of 254 m2 cavern, J. Tunnels and Underground Construction, October 2000,
pp. 37-48. (Japanese)3) Himura, H., Goshima, H. and Tsushima, S.: Construction of a
large-scale tunnel in sedimentary soft rock near a residential area-Onmawashi-Koen regulating reservoir, The Proceedings of Rapid Excavation and Tunneling, 2001.
4) Furuya, Y. and Horii, H.: Analysis of underground cavern considering the behavior of soft rock under low confining
pressure, Proceedings of the Japan Society of Civil Engineering, October 2001. (Japanese)
5) The Japanese Technical Association of Tunnel: Heisei 6th
fiscal year special Committee Report on Construction part for Flood Control Plan: Onmawashi Water Storage Project. March 1995. (Japanese)
6) Ohtsu, H., Ohnishi, Y., Taki, H. and Kamemura, K.: A study
on problems associated with finite element excavation analysis by the stress-flow coupled method, International Journal for Numerical and Analytical Method in Geomechanics, Vol. 23, pp. 1437-1492, 1999.
7) Kunimura, S. Research on tunnel design based on visco-plastic analysis, Doctoral Thesis, The University of Tokyo, September 1999. (Japanese)
8) Jongpradist, P.: Dependence of behavior of soft rock on water content and Analysis of deformed tunnels, Doctoral Thesis, The University of Tokyo, March 2001.
9) Jongpradist, P., Kabele, P., Kunimura, S. and Horii, H.: A creep constitutive model for analysis of tunneling in soft rock, International Journal for Numerical and Analytical Method in Geomechanics. (submitted)
10) Jongpradist, P., Takeuchi, K., Shimura, T., Furuya, Y, and Horii, H.: Analysis of underground cavern considering the failure behavior of soft rock under low confining stress, Proceedings of the 11`h Japan Symposium on Rock Mechanics, January 2002.
(Received September 17, 2002)
軟岩中に建設された大断面都市NATM空 洞の
掘削時岩盤変形挙動に関する解析的研究
PornkasemJONGPRADIST・ 武内 邦文 ・志村 友行 ・堀井 秀之
軟岩中に掘 削された洪水調整のための大規模地下空洞の掘削 中に, ベンチ掘削ステップが進むにつれて
トンネル側壁 部分の岩盤変形量が予期せず増大する現象が計測 された. 支保工 の事前設計の階段で用い ら
れた簡 便な設 計解析によれ ば, このような変形挙動 は事前に予測できなかった. そ こで, 本論文 は, 軟岩
トンネル掘 削のための異なる数種類 の解析法 を採用 し, 上記の挙動 を再現できるかどうかについて研究 し
た. 具体 的には, まず, それ らの解析方法について詳述 し, 大規模地下空洞 の岩盤変形挙動計測データと
それ らの解析結果 を比較す ることによ り, 個々の解析手法によ りどの程度まで変形予測性を改良できるこ
とが可能かについて考察 し, 個々の解析モデルの軟岩への適用性を概略検証することができた.
10