the deformational characteristics of the left...
TRANSCRIPT

843
The Deformational Characteristics of theLeft Ventricle in the Conscious Dog
CRAIG O. OLSEN, J. SCOTT RANKIN, CARL E. ARENTZEN, W. STEVENS RING,
PHILIP A. MCHALE, AND ROBERT W. ANDERSON
SUMMARY We studied left ventricular minor and major axis diameters and equatorial wall thicknessin eleven conscious dogs with chronically implanted pulse-transit ultrasonic dimension transducers.Left ventricular tranemural pressure was measured with micromanometers. Left ventricular volumewas varied by inflation of implanted vena caval or aortic occluders. The geometry of the left ventriclewas represented as a three-dimensional ellipsoidal shell. Left ventricular eccentricity was found to bea linear function of ventricular volume during both diastole and ejection. However, the relationshipwas not the same for diastole and ejection, and during diastole the left ventricle was more spherical atlarge volumes and more elliptical at small volumes than during ejection. The rearrangements ingeometry observed during isovolumic contraction appeared to be transitional stages from the diastolicto the ejection-phase relationship. Thus, during isovolumic contraction, the left ventricle became moreelliptical at large volumes and more spherical at small volumes. These relationships were not alteredsignificantly by increased afterload or inotropic interventions. We also observed that the diastolicdeformation of the ventricular chamber occurred in a set and predictable manner that seemed to bedetermined by the three-dimensional mechanical properties of the myocardium. The geometric inter-relationships of the ventricular wall determined the relationship between diastolic transmural pressureand mural stress. These findings probably reflect basic structural characteristics of the myocardiumand provide a convenient method for quantitatively representing the dynamic geometry of the leftventricle. Circ Res 49: 843-855, 1981
ANALYSIS of myocardial function in the intactheart requires a thorough understanding of thedynamic geometry of the left ventricle. As firsthypothesized by Woods (1892) and recently verifiedby several investigators (Hefner et al., 1962; Burnset al., 1971; McHale and Greenfield, 1973), thegeometry of the ventricular chamber is a majordeterminant of the force within the ventricular wall.This principle is an embodiment of the Laplacerelationship (Laplace, 1839) which predicts that thetensile stress within any shell is a function of thedistending pressure, the radii of curvature, and themural thickness. Because diastolic and systolicstresses are important determinants of myocardialfunction, it is possible that primary alterations inleft ventricular geometry could affect overall car-diac performance adversely, independent ofchanges in the intrinsic functional capabilities ofthe myocardium. Thus, a better understanding of
From the Departments of Surgery and Physiology, Duke UniversityMedical Center, Durham, and the Department of Medicine (Division ofCardiology), Veterans Administration Hospital, Durham, North Carolina
This paper waj presented in part at the 49th Scientific Sesiiong of theAmerican Heart Association, Miami, Florida, November 17, 1977.
This work was supported by Grant 2R01 H 109315-17 from th«National Institutes of Health and by a Whitaker Foundation Grant.
Dr. Rankin wai the recipient of a John A. Hartford FoundationReturch Fellowship Grant.
The present address for Drs, Arentzen, Ring, and Anderson is; De-partment of Surgery, University of Minnesota, Minneapolis, Minnaeota55450.
Address for reprints: Craig O- Oisen, M.D., Boi 3492, Duke UniversityMedical Center, Durham, North Carolina 27710.
Received March 31, 1978, accepted for publication May 5, 1981.
the geometric characteristics of the left ventriclecould improve our ability to differentiate betweennormal and abnormal myocardial function in theintact heart.
Advances in pulse-transit sonomicrometry haveallowed precise measurements of left ventriculargeometry in the experimental animal (Theroux etal., 1974; Rankin et al., 1976). It has been shownthat the dynamic contraction pattern of the leftventricle is not constant but changes with variationsin the physiological state of the preparation (Rush-mer, 1954; Leshin et al., 1972; Rankin et al., 1976).The present report develops this qualitative obser-vation into a quantitative description of the dy-namic geometry of the left ventricle in the consciousdog.
MethodsThe preparation and techniques of data collec-
tion used in these studies have been described inprevious communications (Rankin et al., 1976,1977). Briefly, 11 mongrel dogs were anesthetizedwith intravenous sodium pentobarbital (25 mg/kg)and underwent implantation of pulse-transit ultra-sonic dimension transducers on the left ventricle topermit measurement of minor axis diameter, majoraxis diameter, and equatorial wall thickness. Sili-cone rubber pneumatic occluders were positionedaround both venae cavae, and a silicone rubber tubewas left in the pleura! space to allow the measure-ment of intrapleural pressure. Another silicone rub-
by guest on June 28, 2018http://circres.ahajournals.org/
Dow
nloaded from

844 CIRCULATION RESEARCH VOL. 49, No. 4, OCTOBER 1981
ber tube was implanted in the left atrial chamberand filled with heparinized saline. In four of thedogs, a pneumatic occluder was secured around theascending aorta. In four additional dogs, a StathamTTQ series electromagnetic flow probe was im-planted on the ascending aorta. The azygous veinwas ligated, and the pericardium was left widelyopen. After the connectors had been tunnelled to asubcutaneous pouch, the thoracotomy was repaired.
Seven to 10 days after implantation, each dogwas studied in the conscious state, resting quietlyon its right side. The dimension transducer connec-tors were exteriorized under local anesthesia (5 mlof 1% lidocaine) and coupled directly to a sonomi-crometer. The flow probe leads were connected toa Statham M4001 electromagnetic flowmeter. AMillar PC-350 micromanometer was passed into theleft ventricle through the implanted left atrial tubeand positioned fluoroscopically between the minoraxis diameter transducers. An identical manometerwas passed into the pleural cavity to the surface ofthe mid-left ventricle. Measurements of minor axisdiameter, major axis diameter, equatorial wallthickness, aortic blood flow, left ventricular intra-cavitary pressure, and intrapleural pressure wererecorded on magnetic tape with a Hewlett-Packard3520-B FM recorder. Data were obtained during acontrol period and then during several transientvena caval occlusions which decreased left ventric-ular diastolic transmural pressure to 0 mm Hg. Infour of the dogs, data also were collected during thesteady state infusion of isoproterenol (0.03 MgAgper min). In four other dogs, measurements wereobtained during inflation of the aortic occluders toa stable peak-systolic left ventricular pressure ofapproximately 200 mm Hg. The performance char-acteristics of the equipment used in this study havebeen presented in detail elsewhere (Rankin et al.,1976, 1977).
The analog data were digitized at 5-msec inter-vals by an IBM-1130/System 7 computer and ana-lyzed as previously described (Rankin et al., 1976).The geometry of the left ventricle was presented asa three-dimensional prolate spheroidal shell. Thedynamic internal volume of the defined shell (V)was calculated by means of the formula:
V = - (b - 2h)2 (a - l.lh)6 (1)
where b is the external minor axis diameter, h isthe equatorial wall thickness, and a is the externalmajor axis diameter. The validation of this geomet-ric model has been presented previously. The leftventricular minor axis diameter vs. volume relation-ship was calculated for the diastatic and ejectionphases of the cardiac cycle. The equatorial wallthickness vs. volume relation was calculated simi-larly.
The calculated intracavitary volume was nor-malized according to the Lagrangian equation:
£v = •V - V o
Vo(2)
where ev is the normalized volume, V is the instan-taneous volume, and Vo is the volume obtained at0 mm Hg transmural pressure. The dynamic eccen-tricity (e) at the midwall of the shell was determinedfrom the equation:
e =V(a - 0.55h)2 - (b - h)2
(a - 0.55h)(3)
Eccentricity, as defined here, refers to the degree ofdeviation of a geometric figure from a circle. Acircle has an eccentricity of 0; a straight line has aneccentricity of 1.
The relationship between eccentricity (e) andnormalized volume (ev) was determined for eachventricle during the diastatic phase of diastole andthe ejection phase of systole. Diastatic data weredefined by the computer program. Data from mul-tiple cardiac cycles during a vena caval occlusionwere selected, and the periods of diastasis and ejec-tion were defined over the entire physiologicalrange of ventricular volumes. The diastatic andejection phase relationships between e and ev werefitted with linear regression analyses and the regres-sion constants calculated. Similarly, in four dogs, e-ev data along with the corresponding linear regres-sion constants were obtained during the infusion ofisoproterenol (0.03 MgAg Pe r nun). Within eachstudy, isoproterenol data were compared to controldata using a t-test of the linear regression constants.In four other experiments, e-ev relationships weredetermined during acute increases in peak-systolicpressure by inflation of aortic occluders and werecompared to control data in a similar fashion.
Diastolic midwall minor axis circumference (4)of the assumed ellipsoid was calculated using theequation:
4 = it (b - h) (4)
Major axis midwall circumference (4.) w&s com-puted using the formula:
4(a - 0.55h) E(K) (5)
where K2 = 1 - (b - h)2/(a - 0.55h)2 and wasevaluated as an elliptical function E(K) between 0and TT/2 according to E(K) = \ln Vl - Ks sin2 x dx,x being the function of integration. The minor andmajor axis circumferences and the wall thicknessmeasurements were normalized to a natural straindefinition:
e = In (#<$,) (6)
where e is the strain, ef is the instantaneous dimen-
by guest on June 28, 2018http://circres.ahajournals.org/
Dow
nloaded from

LEFT VENTRICULAR DYNAMIC GEOMETRY/OZsen et al. 845
sion measurement, and ^ is the value of the dimen-sion at 0 mm Hg transmural pressure determinedduring a maximal vena caval occlusion. The nor-malized midwall minor axis circumference wastermed the latitudinal strain, the normalized mid-wall major axis circumference the longitudinalstrain, and the normalized wall thickness was calledthe wall thickness strain. Positive strains in thewall thickness direction were used to denote wallthinning.
The diastolic deformational characteristics ofeach left ventricle were determined from vena cavalocclusion data. Diastolic latitudinal strain (e#) wasplotted vs. wall thickness strain (£h) and also vs.longitudinal strain (e^) over the entire physiologicalrange of ventricular volumes, and the data werefitted to the equations:
(7a)
and
X 6h
X (7b)
using linear regression analyses. The constantsand Kaj defined the relative deformational proper-ties of each ventricle.
The minor axis midwall radius-to-wall thicknessratio (r/h) was calculated for each ventricle duringdiastasis and ejection, and the r/h relationship wasdetermined over the entire range of physiologicalvolumes during caval occlusions. The diastatic andejection phase relationships were compared using at-test of the linear regression constants.
The transmural pressure of the left ventricle wascomputed from the digitized data as the differencebetween the intracavitary pressure and the intra-pleural pressure. The mean tensile stress in theminor axis circumference (latitudinal stress) wascalculated using the formula:
Proh
.rb
3
r.2(2rb(8)
where ae is the latitudinal stress, P is the transmuralpressure, rb is the minor axis midwall radius, ra isthe major axis midwall radius, and h is the equato-rial wall thickness. This equation has been validatedpreviously in our laboratory (McHale and Green-field, 1973). The mean tensile stress in the majoraxis circumference (longitudinal stress) was com-puted using the equation:
Prb2
h(2rb + h)(9)
where a^ is the longitudinal stress (Sandier andDodge, 1963). Average stress in the wall thicknessdirection (wall thickness stress), ah, was calculatedas one-half of the transmural pressure.
The diastatic relationship between transmuralpressure and the calculated latitudinal tensile stress
was determined by fitting data from multiple dias-toles during a vena caval occlusion to the formula:
a, = P X Kpg (10a)
where K^e is the linear regression constant. Simi-larly, the relationship between diastolic pressureand the calculated longitudinal stress was derivedfrom the equation:
a* = P X K,•M- (10b)
where Kp , is the linear regression constant. Theejection phase relationships between a<> and a^ vs.transmural pressure were calculated in a similarmanner and the regression constant Kp« and KMwere determined. The ejection phase and diastaticdata were compared with a £-test of the linearregression constants.
The static elastic characteristics of the myocar-dium in the latitudinal, longitudinal, and wall thick-ness directions were determined from vena cavalocclusion data. In each occlusion, the periods ofdiastasis (de/dt = 0 sec"1 ± 5% sec"1) were selectedautomatically by the computer program from suc-cessive diastoles as left ventricular volume progres-sively decreased. Using a nonlinear regression com-putational algorithm based on a Gauss-Newton it-erative technique that employed a Taylor Serieslinearization (Draper and Smith, 1966), the staticstress-strain data in each of the three directionswere fitted to the equation:
a = (11)
where a and ft are nonlinear static elastic coeffi-cients. Latitudinal, longitudinal, and wall thicknessstatic elastic coefficients were calculated for eachventricle. The static elastic coefficients from all thedogs for each of the three directions were comparedstatistically with the Hotelling's T2 test employingthe pooled within-groups covariance matrix analy-sis of the logarithmically transformed coefficients.
In the statistical analysis, linear relationshipswere fitted with a standard least squares linearregression analysis, and the slope (m), intercept (b),and correlation coefficient (r) were calculated. Datawere compared with the use of Student's two-tailedt-te&t for paired data.
Results
Representative dimension, flow, and pressuredata are shown in digital form in Figure 1. Data attwo different end-diastolic volumes are presentedto illustrate the volume-dependence of left ventric-ular dynamic geometry. At normal end-diastolicvolumes, isovolumic contraction (indicated by seg-ment IC in Fig. 1A) was accompanied by a decreasein minor axis diameter and an increase in majoraxis diameter; left ventricular shape became moreelliptical. During isovolumic relaxation (segment
by guest on June 28, 2018http://circres.ahajournals.org/
Dow
nloaded from
846 CIRCULATION RESEARCH VOL. 49, No. 4, OCTOBER 1981
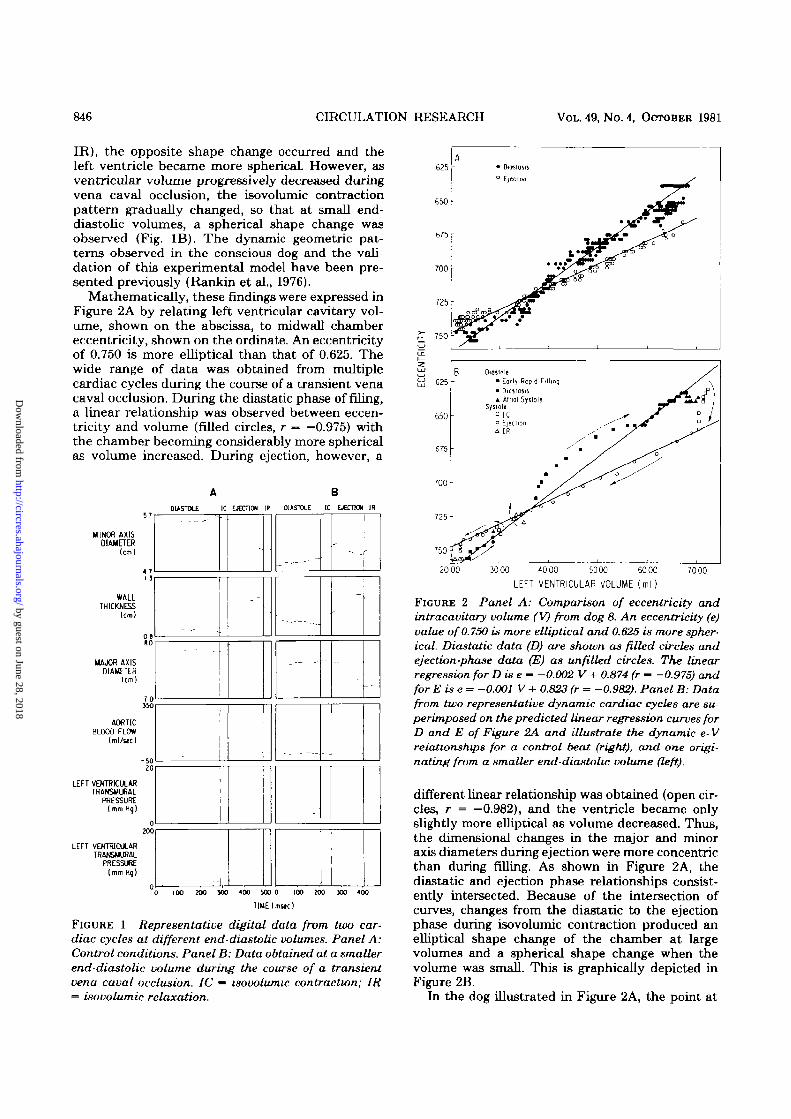
IR), the opposite shape change occurred and theleft ventricle became more spherical. However, asventricular volume progressively decreased duringvena caval occlusion, the isovolumic contractionpattern gradually changed, so that at small end-diastolic volumes, a spherical shape change wasobserved (Fig. IB). The dynamic geometric pat-terns observed in the conscious dog and the vali-dation of this experimental model have been pre-sented previously (Rankin et al., 1976).
Mathematically, these findings were expressed inFigure 2A by relating left ventricular cavitary vol-ume, shown on the abscissa, to midwall chambereccentricity, shown on the ordinate. An eccentricityof 0.750 is more elliptical than that of 0.625. Thewide range of data was obtained from multiplecardiac cycles during the course of a transient venacaval occlusion. During the diastatic phase of filing,a linear relationship was observed between eccen-tricity and volume (filled circles, r — —0.975) withthe chamber becoming considerably more sphericalas volume increased. During ejection, however, a
A BDIASTOLE IC EJECTION IR DIASTOLE IC EJECT** IR
MINOR AXISDIAMETER
(cm)
6 2 5 -
WALLTHICKNESS
(cm)
MAJOR AXISDIAMETER
70550
AORTICBLOOO FLOW
(ml/tec)
-5020
LEFT VENTRICULARTRANSUURAL
PRESSURE(mm Hq)
0300
LEFT VENTRICULARTRANSMURAL
PRESSURE(mm Hq)
_ -
_ . — -
'1
-
-
-
100 200 300 400 m o IOO
TIME (mac)
JOO 300 400
FIGURE 1 Representative digital data from two car-diac cycles at different end-diastolic volumes. Panel A:Control conditions. Panel B: Data obtained at a smallerend-diastolic volume during the course of a transientvena caval occlusion. IC ~ isovolumic contraction; IR= isovolumic relaxation.
750
20 00 3000 4000 5000 6000
L E F T V E N T R I C U L A R V O L U M E ( m l )70 00
FIGURE 2 Panel A: Comparison of eccentricity andintracavitary volume (V) from dog 8. An eccentricity (e)value of 0.75O is more elliptical and 0.625 is more spher-ical. Diastatic data (D) are shown as filled circles andejection-phase data (E) as unfilled circles. The linearregression for D is e - -0.002 V + 0.874 (r — -0.975) andforEise = -0.001 V + 0.823 (r = -0.982). Panel B: Datafrom two representative dynamic cardiac cycles are su-perimposed on the predicted linear regression curves forD and E of Figure 2A and illustrate the dynamic e- Vrelationships for a control beat (right), and one origi-nating from a smaller end-diastolic volume (left).
different linear relationship was obtained (open cir-cles, r = —0.982), and the ventricle became onlyslightly more elliptical as volume decreased. Thus,the dimensional changes in the major and minoraxis diameters during ejection were more concentricthan during filling. As shown in Figure 2A, thediastatic and ejection phase relationships consist-ently intersected. Because of the intersection ofcurves, changes from the diastatic to the ejectionphase during isovolumic contraction produced anelliptical shape change of the chamber at largevolumes and a spherical shape change when thevolume was small. This is graphically depicted inFigure 2B.
In the dog illustrated in Figure 2A, the point at
by guest on June 28, 2018http://circres.ahajournals.org/
Dow
nloaded from

LEFT VENTRICULAR DYNAMIC GEOMETRY/Olsen et aL 847
which the diastatic and ejection phase curves inter-sected (the transitional volume) occurred at thelower range of the physiological ventricular vol-umes. From dog to dog, there was considerablevariation in the observed transitional volume(Table 1). In some dogs the two curves intersectedat larger volumes (Fig. 3A) and, in others, at smallervolumes (Fig. 3B). However, the same basic type ofrelationship was noted in every study. The regres-sion data for the eccentricity-volume relationshipsdetermined for each dog are given in Table 2. Thenormalized volume («v) was used in the regressionanalysis to eliminate any dog-to-dog variability dueto differences in ventricular size.
During infusion of isoproterenol (Fig. 3A), end-diastolic volume was decreased and stroke shorten-ing was augmented, but the diastatic and ejectionphase eccentricity-volume relationships were un-changed from control in every dog (P > 0.20).During inflation of the aortic occluders, the peaksystolic left ventricular pressure increased from 126± 6 mm Hg to 195 ± 13 mm Hg (P < 0.01). Theend-diastolic volume uniformly increased andstroke volume decreased. The control eccentricity-volume relationship was not altered (P > 0.10) inany study by this degree of increased afterload (Fig.3B).
A graphic representation of the dimensional in-terrelationships of the left ventricle is shown inFigure 4. An inverse linear relationship was consist-ently observed between midwall minor axis circum-ference and wall thickness over the entire physio-logical range of ventricular volumes (Fig. 4A). Con-versely, a direct linear relationship existed betweenmidwall minor axis circumference and midwall ma-jor axis circumference (Fig. 4B). As was observedwith the eccentricity-volume data, different rela-tionships were present during diastasis (rilled cir-
cles) and ejection (unfilled circles). Therefore, thethree-dimensional systolic and diastolic deforma-tion of the left ventricle appeared to occur in a setand predictable manner.
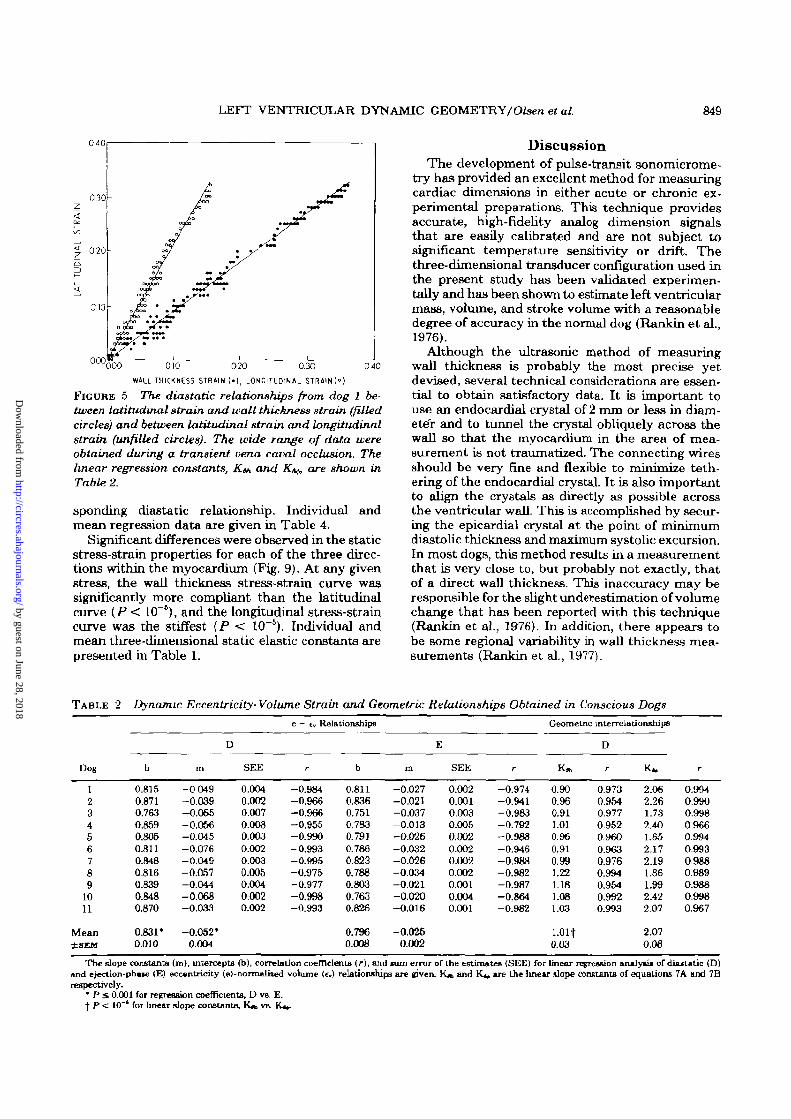
When the diastolic dimension data were normal-ized as an extension from the unstressed length(Fig. 5), linear relationships were observed betweenthe diastolic deformation in each of the three direc-tions. At any given ventricular volume, wall thick-ness deformation was slightly greater than latitu-dinal deformation in most dogs, and deformation inthe longitudinal direction was relatively small. Theregression constants for the three-dimensional geo-metric interrelationships of each ventricle are pre-sented in Table 2.
Shown in Figure 6A is a typical epicardial minoraxis diameter to left ventricular volume relation-ship. For the 11 studies, a direct linear correlationwas observed over the entire physiological range ofvolumes during diastasis (r > 0.978) and ejection(r > 0.974). The slopes of the diastatic and ejectionrelationships differed due to alterations in the dy-namic chamber geometry between these twophases; diastatic slope was 0.029 ± 0.002 cm/ml,whereas ejection slope was 0.025 ± 0.001 cm/ml (P< 0.001). An inverse relationship was observed be-tween wall thickness and left ventricular volume(Fig. 6B). Correlation coefficients for these relation-ships were similar to those obtained for minor axisdiameter vs. volume (diastasis, r > 0.912; ejection,r > 0.969) whereas the slopes were -0.005 ± 0.0006cm/ml for diastasis and -0.009 ± 0.0010 cm/ml forejection (P < 0.01).
Radius was also inversely related to wall thick-ness. Individual and mean regression data for theserelationships are listed in Table 3. The r/h-ventric-ular volume relationship for one study is graphicallypresented in Figure 7 and showed a direct linear
TABLE 1 Three-Dimensional Diastolic Elastic Properties and (Q Values Obtained in Conscious Dogs
Dog
123456789
1011
Mean±SEM
Cm(cm)
11.9610.0512.9010.6312.7413.3713.3811.4911.6111.7410.80
11.880.34
Reference lengths and volumes
(cm)
1.271.191.431.221.321.141.361.071.231.131.22
1.230.03
(cm)
16.9415.9916.8316.3517.G918.5119.7616.1617.6417.3216.69
17.260.34
Vo
(ml)
20.6414.9021.3915.0024.7333.7032.0020.3820.8522.8316.11
22.051.87
V,
(ml)
32.8040.4834.4041.2144.3249.8466.9644.8052.6069.5654.80
48.343.61
Eccentricity
e.o
0.8280.8740.7600.87O0.8060.7970.8490.8170.8450.8SO0.871
0.8330.011
e*
0.7940.8040.7300.7600.7720.7680.7940.7470.7730.7080.788
0.7670.009
a*
1.430.642.090.414.962,583.851.040.070.361.27
1.02
6
P
9.799.849.35
12.916.30
10.977.53
12.3016.1613.93
7.89
10.63
ResMS
1.870.300.567.823.607.503.592.021.151.993.85
t
a"
0.851.110.971.262.700.320.540.090.120.120.91
0.51
h
P
5.415.605.804.853.859.667.84
14.9315.4312.806.01
8.38
RegMS
0.120.430.021.290.180.420.170.100.100.080.22
t
a*
1.532.291.310.271.851.552.400.440.160.120.67
0.76
P
15.4611.8015.5731.0113.2324.0217.5526.5026.9837.4819.41
21.73
ResMS
0.400.240.394.441.752.142.161.100.201.200.76
<o — length at lero load, Vo ~ volume at zero load, V, - transitional volume, e™ ~ eccentricity at lero load, e»t — eccentricity at transitional volume, 9— latitudinal, h — wall thickness, <j> — longitudinal, and Res MS — residual mean square a and /? are the non-linear static elastic coefficient* determined byregression analysis of the diastolic stress-strain relationships.
* Expressed as dynes x lOVcm'.t P < 10"* HotelKng T test of a's and fi"s for 0 vs. h, 6 vs. <j>, «nd h v» &
by guest on June 28, 2018http://circres.ahajournals.org/
Dow
nloaded from

848 CIRCULATION RESEARCH VOL. 49, No. 4, OCTOBER 1981
0.75,
080
0 85065
£ 075Z
0 85
• 0loitotit Control
o Ejection Control
• DlOStons lioproterenol
° Election Ijoproterenol
• Diostom Control
° Election Control
• Dioitont Inllotionof Aortic Occludtr
° Ejtction Inflationof Aortic Occluder
20,00 50004000 WOOLEFT VENTRICULAR VCXUME ( m l )
FIGURE 3 Panel A: Eccentricity-volume relationshipsfrom dog 10 obtained in the control state (circles) andduring the steady state infusion of isoproterenol (0.03Hg/kg per min) (squares). Control D linear regression ise = -0.002 V + 0.917 (r-* -0.998) and isoproterenol D ise = -0.002 V + 0.916 (r 0.995). Control E linearregression is e = -0.001 V + 0.783 (r = -0.863) andisoproterenol E is e = -0.001 V + 0.795 (r = -0.861).There was no difference between the control and isopro-terenol data using a t-test of the linear slope constants(P > 0.6). Panel B: Eccentricity-volume relationshipsfrom dog 1 determined in the control state by vena cavalocclusion (circles) compared to those obtained duringacute pressure loading by inflation of an aortic occluder(squares). Control D linear regression is e = —0.002 V+ 0.864 (r — —0.984) and acute pressure loading D is e= -0.002 V + 0.860 (r = -0.911). Control E linearregression is e = -0.001 V + 0.838 (r = -0.973) and acutepressure loading E is e « -0.001 V + 0.841 (r = -0.957).There was no significant difference between the two setsof data (P > 0.5). D, E, e, and V are the same as forFigure 2.
relation during diastasis and ejection; however, theslopes were not significantly different for this aswell as the other experiments {P > 0.07).
The relationships that were typically observed
between diastatic transmuxal pressure and the cal-culated three-dimensional stresses are shown inFigure 8. The pressure-stress relationships werelinear in all three directions (r S: 0.985). At anygiven pressure, the calculated stress was greatest inthe latitudinal direction and least in the radialdirection. During ejection, similar linear relation-ships were observed between calculated stress andtransmural pressure (r > 0.704). The linear regres-sion constants Kp« and Kw were reduced by 17 ±2.7% and 23.8 ± 3.6%, respectively, from the corre-
1700
"080 090 1 00WALL THICKNESS (cm)
IB
1700
12.001700 20001800 1900
MIDWALL LONGITUDINAL CIRCUMFERENCE |cm)
FIGURE 4 Panel A: The relationship between diastoUc(filled circles) and ejection-phase (unfilled circles) lati-tudinal midwall circumference (l^) and wall thickness(h) from dog 1. The wide range of data was obtainedduring a transient vena caval occlusion. Linear regres-sion for Disk = -13.402 h + 28.448 (r = -0.970) and Eis U - -9.063 h + 24.439 (r - -0.993). Panel B: Therelationship between latitudinal midwall circumference(It) and longitudinal midwall circumference Aj for dias-tasis and ejection. Linear regression for D is L, = 1.823h -19.885 (r = 0.998) and E is U = 1.010 £> -3.910 (r =0.999). The symbols are the same as in panel A. D andE are the same as Figure 2.
by guest on June 28, 2018http://circres.ahajournals.org/
Dow
nloaded from
LEFT VENTRICULAR DYNAMIC GEOMETRY/ Olsen et al. 849
0 4 0
030-
0 2 0 u
0 1 0 u
000040Q0O 010 020 0.30
WILL THICKNESS STRAIN (•!, LONGITUDINAL STRAIN 1°)
FIGURE 5 The dia&tatic relationships from dog 1 be-tween latitudinal strain and wall thickness strain (filledcircles) and between latitudinal strain and longitudinalstrain (unfilled circles). The wide range of data wereobtained during a transient vena caval occlusion. Thelinear regression constants, K&, and K^ are shown inTable 2.
sponding diastatic relationship. Individual andmean regression data are given in Table 4.
Significant differences were observed in the staticstress-strain properties for each of the three direc-tions within the myocardium (Fig. 9). At any givenstress, the wall thickness stress-strain curve wassignificantly more compliant than the latitudinalcurve (P < 10"*), and the longitudinal stress-straincurve was the stiffest {P < 10~5). Individual andmean three-dimensional static elastic constants arepresented in Table 1.
DiscussionThe development of pulse-transit sonomicrome-
try has provided an excellent method for measuringcardiac dimensions in either acute or chronic ex-perimental preparations. This technique providesaccurate, high-fidelity analog dimension signalsthat are easily calibrated and are not subject tosignificant temperature sensitivity or drift. Thethree-dimensional transducer configuration used inthe present study has been validated experimen-tally and has been shown to estimate left ventricularmass, volume, and stroke volume with a reasonabledegree of accuracy in the normal dog (Rankin et al.,1976).
Although the ultrasonic method of measuringwall thickness is probably the most precise yetdevised, several technical considerations are essen-tial to obtain satisfactory data. It is important touse an endocardia! crystal of 2 mm or less in diam-eter and to tunnel the crystal obliquely across thewall so that the myocardium in the area of mea-surement is not traumatized. The connecting wiresshould be very fine and flexible to rninimize teth-ering of the endocardial crystal. It is also importantto align the crystals as directly as possible acrossthe ventricular wall. This is accomplished by secur-ing the epicardial crystal at the point of minimumdiastolic thickness and maximum systolic excursion.In most dogs, this method results in a measurementthat is very close to, but probably not exactly, thatof a direct wall thickness. This inaccuracy may beresponsible for the slight underestimation of volumechange that has been reported with this technique(Rankin et al., 1976). In addition, there appears tobe some regional variability in wall thickness mea-surements (Rankin et al., 1977).
TABLE 2 Dynamic Eccentricity-Volume Strain and Geometric Relationships Obtained in Conscious Dogs
Dog
123456789
1011
Mean±SEM
b
0.8150.8710.7630.8590.8050.8110.8480.8160.8390.8480.870
0.831*0.010
m
- 0 049-0.039-0.0&5-0.066-0.045-0.076-0.049-0.057-0.044-0.068-0.033
-0.052*0.004
D
SEE
0.0040.0020.0070.0080.0030.0020.0030.0050.0040.0020.002
e - tv Reli
r
-0 .984-0.966-0.966-0.955-0.990-0.993-0.995-0.975-0.977-0.998-0.993
itionships
b
0.8110.8360.7510.7830.7910.7860.8230.7880.8O30.7630.826
0.7960.008
m
-0.027-0.021-0.037-0.013-0.026-0.032-0.026-0.034-0.021-0.020-0.016
-0.0260.002
E
SEE
0.0020.0010.0030.0050.0020.0020.0020.0020.0010.0040.001
r
-0.974-0.941-0.983-0.792-0.988-0.946-0.988-0.982-0.987-0.864-0.982
Geometric interrelationships
K*
0.900.960.911.010.960.910.991.221.181.081.03
l.Olt0.03
D
r
0.9730.9540.9770.9520.9600.9630.9760.9940.9540.9920.993
K*
2.062.261.732.401.652.172.191.861.992.422.07
2.070.08
r
0.9940.9900.99809660.9940.9930.9880.9890.9880.9980.967
The slope constants (m), intercepts (b), correlation coefficients (r), and *um error of the estimates (SEE) for linear regression analyst* of diastatic (D)and ejection-pha»e <E) eccentricity (e)-normalized volume (f.) relationships are given. K* and Kj, are the linear slope constants of equations 7A and 7Brespectively.
* P £ 0.001 for regression coefficients, D vs. E.f P < 10"' for linear slope constants, KJB VS. KJ»-
by guest on June 28, 2018http://circres.ahajournals.org/
Dow
nloaded from

850 CIRCULATION RESEARCH VOL. 49, No. 4, OCTOBER 1981
650 -
x 600-
5 50
I 40
I 30
I 20
30 00 4000 5000 6000 70 00 8000
I 00
• Omstosis° Ejection
3000 4000 5000 5000 7000
L E F T VENTRICULAR VOLUME ( m l )
8000
FIGURE 6 Panel A: Comparison of external minor axisdiameter (b) and intracavitary volume (V) during dias-tasis (filled circles) and ejection (unfilled circles) fromdata obtained during a transient vena caval occlusionin dog 5. Linear regression for D is b = 0.002 V + 4.865(r = 0.993) and E is b = 0.016 V+ 5.144 (r = 0.996). PanelB: Comparison of equatorial wall thickness (h) and Vfrom data obtained during same vena caval occlusionas in A above. Linear regression for D is h = —0.004 V+ 1.355 (r = -0.951) and E is h => -0.007 V + 1.522 (r =-0.987). D and E are the same as Figure 2.
Recently, Osakada et al. (1980) developed anultrasonic triangulation technique which employedone subendocardial transmitting crystal with threeoverlying epicardial receiving crystals. This methodtheoretically measures wall thickness more accu-rately by accounting for potential shear of the ven-tricular wall (Streeter et al., 1969). In the controlstate, the average end-diastolic wall thickness bythis method was 9.6 ± 2.6 mm and wall thickeningduring systole was 20.3 ± 10.5%. This comparedfavorably with 9.1 ± 1.0 mm and 30.0 ± 19.0%observed, respectively, from the current experi-
ments. The degree of shear in their study seemedto be small, confirming the observations of Feigland Fry (1964). In addition, the degree of systolicwall thickening obtained with the ultrasonic tech-nique correlates well with previous observations(Mitchell et aL, 1969; Bove, 1971), and any under-estimation of wall thickening or non-uniformity ofmural deformation must be minimal.
It has been proposed that the intact pericardiumlimits diastolic filling of the left ventricle to someextent (Misbach et al., 1979) and accentuates influ-ences of the right ventricle on septal shifting anddistortion of left ventricular geometry (Tyberg etal., 1978). In most of these studies, however, thepericardium had been surgically manipulated. Theclassic work of Kenner and Wood (1966) indicatedthat surgical closure of the pericardium may be theprimary factor affecting ventricular dynamics inthis setting. Because of the unsettled nature of thiscontroversy, the pericardium was left widely openin the present study. Other factors, such as septalshifting and non-uniformity of minor axis geometrycaused by high right ventricular diastolic pressures,could invalidate the prolate spheroidal model. Thetransient vena caval occlusions as employed in thepresent experiments routinely result in low rightventricular pressure throughout the time when leftventricular pressure and dimension data are ob-tained for analysis. Shortening and filling of the leftventricular minor axis circumference under theseconditions seem to be relatively uniform and con-centric in the plane of the minor axis circumference(Olsen et aL, 1981). Thus, the external influences ofthe pericardium and right ventricle during the phys-iological conditions examined in the current studyare felt to have affected the dynamic geometry ofthe left ventricle minimally (Mirsky and Rankin,1979). Further investigation of the external deter-minants of left ventricular geometry should be per-formed.
Previous studies both in dogs and humans haveshown significant differences in regional myocardialshortening throughout the ventricle. LeWinter etal. (1975) used segmental ultrasonic techniques anddemonstrated a greater percentage of shorteningfrom the end-diastolic dimension in the apical re-gion of the ventricle as compared to the mid-ven-tricular or basilar regions. Kong et al. (1971) notedsimilar findings in humans, using coronary arterybifurcations as markers. There are, however, severalproblems with these data. The observed dimen-sional changes in these studies were normalized asa percentage shortening from the end-diastolicvalue. From an engineering standpoint, this type ofnormalization is not valid and may have introducedcertain errors into the results. Furthermore, smallvariations in the three-dimensional spatial relation-ships of either the segmental crystals or the coro-nary markers could have caused considerable van-ability in the observed regional geometry. In a studyof regional diameters measured with ultrasonic
by guest on June 28, 2018http://circres.ahajournals.org/
Dow
nloaded from

LEFT VENTRICULAR DYNAMIC GEOMETRY/0/sen el al. 851
TABLE 3 Dynamic Minor Axis Radius of Curvature- Wall Thickness and r/h- Volume Relationships Obtained inConscious Dogs
Dog
123456789
1011
Mean±SEM
b
4.534.604.819.174.894.504.895.035.044.745.27
5.22*0.40
Mid-wall radius-wall thickness relationships
m
-1.64-2.16-1.51-5.85-1.67-1.68-1.31-2.72-1.96-2.09-3.11
-2.34*0.39
D
SEE
00660 0590 0790.09900840 0670.0860.03501180.0630.037
r
-0.952-0.834-0.923-0.939-0.943-0.927-0.967-0.989-0.841-0.984-0.988
b
3.893.434.233.853.853.744.303 * 13.863.834.17
3.910.08
m
- 0 95- 0 73-0.92-0.83-0.79-0.76-0.84-1.27-0.84-1.00-1.66
-0.960.09
E
SEE
0.0260.0190.0590.0410.0480.0440.0470.0350.0540.0420.030
r
-0.985-0.958-0.943-0.955-0.965-0.913-0.973-0.983-0.927-0.965-0.982
b
-33.83-33.12-40.73-43.67-46.55-32.68-43.07-34.89-44.66- 3 0 55-39.87
-38.97*1.87
D
m
34.8931.5341.1340.1345.4634.4654.5730.1942.6731.8633.31
38.202.24
r/h-V relationships
SEE
0.9510.5510.8330.5880.0240.9651.3530.5411.1920.6580.480
r
0.99609880.9770.9970.9960.9940.9980.9980.9920.9990.999
b
-30.39-25.90-36.54-33.88-33.39-29.69-47.23-27.48-34.68-31.15-34.99
-33.21172
E
m
35 3230.5741.0637.3638 4635.4454 3428.0438.3732.6032.39
36.722.11
SEE
0.2220.1070.6570.3360.0190.6510 5590.2970.7950.4740.397
r
0.9990.9990.9980.9990.9980.9960.9990.9990.9960.9990.999
The slopea (m), intercept* (b), correlation coefficients (r), and sum error of the estimates (SEE) of the regression analysis are given, r/h — minor axisradius of curvature to wall thickness relationship and V - left ventricular internal volume. D and E »re same as for Table 2
* P < 0.01 for regression coefficients, D vs E.
transducers, Ling et al. (1979) demonstrated nosignificant differences in shortening during ejectionbetween the apical and midventricular regionswhen each dimension was properly normalized as afractional change from the unstressed dimension.This rinding is consistent with previous obervationsusing high-speed cine-ventriculography (Bove,1971) and reflects a homogeneity of ejection phaseshortening throughout the left ventricle. In Ling'sstudy, however, significant differences in regionalgeometry during dynamic diastolic filling were
? 7 5 -
3000 80004000 50.00 6000 7000
LEFT VENTRICULAR VOLUME ( m l )
FIGURE 7 The relation between the r/h ratio and in-tracavitary volume (V) for diastasis (filled circles) andejection (unfilled circles) for same vena caval occlusionas in Figure 7 for dog 5. Linear regression for D is r/h= 0.020 V + 1.105 (r •= 0.995) and E is r/h = 0.024 V +0.922 (r = 0.999). There was no significant differencebetween the linear slope constants (P > 0.07). D and Eare same as Figure 2.
noted. During early rapid ventricular filling, mid-ventricular transmural pressure was substantiallyhigher than apical pressure, whereas the apicalpressure increased more rapidly and reached dias-tasis earlier once the diastolic minimum had beenreached. Concurrently, the apical diameter in-creased more rapidly and reached diastasis earlierthan the midventricular diameter. The average end-diastolic strains at each level, however, were notsignificantly different. These regional differences indiastolic geometry and pressure during rapid ven-tricular filling possibly were due to the velocity andacceleration of blood flow across the ventricle and
50 00
4000
t 30001-
20.00
1000
Woll TkKto t l l
0.00,50 100
TRANSMURAL PRESSURE (mmHg)
15.0
FIGURE 8 A comparison of the calculated three-dimen-sional stresses and transmural pressure during diastasisfrom dog 8. The linear regression constants, Kp, and Kp^,are shown in Table 4.
by guest on June 28, 2018http://circres.ahajournals.org/
Dow
nloaded from

852 CIRCULATION RESEARCH VOL. 49, No. 4, OCTOBER 1981
TABLE 4 Dynamic Pressure-Stress Relationships Obtained in Conscious Dogs
Dog
123456789
1011
Mean±SEM
K,,
2.842.532.432.212.572.752.522.922 713.003.20
2.70*0.09
D
r
0.9990.9950.9990.9990.9990.9920.9980.9990.9990.9990.999
Pressure-alres*
Kp.
1.621.261.451.121.411.491.311.641.491.691.72
1.47*0.06
r
0.9990.9910.9980.9990.9970.9850.9960.9980.9980.9980.999
relationships
Kp.
2.431.841.961.912.482.392.232.542.442.422.89
2 320.10
r
0.7630.9670.8690.9840.9230.9900.9470.9680.9600.9600.969
E
Kp.
1.260.841.060.951.321.241.101.361.271.301.51
1.200.06
r
0.7040.9560.8260.9740.9010.9850.9250.9480.9460.9400.959
% Difference
Kp.
16.937.524.015.73.6
15.113.015.011.124.010.7
17.02.7
Kp.
28.650.036.817.96.8
20.219.120.617.330.013.9
23.83.6
Kp# and Kp. are the linear slope constants of equations 10A and 10R, respectively. Percent difference wacalculated as (D — E)/D X 100 for aach slope coefficient. D, E, and r are same as for Table 2
* P < 10"* for linear slope constants, D vs. E.
emphasize the need to measure pressures and di-mensions at the same ventricular level when assess-ing dynamic geometry. Thus, it is clear that anygeometric reference figure that assumes uniformmural deformation must be regarded, at best, as anapproximation of the actual three-dimensional ge-ometry. The question that should be answeredabout any given model is how close an approxima-tion does it provide? Based on previous experiments(Rankin et al., 1976), we conclude that the prolatespheroidal model used in this study is a satisfactoryapproximation of left ventricular geometry in thenormal canine heart under the experimental con-ditions of the present study, especially when dias-tatic data are considered.
There are several engineering methods availablefor normalization of left ventricular dimensions
(Mirsky and Parmley, 1974). A natural strain nor-malization was selected in the present study be-cause it does not assume uniform deformation orstress distribution along the ventricular wall. Sincewall thickness stress is a compressive stress, positivestrains in the wall thickness direction denoted wallthinning. Positive strains in the latitudinal and lon-gitudinal directions represented lengthening be-cause latitudinal and longitudinal stresses are ten-sile stresses. Only diastolic dimensions were nor-malized to 4 because the diastolic and ejection-phase geometries were clearly different, and nomechanically valid reference length could be de-fined for ejection. Despite the relatively low stressesin the wall thickness direction, wall thickness de-formation was the greatest in most dogs. Wheneverthe functional characteristics of the ventricle were
4000
3000-
2000-
1000-
0 0 0
• Latitudmol
• Longitudinal
» Wgll Thickness
FIGURE 9 The diastatic stress-strain relationships typically ob-served for each of the three dimen-sions are shown for dog 1. The non-linear elastic coefficients, a and /3,are shown in Table 1.
000
by guest on June 28, 2018http://circres.ahajournals.org/
Dow
nloaded from

LEFT VENTRICULAR DYNAMIC GEOMETRY/OZsen et al. 853
altered, the percentage change observed in the wallthickness usually was the greatest. In this context,wall thickness, latitudinal, and longitudinal stressesand strains correspond, respectively, to radial, cir-cumferential, and meridional stresses and strains(Mirsky, 1969).
In the initial phases of the present study, e wasderived as a fractional change of 4. from ^o, calcu-lating 4. with an elliptical function (Eq. 5). Becausestrain in the longitudinal direction of a prolatespheroid varies with distance from the equator, thismay not be a totally valid approach. Attempts weremade to calculate c from e<> and €h data, using theformula for incompressibility of mass:
(1 + e,) (1 - €h)• - 1 (12)
where eh denotes wall thinning. The resulting datawere not physiologically suitable, with highly vari-able strain values noted from dog to dog. Thisfinding may reflect dimensional inconsistencies orproblems with the applicability of this equation tointact heart muscle. Eventually, we reverted to theoriginal technique of calculating e , as an averagefractional change of the major axis circumference.There are theoretical limitations with this method,but it yields results that are most consistent, phys-iologically. Hopefully, the error introduced with thismethod is small and the data are proportional tothe actual equatorial major axis strain.
Theoretical limitations have been raised to theapplication of Laplace's relationship to model ven-tricular mechanics (Moriarty, 1980). When the leftventricle is modeled as a sphere, the law of Laplacemarkedly underestimates wall stresses and geomet-ric deformations of the left ventricle for a giventransmural pressure. The results of the presentstudy depend integrally upon the validity of theellipsoidal shell theory used to derive the three-dimensional stresses and deformations. This theoryhas been tested experimentally, and the latitudinalstress calculated from transmural pressure and ven-tricular dimensions correlated well with the directlymeasured latitudinal stress (McHale and Green-field, 1973). In addition, the end-diastolic latitudinalstress calculated previously with this model in theconscious dog (Rankin et al., 1977) was similar tothat directly measured by Bums et al. (1971). Lon-gitudinal stress calculated in the present study wasapproximately 55% of the calculated latitudinalstress, a figure that is comparable to the 43% valuedirectly measured in Burns' experiments. The cal-culation of wall thickness stress as 50% of trans-mural pressure may not be entirely valid. There issome evidence that the wall thickness stress distri-bution across the wall is non-linear, and its calcu-lation as 50% of transmural pressure would resultin a certain amount of error. However, even withthick-walled stress theories (Mirsky, 1969), the de-gree of non-linearity is small, and the error intro-
duced by the above method would be less than 10%.This amount of error would not have affected theresults of the present study significantly.
Two previous studies (Suga and Sagawa, 1974;Rankin et al., 1980) have demonstrated essentiallylinear relationships between minor axis diameter ofthe left ventricle and measured internal volumeover the physiological range of volumes. In both ofthese experiments, differences in the diameter-vol-ume relationships were observed from diastole tosystole, and probably were related to changes inmyocardial geometry between these two phases.Furthermore, equatorial wall thickness and internalventricular volume were found to be related in asimilar linear fashion, although the relationship wasinverse (Fig. 7B). The totally independent natureof the measurements of Suga and Sagawa (1974),and unpublished observations made in our labora-tory with an intracavitary balloon technique (Ran-kin et al., 1976) reinforce the findings illustrated inFigure 6.
Because ventricular volumes were calculatedfrom three-dimensional geometry data, problems ofmathematical coupling of data arise. An introducedmeasurement error of 5% in the minor or major axisdiameters would produce a corresponding 5-12%error in calculated chamber volume with an errorof less than 5% in the derived chamber eccentricity,whereas an introduced error of 10% in wall thicknesswould produce a similar error in chamber volumeand eccentricity of 12% and 1%. The resulting ec-centricity-volume relationships would be shiftedeither up or down, depending on the dimensionchanged, but the slopes would remain relativelyconstant throughout the diastasis and ejectionphases, indicating that this magnitude of introducederror would have minimal effect on the basic resultof the study. The magnitude of these errors intro-duced in each direction of measurement would bewell beyond the minimum resolution of measure-ment of the pulse-transit ultrasonic technique,which is approximately 0.08 mm.
Most currently accepted stress theories are mod-ifications of the Laplace relationship:
a a P X r/h (12)
where a is the tensile stress, P is the transmuralpressure, r is the radius of curvature, and h is thewall thickness. In the current study, the latitudinalradius of curvature was observed to be related towall thickness in an inverse manner (Table 3).Similar findings have been published by Sasaymaet al. (1976). The relationship for diastasis was notthe same as for ejection, again pointing out differ-ences in diastatic and ejection phase geometry.Since radius and wall thickness were related in-versely (Table 3), the r/h ratio increased in a linearfashion with increasing diastolic left ventricular vol-ume (Fig. 7). The r/h ratio vs. volume relationshipfollowed a similar pattern during the ejection phase.
by guest on June 28, 2018http://circres.ahajournals.org/
Dow
nloaded from

854 CIRCULATION RESEARCH VOL. 49, No. 4, OCTOBER 1981
This constant geometric relationship determineswall stress at any given transmural pressure (Fig.8) and constitutes the major influence of ventriculargeometry on cardiac function. The differences inthe diastatic and ejection phase r/h vs. volumerelationships (Table 3) probably account for thediscrepancy in the diastatic and ejection phase pres-sure-stress regression constants, KPS and Kp<j,(Table 4). In summary, the relationship betweenintracavitary pressure and mural stress in any givenventricle is linear during diastasis and ejection andis determined by the three-dimensional geometricinterrelationships of the ventricular wall.
During the initial phase of this study, it becameevident that the dynamic geometry of the left ven-tricle was more complex than had been appreciatedpreviously. Not only were there significant rear-rangements in ventricular geometry during the iso-volumic phases of the cardiac cycle, but the direc-tion and magnitude of these rearrangements variedwith ventricular volume. This finding led to theobservation (Fig. 2A) that the eccentricity of theleft ventricle during diastasis and during ejectionwas related linearly to intracavitary volume. Al-though this method of defining ventricular geome-try is undoubtedly a simplification of more complexgeometric rearrangements, it provides a means ofrepresenting the dynamic geometry of the left ven-tricle over the entire physiological range of ventric-ular volumes. The geometric rearrangements ob-served during the isovolumic phases of contractionand relaxation seemed to represent transitionalstates between the diastatic and ejection phasecurves. It must be emphasized that Figure 2A illus-trates diastatic data. When dynamic e-«v data fromsingle cardiac cycles were examined (Fig. 2B), therapid filling phases did not fall exactly on the dias-tatic curve. This observation may be due to phasedifferences in the rate of deformation in the latitu-dinal and longitudinal dimensions during earlyrapid filling and atrial systole and again reflectsdifferences in regional ventricular geometry duringdynamic diastolic filling.
Even though there was moderate variability inthe geometric characteristics observed from dog todog (Table 1), the eccentricity-volume relationshipin any given ventricle seemed to be constant. Thisrelationship did not change with inotropic interven-tions or with alterations in afterload (Fig. 3).Changes in myocardial function indirectly alteredthe dynamic geometry by changing the end-dia-stolic position on the curve or the degree of ejection-phase shortening, but did not alter the basic linearrelationships. Therefore, we hypothesize that thefindings in Figure 2 are independent of intrinsicmyocardial performance.
The relationships between ventricular volumeand shape probably reflect structuraJ properties ofthe left ventricular wall. It is unclear, however, whythe diaatatic and ejection-phase curves shown in
Figure 2 should be diiferent. During diastatic filling,the dimensional changes of the left ventricle wereasymmetrical, with a disproportionate increase oc-curring in the minor axis diameter as compared tothe major axis diameter. As a result, the ventriclebecame considerably more spherical as diastolicfilling progressed. These diastolic shape changesprobably are determined by the three-dimensionalstress-strain properties of the diastolic myocardiumand have been reviewed elsewhere (Rankin andOlsen, 1980). As illustrated in Figure 9, the leftventricular wall seemed to be anisotropic, and thelongitudinal dimension was significantly stiffer thanthe latitudinal dimension. Thus, with a givenchange in diastolic transmural pressure, deforma-tion in the minor axis diameter was greater.
The dimensional changes during ejection weremore symmetrical, and very little alteration inshape occurred as ventricular volume decreased.Perhaps the ejection-phase relationship was differ-ent from the diastatic relationship because it wasdetermined primarily by intramural fiber orienta-tion rather than the more anisotropic stress-strainproperties. The distribution of fiber angles has beenshown to be fairly uniform across the ventricularwall (Streeter et al., 1969; Streeter and Hanna,1973), with longitudinally oriented fibers predomi-nating in the subendocardial and subepicardial lay-ers and latitudinal oriented fibers predominating atthe midwall level. Such an even distribution couldaccount for the more concentric volume changesthat were observed during ejection.
The method of analysis presented in this com-munication represents a convenient way to quantifydynamic left ventricular geometry. The data pre-sented characterize the dynamic geometry of thenormal canine left ventricle. These findings may beuseful in improving the assessment of myocardialfunction in the intact heart and serve as a basis forfurther study of dynamic geometry of the left ven-tricle under the abnormal conditions of myocardialischemia, chamber dilation, or hypertrophy.
AcknowledgmentsWe gratefully acknowledge the valuable assistance of Ruth
Diion in typing the manuscript and Robert L. Margulies inpreparing the figures and illustrations.
ReferencesBove AA (1971) Radiographic evaluation of dynamic geometry
of the left ventricle. J Appl Physiol 31: 227-234Burns JW, Covell JW, Myers R, Ross J Jr (1971) Comparison of
directly measured left ventricular wall stress and stress cal-culated from geometric reference figures. Circ Res 28: 611-621
Draper NR, Smith H (1966) An introduction to nonlinear esti-mation. In Applied Regression Analysis. New York, Wiley, pp263-282
Feigl EO, Fry DL (1964) Intramural myocardial shear during thecardiac cycle. Circ Res 14: 536-540
Hefner LL, Sheffield LT, Cobbs GC, Klip W (1962) Relationbetween mural force and pressure in the left ventricle of thedog. Circ Res 11: 664-663
by guest on June 28, 2018http://circres.ahajournals.org/
Dow
nloaded from

LEFT VENTRICULAR DYNAMIC GEOMETRY/Olsen et al. 855
Kenner HM, Wood EH (1966) Intrapericardial, intrapleural andlntracardiac pressures during acute heart failure in dogs stud-ied without thoracotomy. Circ Res 19: 1071-1079
Kong Y, Morris JJ, Mclntosh HD (1971) Assessment of regionalmyocardial performance from biplane coronary cineangio-grams. Am J Cardiol 27: 529-537
Laplace M (1839) Theory of capillary attraction. MecaniqueC61este, vol IV, book X, suppl I, sect I, Translation by Na-thaniel Bowditch. Boston, Little & Brown, pp 695-789
Leshin SJ, Mullins CB, Temple ton GH, Mitchell JH (1972)Dimensional analysis of ventricular function. Effects of anes-thetics and thoracotomy. Am J Physiol 222: 540-545
LeWinter MM, Kent RS, Kroener JM, Carew TE, Covell JW(1975) Regional differences in myocardial performance in theleft ventricle of the dog. Circ Res 37: 191-199
Lang D, Rankin JS, Edwards CH, McHale PA, Anderson RW(1979) Regional diastolic mechanics of the left ventricle in theconscious dog. Am J Physiol 236: H323-H330
McHale PA, Greenfield JC Jr (1973) Evaluation of severalgeometric models for estimation of left ventricular circumfer-ential wall stress. Circ Res 33: 303-312
Mirsky I (1969) Left ventricular stresses in the intact humanheart. Biophys J 9: 189-208
Mirsky I, Parmley WW (1974) Evaluation of passive elasticstiffness for the left ventricle and isolated heart muscle. InCardiac Mechanics, edited by I Mirsky, D Ghista, H Sandier.New York, Wiley, pp 331-358
Mirsky I, Rankin JS (1979) The effects of geometry, elasticity,and external pressures on the diastolic pressure-volume andstiffness-stress relations: How important is the pericardium?Circ Res 44: 601-611
Misbach GA, Glantz SA (1979) Changes in the diastolic pressure-diameter relation alter ventricular function curves. Am JPhysiol 237: H644-H648
Mitchell JH, Wildenthal K, Mullins CB (1969) Geometricalstudies of the left ventricle utilizing biplane cinefluorography.Fed Proc 28: 1334-1343
Moriarty TF (1980) The law of Laplace: Its limitations as arelation for diastolic pressure, volume, or wall stress of the leftventricle. Circ Res 48: 321-331
Ohsen CO, Van Trigt P, Rankin JS (1981) The dynamic geometryof the intact left ventricle. Fed Proc May, 1981 40: 2023-2030
Osakada G, Sasayama S, Kawai C, Hirakawa A, Kemper WS,
Franklin D, Ross J Jr (1980) The analysis of left ventricularwall thickness and shear by an ultrasonic triangulation tech-nique in the dog. Circ Res 47: 173-181
Rankin JS, Olsen CO (1980) The diastolic filling of the leftventricle Europ Heart J 1 (suppl A): 95-105
Rankin JS, McHale PA, Arentzen CE, Lang D, Greenfield JC Jr,Anderson RW (1976) The three-dimensional dynamic geom-etry of the left ventricle in the conscious dog. Circ Res 39:304-313
Rankin JS, Arentzen CE, McHale PA, Ling D, Anderson RW(1977) Viscoelastic properties of the diastolic left ventricle inthe conscious dog. Circ Res 41: 37-45
Rankin JS, Arentzen CE, Ring WS, Edwards CH, McHale PA,Anderson RW (1980) The diastolic mechanical properties ofthe intact left ventricle. Fed Proc 39: 141-147
Rushmer RF (1954) Shrinkage of the heart in anesthetized,thoracotomized dogs. Circ Res 2: 22-27
Sandier H, Dodge HT <1963) Left ventricular tension and stressin man Circ Res 8: 91-104
Sasayama S, Ross J Jr, Franklin D, Bloor CM, Bushop S, DilleyKB (1976) Adaptations of the left ventricle to chronic pressureoverload. Circ Res 38: 172-178
Streeter DD Jr, Hanna WT (1973) Engineering mechanics forsuccessive states in canine left ventricular myocardium. II.Fiher angle and Karcomere length. Circ Res 33: 656-664
Streeter DD Jr, Spotnitz HM, Patel DP, Ross J Jr, SonnenblickEH (1969) Fiber orientation in the canine left ventricle duringdiastole and systole. Circ Res 28: 339-347
Suga H, Sagawa K (1974) Assessment of absolute volume fromdiameter of the intact canine left ventricular cavity. J ApplPhysiol 36: 496-499
Therein P, Franklin D, Ross J Jr, Kemper WS (1974) Regionalmyocardial function during acute coronary artery occlusionand its modification by pharmacologic agents in the dog. CircRes 35: 896-908
Tyberg JV, Misbach GA, Glantz SA, Moores WY, Parmley WW(1978) A mechanism for shifts in the diastolic, left ventricular,pressure-volume curve: the role of the pericardium. Eur JCardiol 7 (suppl): 163-175
Woods RH (1892) A few applications of a physical theorem tomembranes in the human body in a state of tension. J AnatPhysiol 26: 362-370
by guest on June 28, 2018http://circres.ahajournals.org/
Dow
nloaded from

C O Olsen, J S Rankin, C E Arentzen, W S Ring, P A McHale and R W AndersonThe deformational characteristics of the left ventricle in the conscious dog.
Print ISSN: 0009-7330. Online ISSN: 1524-4571 Copyright © 1981 American Heart Association, Inc. All rights reserved.is published by the American Heart Association, 7272 Greenville Avenue, Dallas, TX 75231Circulation Research
doi: 10.1161/01.RES.49.4.8431981;49:843-855Circ Res.
http://circres.ahajournals.org/content/49/4/843World Wide Web at:
The online version of this article, along with updated information and services, is located on the
http://circres.ahajournals.org//subscriptions/
is online at: Circulation Research Information about subscribing to Subscriptions:
http://www.lww.com/reprints Information about reprints can be found online at: Reprints:
document. Permissions and Rights Question and Answer about this process is available in the
located, click Request Permissions in the middle column of the Web page under Services. Further informationEditorial Office. Once the online version of the published article for which permission is being requested is
can be obtained via RightsLink, a service of the Copyright Clearance Center, not theCirculation Research Requests for permissions to reproduce figures, tables, or portions of articles originally published inPermissions:
by guest on June 28, 2018http://circres.ahajournals.org/
Dow
nloaded from