robin munson’ discussed in linda’s memo. dr. parr’s ... pertinent background provided. robin...
TRANSCRIPT

Isabel Muñoz-Colón, Chair Ben Rarick, Executive Director Mona Bailey Kevin Laverty Madaleine Osmun Bob Hughes Dr. Daniel Plung Baxter Hershman Cynthia McMullen
Peter Maier Holly Koon Tre’ Maxie Connie Fletcher Judy Jennings Jeff Estes Janis Avery Randy Dorn, Superintendent of Public Instruction
Old Capitol Building 600 Washington St. SE P.O. Box 47206 Olympia, Washington 98504
(360) 725-6025 TTY (360) 664-3631 FAX (360) 586-2357 Email: [email protected] www.sbe.wa.gov
July 31, 2015 Dear board members: Enclosed is your packet for the August 5 State Board of Education meeting at Educational Service District 113 in Tumwater. At the time of this packet, we expect to have approximately 11 board members in person at the meeting, with the remaining calling in by teleconference or K-20 access. Be advised that TVW is scheduled to televise the event, and Kevin and Isabel are holding a press conference immediately following the meeting. The packet includes a summary memorandum by Linda Drake framing the decisions for the Board, with pertinent background provided. Robin Munson’s PowerPoint is also included. Both of these documents are important reading in advance of the meeting. Dr. Andrew Parr has provided an in-depth and more technical analysis based on the options discussed in Linda’s memo. Dr. Parr’s memorandum is structured to be more of a reference document, and may be helpful to answer specific questions that members have about the data behind the options. Feel free to contact him if you want additional help interpreting the data. We look forward to seeing you next week. The fact that over 70 percent of our 10th grade students met a Level Three career and college-ready standard is an excellent start for our system! Sincerely, Ben
1

Prepared for August 5, 2015 Board Meeting
Educational Service District 113, Mason/Lewis Room
6005 Tyee Drive SW Tumwater, WA 98512
August 5, 2015
SPECIAL BOARD MEETING AGENDA
1:00-1:10 p.m. Call to Order 1:10-1:45 Performance Standards Setting for High School Exit Exams and
WA-AIM Ms. Linda Drake, Research Director Dr. Robin Munson, Assistant Superintendent, OSPI Ms. Cinda Parton, Director of Assessment and Development, OSPI
Mr. Mike Middleton, Director of Select Assessments, OSPI 1:45-2:00 Public Comment 2:00-2:20 Board Discussion 2:20-2:45 Business Items
1. Adoption of Threshold Scores for WA-AIM (Action Item) 2. Adoption of Scores Students Must Achieve to Earn a Certificate of
Academic Achievement on the Math Year 1 and Math Year 2 End-of-Course Exit Exams (Action Item)
3. Adoption of Scores Students Must Achieve to Earn a Certificate of Academic Achievement on the Smarter Balanced English Language Arts and Smarter Balanced Math Assessments (Action Item)
2:45 Adjourn
2
Prepared for the August 5, 2015 Special Board Meeting
SETTING MINIMUM GRADUATION SCORES ON NEW HIGH SCHOOL MATH AND ENGLISH LANGUAGE ARTS ASSESSMENTS
Outline
1) Policy Considerations
2) The Transition to Common Core Assessments
3) Background
a) Past Work of The Board
b) High School Common Core Assessments
i) Smarter Balanced Assessments
ii) Math End-of-Course Exit Exams
iii) High School Assessment Options for Students Served by Special Education
4) Specific Requirements of EHB 1450
a) The Transition Experience of Washington Students to the Consortium-developed Assessments
i) Refusals and the Experience of 11th Graders
ii) Technology
iii) Delays in Receiving Scores
iv) A Range of Voices Concerning New Standards and New Tests
b) Student Scores Used in Other States that are Administering the Consortium‐developed Assessments
c) Scores In Other States That Require Passage of an Eleventh Grade Assessment as a High School Graduation Requirement
5) Overview of Spring 2015 Testing Results and Impact on Establishing Minimum Graduation Scores
6) Action
1) Policy Considerations
The State Board of Education (SBE) will consider approval of scores for high school graduation on:
1. The high school comprehensive Smarter Balanced English Language Arts (ELA) assessment
2. The high school comprehensive Smarter Balanced math assessment
The SBE will also consider approval of achievement level scores on:
3. The Math Year 1 end-of-course (EOC) exit exam that is aligned to new standards
4. The Math Year 2 EOC exit exam that is aligned to new standards
13

Prepared for the August 5, 2015 Special Board Meeting
In addition, the Board will consider approval of cut-scores for assessment options for students served by special education
5. WA-AIM
2) The Transition to Common Core Assessments
The Common Core Standards for English Language Arts (ELA) and math were adopted for Washington state in 2011. Since then, Washington school districts have been working to phase in teaching and learning of the new standards and the state, as part of the Smarter Balanced Consortium, has been working on the development of new assessments aligned with the standards. Items from the Smarter Balanced assessments were field-tested in 2013-2014, and the first full administration of the tests was this past spring of 2015.
For Washington, the transition to new assessments required for graduation presented a challenge in three dimension. The former system of high school assessments required for graduation included a combination of EOCs for math and comprehensive reading and writing assessments for ELA. These assessment requirements were completed by most students by the 10th grade. The new Smarter Balanced high school assessments are comprehensive in ELA and math and are administered for federal accountability in the 11th grade. So the transition involves change, in 1) the type of assessment, 2) the number of assessment and 3) the grade at which most students will complete the requirement.
In 2013, the Legislature met the challenge through EHB 1450, codified in RCW 28A.305.130 (Appendix E of this memo). The bill established the new Smarter Balanced assessments in ELA and math as the tests required for high school graduation. Students who pass all assessments required for graduation earn a Certificate of Academic Achievement (CAA). EHB 1450 directed that the Smarter Balanced assessments are the primary means, in ELA and math, for students in the Class of 2019 and beyond to earn a CAA. Prior to the Class of 2019, additional assessment options to earn a CAA are available to students.
EHB 1450 directed OSPI to develop a new transition 10th grade assessment in ELA aligned to the new standards by using Smarter Balanced test items to replace the former Reading and Writing High School Proficiency Exams (HSPE). To meet this requirement OSPI decided to simply administer the ELA Smarter Balanced in 10th grade during the transition to new assessments, as well as in 11th grade for federal accountability. Since the Common Core Standards are not aligned to single grade levels, and since the Smarter Balanced test was developed to address the full range of high school standards, the Smarter Balanced test may appropriately be given to 10th graders. The Smarter Balanced is not an “11th grade exam.” Students in 11th grade should perform better than 10th graders because they have had an additional year of instruction, but the Smarter Balanced may be used for 10th grade students to demonstrate their achievement.
EHB 1450 also directed OSPI to develop new transition math EOCs, aligned to the new standards, for use during the transition to new standards and assessments.
Table 1 summarizes how most students will demonstrate meeting standard on high school assessments, and for which tests the SBE will be setting a minimum graduation score at the August 2015 special meeting. The minimum graduation scores set by the Board on the ELA Smarter Balanced assessment and the transition EOC exit exams will be used by the Class of 2017, the 10th graders who took these tests in spring 2015. The minimum graduation score for the math Smarter Balanced assessment will primarily be used by the Class of 2019, the incoming 9th graders, who will take the test as 11th graders in spring 2018. The math Smarter Balanced assessment may also be used as an alternative assessment for the Classes of 2016, 2017 and 2018.
24

Prepared for the August 5, 2015 Special Board Meeting
For each of these new exams new minimum graduation scores must be established. State law directs the SBE to set the scores needed to show proficiency on state assessments and the scores for high school students to earn a CAA (RCW 28A.305.130, appendix A of this memo). The SBE also sets minimum graduation scores on approved alternatives to high school exit exams. Table 1: Exit Exams in English Language Arts and Math That Most Students Will Use to Demonstrate Meeting Standard
Class of: 2015 2016 2017 2018 2019
Old Standards New Standards
English Language Arts
HSPE HSPE SBAC SBAC SBAC
Math EOC EOC EOC EXIT EOC EXIT SBAC
HSPE-Reading and Writing High School Proficiency Exam SBAC-Smarter Balanced Assessment EOC-Math Year 1 and Math Year 2 End-of-Course Assessments aligned to the former Washington math standards EOC EXIT-Math Year 1 and Math Year 2 End-of-Course Assessments aligned to the new Washington math standards, Common Core State Standards. These assessments are for use during the transition period to the new assessments. Tests for which the SBE will be establishing minimum graduation scores at the August meeting.
While the SBE has the statutory authority to set the minimum graduation scores, OSPI administers the assessment system, and OSPI staff have expertise in analyzing assessment data. The SBE and OSPI work together to set achievement levels and minimum graduation scores. Typically, OSPI staff propose a process for setting a score that the Board reviews and approves. Then, at a subsequent meeting OSPI staff present the resulting score for approval by the Board.
3) Background
a) Past Work of the Board
The Board has been very engaged in work on the assessment system for a number of years. The Board has extensively discussed new standards and assessments, and advocated for a deliberative and intentional transition, while maintaining focus on a meaningful high school diploma and career and college readiness for all students.
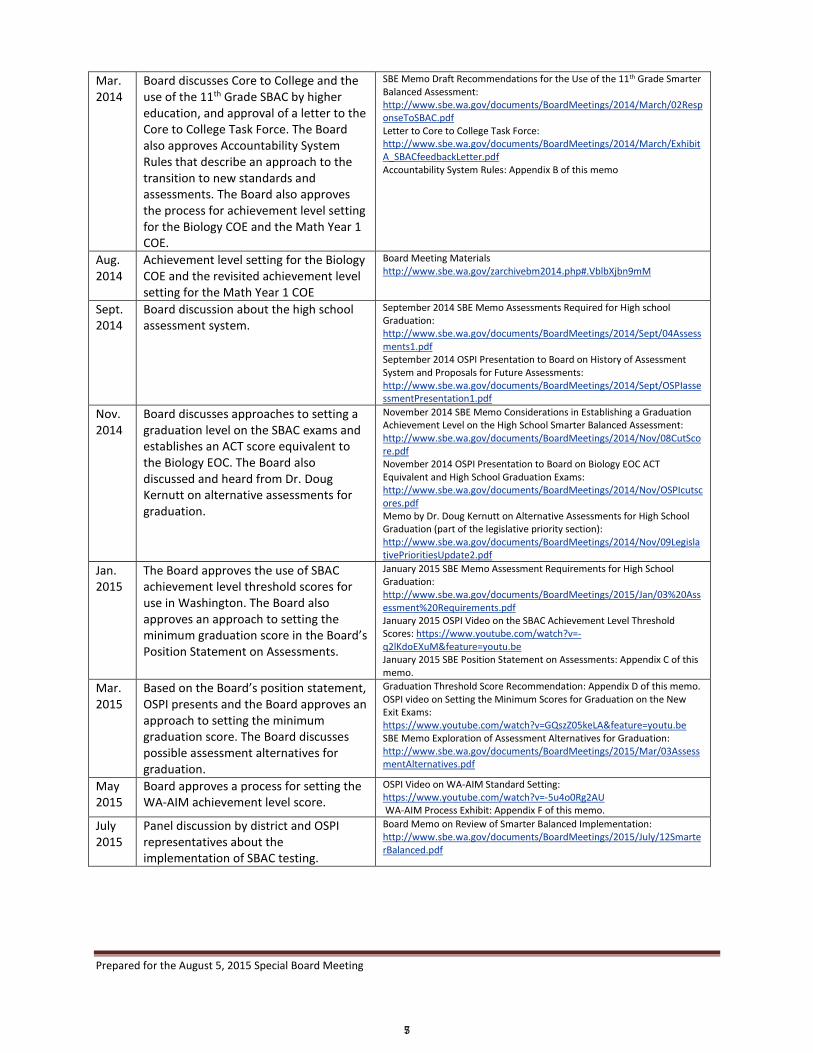
Table 2 summarizes and provides links to the work of the Board on the assessment system over the past three years, as the state worked to fully implementing the new standards and prepare for the new assessments.
The Board has explicitly expressed its position on assessments in a series of documents. On January 10, 2013, the SBE adopted a motion identifying the SBE’s position on assessments:
The State Board of Education (1) recognizes the state is in a time of transition with implementation of the Common Core State Standards (CCSS); (2) strongly urges alignment and work with higher education so the Smarter Balanced Assessment Consortium (SBAC) 11th grade assessment would be meaningful in admissions and placement; (3) affirms exit exams as part of a meaningful high school diploma; (4) move towards exit exams consisting of: Algebra 1 EOC, Biology EOC, Reading and Writing transitioning to ELA (comprehensive SBAC 10th or 11th grade needs further exploration); and (5) more work to broaden Science assessment options (concerns about narrowing of curriculum through Biology EOC).
35

Prepared for the August 5, 2015 Special Board Meeting
In addition, the Board established an intent in rule (WAC 180-17-100, adopted March 2014, Appendix B of this memo) that graduation requirements should ultimately align with career and college readiness, but that during the transition to new content standards and assessments, the graduation level should be a minimum proficiency standard rather than career and college readiness:
(e) The state's graduation requirements should ultimately be aligned to the performance levels associated with career and college readiness. During implementation of these standards, the board recognizes the necessity of a minimum proficiency standard for graduation that reflects a standard approaching full mastery, as both students and educators adapt to the increased rigor of common core and the underlying standard of career and college- readiness for all students.
In January 2015, the Board adopted a position on assessment (Appendix C) that reaffirmed exit exams as part of a meaningful high school diploma, and established an initial “equal impact” approach to setting minimum high school graduation scores on new assessments:
This approach will begin the process of moving toward the more rigorous SBAC college- and career-ready level by setting initial high school proficiency scores that would impact students in the next few years approximately equally to how students have been impacted by exit exams during the past few years. These initial minimum scores would be re-evaluated over the following years, as new standards are implemented and as more students gain the skills necessary to be SBAC College and Career Ready.
Based on this approach, OSPI developed a process for setting initial minimum graduation scores on the Smarter Balanced assessments and the transition math EOC exit exams (Appendix D).
Table 2: SBE’s work on Assessments During the Past Three Years
Date Board Activity References and Links May 2012
OSPI presents to the Board and the Board discusses the transition to Common Core and Next Generation Standards and Assessments.
OSPI presentation on Next Five Years of State Assessment, Transitioning to New Assessments of New State Standards: What We Know So Far: http://www.sbe.wa.gov/documents/2012.05.08-09%2011%20Common%20Core%20and%20Next%20Generation%20Science%20Standards.pdf
Aug. 2012
Standard setting for Biology EOC and WA Alternate Assessment System.
Board meeting materials: http://www.sbe.wa.gov/zarchivebm2012.php#.Vbl5vzbn9mM
Sept. 2012
Board discusses alternatives to certificate of academic achievement assessments.
SBE memo Review of Certificate of Academic Achievement Options for EOC Exams: http://www.sbe.wa.gov/documents/2012.09.26%2012%20CAA.pdf
Nov. 2012
Board discusses assessment graduation requirements and considers the development of a position on assessments.
SBE memo Recommendations for a Career and College Ready Assessment System: http://www.sbe.wa.gov/documents/2012.11.08%2016%20Assessments.pdf
Jan. 2013
The Board approved a legislative priority on assessments.
SBE memo Consideration of an SBE Position Statement: Modifications to the State Assessment System to Support Career and College Readiness: http://www.sbe.wa.gov/documents/2013.01.09%2007%20Assessments.pdf Business items with the legislative priority on assessments: http://www.sbe.wa.gov/documents/2013.01.09%2007%20Assessments.pdf
Mar. 2013
Standard setting for Year 1 and Year 2 Math COEs.
Board meeting materials: http://www.sbe.wa.gov/zarchivebm2013.php#.Vbl2azbn9mM
July 2013
Board discusses the state’s accountability framework, including the role of assessment.
Board memo on the Development of an Accountability Framework Pursuant to the Requirements of Senate Bills 5329 and 5491: http://www.sbe.wa.gov/documents/BoardMeetings/2013/07-10-2013_020AccountabilityFrameworkNew.pdf
46
Prepared for the August 5, 2015 Special Board Meeting
Mar. 2014
Board discusses Core to College and the use of the 11th Grade SBAC by higher education, and approval of a letter to the Core to College Task Force. The Board also approves Accountability System Rules that describe an approach to the transition to new standards and assessments. The Board also approves the process for achievement level setting for the Biology COE and the Math Year 1 COE.
SBE Memo Draft Recommendations for the Use of the 11th Grade Smarter Balanced Assessment: http://www.sbe.wa.gov/documents/BoardMeetings/2014/March/02ResponseToSBAC.pdf Letter to Core to College Task Force: http://www.sbe.wa.gov/documents/BoardMeetings/2014/March/ExhibitA_SBACfeedbackLetter.pdf Accountability System Rules: Appendix B of this memo
Aug. 2014
Achievement level setting for the Biology COE and the revisited achievement level setting for the Math Year 1 COE
Board Meeting Materials http://www.sbe.wa.gov/zarchivebm2014.php#.VblbXjbn9mM
Sept. 2014
Board discussion about the high school assessment system.
September 2014 SBE Memo Assessments Required for High school Graduation: http://www.sbe.wa.gov/documents/BoardMeetings/2014/Sept/04Assessments1.pdf September 2014 OSPI Presentation to Board on History of Assessment System and Proposals for Future Assessments: http://www.sbe.wa.gov/documents/BoardMeetings/2014/Sept/OSPIassessmentPresentation1.pdf
Nov. 2014
Board discusses approaches to setting a graduation level on the SBAC exams and establishes an ACT score equivalent to the Biology EOC. The Board also discussed and heard from Dr. Doug Kernutt on alternative assessments for graduation.
November 2014 SBE Memo Considerations in Establishing a Graduation Achievement Level on the High School Smarter Balanced Assessment: http://www.sbe.wa.gov/documents/BoardMeetings/2014/Nov/08CutScore.pdf November 2014 OSPI Presentation to Board on Biology EOC ACT Equivalent and High School Graduation Exams: http://www.sbe.wa.gov/documents/BoardMeetings/2014/Nov/OSPIcutscores.pdf Memo by Dr. Doug Kernutt on Alternative Assessments for High School Graduation (part of the legislative priority section): http://www.sbe.wa.gov/documents/BoardMeetings/2014/Nov/09LegislativePrioritiesUpdate2.pdf
Jan. 2015
The Board approves the use of SBAC achievement level threshold scores for use in Washington. The Board also approves an approach to setting the minimum graduation score in the Board’s Position Statement on Assessments.
January 2015 SBE Memo Assessment Requirements for High School Graduation: http://www.sbe.wa.gov/documents/BoardMeetings/2015/Jan/03%20Assessment%20Requirements.pdf January 2015 OSPI Video on the SBAC Achievement Level Threshold Scores: https://www.youtube.com/watch?v=-q2lKdoEXuM&feature=youtu.be January 2015 SBE Position Statement on Assessments: Appendix C of this memo.
Mar. 2015
Based on the Board’s position statement, OSPI presents and the Board approves an approach to setting the minimum graduation score. The Board discusses possible assessment alternatives for graduation.
Graduation Threshold Score Recommendation: Appendix D of this memo. OSPI video on Setting the Minimum Scores for Graduation on the New Exit Exams: https://www.youtube.com/watch?v=GQszZ05keLA&feature=youtu.be SBE Memo Exploration of Assessment Alternatives for Graduation: http://www.sbe.wa.gov/documents/BoardMeetings/2015/Mar/03AssessmentAlternatives.pdf
May 2015
Board approves a process for setting the WA-AIM achievement level score.
OSPI Video on WA-AIM Standard Setting: https://www.youtube.com/watch?v=-5u4o0Rg2AU WA-AIM Process Exhibit: Appendix F of this memo.
July 2015
Panel discussion by district and OSPI representatives about the implementation of SBAC testing.
Board Memo on Review of Smarter Balanced Implementation: http://www.sbe.wa.gov/documents/BoardMeetings/2015/July/12SmarterBalanced.pdf
57
Prepared for the August 5, 2015 Special Board Meeting
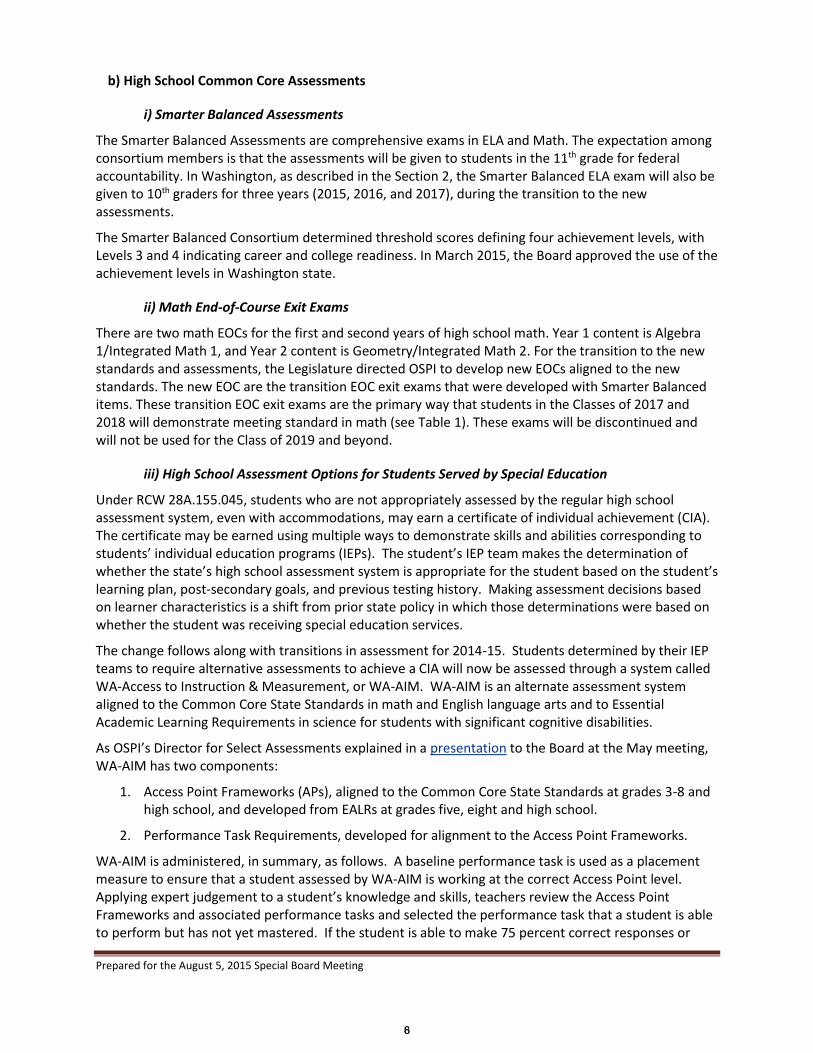
b) High School Common Core Assessments
i) Smarter Balanced Assessments
The Smarter Balanced Assessments are comprehensive exams in ELA and Math. The expectation among consortium members is that the assessments will be given to students in the 11th grade for federal accountability. In Washington, as described in the Section 2, the Smarter Balanced ELA exam will also be given to 10th graders for three years (2015, 2016, and 2017), during the transition to the new assessments.
The Smarter Balanced Consortium determined threshold scores defining four achievement levels, with Levels 3 and 4 indicating career and college readiness. In March 2015, the Board approved the use of the achievement levels in Washington state.
ii) Math End-of-Course Exit Exams
There are two math EOCs for the first and second years of high school math. Year 1 content is Algebra 1/Integrated Math 1, and Year 2 content is Geometry/Integrated Math 2. For the transition to the new standards and assessments, the Legislature directed OSPI to develop new EOCs aligned to the new standards. The new EOC are the transition EOC exit exams that were developed with Smarter Balanced items. These transition EOC exit exams are the primary way that students in the Classes of 2017 and 2018 will demonstrate meeting standard in math (see Table 1). These exams will be discontinued and will not be used for the Class of 2019 and beyond.
iii) High School Assessment Options for Students Served by Special Education
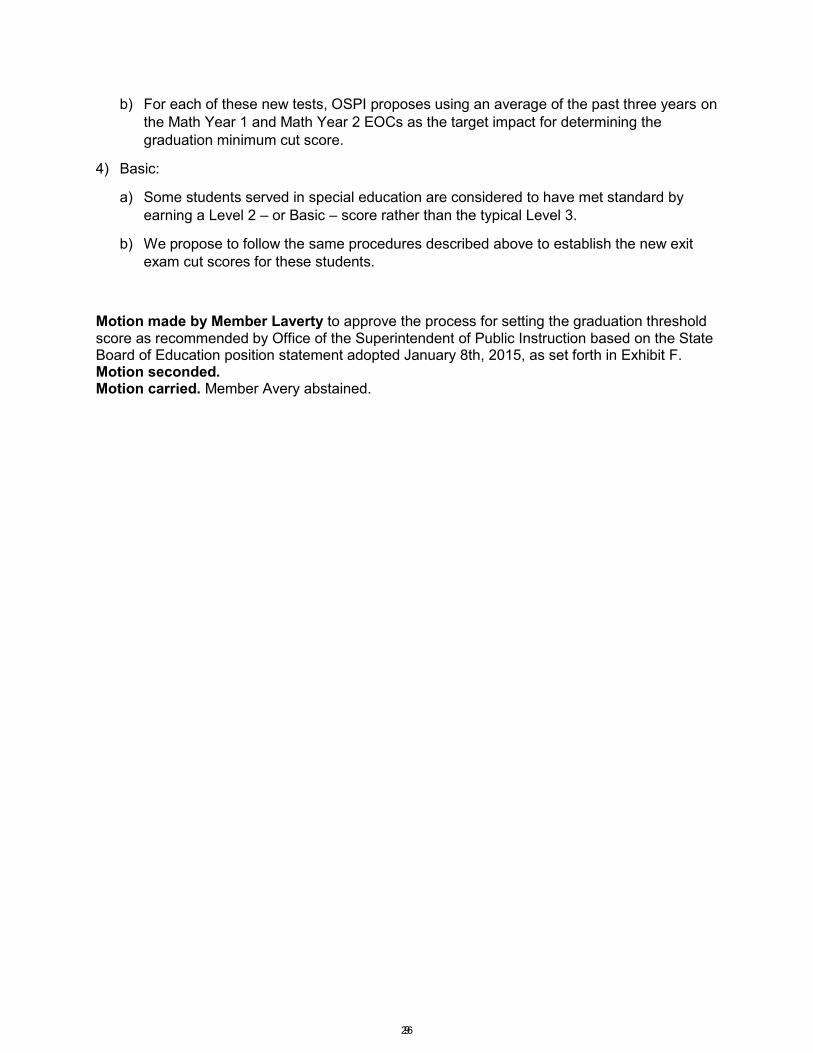
Under RCW 28A.155.045, students who are not appropriately assessed by the regular high school assessment system, even with accommodations, may earn a certificate of individual achievement (CIA). The certificate may be earned using multiple ways to demonstrate skills and abilities corresponding to students’ individual education programs (IEPs). The student’s IEP team makes the determination of whether the state’s high school assessment system is appropriate for the student based on the student’s learning plan, post-secondary goals, and previous testing history. Making assessment decisions based on learner characteristics is a shift from prior state policy in which those determinations were based on whether the student was receiving special education services.
The change follows along with transitions in assessment for 2014-15. Students determined by their IEP teams to require alternative assessments to achieve a CIA will now be assessed through a system called WA-Access to Instruction & Measurement, or WA-AIM. WA-AIM is an alternate assessment system aligned to the Common Core State Standards in math and English language arts and to Essential Academic Learning Requirements in science for students with significant cognitive disabilities.
As OSPI’s Director for Select Assessments explained in a presentation to the Board at the May meeting, WA-AIM has two components:
1. Access Point Frameworks (APs), aligned to the Common Core State Standards at grades 3-8 and high school, and developed from EALRs at grades five, eight and high school.
2. Performance Task Requirements, developed for alignment to the Access Point Frameworks.
WA-AIM is administered, in summary, as follows. A baseline performance task is used as a placement measure to ensure that a student assessed by WA-AIM is working at the correct Access Point level. Applying expert judgement to a student’s knowledge and skills, teachers review the Access Point Frameworks and associated performance tasks and selected the performance task that a student is able to perform but has not yet mastered. If the student is able to make 75 percent correct responses or
68
Prepared for the August 5, 2015 Special Board Meeting
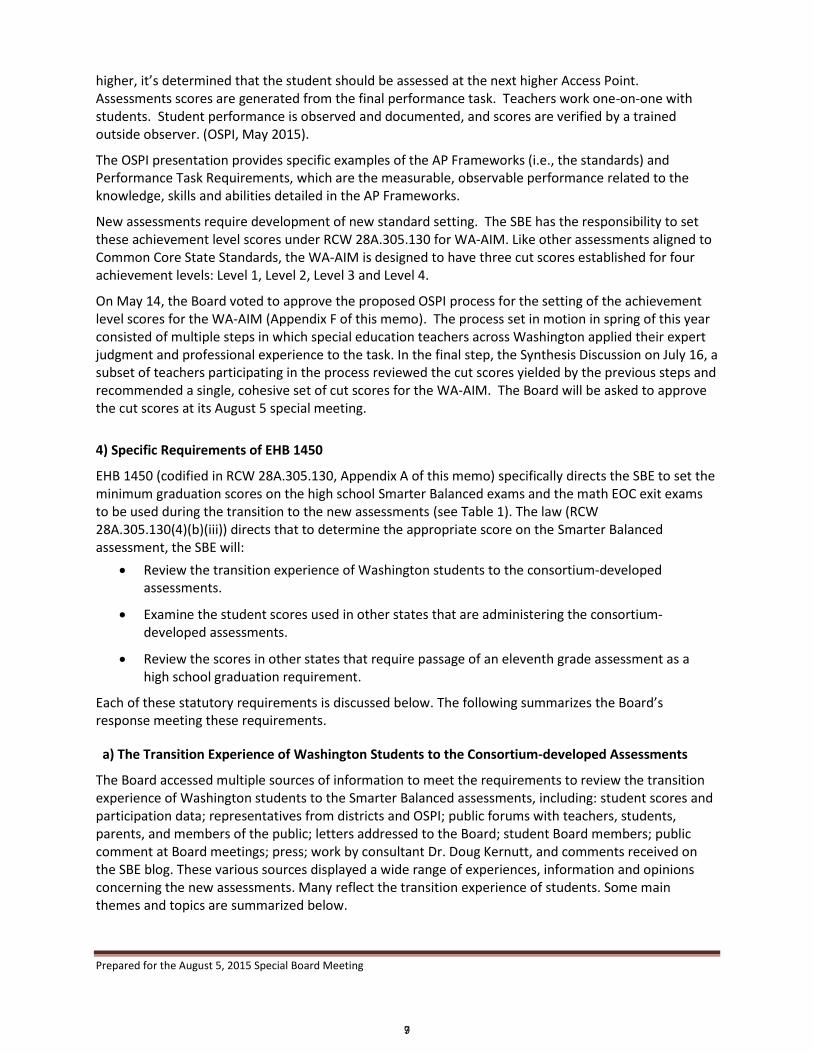
higher, it’s determined that the student should be assessed at the next higher Access Point. Assessments scores are generated from the final performance task. Teachers work one-on-one with students. Student performance is observed and documented, and scores are verified by a trained outside observer. (OSPI, May 2015).
The OSPI presentation provides specific examples of the AP Frameworks (i.e., the standards) and Performance Task Requirements, which are the measurable, observable performance related to the knowledge, skills and abilities detailed in the AP Frameworks.
New assessments require development of new standard setting. The SBE has the responsibility to set these achievement level scores under RCW 28A.305.130 for WA-AIM. Like other assessments aligned to Common Core State Standards, the WA-AIM is designed to have three cut scores established for four achievement levels: Level 1, Level 2, Level 3 and Level 4.
On May 14, the Board voted to approve the proposed OSPI process for the setting of the achievement level scores for the WA-AIM (Appendix F of this memo). The process set in motion in spring of this year consisted of multiple steps in which special education teachers across Washington applied their expert judgment and professional experience to the task. In the final step, the Synthesis Discussion on July 16, a subset of teachers participating in the process reviewed the cut scores yielded by the previous steps and recommended a single, cohesive set of cut scores for the WA-AIM. The Board will be asked to approve the cut scores at its August 5 special meeting.
4) Specific Requirements of EHB 1450
EHB 1450 (codified in RCW 28A.305.130, Appendix A of this memo) specifically directs the SBE to set the minimum graduation scores on the high school Smarter Balanced exams and the math EOC exit exams to be used during the transition to the new assessments (see Table 1). The law (RCW 28A.305.130(4)(b)(iii)) directs that to determine the appropriate score on the Smarter Balanced assessment, the SBE will:
Review the transition experience of Washington students to the consortium‐developed assessments.
Examine the student scores used in other states that are administering the consortium‐developed assessments.
Review the scores in other states that require passage of an eleventh grade assessment as a high school graduation requirement.
Each of these statutory requirements is discussed below. The following summarizes the Board’s response meeting these requirements.
a) The Transition Experience of Washington Students to the Consortium-developed Assessments
The Board accessed multiple sources of information to meet the requirements to review the transition experience of Washington students to the Smarter Balanced assessments, including: student scores and participation data; representatives from districts and OSPI; public forums with teachers, students, parents, and members of the public; letters addressed to the Board; student Board members; public comment at Board meetings; press; work by consultant Dr. Doug Kernutt, and comments received on the SBE blog. These various sources displayed a wide range of experiences, information and opinions concerning the new assessments. Many reflect the transition experience of students. Some main themes and topics are summarized below.
79

Prepared for the August 5, 2015 Special Board Meeting
i) Refusals and the Experience of 11th Graders
OSPI released preliminary data on participation in Smarter Balanced tests. These showed participation rates over 95% for grades 3 to 8, 93.6% for 10th graders, and a participation rate below 50% for 11th graders statewide. Participation by high school students varied around the state. In some districts it was very high, while in some districts is was very low. Some refusals (“opt-outs”) appeared to have been based on disagreement with state and federal testing policy. Some may have been based on inaccurate information given to students by educators or being passed between students: “I was told the test was optional.” “I had to fight to take the test because I was told it was unnecessary.”
Another factor that affected 11th grade scores may have been low motivation on the part of students who did take the test. Statewide, the scores of 11th graders are anomalously low in comparison to other states (see Figures 1 and 2), and in comparison to the 10th grade scores (Figure 3). Students report seeing other students “space-bar through the test” to finish quickly. Most 11th graders have already met the assessment graduation requirement through state tests they took in previous grades, so motivation to do well on the 11th grade Smarter Balanced test may have been diminished. This, along with negative messages some students received from their peers or their educators, may have contributed to both low participating and low achievement.
Clearly, the experience of 11th graders was different than for other grades. Refusals and motivation present a challenge to the system to better communicate with the field, with students and parents, and with the public. Lack of reliable 11th grade data impacts the ability of the SBE to set an appropriate minimum graduation score. It will be discuss in the “Overview of Spring 2015 Testing Results and Impact on Graduation Score Determination” section of this memo.
The Board’s student members discussing their experience taking the Smarter Balanced assessments is available in a video: https://www.youtube.com/watch?v=wB0drd7FEfc&feature=youtu.be
OSPI conducted a student survey, and results of the survey will be presented to the Board at the August meeting.
ii) Technology
While a few technology issues were reported in the press, at the July 2015 SBE meeting, both district representatives and OSPI staff cited technology as a “win” in regards to the transition to the Smarter Balanced assessments. In general, due to hard work on the part of testing personnel at both the districts and the state, the implementation was generally considered smooth relative to past implementations of new assessments.
A limited number of computers in some districts limited student access to testing and extended the testing period. The disruption of instructional schedules should be reduced in the future if districts have sufficient technology capacity to test their students over a reasonably short testing window.
One district’s survey of students indicated that two thirds of students did not mind the computer platform, while one third of students stated they would prefer pencil-and-paper. Teachers reported that some students found the online platform confusing. A student Board member reported that having to scroll back-and-forth while writing an essay was distracting. Some of these challenges should lessen as the testing platform is refined, and as student become more used to online testing.
iii) Delays in Receiving Scores
The Board has heard from numerous teachers and district staff frustrated with the delay in receiving student scores. This negatively impacted the student experience, since if scores had been received earlier it would have allowed more planning by schools to address individual students’ needs through summer school or course planning. OSPI is working to address this contractor issues.
810
Prepared for the August 5, 2015 Special Board Meeting
iv) A Range of Voices Concerning New Standards and New Tests
In multiple venues, the Board heard from students, educators, parents and members of the public about testing and standards, many topics bearing on the student’s experience of the transition to new assessments. Common messages expressing reservations about testing include:
Testing causes anxiety for students.
There are too many tests.
There is miscommunication regarding the test.
Instructional time is being lost to testing.
Tests are changed too frequently.
Some educators are teaching to the test.
Access to computers and technology can limit student success on the assessment.
Assessments are expensive and the benefit is not worth the cost.
The individuality of students is not taken into consideration in the assessments.
The Board also heard support for high standards and specifically, support for setting a minimum graduation score of a Level 3, the Smarter Balanced career and college ready level, on the new tests.
Student rise to high expectations.
The state needs to show confidence that all students can be prepared for college and careers.
Students with disabilities and at-risk students are the students who suffer when high standards are not set for all students.
Without setting high standards the system will not be motivated to provide the support to get all students to a high level of achievement.
The comments on the SBE blog post on Smarter Balanced Assessments and Graduation Requirements provide an example of the range of comments received by the Board: https://washingtonsbe.wordpress.com/2015/07/06/smarter-balanced-assessments-and-graduation-requirements/
b) Student Scores Used in Other States that are Administering the Consortium‐developed Assessments
Of the states that use Smarter Balanced assessments (Connecticut, Delaware, Hawaii, Idaho, Maine, Montana, New Hampshire, North Dakota, Oregon, South Dakota, Vermont, West Virginia), most do not have individual student stakes. Connecticut, Delaware, Hawaii, Maine, Montana, New Hampshire, North Dakota, South Dakota, Vermont, and West Virginia do not require students to achieve a specific score on the assessments.
Oregon does not require students to pass the Smarter Balanced tests but passing the Smarter Balanced tests are one way to fulfill the Essential Skills requirement. This summer Oregon is establishing a scale score that represents an equivalent level of rigor to the standard of the current state exam, the OAKS. Idaho is planning on phasing in a passing score. The Class of 2018 will be required to pass at a 9th grade level, 2019 at 10th, and 2020 at 11th. However, the state decided this year to have 10th graders take the Smarter Balanced, so the plan for the class of 2020 is unclear.
911

Prepared for the August 5, 2015 Special Board Meeting
Preliminary results on the Smarter Balanced assessment have only been released by Washington, Oregon and Idaho. Preliminary results on the math Smarter Balanced (Figure 1) show Washington achieving at a higher level in grades three through eight, and then the performance significantly drops in 11th grade. Despite Washington’s strong math standards and performance as evidenced by performance at other grade levels and by NAEP results (Table 3), Washington falls lower compared to these neighboring states on the percentage meeting a Level 3 in 11th grade. With no reason to believe that the 11th grade cohort is uniquely and considerably lower-performing than other cohorts currently taking the Smarter Balanced in Washington, these results suggest that 11th grade math performance on the Smarter Balanced was exceedingly low for reasons beyond student math skill and knowledge. Other sections of this board packet consider the role of participation rates and motivation to take the test seriously as reasons why 11th grade performance on the math Smarter Balanced is so low. A conclusion that can be drawn from this comparison of states is that Washington’s math performance on the Smarter Balanced can and should become higher at 11th grade in future years than it was in the 2014-2015 school year.
Preliminary results on the ELA Smarter Balanced (Figure 2) show Washington performing similarly to Oregon and Idaho. For Washington, the data for “11th grade” actually includes the results for both 10th and 11th grade. Unlike math, there is no steep drop in ELA performance in 11th grade. However, Washington’s results do not spike upwards for high school as the neighboring states’ do. This absence of an increase in percentage meeting Level 3 in high school ELA, and the plummet in performance on the 11th grade math Smarter Balanced relative to these neighboring states, suggests that Washington’s 11th grade class perceived and handled the 11th grade assessment differently from cohorts taking the Smarter Balanced at other grade levels, and differently from their counterparts in neighboring states.
1012

Prepared for the August 5, 2015 Special Board Meeting
Figure 1. Preliminary Math Smarter Balanced Results for Washington, Oregon and Idaho.
Figure 2. Preliminary ELA Smarter Balanced Results for Washington, Oregon and Idaho.
Idaho
Oregon
Washington
0%
10%
20%
30%
40%
50%
60%
Grade 3 Grade 4 Grade 5 Grade 6 Grade 7 Grade 8 Grade 11
Per
cen
t M
eeti
ng
a Le
vel 3
or
Hig
her
Preliminary Math Smarter Balanced Results
ID OR WA
Idaho
Oregon
Washington
0%
10%
20%
30%
40%
50%
60%
70%
80%
Grade 3 Grade 4 Grade 5 Grade 6 Grade 7 Grade 8 Grade 11
Per
cen
t M
eeti
ng
a Le
vel 3
or
Hig
her
Preliminary ELA Smarter Balanced Results
ID OR WA
The “Grade 11” data for Washington actually includes results for both 10th and 11th grade students.
1113

Prepared for the August 5, 2015 Special Board Meeting
Table 2: Comparison of 2013 NAEP results Washington, Oregon and Idaho
4th Gr. Math 8th Gr. Math 4th Gr. Reading 8th Gr. Reading
Washington 246 290 225 272
Oregon 240 284 219 268
Idaho 241 286 219 270
These values are the average scores of each state on the National Assessment of Education Progress (NAEP) results from 2013 in reading and math at grades four and eight. This provides context to the relative performance levels of other states using the Smarter Balanced for student stakes. It could be expected that Washington would perform somewhat higher on the Smarter Balanced relative to Oregon and Idaho.
c) Scores In Other States That Require Passage of an Eleventh Grade Assessment as a High School Graduation Requirement
Few other states require an 11th grade exit exam.1 Nevada has an 11th grade exit exam, but it will be phased out with the class of 2016 and replaced with EOC exams. New Mexico requires the PARCC English III, which likely is tied to an 11th grade course. New Jersey has multiple options for exit exams, one of which is the PARCC English III. Florida has a tiered diploma, one of which requires an 11th grade ELA exam.
Math exit exams in other states are EOC exams, not tied to a particular grade level.
Due to limited comparability, other states’ 11th grade exit exam policies do not greatly inform the Board’s decision to set an appropriate minimum graduation score. Washington’s exit exam policy and its commitment to career and college ready standards developed over many years, and has been a thoughtful and deliberate process. The lack of other states that directly compare should not deter Washington’s commitment to follow-through on an aligned system with the goal of career and college readiness for all students.
5) Overview of Spring 2015 Smarter Balanced Testing Results and Impact on Establishing Minimum Graduation Scores
As discussed in Section 2 of this memo, both 10th graders and 11th graders took the Smarter Balanced ELA assessment in spring 2015. Figure 3 shows the Smarter Balanced ELA results for all students, only 10th graders, and only 11th graders. The performance of the 10th graders is far better than for the 11th graders, the reverse of what one might expect. In fact, 10th graders performed far better than projected, based on field test results. Over 70 percent of 10th graders earned a career and college ready Level 3 or Level 4.
Figure 4 shows the results by achievement level. At the lower achievement level, the percentage of 11th graders exceed the percentage of 10th graders. At the higher levels, the relationship is reversed.
Figure 5 shows the results of the Smarter Balanced math test, which was taken by 11th graders only. The percentage at a Level 3 or above is quite low—less than 30 percent. This is much lower than the results for this cohort of students on the math COEs would suggest should be expected.
1 Information in this section is primarily from Achieve, http://www.achieve.org/ClosingtheExpectationsGap2014, and personal communication with Dr. Jacob Mishook.
1214

Prepared for the August 5, 2015 Special Board Meeting
Table 3 shows the number of students who participated in each test by grade and subject. Note the low participation by 11th graders. This is may be due to the high refusal rate by 11th graders.
Figure 3: Spring 2015 Results for Smarter Balanced ELA
Figure 4: Spring 2015 Smarter Balanced ELA Results by Achievement Level
0
20
40
60
80
100
All Students 10th Grade 11th Grade
Per
cen
t M
etin
g St
and
ard
Percent of High School Test-Takers Meeting the ELA Content Readiness Benchmark (Level 3)
0
10
20
30
40
50
AL 1 AL 2 AL 3 AL 4
Per
cen
t o
f St
ud
ents
ELA - Percent of Students by Grade by Achievement Level
Grade 10 Grade 11
1315

Prepared for the August 5, 2015 Special Board Meeting
Figure 5: Performance of 11th Graders on the Smarter Balanced Math Compared to The Performance of the Same Students on the Math EOCs.
Table 3: Approximate number of Students Participating in Spring 2015 High School Testing
Grade Level and Subject of SBA Number of Students
Number of Students Who Took HSPE or EOC Previous Yr.
10th Grade ELA SBA ~65,000 ~73,000
11th Grade ELA SBA ~38,000 ~73,000
11th Grade Math SBA ~35,000 ~72,000
For 11th grade students, both low participation and unusually low performance renders the data from the 11th grade Smarter Balanced test results less desirable for use in setting minimum graduation scores.
Fortunately, because of the use of the Smarter Balanced ELA assessment as a transition test for 10th graders, data exists from the 10th grade results that could be used for setting a minimum graduation score. Unfortunately, this is not the case for the Smarter Balanced math assessment, and the Board will need to consider how to set a minimum graduation score on the math assessment. Possible options include setting the minimum graduation score as:
SBAC Achievement Level 2.
SBAC Achievement Level 3.
A level commensurate with the Smarter Balanced ELA minimum graduation score.
Several options will be presented to the Board at the August special meeting.
0
20
40
60
80
100
10th Grade HSPE/EOC 11th Grade SBAC
Per
cen
t M
eeti
ng
Stan
dar
dMath Performance (Matched Cohort)
Math
1416

Prepared for the August 5, 2015 Special Board Meeting
6) Action
At the August Special Meeting the Board will consider establishing graduation scores on new high school assessments aligned to new learning standards in English Language Arts and math. For the transition math EOCs, it is anticipated that OSPI will follow the method approved by the Board for determining minimum graduation scores. OSPI will also present proposed scores for WA-AIM.
Determining the minimum graduation scores for the Smarter Balanced exams will be somewhat more complex because of the 11th grade results. For ELA, the 10th grade results could be used, and a method similar to the method OSPI will follow for the EOCs may yield a reasonable minimum graduation score that would fulfill the goal of “equal impact.”
For setting the minimum math graduation score, a similar solution is not available because only 11th graders took the Smarter Balanced math assessments. Because of the low participation and low achievement, setting a score according to the originally proposed “matched cohort” approach (see Appendix D), would yield a very low minimum graduation score that most likely would not meet the target of “equal impact.” At the Board meeting, OSPI will present several options and SBE staff will make a recommendation for setting the minimum graduation score on the Smarter Balanced math assessments.
The Smarter Balanced math assessment may be used as an alternative for the Classes of 2016, 2017, and 2018, but it will not be until spring 2018 that 11th graders in the Class of 2019 will take the assessment for graduation purposes. The minimum graduation score that the Board must set on the Smarter Balanced math assessment by the end of the school year, as directed by statute, may be revisited once more reliable data is available.
If you have questions regarding this memo, please contact Linda Drake at [email protected].
1517

APPENDICES
APPENDIX A ................................................................................................................................................... 2
RCW 28A.305.130 Powers and duties — Purpose.
APPENDIX B ................................................................................................................................................... 4
WAC 180-17-100
Establishment of accountability framework to improve student achievement for all children.
APPENDIX C ................................................................................................................................................... 5
State Board of Education Position Statement on High School Assessments Required for Graduation
January 8, 2015
APPENDIX D ................................................................................................................................................... 8
SBE Graduation Threshold Score Recommendation
EXHIBIT F March 12, 2015
APPENDIX E ................................................................................................................................................. 10
RCW 28A.655.061 High school assessment system—Certificate of academic achievement
APPENDIX F ................................................................................................................................................. 12
WA-AIM Cut-Score Setting Process
EXHIBIT F May 14, 2015
118
APPENDIX A
RCW 28A.305.130
Powers and duties — Purpose.
The purpose of the state board of education is to provide advocacy and strategic oversight of public education; implement a standards-based accountability framework that creates a unified system of increasing levels of support for schools in order to improve student academic achievement; provide leadership in the creation of a system that personalizes education for each student and respects diverse cultures, abilities, and learning styles; and promote achievement of the goals of RCW 28A.150.210. In addition to any other powers and duties as provided by law, the state board of education shall: . . .
(4) For purposes of statewide accountability: . . . . (b)(i) Identify the scores students must achieve in order to meet the standard on the statewide student assessment and, for high school students, to obtain a certificate of academic achievement. The board shall also determine student scores that identify levels of student performance below and beyond the standard. The board shall consider the incorporation of the standard error of measurement into the decision regarding the award of the certificates. The board shall set such performance standards and levels in consultation with the superintendent of public instruction and after consideration of any recommendations that may be developed by any advisory committees that may be established for this purpose. (ii) By the end of the 2014-15 school year, establish the scores students must achieve to meet the standard and earn a certificate of academic achievement on the tenth grade English language arts assessment and the end-of-course mathematics assessments developed in accordance with RCW 28A.655.070 to be used as the state transitions to high school assessments developed with a multistate consortium. (iii) By the end of the 2014-15 school year, establish the scores students must achieve to meet the standard and earn a certificate of academic achievement on the high school English language arts assessment and the comprehensive mathematics assessment developed with a multistate consortium in accordance with RCW 28A.655.070. To determine the appropriate score, the state board shall review the transition experience of Washington students to the consortium-developed assessments, examine the student scores used in other states that are administering the consortium-developed assessments, and review the scores in other states that require passage of an eleventh grade assessment as a high school graduation requirement. The scores established by the state board of education for the purposes of earning a certificate of academic achievement and graduation from high school may be different from the scores used for the purpose of determining a student's career and college readiness. (iv) The legislature shall be advised of the initial performance standards for the high school statewide student assessment. Any changes recommended by the board in the performance standards for the high school assessment shall be presented to the education committees of the house of representatives and the senate by November 30th of the school year in which the changes will take place to permit the legislature to take statutory action before the changes are implemented if such action is deemed warranted by the legislature. The legislature shall be
219

advised of the initial performance standards and any changes made to the elementary level performance standards and the middle school level performance standards. The board must provide an explanation of and rationale for all initial performance standards and any changes, for all grade levels of the statewide student assessment. If the board changes the performance standards for any grade level or subject, the superintendent of public instruction must recalculate the results from the previous ten years of administering that assessment regarding students below, meeting, and beyond the state standard, to the extent that this data is available, and post a comparison of the original and recalculated results on the superintendent's web site;
320

APPENDIX B
WAC 180-17-100
Establishment of accountability framework to
improve student achievement for all children.
(1) Pursuant to the requirements of RCW 28A.657.110 (chapter 159, Laws of 2013), the state board of education adopts the following guiding principles in fulfillment of its responsibility to establish an accountability framework. The framework establishes the guiding principles for a unified system of support for challenged schools that aligns with basic education, increases the level of support based upon the magnitude of need, and uses data for decisions. . . .
(3) The board finds that the accountability system design and implementation should reflect the following principles and priorities: . . .
(e) The state's graduation requirements should ultimately be aligned to the performance levels associated with career and college readiness. During implementation of these standards, the board recognizes the necessity of a minimum proficiency standard for graduation that reflects a standard approaching full mastery, as both students and educators adapt to the increased rigor of common core and the underlying standard of career and college-readiness for all students.
. [Statutory Authority: RCW 28A.657.040 - 28A.657.070 and 28A.657.105 - 28A.657.110. WSR 14-11-062, § 180-17-100, filed 5/18/14, effective 6/18/14.]
421

APPENDIX C
State Board of Education Position Statement on High School Assessments Required for Graduation Approved January 8, 2015
Background
1. College- and career-ready Smarter Balanced Assessment (SBAC) threshold scores were set nationally by the Smarter Balance Assessment Consortium in November 2014, establishing scores for Achievement Levels 1 to 4. The scores must be approved by the State Board of Education (SBE) for use in Washington. The SBAC assesses both mathematics and English Language Arts.
2. SBAC tests will be taken by Washington students in spring 2015, with results expected by summer 2015.
3. By statute (EHB 1450 passed in 2013), by the end of August 2015 the SBE must set an SBAC threshold score students must meet for high school graduation.
4. In its resolution on assessments adopted in January 2013, the SBE previously affirmed that exit exams are a part of a meaningful high school diploma.
5. Accountability framework rules adopted by the SBE in May 2014 states that graduation requirements should ultimately be aligned to the performance levels associated with career and college readiness. The rules also recognized the necessity of a minimum proficiency standard for graduation as both students and educators adapt to the increased rigor of Common Core State Standards.
6. The legislature stated its intent in statute (EHB 1450 passed in 2013) that the state transition from a biology end-of-course assessment to a more comprehensive science assessment.
7. By its resolution adopted in November 2014, the SBE urged the Legislature to end the biology end-of-course exam as a high school graduation requirement in favor of developing a comprehensive science exam that aligns with the Next Generation Science Standards.
8. Washington public institutions of higher education have agreed to use the high school SBAC for postsecondary placement decisions.
9. The State Board for Community and Technical Colleges and OSPI have an on-going project to establish high school transition courses for Math and English Language Arts, called Bridge To College courses.
Guiding principles
The State Board of Education:
1. Holds a goal of a graduation requirement that aligns with a career- and college-ready performance level; but recognizes that it will take time for students, educators, and the
522

system to adapt to the increased rigor of Common Core State Standards and Next Generation Science Standards.
2. Recognizes that the state is in a time of transition to new standards and assessments. There are challenges, but there are also opportunities to strengthen education and create greater alignment between secondary and postsecondary education, training and career systems.
3. Reaffirms high school exit exams, or alternatives, aligned to rigorous standards that all students are required to take as part of a meaningful high school diploma and an opportunity for students to demonstrate their readiness for postsecondary education, training and careers.
4. Supports multiple ways for students who are not successful on the assessments to demonstrate meeting standard and readiness for postsecondary options.
5. Intends to set initial minimum scores for graduation on the high school SBAC that bridges past statewide performance on exit exams to the initial statewide performance of students on the SBAC assessments. This approach will begin the process of moving toward the more rigorous SBAC college- and career-ready level by setting initial high school proficiency scores that would impact students in the next few years approximately equally to how students have been impacted by exit exams during the past few years. These initial minimum scores would be re-evaluated over the following years, as new standards are implemented and as more students gain the skills necessary to be SBAC College and Career Ready.
6. Supports the use of the SBAC assessments, and in the future the Next Generation Science Standards assessment, by postsecondary institutions in placement and admissions decisions.
7. Supports the development and use of transition courses to prepare high school students for success in college-level work.
8. Supports continued work on the integration of career readiness into high school assessment systems.
9. Supports the streamlining of the high school assessment system, including alternatives to passing exit exams, and further research on the impact of exit exams.
10. Continues to recommend ending the biology assessment as a requirement for graduation, while maintaining the exam for federal accountability, in favor of developing a comprehensive science exam that aligns with the Next Generation Science Standards.
Options to explore: The State Board of Education (SBE) sees potential in additional options for high school students to demonstrate meeting standard and readiness for postsecondary education and work, as quality alternatives to meeting standard on high school assessments required for graduation. The SBE supports seeking further information and exploration of:
1. Tenth grade students taking the high school SBAC, allowing more time for high school course-taking and alternatives if the student is not on-track.
2. Earning credit in Bridge To College transition courses recognized by higher education for college placement.
3. Earning dual credit in specific college-level courses. 4. Earning a professional certification or completing a Career and Technical Education
(CTE) Program. 5. Additional assessments as alternatives, including CTE and work-readiness
assessments.
623

Motion made to adopt the assessment position statement as set forth in Exhibit A. Motion seconded. Amendment proposed to guiding principle two to change “postsecondary educational systems” to “postsecondary college and career systems” as set forth on the screen and to add a new principle, as number eight, that reads “Supports continued work on the integration of career readiness into high school assessment systems.” Friendly amendment proposed to change “postsecondary college and career systems” to “postsecondary education, training and career systems.” Friendly amendment accepted. Amendment carried. Amendment proposed to strike guiding principle three in its entirety and to strike “including alternatives to passing exit exams” from guiding principle nine. Amendment seconded. Amendment failed. Roll call requested. Five yes; eight no. Those voting no: Jennings, Laverty, Maxie, Mayer, Estes, Wilds, Muñoz-Colón, Maier. Those voting yes: Dorn, Fletcher, Hughes, McMullen, Koon. Amendment proposed to guiding principle nine to state “supports the streamlining of the high school assessment system, including further research on the impact of exit exams and alternatives to passing exit exams.”
Amendment seconded. Friendly amendment proposed to state “including alternatives to passing exit exams, and further research on the impact of exit exams.” Friendly amendment accepted. Amendment carried. Amendment proposed to change “cut scores” to “threshold scores” throughout the document. Amendment seconded. Amendment carried. Amendment proposed to guiding principle number five to state “minimum scores for graduation.” Amendment seconded. Amendment carried. Motion carried.
724

APPENDIX D
SBE Graduation Threshold Score Recommendation EXHIBIT F Approved March 12, 2015
The Office of the Superintendent of Public Instruction recommends the following approaches to setting the minimum cut scores for graduation on the new exit exams:
Determine the Smarter Balanced high school exam cut scores from the 11th graders performance in 2015.
Base the Math EOC exit exam cut scores on the average results of the math EOCs over the past three years.
1) Smarter Balanced ELA Comprehensive:
a) Use the procedure reviewed and approved by both NTAC and the State Board in the past for establishing the cut scores on college admissions exams (SAT, ACT).
b) Use the pool of 2015 11th grade students who have both a Smarter Balanced ELA score and both Reading HSPE and Writing HSPE scores.
c) Conduct an equipercentile linking between the percent meeting the assessment graduation requirement on reading and writing (passed both HSPEs) and that same percentile point in the Smarter Balanced file.
d) Determine the Smarter Balanced scale score that yields that percentile.
2) Smarter Balanced Math Comprehensive:
a) Use the procedure reviewed and approved by both NTAC and the State Board in the past for establishing the cut scores on college admissions exams (SAT, ACT).
b) Use the pool of 2015 11th grade students who have both a Smarter Balanced mathematics score and a score on the algebra/integrated 1 EOC OR the geometry/integrated 2 EOC.
c) Conduct an equipercentile linking between the percent meeting the math assessment graduation requirement (passed at least one math EOC) and that same percentile point in the Smarter Balanced file.
d) Determine the Smarter Balanced scale score that yields that percentile.
3) Math Year 1 and Math Year 2 EOC
a) Equal impact cut scores would yield comparable “passing” rates on the new tests as the former tests.
825
b) For each of these new tests, OSPI proposes using an average of the past three years on the Math Year 1 and Math Year 2 EOCs as the target impact for determining the graduation minimum cut score.
4) Basic:
a) Some students served in special education are considered to have met standard by earning a Level 2 – or Basic – score rather than the typical Level 3.
b) We propose to follow the same procedures described above to establish the new exit exam cut scores for these students.
Motion made by Member Laverty to approve the process for setting the graduation threshold score as recommended by Office of the Superintendent of Public Instruction based on the State Board of Education position statement adopted January 8th, 2015, as set forth in Exhibit F. Motion seconded. Motion carried. Member Avery abstained.
926

APPENDIX E
RCW 28A.655.061 High school assessment system—Certificate of academic achievement—Exemptions—Options to retake high school assessment—Objective alternative assessment—Student learning plans.
*** CHANGE IN 2015 *** (SEE 6145.SL) ***
(1) The high school assessment system shall include but need not be limited to the statewide student assessment, opportunities for a student to retake the content areas of the assessment in which the student was not successful, and, if approved by the legislature pursuant to subsection (10) of this section, one or more objective alternative assessments for a student to demonstrate achievement of state academic standards. The objective alternative assessments for each content area shall be comparable in rigor to the skills and knowledge that the student must demonstrate on the statewide student assessment for each content area.
(2) Subject to the conditions in this section, a certificate of academic achievement shall be obtained and is evidence that the students have successfully met the state standard in the content areas included in the certificate. With the exception of students satisfying the provisions of RCW 28A.155.045 or *28A.655.0611, acquisition of the certificate is required for graduation from a public high school but is not the only requirement for graduation.
(3)(a) Beginning with the graduating class of 2008 through the graduating class of 2015, with the exception of students satisfying the provisions of RCW 28A.155.045, a student who meets the state standards on the reading, writing, and mathematics high school statewide student assessment shall earn a certificate of academic achievement. The mathematics assessment shall be the end-of-course assessment for the first year of high school mathematics that assesses the standards common to algebra I and integrated mathematics I or the end-of-course assessment for the second year of high school mathematics that assesses standards common to geometry and integrated mathematics II.
(b) As the state transitions from reading and writing assessments to an English language arts assessment and from end-of-course assessments to a comprehensive assessment for high school mathematics, a student in a graduating class of 2016 through 2018 shall earn a certificate of academic achievement if the student meets the state standard as follows:
(i) Students in the graduating class of 2016 may use the results from: (A) The reading and writing assessment or the English language arts assessment
developed with the multistate consortium; and (B) The end-of-course assessment for the first year of high school mathematics, the end-of-
course assessment for the second year of high school mathematics, or the comprehensive mathematics assessment developed with the multistate consortium.
(ii) Students in the graduating classes of 2017 and 2018 may use the results from: (A) The tenth grade English language arts assessment developed by the superintendent of
public instruction using resources from the multistate consortium or the English language arts assessment developed with the multistate consortium; and
1027

(B) The end-of-course assessment for the first year of high school mathematics, the end-of-course assessment for the second year of high school mathematics, or the comprehensive mathematics assessment developed with the multistate consortium.
(c) Beginning with the graduating class of 2019, a student who meets the state standards on the high school English language arts assessment developed with the multistate consortium and the comprehensive mathematics assessment developed with the multistate consortium shall earn a certificate of academic achievement.
(d) If a student does not successfully meet the state standards in one or more content areas required for the certificate of academic achievement, then the student may retake the assessment in the content area at least twice a year at no cost to the student. If the student successfully meets the state standards on a retake of the assessment then the student shall earn a certificate of academic achievement. Once objective alternative assessments are authorized pursuant to subsection (10) of this section, a student may use the objective alternative assessments to demonstrate that the student successfully meets the state standards for that content area if the student has taken the statewide student assessment at least once. If the student successfully meets the state standards on the objective alternative assessments then the student shall earn a certificate of academic achievement.
1128

APPENDIX F
EXHIBIT F May 14, 2015 WA-AIM Cut-Score Setting Process
1. Online Teacher Achievement Level Study:
a. A modification of the contrasting groups concept used in previous WA standard setting iterations.
b. WA special educator teachers study the alternate achievement level descriptors (AALDs) for each achievement level then decide which level best describes each of their students within a content area.
2. Online Weighting Study:
a. Subset of teachers from the Online Achievement Level study sampled by specific demographic criteria (disability code, ELL status, race/ethnicity).
b. Used the same platform as the Online Achievement Level study to apply expert judgments on differential complexity across AP levels by strand/domain for each content area and grade level combination.
c. Expert review panel will review the teachers’ judgements toward considering an articulation of weights across grade spans.
3. Profile Sorting Workshop:
a. Washington educators (70%-80% special education) are convened to study the AALDs, assessment tools, etc.
b. Discuss various evidence in the form of score combinations on the WA-AIM, then make cut-score decisions based on their expectations of the knowledge, skills, and abilities of students against each AALD.
4. Synthesis Discussion:
a. Subset of Profile Sorting participants convened to consider the cut scores yielded by Teacher Achievement Level Study and Profile Sorting.
b. Recommend a single, cohesive set of cut scores for the WA-AIM.
Motion made by Member Childs to approve the process for setting the cut score on WA-AIM Assessment as set out in Exhibit F. Motion co-made by Member Wilds to approve the process for setting the cut score on WA-AIM Assessment as set out in Exhibit F. Motion seconded. Motion carried.
1229

OFFICE OF SUPERINTENDENT OF PUBLIC INSTRUCTION
Division of Assessment and Student Information
Performance Standards Setting for High
School Exit Exams and WA-AIM
Special Meeting of the State Board of Education
August 5, 2015
130

Aug 5 2015| Slide 2
OF
FIC
E O
F S
UP
ER
INT
EN
DE
NT
OF
PU
BL
IC I
NS
TR
UC
TIO
N
Div
isio
n o
f A
sse
ssm
en
t a
nd
Stu
de
nt In
form
atio
n
Special SBE Meeting
Orientation
Introductions
Topics
WA Access to Instruction & Measurement (WA-AIM)
Exit Exam Cut Scores
Year 1 Math End of Course exit exam
Year 2 Math End of Course exit exam
Smarter Balanced HS English Language Arts (ELA) test
Smarter Balanced HS Mathematics test
231

Aug 5 2015| Slide 3
OF
FIC
E O
F S
UP
ER
INT
EN
DE
NT
OF
PU
BL
IC I
NS
TR
UC
TIO
N
Div
isio
n o
f A
sse
ssm
en
t a
nd
Stu
de
nt In
form
atio
n
Special SBE Meeting
Transition to New Standards
Old Standards New Standards
Accountability Exit Exam
English
Language Arts
HSPE - Rdg Smarter Balanced
HS ELA
Smarter Balanced
HS ELAHSPE - Wrtg
Mathematics
EOC –Year 1 Smarter Balanced
HS Math
EOC –Yr 1 Exit
Exam
EOC –Yr 2 Exit
ExamEOC –Year 2
ELA, Math,
Science
WAAS -Portfolio WA-AIM WA-AIM
332

Aug 5 2015| Slide 4
OF
FIC
E O
F S
UP
ER
INT
EN
DE
NT
OF
PU
BL
IC I
NS
TR
UC
TIO
N
Div
isio
n o
f A
sse
ssm
en
t a
nd
Stu
de
nt In
form
atio
n
Special SBE Meeting
New Standards, New Tests, New
Baselines
Should not compare proficiency rates to previous tests
Increased rigor in learning standards
Increased rigor of tests
433

Aug 5 2015| Slide 5
OF
FIC
E O
F S
UP
ER
INT
EN
DE
NT
OF
PU
BL
IC I
NS
TR
UC
TIO
N
Div
isio
n o
f A
sse
ssm
en
t a
nd
Stu
de
nt In
form
atio
n
Special SBE Meeting
2015 results will set a new baseline of
student performance in Washington
Think of the standards and the assessment as a new
targets with new results…. I envision two mountains:
People who successfully climb Mt Rainer (at 14,000 ft),
will find Mt McKinley (at 20,000 ft) more challenging.
Some will be able to meet the challenge, some will be
close and some who previously were able to summit
Rainier will not be able to summit McKinley at first.
534

Aug 5 2015| Slide 6
OF
FIC
E O
F S
UP
ER
INT
EN
DE
NT
OF
PU
BL
IC I
NS
TR
UC
TIO
N
Div
isio
n o
f A
sse
ssm
en
t a
nd
Stu
de
nt In
form
atio
n
Special SBE Meeting
New Standards, New Tests, New
Baselines
Should not compare proficiency rates to previous tests
Increased rigor in learning standards
Increased rigor of tests
BUT, looking back is necessary for assessment graduation
requirements
Legislature gave SBE authority to set lower performance
standards on exit exams
SBE position is to find cut scores that yield ‘equal impact’
initially
635

Aug 5 2015| Slide 7
OF
FIC
E O
F S
UP
ER
INT
EN
DE
NT
OF
PU
BL
IC I
NS
TR
UC
TIO
N
Div
isio
n o
f A
sse
ssm
en
t a
nd
Stu
de
nt In
form
atio
n
Special SBE Meeting
Your Task is a Balancing Act
736

(WA –AIM)
837

Aug 5 2015| Slide 9
OF
FIC
E O
F S
UP
ER
INT
EN
DE
NT
OF
PU
BL
IC I
NS
TR
UC
TIO
N
Div
isio
n o
f A
sse
ssm
en
t a
nd
Stu
de
nt In
form
atio
n
Special SBE Meeting
Topics
Overview of WA-AIM Who is eligible to be assessed with WA-AIM?
What are the components of WA-AIM?
What is scored on WA-AIM?
Standard setting process
Results and recommendations
938

Aug 5 2015| Slide 10
OF
FIC
E O
F S
UP
ER
INT
EN
DE
NT
OF
PU
BL
IC I
NS
TR
UC
TIO
N
Div
isio
n o
f A
sse
ssm
en
t a
nd
Stu
de
nt In
form
atio
n
Special SBE Meeting
Background of WAshington Access to
Instruction & Measurement – WA-AIM
Designed for students with significant cognitive challenges
(~1% of students) for whom the general assessments, even
with accommodations, are not accessible.
WA-AIM is based on learning standards adapted from the
state content standards.
Performance tasks linked to the adapted learning standards are
used by educators to assess student knowledge and skills in a
pre and post format.
1039

Aug 5 2015| Slide 11
OF
FIC
E O
F S
UP
ER
INT
EN
DE
NT
OF
PU
BL
IC I
NS
TR
UC
TIO
N
Div
isio
n o
f A
sse
ssm
en
t a
nd
Stu
de
nt In
form
atio
n
Special SBE Meeting
Portfolio Data
Collection Structure
Baseline/Placement:
For each content area being
assessed, determine best access
point for student’s year-end
measure
Fall/Winter
Final Data Point:
Assess student against
content standards as
represented in the selected
access points
Winter/Spring
11 1140
Aug 5 2015| Slide 12
OF
FIC
E O
F S
UP
ER
INT
EN
DE
NT
OF
PU
BL
IC I
NS
TR
UC
TIO
N
Div
isio
n o
f A
sse
ssm
en
t a
nd
Stu
de
nt In
form
atio
n
Special SBE Meeting
Student Participants – WA-AIM
1241

Aug 5 2015| Slide 13
OF
FIC
E O
F S
UP
ER
INT
EN
DE
NT
OF
PU
BL
IC I
NS
TR
UC
TIO
N
Div
isio
n o
f A
sse
ssm
en
t a
nd
Stu
de
nt In
form
atio
n
Special SBE Meeting
Purposes of WA-AIM
WA-AIM serves as the alternate assessment, in grades 3-8 and
11, for accountability purposes in ELA, mathematics, and
science.
In high school, students must display a minimum level of
competency in ELA and math in order to earn a certificate of
individual achievement/high school diploma.
1342

Aug 5 2015| Slide 14
OF
FIC
E O
F S
UP
ER
INT
EN
DE
NT
OF
PU
BL
IC I
NS
TR
UC
TIO
N
Div
isio
n o
f A
sse
ssm
en
t a
nd
Stu
de
nt In
form
atio
n
Special SBE Meeting
Grades and Contents Assessed
with WA-AIM
14
Grade ELA Math Science
3 X X
4 X X
5 X X X
6 X X
7 X X
8 X X X
10
11 X X X*
12 Possible Possible Possible
1443
Aug 5 2015| Slide 15
OF
FIC
E O
F S
UP
ER
INT
EN
DE
NT
OF
PU
BL
IC I
NS
TR
UC
TIO
N
Div
isio
n o
f A
sse
ssm
en
t a
nd
Stu
de
nt In
form
atio
n
Special SBE Meeting
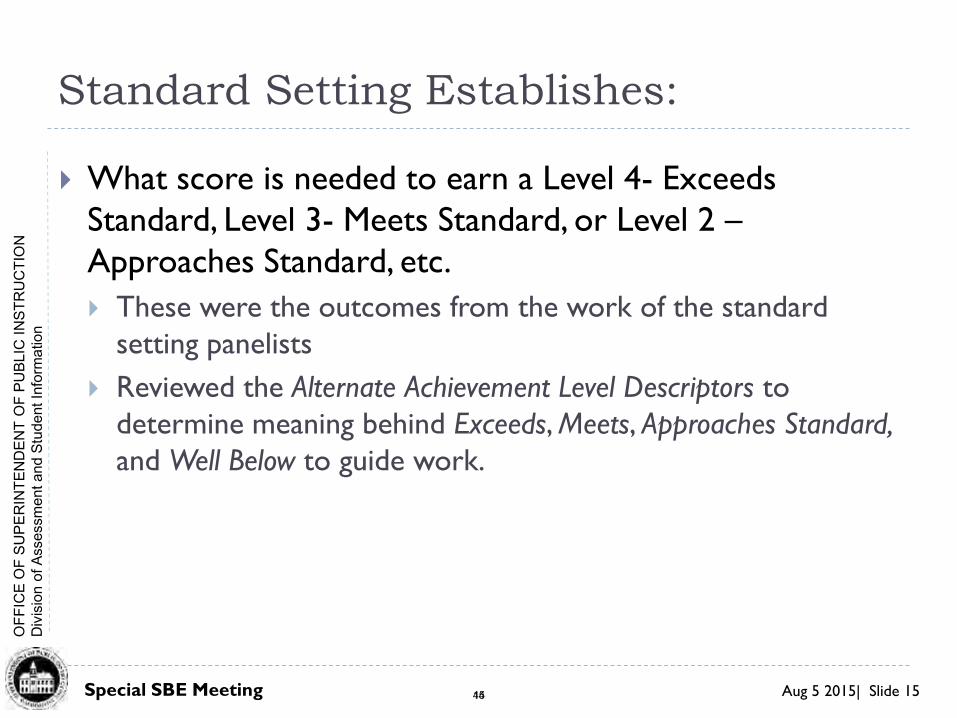
Standard Setting Establishes:
What score is needed to earn a Level 4- Exceeds
Standard, Level 3- Meets Standard, or Level 2 –
Approaches Standard, etc.
These were the outcomes from the work of the standard
setting panelists
Reviewed the Alternate Achievement Level Descriptors to
determine meaning behind Exceeds, Meets, Approaches Standard,
and Well Below to guide work.
1544

Aug 5 2015| Slide 16
OF
FIC
E O
F S
UP
ER
INT
EN
DE
NT
OF
PU
BL
IC I
NS
TR
UC
TIO
N
Div
isio
n o
f A
sse
ssm
en
t a
nd
Stu
de
nt In
form
atio
n
Special SBE Meeting
Performance Standard Setting Process
1. Convened a panel of special education and regular
classroom teachers (n=80)
2. Utilized a “Body of Work” process
3. Set standards for each grade band and content area
4. Had a cross-grade/content area Synthesis Discussion
to review overall program logic and articulation
1645
Aug 5 2015| Slide 17
OF
FIC
E O
F S
UP
ER
INT
EN
DE
NT
OF
PU
BL
IC I
NS
TR
UC
TIO
N
Div
isio
n o
f A
sse
ssm
en
t a
nd
Stu
de
nt In
form
atio
n
Special SBE Meeting
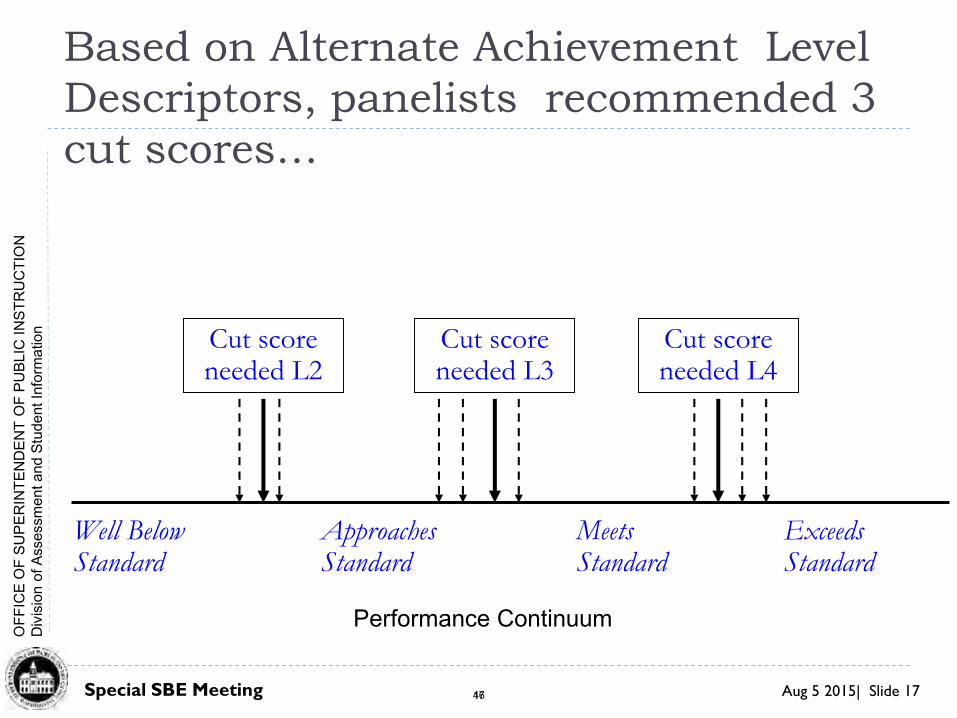
Based on Alternate Achievement Level
Descriptors, panelists recommended 3
cut scores…
Cut score needed L2
Cut score needed L4
Cut score needed L3
Well Below Standard
Approaches Standard
Meets Standard
Exceeds Standard
Performance Continuum
1746

July 2015 | Slide 18Mathematics EOC Achievement Level Descriptors Meeting
General Process
Alternate Achievement Level
Descriptors
How the students performed on the
portfolios
Classify each profile into one of
four performance levels based on:
1847
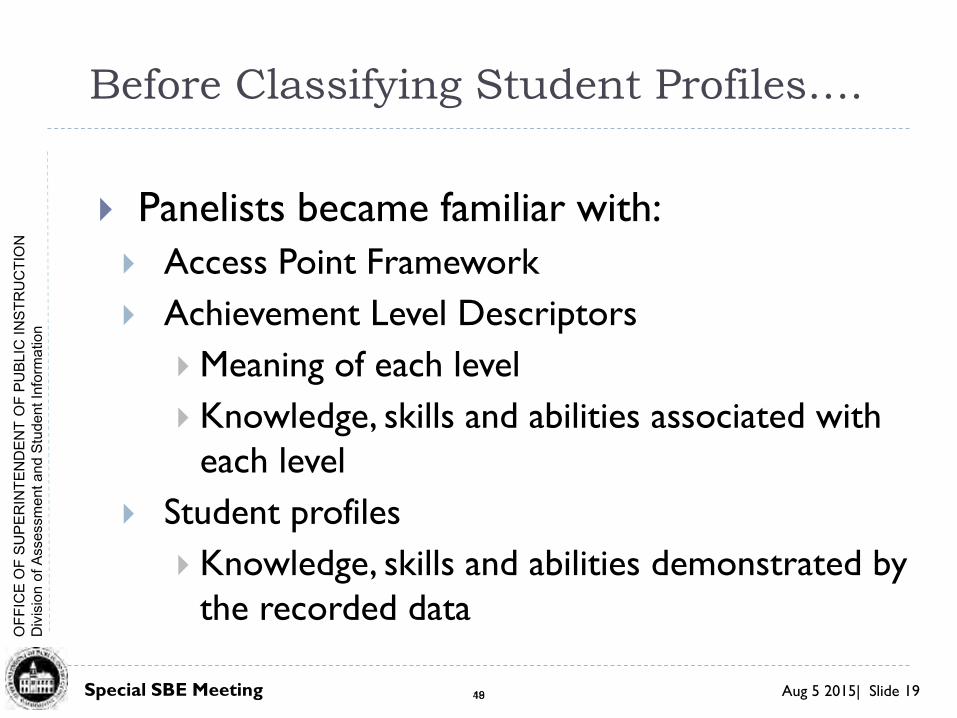
Aug 5 2015| Slide 19
OF
FIC
E O
F S
UP
ER
INT
EN
DE
NT
OF
PU
BL
IC I
NS
TR
UC
TIO
N
Div
isio
n o
f A
sse
ssm
en
t a
nd
Stu
de
nt In
form
atio
n
Special SBE Meeting
Before Classifying Student Profiles….
Panelists became familiar with:
Access Point Framework
Achievement Level Descriptors
Meaning of each level
Knowledge, skills and abilities associated with
each level
Student profiles
Knowledge, skills and abilities demonstrated by
the recorded data
1948

Aug 5 2015| Slide 20
OF
FIC
E O
F S
UP
ER
INT
EN
DE
NT
OF
PU
BL
IC I
NS
TR
UC
TIO
N
Div
isio
n o
f A
sse
ssm
en
t a
nd
Stu
de
nt In
form
atio
n
Special SBE Meeting
Student Profiles
Profiles covered the range of possible total scores
Presented in random order based on raw scores associated
with the five assessed standards.
Profiles used not as indication of typical scores, but
ensuring all possible access point/score combinations
were available.
Not a frequency distribution indicator
Panelists classified 100 student profiles at a grade
level/content area combination.
2049

Aug 5 2015| Slide 21
OF
FIC
E O
F S
UP
ER
INT
EN
DE
NT
OF
PU
BL
IC I
NS
TR
UC
TIO
N
Div
isio
n o
f A
sse
ssm
en
t a
nd
Stu
de
nt In
form
atio
n
Special SBE Meeting
Round 1
Individual Work:
Review profiles
Focus on the knowledge, skills, and abilities represented
by the profiles
Determine match of Achievement Level Descriptor to
represented knowledge, skills, and abilities
Classify profiles to appropriate achievement level
Complete the rating form
2150

Aug 5 2015| Slide 22
OF
FIC
E O
F S
UP
ER
INT
EN
DE
NT
OF
PU
BL
IC I
NS
TR
UC
TIO
N
Div
isio
n o
f A
sse
ssm
en
t a
nd
Stu
de
nt In
form
atio
n
Special SBE Meeting
Round 2
Group Work:
Discuss profile classifications in relation to
Average round 1 results
Other panelists ratings
Knowledge, skills and abilities
Individual Work:
Determine match of Achievement Level Descriptor to
represented knowledge, skills, and abilities
Classify profiles to appropriate achievement level
Complete the rating form
2251

Aug 5 2015| Slide 23
OF
FIC
E O
F S
UP
ER
INT
EN
DE
NT
OF
PU
BL
IC I
NS
TR
UC
TIO
N
Div
isio
n o
f A
sse
ssm
en
t a
nd
Stu
de
nt In
form
atio
n
Special SBE Meeting
Panelists were reminded:
Not necessary for panelists to reach consensus as to
how the profiles are to be categorized.
Group discussion / Individual Rating
Remain open-minded when listening to your colleagues’
rationales for their ratings.
May change your mind as a result of the discussions.
Use best judgment in each round of rating.
2352

Aug 5 2015| Slide 24
OF
FIC
E O
F S
UP
ER
INT
EN
DE
NT
OF
PU
BL
IC I
NS
TR
UC
TIO
N
Div
isio
n o
f A
sse
ssm
en
t a
nd
Stu
de
nt In
form
atio
n
Special SBE Meeting
Synthesis Discussion(aka Articulation Committee)
After all content area groups completed Round 2 for each
grade span, table leader representatives from each content
area met together to look at results across grades and
provide feedback.
Attention was paid to cohesiveness and logic with
respect to interplay of cut-scores and student results
Impact/benchmark data was available
2453

WA-AIM Standard Setting
Results
2554

Aug 5 2015| Slide 26
OF
FIC
E O
F S
UP
ER
INT
EN
DE
NT
OF
PU
BL
IC I
NS
TR
UC
TIO
N
Div
isio
n o
f A
sse
ssm
en
t a
nd
Stu
de
nt In
form
atio
n
Special SBE Meeting
Recommendations
National Technical Advisory Committee reviewed
processes & outcomes on July 29, 2015.
Gave approval to the standard setting recommendations
Superintendent Dorn reviewed outcomes with staff
and presents the following as recommendations to
SBE for adoption as the WA-AIM cut-scores.
2655

Aug 5 2015| Slide 27
OF
FIC
E O
F S
UP
ER
INT
EN
DE
NT
OF
PU
BL
IC I
NS
TR
UC
TIO
N
Div
isio
n o
f A
sse
ssm
en
t a
nd
Stu
de
nt In
form
atio
n
Special SBE Meeting
WA-AIM ELA Proposed Cut Scores
ELA Level 2 Level 3 Level 4
Grade 3 109 124 150
Grade 4 107 125 158
Grade 5 108 129 162
Grade 6 110 125 159
Grade 7 108 123 154
Grade 8 110 123 150
HS 109 123 151
2756

Aug 5 2015| Slide 28
OF
FIC
E O
F S
UP
ER
INT
EN
DE
NT
OF
PU
BL
IC I
NS
TR
UC
TIO
N
Div
isio
n o
f A
sse
ssm
en
t a
nd
Stu
de
nt In
form
atio
n
Special SBE Meeting
WA-AIM ELA Cut Scores - Impact
ELA L1 L2 L3 L4 L3 & Above
Grade 3 15.3% 37.1% 28.1% 19.5% 47.6%
Grade 4 10.9% 47.1% 32.6% 9.4% 42.0%
Grade 5 10.0% 48.6% 33.3% 8.2% 41.4%
Grade 6 25.9% 42.4% 26.4% 5.3% 31.7%
Grade 7 24.7% 50.3% 22.4% 2.6% 25.0%
Grade 8 32.4% 37.6% 23.3% 6.7% 30.0%
HS 42.0% 44.6% 12.1% 1.3% 13.4%
Proficiency
2857
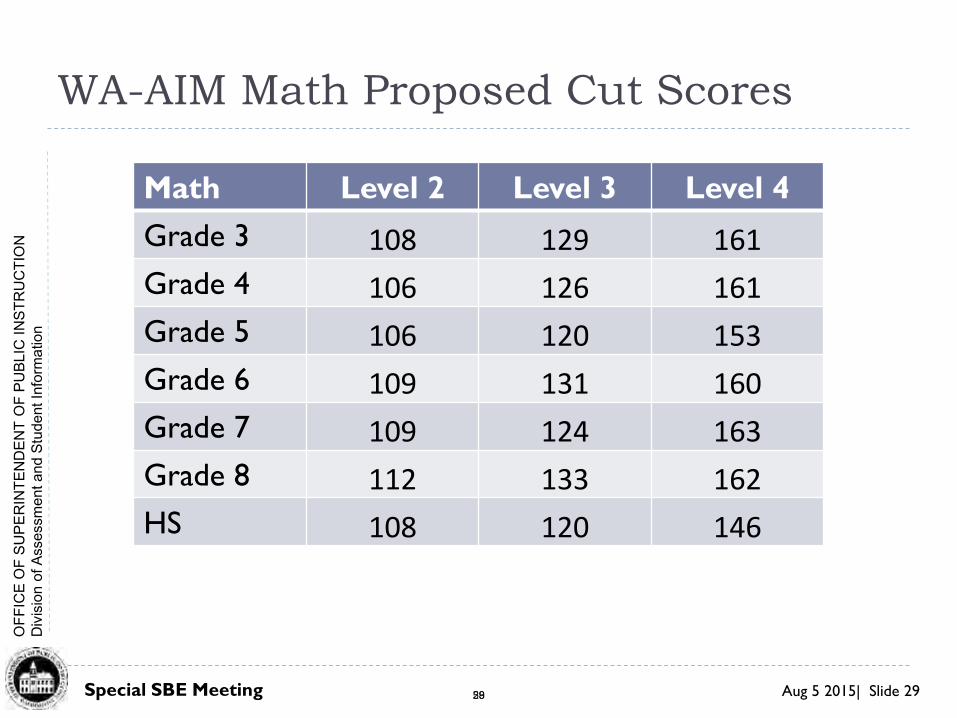
Aug 5 2015| Slide 29
OF
FIC
E O
F S
UP
ER
INT
EN
DE
NT
OF
PU
BL
IC I
NS
TR
UC
TIO
N
Div
isio
n o
f A
sse
ssm
en
t a
nd
Stu
de
nt In
form
atio
n
Special SBE Meeting
WA-AIM Math Proposed Cut Scores
Math Level 2 Level 3 Level 4
Grade 3 108 129 161
Grade 4 106 126 161
Grade 5 106 120 153
Grade 6 109 131 160
Grade 7 109 124 163
Grade 8 112 133 162
HS 108 120 146
2958

Aug 5 2015| Slide 30
OF
FIC
E O
F S
UP
ER
INT
EN
DE
NT
OF
PU
BL
IC I
NS
TR
UC
TIO
N
Div
isio
n o
f A
sse
ssm
en
t a
nd
Stu
de
nt In
form
atio
n
Special SBE Meeting
WA-AIM Math Cut Scores - Impact
Math L1 L2 L3 L4 L3 & Above
Grade 3 12.6% 42.3% 25.7% 19.4% 45.1%
Grade 4 8.4% 40.7% 31.1% 19.7% 50.8%
Grade 5 8.3% 40.9% 32.5% 18.3% 50.8%
Grade 6 21.0% 40.9% 22.1% 16.0% 38.2%
Grade 7 35.9% 34.6% 23.2% 6.3% 29.4%
Grade 8 34.2% 40.9% 21.3% 3.6% 24.9%
HS 38.2% 36.1% 18.1% 7.6% 25.7%
Proficiency
3059

Aug 5 2015| Slide 31
OF
FIC
E O
F S
UP
ER
INT
EN
DE
NT
OF
PU
BL
IC I
NS
TR
UC
TIO
N
Div
isio
n o
f A
sse
ssm
en
t a
nd
Stu
de
nt In
form
atio
n
Special SBE Meeting
WA-AIM Science Proposed Cut Scores
Science Level 2 Level 3 Level 4
Grade 5 110 127 166
Grade 8 107 128 158
HS Note 1
Note 1: HS Science not administered due to accountability testing completed the previous school year
3160

Aug 5 2015| Slide 32
OF
FIC
E O
F S
UP
ER
INT
EN
DE
NT
OF
PU
BL
IC I
NS
TR
UC
TIO
N
Div
isio
n o
f A
sse
ssm
en
t a
nd
Stu
de
nt In
form
atio
n
Special SBE Meeting
WA-AIM Science Cut Scores - Impact
Level
1
Level
2 Level 3 Level 4
Level 3
and Above
Grade 5 26.8% 40.2% 30.0% 3.0% 33.0%
Grade 8 20.4% 48.1% 26.5% 5.0% 31.5%
Proficiency
3261

Aug 5 2015| Slide 33
OF
FIC
E O
F S
UP
ER
INT
EN
DE
NT
OF
PU
BL
IC I
NS
TR
UC
TIO
N
Div
isio
n o
f A
sse
ssm
en
t a
nd
Stu
de
nt In
form
atio
n
Special SBE Meeting
Evaluation
At several points in the process, we asked participants to
evaluate the standard setting procedures.
Participants reported the standards setting methodology allowed for an authentic connection with student work.
General educators reported the process was exceptionally informative as they have limited experience with the portfolio assessment.
Across the board, participants reported that the dialogue in their respective panels was student centered, professional, and productive.
The articulation committee was pleased at how close the cut scores for each content area were across grade level.
3362

Aug 5 2015| Slide 34
OF
FIC
E O
F S
UP
ER
INT
EN
DE
NT
OF
PU
BL
IC I
NS
TR
UC
TIO
N
Div
isio
n o
f A
sse
ssm
en
t a
nd
Stu
de
nt In
form
atio
n
Special SBE Meeting
WA-AIM Proposed Exit Exam Cut
Scores and Impact
ELA Target
Rate
Cut
Score
Grade 11 –
using 3 yr avg
83.8%
(16.2%)
104Level 1
WA-AIMHigh School Cut Scores
Level 2 Level 3 Level 4
ELA 109 123 151
Math 108 120 146
Math Target
Rate
Cut
Score
Grade 11 –
using 3 yr avg
86.6%
(13.4%)
103Level 1
3463

Aug 5 2015| Slide 35
OF
FIC
E O
F S
UP
ER
INT
EN
DE
NT
OF
PU
BL
IC I
NS
TR
UC
TIO
N
Div
isio
n o
f A
sse
ssm
en
t a
nd
Stu
de
nt In
form
atio
n
Special SBE Meeting
Questions & Discussion
3564

Math End of Course Tests,
Year 1 and Year 2 Math
3665
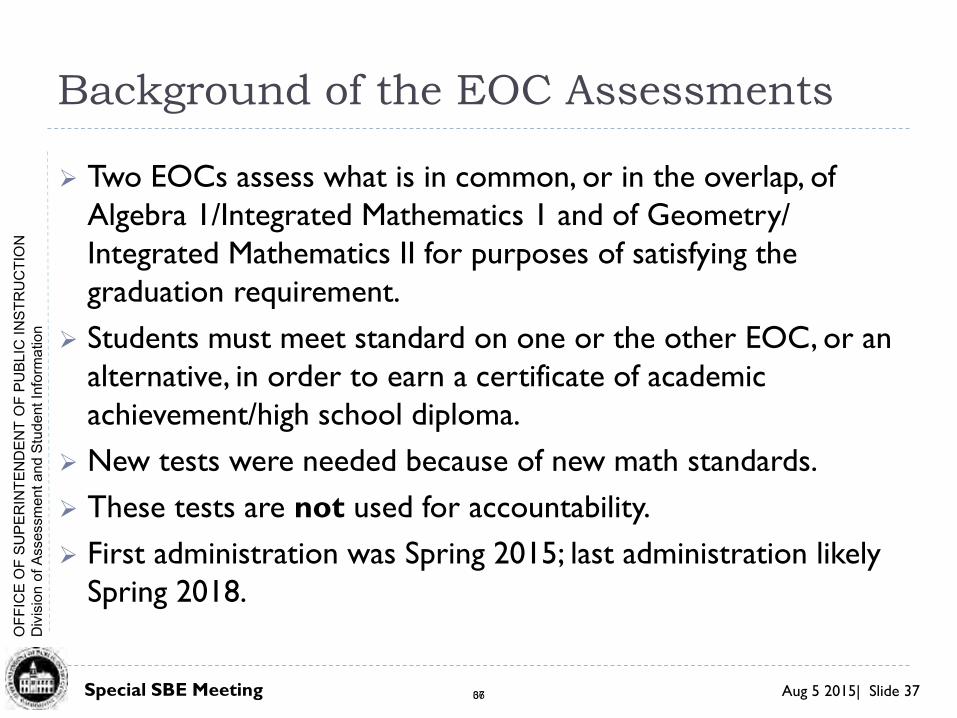
Aug 5 2015| Slide 37
OF
FIC
E O
F S
UP
ER
INT
EN
DE
NT
OF
PU
BL
IC I
NS
TR
UC
TIO
N
Div
isio
n o
f A
sse
ssm
en
t a
nd
Stu
de
nt In
form
atio
n
Special SBE Meeting
Background of the EOC Assessments
Two EOCs assess what is in common, or in the overlap, of
Algebra 1/Integrated Mathematics 1 and of Geometry/
Integrated Mathematics II for purposes of satisfying the
graduation requirement.
Students must meet standard on one or the other EOC, or an
alternative, in order to earn a certificate of academic
achievement/high school diploma.
New tests were needed because of new math standards.
These tests are not used for accountability.
First administration was Spring 2015; last administration likely
Spring 2018.
3766

Aug 5 2015| Slide 38
OF
FIC
E O
F S
UP
ER
INT
EN
DE
NT
OF
PU
BL
IC I
NS
TR
UC
TIO
N
Div
isio
n o
f A
sse
ssm
en
t a
nd
Stu
de
nt In
form
atio
n
Special SBE Meeting
Assessment Development Process
Date Event
2011 New math standards adopted
April 2014 Test map meeting
Summer 2014 Item writing - Pilot Items EOC 2
Nov 2014 SBE decision to have “equal impact”
Feb 2015 Test build
May/June 2015 EOC Exit Exams
July 2015 EOC data determinations
July 2015 ALD review meeting
August 2015 SBE approves “equal impact” determination
3867

Aug 5 2015| Slide 39
OF
FIC
E O
F S
UP
ER
INT
EN
DE
NT
OF
PU
BL
IC I
NS
TR
UC
TIO
N
Div
isio
n o
f A
sse
ssm
en
t a
nd
Stu
de
nt In
form
atio
n
Special SBE Meeting
Determination of the EOC Cut Scores
Equal impact cut scores would yield comparable “passing”
rates on the new tests as the former tests.
The target impact percentage will be equal to the average
of the last three years.
Algebra/Integrated 1
2012-14
Level Percent Met
1 23
2 20
3 30
4 27
Geometry/Integrated 1
2012-14
Level Percent Met
1 12
2 19
3 32
4 3757% 69%
3968

Aug 5 2015| Slide 40
OF
FIC
E O
F S
UP
ER
INT
EN
DE
NT
OF
PU
BL
IC I
NS
TR
UC
TIO
N
Div
isio
n o
f A
sse
ssm
en
t a
nd
Stu
de
nt In
form
atio
n
Special SBE Meeting
Proposed EOC Cut Scores
Math Year 1 Math Year 2
Score ScoreLevel 2
Level 3
Level 4
Meeting Exit Exam L3&L4 57% 69%
4069

Aug 5 2015| Slide 41
OF
FIC
E O
F S
UP
ER
INT
EN
DE
NT
OF
PU
BL
IC I
NS
TR
UC
TIO
N
Div
isio
n o
f A
sse
ssm
en
t a
nd
Stu
de
nt In
form
atio
n
Special SBE Meeting
Questions & Discussion
4170
Smarter Balanced
English Language Arts Test
4271

Aug 5 2015| Slide 43
OF
FIC
E O
F S
UP
ER
INT
EN
DE
NT
OF
PU
BL
IC I
NS
TR
UC
TIO
N
Div
isio
n o
f A
sse
ssm
en
t a
nd
Stu
de
nt In
form
atio
n
Special SBE Meeting
ELA College and Career Ready
Proficiency Rates
Proficiency Rate Participation
HS – Sneak peek 62% NA
HS - Updated 64% NA
Grade 10 71% 90-95%
Grade 11 51% ~50%
4372

Aug 5 2015| Slide 44
OF
FIC
E O
F S
UP
ER
INT
EN
DE
NT
OF
PU
BL
IC I
NS
TR
UC
TIO
N
Div
isio
n o
f A
sse
ssm
en
t a
nd
Stu
de
nt In
form
atio
n
Special SBE Meeting
ELA Performance Levels
Performance LevelCollege Career Ready
Total1 2 3 4 Yes
Grade 10Count 6252 12556 25182 21474 46656 65464
% of Assessed 9.6% 19.2% 38.5% 32.8% 71.3% 100.0%
Grade 11Count 8989 9763 12042 7319 19361 38113
% of Assessed 23.6% 25.6% 31.6% 19.2% 50.8% 100.0%
TotalCount 15241 22319 37224 28793 66017 103577
% of Assessed 14.7% 21.5% 35.9% 27.8% 63.7% 100.0%
4473

Aug 5 2015| Slide 45
OF
FIC
E O
F S
UP
ER
INT
EN
DE
NT
OF
PU
BL
IC I
NS
TR
UC
TIO
N
Div
isio
n o
f A
sse
ssm
en
t a
nd
Stu
de
nt In
form
atio
n
Special SBE Meeting
Who do we have in our data?
ELA Math
11th graders enrolled in 2014 – 2015 81,225 81,225
11th graders who took
Smarter Balanced
38,113 35,248
11th graders who took Smarter
Balanced and have prior scores
33,567 31,957
10th graders enrolled in 2014 - 2015 81,934 81,934
10th graders who took
Smarter Balanced
65,464 NA
4574

Aug 5 2015| Slide 46
OF
FIC
E O
F S
UP
ER
INT
EN
DE
NT
OF
PU
BL
IC I
NS
TR
UC
TIO
N
Div
isio
n o
f A
sse
ssm
en
t a
nd
Stu
de
nt In
form
atio
n
Special SBE Meeting
Comparability of 2015 Testers to All
Race
TotalAmerican
Indian Asian Black HispanicMore Than One Race
Pacific Islander unknown White
Grade 11 AllCurrent Class of 2016
Count 1258 5950 3674 14908 4804 698 13 49950 81255% within Group 1.5% 7.3% 4.5% 18.3% 5.9% .9% .0% 61.5% 100.0%
Grade 11 Matched Cohort - ELA Count 587 2131 1401 7089 1842 310 0 20207 33567% within Group 1.7% 6.3% 4.2% 21.1% 5.5% .9% 0.0% 60.2% 100.0%
Grade 11 Matched Cohort - Math Count 541 2013 1274 6981 1769 286 0 19093 31957% within Group 1.7% 6.3% 4.0% 21.8% 5.5% .9% 0.0% 59.7% 100.0%
Grade 10 - 3 Yr Avg Count 1070 5612 3190 12502 3978 575 215 44479 71621% within Group 1.5% 7.8% 4.5% 17.5% 5.6% .8% .3% 62.1% 100.0%
Grade 10 – Smarter Balanced ELA testers
Count 904 4520 2694 12317 3971 516 1887 38655 65464% within Group 1.4% 6.9% 4.1% 18.8% 6.1% .8% 2.9% 59.0% 100.0%
4675

Aug 5 2015| Slide 47
OF
FIC
E O
F S
UP
ER
INT
EN
DE
NT
OF
PU
BL
IC I
NS
TR
UC
TIO
N
Div
isio
n o
f A
sse
ssm
en
t a
nd
Stu
de
nt In
form
atio
n
Special SBE Meeting
Comparability of 2015 Testers to All
Special Ed ELLLow
Income TotalGrade 11 AllCurrent Class of 2016
Count 8300 2767 32069 81255% within Group 10.2% 3.4% 39.5% 100.0%
Grade 11 Matched Cohort - ELA Count 3084 1241 14685 33567% within Group 9.2% 3.7% 43.7% 100.0%
Grade 11 Matched Cohort - Math Count 2754 1258 14102 31957% within Group 8.6% 3.9% 44.1% 100.0%
10th Grade - 3 Yr Avg Count 6596 2651 28182 71621% within Group 9.2% 3.7% 39.3% 100.0%
Grade 10 – Smarter Balanced ELA testers
Count 4852 2532 26178 65464% within Group 7.4% 3.9% 40.0% 100.0%
4776
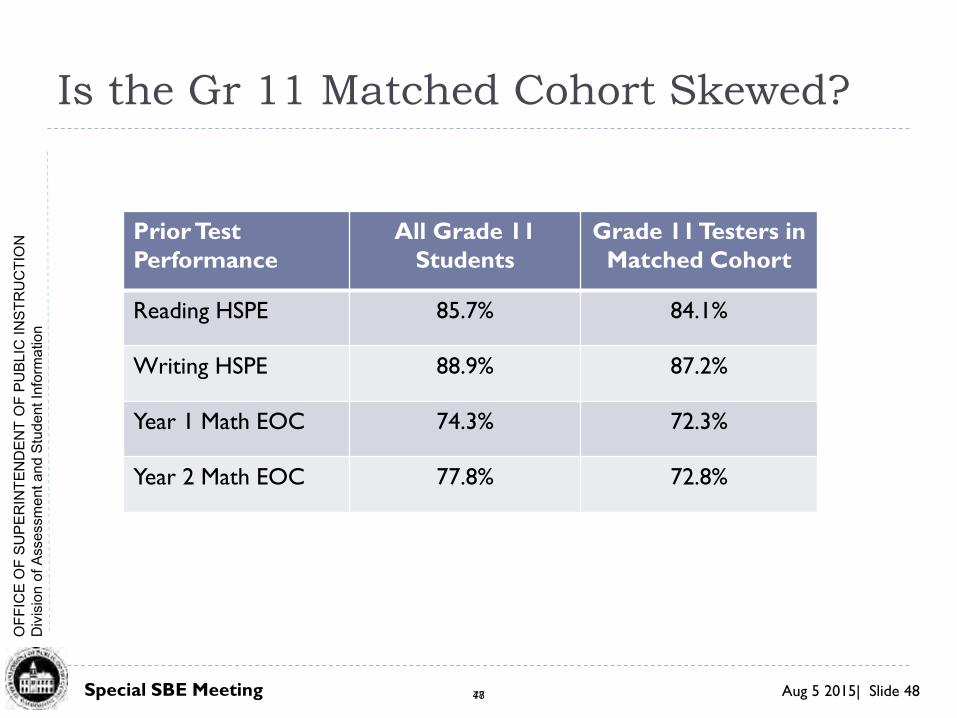
Aug 5 2015| Slide 48
OF
FIC
E O
F S
UP
ER
INT
EN
DE
NT
OF
PU
BL
IC I
NS
TR
UC
TIO
N
Div
isio
n o
f A
sse
ssm
en
t a
nd
Stu
de
nt In
form
atio
n
Special SBE Meeting
Is the Gr 11 Matched Cohort Skewed?
Prior Test
Performance
All Grade 11
Students
Grade 11 Testers in
Matched Cohort
Reading HSPE 85.7% 84.1%
Writing HSPE 88.9% 87.2%
Year 1 Math EOC 74.3% 72.3%
Year 2 Math EOC 77.8% 72.8%
4877

Aug 5 2015| Slide 49
OF
FIC
E O
F S
UP
ER
INT
EN
DE
NT
OF
PU
BL
IC I
NS
TR
UC
TIO
N
Div
isio
n o
f A
sse
ssm
en
t a
nd
Stu
de
nt In
form
atio
n
Special SBE Meeting
ELA Exit Exam Options and Impact
Target
Rate
Cut
Score
Grade 11
Matched
Grade 11
All
Grade 10
All
Grade 11 –
using matched
cohort
79.0%
(21.0%)
2487Level 1
79% 77.6% 91.1%
Smarter Balanced ELA Level 1 Level 2 Level 3 Level 4
High school Score Ranges 2299-2492 2493-2582 2583-2681 2682-2795
4978

Aug 5 2015| Slide 50
OF
FIC
E O
F S
UP
ER
INT
EN
DE
NT
OF
PU
BL
IC I
NS
TR
UC
TIO
N
Div
isio
n o
f A
sse
ssm
en
t a
nd
Stu
de
nt In
form
atio
n
Special SBE Meeting
ELA Exit Exam Options and Impact
Target
Rate
Cut
Score
Grade 11
Matched
Grade 11
All
Grade 10
All
Grade 11 –
using matched
cohort
79.0%
(21.0%)
2487Level 1
79% 77.6% 91.1%
Grade 10 –
using 3 year avg
80.1%
(19.9%)
2548Level 2
NA 61.2% 80.1%
Smarter Balanced ELA Level 1 Level 2 Level 3 Level 4
High school Score Ranges 2299-2492 2493-2582 2583-2681 2682-2795
5079

Aug 5 2015| Slide 51
OF
FIC
E O
F S
UP
ER
INT
EN
DE
NT
OF
PU
BL
IC I
NS
TR
UC
TIO
N
Div
isio
n o
f A
sse
ssm
en
t a
nd
Stu
de
nt In
form
atio
n
Special SBE Meeting
ELA Exit Exam Options and Impact
Target
Rate
Cut
Score
Grade 11
Matched
Grade 11
All
Grade 10
All
Grade 11 –
using matched
cohort
79.0%
(21.0%)
2487Level 1
79% 77.6% 91.1%
Grade 10 –
using 3 year avg
80.1%
19.9%
2548Level 2
NA 61.2% 80.1%
Level 2 CCR NA 2493Level 2
NA 76.2% 90.3%
Level 3 CCR NA 2583Level 3
NA 50.6% 71%
Smarter Balanced ELA Level 1 Level 2 Level 3 Level 4
High school Score Ranges 2299-2492 2493-2582 2583-2681 2682-2795
5180

Aug 5 2015| Slide 52
OF
FIC
E O
F S
UP
ER
INT
EN
DE
NT
OF
PU
BL
IC I
NS
TR
UC
TIO
N
Div
isio
n o
f A
sse
ssm
en
t a
nd
Stu
de
nt In
form
atio
n
Special SBE Meeting
Math Performance Levels
Math
Performance Level
College Career Ready
Total1 2 3 4 Yes
Grade 11Count 16,057 8,748 6,473 3,666 10,139 34,944
% of Assessed 46% 25% 18.5% 10.5% 29% 100%
5281

Aug 5 2015| Slide 53
OF
FIC
E O
F S
UP
ER
INT
EN
DE
NT
OF
PU
BL
IC I
NS
TR
UC
TIO
N
Div
isio
n o
f A
sse
ssm
en
t a
nd
Stu
de
nt In
form
atio
n
Special SBE Meeting
Math Exit Exam Options and Impact
Target
Rate
Cut
Score
Grade 11
Matched
Grade 11
All
Grade 10
All
Grade 11 –
using matched cohort
75.6%
(24.4%)
2469Level 1
75.6% 74.5% NA
Smarter Balanced Math Level 1 Level 2 Level 3 Level 4
High school Score Ranges 2280-2542 2543-2627 2628-2717 2718-2862
5382

Aug 5 2015| Slide 54
OF
FIC
E O
F S
UP
ER
INT
EN
DE
NT
OF
PU
BL
IC I
NS
TR
UC
TIO
N
Div
isio
n o
f A
sse
ssm
en
t a
nd
Stu
de
nt In
form
atio
n
Special SBE Meeting
Math Exit Exam Options and Impact
Target
Rate
Cut
Score
Grade 11
Matched
Grade 11
All
Grade 10
All
Grade 11 –
using matched cohort
75.6%
(24.4%)
2469Level 1
75.6% 74.5% NA
Between 2 and 3,
equivalent to ELA
2595Level 2
38.9% 37.8% NA
Smarter Balanced Math Level 1 Level 2 Level 3 Level 4
High school Score Ranges 2280-2542 2543-2627 2628-2717 2718-2862
5483

Aug 5 2015| Slide 55
OF
FIC
E O
F S
UP
ER
INT
EN
DE
NT
OF
PU
BL
IC I
NS
TR
UC
TIO
N
Div
isio
n o
f A
sse
ssm
en
t a
nd
Stu
de
nt In
form
atio
n
Special SBE Meeting
Math Exit Exam Options and Impact
Target
Rate
Cut
Score
Grade 11
Matched
Grade 11
All
Grade 10
All
Grade 11 –
using matched cohort
75.6%
(24.4%)
2469Level 1
75.6% 74.5% NA
Between 2 and 3,
equivalent to ELA
2595Level 2
38.9% 37.8% NA
Level 2 CCR NA 2543Level 2
54.8% 53.6% NA
Level 3 CCR NA 2628Level 3
29.5% 28.6% NA
Smarter Balanced Math Level 1 Level 2 Level 3 Level 4
High school Score Ranges 2280-2542 2543-2627 2628-2717 2718-2862
5584

Aug 5 2015| Slide 56
OF
FIC
E O
F S
UP
ER
INT
EN
DE
NT
OF
PU
BL
IC I
NS
TR
UC
TIO
N
Div
isio
n o
f A
sse
ssm
en
t a
nd
Stu
de
nt In
form
atio
n
Special SBE Meeting
Feedback from Secondary Students
There were over 2500 responses for grades 6-high
school.
Almost 55% of respondents preferred online to paper/pencil.
In general, the online tools were the most favorite feature of
taking the test online.
Many comments were not repeatable or are inappropriate for
distribution.
5685

Aug 5 2015| Slide 57
OF
FIC
E O
F S
UP
ER
INT
EN
DE
NT
OF
PU
BL
IC I
NS
TR
UC
TIO
N
Div
isio
n o
f A
sse
ssm
en
t a
nd
Stu
de
nt In
form
atio
n
Special SBE Meeting
Feedback from Secondary Students,
cont’.
Check the features of the test that you liked.
Online tools 57.6%
Keyboarding/typing 55.4%
Questions 27.7%
Passages/texts 21.8%
Navigating 17.9%
Other (Calculator, Being able to mark
and go back, MC Questions, Pausing,
Zoom, Highlighter, Online Thesaurus and
Dictionary, Spell Check, Split Screen)
20.7%
5786

Aug 5 2015| Slide 58
OF
FIC
E O
F S
UP
ER
INT
EN
DE
NT
OF
PU
BL
IC I
NS
TR
UC
TIO
N
Div
isio
n o
f A
sse
ssm
en
t a
nd
Stu
de
nt In
form
atio
n
Special SBE Meeting
Feedback from Secondary Students,
cont’.
Which types of questions did you NOT like?
Long written responses 82.1%
Problems with more than one
answer
55.6%
Graphs 52.0%
Drag and Drop 40.9%
Short written responses 37.6%
Multiple choice 10.6%
5887

Aug 5 2015| Slide 59
OF
FIC
E O
F S
UP
ER
INT
EN
DE
NT
OF
PU
BL
IC I
NS
TR
UC
TIO
N
Div
isio
n o
f A
sse
ssm
en
t a
nd
Stu
de
nt In
form
atio
n
Special SBE Meeting
Feedback from Secondary Students,
cont’.
How did this test compare to what you expected?
It was like I expected 24.8%
It was easier than I expected 19.3%
It was harder than I expected 25.1%
I did not know what to expect 30.8%
5988
Aug 5 2015| Slide 60
OF
FIC
E O
F S
UP
ER
INT
EN
DE
NT
OF
PU
BL
IC I
NS
TR
UC
TIO
N
Div
isio
n o
f A
sse
ssm
en
t a
nd
Stu
de
nt In
form
atio
n
Special SBE Meeting
Questions & Discussion
6089
Aug 5 2015| Slide 61
OF
FIC
E O
F S
UP
ER
INT
EN
DE
NT
OF
PU
BL
IC I
NS
TR
UC
TIO
N
Div
isio
n o
f A
sse
ssm
en
t a
nd
Stu
de
nt In
form
atio
n
Special SBE Meeting
Thank you!
6190

Aug 5 2015| Slide 62
OF
FIC
E O
F S
UP
ER
INT
EN
DE
NT
OF
PU
BL
IC I
NS
TR
UC
TIO
N
Div
isio
n o
f A
sse
ssm
en
t a
nd
Stu
de
nt In
form
atio
n
Special SBE Meeting
Subgroup Impact of ELA Cut Scores
% meeting
exit exam
standard
Race
American Indian Asian Black Hispanic
More Than One Race
Pacific Islander White
Un-known
Grade 11 – based on matched cohort cut 67.3% 83.6% 63.6% 70.6% 77.7% 60.5% 81.9% 72.1%
Grade 11 – based on Gr 10 3 year avg 45.6% 71.2% 44.4% 48.8% 62.5% 39.2% 67.6% 54.2%
Grade 11 – based on CCR Level 3 cut 33.6% 60.9% 33.4% 36.4% 52.2% 30.0% 57.5% 42.1%
Grade 10 – based on matched cohort cut 78.4% 94.9% 82.9% 85.5% 91.9% 82.8% 94.0% 82.4%
Grade 10 – based on Gr 10 3 year avg cut 60.5% 88.9% 66.4% 68.1% 81.9% 63.2% 85.4% 66.9%
Grade 10 – based on CCR Level 3 cut 48.5% 82.4% 53.3% 55.5% 73.4% 49.0% 77.6% 57.0%
Historical comparison 62.6% 86.8% 65.0% 68.0% 82.4% 60.5% 84.7% 75.7%
6291

Aug 5 2015| Slide 63
OF
FIC
E O
F S
UP
ER
INT
EN
DE
NT
OF
PU
BL
IC I
NS
TR
UC
TIO
N
Div
isio
n o
f A
sse
ssm
en
t a
nd
Stu
de
nt In
form
atio
n
Special SBE Meeting
Subgroup Impact of ELA Cut Scores
% meeting
exit exam standard
Sub-group
Special Educ ELLLow
IncomeGrade 11 – based on matched cohort cut 45.8% 39.2% 70.0%
Grade 11 – based on Gr 10 3 year avg cut 23.3% 15.6% 50.9%
Grade 11 – based on CCR Level 3 cut 14.3% 7.0% 38.8%
Grade 10 – based on matched cohort cut 61.4% 55.4% 85.4%
Grade 10 – based on Gr 10 3 year avg cut 36.0% 27.3% 69.5%
Grade 10 – based on CCR Level 3 cut 24.4% 25.0% 57.6%
Historical comparison 27.7% 20.3% 68.1%
6392

Aug 5 2015| Slide 64
OF
FIC
E O
F S
UP
ER
INT
EN
DE
NT
OF
PU
BL
IC I
NS
TR
UC
TIO
N
Div
isio
n o
f A
sse
ssm
en
t a
nd
Stu
de
nt In
form
atio
n
Special SBE Meeting
Subgroup Impact of Math Cut Scores
% meeting
exit exam standard
Race
American Indian Asian Black Hispanic
More Than One Race
Pacific Islander White
Un-known
Grade 11 – based on matched cohort cut 63.9% 86.5% 59.5% 66.8% 73.7% 58.9% 78.8% 66.5%
Grade 11 – based on CCR Level 3 cut 13.8% 50.5% 13.7% 15.0% 29.7% 13.0% 34.1% 21.8%
Historical comparison 51.5% 85.3% 53.0% 58.7% 72.5% 53.6% 77.1% 40.0%
6493

Aug 5 2015| Slide 65
OF
FIC
E O
F S
UP
ER
INT
EN
DE
NT
OF
PU
BL
IC I
NS
TR
UC
TIO
N
Div
isio
n o
f A
sse
ssm
en
t a
nd
Stu
de
nt In
form
atio
n
Special SBE Meeting
Subgroup Impact of Math Cut Scores
% meeting
exit exam standard
Sub-group
Special Educ ELLLow
IncomeGrade 11 – based on matched cohort cut 34.1% 45.9% 67.2%
Grade 11 – based on CCR Level 3 cut 3.9% 6.7% 17.3%
Historical comparison 21.8% 26.3% 60.6%
6594
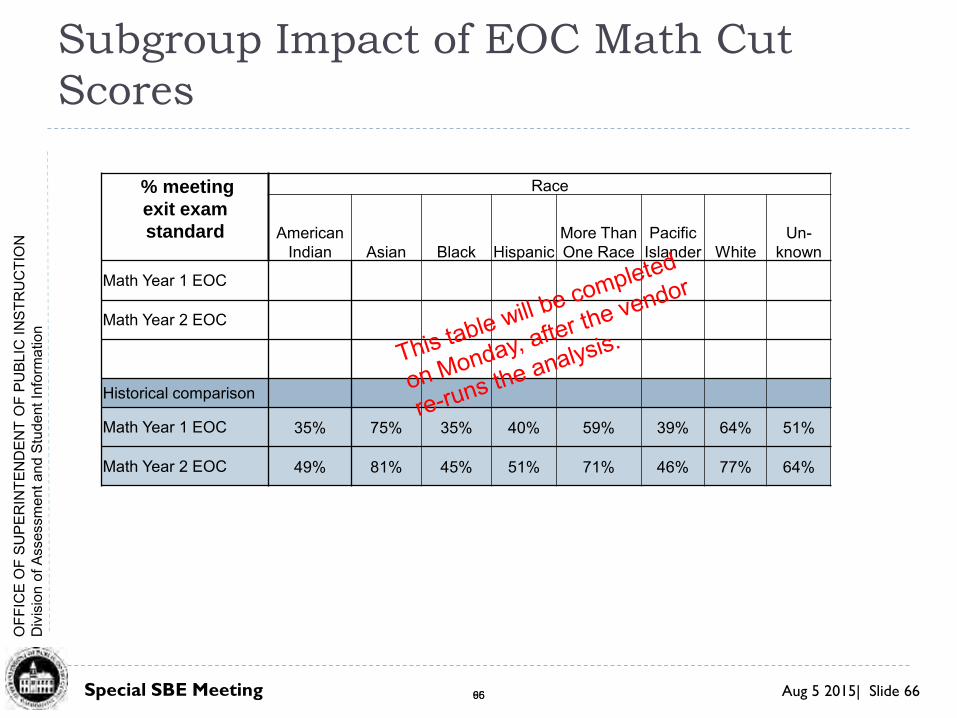
Aug 5 2015| Slide 66
OF
FIC
E O
F S
UP
ER
INT
EN
DE
NT
OF
PU
BL
IC I
NS
TR
UC
TIO
N
Div
isio
n o
f A
sse
ssm
en
t a
nd
Stu
de
nt In
form
atio
n
Special SBE Meeting
Subgroup Impact of EOC Math Cut
Scores
% meeting
exit exam
standard
Race
American Indian Asian Black Hispanic
More Than One Race
Pacific Islander White
Un-known
Math Year 1 EOC
Math Year 2 EOC
Historical comparison
Math Year 1 EOC 35% 75% 35% 40% 59% 39% 64% 51%
Math Year 2 EOC 49% 81% 45% 51% 71% 46% 77% 64%
6695

Aug 5 2015| Slide 67
OF
FIC
E O
F S
UP
ER
INT
EN
DE
NT
OF
PU
BL
IC I
NS
TR
UC
TIO
N
Div
isio
n o
f A
sse
ssm
en
t a
nd
Stu
de
nt In
form
atio
n
Special SBE Meeting
Subgroup Impact of EOC Math Cut
Scores
% meeting
exit exam standard
Sub-group
Special Educ ELLLow
Income
Math Year 1 EOC
Math Year 2 EOC
Historical comparison
Math Year 1 EOC 16% 24% 43%
Math Year 2 EOC 35% 33% 56%
6796