robert maillart's key methods from the salginatobel design
TRANSCRIPT

JOURNAL OF THE INTERNATIONAL ASSOCIATION FOR SHELL AND SPATIAL STRUCTURES: J. IASS
ROBERT MAILLART’S KEY METHODS FROM THE SALGINATOBEL BRIDGE DESIGN PROCESS (1928)
CORENTIN FIVET1 and DENIS ZASTAVNI2 1Arch.-Eng. PhD Student, LOCI Faculty of Architecture, Architectural Engineering and Urbanism, UCLouvain, Belgium;
[email protected] 2PhD Arch.-Eng. Assistant Prof., LOCI Faculty of Architecture, Architectural Engineering and Urbanism, UCLouvain,
Belgium; [email protected]
Editor’s Note: Manuscript received 7 March 2011; revision received 14 September 2011; accepted 25 October. This paper is open for written discussion, which should be submitted to the IASS Secretariat no later than September 2012. ABSTRACT
This paper sheds light on some of the graphical methods used by Robert Maillart to design the Salginatobel Bridge, a three-hinged concrete structure spanning 90 meters. Built in 1929, this masterpiece has since received extensive recognition both for its structural elegance and its efficiency. However investigations into the design process enabling this degree of perfection remain incomplete. Studying Maillart’s original working drawings, this paper reviews the earliest stages chronology of the Salginatobel Bridge design process. It focuses on three methods: the use of graphically controlled parabolas, the minimization of bending moments within the bridge and the geometrical definition of the foundation block. These graphical methods reveal how Maillart simultaneously dealt with geometry and the flow of forces throughout using a straightforward, handy and efficient form-finding process which is still relevant today.
Keywords: design methods, structural definition, graphical methods, graphic statics, Robert Maillart, three-hinged concrete bridge
1. INTRODUCTION
The Salginatobel Bridge is Robert Maillart’s design for a competition held in summer 1928 to link the villages of Schuders and Schiers in the Swiss canton of Graubünden (Figure 1) [1]. Since its completion in 1930, the 90m-span bridge has received considerable praise: while some have celebrated its striking new art form [2][3], others have emphasized its brilliant economical and structural efficiency[4][5]. It does indeed represent a great example of optimal and elegant design which did not have to undergo any repair work in its first 45 years, despite the poor quality of the concrete [6]. There is therefore interest in the design methods employed, especially since Maillart only did handwritten workings and looked for straightforward methods to define the structure.
The aim of this paper is to explore the early steps of the rigorous process leading to the final morphology, as conducted by Maillart. This exploration stems from the study of three working drawings [7] (1:100 scale) that seem to have been drawn by Robert Maillart himself in 1928. They are
referred to here as drawings 1 (Figure 2), 2 and 3. Each of them comprises cross sections, a longitudinal section and a plan that become progressively more precise.Several erased curves were able to be revealed using a color-enhancement filter.
Figure 1. The Salginatobel Bridge (photo D.Zastavni 2010)
These working drawings, as well as another one detailing the foundation block [7], constitute the core of the structural definition and therefore support the first steps of the design process. They clearly differ from the later drawings or calculus devoted to the checking and analysis of sections already defined.
39

Vol. 53 (2012) No. 1 March n. 171
After a brief description of the prior geometrical definition of the bridge, three techniques are explained in the paragraphs below. The first one emphasizes the productive way in which Maillart controlled the lines of the arch graphically. The second one concerns the main structural definition of the bridge: it governs the geometry of the arch and its corresponding weight. The third one details how the features of the foundation block have been adjusted vectorially to guarantee equilibrium.
1.1 Prior definition of the geometry
Starting with a blank page, the very first step of the design process is to define the main morphological features of the bridge according to the initial data which consist of the gorge’s geometry and mechanical behaviour and the expected height of the deck. On the one hand, the Salgina gorge is steep and the sandstone rock walls are crumbly [1]. For that reason, the choice of a three-hinged bridge was made. It allows small movement in the supports without producing any sizeable cracks in the structure. On the other hand, the height of the deck and the slight slope of the gorge on the Schiers side suggested that the deck should be supported by regularly interspersed transversal walls that continue to above the arch. This feature had already been applied by Maillart in stiffened arches from 1924 up to the same year, 1928, in his studies for the reconstruction of his Tavanasa Bridge [3][8].
Another element that he has borrowed from the Tavanasa Bridge is the Système Maillart, better known as a varying section made of either a U-shape (Figure 3b) or a box girder (Figure 3c) constituting the arch. Similarly this earlier bridge served as a reference to fix other primary features, such as the section area at the hinges or the span/sag ratio of the arch rib. Traces of the geometrical construction of a parabola, representing the lower chord of an arch with the same span/sag ratio (96,4m/10,4m) as the earlier 1905 Tavanasa Bridge (51m/5,5m), remain on Maillart’s drawing 1 (Figure 4). But these proportions were quickly abandoned for the less slender ratio of 90m by 13m. This last ratio matches the relief very well, while also coinciding with a regular interval of 6m. This ratio remained constant afterwards.
Figure 2. First working-drawing, Robert Maillart 1928
Figure 3. Early cross sections of the arch before in-depth
definition.
40

JOURNAL OF THE INTERNATIONAL ASSOCIATION FOR SHELL AND SPATIAL STRUCTURES: J. IASS
41
The chosen interval of 6m, which is almost twice as long as those commonly featured in Maillart’s earlier bridges [3], is apparently the choice with the greatest aesthetic influence. It controls the slab sections, the deck width, the number of columns on the arch and also the place where the longitudinal walls merge with the slabs. All other primary thicknesses have initially been rounded to 0,2m (Figure 3).
2. PARABOLAS
Maillart used parabolas throughout the entire design process in order to define any non-straight geometry. Circles and catenaries are almost non-existent in the first three working drawings.
A parabola is a regular curve frequently used for sketching arches to approximate catenary or funicular configurations under distributed loads. However, surprisingly, they are not meant to be used predominantly in that way here, but rather as a
graphical convenience that is accurately reproducible and easy to handle with control points. This feature becomes essential since the geometry will be readjusted many times due to successive refining steps. The specific orientation of most parabolas and traces of their construction attest to their use as a non-structural, but purely graphical tool (Figure 5).
Figure 4. The 1905 Tavanasa Bridge (in red) and the corresponding first (and abandoned) span/sag of the Salginatobel Bridge: the parabola and its construction (in blue). Author’s drawing after working-drawing 1.
Parts of parabolas can be determined through their focus and their directrix (whose distance from a point of the parabola is equal to the distance of that point from the focus), but also by their extreme tangents or their vertex (top point of the parabola) or their chord linking both extreme points etc.
Maillart’s method using a parabola to copy the proportion of the previous Tavanasa Bridge on drawing 1 is shown on Figure 4 (in blue). He employed that same methodlater on to define parabolas from two extremes and one tangent (Figure 5a).
Figure 5. Some parabolas constructed in drawing 1 with their focus and directrix. In red, two control points on the upper
chord and their tangent (a) and another way of constructing the parabola using a vertical axis and compasses (b). After working-drawings 1 and 3.

Vol. 53 (2012) No. 1 March n. 171
3. STRUCTURAL REFINEMENTS AND DEFINITION
Starting from the geometrical constraints synthesized in Figure 3 and Figure 5 Maillart made use of specific techniques in order to guarantee that the concrete remains predominantly compressed everywhere in the arch. The following paragraph describes his method.
The choice of a three-hinged bridge has an influence on the design process: the structure can thereby be statically determined by a simple equilibrium of forces on a half bridge. The remaining design problem of the three-hinged bridge is the adjustment of the geometries in order to reduce bending moments in the arch (Figure 6, Figure 7 and Figure 8). Those bending moments are the effects of the eccentricities left by the thrust line from the line of the centroids in the cross sections. The thrust line is the line of action of the resultant compression force occurring in each cross section – it represents the load path along the arch. The eccentricities are intended to be minimized until they produce as little bending in the arch as possible. If the eccentricities are cancelled, it ensures that the concrete will be equally compressed anywhere in the sections. Considering the compression-only criteria, the volume of concrete would then be optimized.
Because the thrust line mostly depends on the dead weight of this bridge (ranging from 400 to 440 tonnes – Maillart’s preferred unit) and because the line of centroids depends on the bridge’s geometry
which in turn influences the dead weight, the designer has to handle axial forces and geometry in an iterative way while seeking to minimize eccentricities. As usual, Maillart made use of graphic statics methods in order to do so (a comprehensive overview of this technique has been given with the analysis of his Chiasso Shed of 1924 [9]). The thrust line is obtained through the simultaneous construction of two reciprocal diagrams: the space diagram guaranteeing the rotational equilibrium and the force diagram (force polygon) guaranteeing the equilibrium of translation forces. A force in one diagram always has a parallel correspondent in the other diagram (reciprocity).
Four conditionsallowed the designer to use graphic statics in the following way [10]. Firstly, the shape of the structure must favor axial forces, i.e. either compression or tension mainly. Secondly, the transversal section of the arch must be symmetrical. Thirdly, the arch must be articulated in three points, enabling the reaction at the crown and at supports to be positioned precisely. And lastly, the central hinge must be positioned at the crown. All these requirements are fulfilled since Maillart adapted his design methods to the bridge and vice versa.
The iterative process can be segmented into the following stages: the summation of the loads, the construction of the thrust line and the definition of local geometries with readjustment of the global shape of the arch. This process is illustrated below. As far as the three working drawings are concerned, Maillart repeated it four times.
Figure 6. Dead load summation: a) primary geometry of the half bridge and weights of each segment; b) the corresponding
load line. Drawing 1.
42
JOURNAL OF THE INTERNATIONAL ASSOCIATION FOR SHELL AND SPATIAL STRUCTURES: J. IASS
3.1 Summation of loads
The first step consists of cutting half of the symmetrical bridge into segments and graphically adding together the dead loads applied on each segment (2,5tonnes/m³) (Figure 6). The successive weights are represented on the load line by vectors of which the length equals the corresponding magnitude at the given scale (Figure 6b). Maillart divided the arch every three meters and added point loads when discontinuity occurs due to the cross walls and the columns supporting the deck. For greater simplicity, he assumed the line of action of the weight to be at the middle of each segment.
Throughout the design stage, Maillart only considered dead loads. However, he simulated on one occasion (on drawing 2) the load combination of g+p/2, corresponding to the dead load plus half the live load affecting the half bridge (350kg/m²). The bridge optimized in accordance with such a loading will not produce any bending moments under half of the live load and will produce a minimized bending moment when under a full live load or no live load. This represents the most economical solution, but apparently it was not followed by Maillart for two reasons [10]. The first is a combination of the fact that the bridge serves a small mountain village (and will not be loaded most of the time) and that the long-term creep behavior had not really been mastered at that time and so was to be avoided. The second reason is due to the fact that the thrust line under g is almost similar to the one under g+p/2, the angular shifts being almost non-existent.
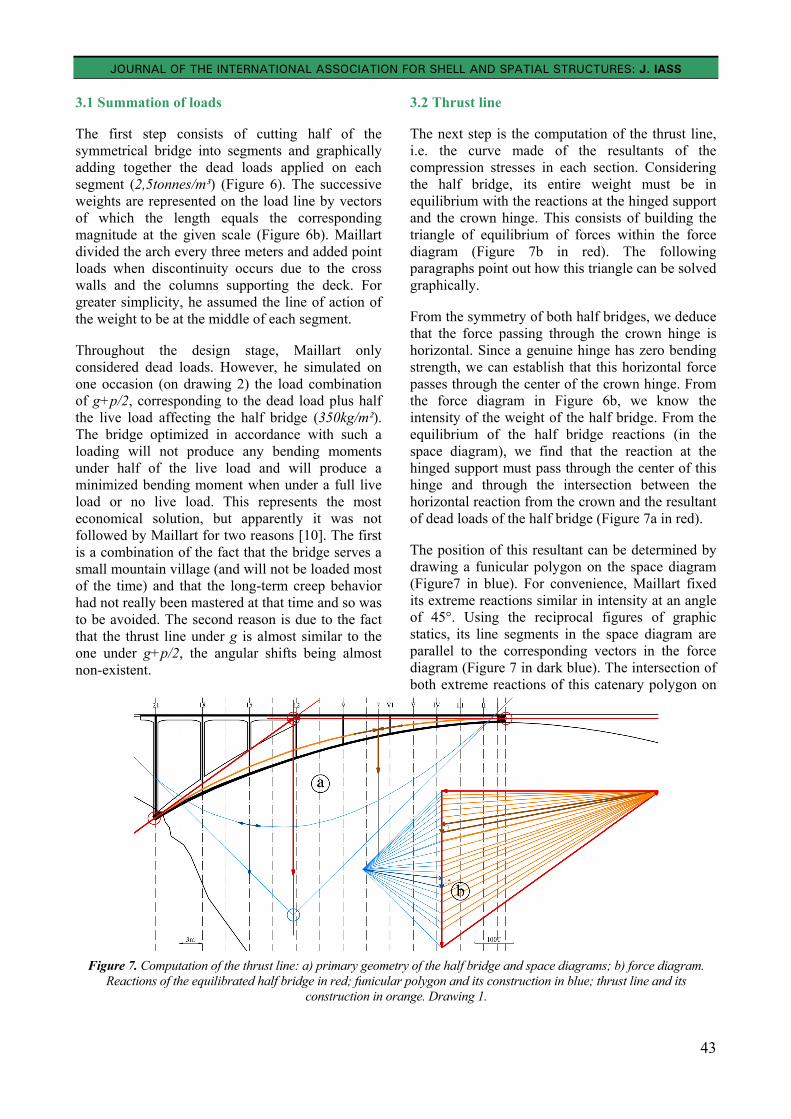
3.2 Thrust line
The next step is the computation of the thrust line, i.e. the curve made of the resultants of the compression stresses in each section. Considering the half bridge, its entire weight must be in equilibrium with the reactions at the hinged support and the crown hinge. This consists of building the triangle of equilibrium of forces within the force diagram (Figure 7b in red). The following paragraphs point out how this triangle can be solved graphically.
From the symmetry of both half bridges, we deduce that the force passing through the crown hinge is horizontal. Since a genuine hinge has zero bending strength, we can establish that this horizontal force passes through the center of the crown hinge. From the force diagram in Figure 6b, we know the intensity of the weight of the half bridge. From the equilibrium of the half bridge reactions (in the space diagram), we find that the reaction at the hinged support must pass through the center of this hinge and through the intersection between the horizontal reaction from the crown and the resultant of dead loads of the half bridge (Figure 7a in red).
The position of this resultant can be determined by drawing a funicular polygon on the space diagram (Figure7 in blue). For convenience, Maillart fixed its extreme reactions similar in intensity at an angle of 45°. Using the reciprocal figures of graphic statics, its line segments in the space diagram are parallel to the corresponding vectors in the force diagram (Figure 7 in dark blue). The intersection of both extreme reactions of this catenary polygon on
Figure 7. Computation of the thrust line: a) primary geometry of the half bridge and space diagrams; b) force diagram.
Reactions of the equilibrated half bridge in red; funicular polygon and its construction in blue; thrust line and its construction in orange. Drawing 1.
43

Vol. 53 (2012) No. 1 March n. 171
the space diagram defines the point through which the resultant of dead loads must pass, since those three forces are in equilibrium (Figure 7a in blue).
The orientation of the reaction force through the support hinge, identified on the space diagram (Figure 7a in red), and the corresponding vectors of both reactions (at the crown and at the support) on the force diagram (Figure 7b in red) define their intensity and enable stresses in the successive sections to be checked (Figure 7b in orange).
The thrust line in the arch (Figure 7a in orange) is then obtained by parallels to corresponding vectors in the force diagram (Figure 7 in brown).
3.3 Geometrical readjustments
Now that the thrust line is defined, its position is compared to that of the centroids in the successive cross sections (Figure 8). These eccentricities give the value of bending moments directly by multiplying them by the force along the thrust line (Figure 7b in orange). Depending on the result, the geometry can be readjusted in order to reposition centroids, or at least stresses can be checked in the sections.
Thanks to the adaptable geometry of the U-shape box (Figure 3b), the eccentricities can theoretically be eradicated completely from sections 21 to 12. The designer can influence the position of the centroids of each of those sections because the height of the arch and the thickness of the longitudinal walls and bottom slab can be adjusted significantly.
But this eccentricity can less easily be minimized from sections 6 to 12. Some freedom is given by the thickness of the walls, the deck, the arch rib and the total height, but practically the thicknesses of both the deck and the arch rib are almost constant and the centroids of the remaining walls are always at their middle (Figure 3c). So some eccentricities systematically remain. The maximum recorded eccentricity is close to 1,6m and occurs on section 12, which is hopefully the highest one. It corresponds under dead load to a compression stress of only 3,7N/mm² at the bottom of the arch rib and a tension stress smaller than 0,2N/mm² in the deck.
A comment can be made about the role of the concrete parapet. While its weight is always included in the load summation of each segment, it is not considered in any computation of the centroids. Since the arch is able to resist considerable bending moments, Maillart had no reason to consider stiffening using a concrete parapet and would use a metal parapet, as he did for other three-hinged bridges. However, he would have introduced a concrete one from the outset for the visual perception of safety.
Geometrical readjustments were the most time-consuming step. Each of the four iterations was followed by a total redefinition of the geometry until it agreed with the designer, who would then construct the next diagrams. For example, the first thrust line conducted to one new lower-chord of the arch rib and four successive upper chords of the longitudinal walls (Figure 9). All these parabolas
Figure 8. Line of centroids in red, thrust line in orange, eccentricities in red hatching. Drawing 1.
44

JOURNAL OF THE INTERNATIONAL ASSOCIATION FOR SHELL AND SPATIAL STRUCTURES: J. IASS
offer a good synthesis of Maillart’s persistence in exploring the most appropriate geometry regarding the ideal behavior of concrete.
This chapter showed how Maillart made use of graphic statics. After adding together the dead load of each segment, the position of the dead-load resultant has been found by constructing a funicular curve. It enabled him to deduce the orientation and amplitude of the reactions on both hinges, based on which the thrust line has been constructed. The geometry could finally be readjusted in order to minimize the eccentricities between the thrust line and the line of centroids.
4. GEOMETRICAL DEFINITION OF THE FOUNDATION BLOCK
Figure 9.Upper chords (in blue) and lower chords (in red). The thick lines were drawn after the first computation of
the thrust line (in green). Drawing 1.
Now that the reaction in the support hinge is known, the designer can manage the foundation block geometry using a third method.
While designing the foundation block, Maillart readjusted its geometry to reduce the eccentricity from its central axis to the actual reaction under the worst load distribution. This can prevent any major rotation of the block in the ground. The method combines geometry and forces and is presented in the following three steps.
A basic geometry for the block is firstly defined symmetrically to the orientation of the known support reaction Kg (dead load only) (Figure 10 in red). The intensity of that resultant regulates the sufficient area at the bottom of the block (2,6m*7m) and the reduced area at the center of the hinge where the concrete can support the entire loading exactly while being stressed asymmetrically (as a complete alternative mechanism of the resisting capacity of the steel reinforcement found in abundance locally).
The second step is to combine the reactions on the support hinge, notably under an extreme live load. The designer simulates a uniformly distributed load p=164tonnes that seems to correspond to 1tonne/m² acting over each half bridge. Since this huge load will never be reached, it only gives a rough idea of the maximum possible eccentricity of the support’s reaction from the central axis of the foundation block. Two load combinations are studied: the first is Kg+p/2 acting on the right-hand half bridge
Figure 10. Computations of the force reactions through the support hinge under dead load and extreme live load. Drawing 1.
45

Vol. 53 (2012) No. 1 March n. 171
(Figure 10 in blue), the second is Kmax=Kg+p acting on the left-hand half bridge (Figure 10 in orange). Because the reactions produced by p/2 and p have to pass through the three hinges, the orientations of these reactions are easily determined and their intensity can be measured in a corresponding force diagram (Figure 11a). Those reactions are graphically calculated, with the original dead load reaction Kg acting on the support hinge, and the corresponding new resultants of forces can be measured (Figure 11b dash blue and dash orange).
The last step considers the additive weight of the foundation block itself (65tonnes) and ipso facto the reactions present below the foundation’s surface (Figure 12). The resultants Kg and Kmax are brought to the center of gravity of the foundation block which is situated 1,3m away from the support hinge (Figure 12 red and dash orange). The
orientation and the intensity of the final resultants Rg and Rmax (Figure 12 bold red and orange) can now be graphically computed from the calculation of Kg and Kmax respectively, with a vertical vector equivalent to the weight of the block.
Figure 11. Dead load + live-load reactions in the foundation block: (a) force diagram, (b) vectorial
calculation. Drawing 1.
The eccentricity of Rmax occurring on the rear side of the block equals 15cm and is least favorable when under an extreme (unreachable) live load. The designer then slightly accommodated the width of the foundation block – considering the actual live loads – and inclined the rear side slightly to get closer to the perpendicular of Rg and Rmax.
This example highlights the simplicity of Maillart’s reasoning and computations – the few algebraic calculi remain basic, the other computations being graphical and simply manipulating orientations and lengths of vectors.
Figure 12. Vectorial calculation of dead load and live-load with the weight of the foundation block. Drawing 1.
CONCLUSION
This paper has shown the techniques used by Maillart to control the geometrical pattern of the Salginatobel Bridge. Once the main features of the structure are defined, parabolas are used as a graphical convenience to master the recursive definition of the arch. The refinement of the main geometry is conducted through graphic statics to define thrust lines enabling the line of centroids to be assessed. Bending occurs through their reciprocal distance so that the optimal design consists in constructing or at best adjusting the geometry of the arch around the thrust line. Studying the design of its foundation blocks revealed an additional application of vectorial equilibrium. These methods enabled Robert Maillart to design it in a relatively simple way. When his engineers subsequently checked the structure, they did not identify any consequent correction.
Today, the Salginatobel Bridge remains a major example of reliability, efficiency and economical design. Retaining visual and simultaneous control of both the geometry and the flow of forces were the key methods of Maillart’s design process. His techniques exemplify ways of managing the geometrical issue within the design.
Such methods derive from analysis methods usually applied to masonry arches and vaults. Examples of their relevance today – while working on concrete structures through thrust lines – can be seen when
46

JOURNAL OF THE INTERNATIONAL ASSOCIATION FOR SHELL AND SPATIAL STRUCTURES: J. IASS
47
they are applied to manage pre-stressing or from a similar method used just recently by Ney & Partnersin specifying the sections of their integral multi-vaulted approach in the Nijmegen City Bridge [11].
ACKNOWLEDGEMENTS
The authors would like to acknowledge the ETHZ for granting access to Maillart’s original working drawings and the UCLouvain for the grant supporting this research.
REFERENCES
[1] Billington D.P., Maillart and the Salginatobel Bridge, Switzerland. Structural Engineering International, 1991; 1.
[2] Giedion S., Space, time and architecture. Harvard University Press, 1941.
[3] Bill M., Robert Maillart, Ponts et Constructions. Girsberger, 1955.
[4] Billington D.P., Robert Maillart, Builder, Designer, and Artist. Cambridge University Press, 1997.
[5] Billington D. P., An Example of Structural Art: The Salginatobel Bridge of Robert Maillart. The Journal of the Society of Architectural Historians, 1974; 33-n°1: pp. 61-72.
[6] Figi H., Rehabilitation of the Salginatobel Bridge. Structural Engineering International, 2000; 10 (1): pp. 21-23.
[7] Maillart R., Salginatobel-Brücke bei Schiers, Pläne u. Berechnungen. ETH-Bibliothek, Archives and Private Collections, Hs 1085: 1929/30-1, Maillart collection. 1928.
[8] Billington D.P., Robert Maillart’s Bridges, The Art of Engineering. Princeton University Press, 1979.
[9] Zastavni D., The structural design of Maillart’s Chiasso Shed (1924): a graphic procedure. Structural Engineering International, 2008; 18(3): pp. 247-252.
[10] Zastavni D., La conception chez Robert Maillart, Morphogenèse des structures architecturales. Université catholique de Louvain. 2008.
[11] Ney L., Nijmegen City Bridge. IABSE Belgium annual general meeting, Brussels, 3 June 2010.