robecosam study water: the market of the future · robecosam study water: the market of the future...
TRANSCRIPT
Water: the market of the future
RobecoSAM Study

RobecoSAM Study
Water: the market of the future
06/2015
RobecoSAM AG
www.robecosam.com
RobecoSAM • Water: the market of the future • 1
Table of Contents
ExEcutivE Summary 2
1. WatEr – a GLOBaL cHaLLENGE 3 1.1 Limited supply 3
1.2 Rising demand 4
2. GLOBaL trENDS SHaPiNG tHE WatEr marKEt 13 2.1 Demographic change 13
2.2 Aging infrastructure 16
2.3 Higher water quality standards 16
2.4 Climate change 18
3. GLOBaL WatEr marKEt: currENt ENvirONmENt SuPPOrtS GrOWtH 20 3.1 Government initiatives 21
3.2 Consolidation and privatization 22
3.3 Water tariffs 23
4. iNvEStmENt OPPOrtuNitiES 25 4.1 Utilities 26
4.2 Capital Goods & Chemicals 28
4.3 Construction & Materials 33
4.4 Quality & Analytics 35
5. caSE StuDy: tHE DraGON’S tHirSt FOr ENErGy 36
6. cONcLuSiON 39
2 • RobecoSAM • Water: the market of the future
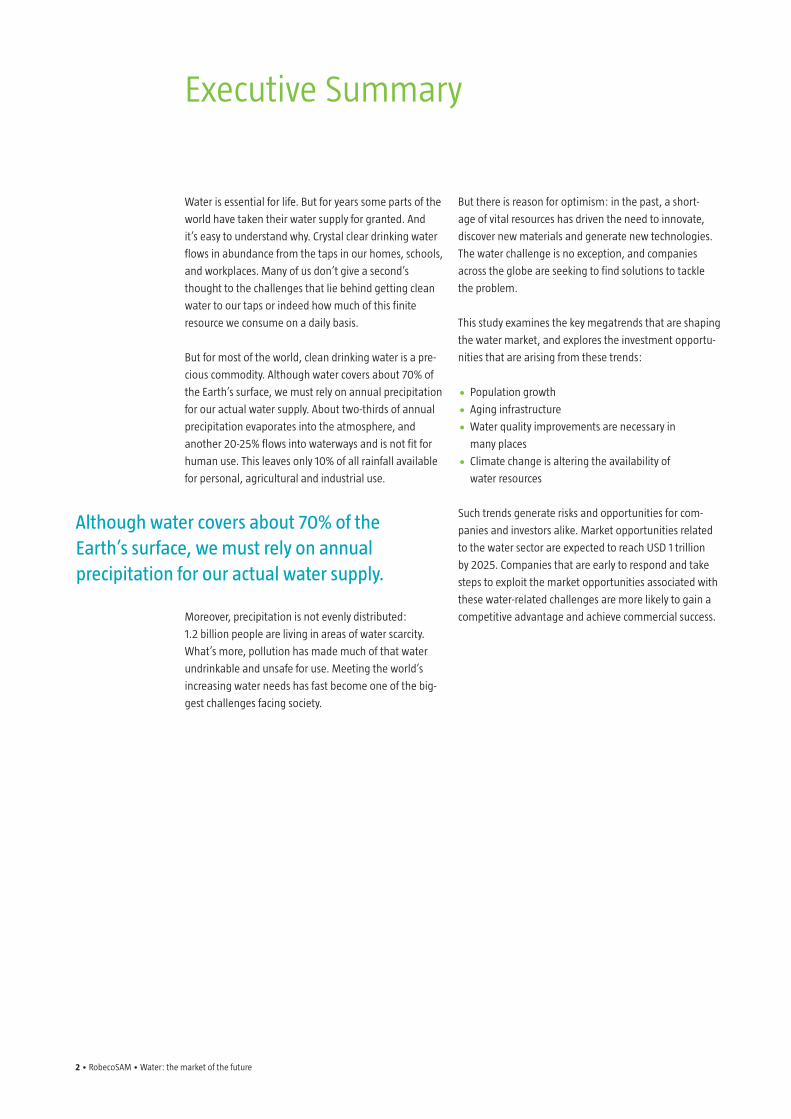
Executive Summary
Water is essential for life. But for years some parts of the
world have taken their water supply for granted. And
it’s easy to understand why. Crystal clear drinking water
flows in abundance from the taps in our homes, schools,
and workplaces. Many of us don’t give a second’s
thought to the challenges that lie behind getting clean
water to our taps or indeed how much of this finite
resource we consume on a daily basis.
But for most of the world, clean drinking water is a pre-
cious commodity. Although water covers about 70% of
the Earth’s surface, we must rely on annual precipitation
for our actual water supply. About two-thirds of annual
precipitation evaporates into the atmosphere, and
another 20-25% flows into waterways and is not fit for
human use. This leaves only 10% of all rainfall available
for personal, agricultural and industrial use.
Moreover, precipitation is not evenly distributed:
1.2 billion people are living in areas of water scarcity.
What’s more, pollution has made much of that water
undrinkable and unsafe for use. Meeting the world’s
increasing water needs has fast become one of the big-
gest challenges facing society.
But there is reason for optimism: in the past, a short-
age of vital resources has driven the need to innovate,
discover new materials and generate new technologies.
The water challenge is no exception, and companies
across the globe are seeking to find solutions to tackle
the problem.
This study examines the key megatrends that are shaping
the water market, and explores the investment opportu-
nities that are arising from these trends:
• Population growth
• Aging infrastructure
• Water quality improvements are necessary in
many places
• Climate change is altering the availability of
water resources
Such trends generate risks and opportunities for com-
panies and investors alike. Market opportunities related
to the water sector are expected to reach USD 1 trillion
by 2025. Companies that are early to respond and take
steps to exploit the market opportunities associated with
these water-related challenges are more likely to gain a
competitive advantage and achieve commercial success.
although water covers about 70% of the Earth’s surface, we must rely on annual precipitation for our actual water supply.
RobecoSAM • Water: the market of the future • 3
1.1 Limited supplyTwo key features dominate current global water con-
sumption patterns:
• The supply of freshwater is limited, but demand
is growing steadily.
• Many countries are failing to satisfy the basic need
to provide sufficient quantities of water of acceptable
quality.
Limited water reserves
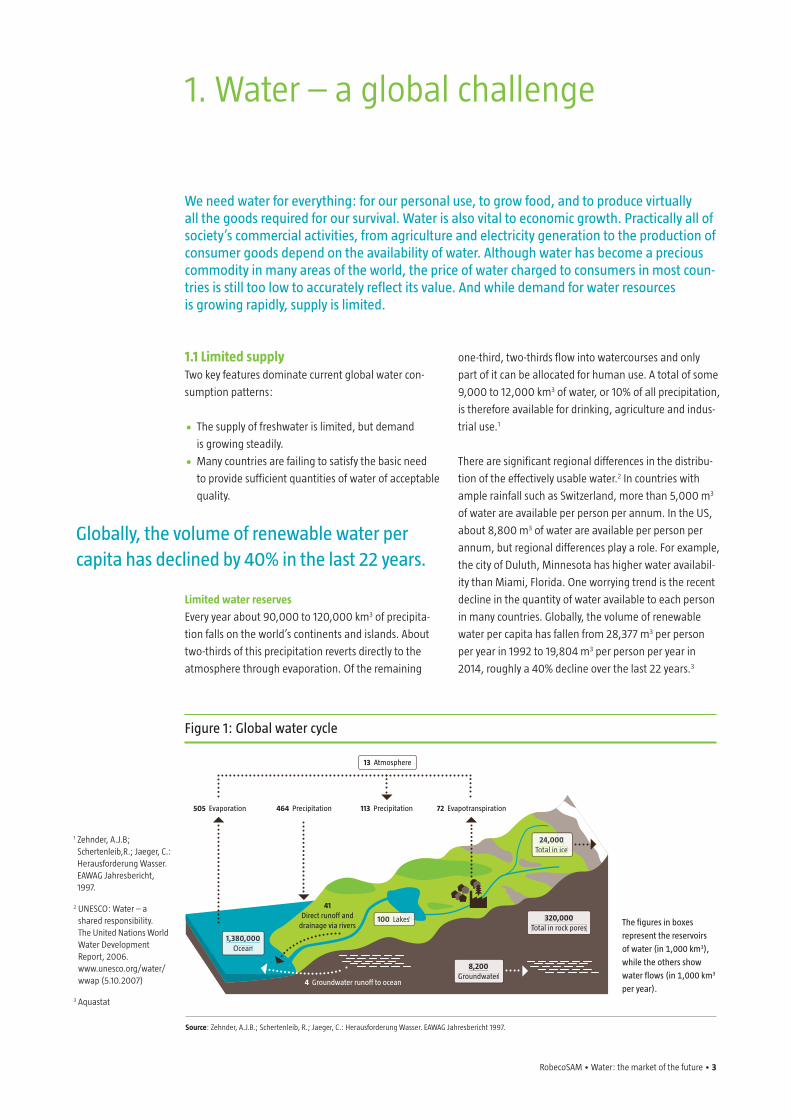
Every year about 90,000 to 120,000 km3 of precipita-
tion falls on the world’s continents and islands. About
two-thirds of this precipitation reverts directly to the
atmosphere through evaporation. Of the remaining
one-third, two-thirds flow into watercourses and only
part of it can be allocated for human use. A total of some
9,000 to 12,000 km3 of water, or 10% of all precipitation,
is therefore available for drinking, agriculture and indus-
trial use.1
There are significant regional differences in the distribu-
tion of the effectively usable water.2 In countries with
ample rainfall such as Switzerland, more than 5,000 m3
of water are available per person per annum. In the US,
about 8,800 m3 of water are available per person per
annum, but regional differences play a role. For example,
the city of Duluth, Minnesota has higher water availabil-
ity than Miami, Florida. One worrying trend is the recent
decline in the quantity of water available to each person
in many countries. Globally, the volume of renewable
water per capita has fallen from 28,377 m3 per person
per year in 1992 to 19,804 m3 per person per year in
2014, roughly a 40% decline over the last 22 years.3
1. Water – a global challenge
We need water for everything: for our personal use, to grow food, and to produce virtually all the goods required for our survival. Water is also vital to economic growth. Practically all of society’s commercial activities, from agriculture and electricity generation to the production of consumer goods depend on the availability of water. although water has become a precious commodity in many areas of the world, the price of water charged to consumers in most coun-tries is still too low to accurately reflect its value. and while demand for water resources is growing rapidly, supply is limited.
Figure 1: Global water cycle
Source: Zehnder, A.J.B.; Schertenleib, R.; Jaeger, C.: Herausforderung Wasser. EAWAG Jahresbericht 1997.
the figures in boxes
represent the reservoirs
of water (in 1,000 km3),
while the others show
water flows (in 1,000 km3
per year).
1,380,000Ocean
100 Lakes Lakes
24,00024,000total in icetotal in ice
13 atmosphere
505 Evaporation 464 Precipitation 113 Precipitation 72 Evapotranspiration
41 Direct runoff and
drainage via rivers320,000
total in rock pores
8,200Groundwater
4 Groundwater runoff to ocean
1 Zehnder, A.J.B; Schertenleib,R.; Jaeger, C.: Herausforderung Wasser. EAWAG Jahresbericht, 1997.
2 UNESCO: Water – a shared responsibility. The United Nations World Water Development Report, 2006. www.unesco.org/water/wwap (5.10.2007)
3 Aquastat
Globally, the volume of renewable water per capita has declined by 40% in the last 22 years.
4 • RobecoSAM • Water: the market of the future
1.2 Rising demandWater use can be roughly divided into three areas:
urban water management, agriculture and industrial
production. Globally, 10% of available water flows into
domestic use, 70% into agriculture and 20% into indus-
trial production. There are, however, major regional
differences in water use: in developed countries, about
half of all water consumption is destined for industrial
uses, while in developing countries, agriculture is the
biggest consumer of water, at about 80%.
Figure 3: Water use in different regions
agriculture industrial Domestic
Source: FAO: Aquastat. www.fao.org/nr/water/aquastat (5.10.2007).
100%
90%
80%
70%
60%
50%
40%
30%
20%
10%
0
World africa asia North america Europe
Globally, 10% of available water flows into domestic use, 70% into agriculture and 20% into industrial production.
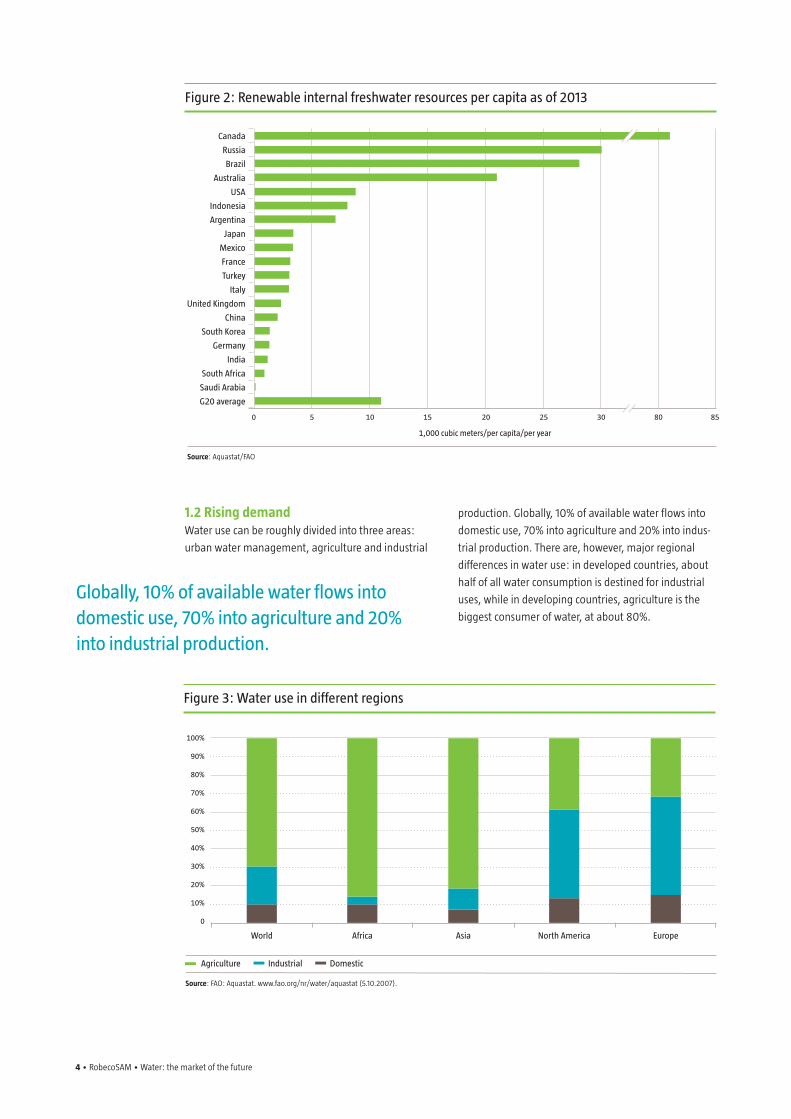
Figure 2: renewable internal freshwater resources per capita as of 2013
Source: Aquastat/FAO
canada
russia
Brazil
australia
uSa
indonesia
argentina
Japan
mexico
France
turkey
italy
united Kingdom
china
South Korea
Germany
india
South africa
Saudi arabia
G20 average
0 5 10 15 20 25 85
1,000 cubic meters/per capita/per year
30 80
RobecoSAM • Water: the market of the future • 5
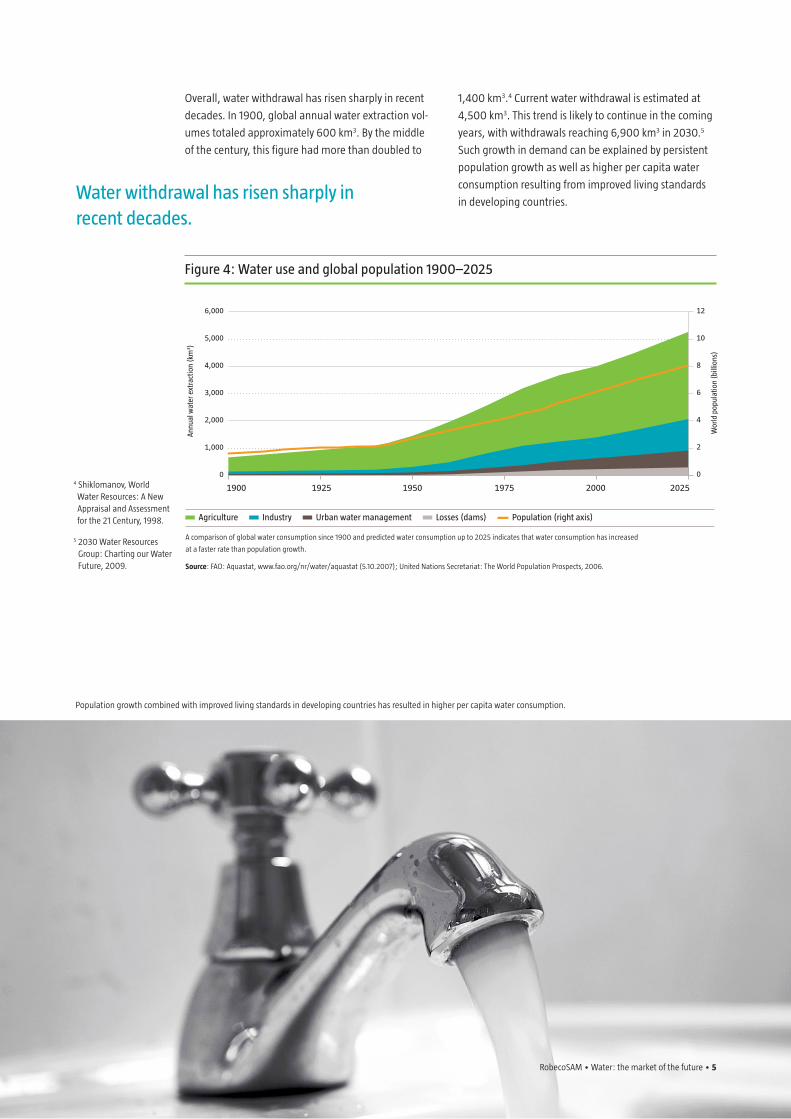
Overall, water withdrawal has risen sharply in recent
decades. In 1900, global annual water extraction vol-
umes totaled approximately 600 km3. By the middle
of the century, this figure had more than doubled to
1,400 km3.4 Current water withdrawal is estimated at
4,500 km3. This trend is likely to continue in the coming
years, with withdrawals reaching 6,900 km3 in 2030.5
Such growth in demand can be explained by persistent
population growth as well as higher per capita water
consumption resulting from improved living standards
in developing countries. Water withdrawal has risen sharply in recent decades.
Figure 4: Water use and global population 1900–2025
agriculture industry urban water management Losses (dams) Population (right axis)
A comparison of global water consumption since 1900 and predicted water consumption up to 2025 indicates that water consumption has increased
at a faster rate than population growth.
Source: FAO: Aquastat, www.fao.org/nr/water/aquastat (5.10.2007); United Nations Secretariat: The World Population Prospects, 2006.
6,000
5,000
4,000
3,000
2,000
1,000
0
annu
al w
ater
ext
ract
ion
(km
3 )
1900
12
10
8
6
4
2
0
Wor
ld p
opul
atio
n (b
illio
ns)
1925 1950 1975 2000 20254 Shiklomanov, World Water Resources: A New Appraisal and Assessment for the 21 Century, 1998.
5 2030 Water Resources Group: Charting our Water Future, 2009.
RobecoSAM • Water: the market of the future • 5
Population growth combined with improved living standards in developing countries has resulted in higher per capita water consumption.
6 • RobecoSAM • Water: the market of the future
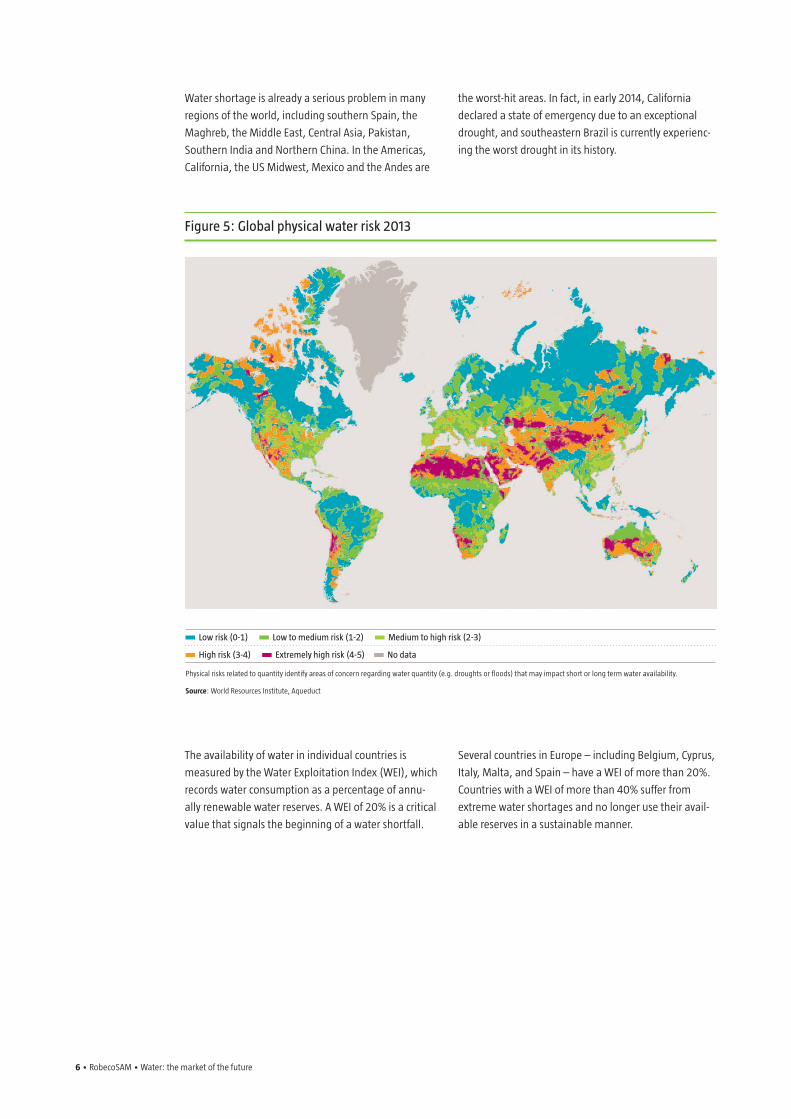
Figure 5: Global physical water risk 2013
Low risk (0-1) Low to medium risk (1-2) medium to high risk (2-3)
High risk (3-4) Extremely high risk (4-5) No data
Physical risks related to quantity identify areas of concern regarding water quantity (e.g. droughts or floods) that may impact short or long term water availability.
Source: World Resources Institute, Aqueduct
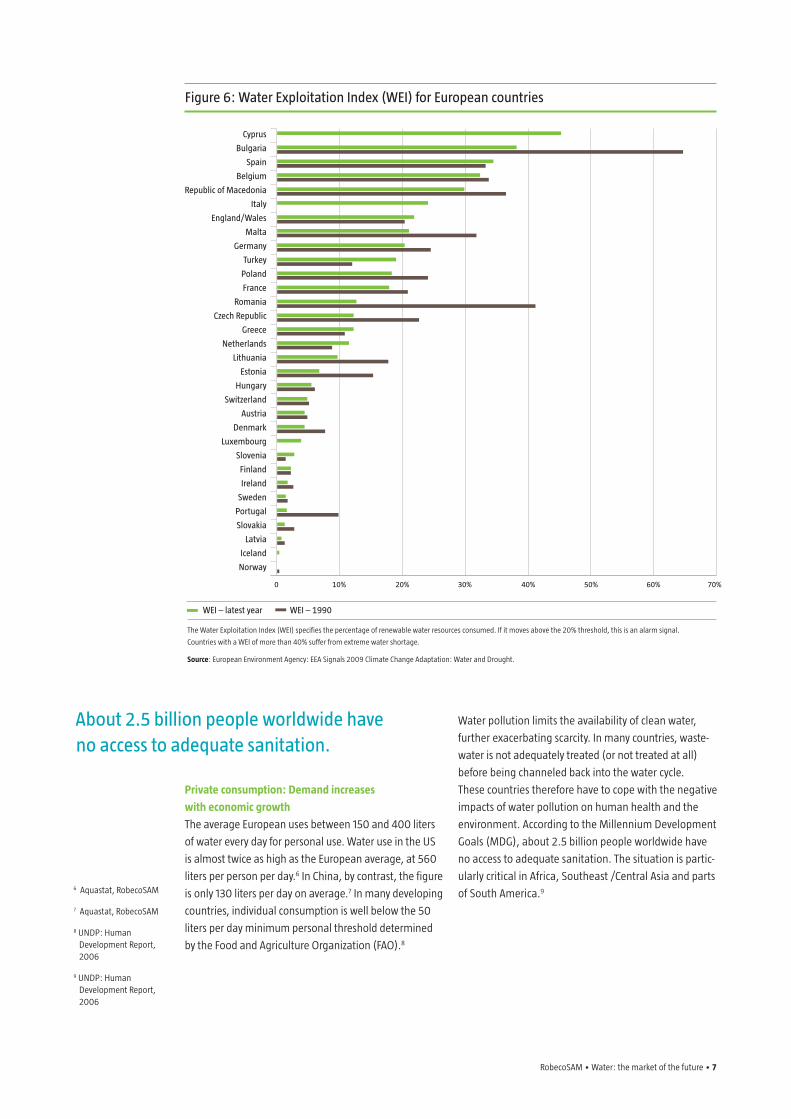
The availability of water in individual countries is
measured by the Water Exploitation Index (WEI), which
records water consumption as a percentage of annu-
ally renewable water reserves. A WEI of 20% is a critical
value that signals the beginning of a water shortfall.
Several countries in Europe – including Belgium, Cyprus,
Italy, Malta, and Spain – have a WEI of more than 20%.
Countries with a WEI of more than 40% suffer from
extreme water shortages and no longer use their avail-
able reserves in a sustainable manner.
Water shortage is already a serious problem in many
regions of the world, including southern Spain, the
Maghreb, the Middle East, Central Asia, Pakistan,
Southern India and Northern China. In the Americas,
California, the US Midwest, Mexico and the Andes are
the worst-hit areas. In fact, in early 2014, California
declared a state of emergency due to an exceptional
drought, and southeastern Brazil is currently experienc-
ing the worst drought in its history.
RobecoSAM • Water: the market of the future • 7
Figure 6: Water Exploitation index (WEi) for European countries
WEi – latest year WEi – 1990
The Water Exploitation Index (WEI) specifies the percentage of renewable water resources consumed. If it moves above the 20% threshold, this is an alarm signal.
Countries with a WEI of more than 40% suffer from extreme water shortage.
Source: European Environment Agency: EEA Signals 2009 Climate Change Adaptation: Water and Drought.
cyprus
Bulgaria
Spain
Belgium
republic of macedonia
italy
England/Wales
malta
Germany
turkey
Poland
France
romania
czech republic
Greece
Netherlands
Lithuania
Estonia
Hungary
Switzerland
austria
Denmark
Luxembourg
Slovenia
Finland
ireland
Sweden
Portugal
Slovakia
Latvia
iceland
Norway
0 70%10% 20% 30% 40% 50% 60%
Private consumption: Demand increases
with economic growth
The average European uses between 150 and 400 liters
of water every day for personal use. Water use in the US
is almost twice as high as the European average, at 560
liters per person per day.6 In China, by contrast, the figure
is only 130 liters per day on average.7 In many developing
countries, individual consumption is well below the 50
liters per day minimum personal threshold determined
by the Food and Agriculture Organization (FAO).8
Water pollution limits the availability of clean water,
further exacerbating scarcity. In many countries, waste-
water is not adequately treated (or not treated at all)
before being channeled back into the water cycle.
These countries therefore have to cope with the negative
impacts of water pollution on human health and the
environment. According to the Millennium Development
Goals (MDG), about 2.5 billion people worldwide have
no access to adequate sanitation. The situation is partic-
ularly critical in Africa, Southeast /Central Asia and parts
of South America.9 6 Aquastat, RobecoSAM
7 Aquastat, RobecoSAM
8 UNDP: Human Development Report, 2006
9 UNDP: Human Development Report, 2006
about 2.5 billion people worldwide have no access to adequate sanitation.
8 • RobecoSAM • Water: the market of the future
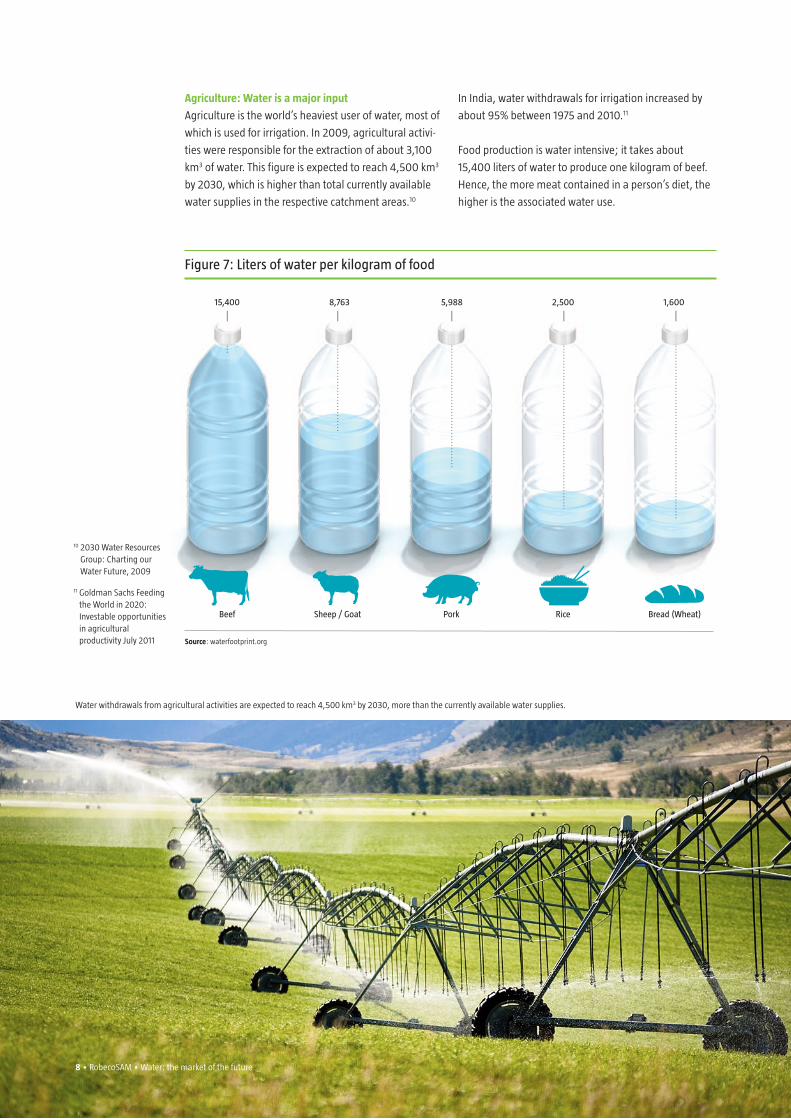
Agriculture: Water is a major input
Agriculture is the world’s heaviest user of water, most of
which is used for irrigation. In 2009, agricultural activi-
ties were responsible for the extraction of about 3,100
km3 of water. This figure is expected to reach 4,500 km3
by 2030, which is higher than total currently available
water supplies in the respective catchment areas.10
In India, water withdrawals for irrigation increased by
about 95% between 1975 and 2010.11
Food production is water intensive; it takes about
15,400 liters of water to produce one kilogram of beef.
Hence, the more meat contained in a person’s diet, the
higher is the associated water use.
10 2030 Water Resources Group: Charting our Water Future, 2009
11 Goldman Sachs Feeding the World in 2020: Investable opportunities in agricultural productivity July 2011
Figure 7: Liters of water per kilogram of food
Source: waterfootprint.org
Beef
15,400
Sheep / Goat Pork Rice Bread (Wheat)
8,763 5,988 2,500 1,600
8 • RobecoSAM • Water: the market of the future
Water withdrawals from agricultural activities are expected to reach 4,500 km3 by 2030, more than the currently available water supplies.
RobecoSAM • Water: the market of the future • 9
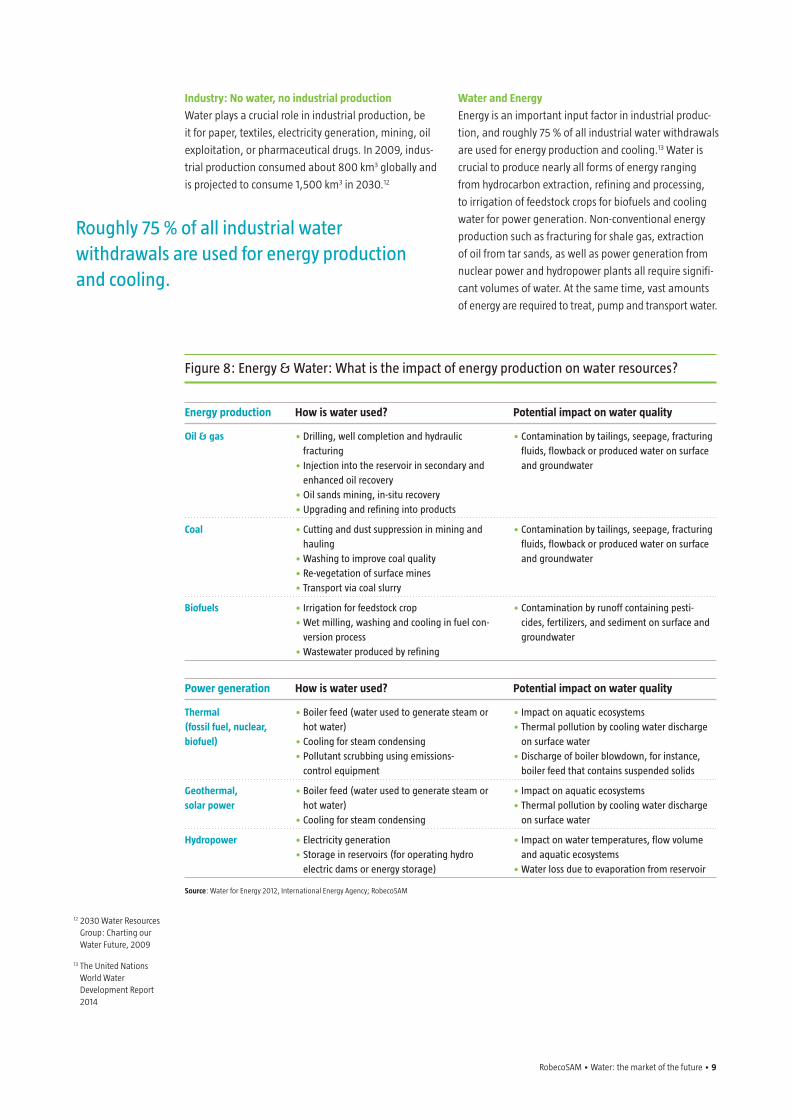
roughly 75 % of all industrial water withdrawals are used for energy production and cooling.
Industry: No water, no industrial production
Water plays a crucial role in industrial production, be
it for paper, textiles, electricity generation, mining, oil
exploitation, or pharmaceutical drugs. In 2009, indus-
trial production consumed about 800 km3 globally and
is projected to consume 1,500 km3 in 2030.12
Water and Energy
Energy is an important input factor in industrial produc-
tion, and roughly 75 % of all industrial water withdrawals
are used for energy production and cooling.13 Water is
crucial to produce nearly all forms of energy ranging
from hydrocarbon extraction, refining and processing,
to irrigation of feedstock crops for biofuels and cooling
water for power generation. Non-conventional energy
production such as fracturing for shale gas, extraction
of oil from tar sands, as well as power generation from
nuclear power and hydropower plants all require signifi-
cant volumes of water. At the same time, vast amounts
of energy are required to treat, pump and transport water.
Figure 8: Energy & Water: What is the impact of energy production on water resources?
Energy production How is water used? Potential impact on water quality
Oil & gas • Drilling, well completion and hydraulic •contamination by tailings, seepage, fracturing fracturing fluids, flowback or produced water on surface •injection into the reservoir in secondary and and groundwater enhanced oil recovery •Oil sands mining, in-situ recovery •upgrading and refining into products
Coal •cutting and dust suppression in mining and •contamination by tailings, seepage, fracturing hauling fluids, flowback or produced water on surface •Washing to improve coal quality and groundwater •re-vegetation of surface mines •transport via coal slurry
Biofuels •irrigation for feedstock crop •contamination by runoff containing pesti- •Wet milling, washing and cooling in fuel con- cides, fertilizers, and sediment on surface and version process groundwater •Wastewater produced by refining
Power generation How is water used? Potential impact on water quality
Thermal •Boiler feed (water used to generate steam or •impact on aquatic ecosystems (fossil fuel, nuclear, hot water) •thermal pollution by cooling water discharge biofuel) •cooling for steam condensing on surface water •Pollutant scrubbing using emissions- •Discharge of boiler blowdown, for instance, control equipment boiler feed that contains suspended solids
Geothermal, •Boiler feed (water used to generate steam or •impact on aquatic ecosystems solar power hot water) •thermal pollution by cooling water discharge •cooling for steam condensing on surface water
Hydropower •Electricity generation •impact on water temperatures, flow volume •Storage in reservoirs (for operating hydro and aquatic ecosystems electric dams or energy storage) •Water loss due to evaporation from reservoir
Source: Water for Energy 2012, International Energy Agency; RobecoSAM
12 2030 Water Resources Group: Charting our Water Future, 2009
13 The United Nations World Water Development Report 2014
10 • RobecoSAM • Water: the market of the future
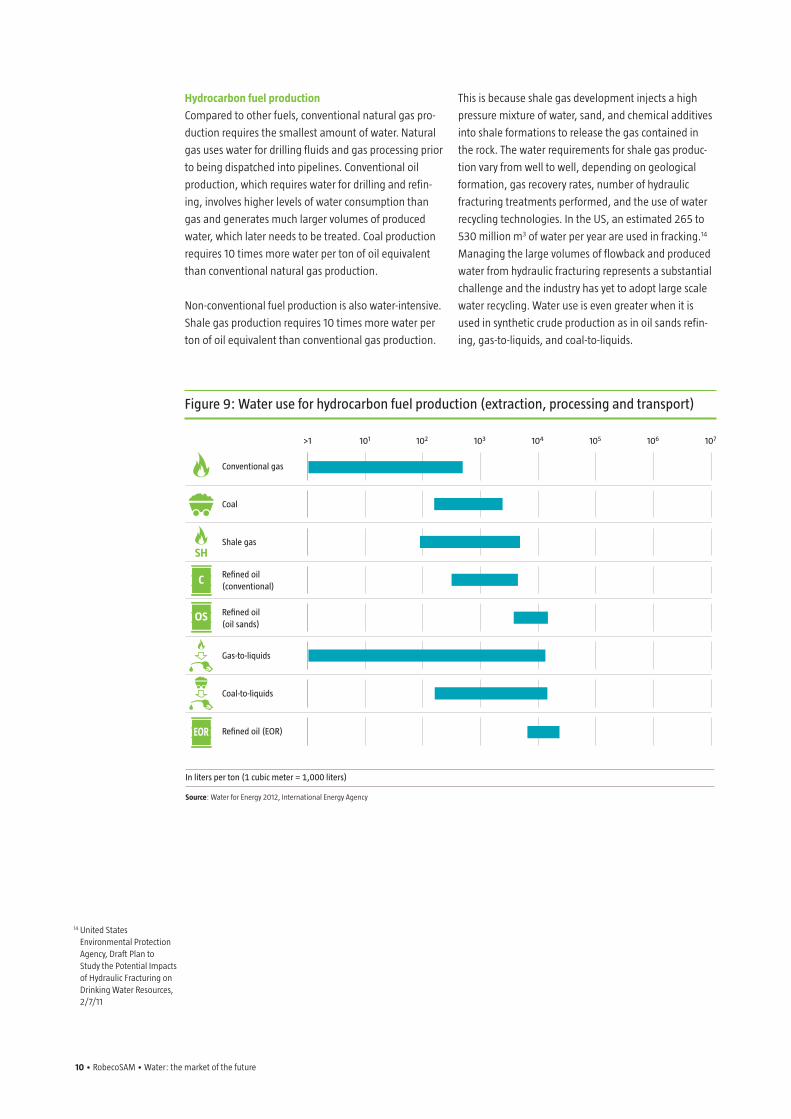
Hydrocarbon fuel production
Compared to other fuels, conventional natural gas pro-
duction requires the smallest amount of water. Natural
gas uses water for drilling fluids and gas processing prior
to being dispatched into pipelines. Conventional oil
production, which requires water for drilling and refin-
ing, involves higher levels of water consumption than
gas and generates much larger volumes of produced
water, which later needs to be treated. Coal production
requires 10 times more water per ton of oil equivalent
than conventional natural gas production.
Non-conventional fuel production is also water-intensive.
Shale gas production requires 10 times more water per
ton of oil equivalent than conventional gas production.
This is because shale gas development injects a high
pressure mixture of water, sand, and chemical additives
into shale formations to release the gas contained in
the rock. The water requirements for shale gas produc-
tion vary from well to well, depending on geological
formation, gas recovery rates, number of hydraulic
fracturing treatments performed, and the use of water
recycling technologies. In the US, an estimated 265 to
530 million m3 of water per year are used in fracking.14
Managing the large volumes of flowback and produced
water from hydraulic fracturing represents a substantial
challenge and the industry has yet to adopt large scale
water recycling. Water use is even greater when it is
used in synthetic crude production as in oil sands refin-
ing, gas-to-liquids, and coal-to-liquids.
14 United States Environmental Protection Agency, Draft Plan to Study the Potential Impacts of Hydraulic Fracturing on Drinking Water Resources, 2/7/11
Figure 9: Water use for hydrocarbon fuel production (extraction, processing and transport)
in liters per ton (1 cubic meter = 1,000 liters)
Source: Water for Energy 2012, International Energy Agency
Conventional gas
>1 101 102 103 104 105 106 107
Coal
Shale gas
Re�ned oil(conventional)
Re�ned oil (EOR)
Re�ned oil(oil sands)
Gas-to-liquids
Coal-to-liquids
OS
SH
EOR
C
RobecoSAM • Water: the market of the future • 11
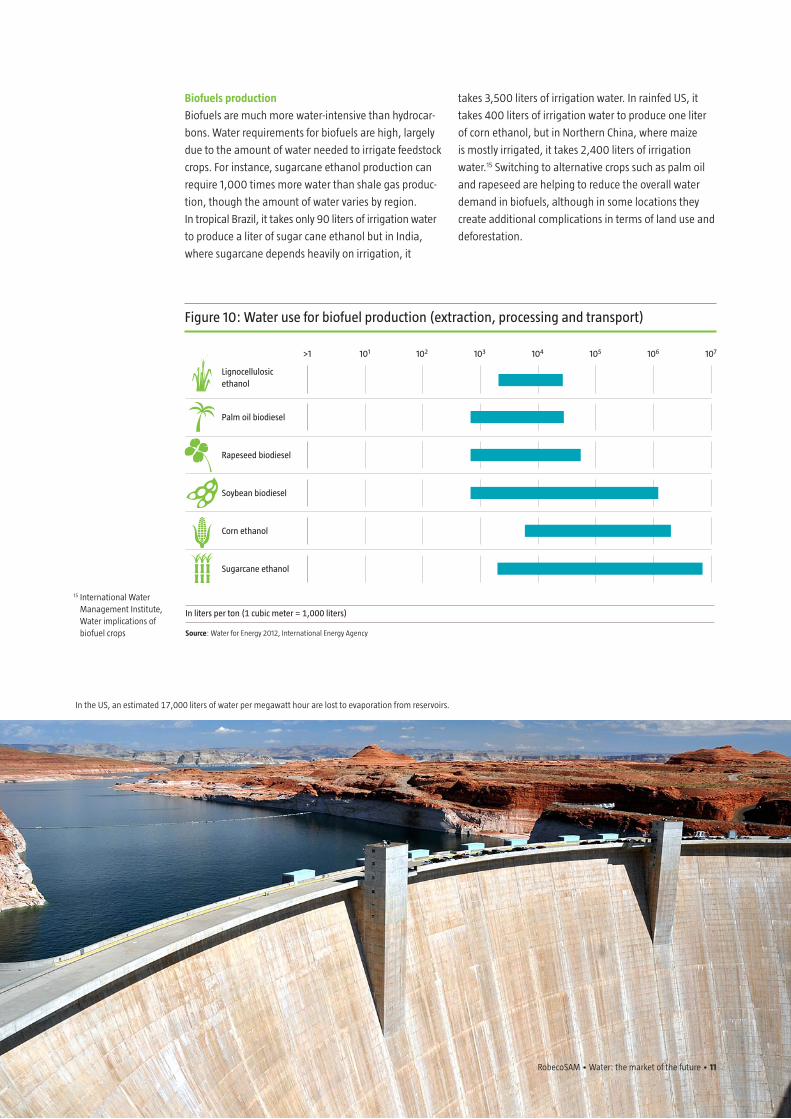
Biofuels production
Biofuels are much more water-intensive than hydrocar-
bons. Water requirements for biofuels are high, largely
due to the amount of water needed to irrigate feedstock
crops. For instance, sugarcane ethanol production can
require 1,000 times more water than shale gas produc-
tion, though the amount of water varies by region.
In tropical Brazil, it takes only 90 liters of irrigation water
to produce a liter of sugar cane ethanol but in India,
where sugarcane depends heavily on irrigation, it
takes 3,500 liters of irrigation water. In rainfed US, it
takes 400 liters of irrigation water to produce one liter
of corn ethanol, but in Northern China, where maize
is mostly irrigated, it takes 2,400 liters of irrigation
water.15 Switching to alternative crops such as palm oil
and rapeseed are helping to reduce the overall water
demand in biofuels, although in some locations they
create additional complications in terms of land use and
deforestation.
Figure 10: Water use for biofuel production (extraction, processing and transport)
in liters per ton (1 cubic meter = 1,000 liters)
Source: Water for Energy 2012, International Energy Agency
Lignocellulosicethanol
>1 101 102 103 104 105 106 107
Palm oil biodiesel
Rapeseed biodiesel
Soybean biodiesel
Corn ethanol
Sugarcane ethanol
15 International Water Management Institute, Water implications of biofuel crops
RobecoSAM • Water: the market of the future • 11
In the US, an estimated 17,000 liters of water per megawatt hour are lost to evaporation from reservoirs.
12 • RobecoSAM • Water: the market of the future
Water withdrawals per unit of electricity produced
are highest for fossil-steam and nuclear power plants,
though the water intensity depends on the type of cool-
ing systems used. Conversely, non-thermal renewables
such as wind and solar photovoltaic have the lowest
water withdrawal and a minimal impact on water quality.
In addition to being water-intensive, energy production
can also impact water quality through contamination
by fluids containing pollutants. Further, the discharge of
cooling water into local waterways can have an impact
on local water temperatures and flow volumes, affect-
ing aquatic ecosystems. According to the International
Energy Agency, the amount of water required for energy
production will increase between 20% and 35% by 2035
to meet our future energy needs, depending on the
energy policy scenarios in place.19
16 Gleick 1994, 267-299; U.S. Department of Energy 2006
17 http://noticias.uol.com.br/cotidiano/ultimas-noticias/2015/01/21/nivel-de-agua-de-85-das-hidreletricas-e-menor-que-em-2001-ano-do-apagao.htm
18 http://www.ft.com/intl/cms/s/0/a140a1e6-b14e-11e4-a830-00144feab7de.html#slide0
19 Water for Energy 2012, International Energy Agency
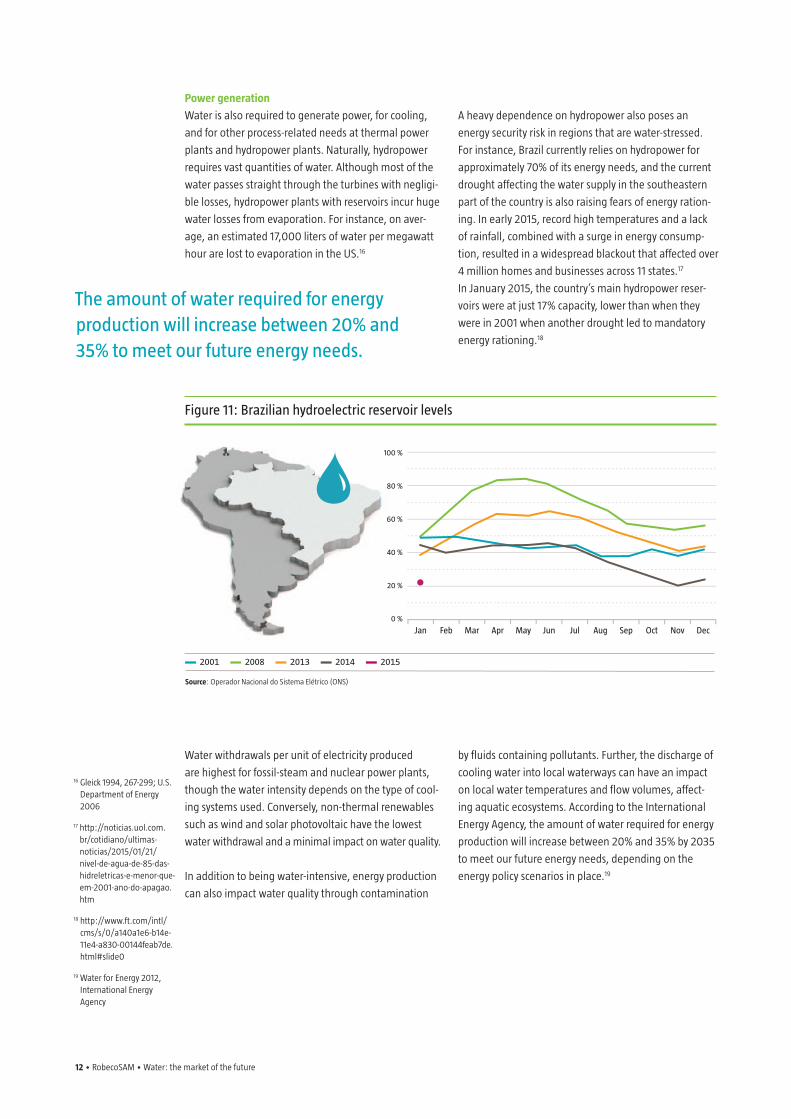
Power generation
Water is also required to generate power, for cooling,
and for other process-related needs at thermal power
plants and hydropower plants. Naturally, hydropower
requires vast quantities of water. Although most of the
water passes straight through the turbines with negligi-
ble losses, hydropower plants with reservoirs incur huge
water losses from evaporation. For instance, on aver-
age, an estimated 17,000 liters of water per megawatt
hour are lost to evaporation in the US.16
A heavy dependence on hydropower also poses an
energy security risk in regions that are water-stressed.
For instance, Brazil currently relies on hydropower for
approximately 70% of its energy needs, and the current
drought affecting the water supply in the southeastern
part of the country is also raising fears of energy ration-
ing. In early 2015, record high temperatures and a lack
of rainfall, combined with a surge in energy consump-
tion, resulted in a widespread blackout that affected over
4 million homes and businesses across 11 states.17
In January 2015, the country’s main hydropower reser-
voirs were at just 17% capacity, lower than when they
were in 2001 when another drought led to mandatory
energy rationing.18
Figure 11: Brazilian hydroelectric reservoir levels
2001 2008 2013 2014 2015
Source: Operador Nacional do Sistema Elétrico (ONS)
Jan Feb Mar Apr May Jun Jul Aug Sep Oct Nov Dec
100 %
80 %
60 %
40 %
20 %
0 %
the amount of water required for energy production will increase between 20% and 35% to meet our future energy needs.
RobecoSAM • Water: the market of the future • 13
2. Global trends shaping the water market
2.1 Demographic change Three key demographic trends are affecting water con-
sumption:
• The world’s population will continue to grow over the
next few decades
• More and more people are moving from the country-
side to cities
• General living standards are improving – particularly
in the two countries with the largest populations,
China and India – leading to more intensified water
consumption
Continued global population boom
The world’s population currently stands at approxi-
mately 7.3 billion people, and though growth rates are
expected to level off, it will continue to increase over the
next few decades. The UN expects the global population
to reach 9.6 billion by the year 2050. Demand for water
will of course increase purely in response to population
growth. But recent experience within the last few decades
also shows that water consumption has grown at a faster
rate than population growth as a result of continuously
improving living standards. This trend is unlikely to be
reversed for some time given rising living standards in the
emerging markets.
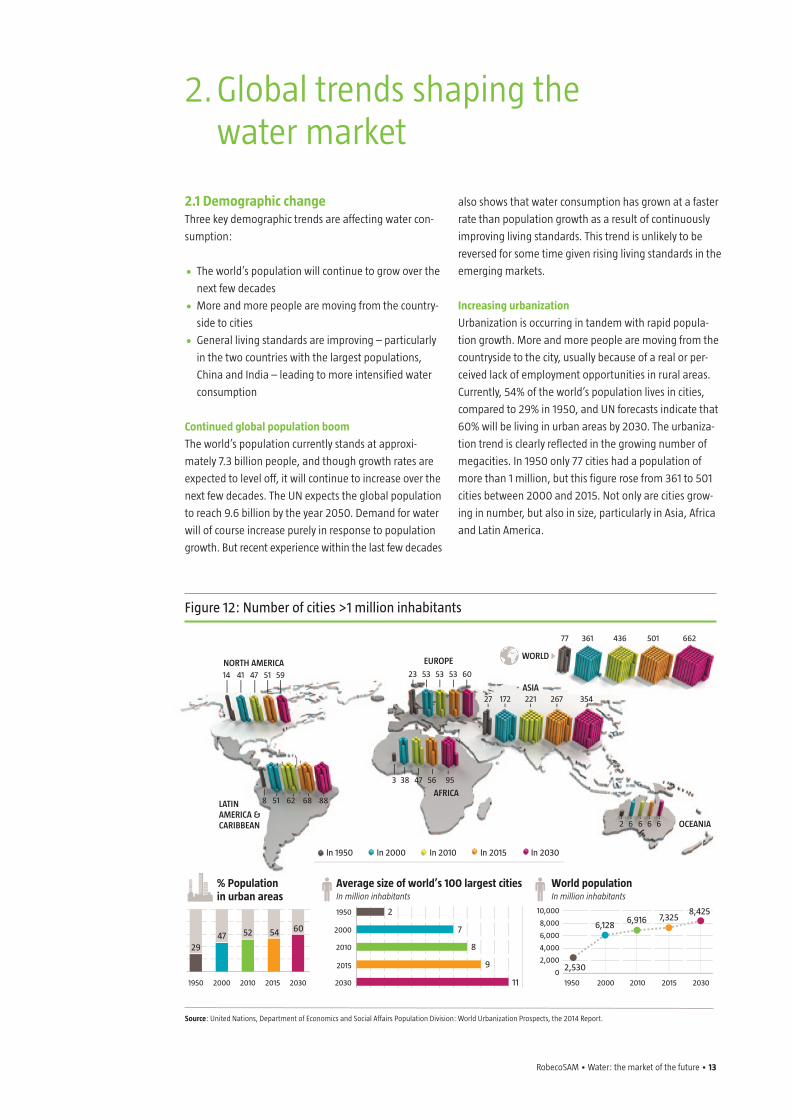
Increasing urbanization
Urbanization is occurring in tandem with rapid popula-
tion growth. More and more people are moving from the
countryside to the city, usually because of a real or per-
ceived lack of employment opportunities in rural areas.
Currently, 54% of the world’s population lives in cities,
compared to 29% in 1950, and UN forecasts indicate that
60% will be living in urban areas by 2030. The urbaniza-
tion trend is clearly reflected in the growing number of
megacities. In 1950 only 77 cities had a population of
more than 1 million, but this figure rose from 361 to 501
cities between 2000 and 2015. Not only are cities grow-
ing in number, but also in size, particularly in Asia, Africa
and Latin America.
Figure 12: Number of cities >1 million inhabitants
Source: United Nations, Department of Economics and Social Affairs Population Division: World Urbanization Prospects, the 2014 Report.
LATINAMERICA &CARIBBEAN
In 1950
World populationIn million inhabitants
% Populationin urban areas
Average size of world’s 100 largest citiesIn million inhabitants
NORTH AMERICA EUROPE
ASIA
OCEANIA
WORLD
AFRICA
14 41 47 51 59 23
27
77 361 436 501 662
172 221 267 354
2 6 6 6 6
53 53 53 60
3 38 47 56 95
8 51 62 68 88
1950
2000
2010
2015
2030
In 2000 In 2010 In 2015 In 2030
20001950
6,1286,916 7,325
8,425
2010 2015 203020001950 2010 2015 2030
8
9
11
7
2 10,000
8,000
6,000
4,000
2,000
0
4729
52 54 60
2,530
14 • RobecoSAM • Water: the market of the future
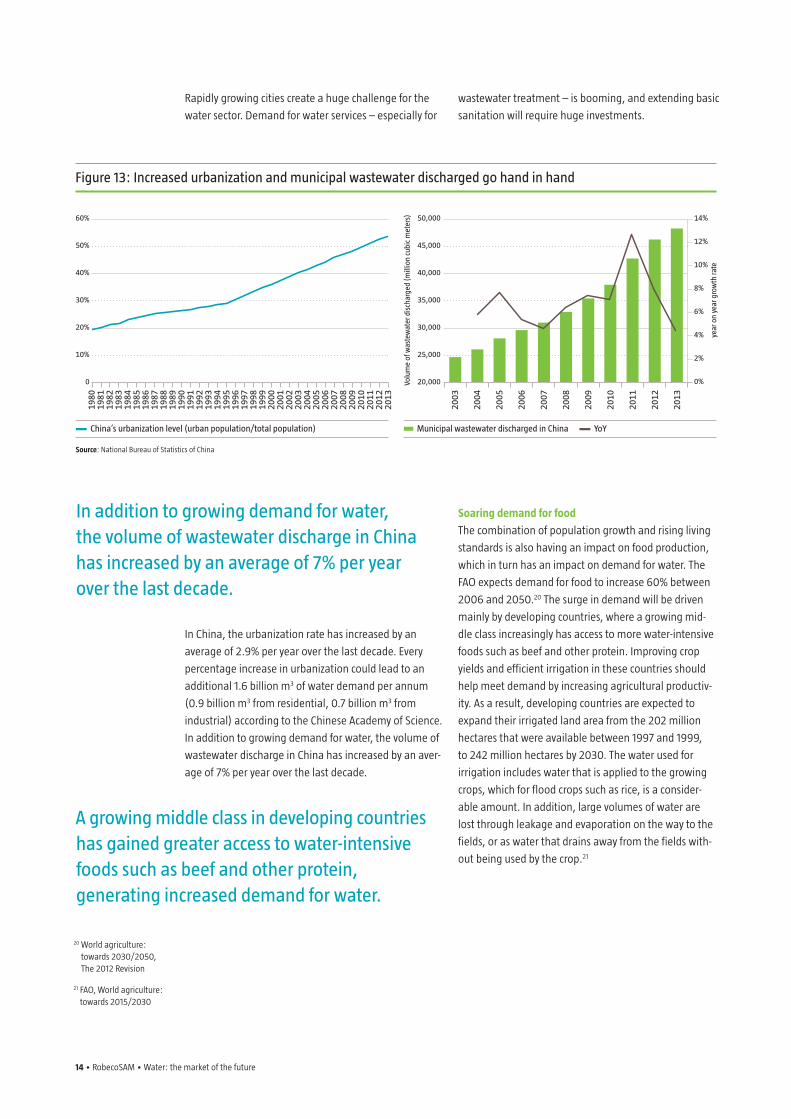
Rapidly growing cities create a huge challenge for the
water sector. Demand for water services – especially for
wastewater treatment – is booming, and extending basic
sanitation will require huge investments.
Figure 13: increased urbanization and municipal wastewater discharged go hand in hand
china’s urbanization level (urban population/total population)
Source: National Bureau of Statistics of China
60%
50%
40%
30%
20%
10%
0
1980
1981
1982
1983
1984
1985
1986
1987
1988
1989
1990
1991
1992
1993
1994
1995
1996
1997
1998
1999
2000
2001
2002
2003
2004
2005
2006
2007
2008
2009
2010
2011
2012
2013
50,000
45,000
40,000
35,000
30,000
25,000
20,000volu
me
of w
aste
wat
er d
isch
arge
d (m
illio
n cu
bic
met
ers) 14%
12%
10%
8%
6%
4%
2%
0%
year
on
year
gro
wth
rate
2003
2004
2005
2006
2007
2008
2009
2010
2011
2012
2013
municipal wastewater discharged in china yoy
In China, the urbanization rate has increased by an
average of 2.9% per year over the last decade. Every
percentage increase in urbanization could lead to an
additional 1.6 billion m3 of water demand per annum
(0.9 billion m3 from residential, 0.7 billion m3 from
industrial) according to the Chinese Academy of Science.
In addition to growing demand for water, the volume of
wastewater discharge in China has increased by an aver-
age of 7% per year over the last decade.
Soaring demand for food
The combination of population growth and rising living
standards is also having an impact on food production,
which in turn has an impact on demand for water. The
FAO expects demand for food to increase 60% between
2006 and 2050.20 The surge in demand will be driven
mainly by developing countries, where a growing mid-
dle class increasingly has access to more water-intensive
foods such as beef and other protein. Improving crop
yields and efficient irrigation in these countries should
help meet demand by increasing agricultural productiv-
ity. As a result, developing countries are expected to
expand their irrigated land area from the 202 million
hectares that were available between 1997 and 1999,
to 242 million hectares by 2030. The water used for
irrigation includes water that is applied to the growing
crops, which for flood crops such as rice, is a consider-
able amount. In addition, large volumes of water are
lost through leakage and evaporation on the way to the
fields, or as water that drains away from the fields with-
out being used by the crop.21
20 World agriculture: towards 2030/2050, The 2012 Revision
21 FAO, World agriculture: towards 2015/2030
in addition to growing demand for water, the volume of wastewater discharge in china has increased by an average of 7% per year over the last decade.
a growing middle class in developing countries has gained greater access to water-intensive foods such as beef and other protein, generating increased demand for water.
RobecoSAM • Water: the market of the future • 15
8,000
7,000
6,000
5,000
4,000
3,000
2,000
1,000
0
billi
on m
3
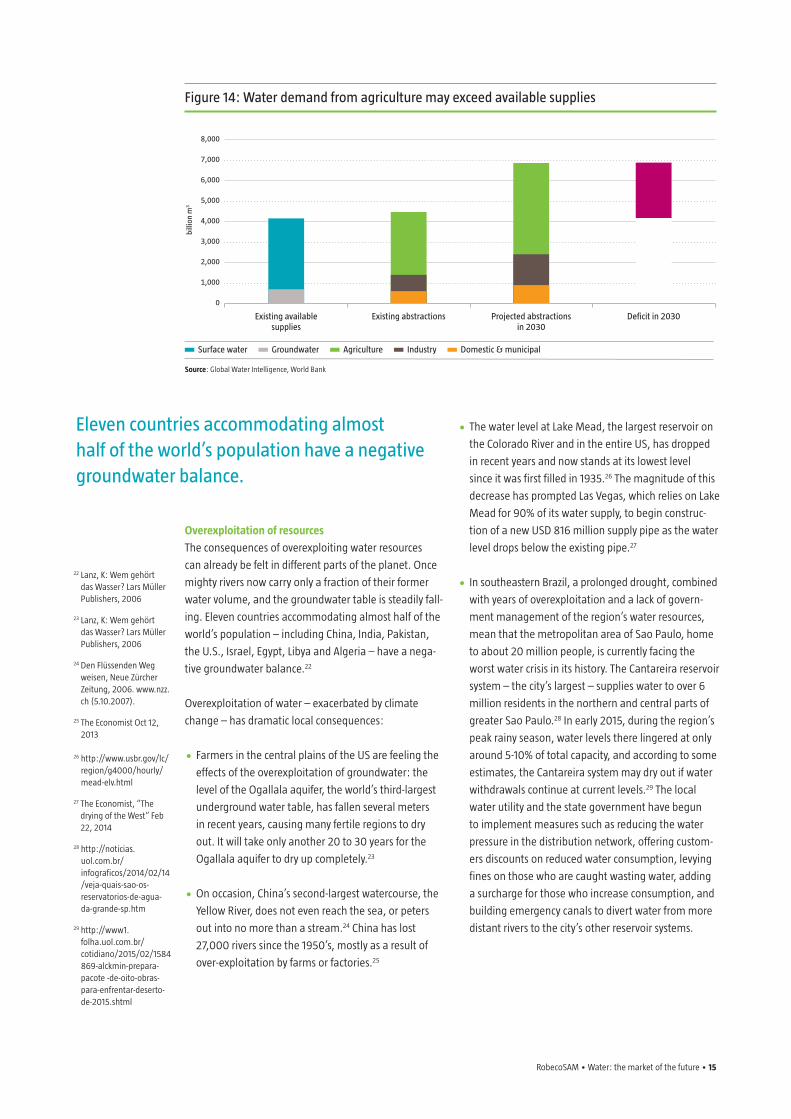
Figure 14: Water demand from agriculture may exceed available supplies
Surface water Groundwater agriculture industry Domestic & municipal
Source: Global Water Intelligence, World Bank
Existing available supplies
Existing abstractions Projected abstractionsin 2030
Deficit in 2030
Overexploitation of resources
The consequences of overexploiting water resources
can already be felt in different parts of the planet. Once
mighty rivers now carry only a fraction of their former
water volume, and the groundwater table is steadily fall-
ing. Eleven countries accommodating almost half of the
world’s population – including China, India, Pakistan,
the U.S., Israel, Egypt, Libya and Algeria – have a nega-
tive groundwater balance.22
Overexploitation of water – exacerbated by climate
change – has dramatic local consequences:
• Farmers in the central plains of the US are feeling the
effects of the overexploitation of groundwater: the
level of the Ogallala aquifer, the world’s third-largest
underground water table, has fallen several meters
in recent years, causing many fertile regions to dry
out. It will take only another 20 to 30 years for the
Ogallala aquifer to dry up completely.23
• On occasion, China’s second-largest watercourse, the
Yellow River, does not even reach the sea, or peters
out into no more than a stream.24 China has lost
27,000 rivers since the 1950’s, mostly as a result of
over-exploitation by farms or factories.25
• The water level at Lake Mead, the largest reservoir on
the Colorado River and in the entire US, has dropped
in recent years and now stands at its lowest level
since it was first filled in 1935.26 The magnitude of this
decrease has prompted Las Vegas, which relies on Lake
Mead for 90% of its water supply, to begin construc-
tion of a new USD 816 million supply pipe as the water
level drops below the existing pipe.27
• In southeastern Brazil, a prolonged drought, combined
with years of overexploitation and a lack of govern-
ment management of the region’s water resources,
mean that the metropolitan area of Sao Paulo, home
to about 20 million people, is currently facing the
worst water crisis in its history. The Cantareira reservoir
system – the city’s largest – supplies water to over 6
million residents in the northern and central parts of
greater Sao Paulo.28 In early 2015, during the region’s
peak rainy season, water levels there lingered at only
around 5-10% of total capacity, and according to some
estimates, the Cantareira system may dry out if water
withdrawals continue at current levels.29 The local
water utility and the state government have begun
to implement measures such as reducing the water
pressure in the distribution network, offering custom-
ers discounts on reduced water consumption, levying
fines on those who are caught wasting water, adding
a surcharge for those who increase consumption, and
building emergency canals to divert water from more
distant rivers to the city’s other reservoir systems.
22 Lanz, K: Wem gehört das Wasser? Lars Müller Publishers, 2006
23 Lanz, K: Wem gehört das Wasser? Lars Müller Publishers, 2006
24 Den Flüssenden Weg weisen, Neue Zürcher Zeitung, 2006. www.nzz.ch (5.10.2007).
25 The Economist Oct 12, 2013
26 http://www.usbr.gov/lc/region/g4000/hourly/mead-elv.html
27 The Economist, “The drying of the West“ Feb 22, 2014
28 http://noticias.uol.com.br/infograficos/2014/02/14 /veja-quais-sao-os-reservatorios-de-agua- da-grande-sp.htm
29 http://www1.folha.uol.com.br/cotidiano/2015/02/1584 869-alckmin-prepara-pacote -de-oito-obras-para-enfrentar-deserto-de-2015.shtml
Eleven countries accommodating almost half of the world’s population have a negative groundwater balance.
16 • RobecoSAM • Water: the market of the future
2.2 Aging infrastructureIn contrast to many developing countries where many
people still do not have adequate access to safe drink-
ing water, industrialized nations built their water mains
back in the early 20th Century. Water supply and sewer
systems have a service life of roughly 60 to 80 years and
in many cases have reached the end of their useful lives.
In addition, the water mains are not being adequately
maintained in some countries. Therefore, huge invest-
ments are needed in many areas to repair and upgrade
the aging water infrastructure.
• Maintenance standards for US water mains and the
sewer system are far too low. Leaking pipes mean that
large volumes of precious drinking water are wasted.
The United States Geologic Survey (USGS) has esti-
mated that as much as 23 million m3 of water per day
are lost, which is equivalent to the combined water
consumption of America’s 10 biggest cities.
• At the beginning of 2012, The American Water Works
Association released a report indicating that USD 1
trillion will be needed for repairs and expansions to
US water infrastructure over the next 25 years.
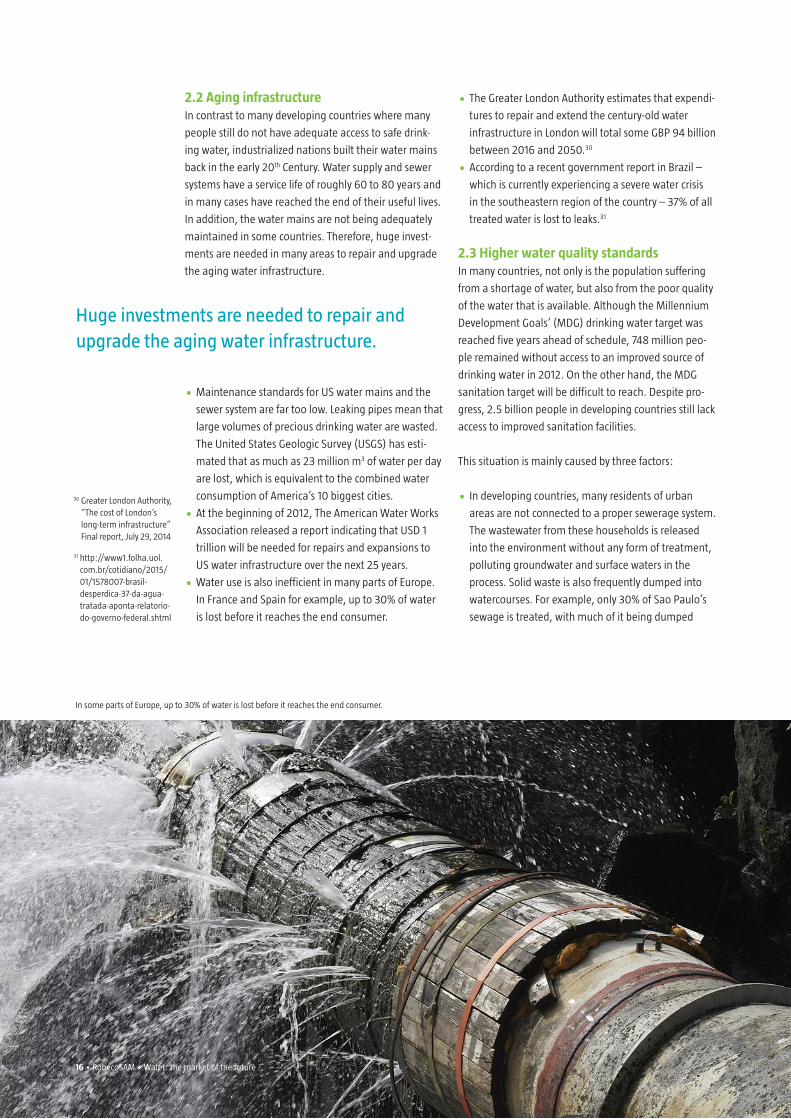
• Water use is also inefficient in many parts of Europe.
In France and Spain for example, up to 30% of water
is lost before it reaches the end consumer.
• The Greater London Authority estimates that expendi-
tures to repair and extend the century-old water
infrastructure in London will total some GBP 94 billion
between 2016 and 2050.30
• According to a recent government report in Brazil –
which is currently experiencing a severe water crisis
in the southeastern region of the country – 37% of all
treated water is lost to leaks.31
2.3 Higher water quality standardsIn many countries, not only is the population suffering
from a shortage of water, but also from the poor quality
of the water that is available. Although the Millennium
Development Goals’ (MDG) drinking water target was
reached five years ahead of schedule, 748 million peo-
ple remained without access to an improved source of
drinking water in 2012. On the other hand, the MDG
sanitation target will be difficult to reach. Despite pro-
gress, 2.5 billion people in developing countries still lack
access to improved sanitation facilities.
This situation is mainly caused by three factors:
• In developing countries, many residents of urban
areas are not connected to a proper sewerage system.
The wastewater from these households is released
into the environment without any form of treatment,
polluting groundwater and surface waters in the
process. Solid waste is also frequently dumped into
watercourses. For example, only 30% of Sao Paulo’s
sewage is treated, with much of it being dumped
30 Greater London Authority, “The cost of London’s long-term infrastructure” Final report, July 29, 2014
31 http://www1.folha.uol. com.br/cotidiano/2015/ 01/1578007-brasil-desperdica-37-da-agua-tratada-aponta-relatorio- do-governo-federal.shtml
Huge investments are needed to repair and upgrade the aging water infrastructure.
16 • RobecoSAM • Water: the market of the future
In some parts of Europe, up to 30% of water is lost before it reaches the end consumer.
RobecoSAM • Water: the market of the future • 17
into local rivers and streams further limiting the avail-
ability of clean water resources. This is a huge missed
opportunity in a region that is currently experiencing
a water crisis, as water recycling and reuse could alle-
viate its water shortage problems.32
• Industrial effluents in many countries are inadequate-
ly treated. For instance, according to China’s land min-
istry, more than half of the groundwater in northern
China is too contaminated to be used in agriculture
or even for bathing.33
• Over the last few decades, farmers have been able
to improve their yields thanks to the increased use
of crop protection agents and fertilizers. However, in
many regions these substances are now contaminat-
ing the water and polluting the groundwater.
The range of potential pollutants is enormous, threat-
ening the environment and human health, and their
impacts are widespread: organic matter decomposing
in the water removes the oxygen that is vital for sus-
taining life, and feces contaminate water with bacteria
and microorganisms that spread disease. The runoff
from over-fertilized fields floods rivers and lakes with
harmful nutrients. Overwatering and excessive ground-
water extraction increases soil salinity. Heavy metals and
toxic compounds from industrial processes contaminate
drinking water. Finally, endocrine active substances can
have a negative impact on any living organisms in the
water.
The lack of adequate sanitation facilities in countries
with poor infrastructure is one of the major causes of
widespread gastrointestinal disorders. Each year, an
estimated 5 million deaths worldwide are caused by
contaminated water. Because cities in these countries are
growing so rapidly, the installation of a comprehensive
sanitation system as typically found in industrialized
nations is not feasible within a reasonable time frame.
Such challenges are sometimes exacerbated by govern-
ments’ budgetary constraints. As a result, simpler, decen-
tralized small-scale solutions to the sanitation problem,
such as the use of septic tanks, are being sought in these
countries.
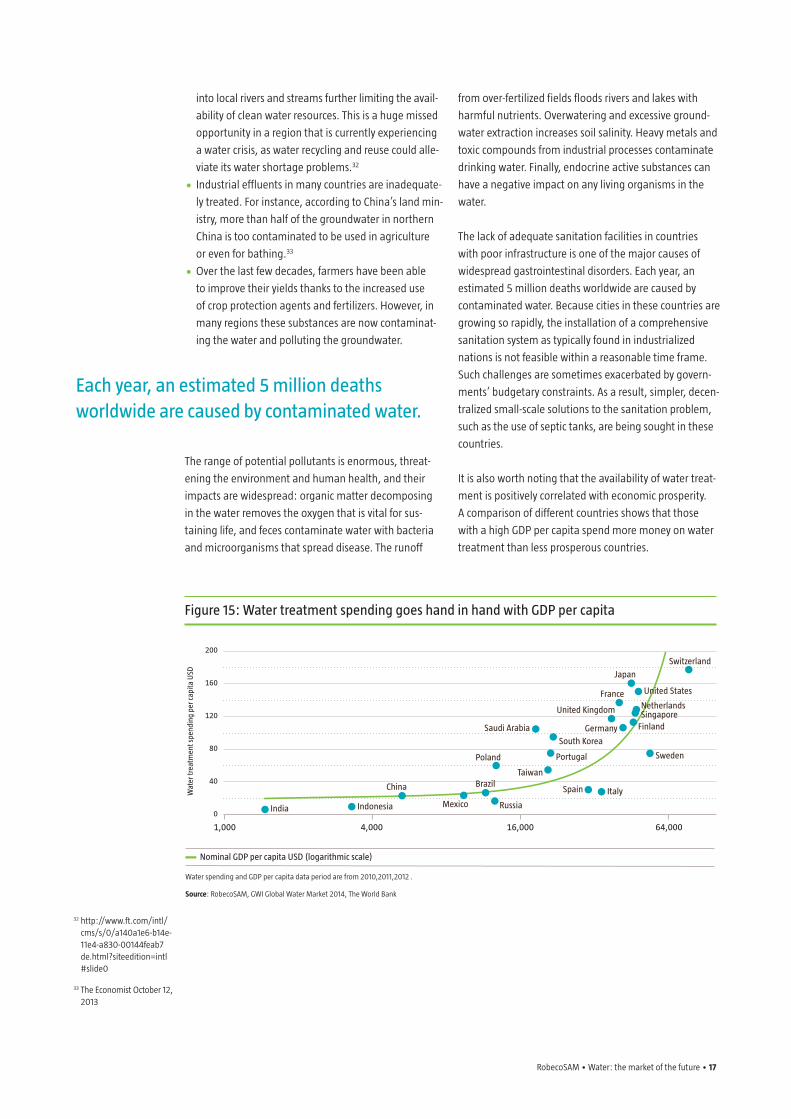
It is also worth noting that the availability of water treat-
ment is positively correlated with economic prosperity.
A comparison of different countries shows that those
with a high GDP per capita spend more money on water
treatment than less prosperous countries.
Each year, an estimated 5 million deaths worldwide are caused by contaminated water.
Figure 15: Water treatment spending goes hand in hand with GDP per capita
Nominal GDP per capita uSD (logarithmic scale)
Water spending and GDP per capita data period are from 2010,2011,2012 .
Source: RobecoSAM, GWI Global Water Market 2014, The World Bank
200
160
120
80
40
0
Wat
er tr
eatm
ent s
pend
ing
per c
apita
uSD
1,000
india
4,000 16,000 64,000
indonesia
china
Poland
mexico
Brazil
russia
taiwan
Portugal
South Korea
Saudi arabia
Spain italy
united Kingdom
Sweden
Germany Finland
Switzerland
Japan
FranceNetherlandsSingapore
united States
32 http://www.ft.com/intl/cms/s/0/a140a1e6-b14e-11e4-a830-00144feab7 de.html?siteedition=intl #slide0
33 The Economist October 12, 2013
18 • RobecoSAM • Water: the market of the future
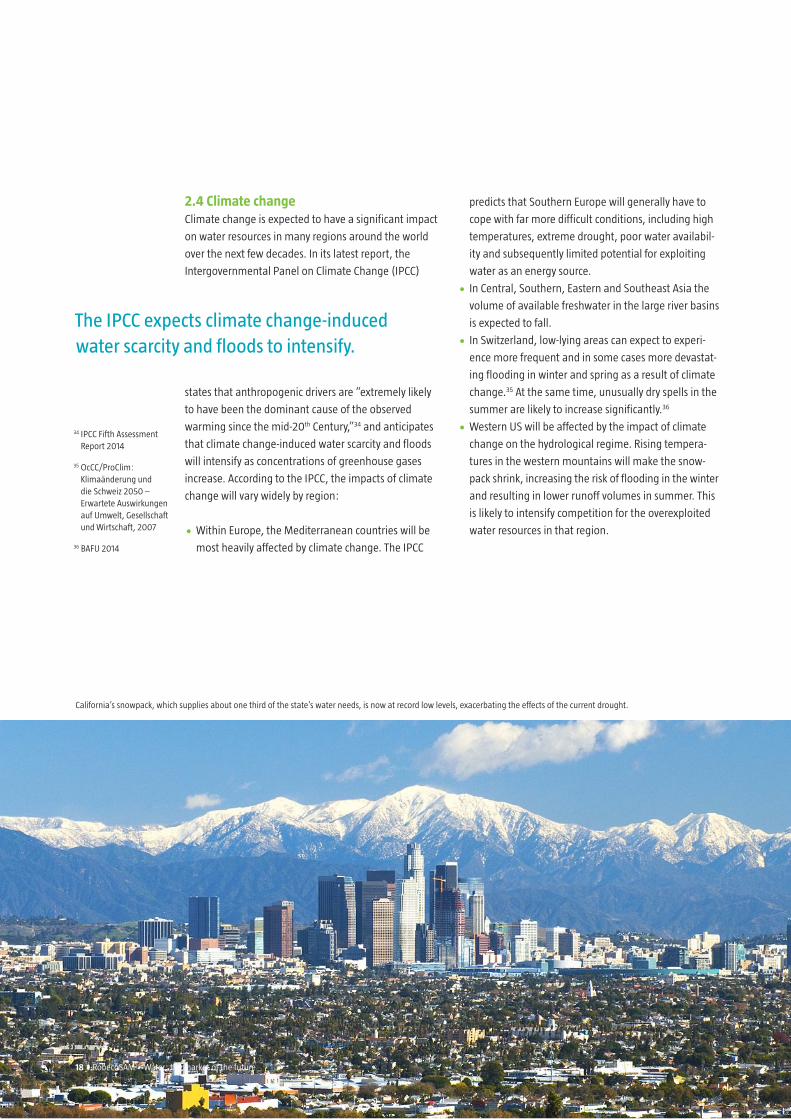
2.4 Climate changeClimate change is expected to have a significant impact
on water resources in many regions around the world
over the next few decades. In its latest report, the
Intergovernmental Panel on Climate Change (IPCC)
states that anthropogenic drivers are “extremely likely
to have been the dominant cause of the observed
warming since the mid-20th Century,”34 and anticipates
that climate change-induced water scarcity and floods
will intensify as concentrations of greenhouse gases
increase. According to the IPCC, the impacts of climate
change will vary widely by region:
• Within Europe, the Mediterranean countries will be
most heavily affected by climate change. The IPCC
predicts that Southern Europe will generally have to
cope with far more difficult conditions, including high
temperatures, extreme drought, poor water availabil-
ity and subsequently limited potential for exploiting
water as an energy source.
• In Central, Southern, Eastern and Southeast Asia the
volume of available freshwater in the large river basins
is expected to fall.
• In Switzerland, low-lying areas can expect to experi-
ence more frequent and in some cases more devastat-
ing flooding in winter and spring as a result of climate
change.35 At the same time, unusually dry spells in the
summer are likely to increase significantly.36
• Western US will be affected by the impact of climate
change on the hydrological regime. Rising tempera-
tures in the western mountains will make the snow-
pack shrink, increasing the risk of flooding in the winter
and resulting in lower runoff volumes in summer. This
is likely to intensify competition for the overexploited
water resources in that region.
34 IPCC Fifth Assessment Report 2014
35 OcCC/ProClim: Klimaänderung und die Schweiz 2050 – Erwartete Auswirkungen auf Umwelt, Gesellschaft und Wirtschaft, 2007
36 BAFU 2014
the iPcc expects climate change-induced water scarcity and floods to intensify.
18 • RobecoSAM • Water: the market of the future
California’s snowpack, which supplies about one third of the state’s water needs, is now at record low levels, exacerbating the effects of the current drought.
RobecoSAM • Water: the market of the future • 19
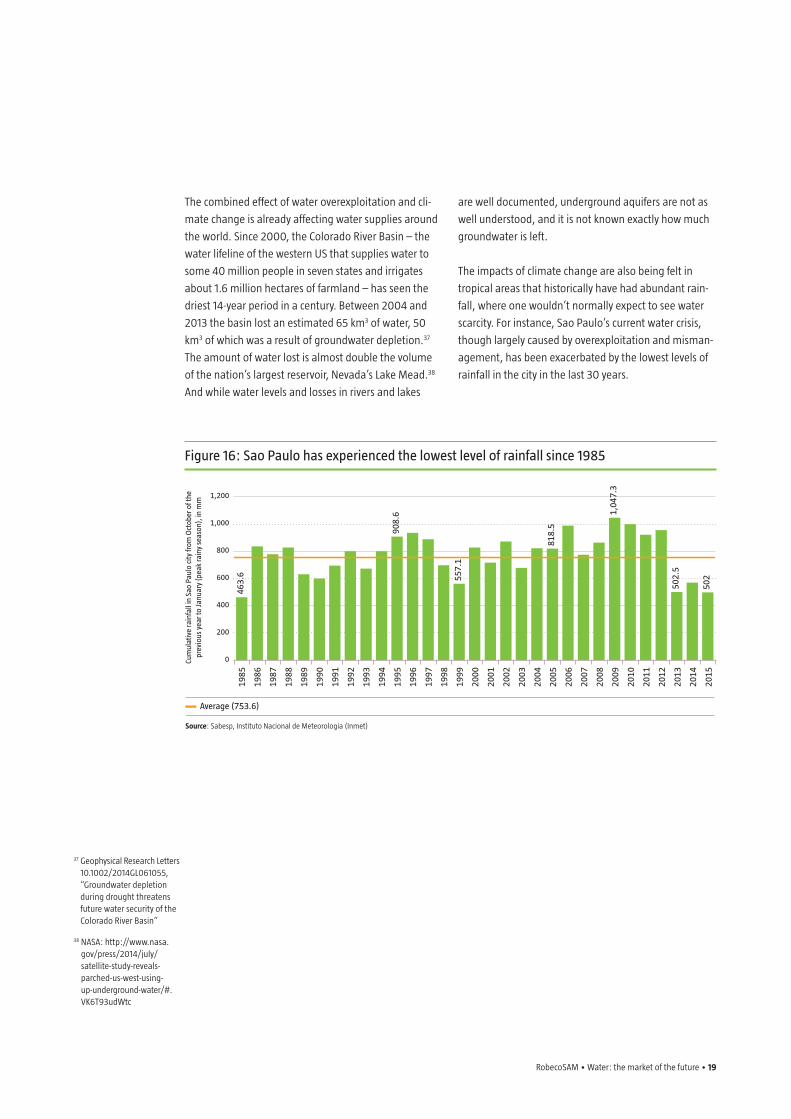
Figure 16: Sao Paulo has experienced the lowest level of rainfall since 1985
average (753.6)
Source: Sabesp, Instituto Nacional de Meteorologia (Inmet)
1,200
1,000
800
600
400
200
0cum
ulat
ive
rain
fall
in S
ao P
aulo
city
from
Oct
ober
of t
he
prev
ious
yea
r to
Janu
ary
(pea
k ra
iny
seas
on),
in m
m
1985
1986
1987
1988
1989
1990
1991
1992
1993
1994
1995
1996
1997
1998
1999
2000
2001
2002
2003
2004
2005
2006
2007
2008
2009
2010
2011
2012
2013
2014
2015
463.
6
908.
6
557.
1
818.
5
1,04
7.3
502.
5
502
The combined effect of water overexploitation and cli-
mate change is already affecting water supplies around
the world. Since 2000, the Colorado River Basin – the
water lifeline of the western US that supplies water to
some 40 million people in seven states and irrigates
about 1.6 million hectares of farmland – has seen the
driest 14-year period in a century. Between 2004 and
2013 the basin lost an estimated 65 km3 of water, 50
km3 of which was a result of groundwater depletion.37
The amount of water lost is almost double the volume
of the nation’s largest reservoir, Nevada’s Lake Mead.38
And while water levels and losses in rivers and lakes
are well documented, underground aquifers are not as
well understood, and it is not known exactly how much
groundwater is left.
The impacts of climate change are also being felt in
tropical areas that historically have had abundant rain-
fall, where one wouldn’t normally expect to see water
scarcity. For instance, Sao Paulo’s current water crisis,
though largely caused by overexploitation and misman-
agement, has been exacerbated by the lowest levels of
rainfall in the city in the last 30 years.
37 Geophysical Research Letters 10.1002/2014GL061055, “Groundwater depletion during drought threatens future water security of the Colorado River Basin”
38 NASA: http://www.nasa.gov/press/2014/july/satellite-study-reveals-parched-us-west-using-up-underground-water/#.VK6T93udWtc

20 • RobecoSAM • Water: the market of the future
3. Global water market: current environment supports growth
The global water market to rebound following the
economic slowdown
Recent estimates put the size of the global water market
at about USD 591 billion in 2014. This includes USD 203
billion from municipal capital expenditure, USD 317 bil-
lion from municipal operating expenditure, USD 1 billion
from industrial capital expenditure, USD 37 billion from
industrial operating expenditure, USD 12 billion from
point of use treatment and USD 3.7 billion from irriga-
tion. Market opportunities related to the water sector
are expected to reach USD 1 trillion by 2025.39
Over the last few years, the economic downturn has led
to weak residential and commercial construction mar-
kets, delays in large infrastructure projects and a decline
in industrial production. Public financing for infrastruc-
ture maintenance and upgrades was temporarily post-
poned due to budget constraints. As consumers faced the
prospect of unemployment, it was also politically difficult
to raise water tariffs to cover much needed infrastructure
investments, resulting in a decrease in water expenditure
growth.
Despite the economic slowdown, various factors support
continued growth in the water market. Governments and
utilities are recognizing that an appropriate level of tariffs
is required to expand and maintain water and wastewater
infrastructure to guarantee a sufficient and safe water
supply, while ensuring adequate services and profitability.
At the same time, the increasing rate of private sector
participation in providing funding for infrastructure, tech-
nology and expertise is also supporting growth in the
water sector. Most importantly, water scarcity and increas-
ing pressure on limited global water resources remain the
secular drivers of growth in the water sector. As a result,
growth in water expenditures is expected to rebound at
an expected CAGR of 5-6% over the next 5 years.40
Figure 17: Global water market
Point of use equipment irrigation equipment industry operating expenditure
industry capital expenditure utility operating expenditure utility capital expenditure
Source: GWI, RobecoSAM
800
700
600
500
400
300
200
100
0
in u
SD b
illio
n
2014 2015 2016 2017 2018
39 GWI, RobecoSAM
40 RobecoSAM and GWI 2014
Water scarcity and increasing pressure on limited global water resources remain the secular drivers of growth in the water sector.
RobecoSAM • Water: the market of the future • 21
3.1 Government initiatives Some countries have continued to invest in water
infrastructure projects and have incorporated environ-
mental spending into stimulus packages despite the
economic downturn. The Chinese government, for
instance, has doubled the amount it is committing to
environmental protection in the 12th Five-Year Plan (2011
to 2015). About USD 110 billion per year are earmarked
for environmental protection and pollution control,
including a significant proportion for wastewater and
solid waste treatment. This amount represents almost
1-2% of China’s projected 5-year GDP. It is expected that
China still needs to invest similar amount or even higher
beyond the 12th Five-Year Plan in order to address its
water issues.
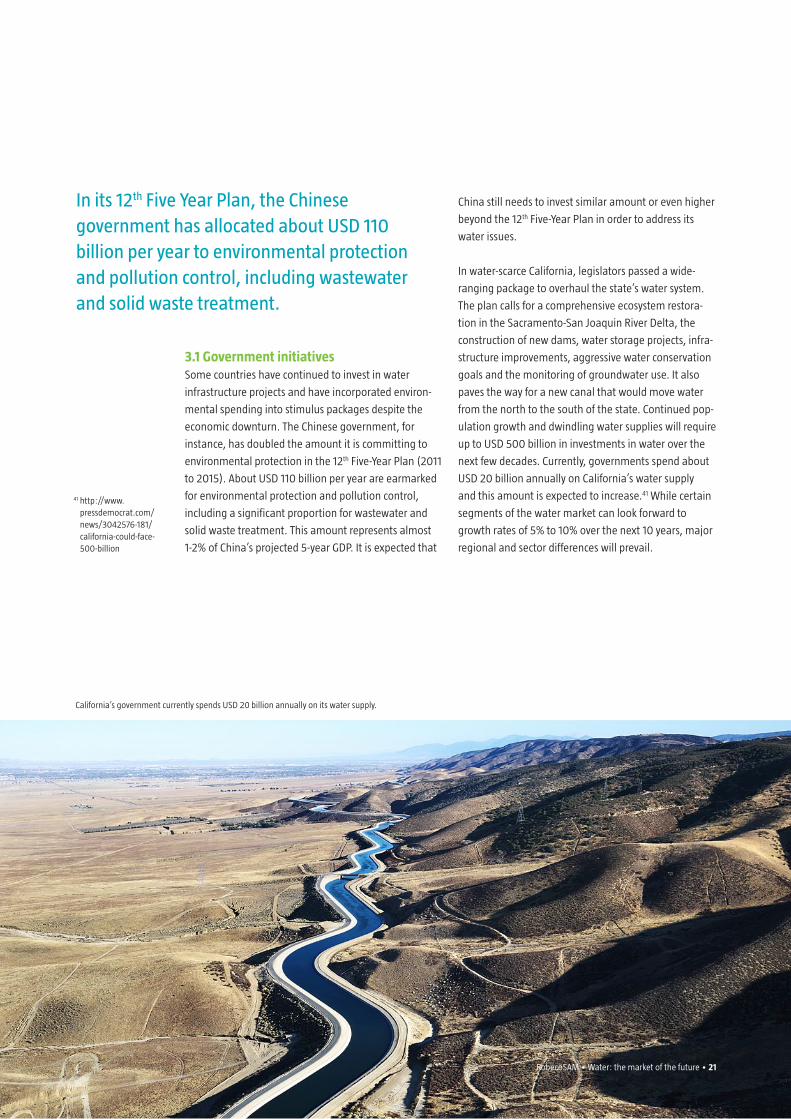
In water-scarce California, legislators passed a wide-
ranging package to overhaul the state’s water system.
The plan calls for a comprehensive ecosystem restora-
tion in the Sacramento-San Joaquin River Delta, the
construction of new dams, water storage projects, infra-
structure improvements, aggressive water conservation
goals and the monitoring of groundwater use. It also
paves the way for a new canal that would move water
from the north to the south of the state. Continued pop-
ulation growth and dwindling water supplies will require
up to USD 500 billion in investments in water over the
next few decades. Currently, governments spend about
USD 20 billion annually on California’s water supply
and this amount is expected to increase.41 While certain
segments of the water market can look forward to
growth rates of 5% to 10% over the next 10 years, major
regional and sector differences will prevail.
41 http://www.pressdemocrat.com/news/3042576-181/california-could-face- 500-billion
in its 12th Five year Plan, the chinese government has allocated about uSD 110 billion per year to environmental protection and pollution control, including wastewater and solid waste treatment.
California’s government currently spends USD 20 billion annually on its water supply.
RobecoSAM • Water: the market of the future • 21
22 • RobecoSAM • Water: the market of the future
Globally, about 14% of the world’s population is served by private operators that provide drinking water and wastewater treatment services.
3.2 Consolidation and privatization
Consolidation of the water industry opens up
opportunities for private service providers
The water industry is very fragmented and, over the last
few decades, has seen a flurry of privatization and con-
solidation, which is expected to continue. Up until 1994,
most private sector participation activity took place
within OECD countries. Since then, activity in developed
markets has eased and the emerging countries are tak-
ing over as the powerhouse behind privatization. For
instance in China, currently about 32% of the municipal
water market is served by the private sector compared to
only 4.4% in 1998.42
The operating model and ownership structure of water
utilities also varies across regions. In most countries,
public authorities or state-owned organizations are
responsible for the drinking water supply and wastewa-
ter treatment while in some countries, these services
have been privatized or organized as public-private
partnership (PPPs). In the UK, privatization starting in
1989 has resulted in 10 large investor-owned water utili-
ties, representing more than 85% of the country’s total
systems.43 But in the US, only 16% of the water systems
are investor-owned and the vast majority is owned by
the local municipality or government. And some nations
such as France operate most of their waterworks through
PPPs. Globally, local authorities are increasingly opting
for integrated solutions along the lines of PPP models.
In recent years, the number of people whose drinking
water and wastewater services are provided by private
companies has increased. Globally, about 14% of the
world’s population is served by private operators that
provide drinking water and wastewater treatment ser-
vices, and this figure is expected to rise to 21% by 2025.44
In Western Europe, 47% of the population is served by
the private sector, about 23% in North America and
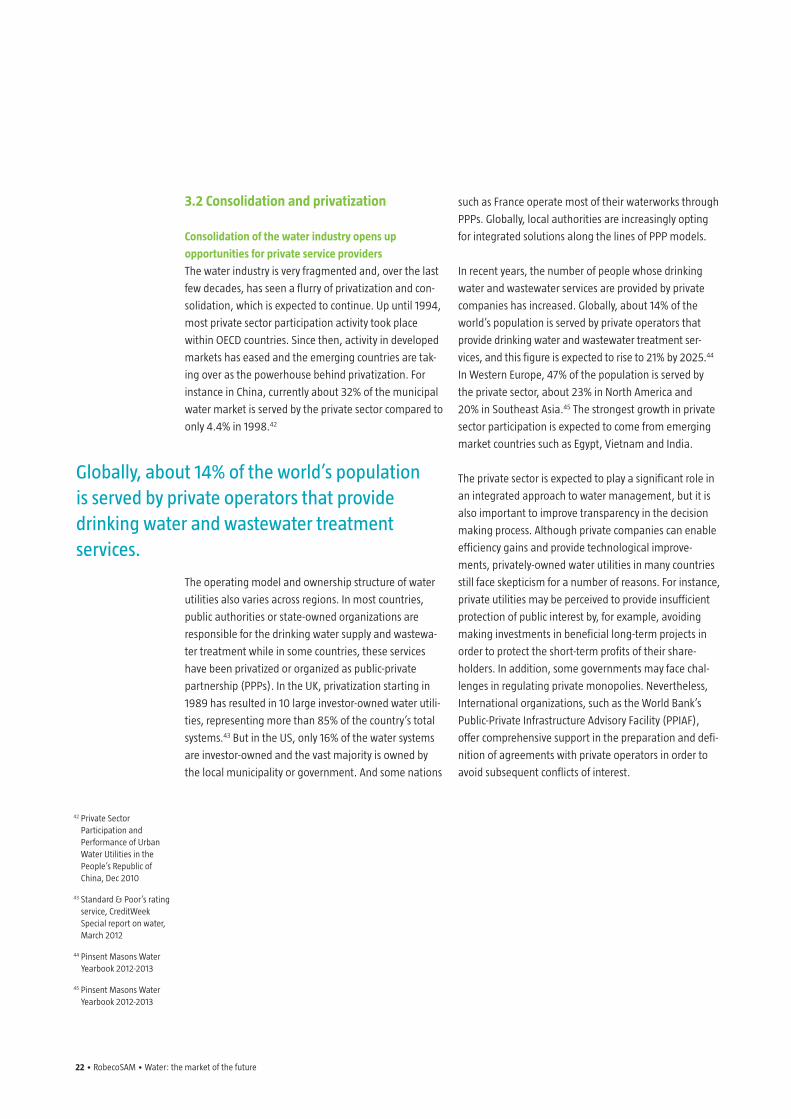
20% in Southeast Asia.45 The strongest growth in private
sector participation is expected to come from emerging
market countries such as Egypt, Vietnam and India.
The private sector is expected to play a significant role in
an integrated approach to water management, but it is
also important to improve transparency in the decision
making process. Although private companies can enable
efficiency gains and provide technological improve-
ments, privately-owned water utilities in many countries
still face skepticism for a number of reasons. For instance,
private utilities may be perceived to provide insufficient
protection of public interest by, for example, avoiding
making investments in beneficial long-term projects in
order to protect the short-term profits of their share-
holders. In addition, some governments may face chal-
lenges in regulating private monopolies. Nevertheless,
International organizations, such as the World Bank’s
Public-Private Infrastructure Advisory Facility (PPIAF),
offer comprehensive support in the preparation and defi-
nition of agreements with private operators in order to
avoid subsequent conflicts of interest.
42 Private Sector Participation and Performance of Urban Water Utilities in the People’s Republic of China, Dec 2010
43 Standard & Poor’s rating service, CreditWeek Special report on water, March 2012
44 Pinsent Masons Water Yearbook 2012-2013
45 Pinsent Masons Water Yearbook 2012-2013
RobecoSAM • Water: the market of the future • 23
Top 5 markets by compound annual growth rate CAGR 2014-2020
Egypt 56%
vietnam 30%
india 21%
canada 19%
Saudi arabia 16%
Opportunities exist for companies to establish themselves as private operators, particularly in the Middle East and Asia
Source: Global Water Intelligence, December 2014, Volume 15
Figure 18: Private sector participation in water
3.3 Water tariffs
Increasing water tariffs support infrastructure
investments
Water tariffs are essential to ensuring that utilities can
cover the costs of providing a service, as well as raising
enough funds to expand and upgrade the existing water
distribution infrastructure. They are also an important
mechanism to encourage consumers to use water more
conscientiously. If water prices are too low, consumers
will use too much water. Where poverty and affordability
are an issue, water tariffs can take the form of a tiered
pricing system. This enables water provision at very low
prices to cover basic household needs, typically 30-50
liters per person per day, but acts as a deterrent to over-
use. Tiered pricing schemes have been successfully imple-
mented in Israel, Australia, Hong Kong, Japan, Korea and
parts of the US.
The need to upgrade an aging infrastructure and build
new infrastructure is intensifying. This, coupled with the
pressure for higher water standards, is driving signifi-
cant capital requirements. But fiscal constraints limiting
central government expenditures mean that something
has to give: water tariffs in some regions must rise.
Although most utilities encounter problems in raising
tariffs to cover costs, the price of water has increased in
many places around the globe recently. Global average
combined water tariffs rose 4.3% in 2014, following a
3.7% increase in 2013. Water tariffs have been outstrip-
ping inflation over the past years. In the US, the price of
water and wastewater services increased by 7% in 2014,
against 1.7% inflation.
Water tariffs are essential to ensuring that utilities can cover the costs of providing a service, as well as raising enough funds to expand and upgrade the existing water distribution infrastructure.
24 • RobecoSAM • Water: the market of the future
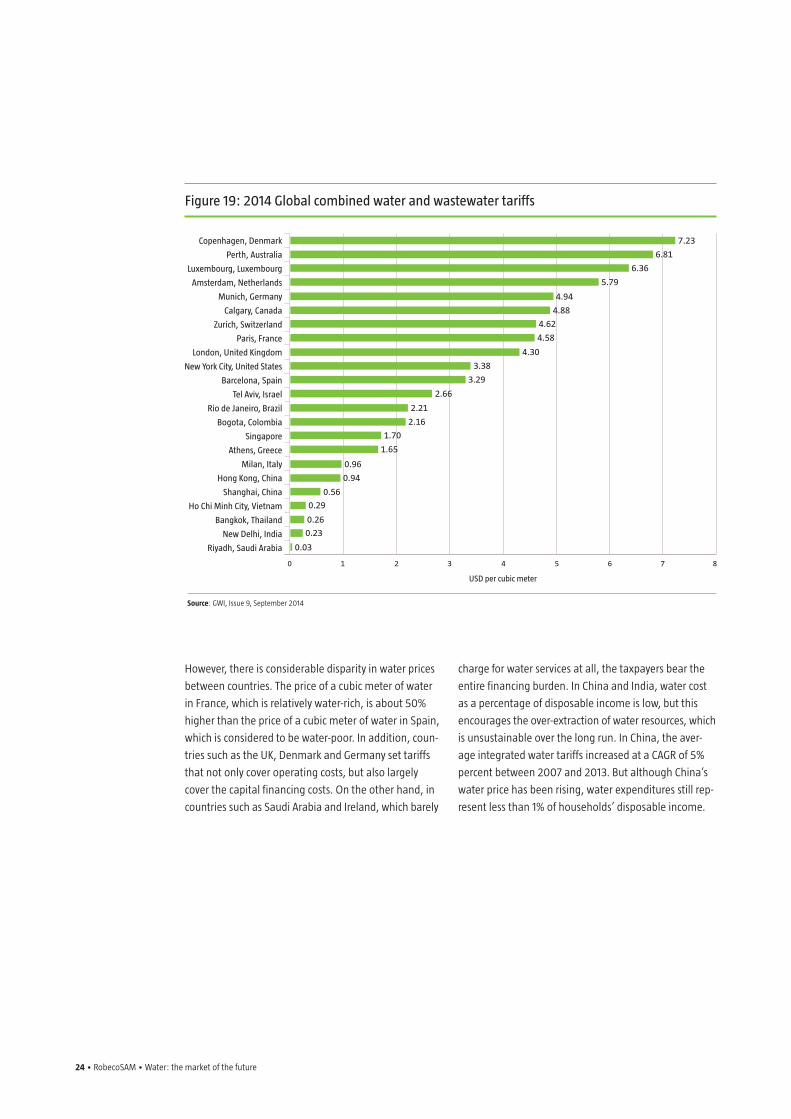
Figure 19: 2014 Global combined water and wastewater tariffs
Source: GWI, Issue 9, September 2014
copenhagen, Denmark
Perth, australia
Luxembourg, Luxembourg
amsterdam, Netherlands
munich, Germany
calgary, canada
Zurich, Switzerland
Paris, France
London, united Kingdom
New york city, united States
Barcelona, Spain
tel aviv, israel
rio de Janeiro, Brazil
Bogota, colombia
Singapore
athens, Greece
milan, italy
Hong Kong, china
Shanghai, china
Ho chi minh city, vietnam
Bangkok, thailand
New Delhi, india
riyadh, Saudi arabia
0
uSD per cubic meter
1 2 3 4 5 86 7
7.23
6.81
6.36
5.79
4.94
4.88
4.62
4.58
4.30
3.38
3.29
2.66
2.21
2.16
1.70
1.65
0.96
0.94
0.56
0.29
0.26
0.23
0.03
However, there is considerable disparity in water prices
between countries. The price of a cubic meter of water
in France, which is relatively water-rich, is about 50%
higher than the price of a cubic meter of water in Spain,
which is considered to be water-poor. In addition, coun-
tries such as the UK, Denmark and Germany set tariffs
that not only cover operating costs, but also largely
cover the capital financing costs. On the other hand, in
countries such as Saudi Arabia and Ireland, which barely
charge for water services at all, the taxpayers bear the
entire financing burden. In China and India, water cost
as a percentage of disposable income is low, but this
encourages the over-extraction of water resources, which
is unsustainable over the long run. In China, the aver-
age integrated water tariffs increased at a CAGR of 5%
percent between 2007 and 2013. But although China’s
water price has been rising, water expenditures still rep-
resent less than 1% of households’ disposable income.
RobecoSAM • Water: the market of the future • 25
4. Investment opportunities
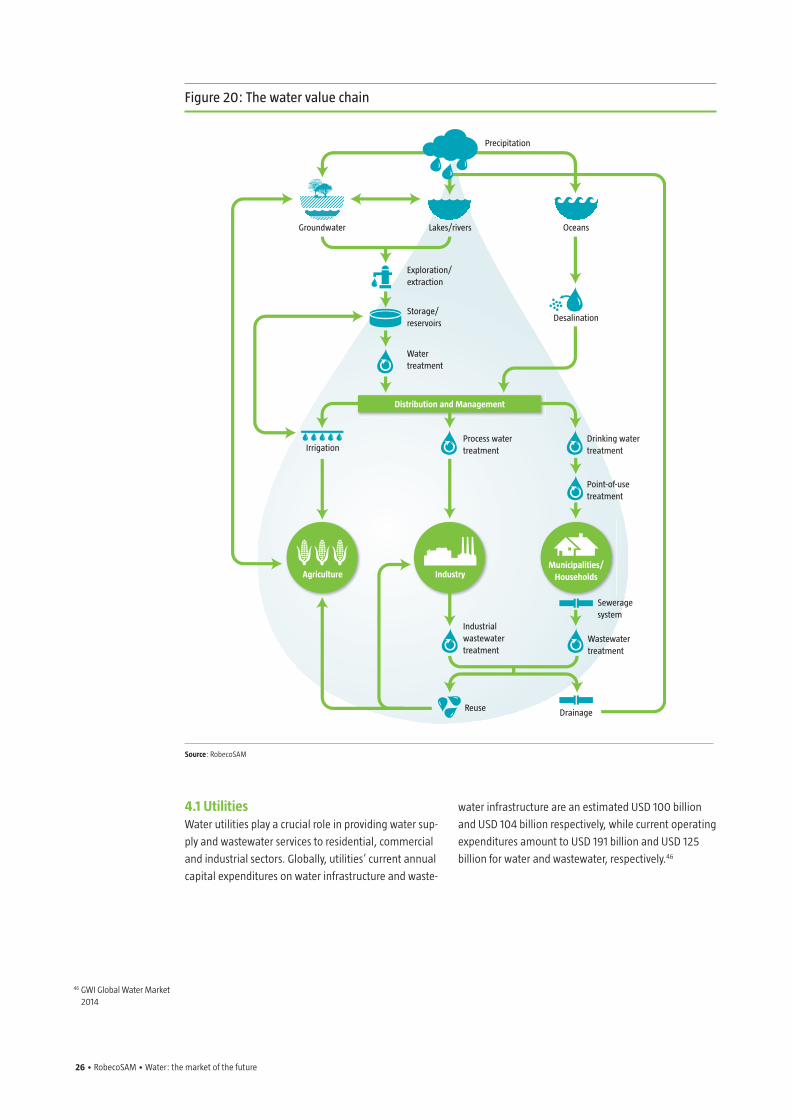
A successful investment strategy focusing on water is
based on three key principles: it complies with the basic
principles of sustainability, it adheres to a set of general
investment principles, and it looks at the entire water
value chain to identify companies providing solutions
to the water crisis. The water value chain encompasses
a broad range of activities. It starts upstream at the
water source with the exploration, extraction, disinfec-
tion and distribution of water to end consumers, and
flows downstream to wastewater collection, treatment
and discharge back into the waterways. The water value
chain also comprises activities such as protecting against
natural disasters, measuring the volume of water sold,
reusing greywater for other purposes and providing sus-
tainable waste management solutions to protect water
resources.
Despite the various challenges surrounding the use of water resources, human ingenuity, innovation and market forces have generally led to innovation and the development of technologies to overcome the challenges related to the availability and quality of water.
Based on our proprietary calculations using historical data, we have defined four investment clusters based on
their equity market volatility and beta characteristics.
1. Utilities
Utilities that supply water and provide wastewater services to residential, commercial and industrial sectors.
2. Capital Goods & Chemicals
Companies that manufacture water equipment such as valves, pumps, integrated water treatment systems,
water treatment chemicals, and irrigation systems across the entire water value chain.
3. Construction & Materials
Companies that build infrastructure such as water networks, pipelines, water channels, reservoirs and
treatment plants, or install water meters, which are often linked to commercial, municipal and infrastructure
construction projects.
4. Quality & Analytics
Companies that develop and sell products and services linked to water quality monitoring and testing,
systems to treat water at its point of use, and water resource protection.
26 • RobecoSAM • Water: the market of the future
Figure 20: the water value chain
Precipitation
Distribution and Management
Process watertreatment
Groundwater Lakes/rivers
Industry
Reuse
Industrialwastewatertreatment
Oceans
Desalination
Municipalities/Households
Drinking watertreatment
Point-of-usetreatment
Seweragesystem
Wastewatertreatment
Drainage
Exploration/extraction
Storage/reservoirs
Watertreatment
Irrigation
Agriculture
Source: RobecoSAM
4.1 UtilitiesWater utilities play a crucial role in providing water sup-
ply and wastewater services to residential, commercial
and industrial sectors. Globally, utilities’ current annual
capital expenditures on water infrastructure and waste-
water infrastructure are an estimated USD 100 billion
and USD 104 billion respectively, while current operating
expenditures amount to USD 191 billion and USD 125
billion for water and wastewater, respectively.46
46 GWI Global Water Market 2014
RobecoSAM • Water: the market of the future • 27
Water Utilities Expected annual growthRegional overview CAGR 2014-2018
asia ex-Japan 10.1%
central, South america & caribbean 5.7%
uSa & canada 4.4%
Eastern Europe 5.5%
Western Europe 2.7%
middle East / africa 13.2%
Source: GWI Global Water Market 2014; RobecoSAM
Figure 21: Water utilities
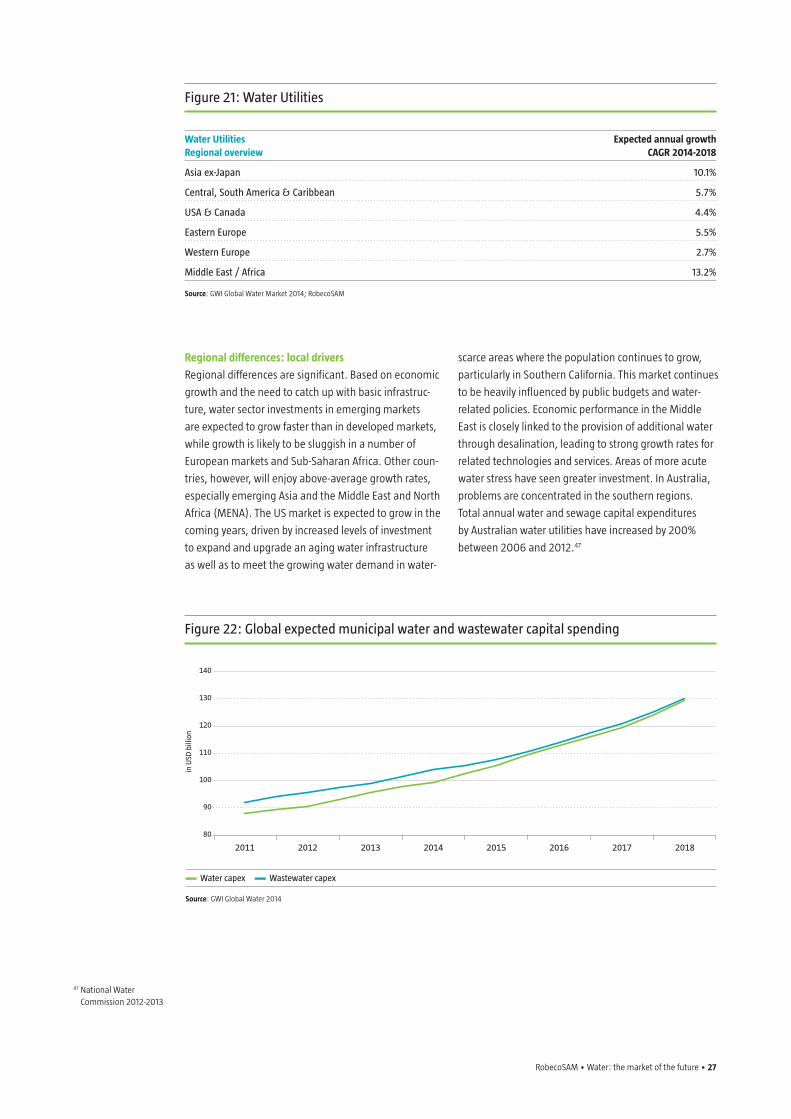
Regional differences: local drivers
Regional differences are significant. Based on economic
growth and the need to catch up with basic infrastruc-
ture, water sector investments in emerging markets
are expected to grow faster than in developed markets,
while growth is likely to be sluggish in a number of
European markets and Sub-Saharan Africa. Other coun-
tries, however, will enjoy above-average growth rates,
especially emerging Asia and the Middle East and North
Africa (MENA). The US market is expected to grow in the
coming years, driven by increased levels of investment
to expand and upgrade an aging water infrastructure
as well as to meet the growing water demand in water-
scarce areas where the population continues to grow,
particularly in Southern California. This market continues
to be heavily influenced by public budgets and water-
related policies. Economic performance in the Middle
East is closely linked to the provision of additional water
through desalination, leading to strong growth rates for
related technologies and services. Areas of more acute
water stress have seen greater investment. In Australia,
problems are concentrated in the southern regions.
Total annual water and sewage capital expenditures
by Australian water utilities have increased by 200%
between 2006 and 2012.47
47 National Water Commission 2012-2013
Figure 22: Global expected municipal water and wastewater capital spending
Water capex Wastewater capex
Source: GWI Global Water 2014
140
130
120
110
100
90
80
in u
SD b
illio
n
2011 2012 2013 2014 2015 2016 2017 2018
28 • RobecoSAM • Water: the market of the future
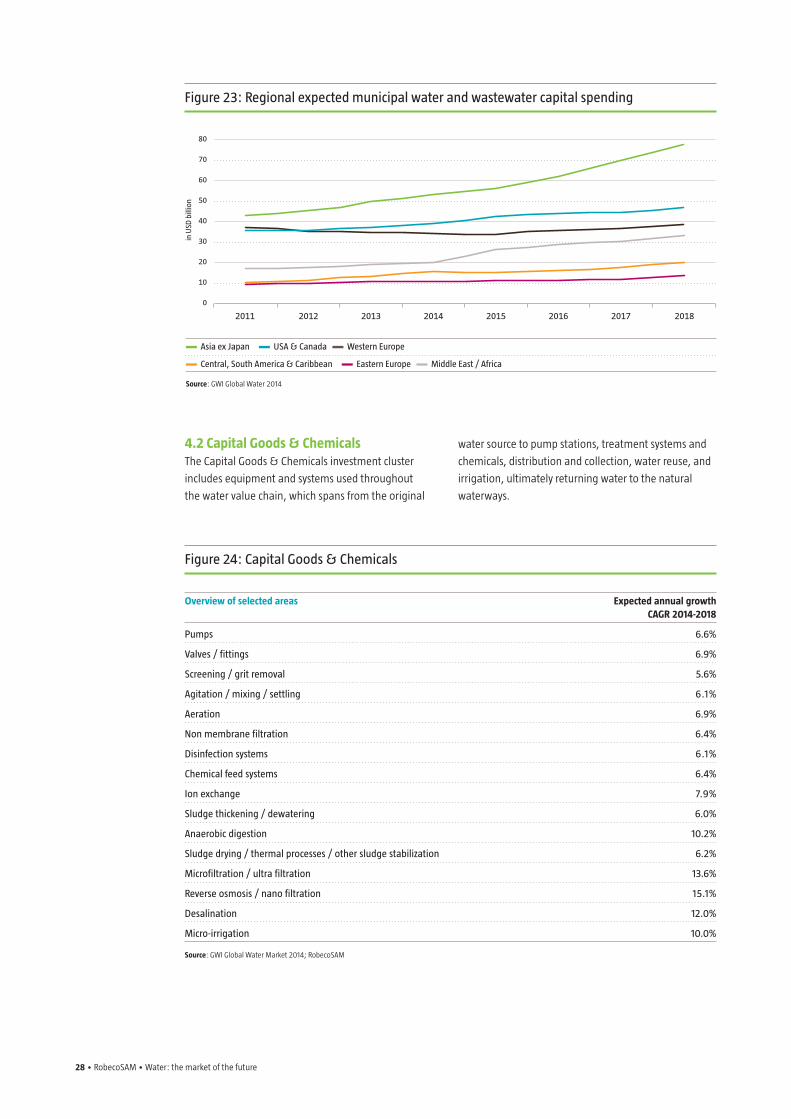
4.2 Capital Goods & ChemicalsThe Capital Goods & Chemicals investment cluster
includes equipment and systems used throughout
the water value chain, which spans from the original
water source to pump stations, treatment systems and
chemicals, distribution and collection, water reuse, and
irrigation, ultimately returning water to the natural
waterways.
asia ex Japan uSa & canada Western Europe
central, South america & caribbean Eastern Europe middle East / africa
Source: GWI Global Water 2014
Figure 23: regional expected municipal water and wastewater capital spending
80
70
60
50
40
30
20
10
0
in u
SD b
illio
n
2011 2012 2013 2014 2015 2016 2017 2018
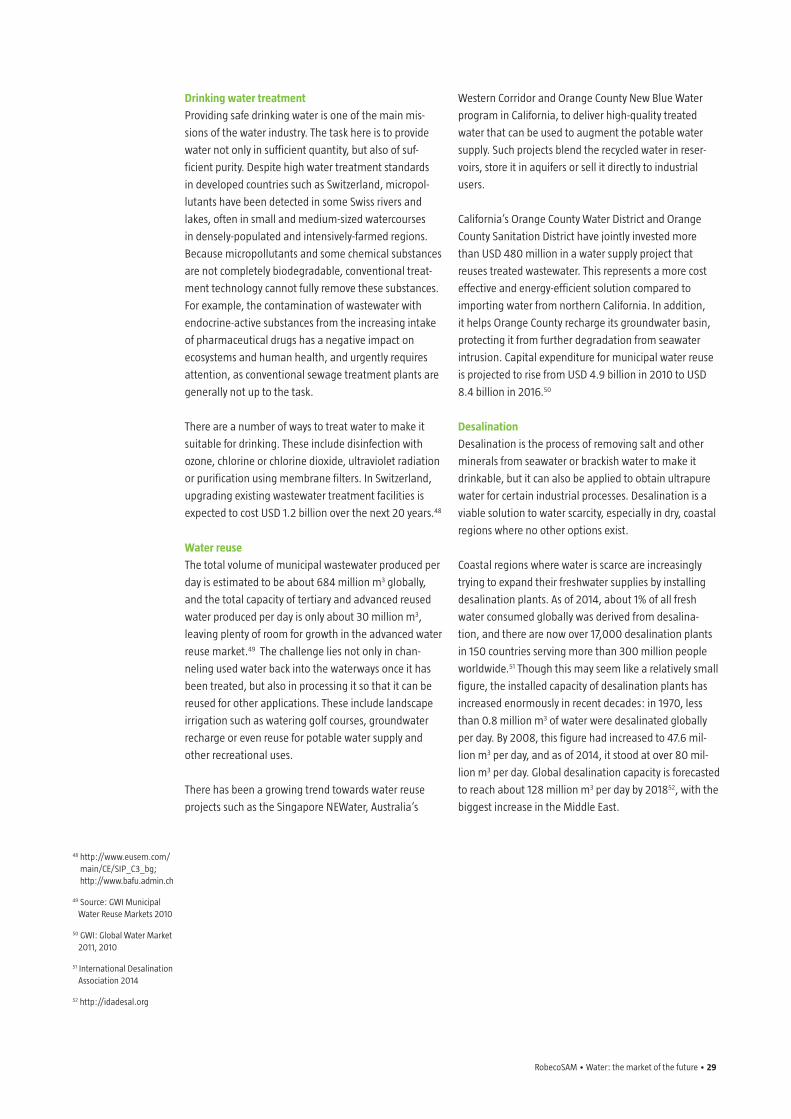
Figure 24: capital Goods & chemicals
Overview of selected areas Expected annual growth CAGR 2014-2018
Pumps 6.6%
valves / fittings 6.9%
Screening / grit removal 5.6%
agitation / mixing / settling 6.1%
aeration 6.9%
Non membrane filtration 6.4%
Disinfection systems 6.1%
chemical feed systems 6.4%
ion exchange 7.9%
Sludge thickening / dewatering 6.0%
anaerobic digestion 10.2%
Sludge drying / thermal processes / other sludge stabilization 6.2%
microfiltration / ultra filtration 13.6%
reverse osmosis / nano filtration 15.1%
Desalination 12.0%
micro-irrigation 10.0%
Source: GWI Global Water Market 2014; RobecoSAM
RobecoSAM • Water: the market of the future • 29
Drinking water treatment
Providing safe drinking water is one of the main mis-
sions of the water industry. The task here is to provide
water not only in sufficient quantity, but also of suf-
ficient purity. Despite high water treatment standards
in developed countries such as Switzerland, micropol-
lutants have been detected in some Swiss rivers and
lakes, often in small and medium-sized watercourses
in densely-populated and intensively-farmed regions.
Because micropollutants and some chemical substances
are not completely biodegradable, conventional treat-
ment technology cannot fully remove these substances.
For example, the contamination of wastewater with
endocrine-active substances from the increasing intake
of pharmaceutical drugs has a negative impact on
ecosystems and human health, and urgently requires
attention, as conventional sewage treatment plants are
generally not up to the task.
There are a number of ways to treat water to make it
suitable for drinking. These include disinfection with
ozone, chlorine or chlorine dioxide, ultraviolet radiation
or purification using membrane filters. In Switzerland,
upgrading existing wastewater treatment facilities is
expected to cost USD 1.2 billion over the next 20 years.48
Water reuse
The total volume of municipal wastewater produced per
day is estimated to be about 684 million m3 globally,
and the total capacity of tertiary and advanced reused
water produced per day is only about 30 million m3,
leaving plenty of room for growth in the advanced water
reuse market.49 The challenge lies not only in chan-
neling used water back into the waterways once it has
been treated, but also in processing it so that it can be
reused for other applications. These include landscape
irrigation such as watering golf courses, groundwater
recharge or even reuse for potable water supply and
other recreational uses.
There has been a growing trend towards water reuse
projects such as the Singapore NEWater, Australia‘s
Western Corridor and Orange County New Blue Water
program in California, to deliver high-quality treated
water that can be used to augment the potable water
supply. Such projects blend the recycled water in reser-
voirs, store it in aquifers or sell it directly to industrial
users.
California’s Orange County Water District and Orange
County Sanitation District have jointly invested more
than USD 480 million in a water supply project that
reuses treated wastewater. This represents a more cost
effective and energy-efficient solution compared to
importing water from northern California. In addition,
it helps Orange County recharge its groundwater basin,
protecting it from further degradation from seawater
intrusion. Capital expenditure for municipal water reuse
is projected to rise from USD 4.9 billion in 2010 to USD
8.4 billion in 2016.50
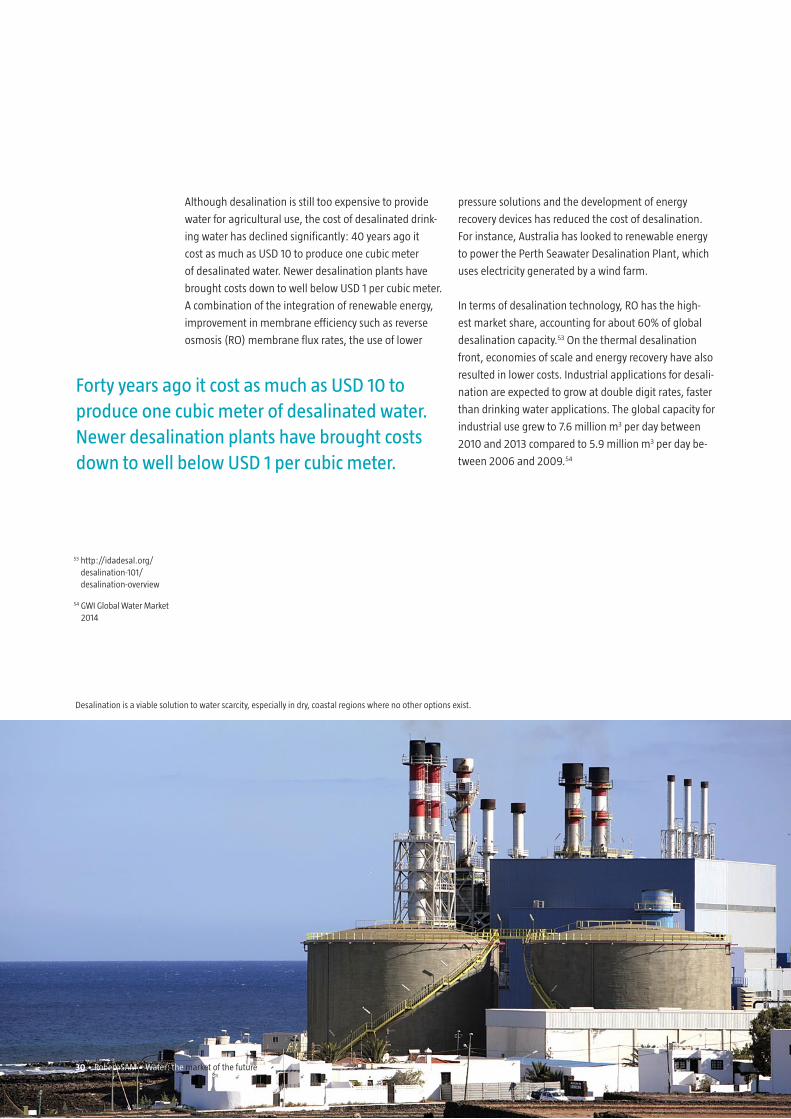
Desalination
Desalination is the process of removing salt and other
minerals from seawater or brackish water to make it
drinkable, but it can also be applied to obtain ultrapure
water for certain industrial processes. Desalination is a
viable solution to water scarcity, especially in dry, coastal
regions where no other options exist.
Coastal regions where water is scarce are increasingly
trying to expand their freshwater supplies by installing
desalination plants. As of 2014, about 1% of all fresh
water consumed globally was derived from desalina-
tion, and there are now over 17,000 desalination plants
in 150 countries serving more than 300 million people
worldwide.51 Though this may seem like a relatively small
figure, the installed capacity of desalination plants has
increased enormously in recent decades: in 1970, less
than 0.8 million m3 of water were desalinated globally
per day. By 2008, this figure had increased to 47.6 mil-
lion m3 per day, and as of 2014, it stood at over 80 mil-
lion m3 per day. Global desalination capacity is forecasted
to reach about 128 million m3 per day by 201852, with the
biggest increase in the Middle East.
48 http://www.eusem.com/main/CE/SIP_C3_bg; http://www.bafu.admin.ch
49 Source: GWI Municipal Water Reuse Markets 2010
50 GWI: Global Water Market 2011, 2010
51 International Desalination Association 2014
52 http://idadesal.org
30 • RobecoSAM • Water: the market of the future
Although desalination is still too expensive to provide
water for agricultural use, the cost of desalinated drink-
ing water has declined significantly: 40 years ago it
cost as much as USD 10 to produce one cubic meter
of desalinated water. Newer desalination plants have
brought costs down to well below USD 1 per cubic meter.
A combination of the integration of renewable energy,
improvement in membrane efficiency such as reverse
osmosis (RO) membrane flux rates, the use of lower
pressure solutions and the development of energy
recovery devices has reduced the cost of desalination.
For instance, Australia has looked to renewable energy
to power the Perth Seawater Desalination Plant, which
uses electricity generated by a wind farm.
In terms of desalination technology, RO has the high-
est market share, accounting for about 60% of global
desalination capacity.53 On the thermal desalination
front, economies of scale and energy recovery have also
resulted in lower costs. Industrial applications for desali-
nation are expected to grow at double digit rates, faster
than drinking water applications. The global capacity for
industrial use grew to 7.6 million m3 per day between
2010 and 2013 compared to 5.9 million m3 per day be-
tween 2006 and 2009.54
Desalination is a viable solution to water scarcity, especially in dry, coastal regions where no other options exist.
Forty years ago it cost as much as uSD 10 to produce one cubic meter of desalinated water. Newer desalination plants have brought costs down to well below uSD 1 per cubic meter.
30 • RobecoSAM • Water: the market of the future
53 http://idadesal.org/desalination-101/desalination-overview
54 GWI Global Water Market 2014
RobecoSAM • Water: the market of the future • 31
55 BCC Research. Ballast Water Treatment: Technologies and global market, November 2013
56 http://globallast.imo.org/Monograph_18_NBWMS_Guidelines_web.pdf
57 GWI, Global Water Market 2014
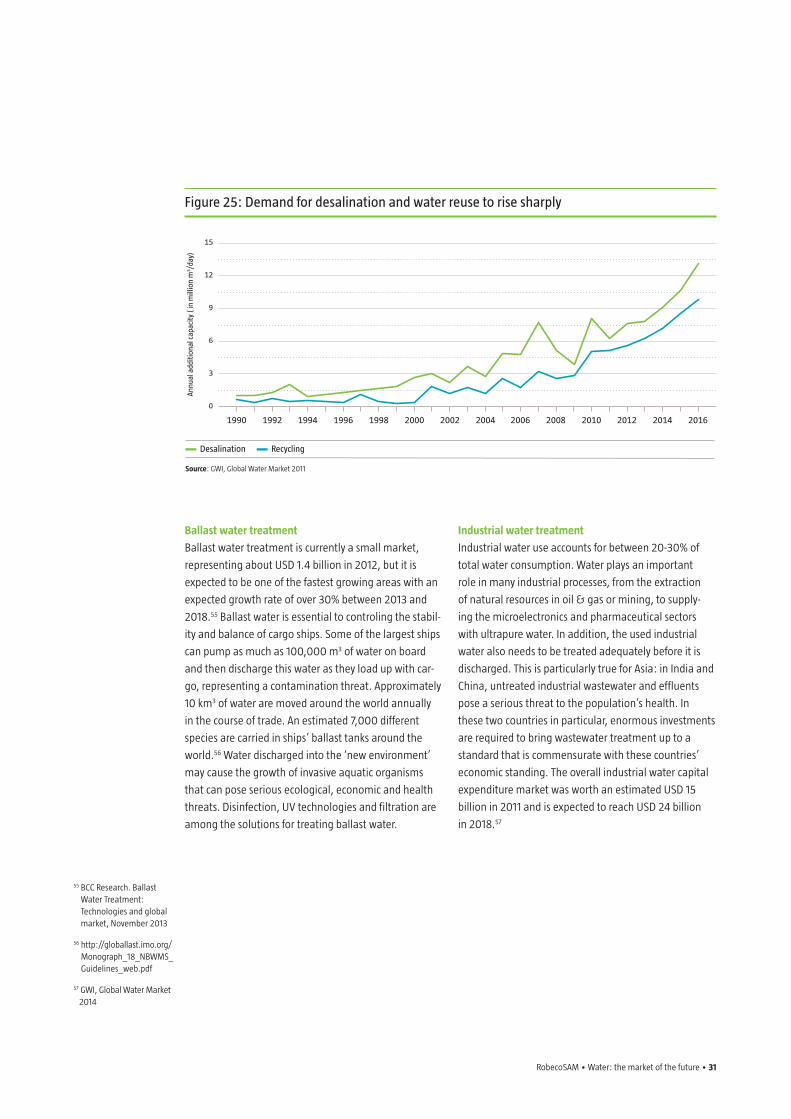
Figure 25: Demand for desalination and water reuse to rise sharply
Desalination recycling
Source: GWI, Global Water Market 2011
15
12
9
6
3
0
annu
al a
dditi
onal
cap
acity
( in
mill
ion
m3 /d
ay)
1990 1992 1994 1996 1998 2000 2002 2004 2006 2008 2010 2012 2014 2016
Ballast water treatment
Ballast water treatment is currently a small market,
representing about USD 1.4 billion in 2012, but it is
expected to be one of the fastest growing areas with an
expected growth rate of over 30% between 2013 and
2018.55 Ballast water is essential to controling the stabil-
ity and balance of cargo ships. Some of the largest ships
can pump as much as 100,000 m3 of water on board
and then discharge this water as they load up with car-
go, representing a contamination threat. Approximately
10 km3 of water are moved around the world annually
in the course of trade. An estimated 7,000 different
species are carried in ships’ ballast tanks around the
world.56 Water discharged into the ‘new environment’
may cause the growth of invasive aquatic organisms
that can pose serious ecological, economic and health
threats. Disinfection, UV technologies and filtration are
among the solutions for treating ballast water.
Industrial water treatment
Industrial water use accounts for between 20-30% of
total water consumption. Water plays an important
role in many industrial processes, from the extraction
of natural resources in oil & gas or mining, to supply-
ing the microelectronics and pharmaceutical sectors
with ultrapure water. In addition, the used industrial
water also needs to be treated adequately before it is
discharged. This is particularly true for Asia: in India and
China, untreated industrial wastewater and effluents
pose a serious threat to the population’s health. In
these two countries in particular, enormous investments
are required to bring wastewater treatment up to a
standard that is commensurate with these countries’
economic standing. The overall industrial water capital
expenditure market was worth an estimated USD 15
billion in 2011 and is expected to reach USD 24 billion
in 2018.57
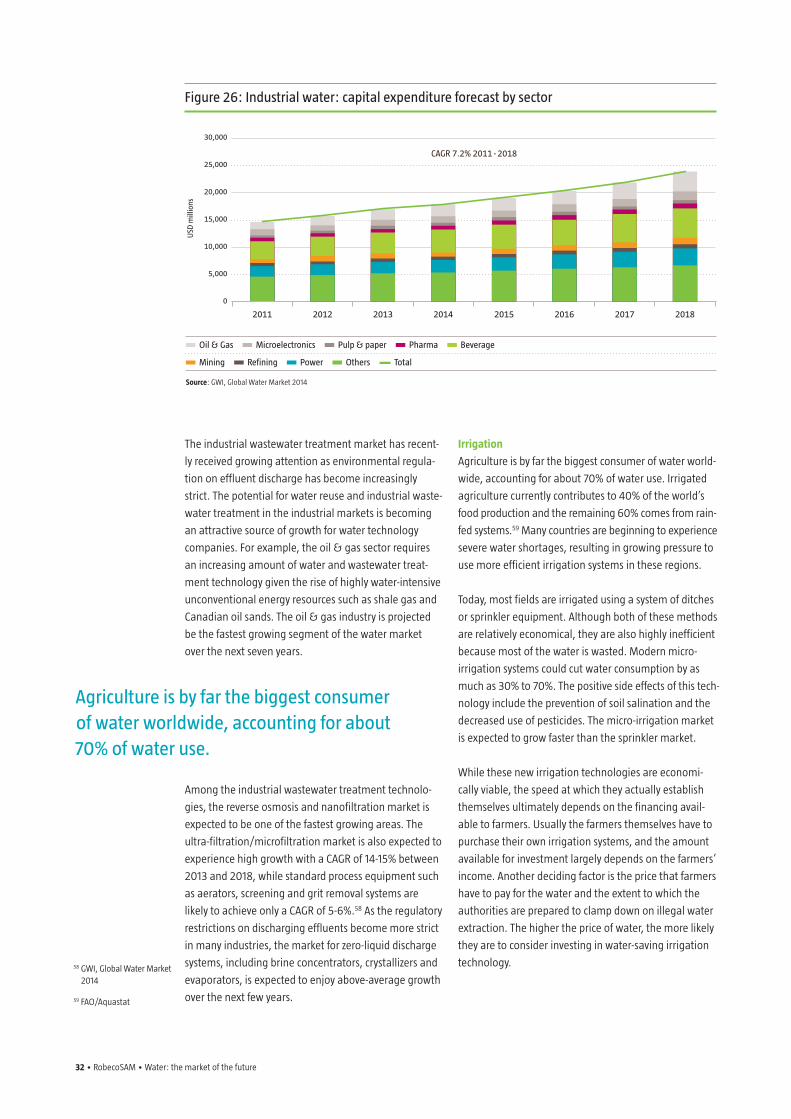
32 • RobecoSAM • Water: the market of the future
The industrial wastewater treatment market has recent-
ly received growing attention as environmental regula-
tion on effluent discharge has become increasingly
strict. The potential for water reuse and industrial waste-
water treatment in the industrial markets is becoming
an attractive source of growth for water technology
companies. For example, the oil & gas sector requires
an increasing amount of water and wastewater treat-
ment technology given the rise of highly water-intensive
unconventional energy resources such as shale gas and
Canadian oil sands. The oil & gas industry is projected
be the fastest growing segment of the water market
over the next seven years.
Among the industrial wastewater treatment technolo-
gies, the reverse osmosis and nanofiltration market is
expected to be one of the fastest growing areas. The
ultra-filtration/microfiltration market is also expected to
experience high growth with a CAGR of 14-15% between
2013 and 2018, while standard process equipment such
as aerators, screening and grit removal systems are
likely to achieve only a CAGR of 5-6%.58 As the regulatory
restrictions on discharging effluents become more strict
in many industries, the market for zero-liquid discharge
systems, including brine concentrators, crystallizers and
evaporators, is expected to enjoy above-average growth
over the next few years.
Irrigation
Agriculture is by far the biggest consumer of water world-
wide, accounting for about 70% of water use. Irrigated
agriculture currently contributes to 40% of the world’s
food production and the remaining 60% comes from rain-
fed systems.59 Many countries are beginning to experience
severe water shortages, resulting in growing pressure to
use more efficient irrigation systems in these regions.
Today, most fields are irrigated using a system of ditches
or sprinkler equipment. Although both of these methods
are relatively economical, they are also highly inefficient
because most of the water is wasted. Modern micro-
irrigation systems could cut water consumption by as
much as 30% to 70%. The positive side effects of this tech-
nology include the prevention of soil salination and the
decreased use of pesticides. The micro-irrigation market
is expected to grow faster than the sprinkler market.
While these new irrigation technologies are economi-
cally viable, the speed at which they actually establish
themselves ultimately depends on the financing avail-
able to farmers. Usually the farmers themselves have to
purchase their own irrigation systems, and the amount
available for investment largely depends on the farmers’
income. Another deciding factor is the price that farmers
have to pay for the water and the extent to which the
authorities are prepared to clamp down on illegal water
extraction. The higher the price of water, the more likely
they are to consider investing in water-saving irrigation
technology.58 GWI, Global Water Market 2014
59 FAO/Aquastat
Figure 26: industrial water: capital expenditure forecast by sector
Oil & Gas microelectronics Pulp & paper Pharma Beverage
mining refining Power Others total
Source: GWI, Global Water Market 2014
30,000
25,000
20,000
15,000
10,000
5,000
0
uSD
mill
ions
2011 2012 2013 2014 2015 2016 2017 2018
caGr 7.2% 2011 - 2018
agriculture is by far the biggest consumer of water worldwide, accounting for about 70% of water use.
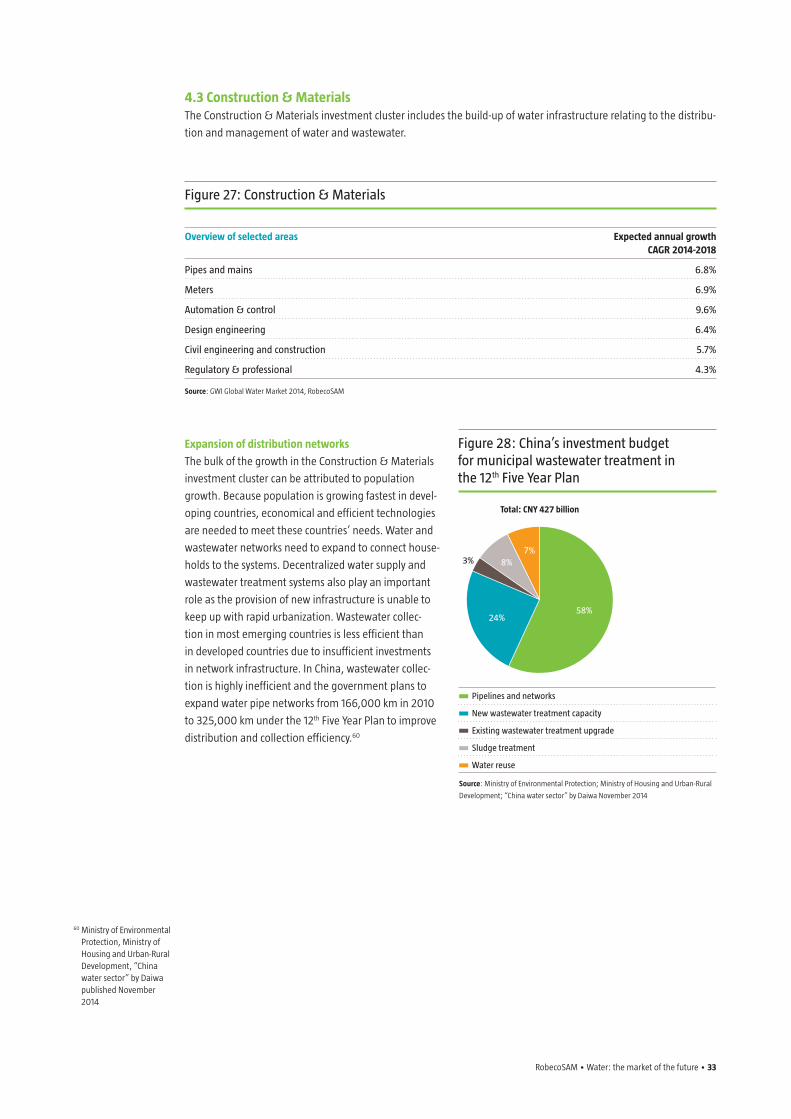
RobecoSAM • Water: the market of the future • 33
4.3 Construction & MaterialsThe Construction & Materials investment cluster includes the build-up of water infrastructure relating to the distribu-
tion and management of water and wastewater.
60 Ministry of Environmental Protection, Ministry of Housing and Urban-Rural Development, “China water sector” by Daiwa published November 2014
Expansion of distribution networks
The bulk of the growth in the Construction & Materials
investment cluster can be attributed to population
growth. Because population is growing fastest in devel-
oping countries, economical and efficient technologies
are needed to meet these countries’ needs. Water and
wastewater networks need to expand to connect house-
holds to the systems. Decentralized water supply and
wastewater treatment systems also play an important
role as the provision of new infrastructure is unable to
keep up with rapid urbanization. Wastewater collec-
tion in most emerging countries is less efficient than
in developed countries due to insufficient investments
in network infrastructure. In China, wastewater collec-
tion is highly inefficient and the government plans to
expand water pipe networks from 166,000 km in 2010
to 325,000 km under the 12th Five Year Plan to improve
distribution and collection efficiency.60
Figure 27: construction & materials
Overview of selected areas Expected annual growth CAGR 2014-2018
Pipes and mains 6.8%
meters 6.9%
automation & control 9.6%
Design engineering 6.4%
civil engineering and construction 5.7%
regulatory & professional 4.3%
Source: GWI Global Water Market 2014, RobecoSAM
Figure 28: china’s investment budget for municipal wastewater treatment in the 12th Five year Plan
Pipelines and networks
New wastewater treatment capacity
Existing wastewater treatment upgrade
Sludge treatment
Water reuse
Total: CNY 427 billion
24%
3%7%
58%
Source: Ministry of Environmental Protection; Ministry of Housing and Urban-Rural
Development; “China water sector” by Daiwa November 2014
8%
34 • RobecoSAM • Water: the market of the future
61 Water 20/20 Bringing Smart Water Networks into Focus, SENSUS 2012
62 http://www.pub.gov.sg/managingflashfloods/WLS/Pages/WaterLevelSensors.aspx
63 ADB: Asian Water Supplies, Reaching the Urban Poor, 2008
Today, a number of different techniques are used for
pipework construction and maintenance. These include
laying pipes by excavation or using trenchless techno-
logy, cement mortar linings, slip linings and long pipe
relining. In densely built-up areas, where most of the
systems in need of renovation are located, alternative
pipe laying technologies that minimize surface disrup-
tions are in greater demand.
Smart water technologies
Globally, utility companies could save an estimated
USD 7-12 billion61 each year by using smart water solu-
tions such as advanced leakage detection and pressure
management techniques to maintain and build water
networks; information systems enabling the collection
and interpretation of data, which can optimize capital
expenditure management; and smarter water quality
monitoring systems that include remote-controlled
devices and sensors. For instance, the Singapore water
utility board has 171 water level sensors located through-
out the island to monitor the drainage system.62 These
water sensors provide data on water levels in drains and
canals, which enable the water authority to better fore-
cast and hence improve response time in the event
of flash flooding.
Smart metering
Water metering is crucial to limiting water losses in the
distribution network and reducing non-revenue water
(NRW). NRW includes water not billed due to leakage,
illegal use and inadequate measurement. Between 4%
and 65% of water in Asian cities is NRW.63 In order to
reduce NRW rates, water needs to be metered to iden-
tify and track water leakage rates. At the same time,
consumers need to be billed based on their water use
to encourage water conservation, which benefits com-
panies that manufacture water meters. Modern water
meters now have components that automatically record
and/or transmit electronic data on water use directly to
the utilities.
RobecoSAM • Water: the market of the future • 35
Figure 29: Quality & analytics
Overview of selected areas Expected annual growth CAGR 2014-2018
Water analytics 9.0%
Point of use treatment 10.0%
municipal solid waste management 8.7%
industrial solid waste management 10.5%
Source: RobecoSAM; “Global Water Purifiers Market Forecast & Opportunities” by TechSci research; Global Municipal Solid Waste Management Market 2014- 2018; Global Industrial Waste Recycling And Services Market 2014- 2018 published by ReportsnReports.com 2014
Analyzing and monitoring contaminants
Growing levels of contaminants and micropollutants
have prompted the need for more stringent monitoring
of surface and groundwater. Analytical instruments are
used to measure and identify chemical and biological
agents; to monitor various parameters such as dissolved
oxygen, pH levels, nitrogen/phosphorus concentrations
and turbidity; and measure levels of pesticides and toxic
chemicals in water bodies.
The Ganges River is India’s holiest river, with more than
420 million people relying on it for food, water, bathing,
agriculture and spiritual needs. However, the Ganges
River has also long been used as an open sewer and is
therefore severely polluted. Water samples taken from
the Ganges have shown fecal coliform as high as 1.5 mil-
lion counts per 100 milliliters. Hence, the Indian govern-
ment has set up numerous monitoring stations across
the country to routinely analyze water samples.
Point-of-use
Point-of-use (POU) water treatment systems are widely
used in individual homes and commercial establish-
ments to improve drinking water quality. In poorer coun-
tries, where water infrastructure spending is constrained
by the availability of funding, the growing number of
cases of water-borne diseases is driving the need for
water purification systems. This has led to the develop-
ment of systems that can purify drinking water at an
affordable cost. The market growth of POU is supported
by rising gross domestic production, the low penetra-
tion level of water purifiers, and a growing awareness of
water-related health concerns.
Resource protection
Sustainable waste management solutions are crucial
to protecting water resources. Leachates from poorly
managed landfills contaminate soil and groundwater.
Untreated waste that is dumped into rivers and seas
threatens the water supply, aquaculture and the liveli-
hoods of those who depend on these aquatic systems.
In China, for example, heavy metal contaminants
from untreated mining and industrial waste are found
in the water, which in turn is used by farmers to water
their crops.
Growing levels of contaminants and micropollutants have prompted the need for more stringent monitoring of surface and groundwater.
4.4 Quality & AnalyticsThis investment cluster focuses on monitoring, maintaining and protecting water quality.
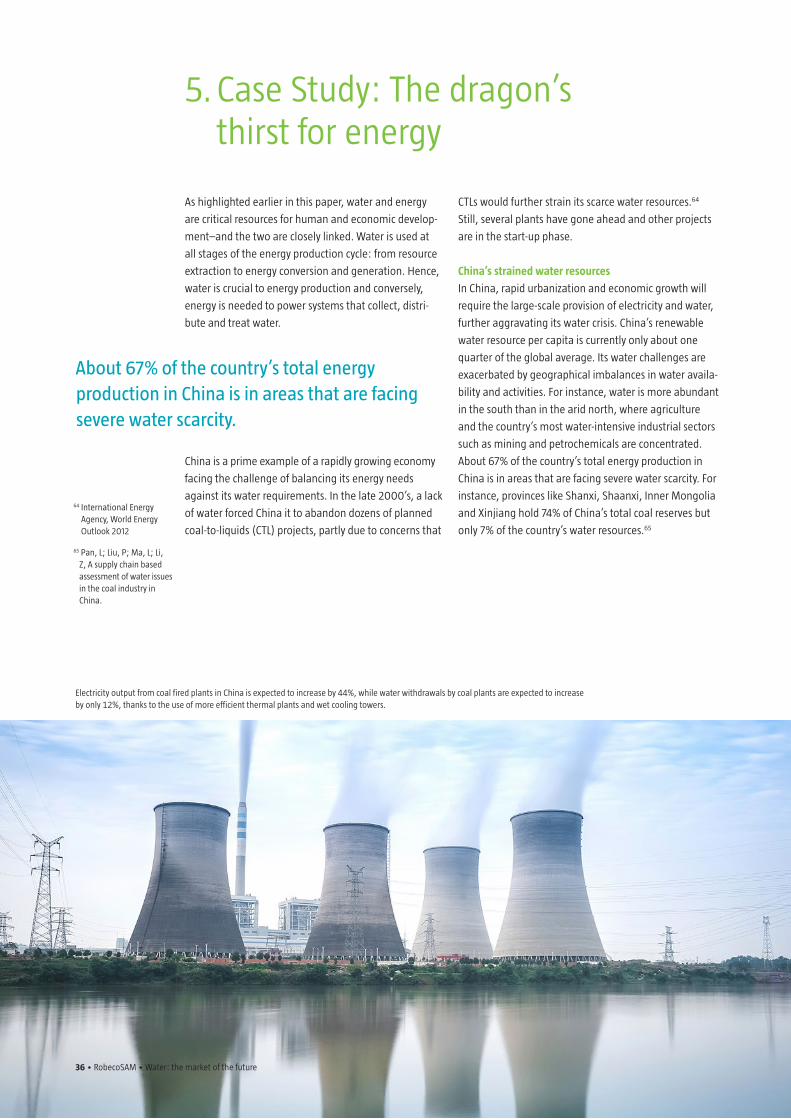
36 • RobecoSAM • Water: the market of the future
5. Case Study: The dragon’s thirst for energy
As highlighted earlier in this paper, water and energy
are critical resources for human and economic develop-
ment–and the two are closely linked. Water is used at
all stages of the energy production cycle: from resource
extraction to energy conversion and generation. Hence,
water is crucial to energy production and conversely,
energy is needed to power systems that collect, distri-
bute and treat water.
China is a prime example of a rapidly growing economy
facing the challenge of balancing its energy needs
against its water requirements. In the late 2000’s, a lack
of water forced China it to abandon dozens of planned
coal-to-liquids (CTL) projects, partly due to concerns that
CTLs would further strain its scarce water resources.64
Still, several plants have gone ahead and other projects
are in the start-up phase.
China’s strained water resources
In China, rapid urbanization and economic growth will
require the large-scale provision of electricity and water,
further aggravating its water crisis. China’s renewable
water resource per capita is currently only about one
quarter of the global average. Its water challenges are
exacerbated by geographical imbalances in water availa-
bility and activities. For instance, water is more abundant
in the south than in the arid north, where agriculture
and the country’s most water-intensive industrial sectors
such as mining and petrochemicals are concentrated.
About 67% of the country’s total energy production in
China is in areas that are facing severe water scarcity. For
instance, provinces like Shanxi, Shaanxi, Inner Mongolia
and Xinjiang hold 74% of China’s total coal reserves but
only 7% of the country’s water resources.65
about 67% of the country’s total energy production in china is in areas that are facing severe water scarcity.
64 International Energy Agency, World Energy Outlook 2012
65 Pan, L; Liu, P; Ma, L; Li, Z, A supply chain based assessment of water issues in the coal industry in China.
36 • RobecoSAM • Water: the market of the future
Electricity output from coal fired plants in China is expected to increase by 44%, while water withdrawals by coal plants are expected to increase by only 12%, thanks to the use of more efficient thermal plants and wet cooling towers.
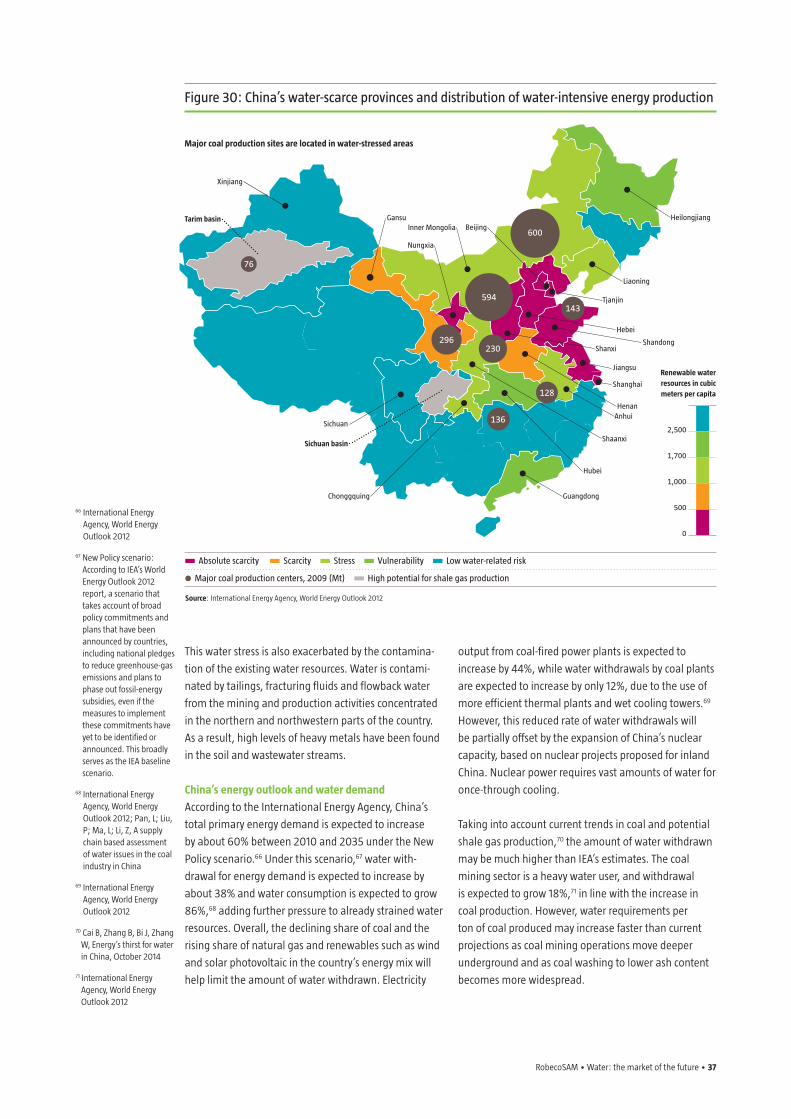
RobecoSAM • Water: the market of the future • 37
This water stress is also exacerbated by the contamina-
tion of the existing water resources. Water is contami-
nated by tailings, fracturing fluids and flowback water
from the mining and production activities concentrated
in the northern and northwestern parts of the country.
As a result, high levels of heavy metals have been found
in the soil and wastewater streams.
China’s energy outlook and water demand
According to the International Energy Agency, China’s
total primary energy demand is expected to increase
by about 60% between 2010 and 2035 under the New
Policy scenario.66 Under this scenario,67 water with-
drawal for energy demand is expected to increase by
about 38% and water consumption is expected to grow
86%,68 adding further pressure to already strained water
resources. Overall, the declining share of coal and the
rising share of natural gas and renewables such as wind
and solar photovoltaic in the country’s energy mix will
help limit the amount of water withdrawn. Electricity
output from coal-fired power plants is expected to
increase by 44%, while water withdrawals by coal plants
are expected to increase by only 12%, due to the use of
more efficient thermal plants and wet cooling towers.69
However, this reduced rate of water withdrawals will
be partially offset by the expansion of China’s nuclear
capacity, based on nuclear projects proposed for inland
China. Nuclear power requires vast amounts of water for
once-through cooling.
Taking into account current trends in coal and potential
shale gas production,70 the amount of water withdrawn
may be much higher than IEA’s estimates. The coal
mining sector is a heavy water user, and withdrawal
is expected to grow 18%,71 in line with the increase in
coal production. However, water requirements per
ton of coal produced may increase faster than current
projections as coal mining operations move deeper
underground and as coal washing to lower ash content
becomes more widespread.
Figure 30: china’s water-scarce provinces and distribution of water- intensive energy production
absolute scarcity Scarcity Stress vulnerability Low water-related risk
major coal production centers, 2009 (mt) High potential for shale gas production
Source: International Energy Agency, World Energy Outlook 2012
2,500
1,700
1,000
500
0
Renewable water resources in cubic meters per capita
Major coal production sites are located in water-stressed areas
Shandong
Guangdong
Gansu
xinjiang
Heilongjiang
tjanjin
Shanxi
Jiangsu
Sichuan
Henananhui
Hubei
Shaanxi
chonggquing
Sichuan basin
Shanghai
inner mongolia
Nungxia
Beijing
Liaoning
Hebei
Tarim basin
600
76
594
296230
143
136
128
66 International Energy Agency, World Energy Outlook 2012
67 New Policy scenario: According to IEA’s World Energy Outlook 2012 report, a scenario that takes account of broad policy commitments and plans that have been announced by countries, including national pledges to reduce greenhouse-gas emissions and plans to phase out fossil-energy subsidies, even if the measures to implement these commitments have yet to be identified or announced. This broadly serves as the IEA baseline scenario.
68 International Energy Agency, World Energy Outlook 2012; Pan, L; Liu, P; Ma, L; Li, Z, A supply chain based assessment of water issues in the coal industry in China
69 International Energy Agency, World Energy Outlook 2012
70 Cai B, Zhang B, Bi J, Zhang W, Energy’s thirst for water in China, October 2014
71 International Energy Agency, World Energy Outlook 2012
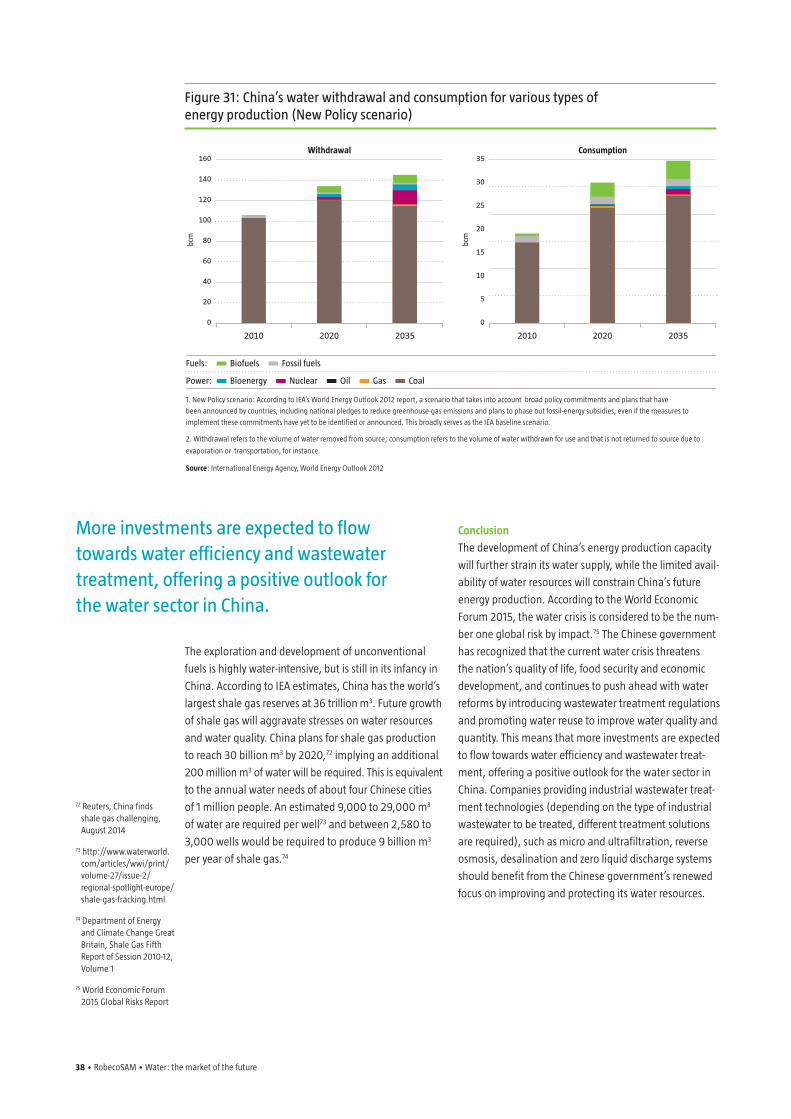
38 • RobecoSAM • Water: the market of the future
Figure 31: china’s water withdrawal and consumption for various types of energy production (New Policy scenario)
Fuels: Biofuels Fossil fuels
Power: Bioenergy Nuclear Oil Gas coal
1. New Policy scenario: According to IEA’s World Energy Outlook 2012 report, a scenario that takes into account broad policy commitments and plans that have
been announced by countries, including national pledges to reduce greenhouse-gas emissions and plans to phase out fossil-energy subsidies, even if the measures to
implement these commitments have yet to be identified or announced. This broadly serves as the IEA baseline scenario.
2. Withdrawal refers to the volume of water removed from source; consumption refers to the volume of water withdrawn for use and that is not returned to source due to
evaporation or transportation, for instance.
Source: International Energy Agency, World Energy Outlook 2012
160
140
120
100
80
60
40
20
0
bcm
2010 2020 2035
Withdrawal35
30
25
20
15
10
5
0
bcm
2010 2020 2035
Consumption
The exploration and development of unconventional
fuels is highly water-intensive, but is still in its infancy in
China. According to IEA estimates, China has the world’s
largest shale gas reserves at 36 trillion m3. Future growth
of shale gas will aggravate stresses on water resources
and water quality. China plans for shale gas production
to reach 30 billion m3 by 2020,72 implying an additional
200 million m3 of water will be required. This is equivalent
to the annual water needs of about four Chinese cities
of 1 million people. An estimated 9,000 to 29,000 m3
of water are required per well73 and between 2,580 to
3,000 wells would be required to produce 9 billion m3
per year of shale gas.74
Conclusion
The development of China’s energy production capacity
will further strain its water supply, while the limited avail-
ability of water resources will constrain China’s future
energy production. According to the World Economic
Forum 2015, the water crisis is considered to be the num-
ber one global risk by impact.75 The Chinese government
has recognized that the current water crisis threatens
the nation’s quality of life, food security and economic
development, and continues to push ahead with water
reforms by introducing wastewater treatment regulations
and promoting water reuse to improve water quality and
quantity. This means that more investments are expected
to flow towards water efficiency and wastewater treat-
ment, offering a positive outlook for the water sector in
China. Companies providing industrial wastewater treat-
ment technologies (depending on the type of industrial
wastewater to be treated, different treatment solutions
are required), such as micro and ultrafiltration, reverse
osmosis, desalination and zero liquid discharge systems
should benefit from the Chinese government’s renewed
focus on improving and protecting its water resources.
more investments are expected to flow towards water efficiency and wastewater treatment, offering a positive outlook for the water sector in china.
72 Reuters, China finds shale gas challenging, August 2014
73 http://www.waterworld.com/articles/wwi/print/volume-27/issue-2/regional-spotlight-europe/shale-gas-fracking.html
74 Department of Energy and Climate Change Great Britain, Shale Gas Fifth Report of Session 2010-12, Volume 1
75 World Economic Forum 2015 Global Risks Report
RobecoSAM • Water: the market of the future • 39
6. Conclusion
The importance of water as a life-sustaining resource
is undeniable. Yet while demand for water resources
is unlimited, supply is limited. As increasing per capita
water consumption, pollution and unstable weather
patterns continue to strain our limited water resources,
the need to guarantee access to sufficient quantities
of clean and safe water to an ever growing population
becomes even more pressing. Given the secular nature
of these challenges, demand for innovative solutions
that enable the more efficient use of available water
resources or enhance the quality of drinking water
will continue to grow. As a result, the water market is
expected to grow by 1-2 percentage points above GDP
growth, reaching USD 1 trillion by 2025.
Investment opportunities abound
Those companies that recognize the growing need for
sustainable solutions as an opportunity – and respond
by offering innovative solutions that address the chal-
lenges related to scarcity, quality and allocation of water
are well positioned to profit in the long run.
Many of these solutions already exist, and investors with
a long-term horizon can find numerous attractive invest-
ment opportunities along the water value chain: micro-
irrigation, smart metering and water-saving domestic
appliances help reduce excessive water consumption,
while micro and ultrafiltration, desalination, and ultra-
violet disinfection are just a few examples of how different
water treatment technologies can help us tap into new
sources of water.
Water investing requires a deep understanding of the
latest technical advances and industry solutions as well
as the political and regulatory developments and deci-
sions affecting the water sector. New environmental
standards, tougher demands on water quality, more
public spending on infrastructure construction and main-
tenance, as well as the fixing of water tariffs, all have a
significant impact on the growth of individual segments
of the water market and, consequently, on the attractive-
ness of companies doing business in these segments.
RobecoSAM has a long-history of successfully investing
in solution providers to our water challenges, and pos-
sesses the in-house expertise to required identify most
attractive companies within the Utilities, Capital Goods
& Chemicals, Construction & Materials, and Quality &
Analytics investment clusters.
the water market is expected to grow by 1-2 percentage points above GDP growth, reaching uSD 1 trillion by 2025.
40 • RobecoSAM • Water: the market of the future
Important legal information: The details given on these pages do not constitute an offer. They are given for information purposes only. No liability is assumed for the correctness and accuracy of the details given. The securities identified and described may or may not be purchased, sold or recommended for advisory clients. It should not be assumed that an investment in these securities was or will be profitable. *RobecoSAM Private Equity is the marketing name of the combined private equity divisions of Robeco Institutional Asset Management B.V. (‘Robeco’) and its fully owned subsidiary, RobecoSAM AG (‘RobecoSAM’). Any funds or services offered by RobecoSAM Private Equity are managed and offered by Robeco, who may have delegated certain investment advisory functions to RobecoSAM. ** RobecoSAM’s Governance & Active Ownership team is a brand name of Robeco. RobecoSAM USA is an investment adviser registered in the US. Copyright © 2015 RobecoSAM – all rights reserved.
About RobecoSAM
Founded in 1995, RobecoSAM is an investment specialist focused exclusively on Sustainability Investing. It offers
asset management, indices, engagement, voting, impact analysis, sustainability assessments, and benchmarking
services. Asset management capabilities cater to institutional asset owners and financial intermediaries and cover
a range of ESG-integrated investments (in public and private equity), featuring a strong track record in resource
efficiency theme strategies. Together with S&P Dow Jones Indices, RobecoSAM publishes the globally recognized
Dow Jones Sustainability Indices (DJSI). Based on its Corporate Sustainability Assessment, an annual ESG analysis
of 2,900 listed companies, RobecoSAM has compiled one of the world’s most comprehensive databases of finan-
cially material sustainability information.
RobecoSAM is a member of the global pure-play asset manager Robeco, which was established in 1929 and is
the center of expertise for asset management within the ORIX Corporation. As a reflection of its own commitment
to advocating sustainable investment practices, RobecoSAM is a signatory of the UNPRI and a member of Eurosif,
ASrIA and Ceres. Approximately 130 professionals work for RobecoSAM, which is headquartered in Zurich. As of
June 30, 2014, RobecoSAM had assets under management, advice and/or license in listed and private equity* of
approximately USD 10.7 billion. Additionally, RobecoSAM’s Governance & Active Ownership team** had USD 85.1
billion of assets under engagement and USD 53 billion of assets under voting.
DISCLAIMER
No warranty: This publication is derived from sources believed to be accurate and reliable, but neither its accuracy
nor completeness is guaranteed. The material and information in this publication are provided “as is” and without
warranties of any kind, either expressed or implied. RobecoSAM AG and its related, affiliated and subsidiary com-
panies disclaim all warranties, expressed or implied, including, but not limited to, implied warranties of merchant-
ability and fitness for a particular purpose. Any opinions and views in this publication reflect the current judgment
of the authors and may change without notice. It is each reader’s responsibility to evaluate the accuracy, complete-
ness and usefulness of any opinions, advice, services or other information provided in this publication.
Limitation of liability: All information contained in this publication is distributed with the understanding that the
authors, publishers and distributors are not rendering legal, accounting or other professional advice or opinions
on specific facts or matters and accordingly assume no liability whatsoever in connection with its use. In no event
shall RobecoSAM AG and its related, affiliated and subsidiary companies be liable for any direct, indirect, special,
incidental or consequential damages arising out of the use of any opinion or information expressly or implicitly
contained in this publication.
Copyright: Unless otherwise noted, text, images and layout of this publication are the exclusive property of
Robeco SAM AG and/or its related, affiliated and subsidiary companies and may not be copied or distributed, in
whole or in part, without the express written consent of RobecoSAM AG or its related, affiliated and subsidiary
companies.
No Offer: The information and opinions contained in this publication constitutes neither a solicitation, nor a recom-
mendation, nor an offer to buy or sell investment instruments or other services, or to engage in any other kind
of transaction. The information described in this publication is not directed to persons in any jurisdiction where the
provision of such information would run counter to local laws and regulation.
Copyright © 2015 RobecoSAM AG
CarbonNeutral® publication
The unavoidable CO2 generated by the printing and distribution
of this report have been reduced to net zero through verified
carbon off set projects.