roadway design calculations · roadway design calculations interim interchange at sr 400 (i-4) and...
TRANSCRIPT
ROADWAY DESIGN CALCULATIONS
Interim Interchange at SR 400 (I-4) and Daryl Carter Parkway
FPID: 441113-1-52-01
60% (Phase II)
Prepared by: AECOM Technical Services, Inc.150 North Orange Avenue, Suite 200Orlando, FL 32801
Certificate of Authorization No: 8115Date: May 18, 2018
Notes:PRELIMINARY: NOT FOR CONSTRUCTIONBookmarks have been provided per Section and Subsection
Interim Interchange at SR 400 (I-4) and Daryl Carter ParkwayFPID: 441113-1-52-01PRELIMINARY: NOT FOR CONSTRUCTION
TABLE OF CONTENTS
SECTION SUBSECTION1. DESIGN CRITERIA
ROADWAY DESIGN CRITERIA – SHS FACILITIES ........................................................... 1.1ROADWAY DESIGN CRITERIA – NON SHS FACILITIES.................................................. 1.2
2. SR 400 – (I-4)2.1 SR 400 (I-4)
HORIZONTAL ALIGNMENT (BASELINE SURVEY) ... 2.1.12.2 Westbound Collector Distributor (IWBCD2)
HORIZONTAL ALIGNMENT ..................................... 2.2.1STOPPING SIGHT DISTANCE ................................... 2.2.2SUPERELEVATION ................................................... 2.2.3VERTICAL ALIGNMENT ........................................... 2.2.4
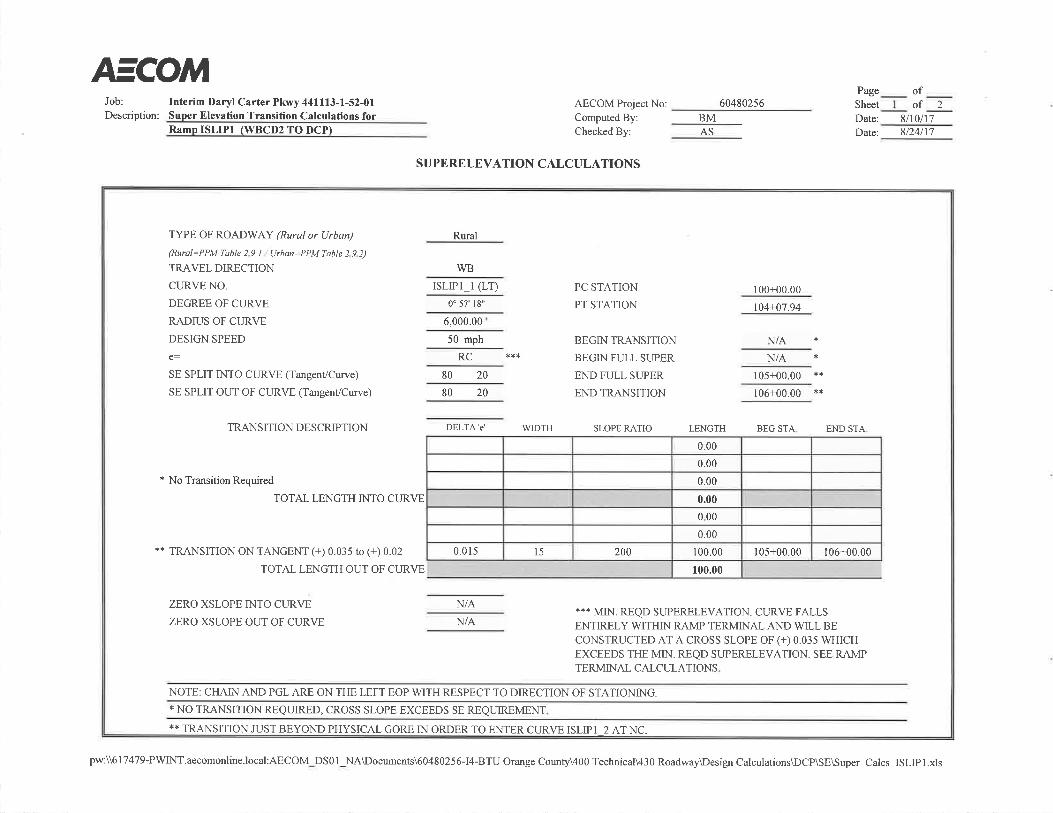
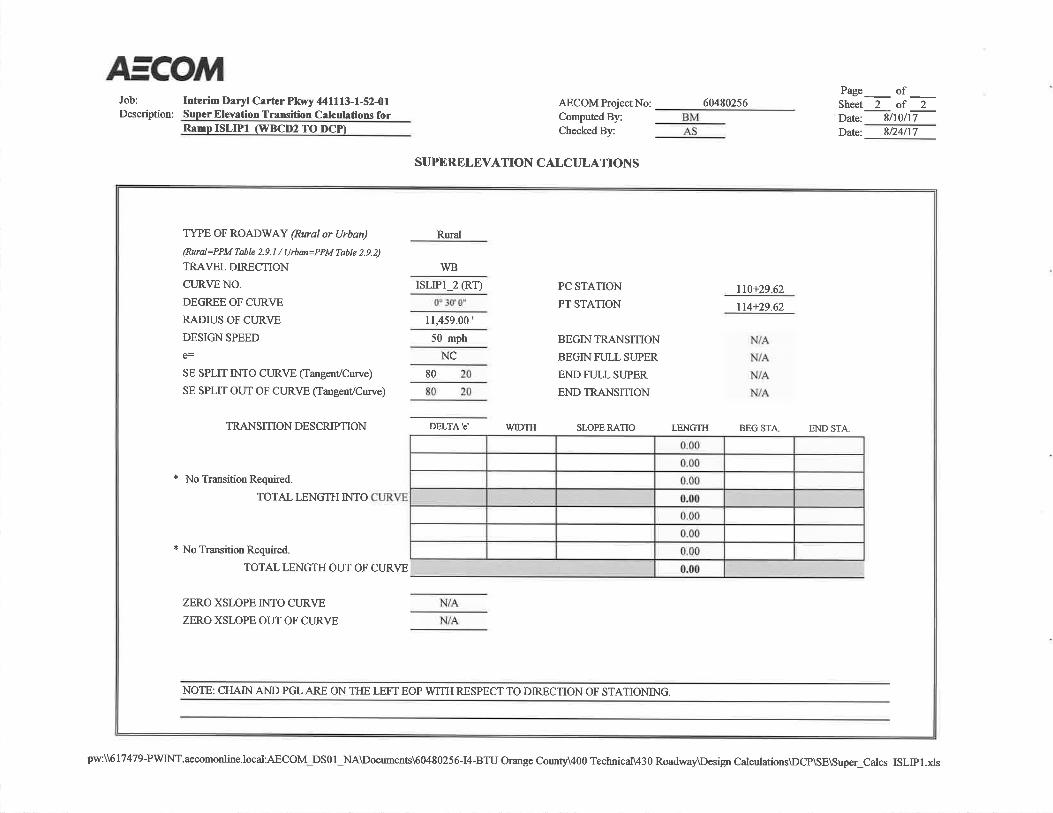
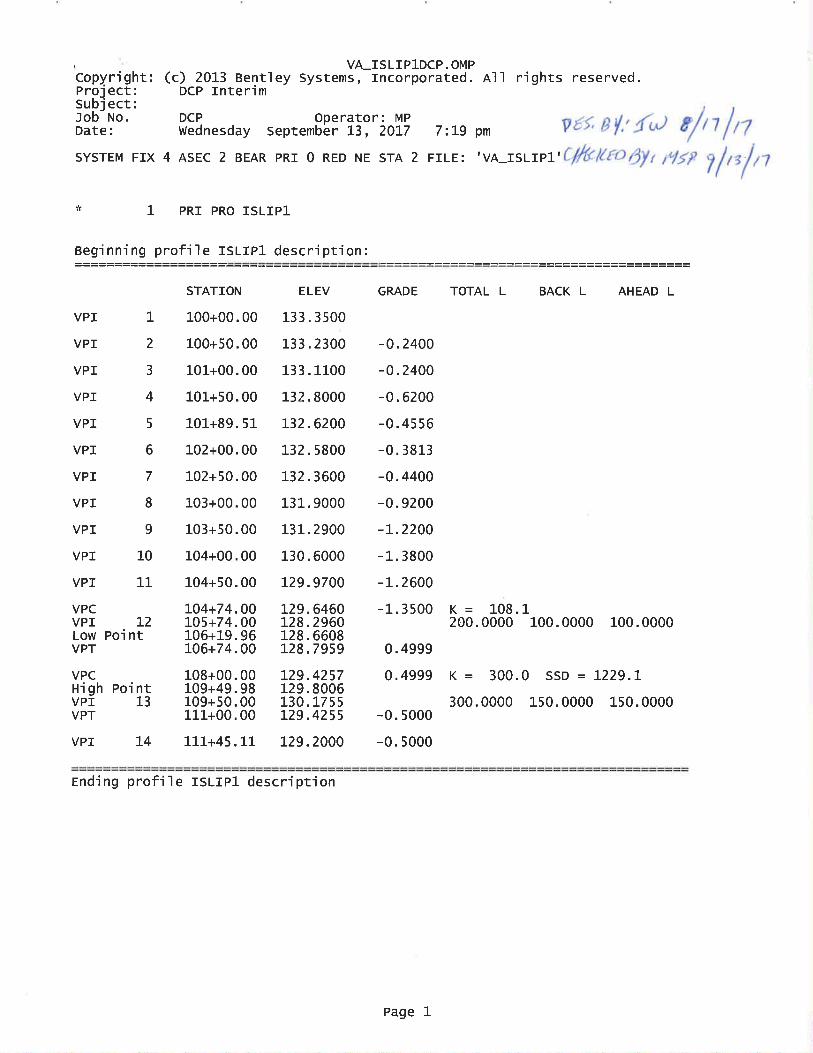
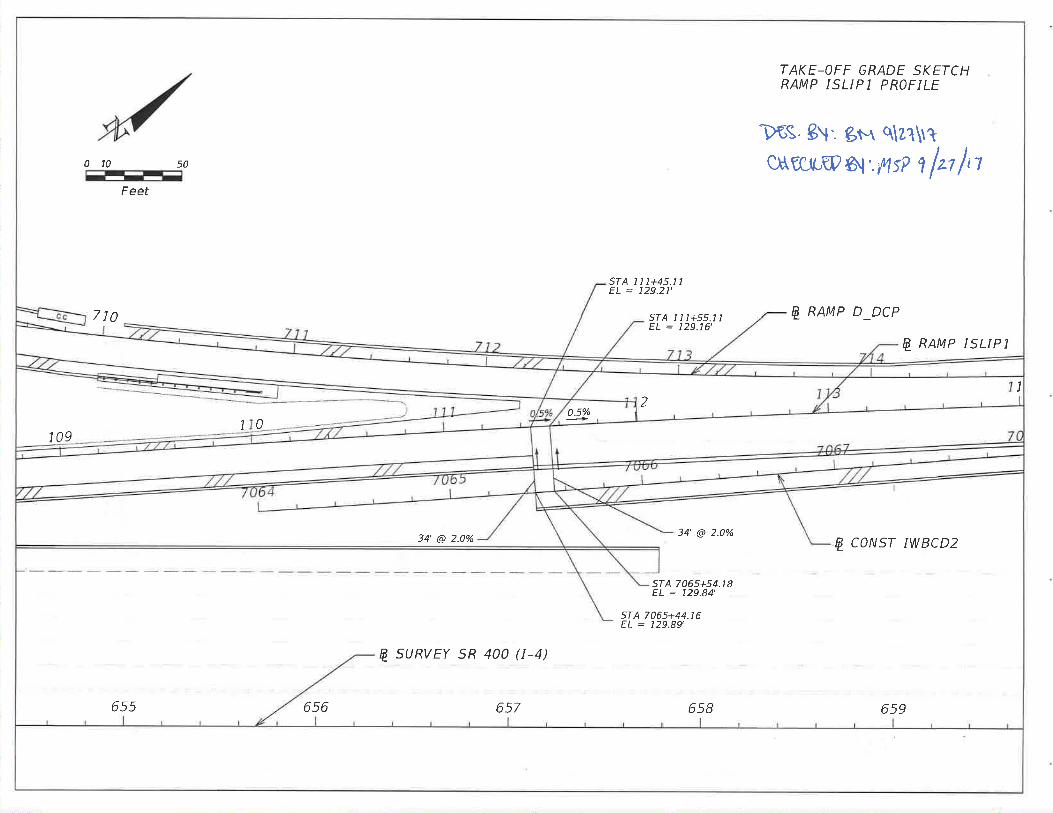
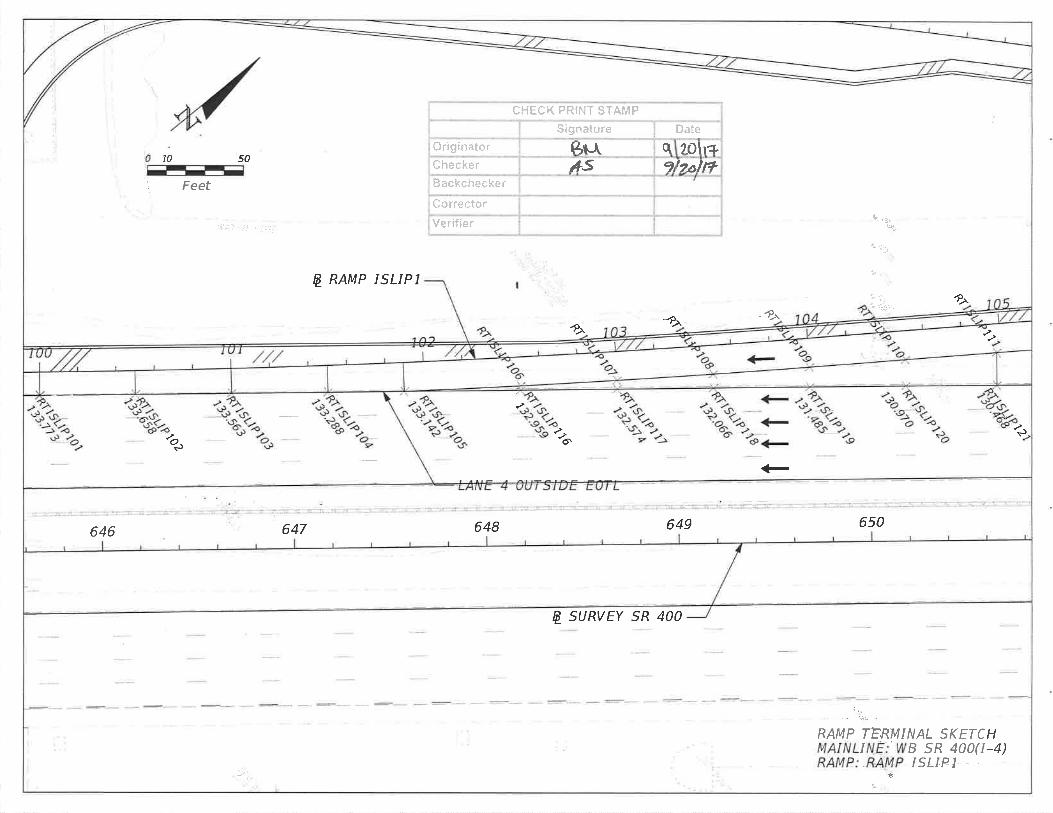
2.3 RAMP ISLIP1 (IWBCD2 TO WB I-4)HORIZONTAL ALIGNMENT ..................................... 2.3.1STOPPING SIGHT DISTANCE ................................... 2.3.2SUPERELEVATION ................................................... 2.3.3VERTICAL ALIGNMENT ........................................... 2.3.4RAMP TERMINAL DETAILS (ISLIP1 & WB I-4) ........ 2.3.5
2.4 RAMP ISLIP2 (WB I-4 to IWBCD2 )HORIZONTAL ALIGNMENT ..................................... 2.4.1STOPPING SIGHT DISTANCE ................................... 2.4.2SUPERELEVATION ................................................... 2.4.3VERTICAL ALIGNMENT ........................................... 2.4.4RAMP TERMINAL DETAILS (ISLIP2 & WB I-4)(ISLIP2 & IWBCD2) .................................................. 2.4.5
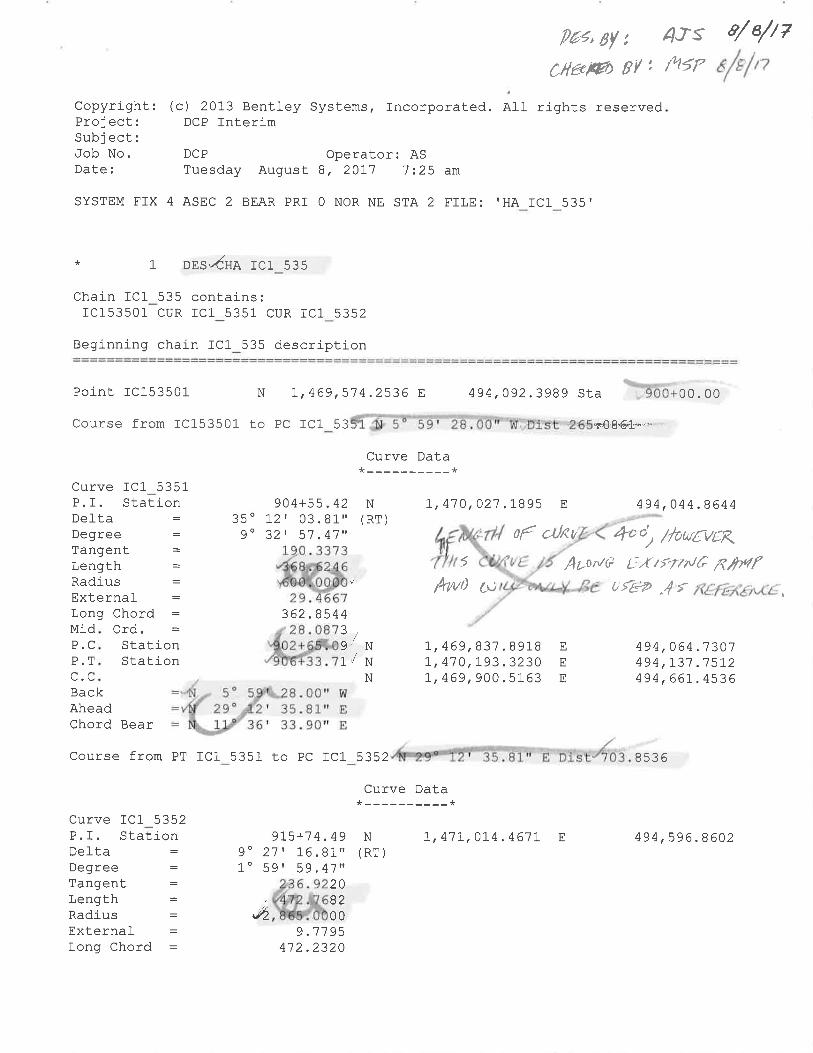
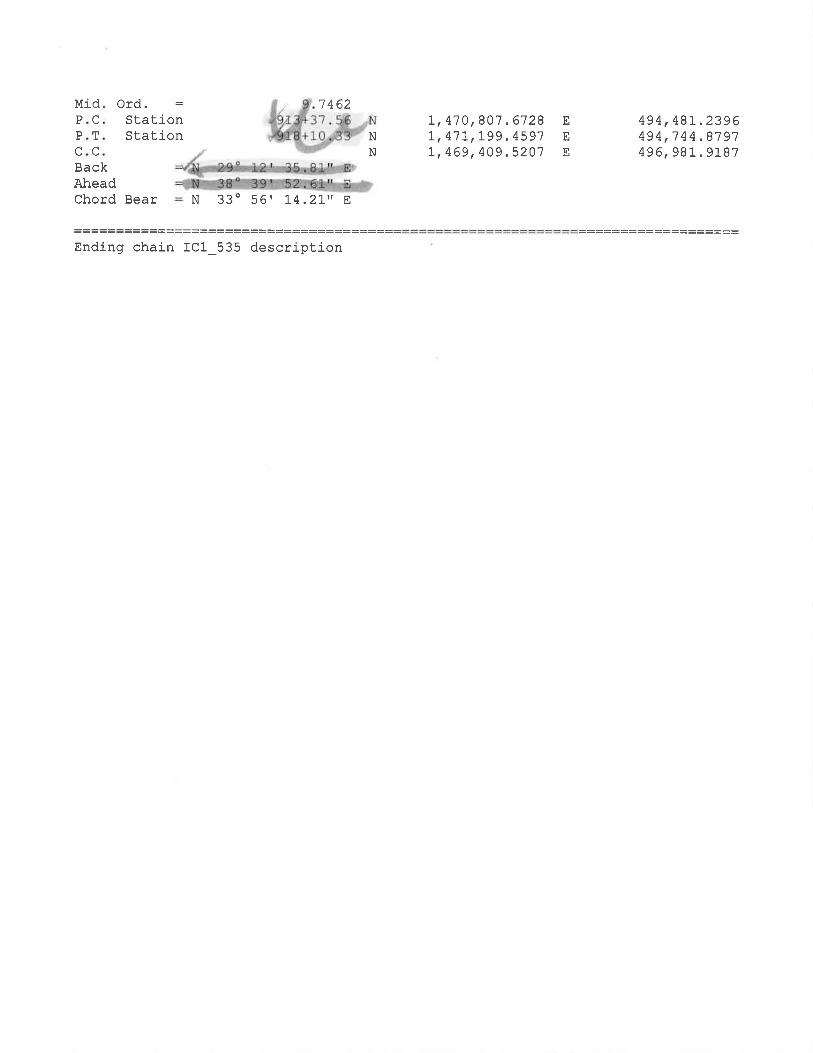
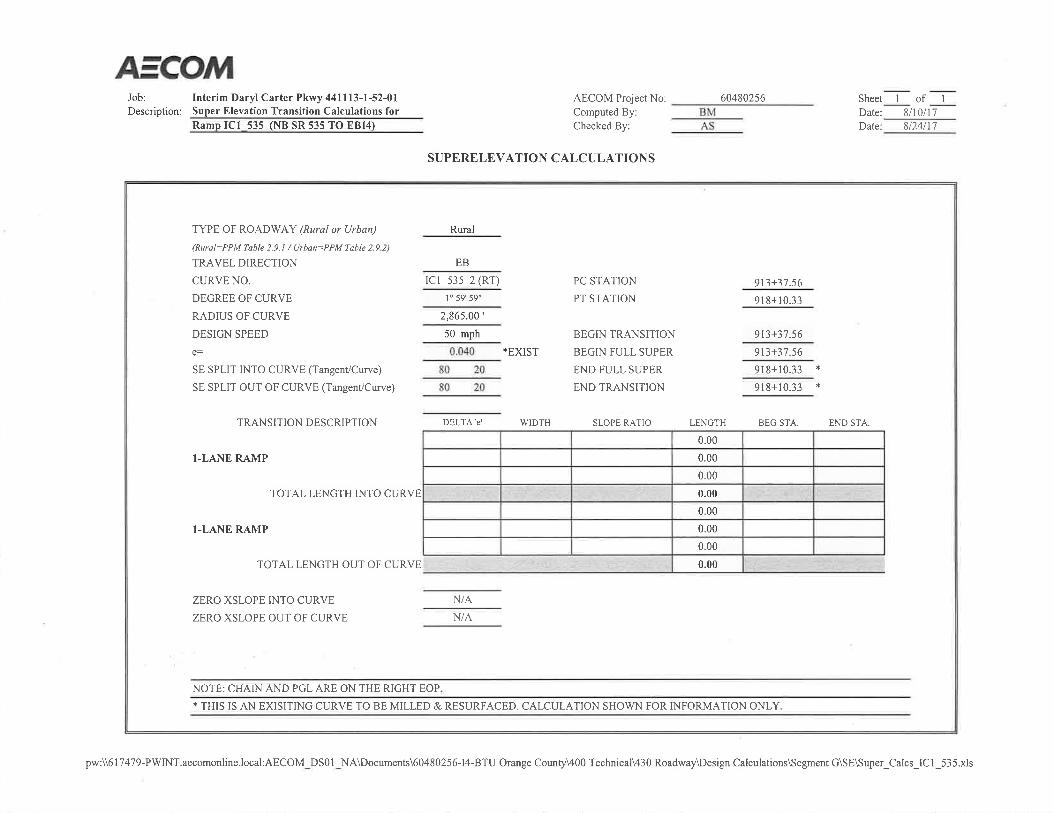
3. SR 535 INTERCHANGE3.1 RAMP IC1_535 (NB 535 TO EB I-4)
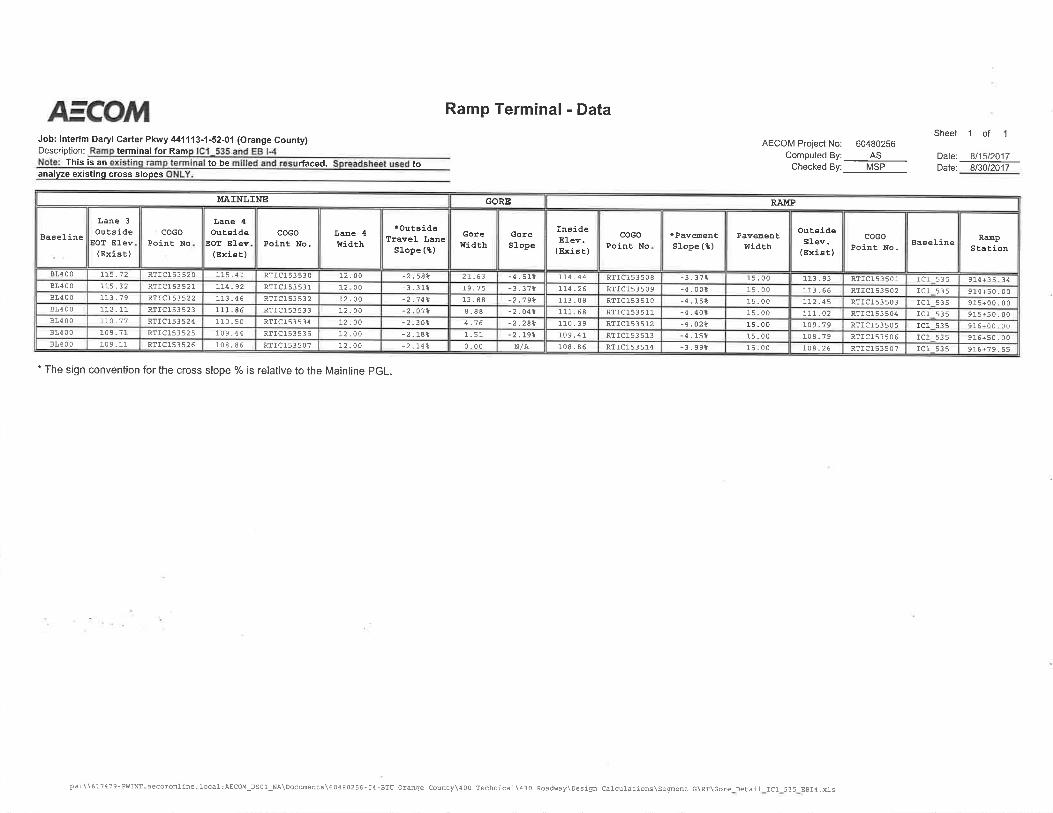
HORIZONTAL ALIGNMENT ..................................... 3.1.1STOPPING SIGHT DISTANCE ................................... 3.1.2SUPERELEVATION ................................................... 3.1.3RAMP TERMINAL DETAILS (IC1_535 & EB I-4) ...... 3.1.4
4. Daryl Carter Pkwy INTERCHANGE4.1 DARYL CARTER PARKWAY
HORIZONTAL ALIGNMENT – CLDCP ...................... 4.1.1HORIZONTAL ALIGNMENT – EBDCP ...................... 4.1.2STOPPING SIGHT DISTANCE – EBDCP.................... 4.1.3SUPERELEVATION – EBDCP .................................... 4.1.4

Interim Interchange at SR 400 (I-4) and Daryl Carter ParkwayFPID: 441113-1-52-01PRELIMINARY: NOT FOR CONSTRUCTION
SECTION SUBSECTIONHORIZONTAL ALIGNMENT – WBDCP ................... 4.1.5STOPPING SIGHT DISTANCE – WBDCP .................. 4.1.6SUPERELEVATION - WBDCP ................................... 4.1.7
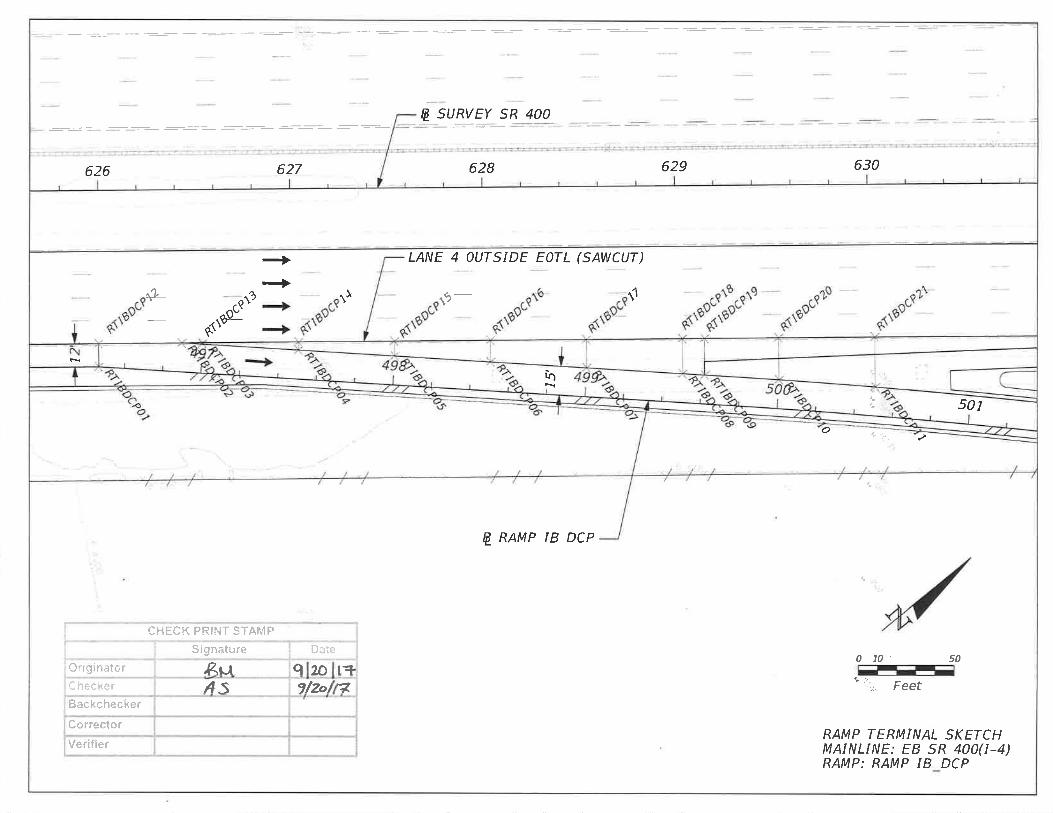
4.2 RAMP IB_DCP (EB I-4 TO DCP)HORIZONTAL ALIGNMENT ..................................... 4.2.1STOPPING SIGHT DISTANCE ................................... 4.2.2SUPERELEVATION ................................................... 4.2.3VERTICAL ALIGNMENT ........................................... 4.2.4RAMP TERMINAL DETAILS (IB_DCP & EB I-4)……..4.2.5
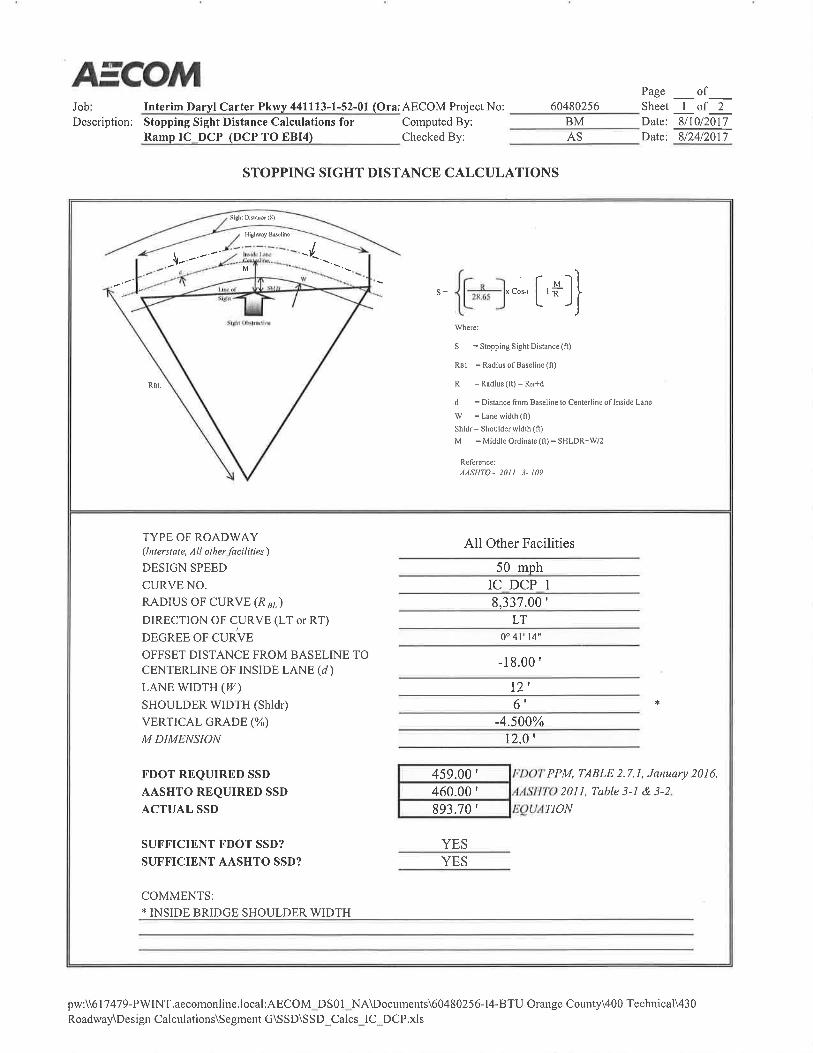
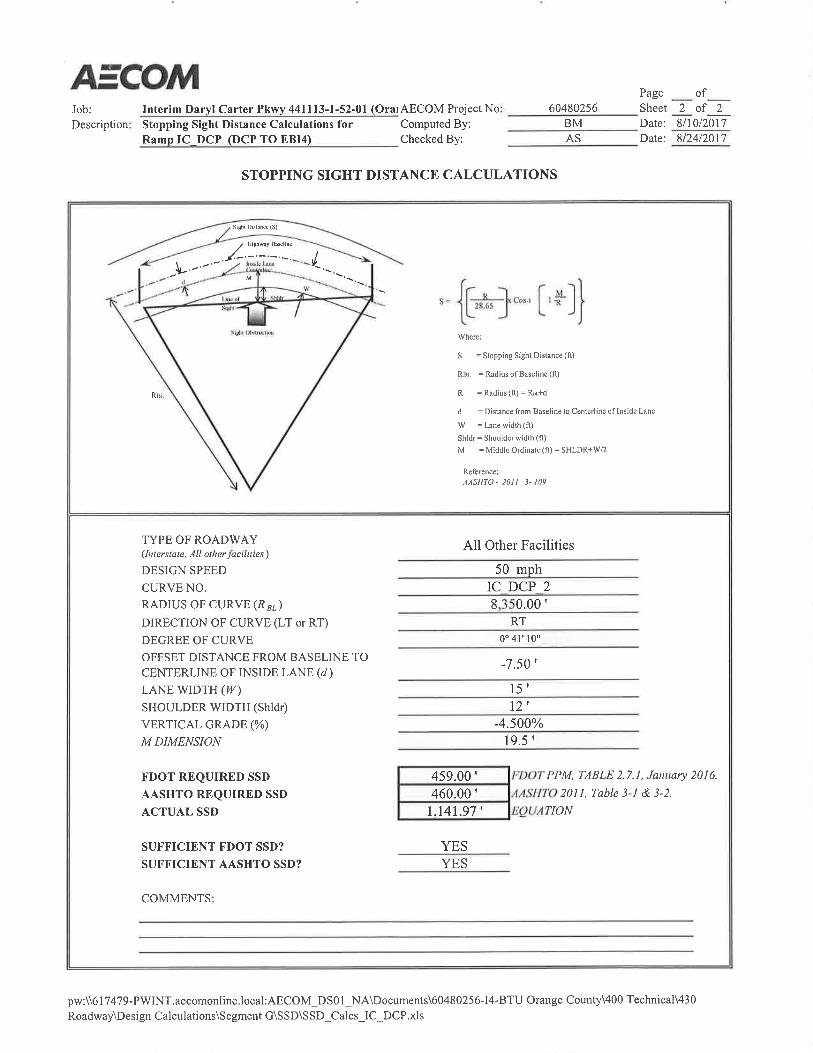
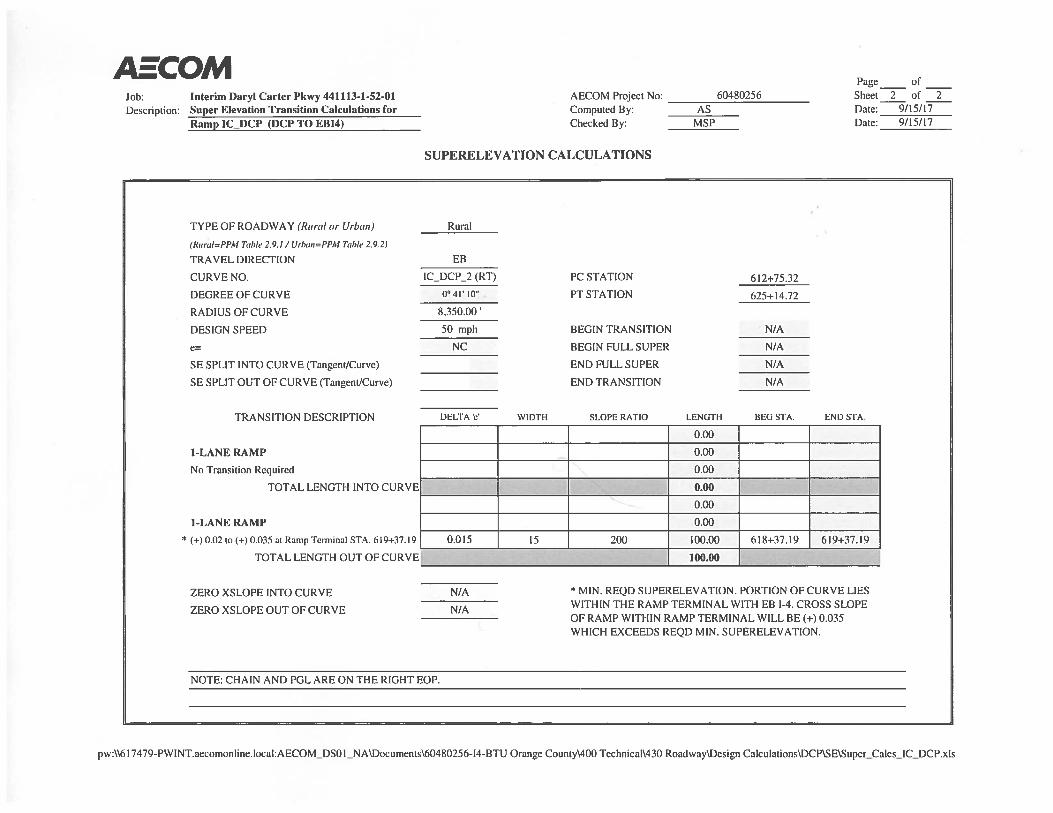
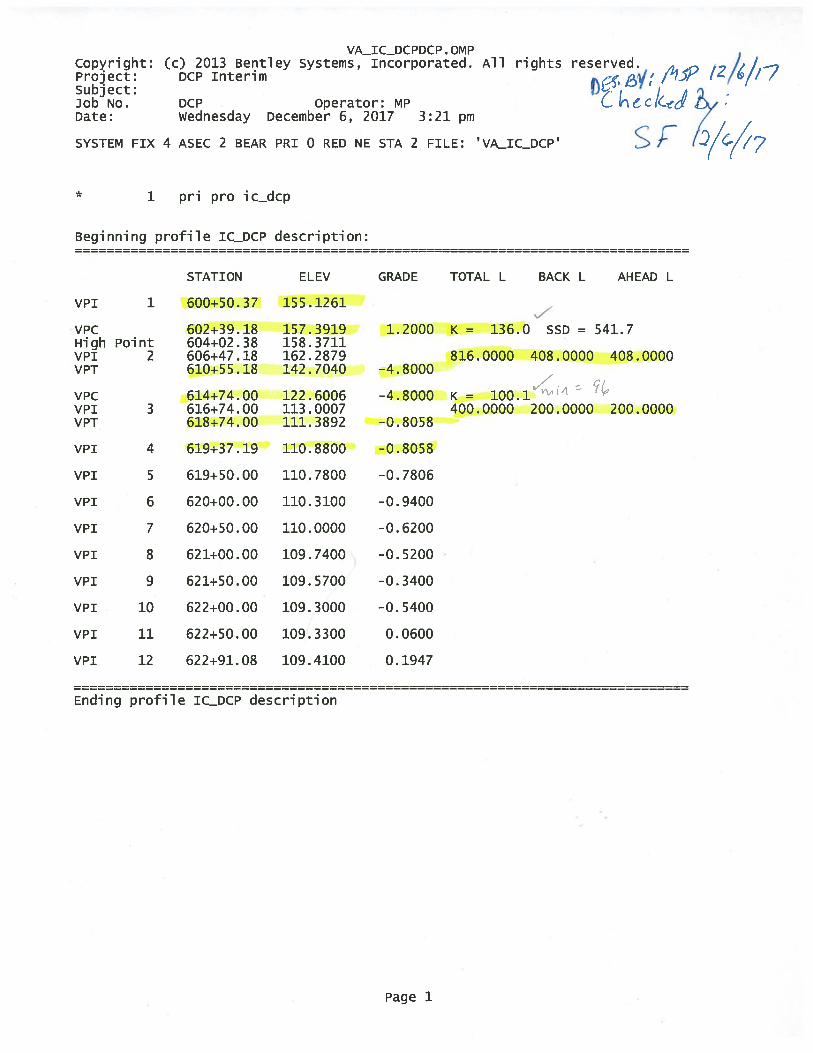
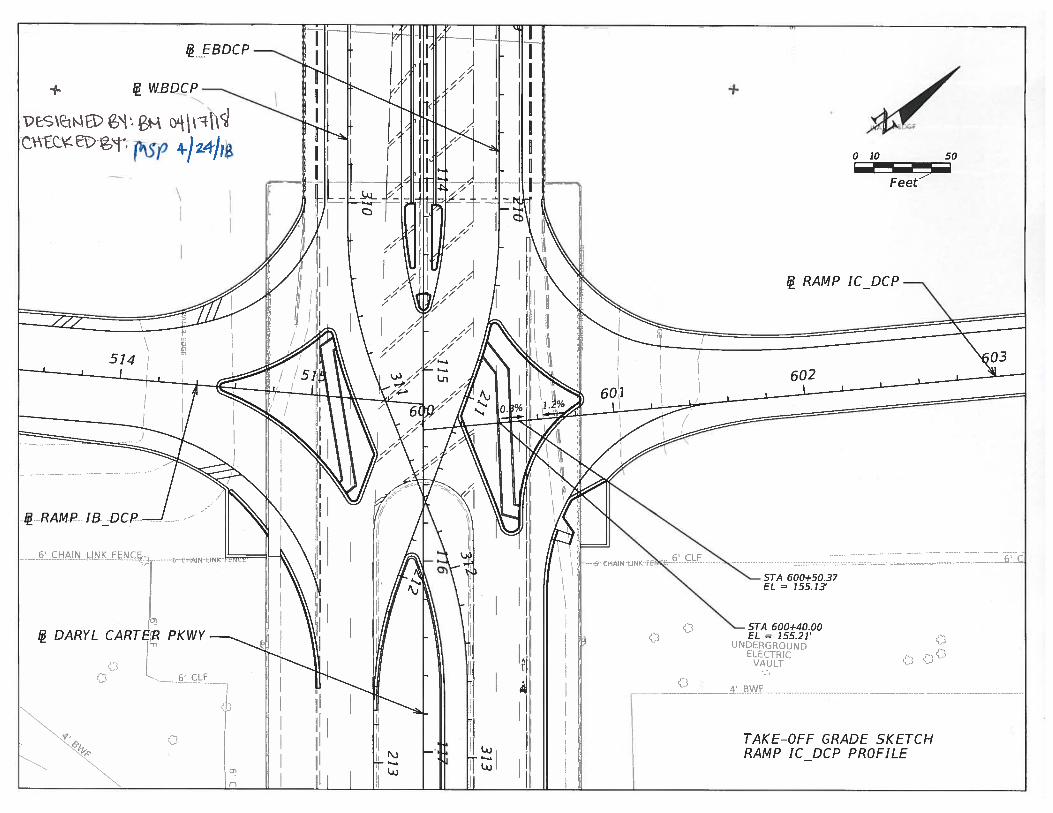
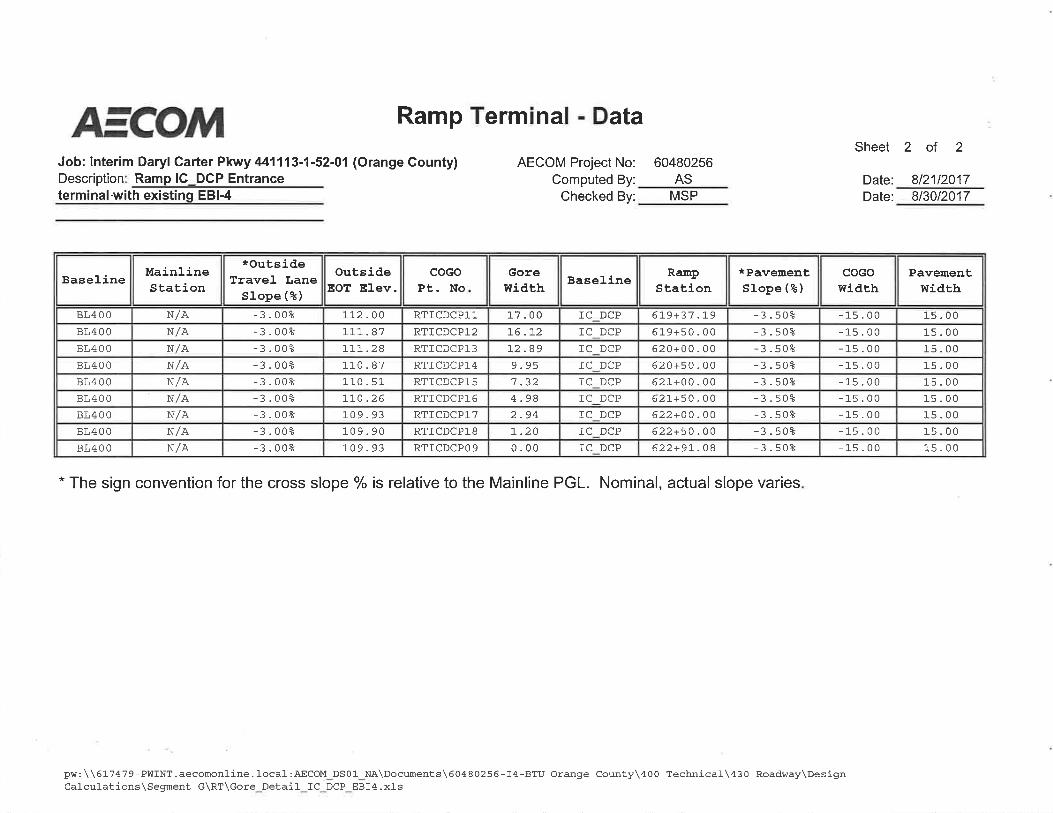
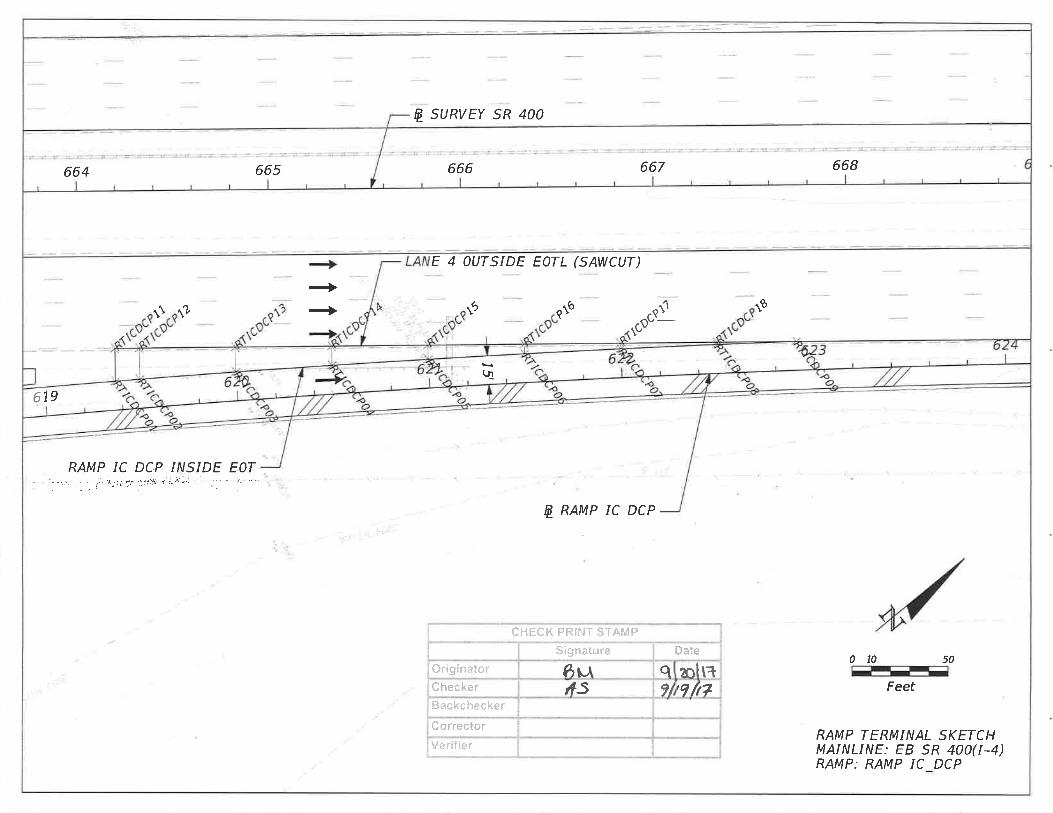
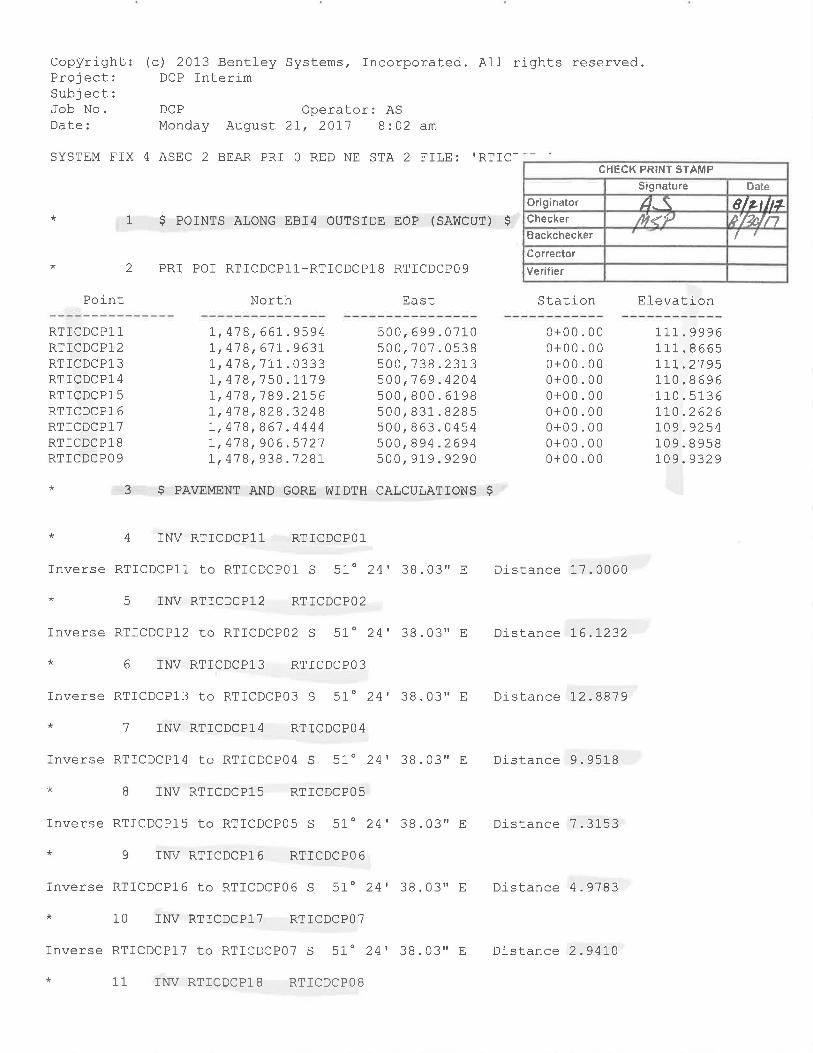
4.3 RAMP IC_DCP (DCP TO EB I-4)HORIZONTAL ALIGNMENT ..................................... 4.3.1STOPPING SIGHT DISTANCE ................................... 4.3.2SUPERELEVATION ................................................... 4.3.3VERTICAL ALIGNMENT ........................................... 4.3.4RAMP TERMINAL DETAILS (IC_DCP & EB I-4) ....... 4.3.5
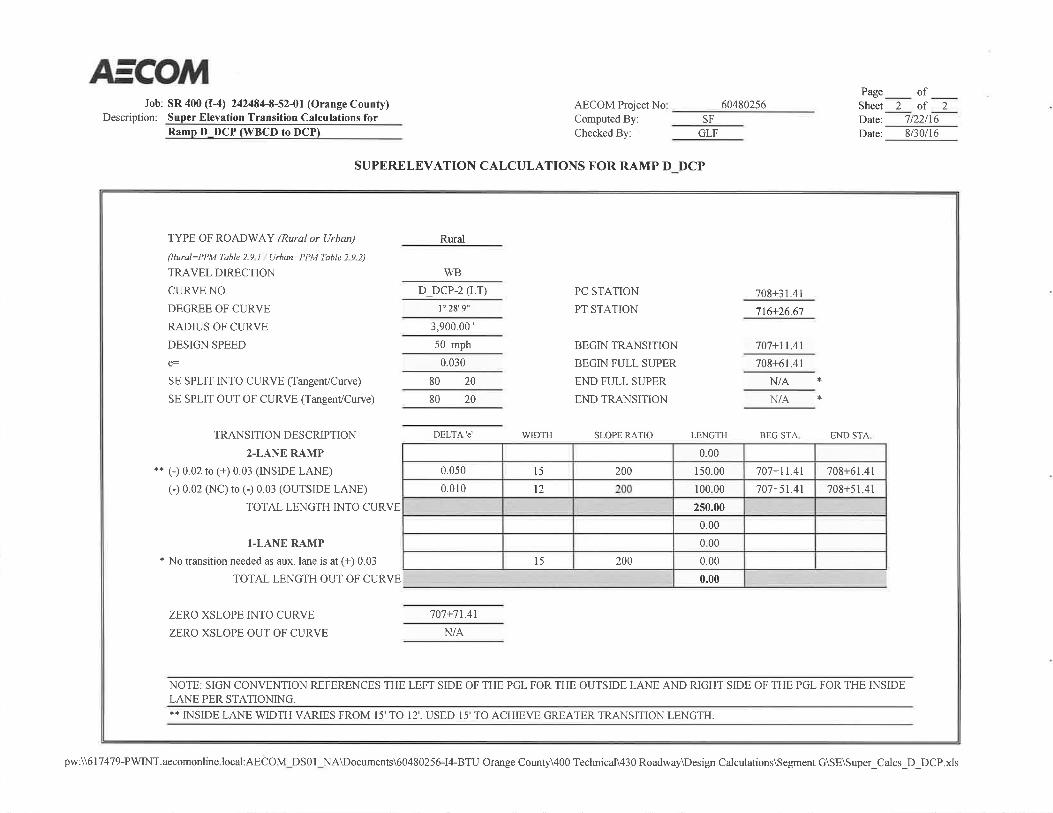
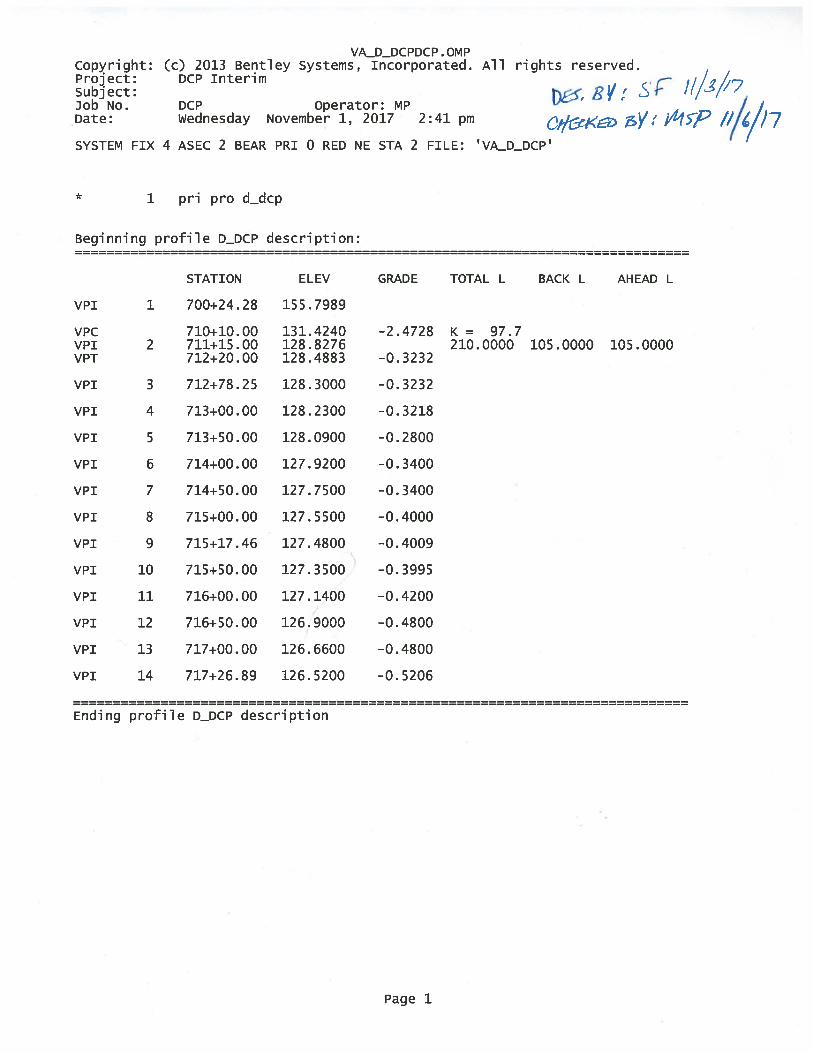
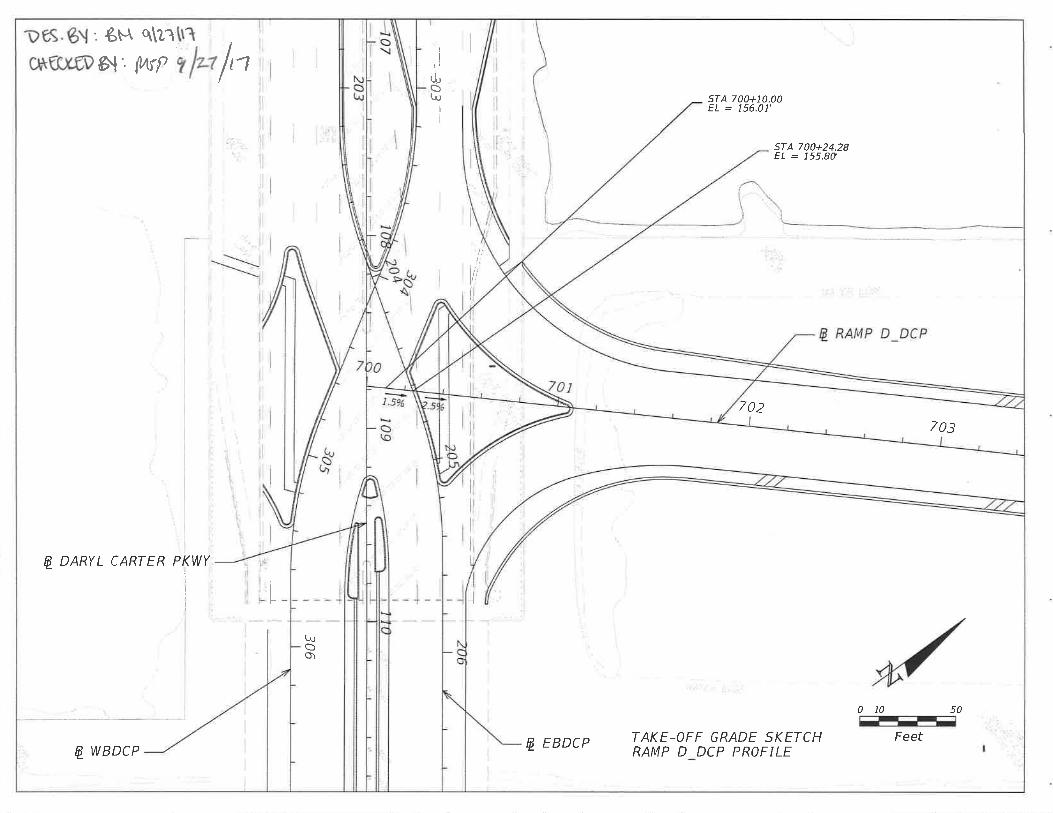
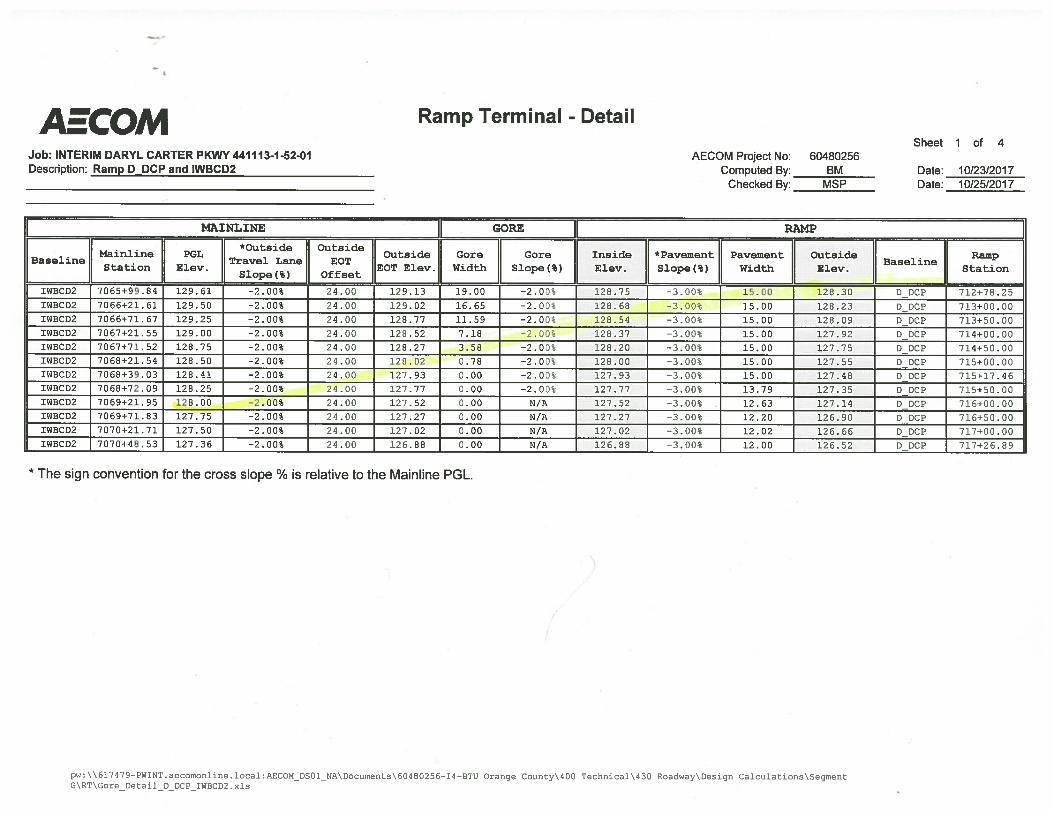
4.4 RAMP D_DCP (IWBCD2 TO DCP)HORIZONTAL ALIGNMENT ..................................... 4.4.1STOPPING SIGHT DISTANCE ................................... 4.4.2SUPERELEVATION ................................................... 4.4.3VERTICAL ALIGNMENT ........................................... 4.4.4RAMP TERMINAL DETAILS (D_DCP & IWBCD2) .... 4.4.5
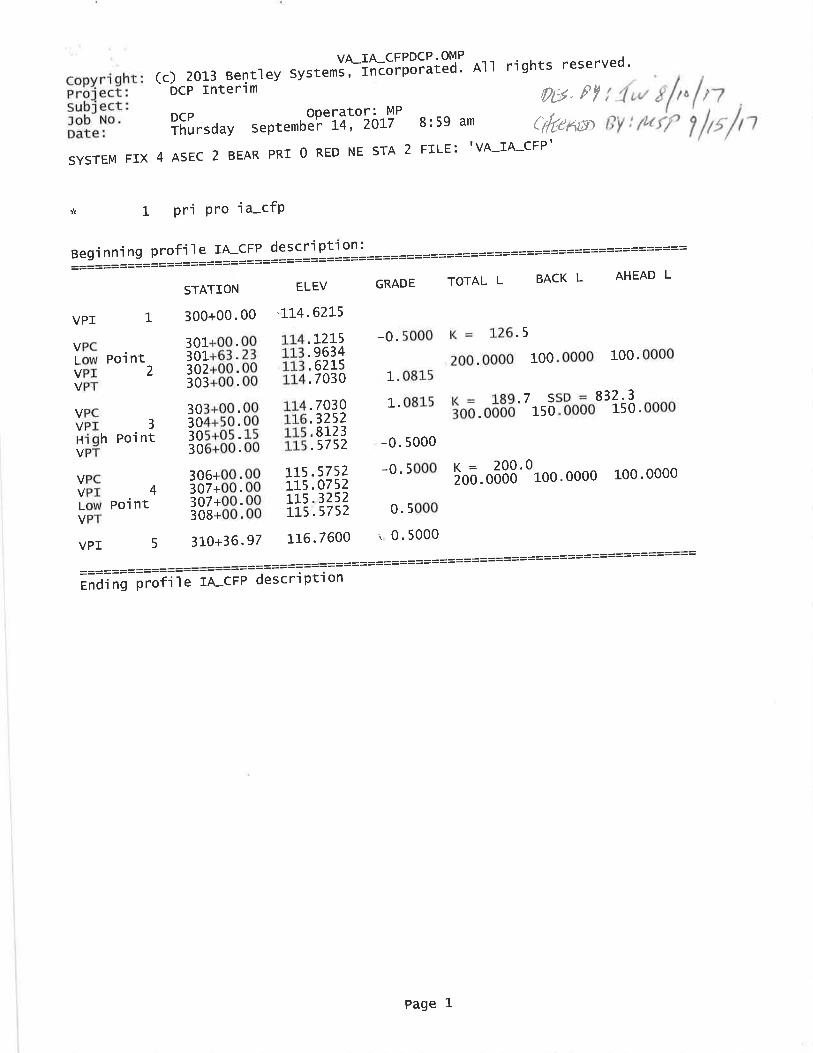
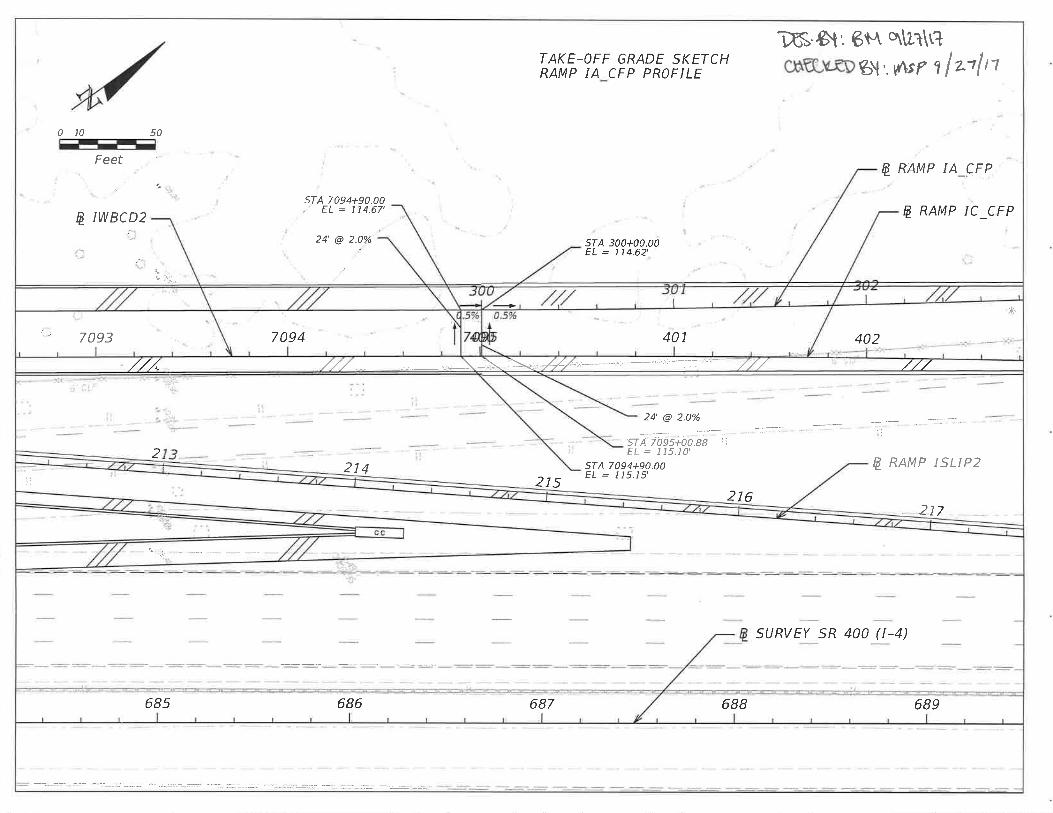
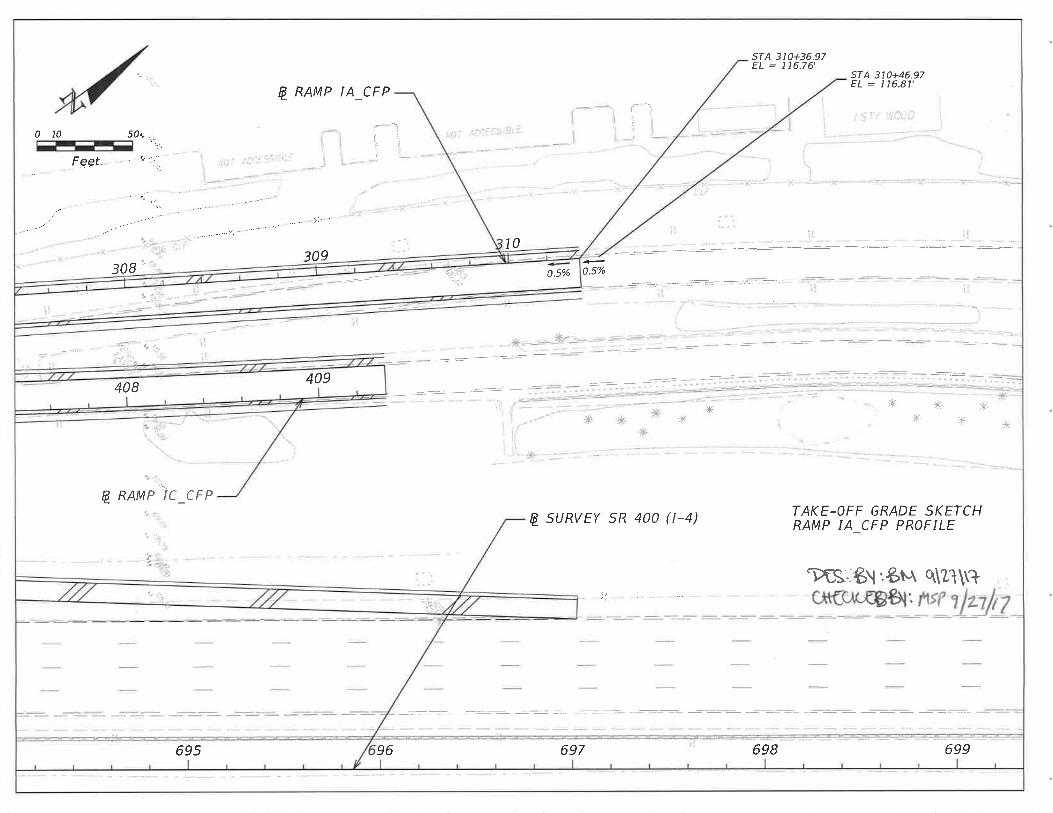
5. Central Florida Pkwy INTERCHANGE5.1 RAMP IA_CFP (EB CFP TO WB I-4)
HORIZONTAL ALIGNMENT ..................................... 5.1.1STOPPING SIGHT DISTANCE ................................... 5.1.2SUPERELEVATION ................................................... 5.1.3VERTICAL ALIGNMENT ........................................... 5.1.4
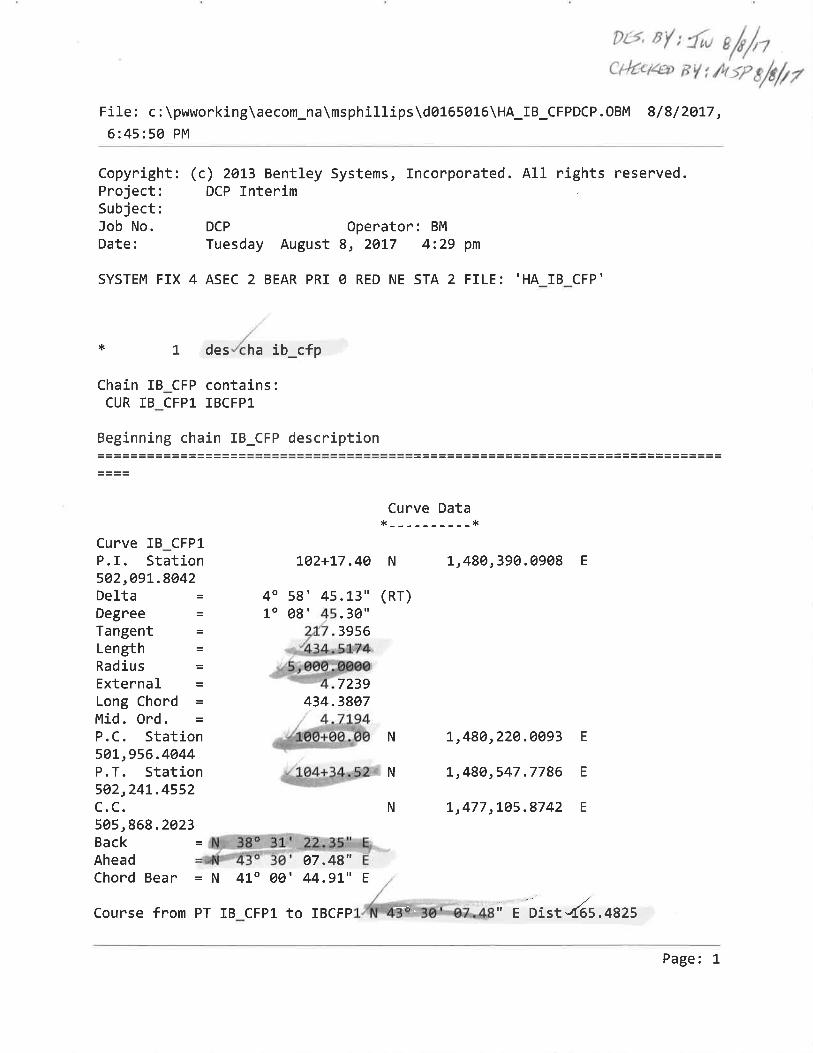
5.2 RAMP IB_CFP (EB I-4 TO CFP)HORIZONTAL ALIGNMENT ..................................... 5.2.1STOPPING SIGHT DISTANCE ................................... 5.2.2SUPERELEVATION ................................................... 5.2.3RAMP TERMINAL DETAILS (IB_CFP & EB I-4) ........ 5.2.4
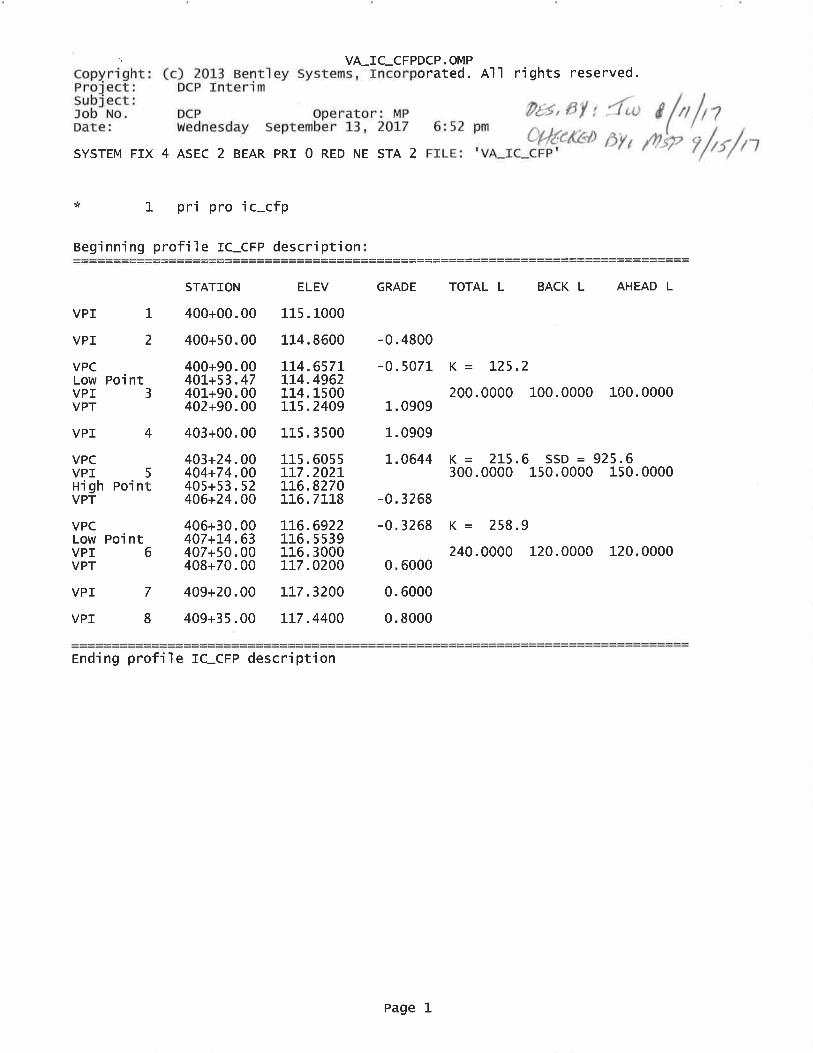
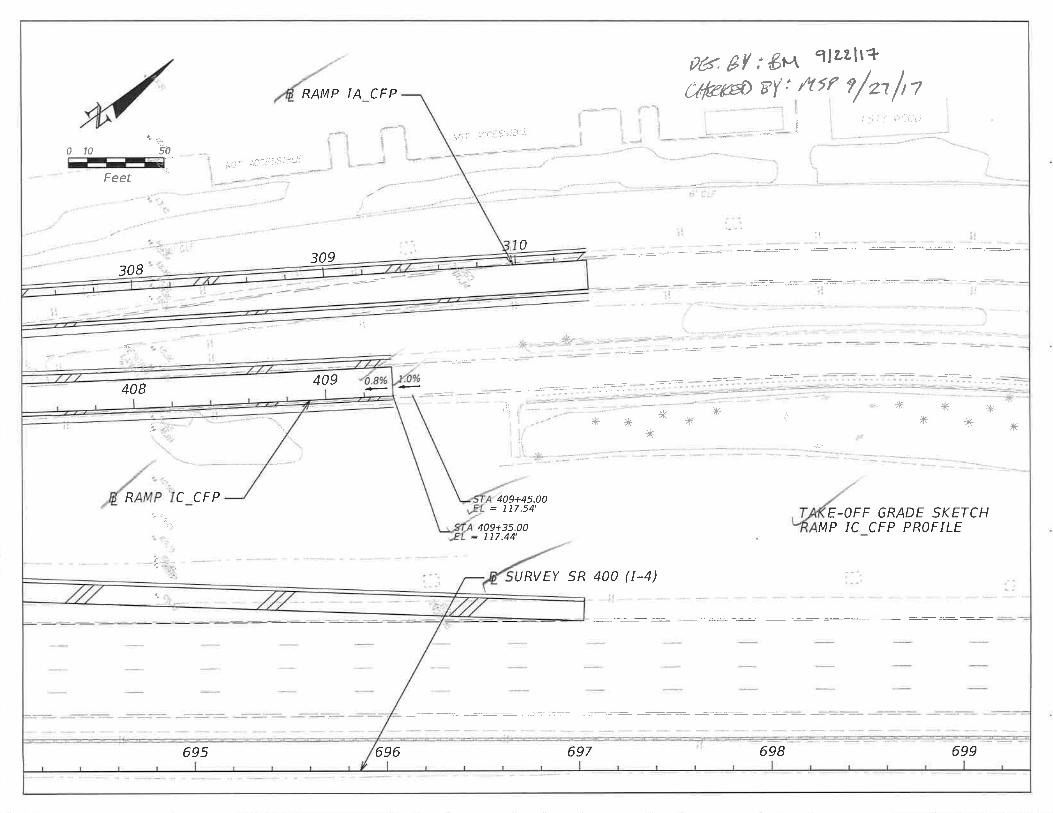
5.3 RAMP IC_CFP (WB CFP TO WB I-4 (VIA IWBCD2))HORIZONTAL ALIGNMENT ..................................... 5.3.1STOPPING SIGHT DISTANCE ................................... 5.3.2SUPERELEVATION ................................................... 5.3.3VERTICAL ALIGNMENT ........................................... 5.3.4RAMP TERMINAL DETAILS (IC_CFP & IA_CFP) ...... 5.3.5

Interim Interchange at SR 400 (I-4) and Daryl Carter ParkwayFPID: 441113-1-52-01PRELIMINARY: NOT FOR CONSTRUCTION
SECTION SUBSECTION6. Temporary Traffic Control Plan (TTCP)
6.1 DIVERSION 1HORIZONTAL ALIGNMENT ..................................... 6.1.1STOPPING SIGHT DISTANCE ................................... 6.1.2SUPERELEVATION ................................................... 6.1.3VERTICAL ALIGNMENT ........................................... 6.1.4VERTICAL CLEARANCE ............................................ 6.1.5RAMP TERMINAL DETAILS(DIVERSION 1 & WB I-4) ......................................... 6.1.6
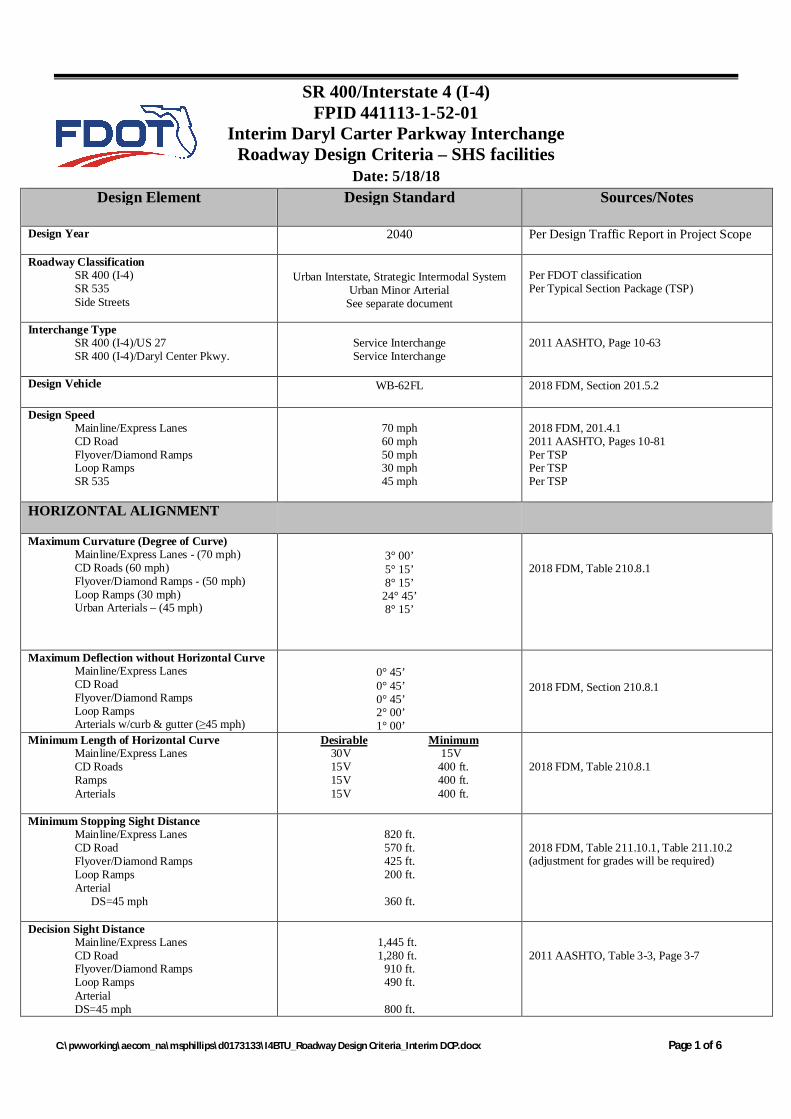
SR 400/Interstate 4 (I-4)FPID 441113-1-52-01
Interim Daryl Carter Parkway InterchangeRoadway Design Criteria – SHS facilities
Date: 5/18/18
C:\pwworking\aecom_na\msphillips\d0173133\I4BTU_Roadway Design Criteria_Interim DCP.docx Page 1 of 6
Design Element Design Standard Sources/Notes
Design Year 2040 Per Design Traffic Report in Project Scope
Roadway ClassificationSR 400 (I-4)SR 535Side Streets
Urban Interstate, Strategic Intermodal SystemUrban Minor Arterial
See separate document
Per FDOT classificationPer Typical Section Package (TSP)
Interchange TypeSR 400 (I-4)/US 27SR 400 (I-4)/Daryl Center Pkwy.
Service InterchangeService Interchange
2011 AASHTO, Page 10-63
Design Vehicle WB-62FL 2018 FDM, Section 201.5.2
Design SpeedMainline/Express LanesCD RoadFlyover/Diamond RampsLoop RampsSR 535
70 mph60 mph50 mph30 mph45 mph
2018 FDM, 201.4.12011 AASHTO, Pages 10-81Per TSPPer TSPPer TSP
HORIZONTAL ALIGNMENT
Maximum Curvature (Degree of Curve)Mainline/Express Lanes - (70 mph)CD Roads (60 mph)Flyover/Diamond Ramps - (50 mph)Loop Ramps (30 mph)Urban Arterials – (45 mph)
3° 00’5° 15’8° 15’24° 45’8° 15’
2018 FDM, Table 210.8.1
Maximum Deflection without Horizontal CurveMainline/Express LanesCD RoadFlyover/Diamond RampsLoop RampsArterials w/curb & gutter (≥45 mph)
0° 45’0° 45’0° 45’2° 00’1° 00’
2018 FDM, Section 210.8.1
Minimum Length of Horizontal CurveMainline/Express LanesCD RoadsRampsArterials
Desirable Minimum 30V 15V 15V 400 ft. 15V 400 ft. 15V 400 ft.
2018 FDM, Table 210.8.1
Minimum Stopping Sight DistanceMainline/Express LanesCD RoadFlyover/Diamond RampsLoop RampsArterial
DS=45 mph
820 ft.570 ft.425 ft.200 ft.
360 ft.
2018 FDM, Table 211.10.1, Table 211.10.2(adjustment for grades will be required)
Decision Sight DistanceMainline/Express LanesCD RoadFlyover/Diamond RampsLoop RampsArterialDS=45 mph
1,445 ft.1,280 ft.
910 ft.490 ft.
800 ft.
2011 AASHTO, Table 3-3, Page 3-7

SR 400/Interstate 4 (I-4)FPID 441113-1-52-01
Interim Daryl Carter Parkway InterchangeRoadway Design Criteria – SHS facilities
Date: 5/18/18
C:\pwworking\aecom_na\msphillips\d0173133\I4BTU_Roadway Design Criteria_Interim DCP.docx Page 2 of 6
Design Element Design Standard Sources/Notes
Lane Drop TaperMainline/Express LanesCD RoadArterial, DS≥45 mph
70:1 Des, 50:1 Min50:1 Min
L=WS
2011 AASHTO, Page 10-80
2018 FDM, Section 212.6
Add Lane TaperFreeway Auxiliary Lanes
TangentCurve
Arterial, DS≥45 mph
300 ft.100 ft.L=WS
2011 AASHTO, Figure 10-53 (B1 & B2), Pages10-78 and 10-1202018 FDM, Section 212.6
Minimum Spacing Ramp TerminalsEntrance to Exit (Weaving):
System to ServiceService to Service
Exit to EntranceEntrance to EntranceExit to ExitTurning Roadways:
System InterchangeService Interchange
Freeway CD Road
2000 ft. 1600 ft. 1600 ft. 1000 ft.
500 ft. 400 ft. 1000 ft. 800 ft. 1000 ft. 800 ft.
800 ft.600 ft.
2011 AASHTO,Figure 10-68, Page 10-106
Entrance and Exit Ramp DesignFlyover/Diamond Ramps Entrance ExitLoop Ramps Entrance Exit
Entrance Acceleration Lengths50 mph to 70 mph30 mph to 70 mph
All Speeds
Tapers
Exit Deceleration Lengths70 mph to 50 mph70 mph to 30 mph
All Speeds
Tapers
Taper Design with 50:1 (1200 ft.)Taper Design with 3° to 5°
Parallel Design:1,200’ accel + 300 ft. Taper800’ decel + 300 ft. Taper
580 ft. +Taper (Single Lane)*1350 ft. +Taper (Single Lane)*
(Two Lane Entrance) - First lane drop, treat assingle lane entrance with single lane taper.Second lane drop has an auxiliary lane taper anda tangent length that makes the total two-laneentrance length 2500 ft. min. (including a 300 ft.taper).
Single Lane (Taper Design) – 50:1 minSingle Lane (Parallel Design) - 300 ft. min
340 ft. +Taper (Single Lane)*520 ft. +Taper (Single Lane)*
(Two Lane Exit) -2500 ft. min. (Includes 300 ft.Taper)
Tapered Design, Single Lane: 2° - 5°Parallel Design, Single Lane: 250 ft. Min
(15:1 to 25:1)
2018/2019 FDOT Design Standard Index No. 525
Per Preliminary Engineering ReportPer Preliminary Engineering Report
2011 AASHTO, Figure 10-69 & Table 10-3,Pages 10-108 and 10-1102018/2019 FDOT Design Standard Index No. 525*All acceleration lengths will be adjustedaccording to grade per 2011 AASHTO Table 10-4, Page 10-112
2011 AASHTO, Figure 10-53, Page 10-78
2011 AASHTO, Figure 10-69, Page 10-108
2011 AASHTO, Figure 10-70 & Table 10-5,Pages10-114 & 10-115
2018/2019 FDOT Design Standard Index No. 525*All deceleration lengths will be adjustedaccording to grade per 2011 AASHTO Table 10-4, Page 10-1122011 AASHTO, Figure 10-53, Page 10-78
2011 AASHTO, Page 10-112, Page 10-116
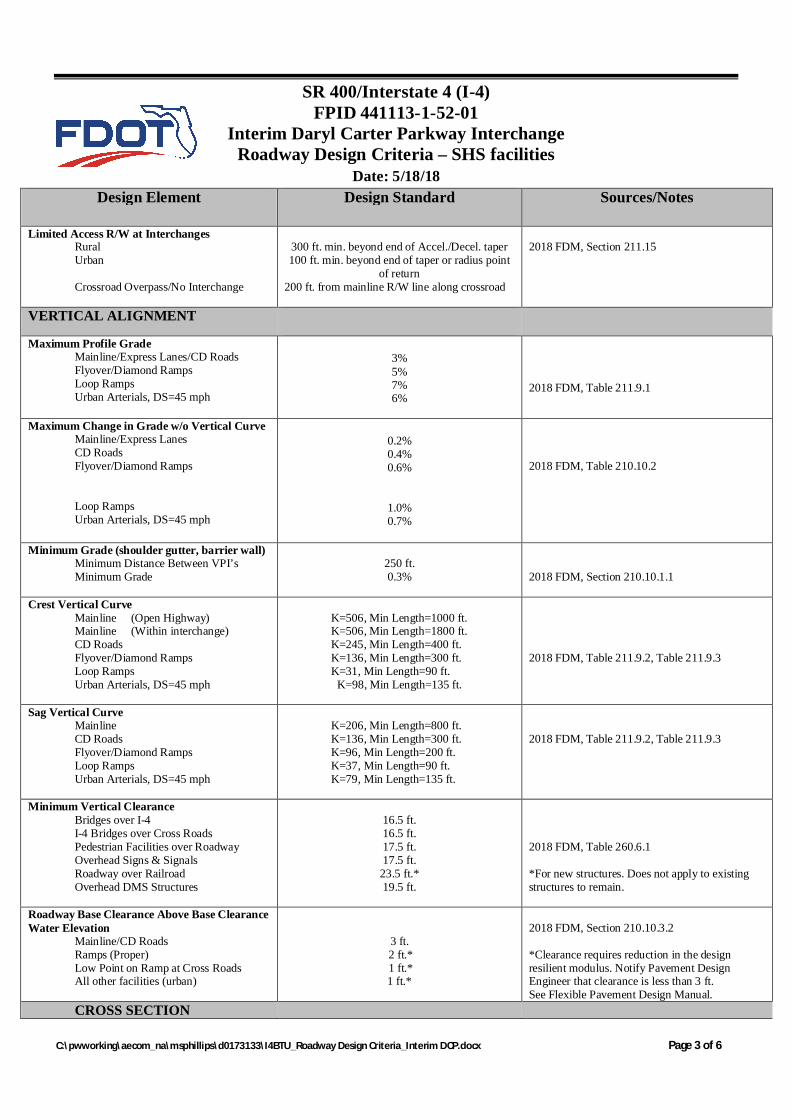
SR 400/Interstate 4 (I-4)FPID 441113-1-52-01
Interim Daryl Carter Parkway InterchangeRoadway Design Criteria – SHS facilities
Date: 5/18/18
C:\pwworking\aecom_na\msphillips\d0173133\I4BTU_Roadway Design Criteria_Interim DCP.docx Page 3 of 6
Design Element Design Standard Sources/Notes
Limited Access R/W at InterchangesRuralUrban
Crossroad Overpass/No Interchange
300 ft. min. beyond end of Accel./Decel. taper100 ft. min. beyond end of taper or radius point
of return200 ft. from mainline R/W line along crossroad
2018 FDM, Section 211.15
VERTICAL ALIGNMENT
Maximum Profile GradeMainline/Express Lanes/CD RoadsFlyover/Diamond RampsLoop RampsUrban Arterials, DS=45 mph
3%5%7%6%
2018 FDM, Table 211.9.1
Maximum Change in Grade w/o Vertical CurveMainline/Express LanesCD RoadsFlyover/Diamond Ramps
Loop RampsUrban Arterials, DS=45 mph
0.2%0.4%0.6%
1.0%0.7%
2018 FDM, Table 210.10.2
Minimum Grade (shoulder gutter, barrier wall)Minimum Distance Between VPI’sMinimum Grade
250 ft.0.3% 2018 FDM, Section 210.10.1.1
Crest Vertical CurveMainline (Open Highway)Mainline (Within interchange)CD RoadsFlyover/Diamond RampsLoop RampsUrban Arterials, DS=45 mph
K=506, Min Length=1000 ft.K=506, Min Length=1800 ft.K=245, Min Length=400 ft.K=136, Min Length=300 ft.K=31, Min Length=90 ft.
K=98, Min Length=135 ft.
2018 FDM, Table 211.9.2, Table 211.9.3
Sag Vertical CurveMainlineCD RoadsFlyover/Diamond RampsLoop RampsUrban Arterials, DS=45 mph
K=206, Min Length=800 ft.K=136, Min Length=300 ft.K=96, Min Length=200 ft.K=37, Min Length=90 ft.K=79, Min Length=135 ft.
2018 FDM, Table 211.9.2, Table 211.9.3
Minimum Vertical ClearanceBridges over I-4I-4 Bridges over Cross RoadsPedestrian Facilities over RoadwayOverhead Signs & SignalsRoadway over RailroadOverhead DMS Structures
16.5 ft.16.5 ft.17.5 ft.17.5 ft.23.5 ft.*19.5 ft.
2018 FDM, Table 260.6.1
*For new structures. Does not apply to existingstructures to remain.
Roadway Base Clearance Above Base ClearanceWater Elevation
Mainline/CD RoadsRamps (Proper)Low Point on Ramp at Cross RoadsAll other facilities (urban)
3 ft. 2 ft.* 1 ft.*1 ft.*
2018 FDM, Section 210.10.3.2
*Clearance requires reduction in the designresilient modulus. Notify Pavement DesignEngineer that clearance is less than 3 ft.See Flexible Pavement Design Manual.
CROSS SECTION

SR 400/Interstate 4 (I-4)FPID 441113-1-52-01
Interim Daryl Carter Parkway InterchangeRoadway Design Criteria – SHS facilities
Date: 5/18/18
C:\pwworking\aecom_na\msphillips\d0173133\I4BTU_Roadway Design Criteria_Interim DCP.docx Page 4 of 6
Design Element Design Standard Sources/Notes
Lane WidthsMainline/Express LanesCD Roads1-Lane Ramp2-Lane RampUrban Arterial
12 ft. - Tangent12 ft. - Tangent15 ft. - Tangent24 ft. - Tangent
11 ft. travel lane/7 ft. bicycle lane
2018 FDM, Tables 210.2.1
Median Width (Minimum)FREEWAYS
Without BarrierInterstateOther Freeways (> 60 mph)Other Freeways (< 60 mph)
With BarrierI-4 Mainline (Orange & Osceola Cos.)All other
ARTERIAL AND COLLECTORSDS < 45 mphDS > 45 mph
64 ft.60 ft.40 ft.
52 ft.26 ft.
22 ft.40 ft.
2018 FDM, Table 211.3.1
Per TSP and Preliminary Engineering Report. Toprovide 44 ft. rail corridor.
2018 FDM, Table 210.3.12018 FDM, Table 210.3.1
Shoulder Width, Roadway, Inside (or Left)Freeways
Mainline (Barrier-Separated, Osceola &Orange Cos.)CD, 2-LaneCD, 3-Lane1-Lane Ramp2-Lane Ramp3-Lane Ramp
Arterials4-Lane3-Lane2-Lane
Total Paved 10 ft. 10 ft.
8 ft. 4 ft. 12 ft. 10 ft. 6 ft. 2 ft. 8 ft. 4 ft. 12 ft. 10 ft.
12 ft. 4 ft. 12 ft. 0 ft. 8 ft. 0 ft.
Per TSP
2018 FDM, Table 211.4.12018 FDM, Table 211.4.12018 FDM, Table 211.4.12018 FDM, Table 211.4.12018 FDM, Table 211.4.1
2018 FDM, Table 210.4.12018 FDM, Table 210.4.12018 FDM, Table 210.4.1
Shoulder Width, Roadway, Outside (or Right)Freeways
MainlineMainline (Barrier-Separated)CD, 3-Lane1-Lane Ramp2-Lane Ramp3-Lane Ramp
Arterials4-Lane3-Lane2-Lane
Total Paved12 ft. 10 ft.12 ft. 12 ft.12 ft. 10 ft. 6 ft. 4 ft.
12 ft. 10 ft. 12 ft. 10 ft.
12 ft. 5 ft. 12 ft. 5 ft. 12 ft. 5 ft.
2018 FDM, Table 211.4.12018 FDM, Table 211.4.12018 FDM, Table 211.4.12018 FDM, Table 211.4.12018 FDM, Table 211.4.1Per TSP
2018 FDM, Table 210.4.12018 FDM, Table 210.4.12018 FDM, Table 210.4.1
Shoulder Width on Bridge StructuresFreeways and Divided Arterials (DS ≥ 50 mph)
MainlineCD Roads (2-Lane)1-Lane Ramp2-Lane Ramp3-Lane Ramp
Divided Arterials and CollectorsFlush shoulders on approach roadway with 3or more lanes
Inside Outside
10 ft. 10 ft. 6 ft. 10 ft. 6 ft. 6 ft. 6 ft. 10 ft.
10 ft. 10 ft.
10 ft. 10 ft.
2018 FDM, Figure 260.1.1
SR 400/Interstate 4 (I-4)FPID 441113-1-52-01
Interim Daryl Carter Parkway InterchangeRoadway Design Criteria – SHS facilities
Date: 5/18/18
C:\pwworking\aecom_na\msphillips\d0173133\I4BTU_Roadway Design Criteria_Interim DCP.docx Page 5 of 6
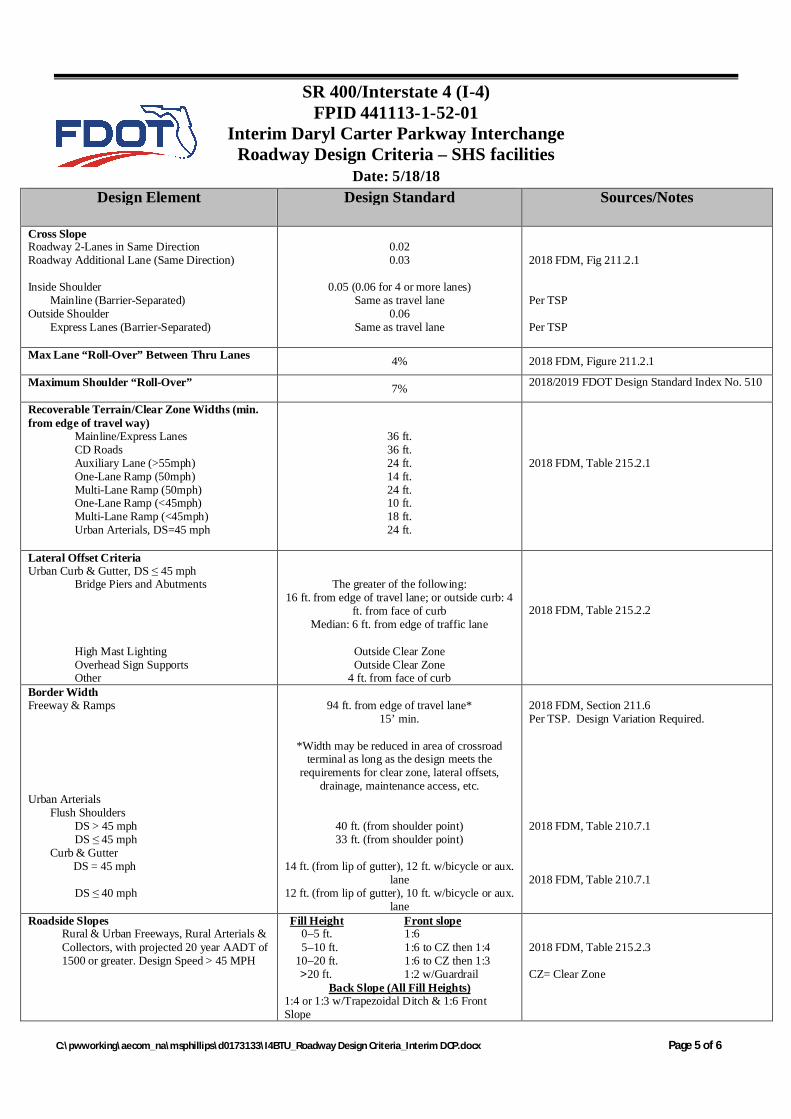
Design Element Design Standard Sources/Notes
Cross SlopeRoadway 2-Lanes in Same DirectionRoadway Additional Lane (Same Direction)
Inside ShoulderMainline (Barrier-Separated)
Outside ShoulderExpress Lanes (Barrier-Separated)
0.020.03
0.05 (0.06 for 4 or more lanes)Same as travel lane
0.06Same as travel lane
2018 FDM, Fig 211.2.1
Per TSP
Per TSP
Max Lane “Roll-Over” Between Thru Lanes 4% 2018 FDM, Figure 211.2.1
Maximum Shoulder “Roll-Over” 7% 2018/2019 FDOT Design Standard Index No. 510
Recoverable Terrain/Clear Zone Widths (min.from edge of travel way)
Mainline/Express LanesCD RoadsAuxiliary Lane (>55mph)One-Lane Ramp (50mph)Multi-Lane Ramp (50mph)One-Lane Ramp (<45mph)Multi-Lane Ramp (<45mph)Urban Arterials, DS=45 mph
36 ft.36 ft.24 ft.14 ft.24 ft.10 ft.18 ft.24 ft.
2018 FDM, Table 215.2.1
Lateral Offset CriteriaUrban Curb & Gutter, DS ≤ 45 mph
Bridge Piers and Abutments
High Mast LightingOverhead Sign SupportsOther
The greater of the following:16 ft. from edge of travel lane; or outside curb: 4
ft. from face of curbMedian: 6 ft. from edge of traffic lane
Outside Clear ZoneOutside Clear Zone
4 ft. from face of curb
2018 FDM, Table 215.2.2
Border WidthFreeway & Ramps
Urban ArterialsFlush Shoulders
DS > 45 mphDS ≤ 45 mph
Curb & GutterDS = 45 mph
DS ≤ 40 mph
94 ft. from edge of travel lane*15’ min.
*Width may be reduced in area of crossroadterminal as long as the design meets the
requirements for clear zone, lateral offsets,drainage, maintenance access, etc.
40 ft. (from shoulder point)33 ft. (from shoulder point)
14 ft. (from lip of gutter), 12 ft. w/bicycle or aux.lane
12 ft. (from lip of gutter), 10 ft. w/bicycle or aux.lane
2018 FDM, Section 211.6Per TSP. Design Variation Required.
2018 FDM, Table 210.7.1
2018 FDM, Table 210.7.1
Roadside SlopesRural & Urban Freeways, Rural Arterials &Collectors, with projected 20 year AADT of1500 or greater. Design Speed > 45 MPH
Fill Height Front slope 0–5 ft. 1:6 5–10 ft. 1:6 to CZ then 1:4 10–20 ft. 1:6 to CZ then 1:3 >20 ft. 1:2 w/Guardrail
Back Slope (All Fill Heights)1:4 or 1:3 w/Trapezoidal Ditch & 1:6 FrontSlope
2018 FDM, Table 215.2.3
CZ= Clear Zone
SR 400/Interstate 4 (I-4)FPID 441113-1-52-01
Interim Daryl Carter Parkway InterchangeRoadway Design Criteria – SHS facilities
Date: 5/18/18
C:\pwworking\aecom_na\msphillips\d0173133\I4BTU_Roadway Design Criteria_Interim DCP.docx Page 6 of 6
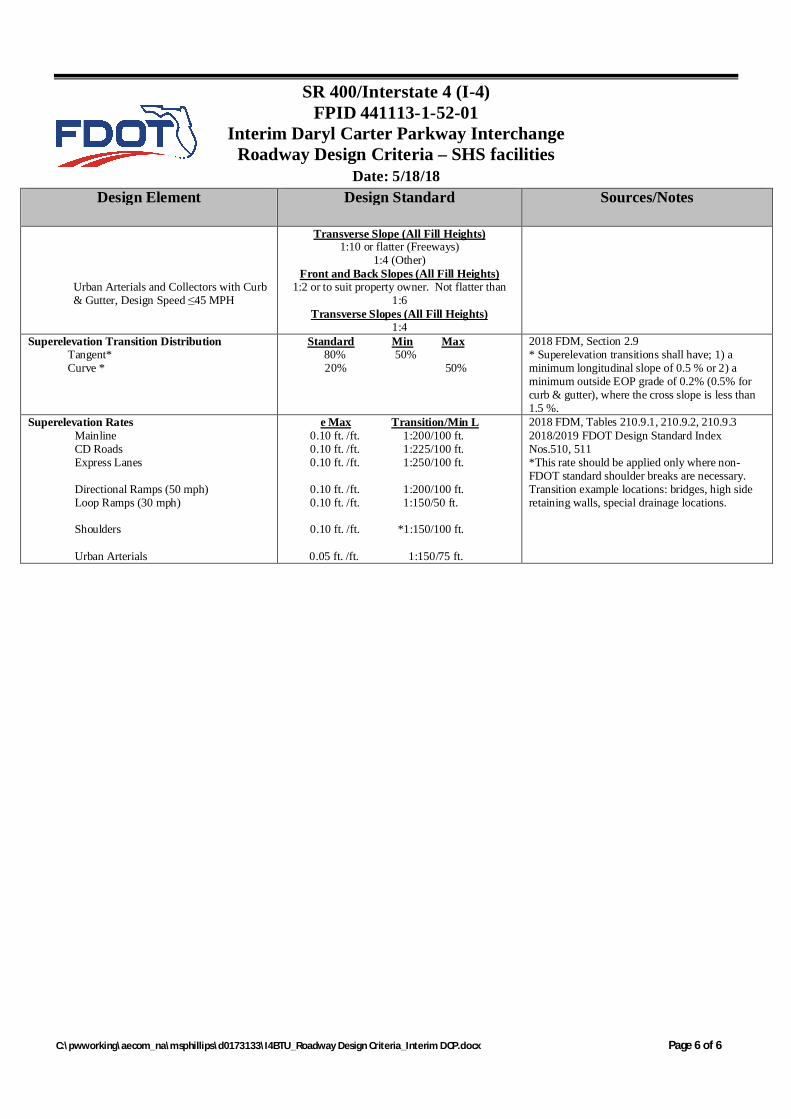
Design Element Design Standard Sources/Notes
Urban Arterials and Collectors with Curb& Gutter, Design Speed ≤45 MPH
Transverse Slope (All Fill Heights)1:10 or flatter (Freeways)
1:4 (Other)Front and Back Slopes (All Fill Heights)
1:2 or to suit property owner. Not flatter than1:6
Transverse Slopes (All Fill Heights)1:4
Superelevation Transition DistributionTangent*Curve *
Standard Min Max 80% 50%
20% 50%
2018 FDM, Section 2.9* Superelevation transitions shall have; 1) aminimum longitudinal slope of 0.5 % or 2) aminimum outside EOP grade of 0.2% (0.5% forcurb & gutter), where the cross slope is less than1.5 %.
Superelevation RatesMainlineCD RoadsExpress Lanes
Directional Ramps (50 mph)Loop Ramps (30 mph)
Shoulders
Urban Arterials
e Max Transition/Min L 0.10 ft. /ft. 1:200/100 ft. 0.10 ft. /ft. 1:225/100 ft. 0.10 ft. /ft. 1:250/100 ft.
0.10 ft. /ft. 1:200/100 ft. 0.10 ft. /ft. 1:150/50 ft.
0.10 ft. /ft. *1:150/100 ft.
0.05 ft. /ft. 1:150/75 ft.
2018 FDM, Tables 210.9.1, 210.9.2, 210.9.32018/2019 FDOT Design Standard IndexNos.510, 511*This rate should be applied only where non-FDOT standard shoulder breaks are necessary.Transition example locations: bridges, high sideretaining walls, special drainage locations.
SR 400/Interstate 4 (I-4)FPID 441113-1-52-01
Interim Daryl Carter Parkway InterchangeRoadway Design Criteria – Non SHS facilities
Date: 5/18/18
C:\pwworking\aecom_na\msphillips\d0173133\I4BTU_Roadway Design Criteria_Interim DCP_Non_SHS.docx Page 1 of 4
Design Element Design Standard Sources/Notes
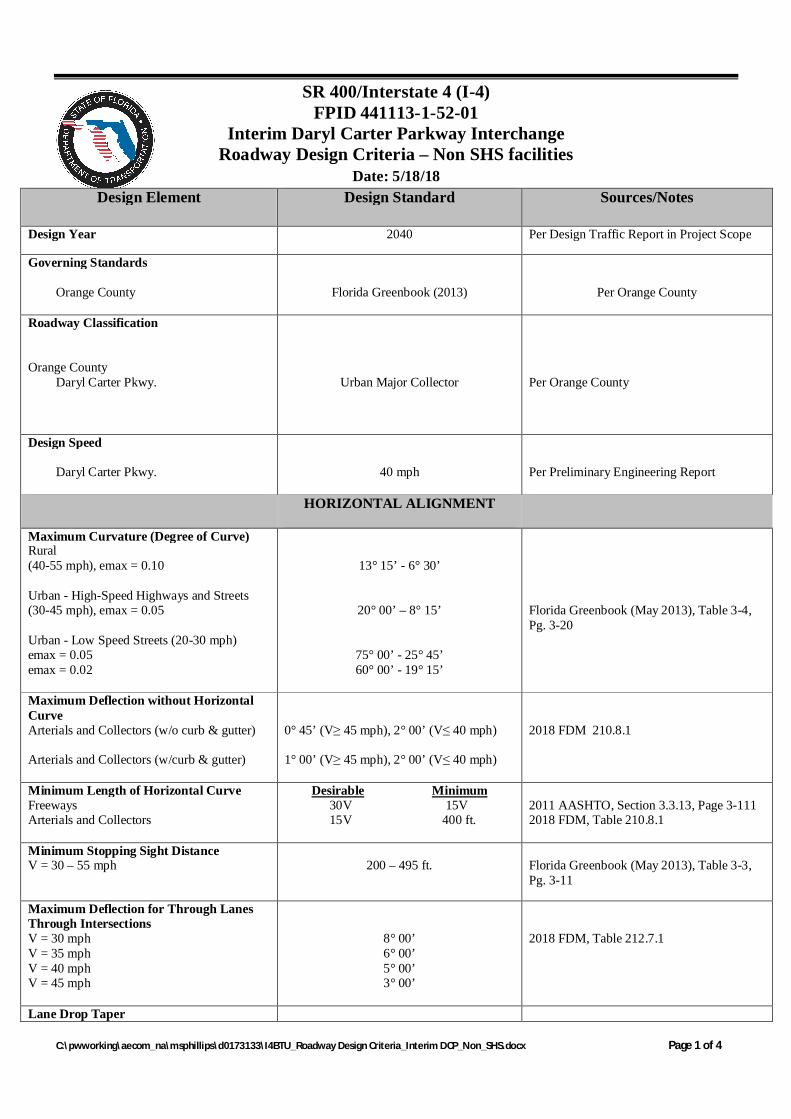
Design Year 2040 Per Design Traffic Report in Project Scope
Governing Standards
Orange County Florida Greenbook (2013) Per Orange County
Roadway Classification
Orange CountyDaryl Carter Pkwy. Urban Major Collector Per Orange County
Design Speed
Daryl Carter Pkwy. 40 mph Per Preliminary Engineering Report
HORIZONTAL ALIGNMENT
Maximum Curvature (Degree of Curve)Rural(40-55 mph), emax = 0.10
Urban - High-Speed Highways and Streets(30-45 mph), emax = 0.05
Urban - Low Speed Streets (20-30 mph)emax = 0.05emax = 0.02
13° 15’ - 6° 30’
20° 00’ – 8° 15’
75° 00’ - 25° 45’60° 00’ - 19° 15’
Florida Greenbook (May 2013), Table 3-4,Pg. 3-20
Maximum Deflection without HorizontalCurveArterials and Collectors (w/o curb & gutter)
Arterials and Collectors (w/curb & gutter)
0° 45’ (V≥ 45 mph), 2° 00’ (V≤ 40 mph)
1° 00’ (V≥ 45 mph), 2° 00’ (V≤ 40 mph)
2018 FDM 210.8.1
Minimum Length of Horizontal CurveFreewaysArterials and Collectors
Desirable Minimum 30V 15V 15V 400 ft.
2011 AASHTO, Section 3.3.13, Page 3-1112018 FDM, Table 210.8.1
Minimum Stopping Sight DistanceV = 30 – 55 mph 200 – 495 ft. Florida Greenbook (May 2013), Table 3-3,
Pg. 3-11
Maximum Deflection for Through LanesThrough IntersectionsV = 30 mphV = 35 mphV = 40 mphV = 45 mph
8° 00’6° 00’5° 00’3° 00’
2018 FDM, Table 212.7.1
Lane Drop Taper
SR 400/Interstate 4 (I-4)FPID 441113-1-52-01
Interim Daryl Carter Parkway InterchangeRoadway Design Criteria – Non SHS facilities
Date: 5/18/18
C:\pwworking\aecom_na\msphillips\d0173133\I4BTU_Roadway Design Criteria_Interim DCP_Non_SHS.docx Page 2 of 4
Design Element Design Standard Sources/Notes
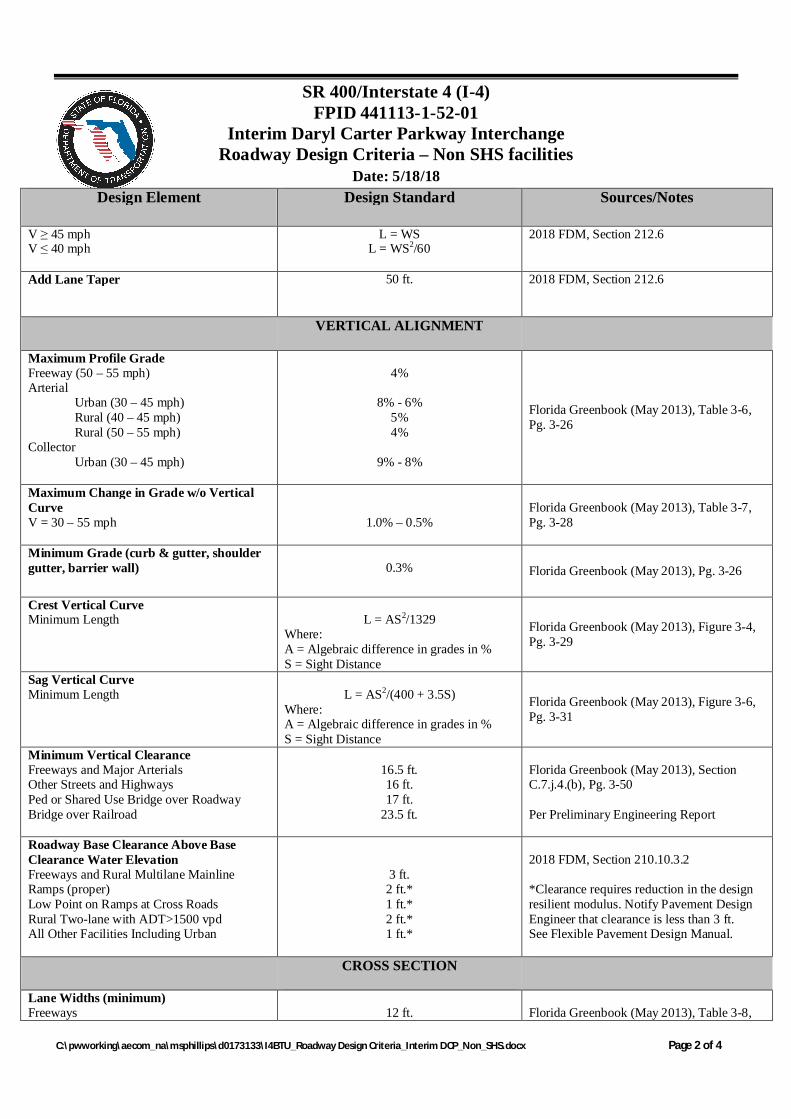
V ≥ 45 mphV ≤ 40 mph
L = WSL = WS2/60
2018 FDM, Section 212.6
Add Lane Taper 50 ft. 2018 FDM, Section 212.6
VERTICAL ALIGNMENT
Maximum Profile GradeFreeway (50 – 55 mph)Arterial
Urban (30 – 45 mph)Rural (40 – 45 mph)Rural (50 – 55 mph)
CollectorUrban (30 – 45 mph)
4%
8% - 6%5%4%
9% - 8%
Florida Greenbook (May 2013), Table 3-6,Pg. 3-26
Maximum Change in Grade w/o VerticalCurveV = 30 – 55 mph 1.0% – 0.5%
Florida Greenbook (May 2013), Table 3-7,Pg. 3-28
Minimum Grade (curb & gutter, shouldergutter, barrier wall) 0.3% Florida Greenbook (May 2013), Pg. 3-26
Crest Vertical CurveMinimum Length L = AS2/1329
Where:A = Algebraic difference in grades in %S = Sight Distance
Florida Greenbook (May 2013), Figure 3-4,Pg. 3-29
Sag Vertical CurveMinimum Length L = AS2/(400 + 3.5S)
Where:A = Algebraic difference in grades in %S = Sight Distance
Florida Greenbook (May 2013), Figure 3-6,Pg. 3-31
Minimum Vertical ClearanceFreeways and Major ArterialsOther Streets and HighwaysPed or Shared Use Bridge over RoadwayBridge over Railroad
16.5 ft.16 ft.17 ft.
23.5 ft.
Florida Greenbook (May 2013), SectionC.7.j.4.(b), Pg. 3-50
Per Preliminary Engineering Report
Roadway Base Clearance Above BaseClearance Water ElevationFreeways and Rural Multilane MainlineRamps (proper)Low Point on Ramps at Cross RoadsRural Two-lane with ADT>1500 vpdAll Other Facilities Including Urban
3 ft.2 ft.*1 ft.*2 ft.*1 ft.*
2018 FDM, Section 210.10.3.2
*Clearance requires reduction in the designresilient modulus. Notify Pavement DesignEngineer that clearance is less than 3 ft.See Flexible Pavement Design Manual.
CROSS SECTION
Lane Widths (minimum)Freeways 12 ft. Florida Greenbook (May 2013), Table 3-8,
SR 400/Interstate 4 (I-4)FPID 441113-1-52-01
Interim Daryl Carter Parkway InterchangeRoadway Design Criteria – Non SHS facilities
Date: 5/18/18
C:\pwworking\aecom_na\msphillips\d0173133\I4BTU_Roadway Design Criteria_Interim DCP_Non_SHS.docx Page 3 of 4
Design Element Design Standard Sources/Notes
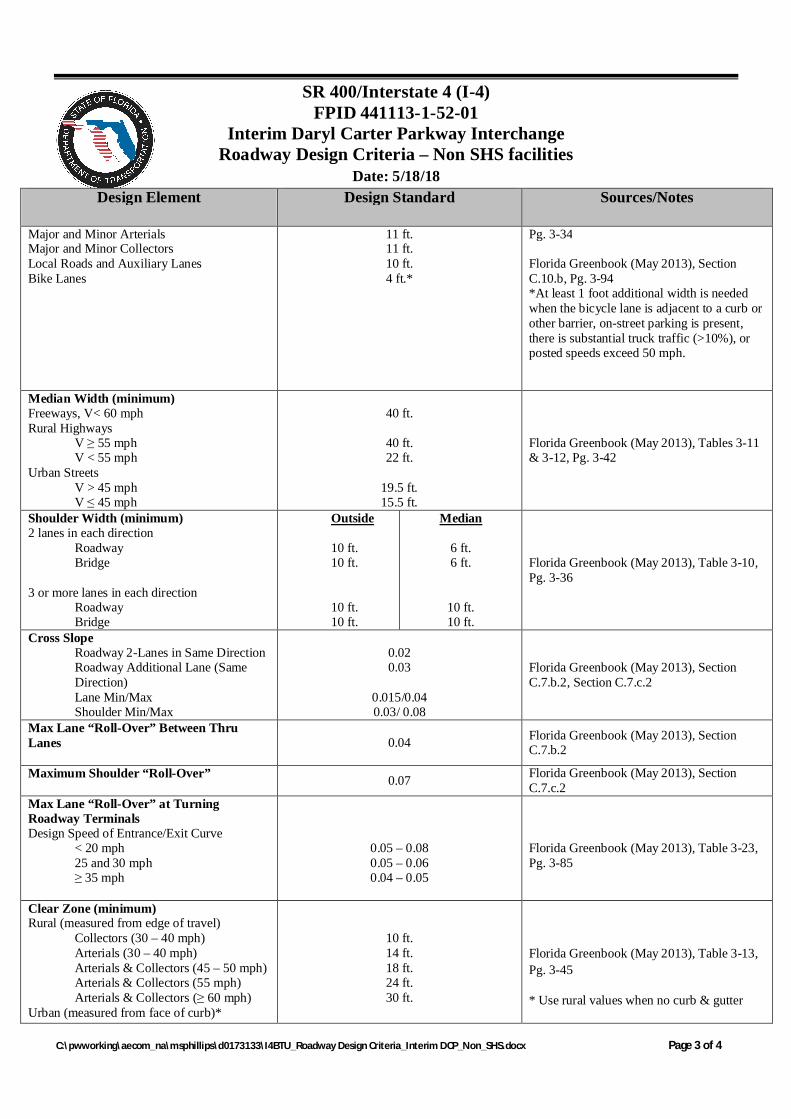
Major and Minor ArterialsMajor and Minor CollectorsLocal Roads and Auxiliary LanesBike Lanes
11 ft.11 ft.10 ft.4 ft.*
Pg. 3-34
Florida Greenbook (May 2013), SectionC.10.b, Pg. 3-94*At least 1 foot additional width is neededwhen the bicycle lane is adjacent to a curb orother barrier, on-street parking is present,there is substantial truck traffic (>10%), orposted speeds exceed 50 mph.
Median Width (minimum)Freeways, V< 60 mphRural Highways
V ≥ 55 mphV < 55 mph
Urban StreetsV > 45 mphV ≤ 45 mph
40 ft.
40 ft.22 ft.
19.5 ft.15.5 ft.
Florida Greenbook (May 2013), Tables 3-11& 3-12, Pg. 3-42
Shoulder Width (minimum)2 lanes in each direction
RoadwayBridge
3 or more lanes in each directionRoadwayBridge
Outside
10 ft.10 ft.
10 ft.10 ft.
Median
6 ft.6 ft.
10 ft.10 ft.
Florida Greenbook (May 2013), Table 3-10,Pg. 3-36
Cross SlopeRoadway 2-Lanes in Same DirectionRoadway Additional Lane (SameDirection)Lane Min/MaxShoulder Min/Max
0.020.03
0.015/0.040.03/ 0.08
Florida Greenbook (May 2013), SectionC.7.b.2, Section C.7.c.2
Max Lane “Roll-Over” Between ThruLanes 0.04 Florida Greenbook (May 2013), Section
C.7.b.2
Maximum Shoulder “Roll-Over” 0.07 Florida Greenbook (May 2013), SectionC.7.c.2
Max Lane “Roll-Over” at TurningRoadway TerminalsDesign Speed of Entrance/Exit Curve
< 20 mph25 and 30 mph≥ 35 mph
0.05 – 0.080.05 – 0.060.04 – 0.05
Florida Greenbook (May 2013), Table 3-23,Pg. 3-85
Clear Zone (minimum)Rural (measured from edge of travel)
Collectors (30 – 40 mph)Arterials (30 – 40 mph)Arterials & Collectors (45 – 50 mph)Arterials & Collectors (55 mph)Arterials & Collectors (≥ 60 mph)
Urban (measured from face of curb)*
10 ft.14 ft.18 ft.24 ft.30 ft.
Florida Greenbook (May 2013), Table 3-13,Pg. 3-45
* Use rural values when no curb & gutter

SR 400/Interstate 4 (I-4)FPID 441113-1-52-01
Interim Daryl Carter Parkway InterchangeRoadway Design Criteria – Non SHS facilities
Date: 5/18/18
C:\pwworking\aecom_na\msphillips\d0173133\I4BTU_Roadway Design Criteria_Interim DCP_Non_SHS.docx Page 4 of 4
Design Element Design Standard Sources/Notes
25 mph and below30 – 45 mph
1.5 ft. 4 ft.**
**1.5 ft. min where 4 ft. deemed impractical
Roadside SlopesFill slopes
Cut slopes and ditch backslopes
Ditch bottom width
1:4 or flatter, 1:3 max within clear zone
1:3 max within clear zone, 1:4 desirable
4 ft. min.
Florida Greenbook (May 2013), SectionC.7.f.2
Superelevation RatesRural Highways, Urban Freeways and HighSpeed Urban Arterials
2 lane & 4 lane (45 – 60 mph)6 lane (45 – 60 mph)
Urban Highways and High Speed UrbanStreets (30 – 50 mph)
Emax
0.10 ft/ft0.10 ft/ft
0.05 ft/ft
Transition rate/(Min L)
1:200 – 1:225/(100 ft.)1:160 – 1:180/(100 ft.)
1:100 – 1:150/(50 – 75 ft.)
Florida Greenbook (May 2013), SectionC.4.b and
2018/2019 FDOT Design Standard IndexNo. 510
2018/2019 FDOT Design Standard IndexNo. 511
Superelevation Transition DistributionTangentCurve
Standard80%20%
2018/2019 FDOT Design Standard IndexNos. 510 & 511


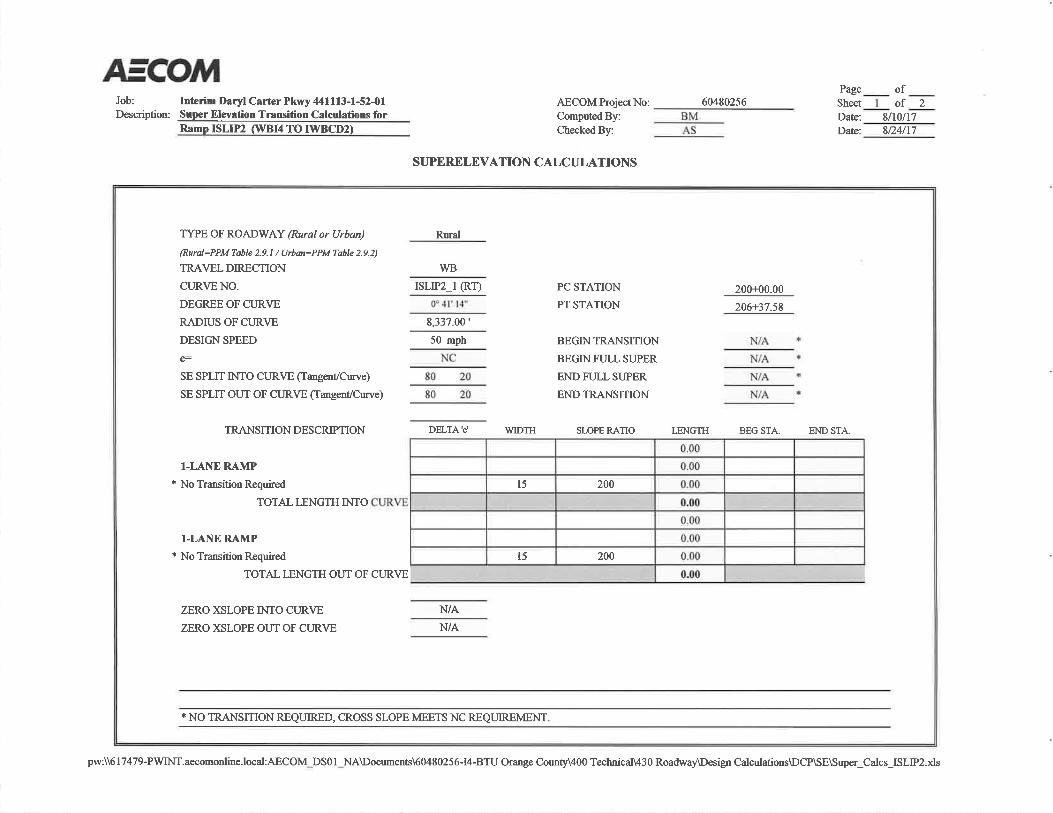


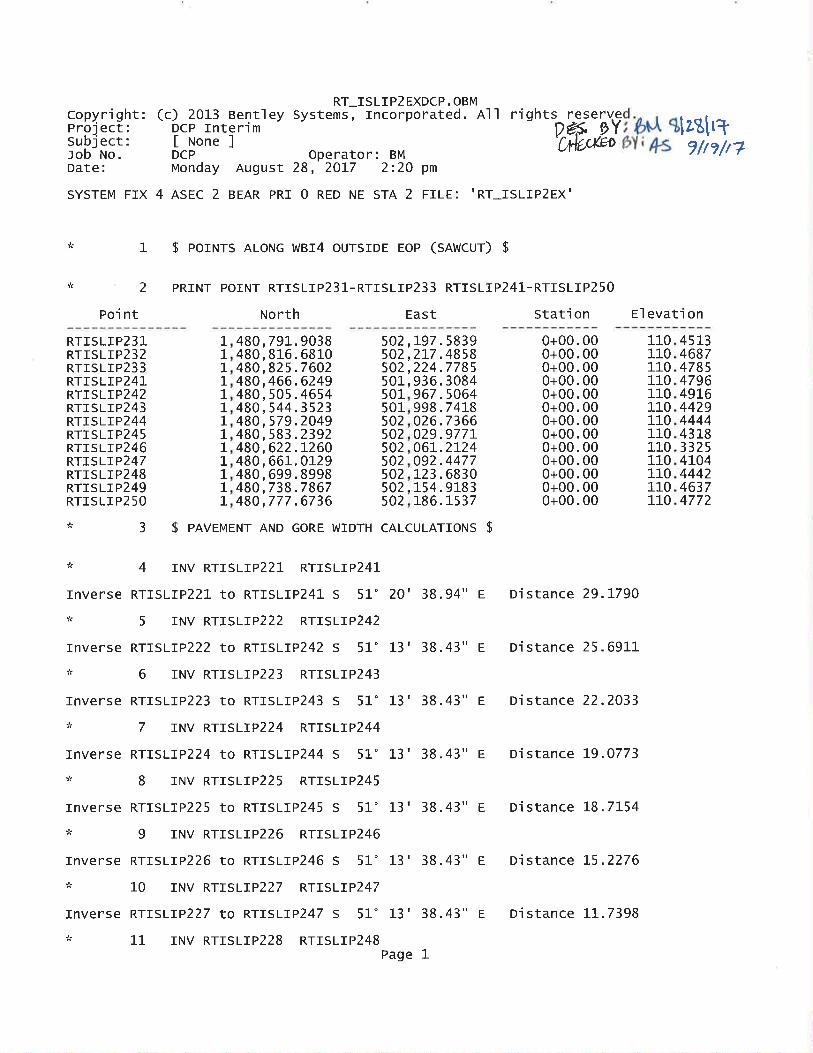
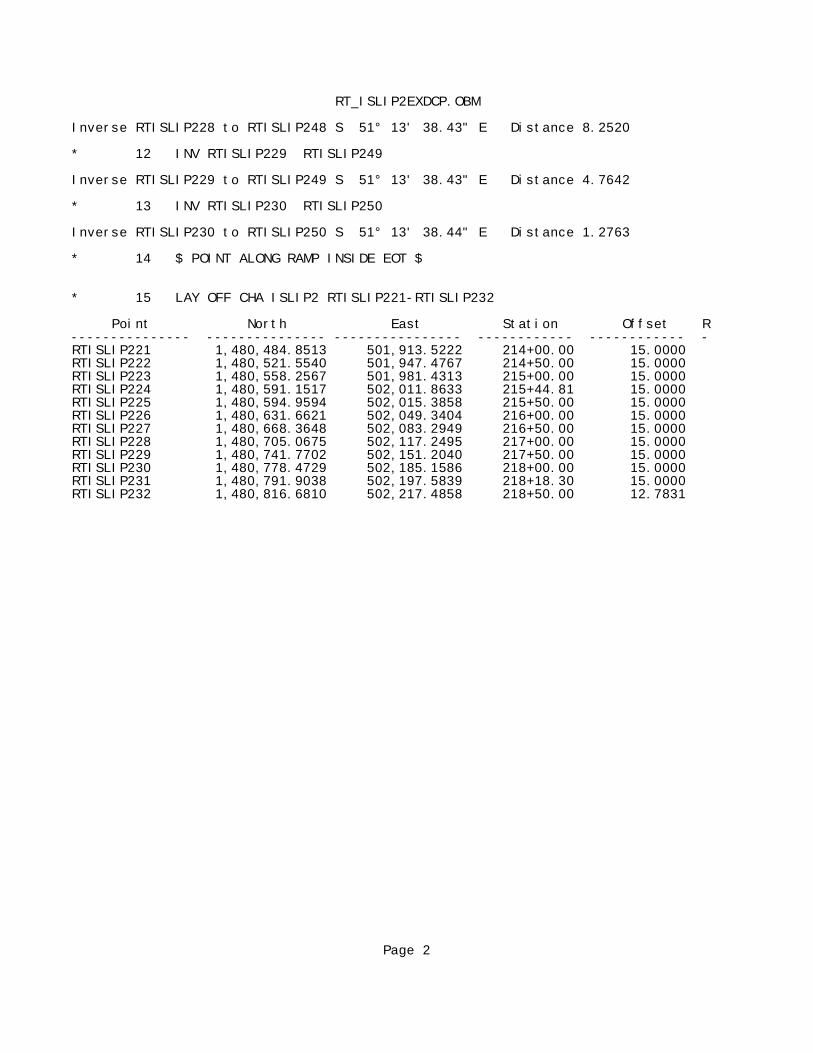
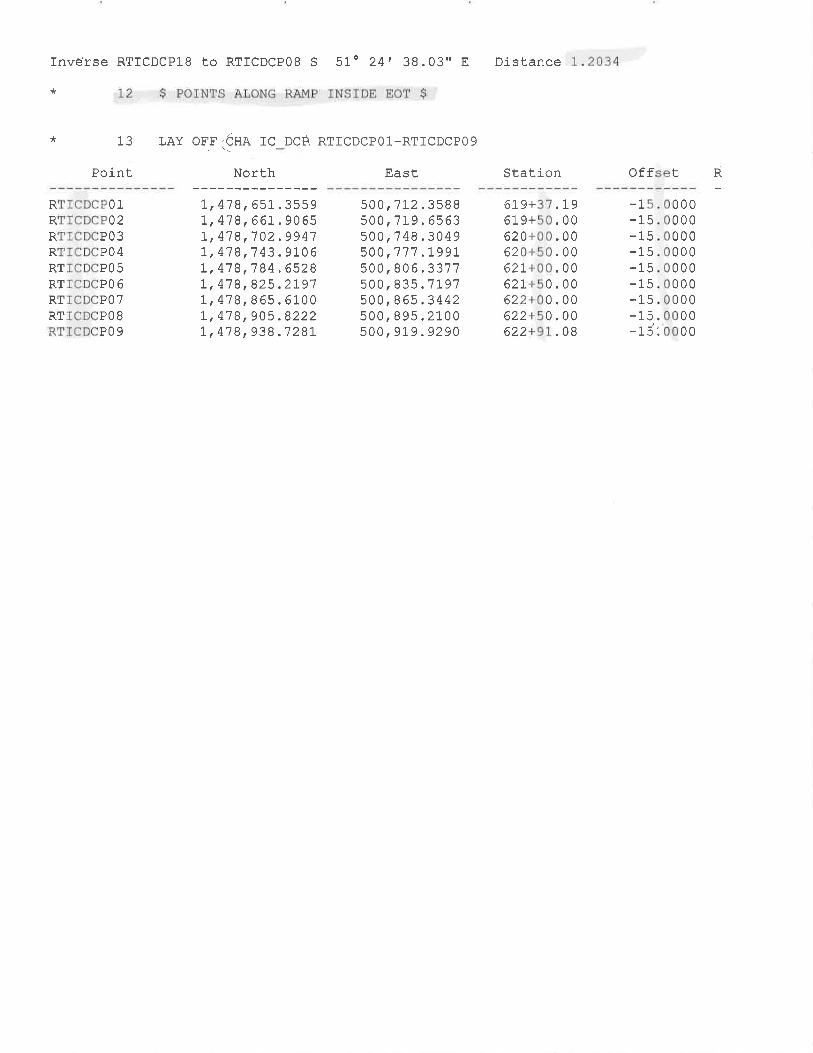
RT_ISLIP2EXDCP.OBM
Inverse RTISLIP228 to RTISLIP248 S 51° 13' 38.43" E Distance 8.2520
* 12 INV RTISLIP229 RTISLIP249
Inverse RTISLIP229 to RTISLIP249 S 51° 13' 38.43" E Distance 4.7642
* 13 INV RTISLIP230 RTISLIP250
Inverse RTISLIP230 to RTISLIP250 S 51° 13' 38.44" E Distance 1.2763
* 14 $ POINT ALONG RAMP INSIDE EOT $
* 15 LAY OFF CHA ISLIP2 RTISLIP221-RTISLIP232
Point North East Station Offset R--------------- --------------- ---------------- ------------ ------------ -RTISLIP221 1,480,484.8513 501,913.5222 214+00.00 15.0000RTISLIP222 1,480,521.5540 501,947.4767 214+50.00 15.0000RTISLIP223 1,480,558.2567 501,981.4313 215+00.00 15.0000RTISLIP224 1,480,591.1517 502,011.8633 215+44.81 15.0000RTISLIP225 1,480,594.9594 502,015.3858 215+50.00 15.0000RTISLIP226 1,480,631.6621 502,049.3404 216+00.00 15.0000RTISLIP227 1,480,668.3648 502,083.2949 216+50.00 15.0000RTISLIP228 1,480,705.0675 502,117.2495 217+00.00 15.0000RTISLIP229 1,480,741.7702 502,151.2040 217+50.00 15.0000RTISLIP230 1,480,778.4729 502,185.1586 218+00.00 15.0000RTISLIP231 1,480,791.9038 502,197.5839 218+18.30 15.0000RTISLIP232 1,480,816.6810 502,217.4858 218+50.00 12.7831
Page 2
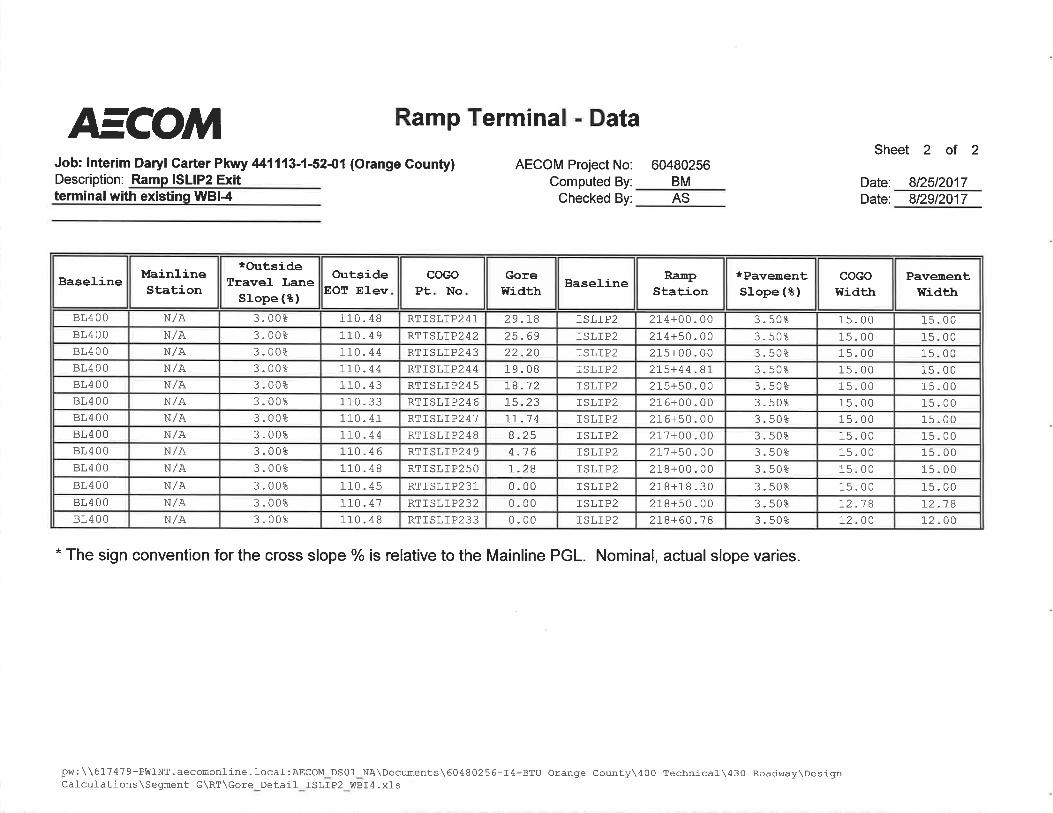
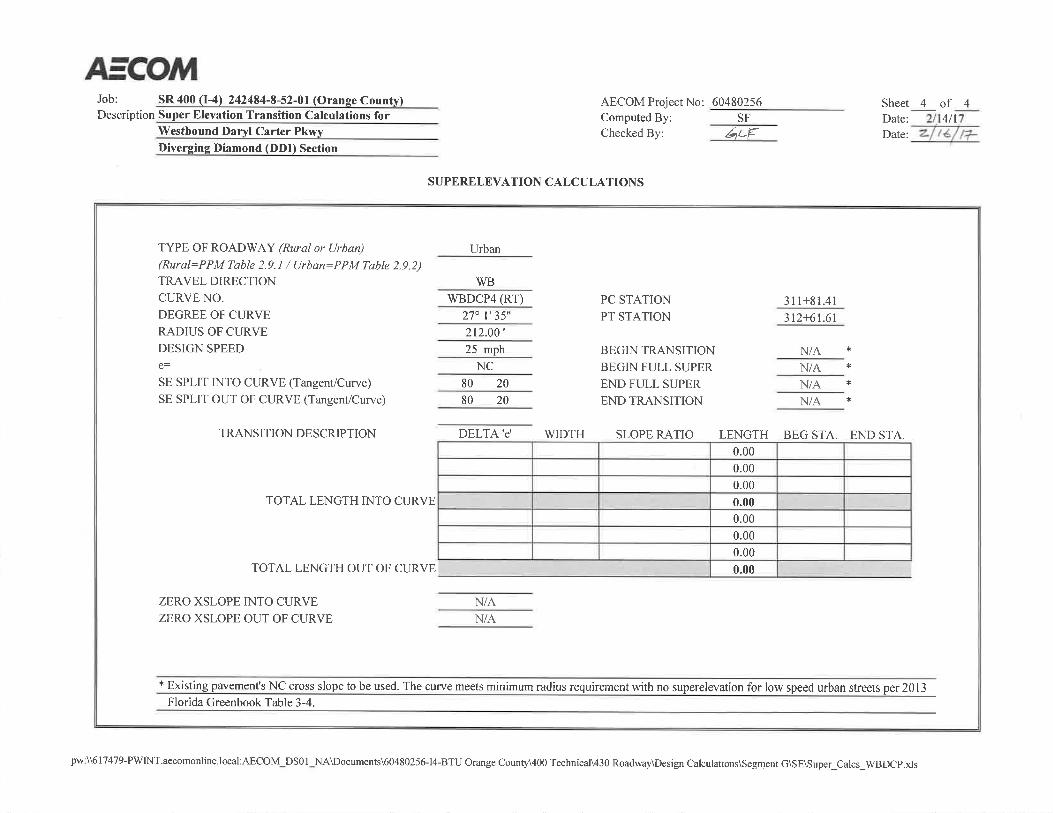
Sheet 1 of 4Job: Interim Daryl Carter Pkwy 441113-1-52-01 (Orange County) AECOM Project No: 60480256Description: Computed By: BM Date: 4/25/2018
Checked By: MSP Date: 4/25/2018
BaselineMainlineStation
PGLElev.
*OutsideTravel LaneSlope(%)
OutsideEOT
Offset
OutsideEOT Elev.
GoreWidth
GoreSlope(%)
InsideElev.
*PavementSlope(%)
PavementWidth
OutsideElev.
BaselineRamp
Station
IWBCD2 7080+36.19 122.42 2.00% 29.27 121.84 0.00 N/A 122.42 2.00% 0.00 122.42 ISLIP2 200+00.00IWBCD2 7080+86.19 122.17 2.00% 27.39 121.63 0.00 N/A 122.17 2.00% 0.15 122.18 ISLIP2 200+50.00IWBCD2 7081+36.19 121.92 2.00% 25.39 121.42 0.00 N/A 121.92 2.00% 0.60 121.94 ISLIP2 201+00.00IWBCD2 7081+86.18 121.68 2.00% 24.00 121.20 0.00 N/A 121.68 2.00% 1.35 121.70 ISLIP2 201+50.00IWBCD2 7082+36.17 121.43 2.00% 24.00 120.95 0.00 N/A 121.43 2.00% 2.40 121.47 ISLIP2 202+00.00IWBCD2 7082+86.15 121.18 2.00% 24.00 120.70 0.00 N/A 121.18 2.00% 3.75 121.25 ISLIP2 202+50.00IWBCD2 7083+36.13 120.93 2.00% 24.00 120.45 0.00 N/A 120.93 2.00% 5.40 121.03 ISLIP2 203+00.00IWBCD2 7083+86.09 120.68 2.00% 24.00 120.20 0.00 N/A 120.68 2.00% 7.35 120.82 ISLIP2 203+50.00IWBCD2 7084+36.04 120.43 2.00% 24.00 119.95 0.00 N/A 120.43 2.00% 9.59 120.62 ISLIP2 204+00.00IWBCD2 7084+85.97 120.18 2.00% 24.00 119.70 0.00 N/A 120.18 2.00% 12.14 120.42 ISLIP2 204+50.00IWBCD2 7085+36.53 119.92 2.00% 24.00 119.44 0.00 N/A 119.92 2.00% 15.00 120.22 ISLIP2 204+99.74IWBCD2 7085+86.78 119.67 2.00% 24.00 119.19 3.17 2.00% 119.74 2.00% 15.00 120.04 ISLIP2 205+50.00IWBCD2 7086+36.75 119.42 2.00% 24.00 118.94 6.62 2.00% 119.55 2.00% 15.00 119.85 ISLIP2 206+00.00IWBCD2 7086+86.68 119.17 2.00% 24.00 118.69 10.36 2.00% 119.38 2.00% 15.00 119.68 ISLIP2 206+50.00IWBCD2 7087+36.53 118.92 2.00% 24.00 118.44 14.18 2.00% 119.21 2.00% 15.00 119.51 ISLIP2 207+00.00IWBCD2 7087+73.33 118.74 2.00% 24.00 118.26 17.00 2.00% 119.08 2.00% 15.00 119.38 ISLIP2 207+36.90
* The sign convention for the cross slope % is relative to the Mainline PGL.
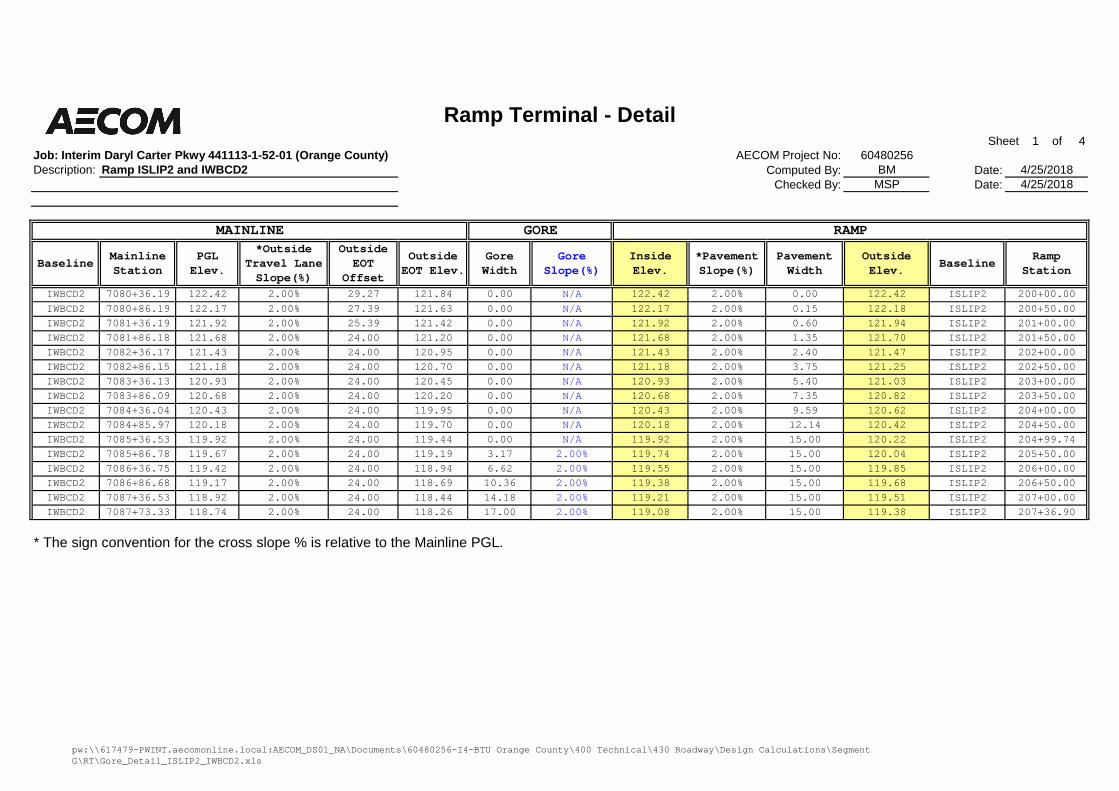
Ramp Terminal - Detail
Ramp ISLIP2 and IWBCD2
MAINLINE GORE RAMP
pw:\\617479-PWINT.aecomonline.local:AECOM_DS01_NA\Documents\60480256-I4-BTU Orange County\400 Technical\430 Roadway\Design Calculations\SegmentG\RT\Gore_Detail_ISLIP2_IWBCD2.xls

Sheet 2 of 4Job: Interim Daryl Carter Pkwy 441113-1-52-01 (Orange County) AECOM Project No: 60480256Description: Computed By: BM Date: 4/25/2018
Checked By: MSP Date: 4/25/2018
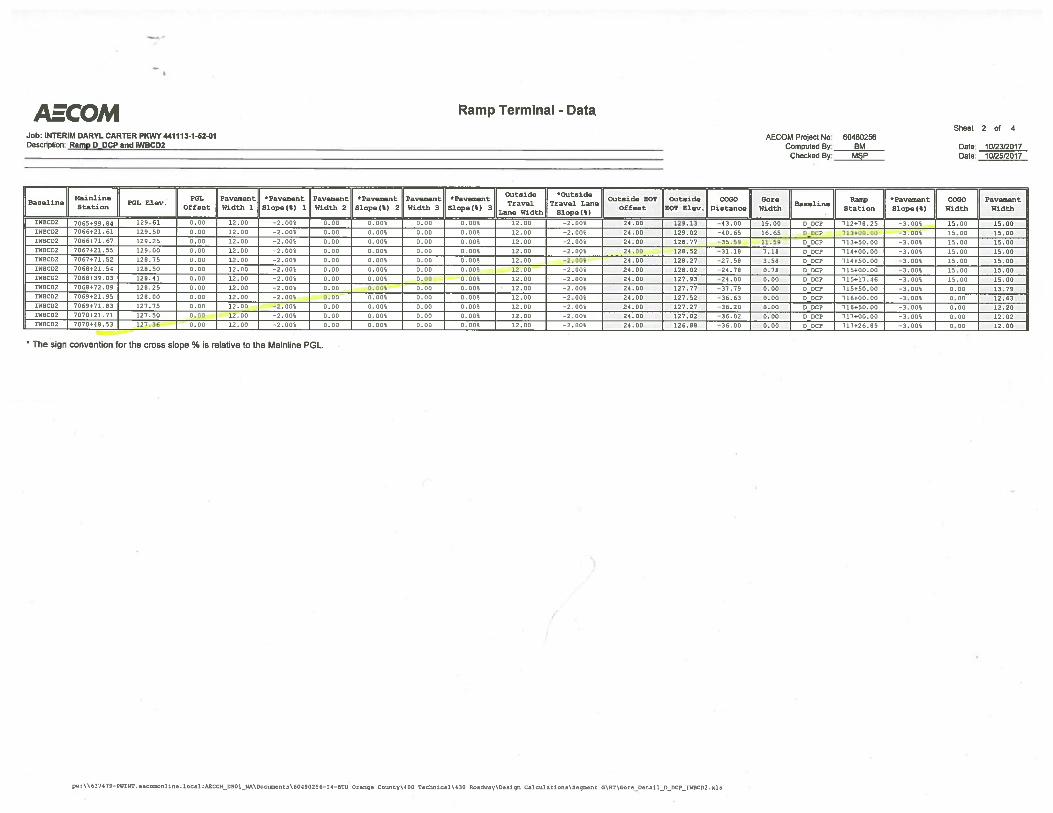
BaselineMainlineStation
PGLElev.
PGLOffset
PavementWidth 1
*PavementSlope(%)
1
Pavement Width
2
*Pavement
Slope(%) 2
Pavement
Width3
*Pavement
Slope(%) 3
OutsideTravelLaneWidth
*OutsideTravel LaneSlope(%)
OutsideEOT
Offset
OutsideEOT Elev.
COGODistance
GoreWidth
BaselineRamp
Station*PavementSlope(%)
COGOWidth
PavementWidth
IWBCD2 7080+36.19 122.42 0.00 0.00 0.00% 0.00 0.00% 0.00 0.00% 29.27 2.00% 29.27 121.84 0.00 0.00 ISLIP2 200+00.00 2.00% 0.00 0.00
IWBCD2 7080+86.19 122.17 0.00 0.00 0.00% 0.00 0.00% 0.00 0.00% 27.39 2.00% 27.39 121.63 0.15 0.00 ISLIP2 200+50.00 2.00% 0.00 0.15IWBCD2 7081+36.19 121.92 0.00 0.00 0.00% 0.00 0.00% 0.00 0.00% 25.39 2.00% 25.39 121.42 0.60 0.00 ISLIP2 201+00.00 2.00% 0.00 0.60IWBCD2 7081+86.18 121.68 0.00 0.00 0.00% 0.00 0.00% 0.00 0.00% 24.00 2.00% 24.00 121.20 1.35 0.00 ISLIP2 201+50.00 2.00% 0.00 1.35IWBCD2 7082+36.17 121.43 0.00 0.00 0.00% 0.00 0.00% 0.00 0.00% 24.00 2.00% 24.00 120.95 2.40 0.00 ISLIP2 202+00.00 2.00% 0.00 2.40IWBCD2 7082+86.15 121.18 0.00 0.00 0.00% 0.00 0.00% 0.00 0.00% 24.00 2.00% 24.00 120.70 3.75 0.00 ISLIP2 202+50.00 2.00% 0.00 3.75IWBCD2 7083+36.13 120.93 0.00 0.00 0.00% 0.00 0.00% 0.00 0.00% 24.00 2.00% 24.00 120.45 5.40 0.00 ISLIP2 203+00.00 2.00% 0.00 5.40IWBCD2 7083+86.09 120.68 0.00 0.00 0.00% 0.00 0.00% 0.00 0.00% 24.00 2.00% 24.00 120.20 7.35 0.00 ISLIP2 203+50.00 2.00% 0.00 7.35IWBCD2 7084+36.04 120.43 0.00 0.00 0.00% 0.00 0.00% 0.00 0.00% 24.00 2.00% 24.00 119.95 9.59 0.00 ISLIP2 204+00.00 2.00% 0.00 9.59IWBCD2 7084+85.97 120.18 0.00 0.00 0.00% 0.00 0.00% 0.00 0.00% 24.00 2.00% 24.00 119.70 12.14 0.00 ISLIP2 204+50.00 2.00% 0.00 12.14IWBCD2 7085+36.53 119.92 0.00 0.00 0.00% 0.00 0.00% 0.00 0.00% 24.00 2.00% 24.00 119.44 0.00 0.00 ISLIP2 204+99.74 2.00% -15.00 15.00IWBCD2 7085+86.78 119.67 0.00 0.00 0.00% 0.00 0.00% 0.00 0.00% 24.00 2.00% 24.00 119.19 3.17 3.17 ISLIP2 205+50.00 2.00% -15.00 15.00IWBCD2 7086+36.75 119.42 0.00 0.00 0.00% 0.00 0.00% 0.00 0.00% 24.00 2.00% 24.00 118.94 6.62 6.62 ISLIP2 206+00.00 2.00% -15.00 15.00IWBCD2 7086+86.68 119.17 0.00 0.00 0.00% 0.00 0.00% 0.00 0.00% 24.00 2.00% 24.00 118.69 25.32 10.36 ISLIP2 206+50.00 2.00% 15.00 15.00IWBCD2 7087+36.53 118.92 0.00 0.00 0.00% 0.00 0.00% 0.00 0.00% 24.00 2.00% 24.00 118.44 29.14 14.18 ISLIP2 207+00.00 2.00% 15.00 15.00IWBCD2 7087+73.33 118.74 0.00 0.00 0.00% 0.00 0.00% 0.00 0.00% 24.00 2.00% 24.00 118.26 31.96 17.00 ISLIP2 207+36.90 2.00% 15.00 15.00
* The sign convention for the cross slope % is relative to the Mainline PGL.
Ramp Terminal - Data
Ramp ISLIP2 and IWBCD2
pw:\\617479-PWINT.aecomonline.local:AECOM_DS01_NA\Documents\60480256-I4-BTU Orange County\400 Technical\430 Roadway\Design Calculations\Segment G\RT\Gore_Detail_ISLIP2_IWBCD2.xls
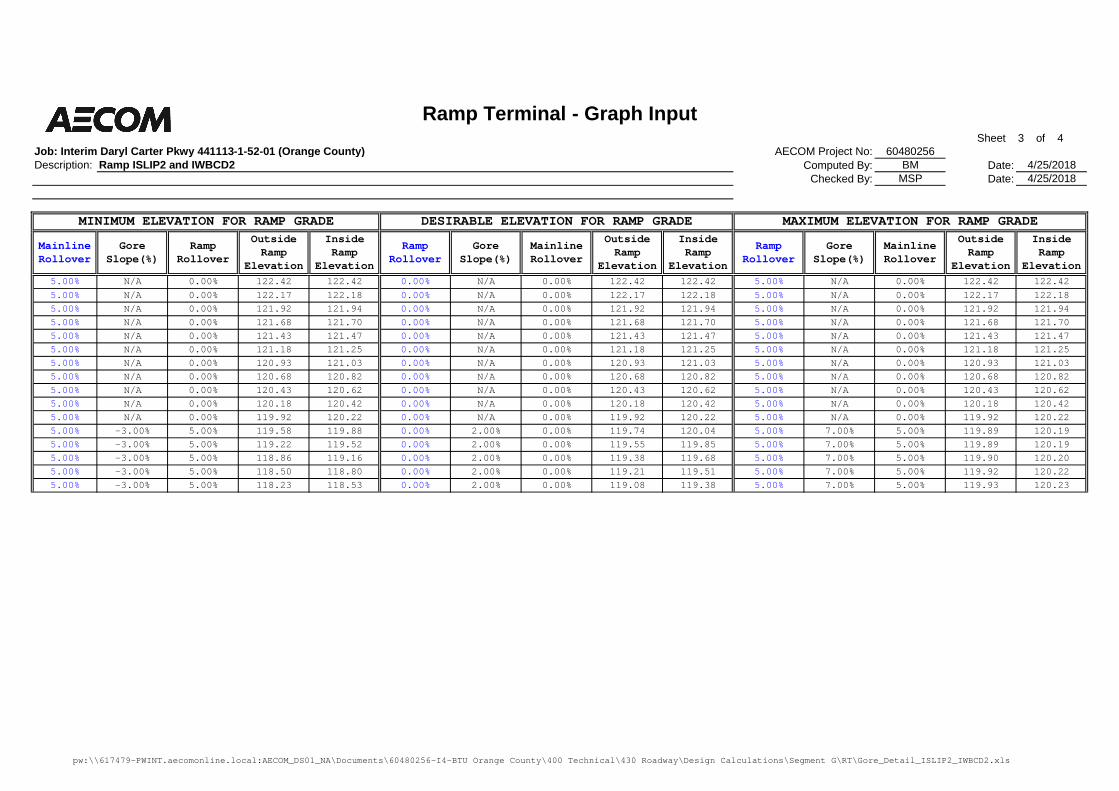
Sheet 3 of 4Job: Interim Daryl Carter Pkwy 441113-1-52-01 (Orange County) AECOM Project No: 60480256Description: Computed By: BM Date: 4/25/2018
Checked By: MSP Date: 4/25/2018
MainlineRollover
GoreSlope(%)
RampRollover
OutsideRamp
Elevation
InsideRamp
Elevation
RampRollover
GoreSlope(%)
MainlineRollover
OutsideRamp
Elevation
InsideRamp
Elevation
RampRollover
GoreSlope(%)
MainlineRollover
OutsideRamp
Elevation
InsideRamp
Elevation5.00% N/A 0.00% 122.42 122.42 0.00% N/A 0.00% 122.42 122.42 5.00% N/A 0.00% 122.42 122.425.00% N/A 0.00% 122.17 122.18 0.00% N/A 0.00% 122.17 122.18 5.00% N/A 0.00% 122.17 122.185.00% N/A 0.00% 121.92 121.94 0.00% N/A 0.00% 121.92 121.94 5.00% N/A 0.00% 121.92 121.945.00% N/A 0.00% 121.68 121.70 0.00% N/A 0.00% 121.68 121.70 5.00% N/A 0.00% 121.68 121.705.00% N/A 0.00% 121.43 121.47 0.00% N/A 0.00% 121.43 121.47 5.00% N/A 0.00% 121.43 121.475.00% N/A 0.00% 121.18 121.25 0.00% N/A 0.00% 121.18 121.25 5.00% N/A 0.00% 121.18 121.255.00% N/A 0.00% 120.93 121.03 0.00% N/A 0.00% 120.93 121.03 5.00% N/A 0.00% 120.93 121.035.00% N/A 0.00% 120.68 120.82 0.00% N/A 0.00% 120.68 120.82 5.00% N/A 0.00% 120.68 120.825.00% N/A 0.00% 120.43 120.62 0.00% N/A 0.00% 120.43 120.62 5.00% N/A 0.00% 120.43 120.625.00% N/A 0.00% 120.18 120.42 0.00% N/A 0.00% 120.18 120.42 5.00% N/A 0.00% 120.18 120.425.00% N/A 0.00% 119.92 120.22 0.00% N/A 0.00% 119.92 120.22 5.00% N/A 0.00% 119.92 120.225.00% -3.00% 5.00% 119.58 119.88 0.00% 2.00% 0.00% 119.74 120.04 5.00% 7.00% 5.00% 119.89 120.195.00% -3.00% 5.00% 119.22 119.52 0.00% 2.00% 0.00% 119.55 119.85 5.00% 7.00% 5.00% 119.89 120.195.00% -3.00% 5.00% 118.86 119.16 0.00% 2.00% 0.00% 119.38 119.68 5.00% 7.00% 5.00% 119.90 120.205.00% -3.00% 5.00% 118.50 118.80 0.00% 2.00% 0.00% 119.21 119.51 5.00% 7.00% 5.00% 119.92 120.225.00% -3.00% 5.00% 118.23 118.53 0.00% 2.00% 0.00% 119.08 119.38 5.00% 7.00% 5.00% 119.93 120.23
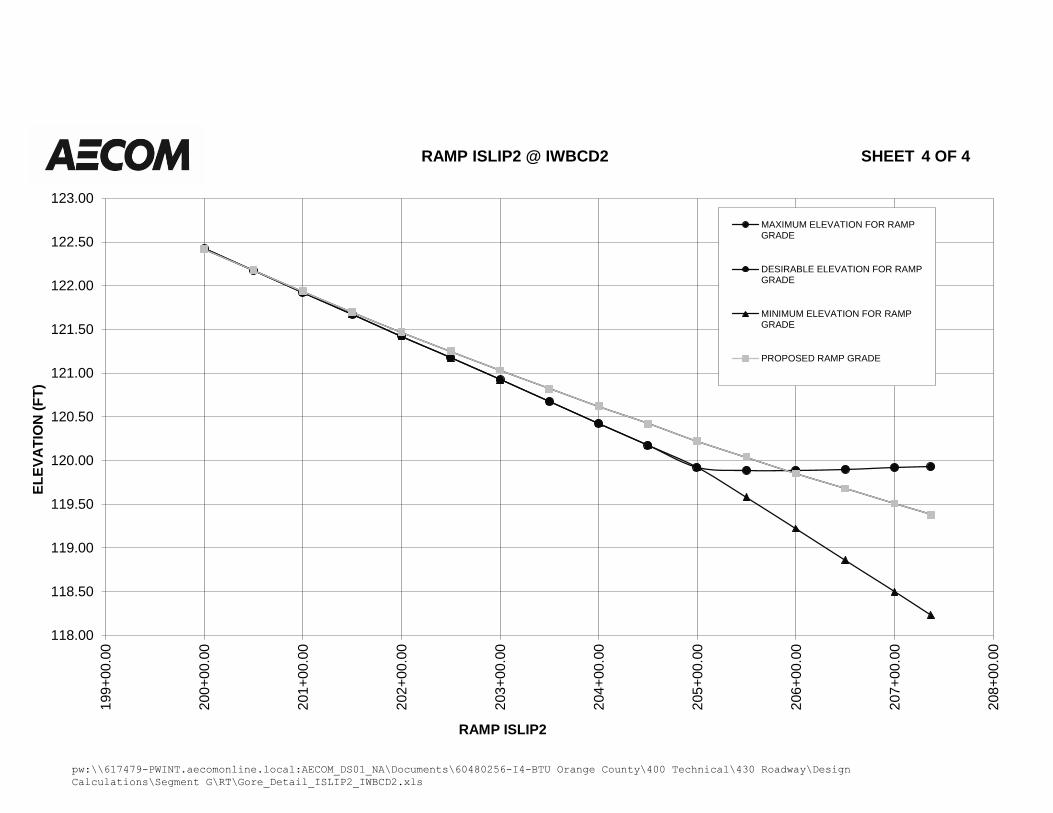
Ramp Terminal - Graph Input
Ramp ISLIP2 and IWBCD2
MINIMUM ELEVATION FOR RAMP GRADE DESIRABLE ELEVATION FOR RAMP GRADE MAXIMUM ELEVATION FOR RAMP GRADE
pw:\\617479-PWINT.aecomonline.local:AECOM_DS01_NA\Documents\60480256-I4-BTU Orange County\400 Technical\430 Roadway\Design Calculations\Segment G\RT\Gore_Detail_ISLIP2_IWBCD2.xls
pw:\\617479-PWINT.aecomonline.local:AECOM_DS01_NA\Documents\60480256-I4-BTU Orange County\400 Technical\430 Roadway\Design
Calculations\Segment G\RT\Gore_Detail_ISLIP2_IWBCD2.xls
118.00
118.50
119.00
119.50
120.00
120.50
121.00
121.50
122.00
122.50
123.00
199
+0
0.0
0
200
+0
0.0
0
201
+0
0.0
0
202
+0
0.0
0
203
+0
0.0
0
204
+0
0.0
0
205
+0
0.0
0
206
+0
0.0
0
207
+0
0.0
0
208+
00.0
0
EL
EV
AT
ION
(F
T)
RAMP ISLIP2
RAMP ISLIP2 @ IWBCD2 SHEET 4 OF 4
MAXIMUM ELEVATION FOR RAMPGRADE
DESIRABLE ELEVATION FOR RAMPGRADE
MINIMUM ELEVATION FOR RAMPGRADE
PROPOSED RAMP GRADE
6' CLF
MER
GE L
EFT
ASPH
LA
NE E
NDS
12' W
OO
D
6' C
LF
6' C
LF
6' C
LF
6' C
LF
6' C
LF
676 677 678 679 680
204205
206
207208
7084 7085 7086 7087 7088 7089
1100
RTIS
LIP
208
RTIS
LIP
209
RTIS
LIP
210
RTIS
LIP
211
RTIS
LIP
212
RTIS
LIP
213
50
Feet
0 10
N
£ CONST IWBCD2
£ SURVEY SR 400
£ RAMP ISLIP2
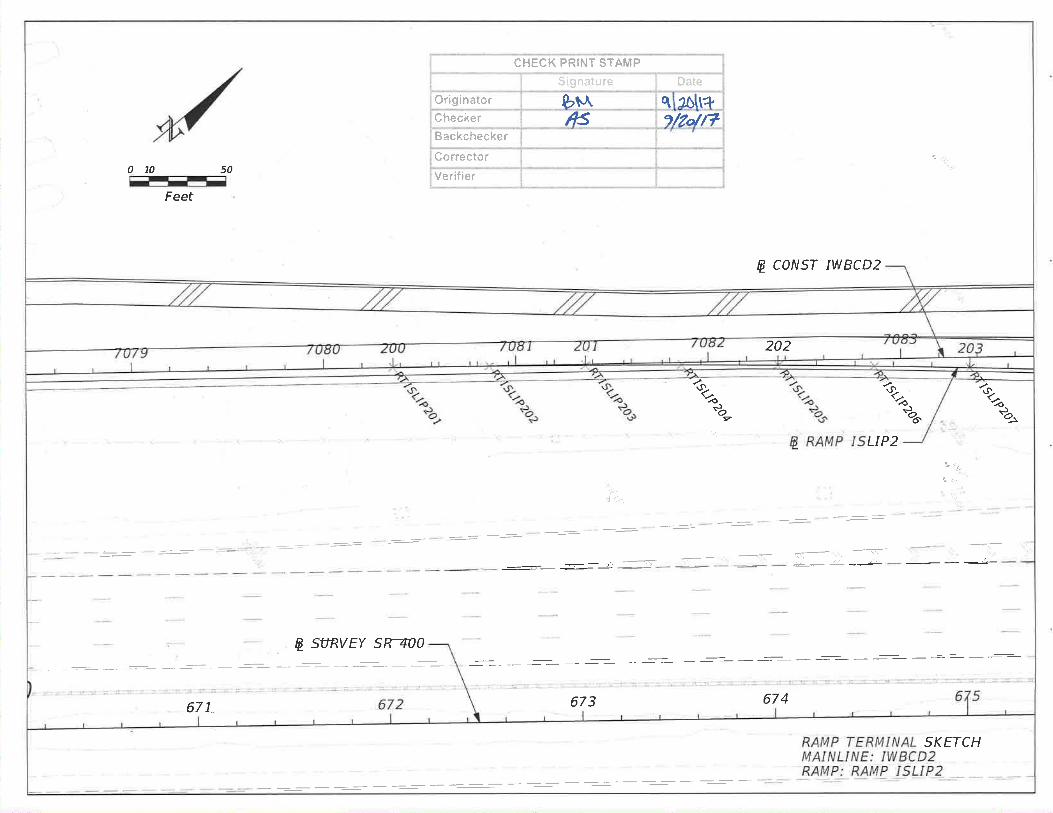
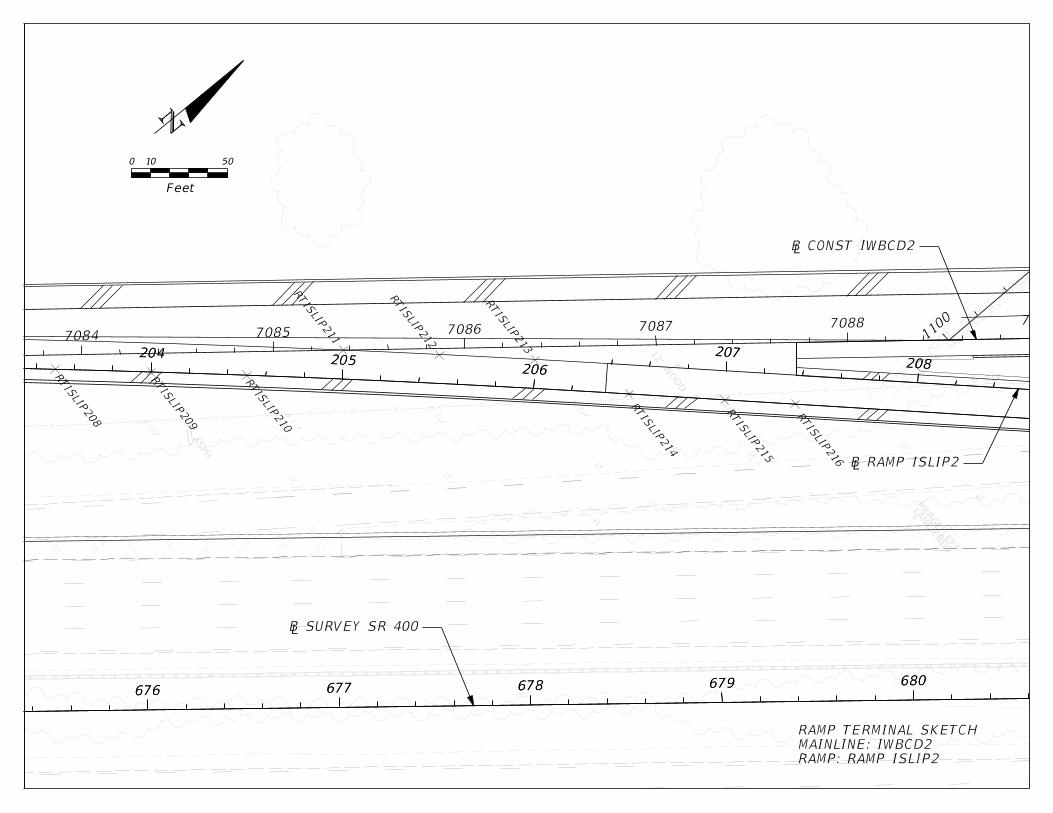
RAMP: RAMP ISLIP2
MAINLINE: IWBCD2
RAMP TERMINAL SKETCH
204205
206
207208
676 677 678 679 680
RTIS
LIP
214
RTIS
LIP
215
RTIS
LIP
216

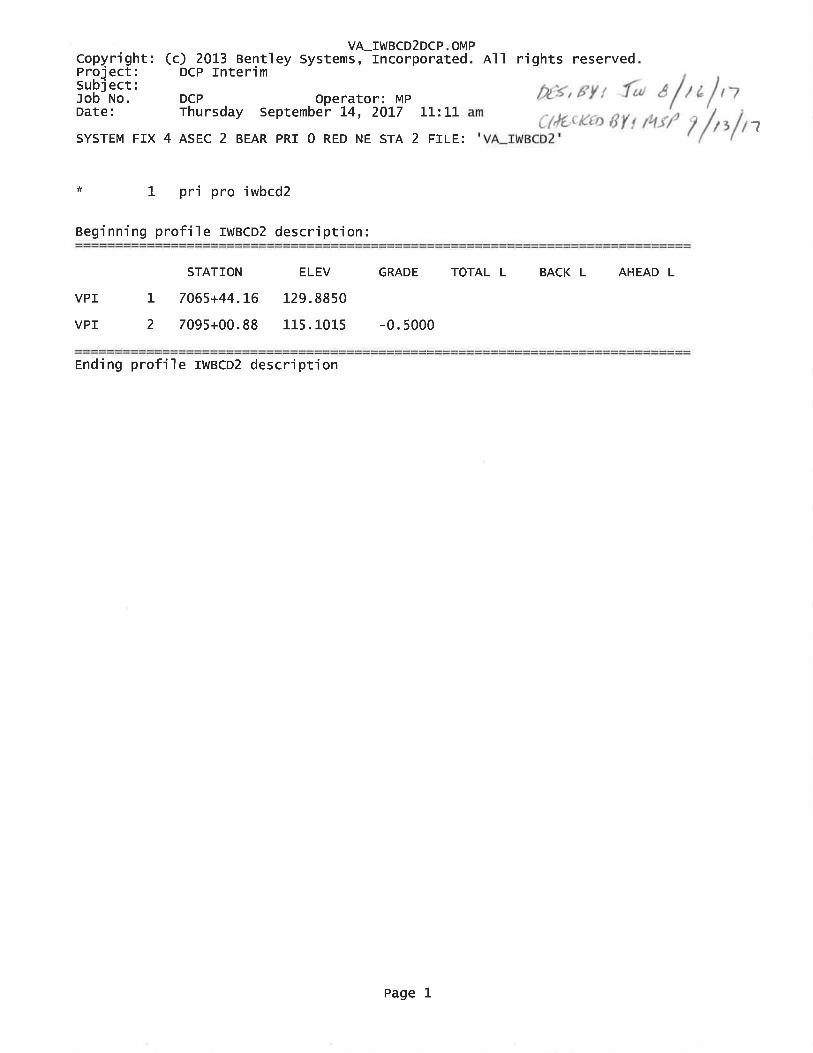
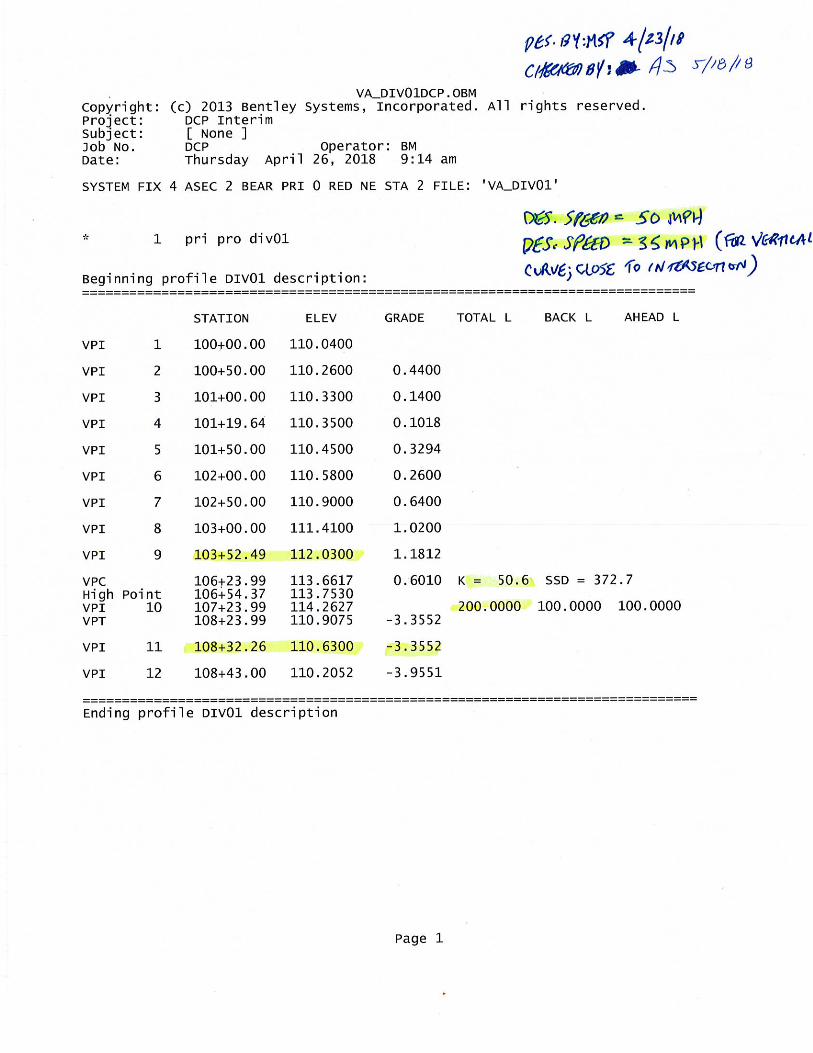
RT_ISLIP2DCP.OBMCopyright: (c) 2013 Bentley Systems, Incorporated. All rights reserved.Project: DCP InterimSubject: [ None ]Job No. DCP Operator: BMDate: Wednesday April 4, 2018 4:21 pm
SYSTEM FIX 4 ASEC 2 BEAR PRI 0 RED NE STA 2 FILE: 'RT_ISLIP2'
* 1 LAY OFF CHA IWBCD2 RTISLIP201-RTISLIP216
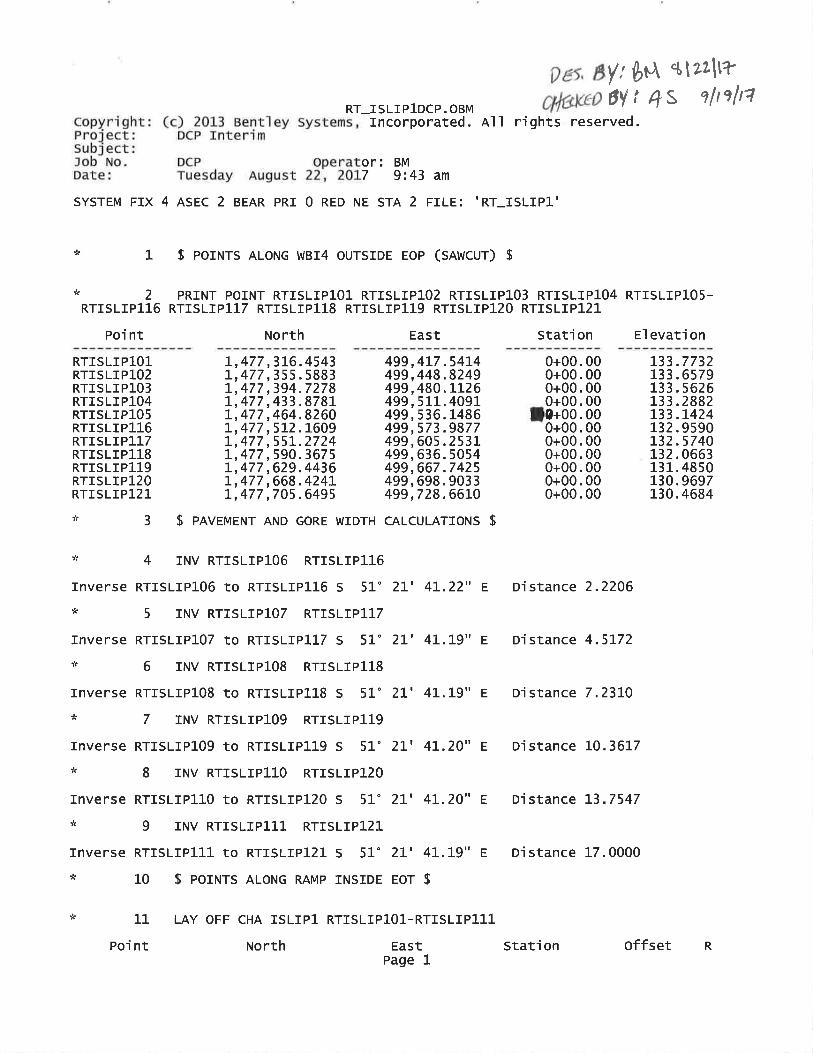
Point North East Station Offset R--------------- --------------- ---------------- ------------ ------------ -RTISLIP201 1,479,441.0835 500,981.1041 7080+36.19 0.0000RTISLIP202 1,479,480.1797 501,012.2725 7080+86.19 0.1499RTISLIP203 1,479,519.0884 501,043.6749 7081+36.19 0.5997RTISLIP204 1,479,557.8080 501,075.3101 7081+86.19 1.3494RTISLIP205 1,479,596.3372 501,107.1769 7082+36.18 2.3988RTISLIP206 1,479,634.6745 501,139.2743 7082+86.16 3.7481RTISLIP207 1,479,672.8187 501,171.6009 7083+36.13 5.3970RTISLIP208 1,479,710.7684 501,204.1558 7083+86.09 7.3457RTISLIP209 1,479,748.5221 501,236.9377 7084+36.04 9.5939RTISLIP210 1,479,786.0785 501,269.9454 7084+85.98 12.1417RTISLIP211 1,479,833.2422 501,291.8237 7085+36.53 0.0000RTISLIP212 1,479,870.6642 501,325.5163 7085+86.78 3.1681RTISLIP213 1,479,907.6872 501,359.2549 7086+36.76 6.6200RTISLIP214 1,479,934.3107 501,404.2038 7086+85.54 25.3168RTISLIP215 1,479,971.0134 501,438.1584 7087+35.39 29.1369RTISLIP216 1,479,998.1005 501,463.2173 7087+72.18 31.9562
* 2 EL PRO IWBCD2 7080+36.19 7080+86.19 7081+36.19 7081+86.18 7082+36.-17 7082+86.15 7083+36.13 7083+86.09 7084+36.04 7084+85.97 7085+36.53 7085+86.78- 7086+36.75 7086+86.68 7087+36.53 7087+73.33
Elev at 7080+36.19 = 122.4249, grade = -0.5000, On tang betw 1 & 2Elev at 7080+86.19 = 122.1749, grade = -0.5000, On tang betw 1 & 2Elev at 7081+36.19 = 121.9249, grade = -0.5000, On tang betw 1 & 2Elev at 7081+86.18 = 121.6750, grade = -0.5000, On tang betw 1 & 2Elev at 7082+36.17 = 121.4250, grade = -0.5000, On tang betw 1 & 2Elev at 7082+86.15 = 121.1751, grade = -0.5000, On tang betw 1 & 2Elev at 7083+36.13 = 120.9252, grade = -0.5000, On tang betw 1 & 2Elev at 7083+86.09 = 120.6754, grade = -0.5000, On tang betw 1 & 2Elev at 7084+36.04 = 120.4257, grade = -0.5000, On tang betw 1 & 2Elev at 7084+85.97 = 120.1760, grade = -0.5000, On tang betw 1 & 2Elev at 7085+36.53 = 119.9232, grade = -0.5000, On tang betw 1 & 2Elev at 7085+86.78 = 119.6720, grade = -0.5000, On tang betw 1 & 2Elev at 7086+36.75 = 119.4221, grade = -0.5000, On tang betw 1 & 2Elev at 7086+86.68 = 119.1725, grade = -0.5000, On tang betw 1 & 2Elev at 7087+36.53 = 118.9232, grade = -0.5000, On tang betw 1 & 2Elev at 7087+73.33 = 118.7392, grade = -0.5000, On tang betw 1 & 2
* 3 LAY OFF CHA ISLIP2 RTISLIP201-RTISLIP216
Point North East Station Offset R--------------- --------------- ---------------- ------------ ------------ -RTISLIP201 1,479,441.0835 500,981.1041 200+00.00 0.0000RTISLIP202 1,479,480.1797 501,012.2725 200+50.00 0.0000RTISLIP203 1,479,519.0884 501,043.6749 201+00.00 0.0000RTISLIP204 1,479,557.8080 501,075.3101 201+50.00 0.0000RTISLIP205 1,479,596.3372 501,107.1769 202+00.00 0.0000RTISLIP206 1,479,634.6745 501,139.2743 202+50.00 0.0000RTISLIP207 1,479,672.8187 501,171.6009 203+00.00 0.0000
Page 1

RT_ISLIP2DCP.OBMRTISLIP208 1,479,710.7684 501,204.1558 203+50.00 0.0000RTISLIP209 1,479,748.5221 501,236.9377 204+00.00 0.0000RTISLIP210 1,479,786.0785 501,269.9454 204+50.00 0.0000RTISLIP211 1,479,833.2422 501,291.8237 204+99.74 -15.0000RTISLIP212 1,479,870.6642 501,325.5163 205+50.00 -15.0000RTISLIP213 1,479,907.6872 501,359.2549 206+00.00 -15.0000RTISLIP214 1,479,934.3107 501,404.2038 206+50.00 15.0000RTISLIP215 1,479,971.0134 501,438.1584 207+00.00 15.0000RTISLIP216 1,479,998.1005 501,463.2173 207+36.90 15.0000
* 4 END
Page 2


Sheet 3 of 4Job: INTERIM DARYL CARTER PKWY 441113-1-52-01 AECOM Project No: 60480256Description: Computed By: BM Date: 10/23/2017
Checked By: MSP Date: 10/25/2017
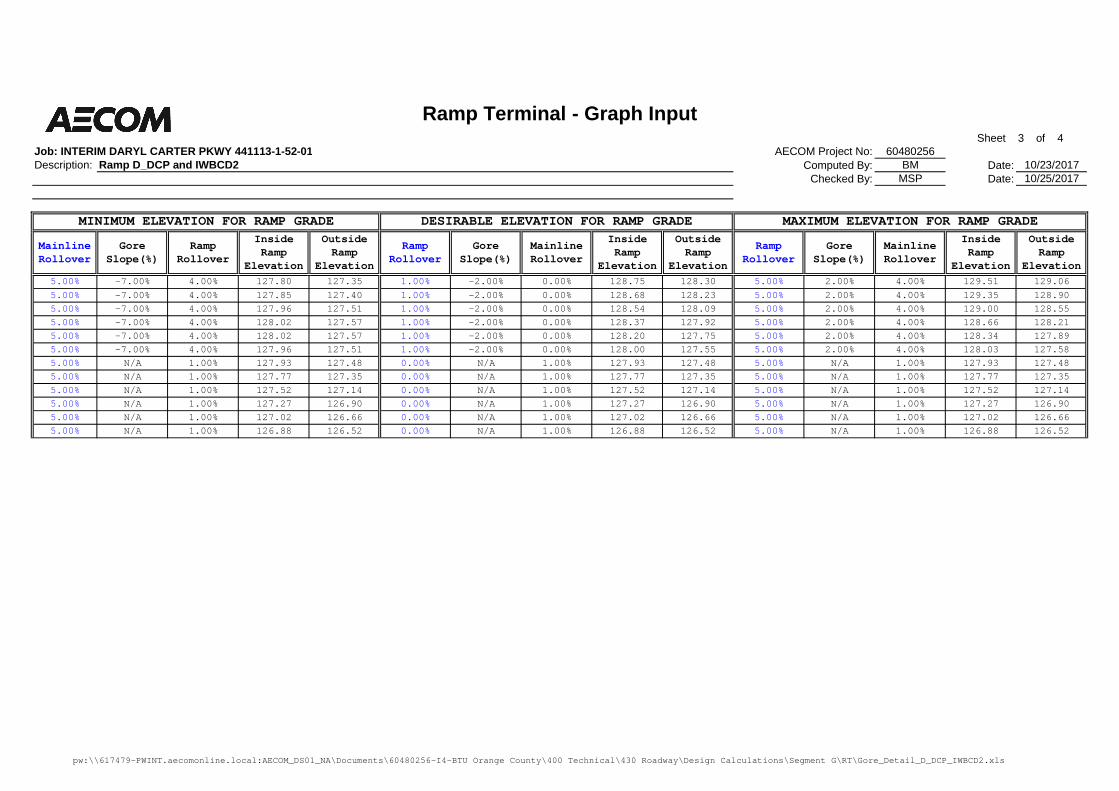
MainlineRollover
GoreSlope(%)
RampRollover
InsideRamp
Elevation
OutsideRamp
Elevation
RampRollover
GoreSlope(%)
MainlineRollover
InsideRamp
Elevation
OutsideRamp
Elevation
RampRollover
GoreSlope(%)
MainlineRollover
InsideRamp
Elevation
OutsideRamp
Elevation5.00% -7.00% 4.00% 127.80 127.35 1.00% -2.00% 0.00% 128.75 128.30 5.00% 2.00% 4.00% 129.51 129.065.00% -7.00% 4.00% 127.85 127.40 1.00% -2.00% 0.00% 128.68 128.23 5.00% 2.00% 4.00% 129.35 128.905.00% -7.00% 4.00% 127.96 127.51 1.00% -2.00% 0.00% 128.54 128.09 5.00% 2.00% 4.00% 129.00 128.555.00% -7.00% 4.00% 128.02 127.57 1.00% -2.00% 0.00% 128.37 127.92 5.00% 2.00% 4.00% 128.66 128.215.00% -7.00% 4.00% 128.02 127.57 1.00% -2.00% 0.00% 128.20 127.75 5.00% 2.00% 4.00% 128.34 127.895.00% -7.00% 4.00% 127.96 127.51 1.00% -2.00% 0.00% 128.00 127.55 5.00% 2.00% 4.00% 128.03 127.585.00% N/A 1.00% 127.93 127.48 0.00% N/A 1.00% 127.93 127.48 5.00% N/A 1.00% 127.93 127.485.00% N/A 1.00% 127.77 127.35 0.00% N/A 1.00% 127.77 127.35 5.00% N/A 1.00% 127.77 127.355.00% N/A 1.00% 127.52 127.14 0.00% N/A 1.00% 127.52 127.14 5.00% N/A 1.00% 127.52 127.145.00% N/A 1.00% 127.27 126.90 0.00% N/A 1.00% 127.27 126.90 5.00% N/A 1.00% 127.27 126.905.00% N/A 1.00% 127.02 126.66 0.00% N/A 1.00% 127.02 126.66 5.00% N/A 1.00% 127.02 126.665.00% N/A 1.00% 126.88 126.52 0.00% N/A 1.00% 126.88 126.52 5.00% N/A 1.00% 126.88 126.52
Ramp Terminal - Graph Input
Ramp D_DCP and IWBCD2
MINIMUM ELEVATION FOR RAMP GRADE DESIRABLE ELEVATION FOR RAMP GRADE MAXIMUM ELEVATION FOR RAMP GRADE
pw:\\617479-PWINT.aecomonline.local:AECOM_DS01_NA\Documents\60480256-I4-BTU Orange County\400 Technical\430 Roadway\Design Calculations\Segment G\RT\Gore_Detail_D_DCP_IWBCD2.xls


Page of
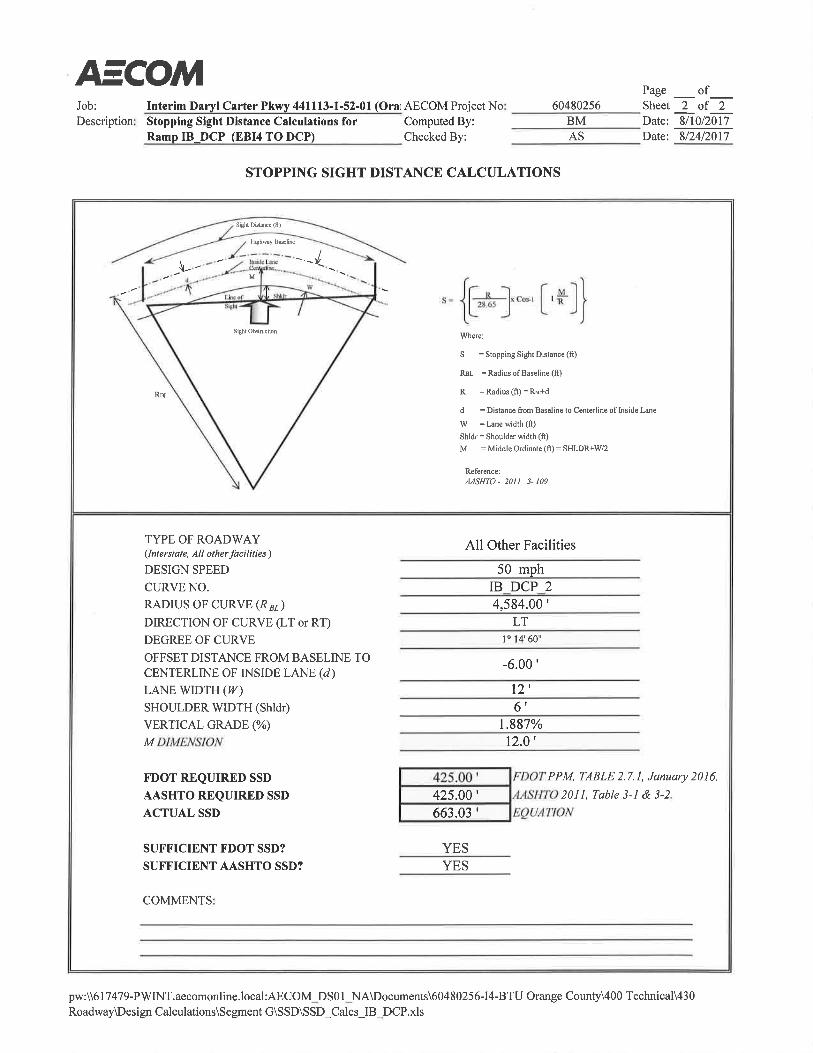
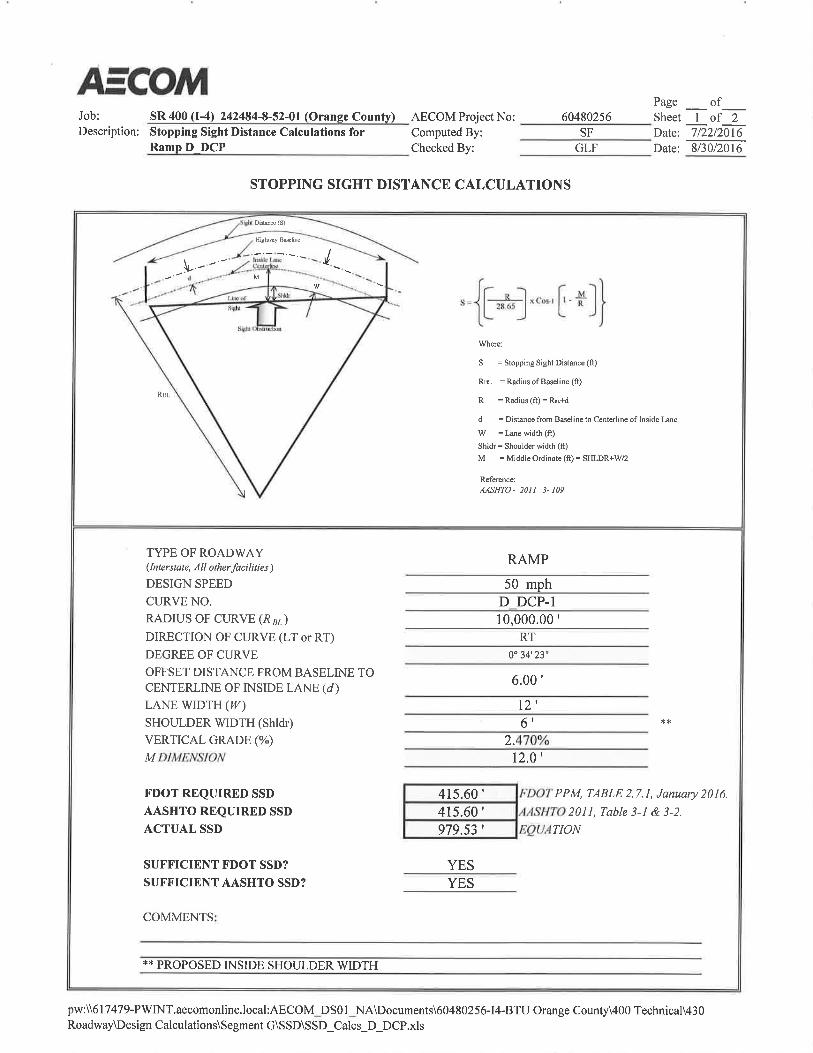
Job: Interim Daryl Carter Pkwy 441113-1-52-01 (Orange County)AECOM Project No: 60480256 Sheet 1 of 2
Description: Stopping Sight Distance Calculations for Computed By: BM Date:
Ramp IB_CFP (EBI4 TO CFP) Checked By: AS Date:
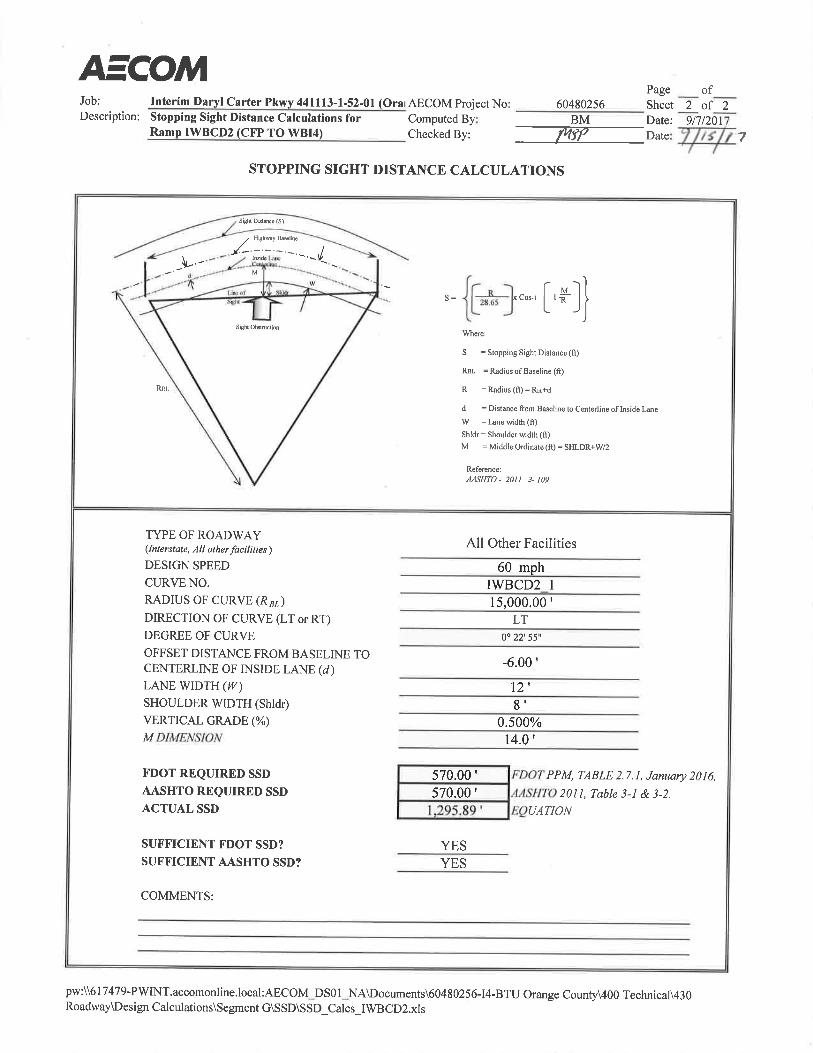
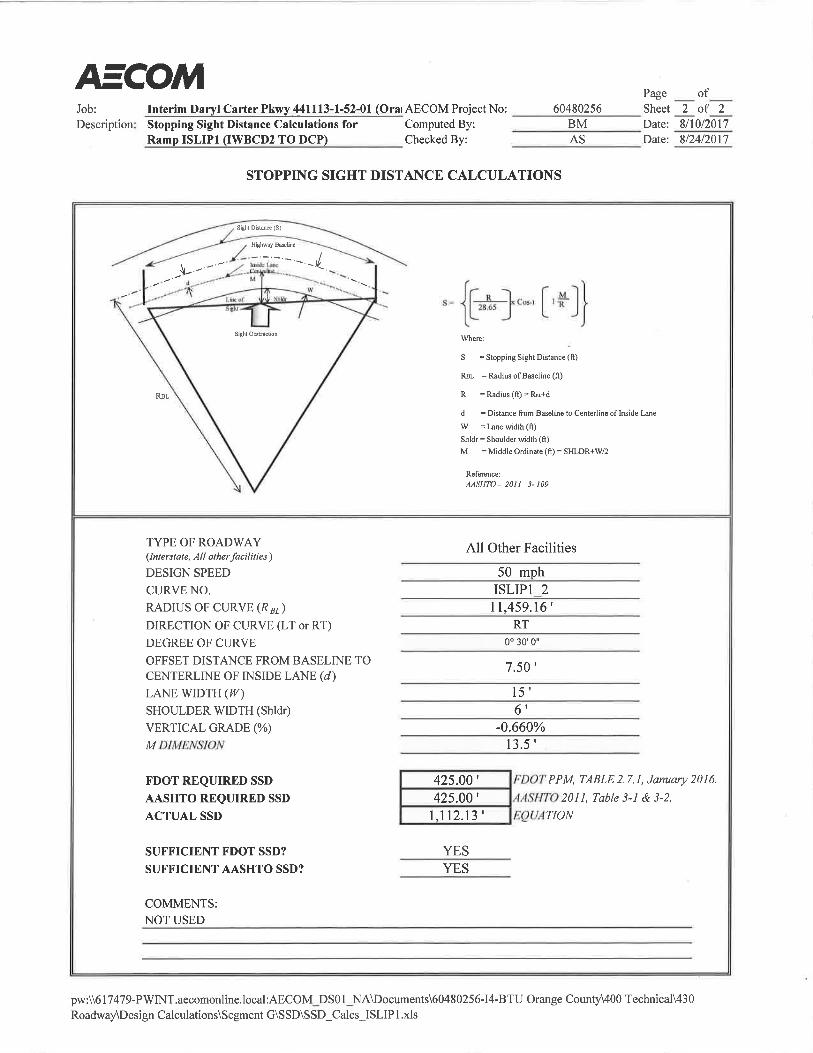
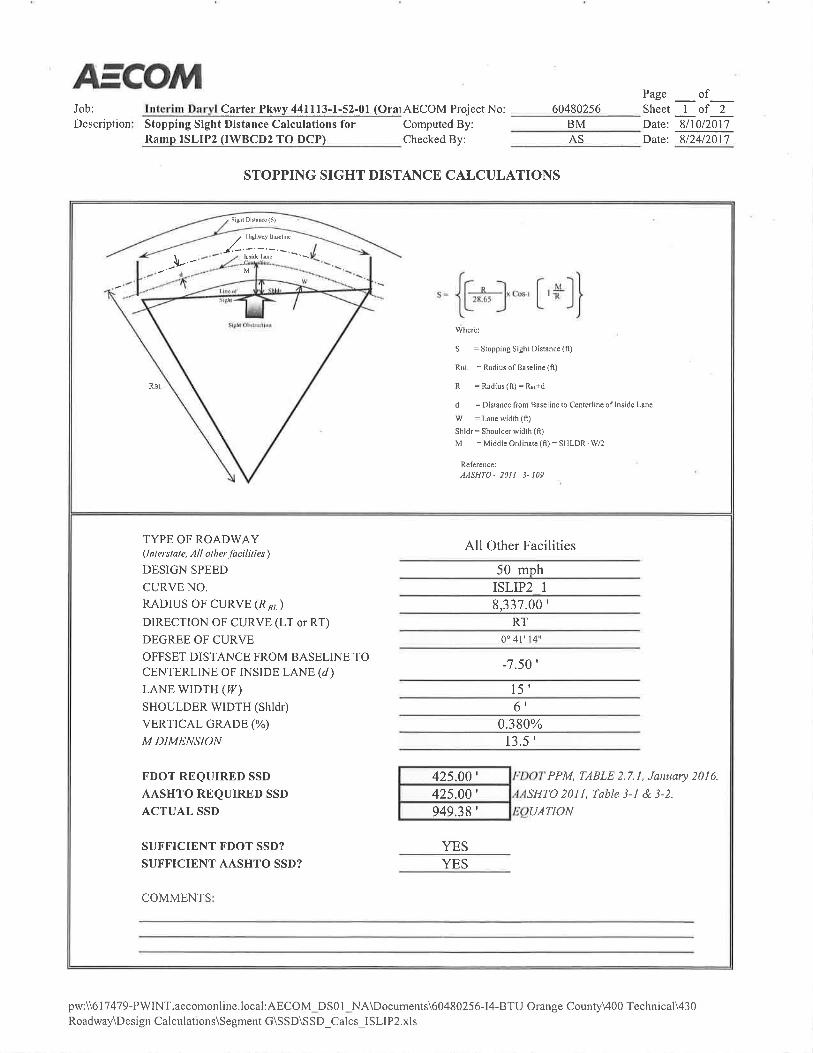
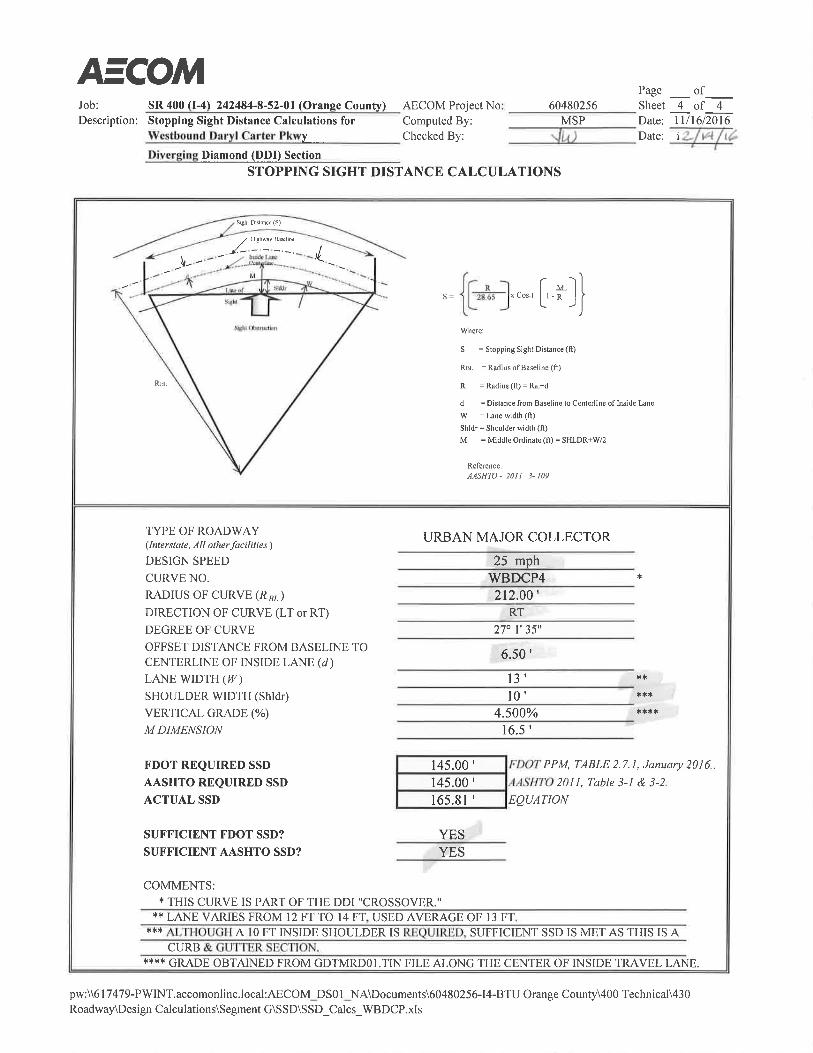
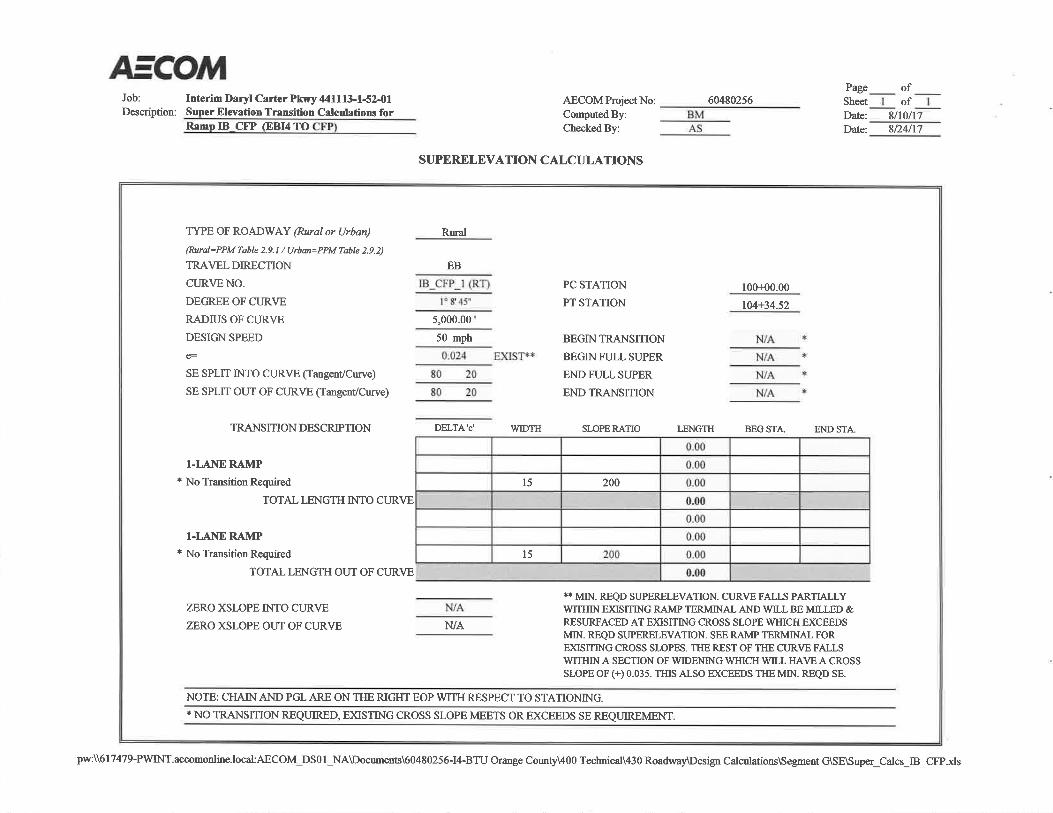
TYPE OF ROADWAY (Interstate, All other facilities )
DESIGN SPEED
CURVE NO.
RADIUS OF CURVE (R BL )
DIRECTION OF CURVE (LT or RT)
DEGREE OF CURVE
OFFSET DISTANCE FROM BASELINE TO
CENTERLINE OF INSIDE LANE (d )
LANE WIDTH (W )
SHOULDER WIDTH (Shldr)
VERTICAL GRADE (%)
M DIMENSION
FDOT REQUIRED SSD 425.00 '
AASHTO REQUIRED SSD 425.00 ' AASHTO 2011, Table 3-1 & 3-2.
ACTUAL SSD 735.51 ' EQUATION
SUFFICIENT FDOT SSD? YES
SUFFICIENT AASHTO SSD? YES
8/10/2017
8/24/2017
STOPPING SIGHT DISTANCE CALCULATIONS
All Other Facilities
50 mph
IB_CFP_1
5,000.00 '
RT
1° 8' 45"
-7.50 '
15 '
6 '
2.000%
FDOT PPM, TABLE 2.7.1, January 2016.
COMMENTS:
13.5 '
Where:
S = Stopping Sight Distance (ft)
RBL = Radius of Baseline (ft)
R = Radius (ft) = RBL+d
d = Distance from Baseline to Centerline of Inside Lane W = Lane width (ft) Shldr = Shoulder width (ft) M = Middle Ordinate (ft) = SHLDR+W/2
S =
R 28.65 x Cos-1
1 -
M R
Reference: AASHTO - 2011 3- 109
Sight Obstruction
Shldr
Line of
Sight
Highway Baseline
Inside Lane Centerline
Sight Distance (S)
M
RBL
W
d
pw:\\617479-PWINT.aecomonline.local:AECOM_DS01_NA\Documents\60480256-I4-BTU Orange County\400 Technical\430
Roadway\Design Calculations\Segment G\SSD\SSD_Calcs_IB_CFP.xls

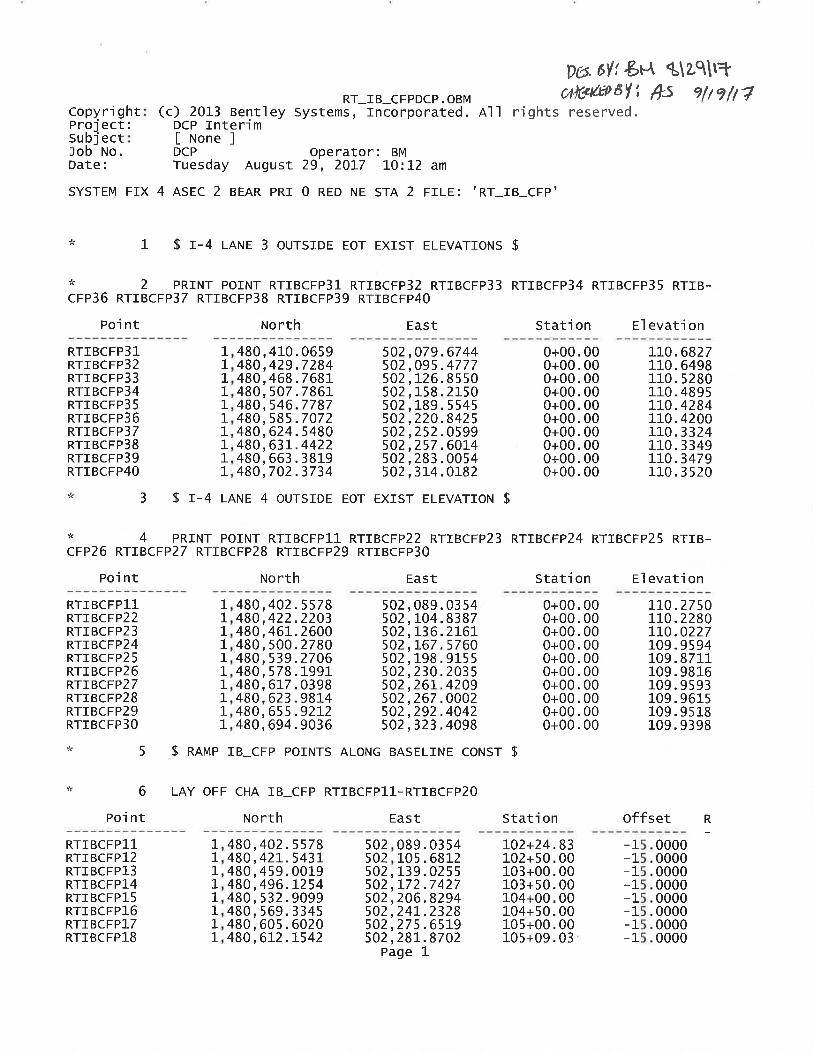
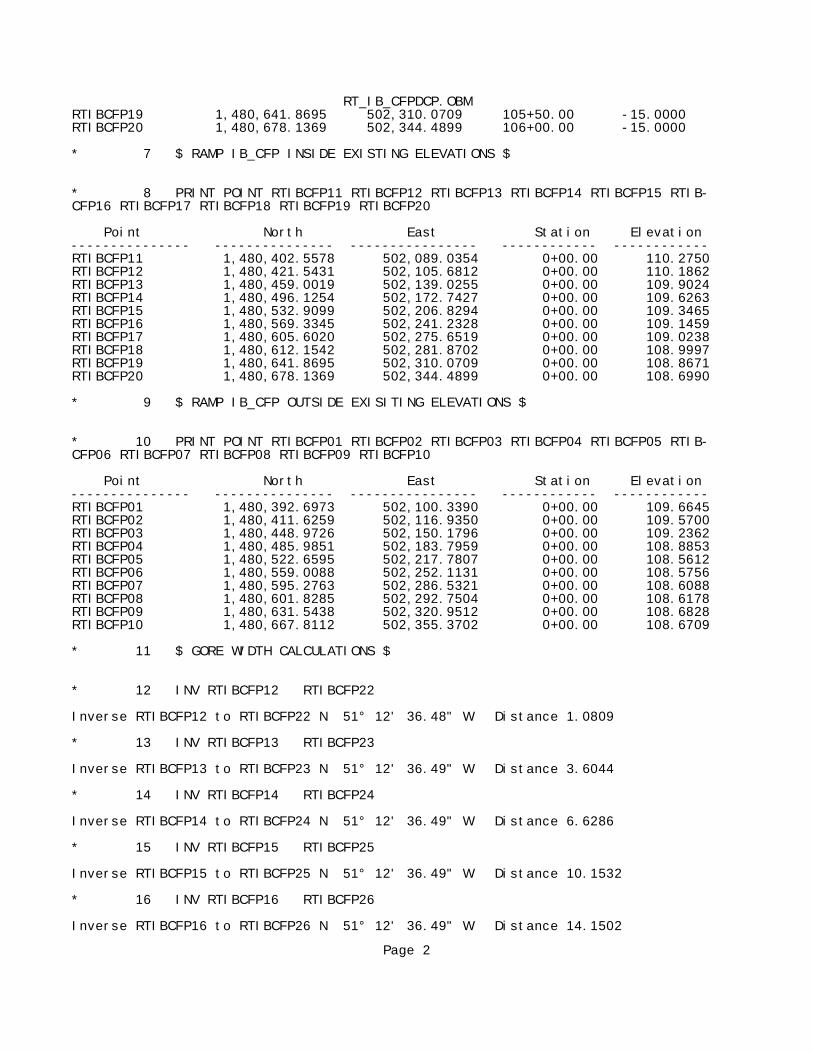
RT_IB_CFPDCP.OBMRTIBCFP19 1,480,641.8695 502,310.0709 105+50.00 -15.0000RTIBCFP20 1,480,678.1369 502,344.4899 106+00.00 -15.0000
* 7 $ RAMP IB_CFP INSIDE EXISTING ELEVATIONS $
* 8 PRINT POINT RTIBCFP11 RTIBCFP12 RTIBCFP13 RTIBCFP14 RTIBCFP15 RTIB-CFP16 RTIBCFP17 RTIBCFP18 RTIBCFP19 RTIBCFP20
Point North East Station Elevation--------------- --------------- ---------------- ------------ ------------RTIBCFP11 1,480,402.5578 502,089.0354 0+00.00 110.2750RTIBCFP12 1,480,421.5431 502,105.6812 0+00.00 110.1862RTIBCFP13 1,480,459.0019 502,139.0255 0+00.00 109.9024RTIBCFP14 1,480,496.1254 502,172.7427 0+00.00 109.6263RTIBCFP15 1,480,532.9099 502,206.8294 0+00.00 109.3465RTIBCFP16 1,480,569.3345 502,241.2328 0+00.00 109.1459RTIBCFP17 1,480,605.6020 502,275.6519 0+00.00 109.0238RTIBCFP18 1,480,612.1542 502,281.8702 0+00.00 108.9997RTIBCFP19 1,480,641.8695 502,310.0709 0+00.00 108.8671RTIBCFP20 1,480,678.1369 502,344.4899 0+00.00 108.6990
* 9 $ RAMP IB_CFP OUTSIDE EXISITING ELEVATIONS $
* 10 PRINT POINT RTIBCFP01 RTIBCFP02 RTIBCFP03 RTIBCFP04 RTIBCFP05 RTIB-CFP06 RTIBCFP07 RTIBCFP08 RTIBCFP09 RTIBCFP10
Point North East Station Elevation--------------- --------------- ---------------- ------------ ------------RTIBCFP01 1,480,392.6973 502,100.3390 0+00.00 109.6645RTIBCFP02 1,480,411.6259 502,116.9350 0+00.00 109.5700RTIBCFP03 1,480,448.9726 502,150.1796 0+00.00 109.2362RTIBCFP04 1,480,485.9851 502,183.7959 0+00.00 108.8853RTIBCFP05 1,480,522.6595 502,217.7807 0+00.00 108.5612RTIBCFP06 1,480,559.0088 502,252.1131 0+00.00 108.5756RTIBCFP07 1,480,595.2763 502,286.5321 0+00.00 108.6088RTIBCFP08 1,480,601.8285 502,292.7504 0+00.00 108.6178RTIBCFP09 1,480,631.5438 502,320.9512 0+00.00 108.6828RTIBCFP10 1,480,667.8112 502,355.3702 0+00.00 108.6709
* 11 $ GORE WIDTH CALCULATIONS $
* 12 INV RTIBCFP12 RTIBCFP22
Inverse RTIBCFP12 to RTIBCFP22 N 51° 12' 36.48" W Distance 1.0809
* 13 INV RTIBCFP13 RTIBCFP23
Inverse RTIBCFP13 to RTIBCFP23 N 51° 12' 36.49" W Distance 3.6044
* 14 INV RTIBCFP14 RTIBCFP24
Inverse RTIBCFP14 to RTIBCFP24 N 51° 12' 36.49" W Distance 6.6286
* 15 INV RTIBCFP15 RTIBCFP25
Inverse RTIBCFP15 to RTIBCFP25 N 51° 12' 36.49" W Distance 10.1532
* 16 INV RTIBCFP16 RTIBCFP26
Inverse RTIBCFP16 to RTIBCFP26 N 51° 12' 36.49" W Distance 14.1502
Page 2


Sheet 1 of 4Job: Interim Daryl Carter Pkwy 441113-1-52-01 (Orange County) AECOM Project No: 60480256Description: Computed By: BM Date: 4/24/2018
Checked By: MSP Date: 4/24/2018
BaselineMainlineStation
PGLElev.
InsideTravel LaneSlope(%)
InsideEOT
Offset
InsideEOT Elev.
GoreWidth
GoreSlope(%)
OutsideElev.
*PavementSlope(%)
PavementWidth
InsideElev.
BaselineRamp
Station
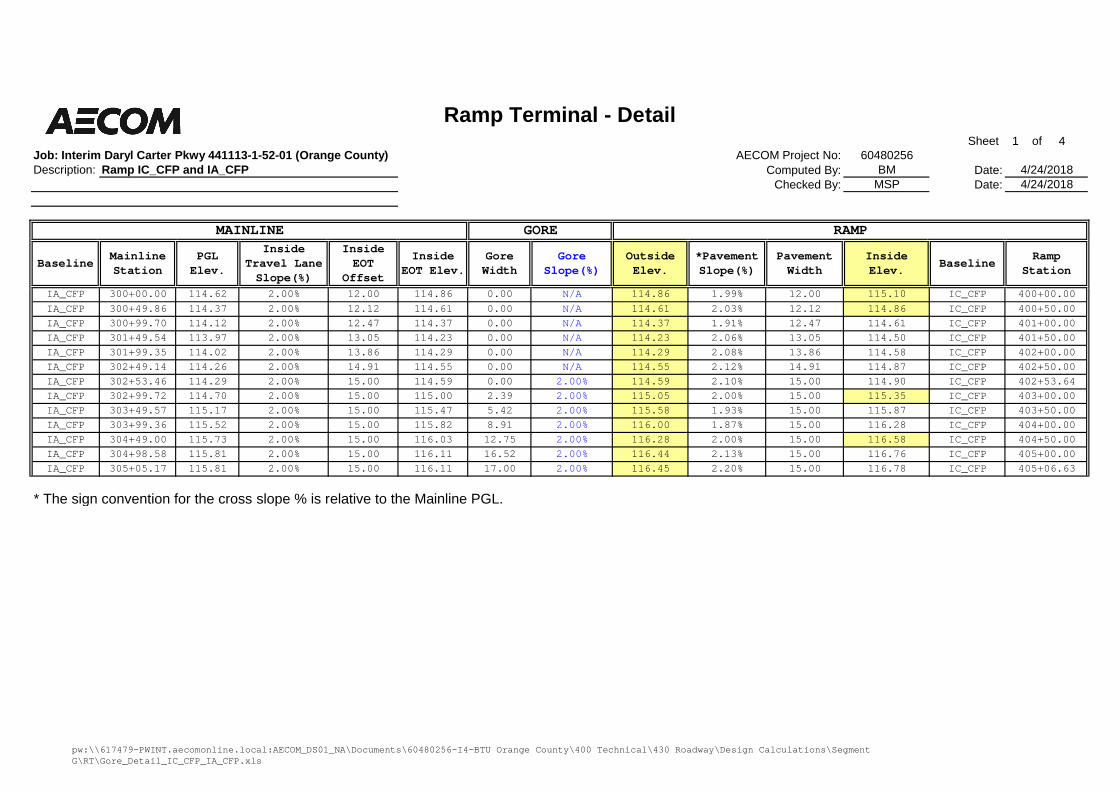
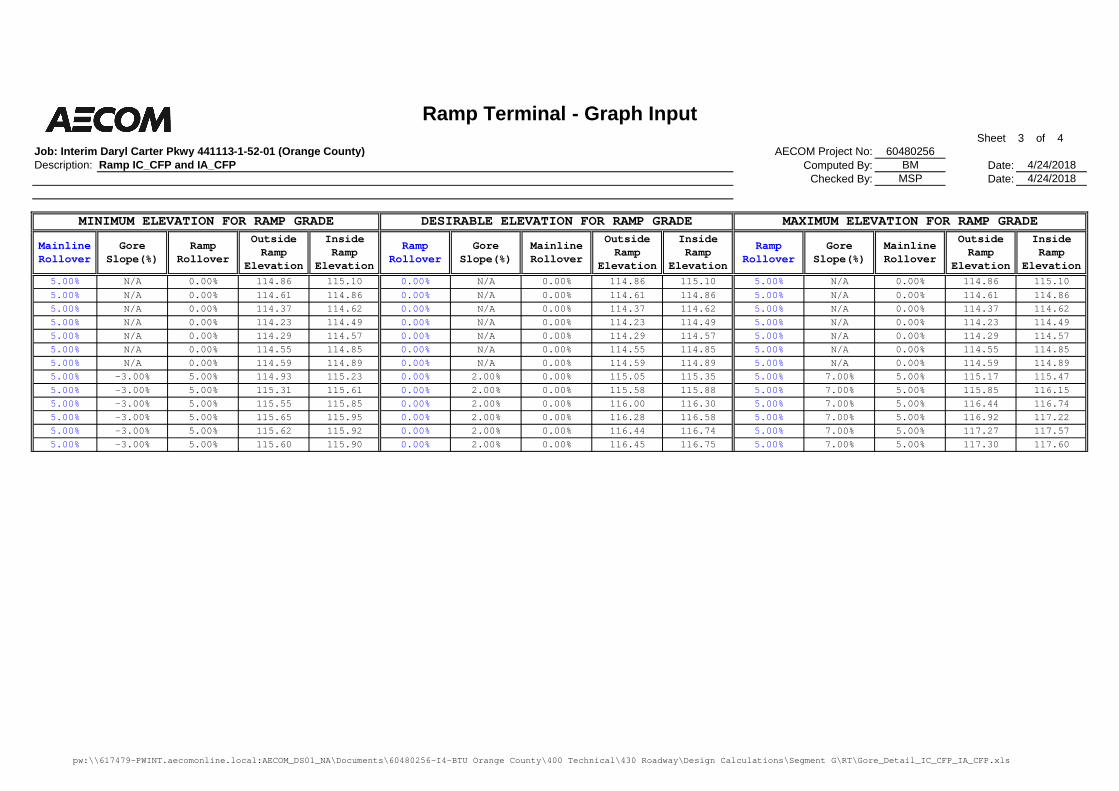
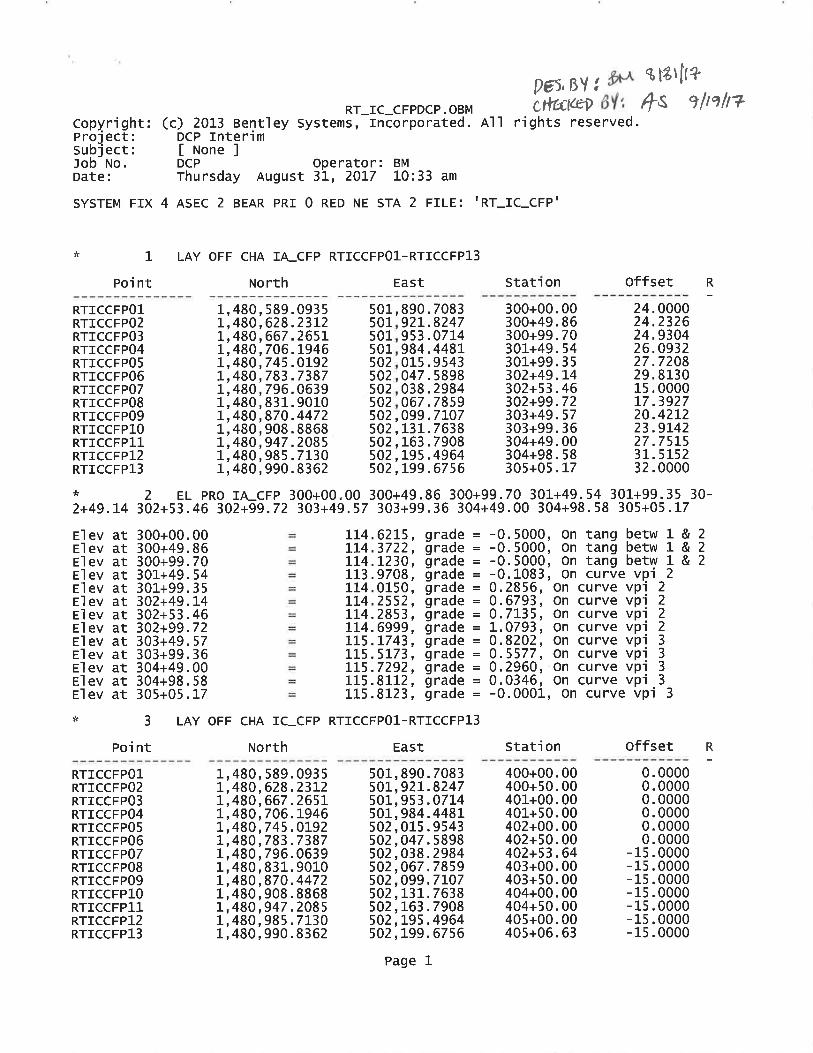
IA_CFP 300+00.00 114.62 2.00% 12.00 114.86 0.00 N/A 114.86 1.99% 12.00 115.10 IC_CFP 400+00.00IA_CFP 300+49.86 114.37 2.00% 12.12 114.61 0.00 N/A 114.61 2.03% 12.12 114.86 IC_CFP 400+50.00IA_CFP 300+99.70 114.12 2.00% 12.47 114.37 0.00 N/A 114.37 1.91% 12.47 114.61 IC_CFP 401+00.00IA_CFP 301+49.54 113.97 2.00% 13.05 114.23 0.00 N/A 114.23 2.06% 13.05 114.50 IC_CFP 401+50.00IA_CFP 301+99.35 114.02 2.00% 13.86 114.29 0.00 N/A 114.29 2.08% 13.86 114.58 IC_CFP 402+00.00IA_CFP 302+49.14 114.26 2.00% 14.91 114.55 0.00 N/A 114.55 2.12% 14.91 114.87 IC_CFP 402+50.00IA_CFP 302+53.46 114.29 2.00% 15.00 114.59 0.00 2.00% 114.59 2.10% 15.00 114.90 IC_CFP 402+53.64IA_CFP 302+99.72 114.70 2.00% 15.00 115.00 2.39 2.00% 115.05 2.00% 15.00 115.35 IC_CFP 403+00.00IA_CFP 303+49.57 115.17 2.00% 15.00 115.47 5.42 2.00% 115.58 1.93% 15.00 115.87 IC_CFP 403+50.00IA_CFP 303+99.36 115.52 2.00% 15.00 115.82 8.91 2.00% 116.00 1.87% 15.00 116.28 IC_CFP 404+00.00IA_CFP 304+49.00 115.73 2.00% 15.00 116.03 12.75 2.00% 116.28 2.00% 15.00 116.58 IC_CFP 404+50.00IA_CFP 304+98.58 115.81 2.00% 15.00 116.11 16.52 2.00% 116.44 2.13% 15.00 116.76 IC_CFP 405+00.00IA_CFP 305+05.17 115.81 2.00% 15.00 116.11 17.00 2.00% 116.45 2.20% 15.00 116.78 IC_CFP 405+06.63
* The sign convention for the cross slope % is relative to the Mainline PGL.
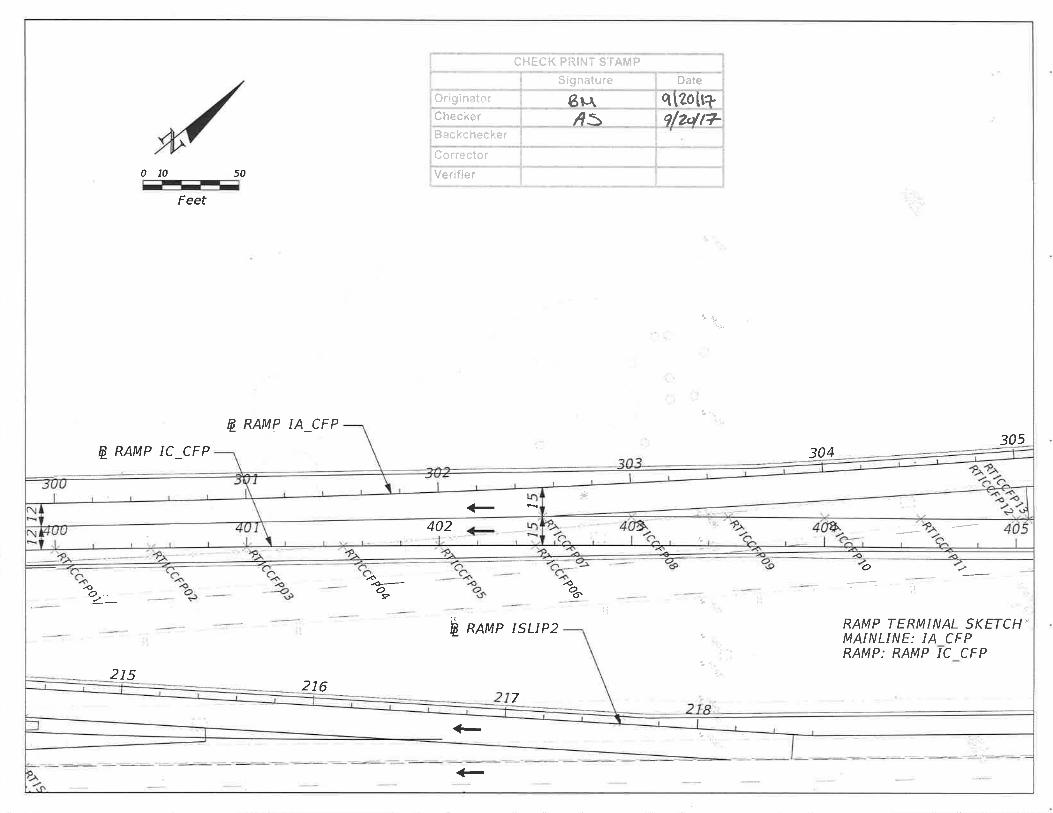
Ramp Terminal - Detail
Ramp IC_CFP and IA_CFP
MAINLINE GORE RAMP
pw:\\617479-PWINT.aecomonline.local:AECOM_DS01_NA\Documents\60480256-I4-BTU Orange County\400 Technical\430 Roadway\Design Calculations\SegmentG\RT\Gore_Detail_IC_CFP_IA_CFP.xls
Sheet 2 of 4Job: Interim Daryl Carter Pkwy 441113-1-52-01 (Orange County) AECOM Project No: 60480256Description: Computed By: BM Date: 4/24/2018
Checked By: MSP Date: 4/24/2018
BaselineMainlineStation
PGLElev.
InsideTravel
Lane Width
InsideTravel LaneSlope(%)
InsideEOT
Offset
InsideEOT
Elev.
COGODistance
GoreWidth
BaselineRamp
Station*PavementSlope(%)
COGOWidth
PavementWidth
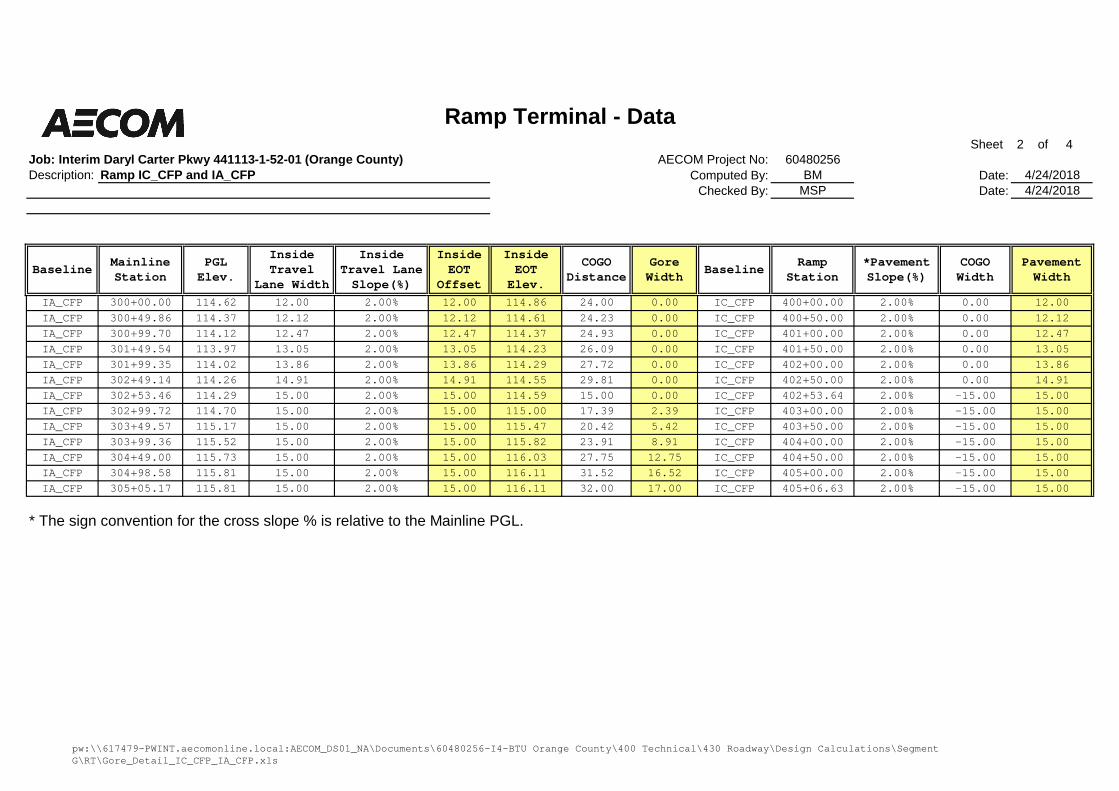
IA_CFP 300+00.00 114.62 12.00 2.00% 12.00 114.86 24.00 0.00 IC_CFP 400+00.00 2.00% 0.00 12.00IA_CFP 300+49.86 114.37 12.12 2.00% 12.12 114.61 24.23 0.00 IC_CFP 400+50.00 2.00% 0.00 12.12IA_CFP 300+99.70 114.12 12.47 2.00% 12.47 114.37 24.93 0.00 IC_CFP 401+00.00 2.00% 0.00 12.47IA_CFP 301+49.54 113.97 13.05 2.00% 13.05 114.23 26.09 0.00 IC_CFP 401+50.00 2.00% 0.00 13.05IA_CFP 301+99.35 114.02 13.86 2.00% 13.86 114.29 27.72 0.00 IC_CFP 402+00.00 2.00% 0.00 13.86IA_CFP 302+49.14 114.26 14.91 2.00% 14.91 114.55 29.81 0.00 IC_CFP 402+50.00 2.00% 0.00 14.91IA_CFP 302+53.46 114.29 15.00 2.00% 15.00 114.59 15.00 0.00 IC_CFP 402+53.64 2.00% -15.00 15.00IA_CFP 302+99.72 114.70 15.00 2.00% 15.00 115.00 17.39 2.39 IC_CFP 403+00.00 2.00% -15.00 15.00IA_CFP 303+49.57 115.17 15.00 2.00% 15.00 115.47 20.42 5.42 IC_CFP 403+50.00 2.00% -15.00 15.00IA_CFP 303+99.36 115.52 15.00 2.00% 15.00 115.82 23.91 8.91 IC_CFP 404+00.00 2.00% -15.00 15.00IA_CFP 304+49.00 115.73 15.00 2.00% 15.00 116.03 27.75 12.75 IC_CFP 404+50.00 2.00% -15.00 15.00IA_CFP 304+98.58 115.81 15.00 2.00% 15.00 116.11 31.52 16.52 IC_CFP 405+00.00 2.00% -15.00 15.00IA_CFP 305+05.17 115.81 15.00 2.00% 15.00 116.11 32.00 17.00 IC_CFP 405+06.63 2.00% -15.00 15.00
* The sign convention for the cross slope % is relative to the Mainline PGL.
Ramp Terminal - Data
Ramp IC_CFP and IA_CFP
pw:\\617479-PWINT.aecomonline.local:AECOM_DS01_NA\Documents\60480256-I4-BTU Orange County\400 Technical\430 Roadway\Design Calculations\SegmentG\RT\Gore_Detail_IC_CFP_IA_CFP.xls
Sheet 3 of 4Job: Interim Daryl Carter Pkwy 441113-1-52-01 (Orange County) AECOM Project No: 60480256Description: Computed By: BM Date: 4/24/2018
Checked By: MSP Date: 4/24/2018
MainlineRollover
GoreSlope(%)
RampRollover
OutsideRamp
Elevation
InsideRamp
Elevation
RampRollover
GoreSlope(%)
MainlineRollover
OutsideRamp
Elevation
InsideRamp
Elevation
RampRollover
GoreSlope(%)
MainlineRollover
OutsideRamp
Elevation
InsideRamp
Elevation5.00% N/A 0.00% 114.86 115.10 0.00% N/A 0.00% 114.86 115.10 5.00% N/A 0.00% 114.86 115.105.00% N/A 0.00% 114.61 114.86 0.00% N/A 0.00% 114.61 114.86 5.00% N/A 0.00% 114.61 114.865.00% N/A 0.00% 114.37 114.62 0.00% N/A 0.00% 114.37 114.62 5.00% N/A 0.00% 114.37 114.625.00% N/A 0.00% 114.23 114.49 0.00% N/A 0.00% 114.23 114.49 5.00% N/A 0.00% 114.23 114.495.00% N/A 0.00% 114.29 114.57 0.00% N/A 0.00% 114.29 114.57 5.00% N/A 0.00% 114.29 114.575.00% N/A 0.00% 114.55 114.85 0.00% N/A 0.00% 114.55 114.85 5.00% N/A 0.00% 114.55 114.855.00% N/A 0.00% 114.59 114.89 0.00% N/A 0.00% 114.59 114.89 5.00% N/A 0.00% 114.59 114.895.00% -3.00% 5.00% 114.93 115.23 0.00% 2.00% 0.00% 115.05 115.35 5.00% 7.00% 5.00% 115.17 115.475.00% -3.00% 5.00% 115.31 115.61 0.00% 2.00% 0.00% 115.58 115.88 5.00% 7.00% 5.00% 115.85 116.155.00% -3.00% 5.00% 115.55 115.85 0.00% 2.00% 0.00% 116.00 116.30 5.00% 7.00% 5.00% 116.44 116.745.00% -3.00% 5.00% 115.65 115.95 0.00% 2.00% 0.00% 116.28 116.58 5.00% 7.00% 5.00% 116.92 117.225.00% -3.00% 5.00% 115.62 115.92 0.00% 2.00% 0.00% 116.44 116.74 5.00% 7.00% 5.00% 117.27 117.575.00% -3.00% 5.00% 115.60 115.90 0.00% 2.00% 0.00% 116.45 116.75 5.00% 7.00% 5.00% 117.30 117.60
Ramp Terminal - Graph Input
Ramp IC_CFP and IA_CFP
MINIMUM ELEVATION FOR RAMP GRADE DESIRABLE ELEVATION FOR RAMP GRADE MAXIMUM ELEVATION FOR RAMP GRADE
pw:\\617479-PWINT.aecomonline.local:AECOM_DS01_NA\Documents\60480256-I4-BTU Orange County\400 Technical\430 Roadway\Design Calculations\Segment G\RT\Gore_Detail_IC_CFP_IA_CFP.xls

pw:\\617479-PWINT.aecomonline.local:AECOM_DS01_NA\Documents\60480256-I4-BTU Orange County\400 Technical\430 Roadway\Design
Calculations\Segment G\RT\Gore_Detail_IC_CFP_IA_CFP.xls
114.00
114.50
115.00
115.50
116.00
116.50
117.00
117.50
118.00
399
+0
0.0
0
400
+0
0.0
0
401
+0
0.0
0
402
+0
0.0
0
403
+0
0.0
0
404
+0
0.0
0
405
+0
0.0
0
406+
00.0
0
EL
EV
AT
ION
(F
T)
RAMP IC_CFP STATIONS
RAMP IC_CFP @ RAMP IA_CFP SHEET 4 OF 4
MAXIMUM ELEVATION FOR RAMP GRADE
DESIRABLE ELEVATION FOR RAMP GRADE
MINIMUM ELEVATION FOR RAMP GRADE
PROPOSED RAMP GRADE
Page ofJob: Interim Daryl Carter Pkwy 441113-1-52-01 (Orange County)AECOM Project No: 60480256 Sheet 1 of 2Description: Stopping Sight Distance Calculations for Computed By: BM Date:
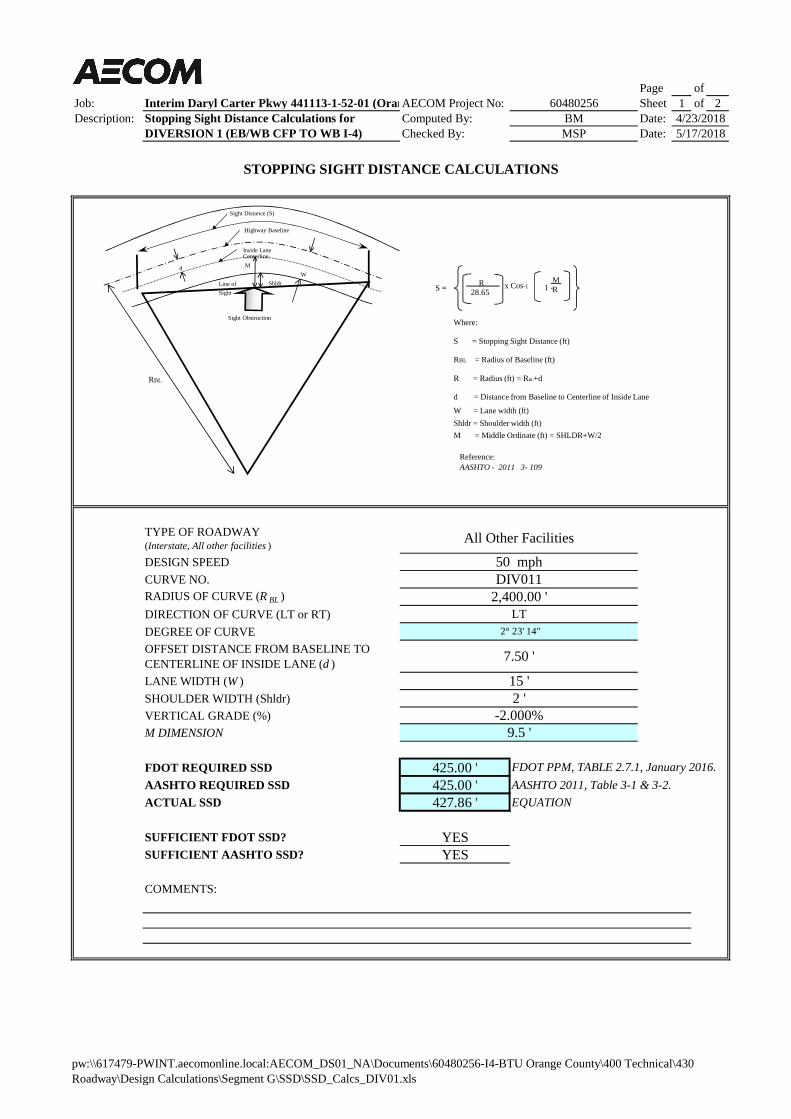
DIVERSION 1 (EB/WB CFP TO WB I-4) Checked By: MSP Date:
TYPE OF ROADWAY(Interstate, All other facilities )
DESIGN SPEEDCURVE NO.RADIUS OF CURVE (R BL )DIRECTION OF CURVE (LT or RT)DEGREE OF CURVEOFFSET DISTANCE FROM BASELINE TOCENTERLINE OF INSIDE LANE (d )LANE WIDTH (W )SHOULDER WIDTH (Shldr)VERTICAL GRADE (%)M DIMENSION
FDOT REQUIRED SSD 425.00 'AASHTO REQUIRED SSD 425.00 ' AASHTO 2011, Table 3-1 & 3-2.ACTUAL SSD 427.86 ' EQUATION
SUFFICIENT FDOT SSD? YESSUFFICIENT AASHTO SSD? YES
4/23/20185/17/2018
STOPPING SIGHT DISTANCE CALCULATIONS
All Other Facilities
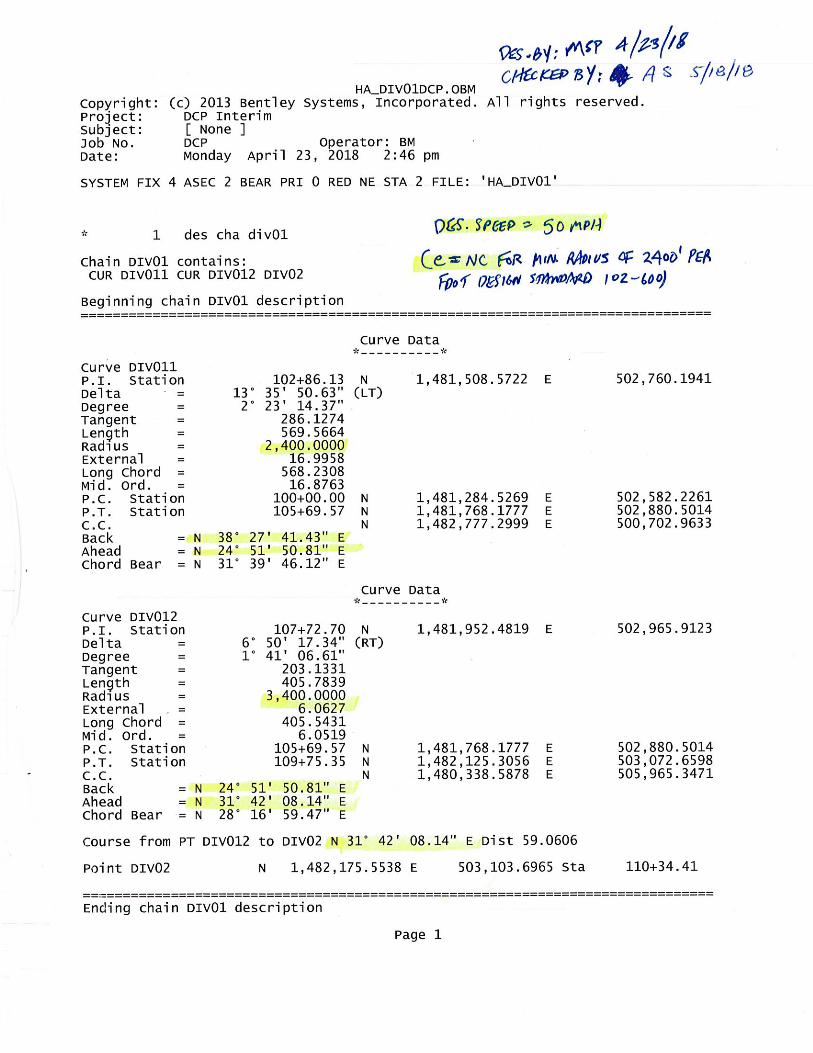
50 mphDIV011
2,400.00 'LT
2° 23' 14"
7.50 '
15 '2 '
-2.000%
FDOT PPM, TABLE 2.7.1, January 2016.
COMMENTS:
9.5 '
Where:
S = Stopping Sight Distance (ft)
RBL = Radius of Baseline (ft)
R = Radius (ft) = RBL+d
d = Distance from Baseline to Centerline of Inside Lane
W = Lane width (ft)Shldr = Shoulder width (ft)M = Middle Ordinate (ft) = SHLDR+W/2
S = R28.65
x Cos-1 1 -MR
Reference:AASHTO - 2011 3- 109
Sight Obstruction
ShldrLine ofSight
Highway Baseline
Inside LaneCenterline
Sight Distance (S)
M
RBL
Wd
pw:\\617479-PWINT.aecomonline.local:AECOM_DS01_NA\Documents\60480256-I4-BTU Orange County\400 Technical\430Roadway\Design Calculations\Segment G\SSD\SSD_Calcs_DIV01.xls

Page ofJob: Interim Daryl Carter Pkwy 441113-1-52-01 (Orange County)AECOM Project No: 60480256 Sheet 2 of 2Description: Stopping Sight Distance Calculations for Computed By: BM Date:
DIVERSION 1 (EB/WB CFP TO WB I-4) Checked By: MSP Date:
TYPE OF ROADWAY(Interstate, All other facilities )
DESIGN SPEEDCURVE NO.RADIUS OF CURVE (R BL )DIRECTION OF CURVE (LT or RT)DEGREE OF CURVEOFFSET DISTANCE FROM BASELINE TOCENTERLINE OF INSIDE LANE (d )LANE WIDTH (W )SHOULDER WIDTH (Shldr)VERTICAL GRADE (%)M DIMENSION
FDOT REQUIRED SSD 453.64 'AASHTO REQUIRED SSD 454.91 ' AASHTO 2011, Table 3-1 & 3-2.ACTUAL SSD 507.85 ' EQUATION
SUFFICIENT FDOT SSD? YESSUFFICIENT AASHTO SSD? YES
COMMENTS:NOT USED
9.5 '
FDOT PPM, TABLE 2.7.1, January 2016.
2 '-3.955%
DIV0123,400.00 '
RT 1° 41' 7"
7.50 '
15 '
4/23/20185/17/2018
STOPPING SIGHT DISTANCE CALCULATIONS
All Other Facilities
50 mph
Where:
S = Stopping Sight Distance (ft)
RBL = Radius of Baseline (ft)
R = Radius (ft) = RBL+d
d = Distance from Baseline to Centerline of Inside Lane
W = Lane width (ft)Shldr = Shoulder width (ft)M = Middle Ordinate (ft) = SHLDR+W/2
S = R28.65
x Cos-1 1 -MR
Reference:AASHTO - 2011 3- 109
Sight Obstruction
ShldrLine of
Sight
Highway Baseline
Inside LaneCenterline
Sight Distance (S)
M
RBL
Wd
pw:\\617479-PWINT.aecomonline.local:AECOM_DS01_NA\Documents\60480256-I4-BTU Orange County\400 Technical\430Roadway\Design Calculations\Segment G\SSD\SSD_Calcs_DIV01.xls

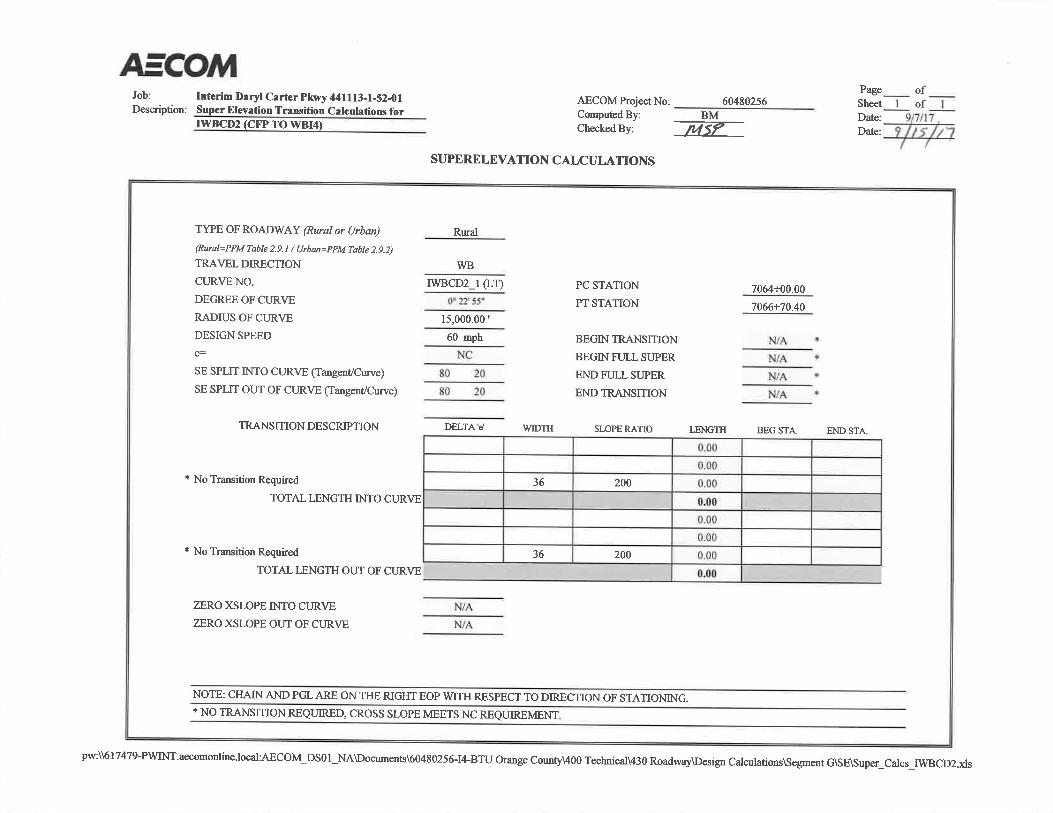
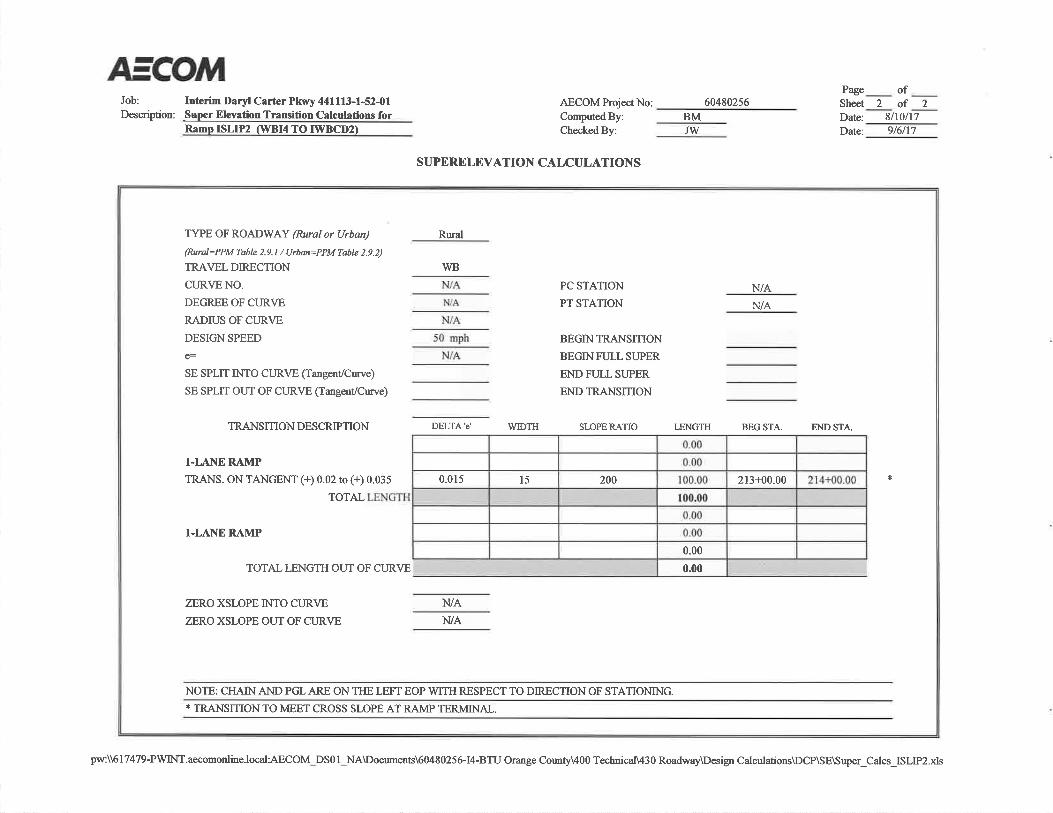
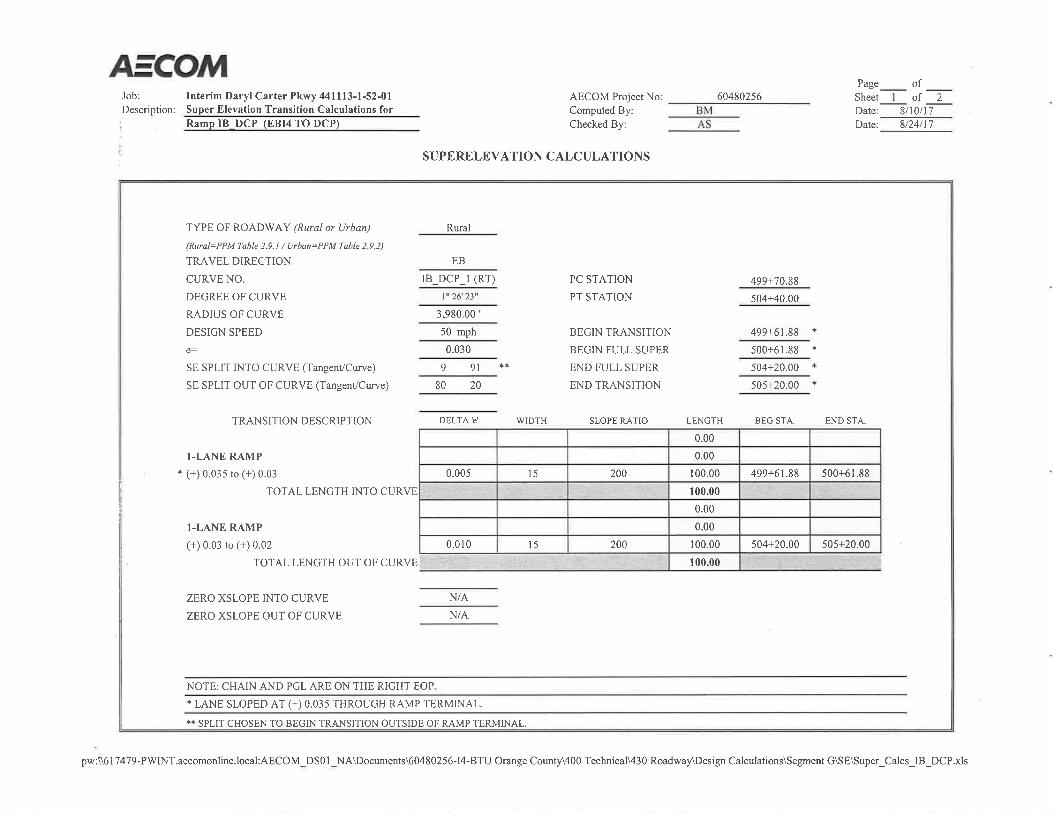
Page ofJob: Interim Daryl Carter Pkwy 441113-1-52-01 AECOM Project No: Sheet 1 of 2Description: Super Elevation Transition Calculations for Computed By: BM Date:
DIVERSION 1 (EB/WB TO WB I-4) Checked By: MSP Date:
TYPE OF ROADWAY (Rural or Urban)(Rural=PPM Table 2.9.1 / Urban=PPM Table 2.9.2)
TRAVEL DIRECTIONCURVE NO. PC STATION 100+00.00DEGREE OF CURVE PT STATION 105+69.57RADIUS OF CURVEDESIGN SPEED BEGIN TRANSITION N/Ae= * BEGIN FULL SUPER N/ASE SPLIT INTO CURVE (Tangent/Curve) 80 20 END FULL SUPER N/ASE SPLIT OUT OF CURVE (Curve/Curve) 80 20 END TRANSITION N/A
TRANSITION DESCRIPTION WIDTH SLOPE RATIO LENGTH BEG STA. END STA.
0.00
1-LANE RAMP 0.00No Transition Required 0.00
TOTAL LENGTH INTO CURVE 0.001-LANE RAMP 0.00
0.0015 200 100.00 103+55.00 104+55.00
TOTAL LENGTH OUT OF CURVE 100.00
ZERO XSLOPE INTO CURVEZERO XSLOPE OUT OF CURVE
604802564/23/185/17/18
SUPERELEVATION CALCULATIONS
Rural
WBDIV011 (LT)
2° 23' 14"
2,400.00 '50 mph
0.047
*PER FDOT DESIGN STANDARD 102-600 SUPERELEVATION IS NC FOR 2,400' RADIUS FOR TTCP.
0.015
N/AN/A
DELTA 'e'
NOTE: CHAIN AND PGL ARE ON THE LEFT EOP IN THE DIRECTION OF STATIONING.
(+) 0.035 to (+) 0.02 at Transition to start justbeyond physical gore.
pw:\\617479-PWINT.aecomonline.local:AECOM_DS01_NA\Documents\60480256-I4-BTU Orange County\400 Technical\430 Roadway\Design Calculations\Segment G\SE\Super_Calcs_DIV01.xls

Page ofJob: Interim Daryl Carter Pkwy 441113-1-52-01 AECOM Project No: Sheet 2 of 2
Description: Super Elevation Transition Calculations for Computed By: BM Date:DIVERSION 1 (EB/WB TO WB I-4) Checked By: MSP Date:
TYPE OF ROADWAY (Rural or Urban)(Rural=PPM Table 2.9.1 / Urban=PPM Table 2.9.2)
TRAVEL DIRECTIONCURVE NO. PC STATION 105+69.57DEGREE OF CURVE PT STATION 109+75.35RADIUS OF CURVEDESIGN SPEED BEGIN TRANSITION N/Ae= * BEGIN FULL SUPER N/ASE SPLIT INTO CURVE (Curve/Curve) 80 20 END FULL SUPER N/ASE SPLIT OUT OF CURVE (Tangent/Curve) 80 20 END TRANSITION N/A
TRANSITION DESCRIPTION WIDTH SLOPE RATIO LENGTH BEG STA. END STA.
0.001-LANE RAMP 0.00No Transition Required 0.00
TOTAL LENGTH INTO CURVE 0.000.00
1-LANE RAMP 0.00No Transition Required 0.00
TOTAL LENGTH OUT OF CURVE 0.00
ZERO XSLOPE INTO CURVEZERO XSLOPE OUT OF CURVE
604802564/23/20185/17/2018
SUPERELEVATION CALCULATIONS
Rural
WBDIV012 (RT)
1° 41' 7"
3,400.00 '50 mph
NOTE: CHAIN AND PGL ARE ON THE LEFT EOP IN THE DIRECTION OF STATIONING.
0.035
DELTA 'e'
N/AN/A
*PER FDOT DESIGN STANDARD 102-600 SUPERELEVATION IS NC FOR 2,400' RADIUS FOR TTCP.
pw:\\617479-PWINT.aecomonline.local:AECOM_DS01_NA\Documents\60480256-I4-BTU Orange County\400 Technical\430 Roadway\Design Calculations\Segment G\SE\Super_Calcs_DIV01.xls
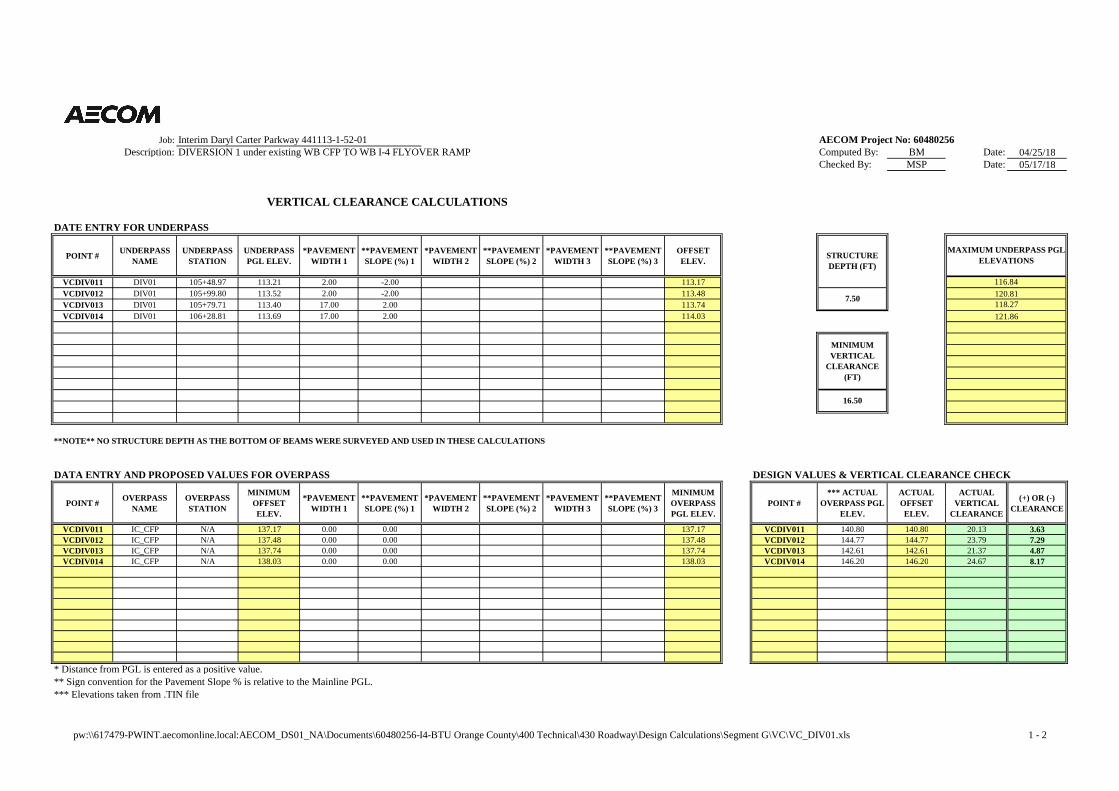
Job: AECOM Project No: 60480256Description: Computed By: BM Date: 04/25/18
Checked By: MSP Date: 05/17/18
DATE ENTRY FOR UNDERPASS
POINT # UNDERPASSNAME
UNDERPASSSTATION
UNDERPASSPGL ELEV.
*PAVEMENTWIDTH 1
**PAVEMENTSLOPE (%) 1
*PAVEMENTWIDTH 2
**PAVEMENTSLOPE (%) 2
*PAVEMENTWIDTH 3
**PAVEMENTSLOPE (%) 3
OFFSETELEV.
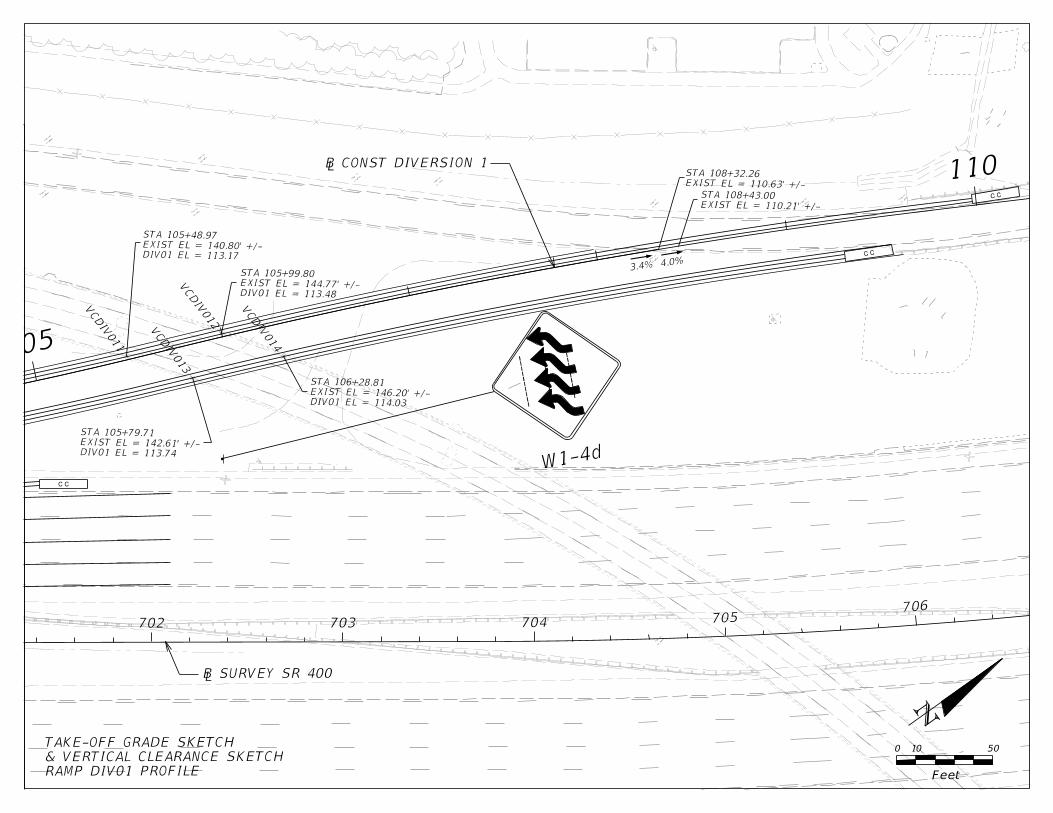
VCDIV011 DIV01 105+48.97 113.21 2.00 -2.00 113.17VCDIV012 DIV01 105+99.80 113.52 2.00 -2.00 113.48VCDIV013 DIV01 105+79.71 113.40 17.00 2.00 113.74VCDIV014 DIV01 106+28.81 113.69 17.00 2.00 114.03
**NOTE** NO STRUCTURE DEPTH AS THE BOTTOM OF BEAMS WERE SURVEYED AND USED IN THESE CALCULATIONS
DATA ENTRY AND PROPOSED VALUES FOR OVERPASS DESIGN VALUES & VERTICAL CLEARANCE CHECK
POINT # OVERPASSNAME
OVERPASSSTATION
MINIMUMOFFSETELEV.
*PAVEMENTWIDTH 1
**PAVEMENTSLOPE (%) 1
*PAVEMENTWIDTH 2
**PAVEMENTSLOPE (%) 2
*PAVEMENTWIDTH 3
**PAVEMENTSLOPE (%) 3
MINIMUMOVERPASSPGL ELEV.
POINT #*** ACTUAL
OVERPASS PGLELEV.
ACTUALOFFSETELEV.
ACTUALVERTICAL
CLEARANCE
(+) OR (-)CLEARANCE
VCDIV011 IC_CFP N/A 137.17 0.00 0.00 137.17 VCDIV011 140.80 140.80 20.13 3.63VCDIV012 IC_CFP N/A 137.48 0.00 0.00 137.48 VCDIV012 144.77 144.77 23.79 7.29VCDIV013 IC_CFP N/A 137.74 0.00 0.00 137.74 VCDIV013 142.61 142.61 21.37 4.87VCDIV014 IC_CFP N/A 138.03 0.00 0.00 138.03 VCDIV014 146.20 146.20 24.67 8.17
* Distance from PGL is entered as a positive value.** Sign convention for the Pavement Slope % is relative to the Mainline PGL.*** Elevations taken from .TIN file
7.50
Interim Daryl Carter Parkway 441113-1-52-01
MAXIMUM UNDERPASS PGLELEVATIONS
116.84120.81118.27121.86
STRUCTUREDEPTH (FT)
16.50
MINIMUMVERTICAL
CLEARANCE(FT)
DIVERSION 1 under existing WB CFP TO WB I-4 FLYOVER RAMP
VERTICAL CLEARANCE CALCULATIONS
pw:\\617479-PWINT.aecomonline.local:AECOM_DS01_NA\Documents\60480256-I4-BTU Orange County\400 Technical\430 Roadway\Design Calculations\Segment G\VC\VC_DIV01.xls 1 - 2
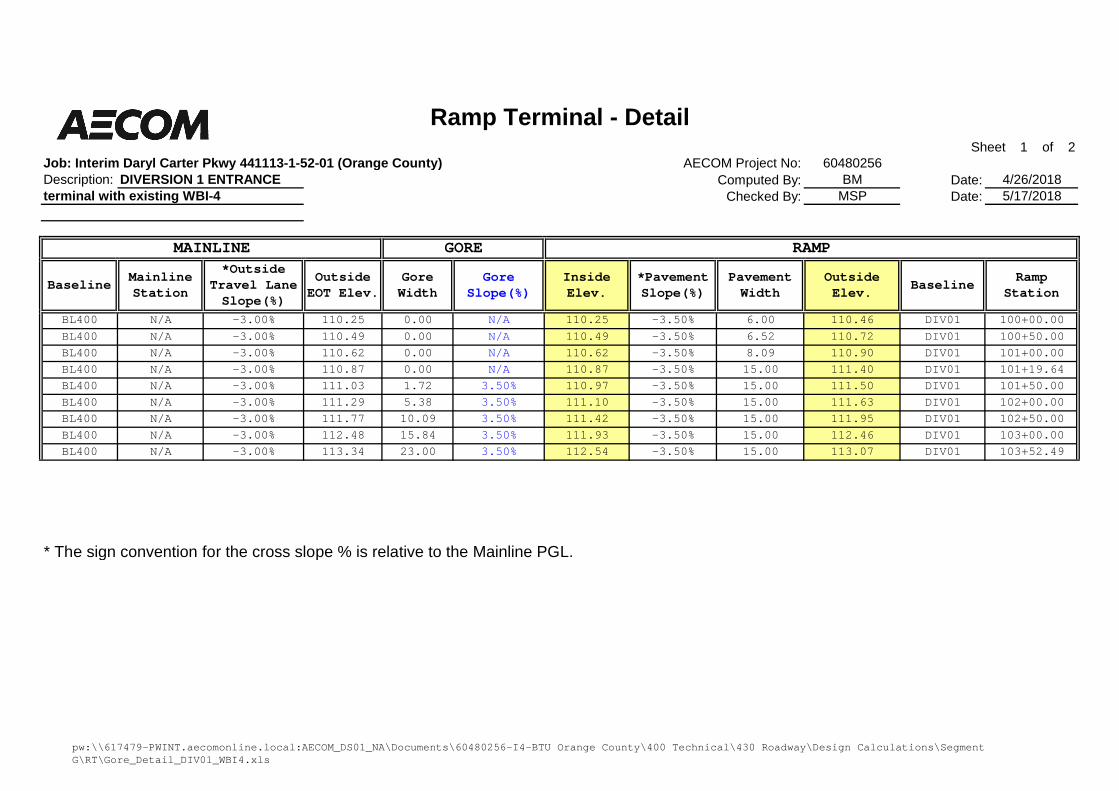
Sheet 1 of 2Job: Interim Daryl Carter Pkwy 441113-1-52-01 (Orange County) AECOM Project No: 60480256Description: Computed By: BM Date: 4/26/2018
Checked By: MSP Date: 5/17/2018
BaselineMainlineStation
*OutsideTravel LaneSlope(%)
OutsideEOT Elev.
GoreWidth
GoreSlope(%)
InsideElev.
*PavementSlope(%)
PavementWidth
OutsideElev.
BaselineRamp
Station
BL400 N/A -3.00% 110.25 0.00 N/A 110.25 -3.50% 6.00 110.46 DIV01 100+00.00BL400 N/A -3.00% 110.49 0.00 N/A 110.49 -3.50% 6.52 110.72 DIV01 100+50.00BL400 N/A -3.00% 110.62 0.00 N/A 110.62 -3.50% 8.09 110.90 DIV01 101+00.00BL400 N/A -3.00% 110.87 0.00 N/A 110.87 -3.50% 15.00 111.40 DIV01 101+19.64BL400 N/A -3.00% 111.03 1.72 3.50% 110.97 -3.50% 15.00 111.50 DIV01 101+50.00BL400 N/A -3.00% 111.29 5.38 3.50% 111.10 -3.50% 15.00 111.63 DIV01 102+00.00BL400 N/A -3.00% 111.77 10.09 3.50% 111.42 -3.50% 15.00 111.95 DIV01 102+50.00BL400 N/A -3.00% 112.48 15.84 3.50% 111.93 -3.50% 15.00 112.46 DIV01 103+00.00BL400 N/A -3.00% 113.34 23.00 3.50% 112.54 -3.50% 15.00 113.07 DIV01 103+52.49
* The sign convention for the cross slope % is relative to the Mainline PGL.
Ramp Terminal - Detail
DIVERSION 1 ENTRANCEterminal with existing WBI-4
MAINLINE GORE RAMP
pw:\\617479-PWINT.aecomonline.local:AECOM_DS01_NA\Documents\60480256-I4-BTU Orange County\400 Technical\430 Roadway\Design Calculations\SegmentG\RT\Gore_Detail_DIV01_WBI4.xls
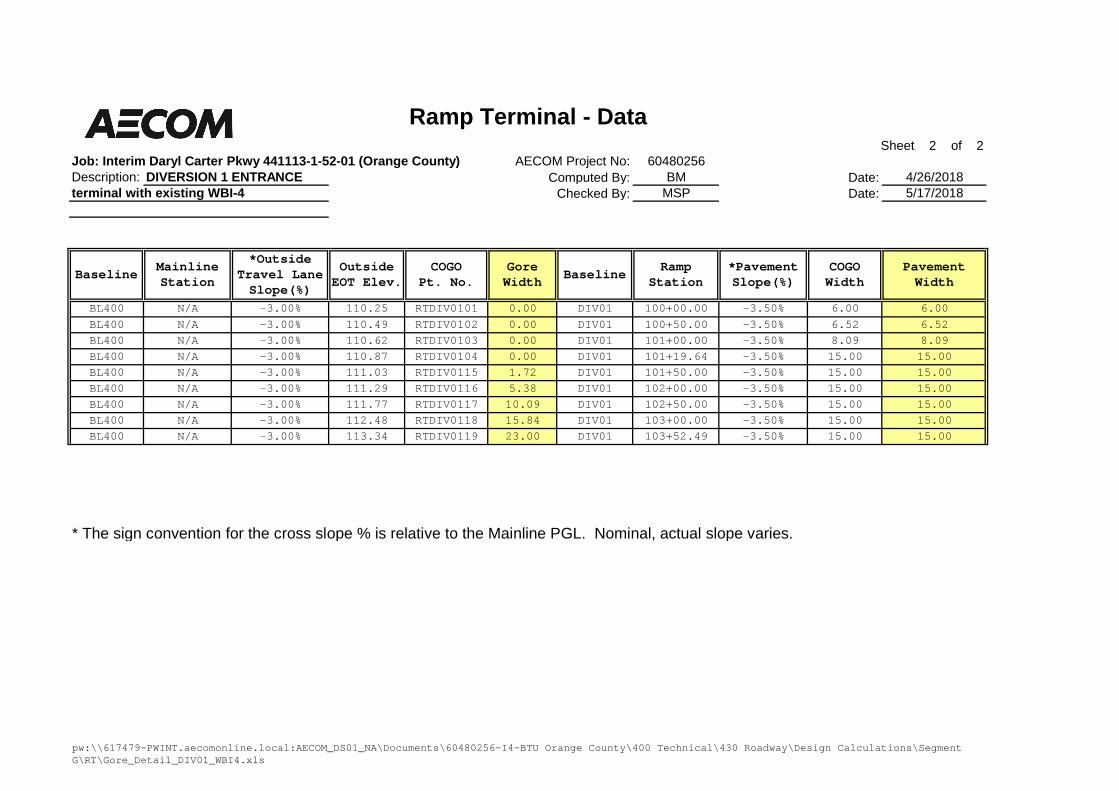
Sheet 2 of 2Job: Interim Daryl Carter Pkwy 441113-1-52-01 (Orange County) AECOM Project No: 60480256Description: Computed By: BM Date: 4/26/2018
Checked By: MSP Date: 5/17/2018
BaselineMainlineStation
*OutsideTravel LaneSlope(%)
OutsideEOT Elev.
COGOPt. No.
GoreWidth
BaselineRamp
Station*PavementSlope(%)
COGOWidth
PavementWidth
BL400 N/A -3.00% 110.25 RTDIV0101 0.00 DIV01 100+00.00 -3.50% 6.00 6.00BL400 N/A -3.00% 110.49 RTDIV0102 0.00 DIV01 100+50.00 -3.50% 6.52 6.52BL400 N/A -3.00% 110.62 RTDIV0103 0.00 DIV01 101+00.00 -3.50% 8.09 8.09BL400 N/A -3.00% 110.87 RTDIV0104 0.00 DIV01 101+19.64 -3.50% 15.00 15.00BL400 N/A -3.00% 111.03 RTDIV0115 1.72 DIV01 101+50.00 -3.50% 15.00 15.00BL400 N/A -3.00% 111.29 RTDIV0116 5.38 DIV01 102+00.00 -3.50% 15.00 15.00BL400 N/A -3.00% 111.77 RTDIV0117 10.09 DIV01 102+50.00 -3.50% 15.00 15.00BL400 N/A -3.00% 112.48 RTDIV0118 15.84 DIV01 103+00.00 -3.50% 15.00 15.00BL400 N/A -3.00% 113.34 RTDIV0119 23.00 DIV01 103+52.49 -3.50% 15.00 15.00
* The sign convention for the cross slope % is relative to the Mainline PGL. Nominal, actual slope varies.
Ramp Terminal - Data
DIVERSION 1 ENTRANCEterminal with existing WBI-4
pw:\\617479-PWINT.aecomonline.local:AECOM_DS01_NA\Documents\60480256-I4-BTU Orange County\400 Technical\430 Roadway\Design Calculations\SegmentG\RT\Gore_Detail_DIV01_WBI4.xls

696 697 698 699 700 701
310
105
100 0.6%
50
Feet
0 10
N £ SURVEY SR 400
EL = 112.03'
STA 103+52.49
EL = 111.88'
STA 103+40.00
EL = 112.55'
STA 103+52.49
EXIST EL = 113.14' +/-
STA 103+50.03
EL = 112.40'
STA 103+40.00
EXIST ELEV = 112.93' +/-
STA 103+37.88
1.2%
3.5
%3.5
%
RT
DIV
0105
RT
DIV
0106
RT
DIV
0107
RT
DIV
0108
RT
DIV
0109
RT
DIV
0101
110.2
51
RT
DIV
0102
110.4
90
RT
DIV
0103
110.6
17
RT
DIV
0104
110.8
70
RT
DIV
0115
111.0
29
RT
DIV
0116
111.2
91
RT
DIV
0117
111.7
72
RT
DIV
0118
112.4
84
RT
DIV
0119
113.3
42
RAMP DIV01 PROFILE
& RAMP TERMINAL SKETCH
TAKE-OFF GRADE SKETCH
£ CONST DIVERSION 1
702 703 704 705706
105
110C C
C C
C C
W1-4d
EXIST EL = 110.63' +/-
STA 108+32.26
EXIST EL = 110.21' +/-
STA 108+43.00
4.0%3.4%
DIV01 EL = 113.17
EXIST EL = 140.80' +/-
STA 105+48.97
DIV01 EL = 113.48
EXIST EL = 144.77' +/-
STA 105+99.80
DIV01 EL = 113.74
EXIST EL = 142.61' +/-
STA 105+79.71
DIV01 EL = 114.03
EXIST EL = 146.20' +/-
STA 106+28.81
VC
DIV
011
VC
DIV
012
VC
DIV
013
VC
DIV
014
50
Feet
0 10
N
RAMP DIV01 PROFILE
& VERTICAL CLEARANCE SKETCH
TAKE-OFF GRADE SKETCH
£ SURVEY SR 400
£ CONST DIVERSION 1