rms-based damage detection in concrete beams: … da… · zima b, kedra r.: rms-based damage...
TRANSCRIPT

Article citation info:
Zima B, Kedra R. RMS-based damage detection in concrete beams: numerical simulations. Diagnostyka. 2019;20(4):3-10.
https://doi.org/10.29354/diag/112395
3
DIAGNOSTYKA, 2019, Vol. 20, No. 4
ISSN 1641-6414 e-ISSN 2449-5220
DOI: 10.29354/diag/112395
RMS-BASED DAMAGE DETECTION IN CONCRETE BEAMS: NUMERICAL
SIMULATIONS
Beata ZIMA, Rafał KĘDRA
Gdańsk University of Technology, Faculty of Civil and Environmental Engineering,
Department of Mechanics of Materials and Structures, Narutowicza 11/12, 80-233 Gdańsk, Poland,
e-mails: [email protected], [email protected]
Abstract
Image-based damage detection methods using guided waves are well known and widely applied
approaches in structural diagnostics. They are usually utilized in detection of surface damages or defects of
plate-like structures. The article presents results of the study of applicability of imaging wave-based methods
in detection in miniscule internal damage in the form of debonding. The investigations were carried out on
numerical models of reinforced concrete beams with varying size of circumferentially oriented debonding
between steel rod and concrete block. Maps created using root mean square of measured signals are
presented. Moreover, the results were collected for two different excitation frequencies.
Keywords: guided waves, damage detection, debonding, reinforced concrete
WYKRYWANIE USZKODZEŃ W BELKACH ŻELBETOWYCH Z WYKORZYSTANIEM
RMS: SYMULACJE NUMERYCZNE
Streszczenie
Metody obrazowania uszkodzeń wykorzystujące propagację fal prowadzonych są dobrze znanym i
powszechnie stosowanym narzędziem w diagnostyce konstrukcji. Zwykle są one wykorzystywane do
wykrywania uszkodzeń powierzchniowych lub uszkodzeń obiektów płytowych. W artykule przedstawiono
analizę możliwości wykorzystania metod obrazowania bazujących na propagacji fal prowadzonych w
wykrywaniu niewielkich, wewnętrznych uszkodzeń w postaci rozwarstwienia. Analiza została
przeprowadzona z użyciem modeli numerycznych belek żelbetowych z obwodowym rozwarstwieniem
pomiędzy zbrojeniem a otuliną betonową charakteryzującym się różnymi rozmiarami. Po obliczeniu średniej
kwadratowej dla zarejestrowanych sygnałów, wykonane zostały mapy. Ponadto, przedstawiono wyniki dla
dwóch różnych częstotliwości wzbudzenia.
Słowa kluczowe: fale prowadzone, wykrywanie uszkodzeń, beton zbrojony
1. INTRODUCTION
The nondestructive diagnostics has rapidly
developed during last decades. A variety of the
possible different approaches allows for applying
the most effective method with regard to the kind of
investigated object and an analysed problem. The
Nondestructive Testing (NDT) is divided into
various methods e.g. eddy current [1], ground
penetrating radar [2], acoustic emission [3],
vibration-based methods [4] or wave propagation
based methods like impact-echo [5], ultrasonic [6]
and guided wave propagation method [7],[8]. The
last method based on guided waves has been
extensively studied last years because of waves’
insignificant propagation loss and possible
application to damage detection. It has become an
appealing alternative for an expensive destructive
tests or long-time visual inspections. The guided
waves’ sensitivity to various types of damages
causes that they are especially attractive approach
for the civil engineering field. Their application
allows for monitoring large areas, which are not
readily accessible or detecting internal damages like
i.e. debondings occurring in composite specimens
or reinforced concrete structures, which was
presented in many papers. Feng et al. [9] used a
broadband chirp signal as excitation to detect
delaminations in composite plates. They showed
that by observing the disturbance of particular
frequency components of chirp-excited Lamb
waves, delamination length can be estimated. A
novel wave-based method for locating and imaging
the contact delaminations in composite plates using
Lyapunov damage index was proposed by Liu et al.
[10]. Low frequency guided waves for delamination
detection in composite laminates were numerically
analyzed by Shoja et al. [11]. Examples of the
usefulness of guided waves in debonding detection
in reinforced concrete structures has been presented
among others by Zhu et al. [12] Li et al. [13] and
Zima [14]. In the paper [14] it was proved that size
or circumferential extent of debonding can be
assessed on the basis of a single time-domain signal

DIAGNOSTYKA, Vol. 20, No. 4 (2019)
Zima B, Kedra R.: RMS-based damage detection in concrete beams: numerical simulations
4
registered at the end of the beam. However, the
described methods do not allow for both, precise
localization and determining the shape of the
debonding, especially when it is large in size. The
possible solution might be the image-based
methods, which usually allow for visualizing the
real position, size and shape of the damage [15]-
[17]. The idea of the use image-based methods
consists on appropriate interpretation of the
deviations of wave propagation patterns caused by
the presence of damage. Their main advantage is
the possibility of automation of the diagnostic
process and visualization of the exact defect
position. An application of image-based methods in
structural health monitoring was discussed by Żak
et al. [15] They described different strategies of
damage detection in plate and shell-like structures
using integral mean value (IMV) and root mean
square (RMS), which can be calculated on the basis
of the time-domain signals registered in the
monitored surface according to the following
formulas:
2
1 12 1
1 1IMV( ) ( )
nt
kt
k
s s t dt st t n
(1)
2
1
2 2
12 1
1 1RMS( ) ( )
nt
kt
k
s s t dt st t n
(2)
where s(t) is time signal sampled at n points. To
create enough detailed damage map, collecting a
large number of time-domain signals is required. A
perfect solution for monitoring of the significant
areas is using a laser scanning vibrometry (LSV).
Due to the fact that the scanning process is much
more efficient when scanned surface is flat, smooth
and laser light is not scattered, the RMS method is
usually applied for detection and visualization the
damage in plate or shell-like metallic structures
with the clearly visible damage in the form of e.g.
attached mass, missing bolts hole or damage
located near the surface [16]. In the case of
reinforced beams with debonding inside the
structure, it is impossible to scan the damage
directly. Moreover, in the case of plate-like
structures only one surface is scanned, while for
more complex structural shapes, the key aspect is
also the selection of the right area for scanning.
Especially, if there is no possibility to scan all
surfaces.
The article presents the results of numerical
investigation of detection of circumferentially
oriented debonding between steel rod and concrete
block. The main aim of the paper was an analysis of
the possibility of the use image-based inspection in
detection of damage located inside the beam-like
multi-layered structure. Moreover, the introduced
damage was characterized by a very small size. The
damage consisted in the lack of connection between
the steel core and the cover. The numerical
simulations were performed for two different
excitation frequencies to present the differences
between damage maps obtained for various input
parameters.
2. NUMERICAL RESULTS
2.1. Description of numerical model
The calculations were made for concrete beam
with rectangular cross section and single steel rod
embedded in the middle of the concrete block in the
longitudinal direction. The total length of the beam
was 50 cm. The material parameters for concrete
were: elastic modulus E=29 GPa, Poisson’s ratio v
= 0.2, density ρ = 2306 kg/m3 and for steel elastic
modulus E=207 GPa, Poisson’s ratio v = 0.3,
denisty ρ = 7894 kg/m3. The scheme of the
specimen is presented in Fig. 1.
Fig. 1. Scheme of the numerical model: a) geometry of the specimen
and b) geometry of the cross-section
DIAGNOSTYKA, Vol. 20, No. 4 (2019) 5
Zima B, Kedra R.: RMS-based damage detection in concrete beams: numerical simulations
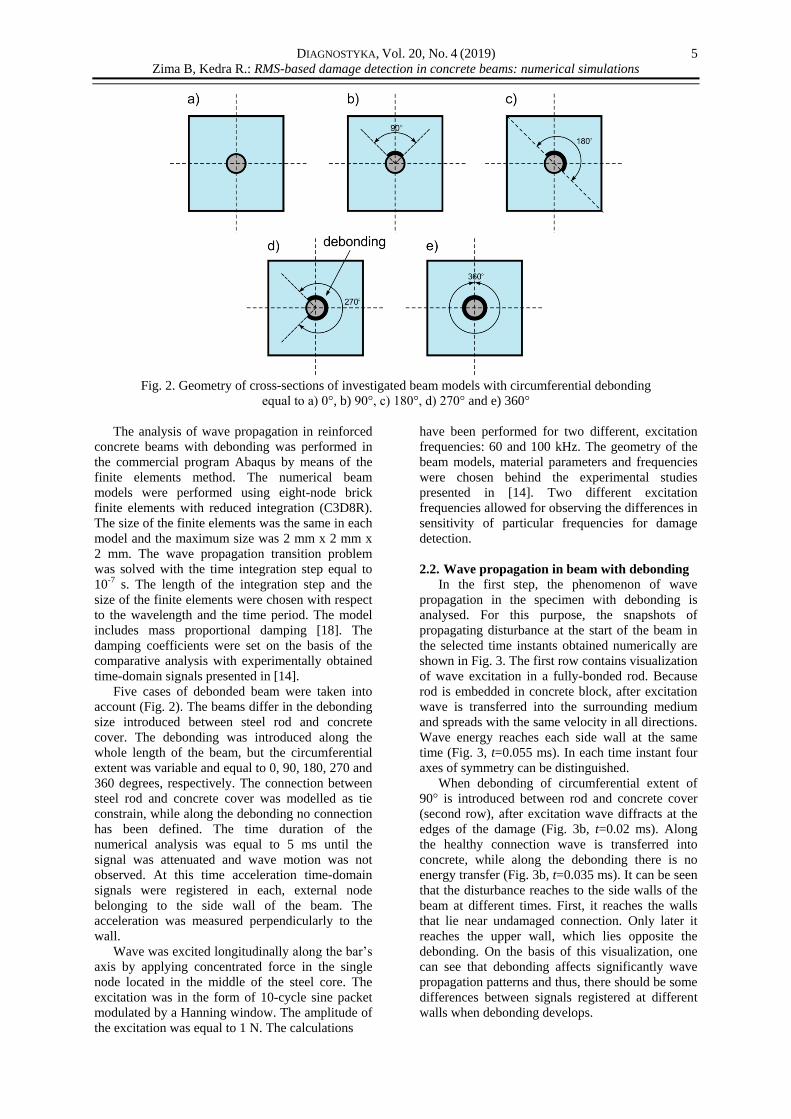
Fig. 2. Geometry of cross-sections of investigated beam models with circumferential debonding
equal to a) 0°, b) 90°, c) 180°, d) 270° and e) 360°
The analysis of wave propagation in reinforced
concrete beams with debonding was performed in
the commercial program Abaqus by means of the
finite elements method. The numerical beam
models were performed using eight-node brick
finite elements with reduced integration (C3D8R).
The size of the finite elements was the same in each
model and the maximum size was 2 mm x 2 mm x
2 mm. The wave propagation transition problem
was solved with the time integration step equal to
10-7 s. The length of the integration step and the
size of the finite elements were chosen with respect
to the wavelength and the time period. The model
includes mass proportional damping [18]. The
damping coefficients were set on the basis of the
comparative analysis with experimentally obtained
time-domain signals presented in [14].
Five cases of debonded beam were taken into
account (Fig. 2). The beams differ in the debonding
size introduced between steel rod and concrete
cover. The debonding was introduced along the
whole length of the beam, but the circumferential
extent was variable and equal to 0, 90, 180, 270 and
360 degrees, respectively. The connection between
steel rod and concrete cover was modelled as tie
constrain, while along the debonding no connection
has been defined. The time duration of the
numerical analysis was equal to 5 ms until the
signal was attenuated and wave motion was not
observed. At this time acceleration time-domain
signals were registered in each, external node
belonging to the side wall of the beam. The
acceleration was measured perpendicularly to the
wall.
Wave was excited longitudinally along the bar’s
axis by applying concentrated force in the single
node located in the middle of the steel core. The
excitation was in the form of 10-cycle sine packet
modulated by a Hanning window. The amplitude of
the excitation was equal to 1 N. The calculations
have been performed for two different, excitation
frequencies: 60 and 100 kHz. The geometry of the
beam models, material parameters and frequencies
were chosen behind the experimental studies
presented in [14]. Two different excitation
frequencies allowed for observing the differences in
sensitivity of particular frequencies for damage
detection.
2.2. Wave propagation in beam with debonding
In the first step, the phenomenon of wave
propagation in the specimen with debonding is
analysed. For this purpose, the snapshots of
propagating disturbance at the start of the beam in
the selected time instants obtained numerically are
shown in Fig. 3. The first row contains visualization
of wave excitation in a fully-bonded rod. Because
rod is embedded in concrete block, after excitation
wave is transferred into the surrounding medium
and spreads with the same velocity in all directions.
Wave energy reaches each side wall at the same
time (Fig. 3, t=0.055 ms). In each time instant four
axes of symmetry can be distinguished.
When debonding of circumferential extent of
90° is introduced between rod and concrete cover
(second row), after excitation wave diffracts at the
edges of the damage (Fig. 3b, t=0.02 ms). Along
the healthy connection wave is transferred into
concrete, while along the debonding there is no
energy transfer (Fig. 3b, t=0.035 ms). It can be seen
that the disturbance reaches to the side walls of the
beam at different times. First, it reaches the walls
that lie near undamaged connection. Only later it
reaches the upper wall, which lies opposite the
debonding. On the basis of this visualization, one
can see that debonding affects significantly wave
propagation patterns and thus, there should be some
differences between signals registered at different
walls when debonding develops.

6 DIAGNOSTYKA, Vol. 20, No. 4 (2019)
Zima B, Kedra R.: RMS-based damage detection in concrete beams: numerical simulations
Fig. 3. Visualization of wave propagation at the start of the a) beam without debonding
and b) beam with debonding of extent 90°
2.3. Damage maps
The damage maps have been created using
collected time-domain signals. Signals were
registered at each node lying on the side surface of
the beam. Next, the value of RMS using Eq. (2)
was calculated and presented as 2D image using
Delaunay triangulation. The results are shown in
Fig. 4 and 5. Two different excitation frequencies
were taken into account: 60 and 100 kHz. Figure 4
presents the results for frequency 60 kHz, while the
results for 100 kHz are given in Fig. 5.
For each of five beam models there are four
maps corresponding particular side walls. Above
the damage maps an additional scheme figures
showing for which wall the RMS map was
calculated have been added for the clarity.
In the first case of undamaged beam, one can
see that four maps are exactly the same (Fig. 4a).
Because rod is perfectly connected with concrete
cover on the whole of its surface, wave energy
leaks with the same intensity in each direction. The
same amount of energy reaches each of the four
side walls of the beam. The highest values of RMS
represented by red color were registered in the
middle part of the beam, what suggests that the
largest amount of wave energy has propagated
there. Because after excitation in the rod wave
travels with the same velocity in each direction, it
propagates circularly (compare Fig. 3a). The
visualization shown in Fig. 3a (t=0.055 ms) proves
that middle parts of the walls are the first places
which wave reaches. It is well known that the
longer the distance wave travels, the smaller its
amplitude is, because of geometric and material
damping. RMS values are the highest in the middle
parts of the walls, because there the first reflections
from the edges are registered.
When debonding was introduced in the model,
RMS maps changed significantly compared to the
maps obtained for undamaged beam (Fig. 4b). In
maps created for wall 1 and 3, that lie exactly
opposite to the debonding, the outline of the rod is
clearly visible. The higher values of RMS is caused
by wave diffraction at the edges of the debonding
(see Fig. 3b, t=0.02 ms). In the case of debonding
of circumferential extent of 90° vertical axis of
symmetry exists. The symmetry is visible in the
equality of maps obtained for walls 2 and 4, which
lies on both sides of this axis.
In the case of beam with debonding of extent
equal to 180° (Fig. 4c) two axes of symmetry can
be distinguished and they coincide with diagonals
of the cross-section. The consequence is equality of
two pairs of images. The maps 1 and 2 and next 3
and 4 are the same.
When only one axis of symmetry can be
indicated like in the case shown in Fig. 4d, one pair
of similar maps is obtained. The axis of symmetry
coincides with horizontal axis and thus, maps 1 and
3 are equal. One can see that in RMS maps
calculated for walls 2 and 4, which lied opposite the

DIAGNOSTYKA, Vol. 20, No. 4 (2019) 7
Zima B, Kedra R.: RMS-based damage detection in concrete beams: numerical simulations
Fig. 4. RMS maps for beam with debonding of extent a) 0°, b) 90°, c) 180°,
d) 270° and e) 360° for excitation of 60 kHz

DIAGNOSTYKA, Vol. 20, No. 4 (2019)
Zima B, Kedra R.: RMS-based damage detection in concrete beams: numerical simulations
8
Fig. 5. RMS maps for beam with debonding of extent a) 0°, b) 90°, c) 180°, d) 270°
and e) 360° for excitation of 100 kHz

DIAGNOSTYKA, Vol. 20, No. 4 (2019) 9
Zima B, Kedra R.: RMS-based damage detection in concrete beams: numerical simulations
undamaged part of the beam, the areas
characterized by the higher value of the RMS value
can be indicated. The location of these areas
coincides with the longitudinal axis of the rod.
The last case concerned specimen with totally
debonded rod – as a wave was excited in separated
waveguide, no energy was transferred into
surrounding medium and no wave motion was
registered at the side surfaces. The RMS values are
0 on the each side surface.
The RMS maps performed in the same way for
100 kHz are presented in Fig. 5. As previously,
only in the case of the totally bonded rod, four
maps for all beam walls are the same (Fig. 5a). Due
to the appearance of the damage, one cannot
distinguish four axes of symmetry and the
differences between maps in the rest of cases are
visible (Fig. 5b-e). Despite the fact that the
frequencies 60 and 100 kHz do not differ much, the
character of the images created for those two
excitations is very different. First significant
difference is the location of the areas characterized
by high values of RMS. They coincide with the
location of the bar (middle part of the beam) and
they localized at the end of the specimen, where
wave reflects from the opposite beam end. The
second difference is the inability to identify the
areas where wave was diffracted. On the other
hand, in maps for 100 kHz the longitudinal axis of
the rod can be easily indicated.
The obtained results suggest that debonding
occurrence significantly affects the RMS maps.
However, despite the difference between outcomes
for varying circumferential extent of the damage,
determining the exact damage size and location on
the basis of presented results is still a great
challenge. Notwithstanding that RMS-based
method in this case does not provide
comprehensive information about potential damage,
presented approach can be useful in confirming the
presence of debonding in reinforced concrete
beams. In the absence of any damage and
longitudinal excitation, all maps performed for
particular side surfaces would be identical.
Otherwise, significant differences between images
obtained for various side surfaces of the same
specimen are related with structural fault.
Moreover, very low values of RMS can also
indicate a poor condition of adhesive connection
between core and the cover (see Fig. 4e and 5e).
The main disadvantage of the approach based on
comparable analysis of maps created for various
side surfaces is the necessity of scanning the large
surface of the structure.
On the other hand, the results obtained allow to
conclude that RMS-based method can be applied in
detection various types of damages located inside
the structure. The examples are debondings or
cracks in multilayered specimens i.e. composite
structures. The occurrence of the inside damage
affects the wave propagation patterns observed at
the outer surface of the structure.
Moreover, the RMS maps can be also used to
choose an appropriate location of the sensors
attached to the monitored structure. According to
Eq. (2) the RMS value is the measure of the signal
energy. One can see that in some places the RMS
values increase or decrease as a result of debonding
development and additional wave diffractions,
while in some places in the beams side surfaces the
RMS values remain the same regardless the
debonding occurrence. The potential system of
continuous monitoring would require the small
number of permanently attached sensors. It is
desirable to locate the sensors, in places where the
most significant change in RMS value was
observed. Then, even the small change in the
monitored RMS value or signal energy would
indicate the possible damage development.
3. CONCLUSIONS
The article presents the results of numerical
investigation partial, circumferentially oriented
debonding detection in reinforced concrete beams
using guided waves propagation. The main of the
paper was an analysis of the possibility of internal,
miniscule damage detection on the basis of
commonly used RMS-based method. Signals were
collected for four side walls of each beam and then
damage maps were created. Despite the fact that
obtained results do not allow for precise
determining the location and shape of the damage,
its occurrence can be detected on the basis of the
lack of symmetry of results. The results were
collected for two different excitation frequencies,
which allow to observe the difference in sensitivity
of the particular frequency to debonding detection.
The presented results indicate the high potential
of RMS-based method in detection of internal
damages on the basis of the wave propagation
patterns observed on the outer surface of the
structure.
REFERENCES
1. Drobiec Ł, Jasiński R, Mazur W. Accuracy of Eddy-
Current and Radar Methods Used in Reinforcement
Detection. Materials 2019; 12(7): 1168.
https://doi.org/10.3390/ma12071168
2. Lachowicz J, Rucka M. Numerical modeling of GPR
field in damage detection of a reinforced concrete
footbridge. Diagnostyka 2016; 17(2): 3-8.
3. Goszczyńska B, Świt G, Trąpczyński W,
Krampinowska A, Tworzewska J, Tworzewski P.
Experimental validation of concrete crack
identification and location with acoustic emission
method. Archives of Civil and Mechanical
Engineering 2012; 12(1): 23-28.
https://doi.org/10.1016/j.acme.2012.03.004
4. Mendrok K, Uhl T. Experimental verification of the
damage localization procedure based on modal
filtering. Structural Health Monitoring 2011; 10(2):
157-171. https://doi.org/10.1177/1475921710373292
5. Garbacz A, Piotrowski T, Courard L, Kwaśniewski L.
On the evaluation of interface quality in concrete

DIAGNOSTYKA, Vol. 20, No. 4 (2019)
Zima B, Kedra R.: RMS-based damage detection in concrete beams: numerical simulations
10
repair system by means of impact-echo signal
analysis. Construction and Building Materials 2017;
134: 311-323.
https://doi.org/10.1016/j.conbuildmat.2016.12.064
6. Czarnecki L, Garbacz A, Krystosiak M. On the
ultrasound assessment of adhesion between polymer
coating and concrete substrate. Cement and Concrete
Composites 2016; 28(4): 360-369.
https://doi.org/10.1016/j.cemconcomp.2006.02.017
7. Mitra M, Gopalakrishnan S. Guided wave based
structural health monitoring: A review, Smart
Materials and Structures 2016, 25(5): 1-27.
https://doi.org/10.1088/0964-1726/25/5/053001
8. Ostachowicz W, Kudela P, Krawczuk M, Żak A.
Guided waves in structures for SHM. The Time-
domain Spectral Element Method, John Wiley& Sons
Ltd. 2012.
9. Feng B, Ribeiro AL, Ramos HG. A new method to
detect delamination in composites using chirp-excited
Lamb wave and wavelet analysis. NDT and E
International 2018; 100: 64-73.
https://doi.org/10.1016/j.ndteint.2018.08.004
10. Liu X, Bo L, Yang K, Liu Y, Zhao Y, Zhang J, Hu N,
Deng M. Locating and imaging contact delamination
based on chaotic detection of nonlinear Lamb waves.
Mechanical Systems and Signal Processing 2018;109:
58-73. https://doi.org/10.1016/j.ymssp.2018.02.041
11. Shoja S, Berbyuk V, Bostrom A. Delamination
detection in composite laminates using low frequency
guided waves: Numerical simulations. Composite
Structures 2018; 203: 826-834.
https://doi.org/10.1016/j.compstruct.2018.07.025
12. Zhu XQ, Hao H, Fan Q. Detection of delamination
between steel bars and concrete using embedded
piezoelectric actuators/sensors. Journal of Civil
Structural Health Monitoring 2013; 3: 105-115.
https://doi.org/10.1007/s13349-013-0039-2
13. Li J, Lu Y, Guan R, Qu W. Guided waves for
debonding identification on CFRP-reinforced
concrete beams. Construction and Building Materials
2017; 131: 388-399.
https://doi.org/10.1016/j.conbuildmat.2016.11.058
14. Zima B. Guided Wave Propagation in Detection of
Partial Circumferential Debonding in Concrete
Structures. Sensors 2019; 19(9): 2199.
https://doi.org/10.3390/s19092199
15. Żak A, Radzieński M, Krawczuk M, Ostachowicz W.
Damage detection strategies based on propagation of
guided elastic waves. Smart Materials and Structures
2012;21:1-18.
https://doi.org/10.1088/0964-1726/21/3/035024
16. Saravanan JT, Gopalakrishnan N, Rao NP. Damage
detection in structural element through propagating
waves using radially weighted and factored RMS.
Measurement, 2015;3:520-538.
https://doi.org/10.1016/j.measurement.2015.06.015
17. Radzieński M, Doliński Ł, Żak A, Ostachowicz W.
Application of RMS for damage detection by guided
elastic waves. Journal of Physics. Conference Series.
2011;305:1-10.
https://doi.org/10.1088/1742-6596/305/1/012085
18. Kudela P, Krawczuk M, Ostachowicz W. Wave
propagation modelling in 1D structures using spectral
finite elements. Journal of sound and vibration
2007;300: 88-100.
https://doi.org/10.1016/j.jsv.2006.07.031
Received 2019-05-30
Accepted 2019-09-16
Available online 2019-09-17
Beata ZIMA, Ph.D. graduated
civil engineering at the Faculty of
Civil and Environmental
Engineering, Gdańsk University
of Technology. She mainly deals
with diagnostics of structural
elements using guided wave
propagation.
Rafał KĘDRA, M.Sc. graduated
civil engineering at Gdańsk
University of Technology. Since
October 2014 he continues his
education as a Ph.D. student. His
main interests are modelling of
mechanical structures and non-
destructive testing.