rmb morgan stanley big five conference - the vault mainly for maintenance as projects ... three...
TRANSCRIPT

RMB Morgan Stanley Big Five Conference
26 - 27 September 2016
Darryll Castle – CEO
Tryphosa Ramano - CFO
2
Agenda
IntroductionCorporate
Update
Operational Overview
Projects Update
Outlook &Questions

3
CORPORATE UPDATE

4
Results of the rights offer
rights offer was more than 5x over-subscribed
Shareholders and their renouncees subscribed for 920 million of the 1 billion rights offer shares
Applications were received for 5 089 million rights offer shares, equivalent to 509% of the total rights offer shares available for subscription
80 million rights offer shares in respect of excess applications were allocated in an equitable manner as set out in the rights offer circular
The rights offer was underwritten by Standard Bank, Absa Bank, Nedbank and Rand Merchant Bank
The underwriters were not required to subscribe for any rights offer shares
Results of rights offer

5
Debt as at June 2016:
R5.9 billion (PPC Centre/RSA)
R9.6 billion (PPC Group)
R3.7 billion of the group debt relates to the rest of Africa
Proceeds of R4 billion Rights Offer:
repaid outstanding debt of R3 billion – R1.8 billion for the liquidity and guarantee facility and R1.2 billion for other debt
finance existing projects of the group and other funding requirements
settled transactions costs
B-BBEE 1 is maturing in December 2016 and proceeds are expected to be between R850 million to R1 billion which will be used to further reduce debt at the centre
Debt in the SA business (PPC centre) will be the range of R2 billion to R2.5 billion post December 2016
Post rights offer balance sheet

6
In 2008, PPC implemented its first black ownership initiative which matures in December 2016 (15% shareholding by broad-based partners including the SBPs and CSGs)
Upon maturity:
in terms of the agreement, PPC is obliged to pay the bullet loan of about R1 billion to the SBPs and CSGs
SBPs and CSGs pay the external funders and remaining cash of between R850 million and R1 billion is utilised to subscribe for PPC shares at R66.84 (compulsory subscription)
PPC is obliged to buy back the 48.5 million shares at a nominal rate – shares will be cancelled
proceeds of subscribed shares will be used to reduce PPC debt
Details of the unwind will be shared with investors in due course
Work is underway to meet DMR requirements
Empowerment transaction
Management focus post Rights Offer

7
Key focus areas going forward
Focus on delivery of existing projects in South Africa (Slurry SK9), the DRC, Zimbabwe and Ethiopia
In SA, focus on cost optimisation and future capex expansion at Dwaalboom and De Hoek
Focus on delivery of business plans in the rest of Africa projects
Embed the recently acquired 3Q Mahuma Concrete business in our materials business; further enhancing our channel management strategy
Restructure of residual debt at the centre
Continued management actions in response to risk, compliance and internal controls
Cost and efficiency focus with internal initiatives to continue the execution of our Profit Improvement Programme
Management focus post Rights Offer

8
Capex guidance F2017 F2018 F2019
RSA R900m – R1bn R900m – R1bn R500m – R700m
ROA R1bn – R1.5bn R100m – R200m R100m – R250m
Total R1.9bn – R2.5bn* R1bn – R1.2bn* R600m – R950m*
*Excludes Ethiopia
~R500 million has been spent to date on Slurry kiln 9 (SK9)
RSA F2017 – F2019: bulk of capex for Slurry kiln 9
F2017: rest of Africa capex to complete remaining projects
F2019: other expansion capex will be spent at Dwaalboom and De Hoek
F2018 – F2020: rest of Africa capex mainly for maintenance as projects will be substantively complete
Q1 F2017(Quarter to June 2016)
Q1 F2016 (Quarter to June 2015)
F2016(Six months to March 2016)
Maintenance capex
213 263
SK9 expansion 143 110 114
DRC 218 581 486
Zimbabwe 87 97 259
Total 555 1 001 1122
Capex guidance

9
Three mega-plant strategy
In F2017
~R72m to be spent on Dwaalboom kiln 1 ESP to address emissions compliance
continue with Slurry SK 9 project
In 2018
Completion of Slurry SK 9
From F2019
Dwaalboom
Reclaiming, raw material handling and proportioning capex
~R350m to be spent to remove bottlenecks at Dwaalboom which will:
solve material handling constraints in the limestone reclaiming circuit
increase the capacity of the limestone reclaimer and raw mix proportioning (each kiln has its own kiln feed)
increase nameplate output to 5500tpd of clinker capacity from 4800tpd of clinker capacity
these changes will enable Dwaalboom to run more efficiently at an optimal mix design
De Hoek
Alternative fuels system for De Hoek kiln 6
~R400 million will be spent to ensure the use of alternative fuels:
Install feed systems
Retrofit pre-calciner which enables 80% fuel replacement with alternative fuels
reduce dependency on coal
cost savings and also environmental advantages
implement municipal waste (RDF) feed systems
upgrade raw material preparation
Capex guidance

10
Expand product and service offering through materials and solutions
Product diversification
Vertical integration
Channel management
Grow cement volumes
Materials and solutions business strategy
Materials division
Lime Aggregates Readymix Ash
Material division

11
F2015
Volumes of readymix 419 000 m3
Revenue R438 million
EBITDA R31 million
EBITDA margin 7.1%
Volumes of cementsold to 3Q Mahuma Concrete
100 000 tons
PPC acquired 3Q Mahuma Concrete in July 2016
3Q Mahuma Concrete employs 280 staff across its plants
It operates 17 readymix plants and 113 readymix trucks
The company has branches in Limpopo, North West, Northern Cape, Mpumalanga and Mozambique
This acquisition complements PPC’s Pronto readymix business that only has a foot print in the Gauteng province
Acquisition – 3Q Mahuma Concrete
PPC Research

12
OPERATIONAL OVERVIEW

13
Group cement sales volumes up 7% for the first five months of F2017
6% volume growth recorded in the SA cement business supported by strong volume growth in the coastal regions
8% volume growth in the key international businesses due to ramping up of Rwanda
volumes in Rwanda have more than doubled at the expected EBITDA margin
Significant pressure on selling prices in the inland region, with declines of 5% recorded in the South African cement business
Overall margins under pressure despite good cost control and exchange rate gains
Continued pressure in the steel and alloys industry has weighed on the Lime division’s performance
The South African aggregates and readymix divisions have seen an improvement in performance
Finance costs up markedly due to:
• the commissioning of the CIMERWA plant
• liquidity facility costs
• increased funding costs
Operating update

14
SA volumes up 6% for the first five months of the financial year
Competitor activity in the market continued to put pressure on pricing as selling prices were down 5%
Weaker volumes experienced in both the Gauteng industrial and retail segments
High double digit volumes experienced in the Western Cape (>30% yoy)
Volume declines recorded in the inland region, particularly Mpumalanga and North West
PPC now producing P&L’s house brand in Limpopo - has contributed to improved sales (P&L is part of Cashbuild)
Projects being supplied: Table Bay Mall – (Complete March 2017)
Loeriesfontein Wind Farms
Cape Town International Convention Centre
Elandsfontein Phosphate Mine (West Coast)
Towani Mall in Polokwane
South African operating environment

15
-
50 000
100 000
150 000
200 000
250 000
300 000
350 000
400 000
450 000
Q1-12 Q2-12 Q3-12 Q4-12 Q1-13 Q2-13 Q3-13 Q4-13 Q1-14 Q2-14 Q3-14 Q4-14 Q1-15 Q2-15 Q3-15 Q4-15 Q1-16 Q2-16
Durban PE&EL Cape Town
Imports are down 47% year-on-year to the quarter ending June 2016
They declined by 79% in the Western Cape over the same period
Over the past 12 months, 60% of imports from Pakistan and balance from China
Shipping rates have been steadily increasing while the exchange rate continues to be a headwind for importers
0
200
400
600
800
1000
1200
1400
Baltic Dry Index
Calendar Quarters
Imported cement volumes by port of entry (tons)
South African operating environment

16
Zimbabwe
Local cement sales volumes down single digitsdue to:
increasing regional competition on the back of weakening domestic currencies
imports were growing in Zimbabwe however effective 1 October 2016 the authorities have introduced import tariffs of US$100 per ton of cement
local economy under pressure, exacerbated by the impact of the drought
reduction in remittances following SA Rand weakness
Increased pressure on pricing
• price reductions were implemented in certain nodes on 22.5 and 32.5 products (border strategy)
Engaging banking authorities on a daily basis to pay our import suppliers
Finalised negotiations of in-country payments for December debt service obligations to deal with liquidity constraints
Sales and marketing initiatives are focused on distribution channels and pricing
Projects underway (all externally funded):
• Harare International Airport refurbishments
• Gwai Shangani Dam
• Beitbridge to Chirundu road rehabilitation
Botswana
Volumes were down 3% from the previous year while pricing fell 10%
EBITDA has declined materially due to price impact for the first five months of the reporting period
Volumes rose 134% to 120 000 tons as steady ramp-up continued at market related pricing
Export cement volumes up 15% from previous year
An EBITDA margin of between 30% - 35% is being achieved
Share of market has increased to about 50%
Rwanda
Zimbabwe, Botswana and Rwanda

17
Lime
Burnt product volumes have declineddue to reduced supply into the steel andalloys industry
Milk of lime sales assisted to negate thereduction in prices and maintain afavourable customer mix
Good cost management is expected toreduce some of the negative impact onmargins
Aggregates and Readymix
Total aggregates volumes up in single digitsdespite a slowdown in the Botswana division
Aggregates EBITDA margin up due to highervolumes and solid cost performance
Readymix volumes down 1% as prices undersignificant pressure due to competitoractivity
Readymix EBITDA margin down due toreduced selling prices despite good costperformance
Lime, Aggregates and Readymix

18
PROJECTS UPDATE

19
Input cost (ex factory, including overheads)
Rwanda DRC Zimbabwe
Contribution to total cost of sales
Variable cost of sales 69% 61% 59%
Fixed cost of sales 31% 39% 41%
Key variable cost components as a % of total cost of sales
Thermal energy (note 1) 23% 31% 5%
Electricity (note 2) 16% 1% 10%
Gypsum (note 3) 8% 7% 1%
Packaging (note 4) 8% 7% 5%
Maintenance 4% 7% 7%
Clinker and limestone transport - - 18%
Other 10% 8% 13%
Key fixed cost components as a % of total cost of sales
Depreciation 13% 16% 14%
Overheads 11% 6% 10%
Staff cost (note 5) 7% 10% 17%
Fixed component of electricity (note2)
- 7% -
Note 1Thermal energy
RwandaCoal 50% (regional source), peat 40% (local source), charcoal 5% (local source)
DRC Coal, sourced from South Africa
ZimCoal, sourced locally. Significantly lower cost than Rwanda and DRC
Note 2Electricity
DRC structure different to Zimbabwe and Rwanda, with a higher fixed charge. The total steady state electricity cost per ton cement in Rwanda is higher, whereas the cost in the DRC is the lowest
Note 3Gypsum
Rwanda Sourced regionally
DRCSourced from Spain (Angolan sourcing being investigated at a significantly reduced cost)
ZimSourced locally. Significantly lower cost than Rwanda and DRC
Note 4Packaging
RwandaSourced regionally, will change from paper to woven polypropylene bags shortly with a significant cost benefit
DRC Sourced from South Africa and Saudi Arabia
Zim Sourced from South Africa
Note 5Staff costs
Zimbabwe cost of labour generally higher in comparison and also exacerbated by lower capacity utilisation
Anticipated input cost at steady state

20
Legend
PPC Barnet DRC
Kimpese
1mtpa
CILU (Heidelberg)
Lukala
450- 750ktpa 2017
CIMKO (Lucky)
Songololo
1mtpa 2018
Dangote
Madingou
1mtpa 2018
NACEM Diamond;
CIMAF Hinda:
Forspak
SONNACC
Total approx 2mpa
Nova Cimangola 1.8mta
CIF 3.6mtpa
Luanda
FCKS 1.4mtp
Cemenfort 1.4mtpa
Secil Labito 0.4mtpa
Democratic Republic of the Congo

21
Project financed on a limited recourse basis to PPC Ltd
Therefore, any funding shortfalls incurred prior to Project Financial Completion will be for the account of PPC Ltd (as First Sponsor)
Project Financial Completion occurs when certain working capital and debt ratios are met for four consecutive quarters (then project becomes fully ring-fenced)
Maintaining the debt and interest repayment schedule is key, however the full debt accelerates and becomes due only if the project is expropriated or nationalised before Project Financial Completion
Mitigation options include ensuring financial completion and insuring against political risks
Considering strategic options to reduce PPC risk exposure to the DRC
Project Costs
US$280 million project likely
to rise by 4%-6%
Start up Funding
Likely to be between US$20
million and US$30 million –
relates to VAT repayment &
settling of bank facilities for
trading losses
Ops Cash Flows
Project likely to generate
positive free cash flows before
funding repayments
Down from prior guidance (was up to US$ 50m)
Democratic Republic of the Congo

22
Transporters
Transporters(contracted
Fleet)
Distributors
Warehouse
Retailers
Retailers
Market
Market
Factory gate
Factory gate
Route to market strategy – various strategic options being considered
Democratic Republic of the Congo

23
PPC Zim new Harare mill
(700ktpa)
PPC Zim Bulawayo milling plant
(700ktpa)
PPC Zim Colleen Bawn clinker
plant (650ktpa)
LafargeHolcim integrated plant
(450ktpa) – imports 42.5 ex
Zambia
SinoCement integrated plant
(250ktpa)
Pacstar milling plant (100 ktpa)
(Upgrade to 250 ktpa in progress)
Legend
Zimbabwe

24
Final project cost is ~US$82 million (was US$85 million)
Project is 94% complete and hot commissioning has commenced
1800 tons of cement has been produced and conveyed to storage silos
Input costs
• managed to limit the impact of overhead costs by moving 67 employees from the Bulawayo factory to the Harare factory and only employing 30 new employees
• new mill is in the growth node (Harare) which is currently 40% of our Zimbabwean market
improved logistics costs as transportation of clinker by rail to Harare is cheaper than transportation of cement by road to Harare
limestone and gypsum are about 50% - 60% less expensive at Harare because they are sourced close to the factory
significant savings on delivery of final product to customers in Harare and surrounding areas
New 700 000 tpa millNew mill will improve Zimbabwe’s margin by 3%-5%
Zimbabwe

25
Legend
Dangote
1.9mtpa cement
105km to Addis
Ababa
Habesha
1.1mtpa cement
35 km to Addis
Ababa
Mugher Cement
1.9mtpa cement
110km to Addis
Ababa
Messebo
1.9 mtpa cement
800km to Addis
Ababa
National Cement
1.2mtpa cement
520km to Addis Ababa
Derba Midroc
1.9mtpa cement
70km to Addis Ababa
Addis Ababa
Ethiopia

26
New 1.4 mtpa plant
The US$170 million to US$180 million, 1.4 million tpa plant is scheduled for commissioning in the second calendar quarter of 2017
As at 30 June 2016, the Habesha plant was 74% complete
The main plant power agreement is in place with the Ethiopian power authorities and the contract for supply and construction of a 14km 132KV transmission line has been awarded
Both PPC and IDC have followed their rights in the first capital raise, with PPC investing a further US$5,1 million in March 2016
PPC’s shareholding has risen to 35% because some shareholders did not follow their rights
PPC is acquiring unallocated rights offer shares
Route to market strategy has been developed (collect, delivered and distributors) and export opportunities are being explored
Cement to be sold in bulk, bags and, in future, readymix
PPC is currently not consolidating the Habesha business
Ethiopia

27New 1 mtpa kiln line
Work on the new approximately ~R1.7 billion, 1mtpa clinker production line (SK9) at PPC Slurry is on schedule
Tower crane erection and load tests are completed, preheater civil works are completed and on site, manufacturing is about 31% complete
While issuing work permits to the EPC contractor’s workforce has been delayed for 3 months, as an interim plan to avoid delaying implementation, the contractor has partnered with local contractors to begin the main earthworks
The project is on schedule for commissioning and ramp-up in 2018
PPC has received section 12(I) allowance for the project, R350 million – promulgated in the government gazette
Slurry Kiln (SK9) upgrade project

28
Questions

29
This document including, without limitation, those statements concerning the demandoutlook, PPC’s expansion projects and its capital resources and expenditure, contain certainforward-looking statements and views. By their nature, forward-looking statements involverisk and uncertainty and although PPC believes that the expectations reflected in suchforward-looking statements are reasonable, no assurance can be given that such expectationswill prove to be correct. Accordingly, results could differ materially from those set out in theforward-looking statements as a result of, among other factors, changes in economic andmarket conditions, success of business and operating initiatives, changes in the regulatoryenvironment, other government action and business and operational risk management.
Whilst PPC takes reasonable care to ensure the accuracy of the information presented, PPCaccepts no responsibility for any damages, be they consequential, indirect, special orincidental, whether foreseeable or unforeseeable, based on claims arising out ofmisrepresentation or negligence arising in connection with a forward-looking statement. Thisdocument is not intended to contain any profit forecasts or profit estimates, and theinformation published in this document is unaudited.
Disclaimer

30
Azola Lowan Investor Relations
Vuyo Nombila Investor Relations
Tel. +27 11 386 9000www.ppc.co.za
Investor contacts

31
Appendix

32
SOUTH AFRICA
BOTSWANA
ZIMBABWE
ZAMBIAMOZAMBIQUE
DEMOCRATIC REPUBLIC OF THE CONGO
ETHIOPIA
RWANDA
BURUNDI
600 000 tpa Limestone reserves 7 Mt;
13 years Project cost: US$165
million Commissioned August
2015 51% subsidiary of PPC Ltd
ETHIOPIA
RWANDA
1.4mtpa Limestone reserves 27
Mt; 25 years Project cost: US$170 –
US$180 million Commissioning second
quarter of CY2017 35% associate of PPC Ltd
SOUTH AFRICA
BOTSWANA
ZIMBABWE
DEMOCRATIC REPUBLIC OF THE CONGO
7mtpa Limestone reserves 759 Mt; 240
years 7 cement plants Aggregates quarries and Lime
factory Subsidiaries: Pronto Ready-mix,
Ulula Ash and Safika Cement Recently acquired 3Q Mahuma
Concrete
1mtpa Limestone reserves 76 Mt; 54
years Project cost: US$280 million Commissioning end CY2016 69% subsidiary of PPC Ltd
1.4mtpa (post new Harare mill) Limestone reserves 43 Mt; 41
years Constructing a 700 000tpa mill
for US$82 million (was US$85m) Commissioning end of CY2016 70% subsidiary of PPC Ltd
Milling operation Kgale quarries and Aggregates
Botswana 100% subsidiary of PPC Ltd
373 years of limestone reserves
ZIMBABWE
BOTSWANA
SOUTH AFRICA
ZAMBIA
DEMOCRATIC REPUBLIC OF THE CONGO
RWANDA
ETHIOPIA
BURUNDI
MOZAMBIQUE
Overview of PPC operations

33
Capacity build up 2015 – 2018 (mt)
~ 50% increase in capacity by 2018
8,6
1,0 0,7
1,4 11,7
1,0 12,7
0,0
2,0
4,0
6,0
8,0
10,0
12,0
14,0
Capacity 2015
(including Rwanda
capacity)
DRC Zimbabwe Ethiopia Capacity 2017 SK9 Capacity 2018
PPC capacity

34
DRC ($280m)
Debt: $168m facility with $123m drawn
Equity $112m: Fully subscribed
ETHIOPIA (~$175m)
Target debt $114m (65%)
Target equity $61m (35%)
Two step capital raise & debt funding
underway
CENTRE
Aggre
gate
Lim
e
Pro
nto
Safika
Bots
wana
In production April / May ‘17
In production, by end of calendar 2016
1st year of production
In production Jan / Feb ‘17
ZIMBABWE ($85m)
Debt: $75m facility with $43m drawn
Equity $10m: Internally funded
RWANDA ($165m)
Debt: $88m facility fully drawn down
Equity $77m: Fully subscribed
PPC receives
dividends &
management &
technical fees
Rwanda has cash for
working capital
commissioning
Pays
management &
technical fees
PPC may
increase equity
stake
Pays management &
technical fees
Debt : R5,9bn EBITDA : R1,8bn
Ring-fenced debt
Debt ring-fenced post
Financial CompletionPossible start
up capital
requirement
DEBT EBITDA RATIO
PPC
Centre
R5,9bn R1,8bn 3.3x
Covenant
Group
R6,5bn R2,2bn 2,9x
Group R9,6bn R2,4bn 4,0x
PPC group debt view (as at 30 June 2016)
35
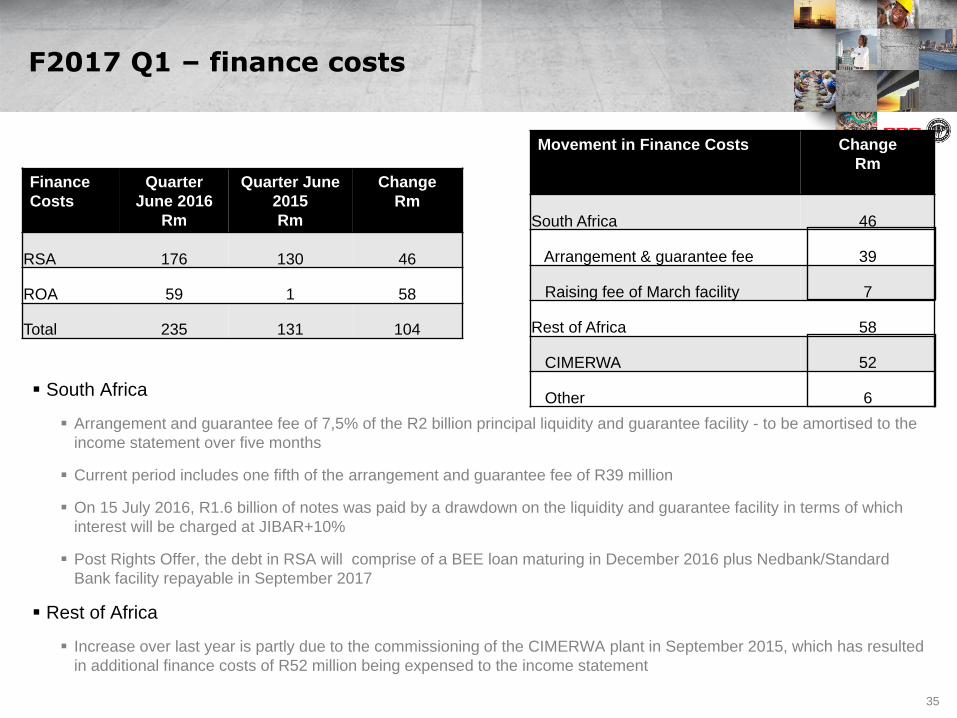
South Africa
Arrangement and guarantee fee of 7,5% of the R2 billion principal liquidity and guarantee facility - to be amortised to the
income statement over five months
Current period includes one fifth of the arrangement and guarantee fee of R39 million
On 15 July 2016, R1.6 billion of notes was paid by a drawdown on the liquidity and guarantee facility in terms of which
interest will be charged at JIBAR+10%
Post Rights Offer, the debt in RSA will comprise of a BEE loan maturing in December 2016 plus Nedbank/Standard
Bank facility repayable in September 2017
Rest of Africa
Increase over last year is partly due to the commissioning of the CIMERWA plant in September 2015, which has resulted
in additional finance costs of R52 million being expensed to the income statement
Finance
Costs
Quarter
June 2016
Rm
Quarter June
2015
Rm
Change
Rm
RSA 176 130 46
ROA 59 1 58
Total 235 131 104
Movement in Finance Costs Change
Rm
South Africa 46
Arrangement & guarantee fee 39
Raising fee of March facility 7
Rest of Africa 58
CIMERWA 52
Other 6
F2017 Q1 – finance costs

36
Operating architecture of the company has been fundamentally changed post-January 2015
Monthly exco meetings supported by four sub-exco meetings
Matrix structure breaks down the independent silo approach
Improved transparency, reporting and performance management
Quarterly business reviews to assess operational health of each business
A three-tier risk system introduced focusing on the operations, business functions and group
Robust strategic and business planning processes introduced
New board committee – Investment committee constituted and operational
Key structural changes have already been made to align with the new operating architecture
Current crisis would not recur as:
A multidisciplinary team would be involved in all work streams
Final product would have been signed off at Exco after risks and sensitivities, as well as unintended consequences, had been noted
Once identified, the risks would be tracked, monitored and fully understood
Post stabilisation, further changes likely to be made to strengthen the company and ensure non-recurrence of similar events
Increased board vigilance
Changes, structures, processes and controls

37
• Appointed CEO of PPC in December 2014
• Darryll has extensive experience in the mining industry and served as a CEO of Trafigura Mining Group and Anvil Mining, as well as COO of Metorex Group
• Darryll has a broad range of skills in corporate management, fund management, financial analysis, mining and engineering.
• Darryll’s first hand knowledge of various countries in Africa and emerging markets as well as deep relationships built over the years are expected to add value
• BSc (Civil), BCom, MBA, CFA
Darryll Castle (47)CEO
Tryphosa Ramano (45)CFO
• Appointed CFO of PPC in 2011
• Tryphosa was CEO of WIP International (a subsidiary of WIPHOLD focused on African expansion)
• Tryphosa also served as CFO of SAA, and prior to that, she was requested to join National Treasury, where she set up a business unit with financial oversight of state-owned entities
• CA(SA)
• Johan is a professional engineer who joined PPC in 1989
• He has served PPC in a number of key positions including as an executive in cement operations and lime
• He was previously employed by the Department of Water Affairs, progressing to regional engineer
• BEng (University of Stellenbosch), EDP (Wits Business School)
• Govt Certificate of Competence – Mines & Works, Govt Certificate of Competence - Factories
• Njombo is a chemical engineer who joined PPC in 1990
• He joined PPC Zimbabwe from May 2013 in the position of Managing Director
• He previously held the position of executive group services where he headed the Technical, Projects, Procurement and Supply Chain divisions
• BSc (Chemical) and MBA degree from the University of Stellenbosch
Johan Claassen (56)MD – PPC Cement RSA
Njombo Lekula (48)MD – International
Rob Rein (40) Executive: Sales and
Marketing
• Rob joined PPC in February 2015 on secondment from Safika Cement
• He joined IDM’s sales department in 1998 and is now a Director and shareholder
• BCom (Accounting)
Experienced management team

38
l
• Hardie is a professional engineer who joined PPC in 1996
• He has served PPC in a number of key positions including general manager, group health and safety specialist and also as an executive in operations and technical
• BEng (Mech), Master of Business Leadership (UNISA), Govt Certificate of Competence – Mines & Works, Govt Certificate of Competence - Factories
Hardie De Beer (51)Executive: Technical
Neil Caldwell (50)Executive: Commercial
• Appointed Commercial Executive in February 2016
• Neil has worked at various companies such as Anvil Mining as a VP on Development and Sustainability
• Previously he was the General Manager for Development at Trafigura Mining
• BSc(Mechanical), MBA, B.Proc
Ndivhu Nepfumbada (45)Group Human Resource
Executive
• Appointed Group Human Resource executive in January 2016
• Ndivhu has a broad range of experience as country human resource manager at Shell and the Head of Organizational Transformation at Nedbank
• BSocSc Psychology & Sociology (University of Natal) and PGDip Human Resource Management (Wits University Business School)
Experienced management team