rival iq social index_benchmarking high-end department stores_q1 2015
TRANSCRIPT
Retail: High-end Department Stores
Q1 2015
The Rival Results Index (RRI)

What is the Rival Results Index?
• The RRI is a comprehensive analysis, scoring and ranking of a
group of organizations in a specific industry on social media.
• The RRI is designed to provide a competitive and data-driven
view of a market across key social media measurements,
including presence, audience, activity, engagement, potential
reach and top social content.
• The RRI program, related processes and scoring is managed
by Rival IQ, a digital marketing analytics firm based in the
United States. All data for the RRI is based on the Rival IQ
digital marketing analytics software.
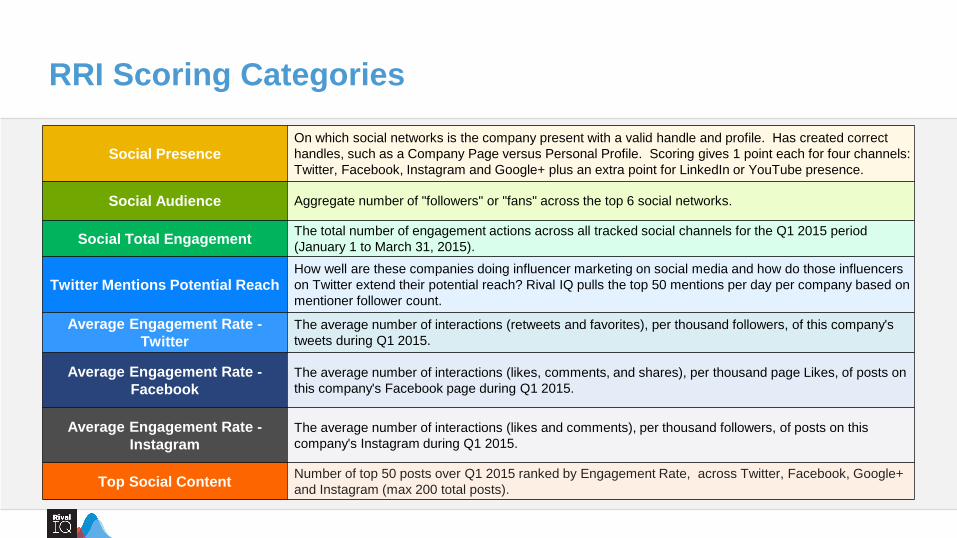
RRI Scoring Categories
Social PresenceOn which social networks is the company present with a valid handle and profile. Has created correct
handles, such as a Company Page versus Personal Profile. Scoring gives 1 point each for four channels:
Twitter, Facebook, Instagram and Google+ plus an extra point for LinkedIn or YouTube presence.
Social Audience Aggregate number of "followers" or "fans" across the top 6 social networks.
Social Total Engagement The total number of engagement actions across all tracked social channels for the Q1 2015 period
(January 1 to March 31, 2015).
Twitter Mentions Potential ReachHow well are these companies doing influencer marketing on social media and how do those influencers
on Twitter extend their potential reach? Rival IQ pulls the top 50 mentions per day per company based on
mentioner follower count.
Average Engagement Rate -
The average number of interactions (retweets and favorites), per thousand followers, of this company's
tweets during Q1 2015.
Average Engagement Rate -
The average number of interactions (likes, comments, and shares), per thousand page Likes, of posts on
this company's Facebook page during Q1 2015.
Average Engagement Rate -
The average number of interactions (likes and comments), per thousand followers, of posts on this
company's Instagram during Q1 2015.
Top Social Content Number of top 50 posts over Q1 2015 ranked by Engagement Rate, across Twitter, Facebook, Google+
and Instagram (max 200 total posts).

RRI Scoring System: Max of 40 Points Possible
Total Score Social IQ Classification Detail
33 to 40 Superior Social IQ
The Rival to beat (and emulate). Follows best practices in social media. Presence across at least
four major social networks, with strong audience, activity and engagement. Consistent top content
across top two channels for this Landscape, Twitter and Facebook, and extending reach and
engagement to other channels.
25 to 32 High Average Social IQ
Ahead of the pack. You’re doing great, and headed in the right direction. You adhere to most best
practices. Presence across at least three major social networks. Strong audience, activity and
engagement, but not always consistent. A bit more work (and potentially learning from the higher IQ
players, could lead to a superior IQ).
17 to 24 Average Social IQ
Middle of the road social player. Present on social networks but not following best practices or
optimizing that presence. Inconsistent activity and engagement. You need to increase all areas of
social media activity. Focus on a strong, consistent presence with logos, branding and positioning
aligning. Build your audience with more loyal fans and learn what content is more engaging.
Emulate the higher IQ players in your market.
9 to 16 Below Average IQ
You are there but not really. You have some handles on some networks, but your presence is
inconsistent at best and your activity is lackluster. You need to make a decision of go or no go. Are
you in this game or do you want to stay on the sidelines? You need to basically start over with your
strategy. Establish better presences on top networks, build your audience through organic and paid
mechanisms, start increasing your activity with engaging content for your audience, etc. If you don't
have someone dedicated to social media on your team, hire them.
8 and lower Extremely Low Social IQYou barely have a pulse on the social media landscape, and your competition does not see you as
a rival. Get some training, hire staff or find outside resources to help you.

The Department Store RRI
For each of these organizations, the RRI analyzed the
social handles relevant to this brand only. Parent
companies or associated organizations were not included.

Qualifications for this RRI
• High-end Department Store: Must have at least one physical retail location
and be considered a top department store selling high-end fashion.
• Social Network Presence: Minimum presence on Twitter, Facebook,
Instagram and Google+.
• Minimum Social Audience: 500,000
• Social Activity Level: At least 5 social postings per day on the main social
networks being tracked.
To be included in this RRI evaluation, the retail organization had to
meet the following qualifications:
Expert source: Validation of high-end department stores was
found in both International Business Times and Forbes.

Social Media Networks for the RRI
For this business-to-consumer (B2C) landscape of retail high-end
department stores, we focused on the following social networks:
• Google+
• YouTube and LinkedIn were included for cross-channel evaluations

Top Social Media Networks for B2C
3%
15%
41%
42%
48%
57%
60%
83%
93%
97%
85%
59%
58%
52%
43%
40%
17%
7%
Snapchat
Tumblr
Google+
YouTube
Important to Critical Somewhat or Not Important
Source: Social Media Trends 2015 Research, Rival IQ

Market Analysis
A lot of social media best practices and “standards” are being missed by these huge
department stores that spend millions on advertising. They are missing the viral value of
social media.
No eCommerce connection between their Instagram or Facebook pages and online
stores. Big gap! They are only posting content, and not leveraging product images or
content with potential purchases.
Most brands do well on only one or two channels but are not consistently focused
across channels or leveraging content or messages across channels. They should all be
rocking Twitter, Instagram and Facebook – at least.
No pattern or consistency in how much or when they post on different channels.
Higher focus on building audience and activity (posting) rather than engagement.

Biggest Surprises
Really low engagement on Twitter and Facebook. On Twitter, part of this is the lack of using images. Stores are posting frequently but not focused on engagement with their social audience.
Hashtag abuse or lack of use overall. This is a huge issue on all channels, including Instagram, which is an extremely hashtag-centric network.
Lack of social profile optimization or consistency. There are minimal to no product links, hashtags or branding consistency across channels. Even for sister companies, there is no cross-brand consistency.
No connection or link to sub-brands or partner brands. For example, stores are not using product brand Twitter handles to tie the two brands together. This is true even for Nordstrom, who scored the highest Social IQ. In doing so, they are missing the influence and extended reach of these other brands.

RESULTS: RRI High-end Department Stores
Nordstrom is the one to watch and beat! The only one with Superior Social IQ.
40 Maximum Potential Score
Total Score Social IQ
Nordstrom 35 Superior Social IQ
Macy's 30 High Average Social IQ
Harrods 29 High Average Social IQ
Neiman Marcus 25 High Average Social IQ
Saks Fifth Avenue 24 Average Social IQ
Bergdorf Goodman 23 Average Social IQ
Bloomingdale's 23 Average Social IQ
Barneys 22 Average Social IQ
Lord & Taylor 22 Average Social IQ
Henri Bendel 21 Average Social IQ
LUISAVIAROMA 19 Average Social IQ
Dillard's 16 Below Average Social IQ

DETAILED SCORES: RRI High-end Department Stores
Social
Presence
Social
Audience
Social Total
Engagement
Twitter Mentions
Potential Reach
Average
Engagement
Rate - Twitter
Average
Engagement Rate
Average
Engagement Rate
Top Social
Content TOTAL
Potential Max Score 5 5 5 5 5 5 5 5 40
Barneys 5 4 4 4 1 1 2 1 22 Average Social IQ
Bergdorf Goodman 5 4 4 2 1 2 3 2 23 Average Social IQ
Bloomingdale's 5 5 2 4 1 2 3 1 23 Average Social IQ
Dillard's 5 1 1 1 1 1 3 3 16 Below Average Social IQ
Harrods 5 2 2 3 2 5 5 5 29 High Average Social IQ
Henri Bendel 5 1 1 1 2 2 4 5 21 Average Social IQ
Lord & Taylor 5 1 1 2 3 2 3 5 22 Average Social IQ
LUISAVIAROMA 5 3 2 2 1 3 2 1 19 Average Social IQ
Macy's 5 5 5 5 1 3 3 3 30 High Average Social IQ
Neiman Marcus 5 4 4 4 1 2 2 3 25 Average Social IQ
Nordstrom 5 5 5 5 1 5 4 5 35 Superior Social IQ
Saks Fifth Avenue 5 4 3 5 1 1 2 3 24 High Average Social IQ

Detailed Analysis

Social Presence

Social Presence: RRI Department Stores
At first glance, it
appears these
companies are all
“everywhere” with
every store having
branded profiles on all
six tracked social
networks.

Social Presence Scores
Social Presence
Twitter Facebook Instagram Google+LinkedIn or
YouTube
Potential Score 1 1 1 1 1
Barneys 1 1 1 1 1
Bergdorf Goodman 1 1 1 1 1
Bloomingdale's 1 1 1 1 1
Dillard's 1 1 1 1 1
Harrods 1 1 1 1 1
Henri Bendel 1 1 1 1 1
Lord & Taylor 1 1 1 1 1
LUISAVIAROMA 1 1 1 1 1
Macy's 1 1 1 1 1
Neiman Marcus 1 1 1 1 1
Nordstrom 1 1 1 1 1
Saks Fifth Avenue 1 1 1 1 1
On which social networks is the
company present with a valid
handle and profile. Company has
created correct handles, such as a
Company Page versus Personal
Profile. Scoring evaluates top 4
channels: Twitter, Facebook,
Instagram and Google+, plus gives
an extra point for YouTube or
LinkedIn presence.

Social Activity
While we did not give a
score for social activity,
it is interesting to note
that the leader,
Nordstrom, is also the
most active (by a lot)
across multiple social
networks on activity,
especially Twitter.

Social Audience

Social Audience: RRI Department Stores
Macy’s has the largest
aggregate social
audience by several
million fans, especially
on Facebook, illustrating
how many of these
stores are putting heavy
focus on one channel.

Social Audience Scores
Aggregate number of
"followers" or "fans" across the
top 6 social networks.
Social Audience
Detail < 1 Million 1M - 2M 2.01M - 3M 3.01M - 4M > 4 Million
Potential Score 1 2 3 4 5
Barneys 4
Bergdorf Goodman 4
Bloomingdale's 5
Dillard's 1
Harrods 2
Henri Bendel 1
Lord & Taylor 1
LUISAVIAROMA 3
Macy's 5
Neiman Marcus 4
Nordstrom 5
Saks Fifth Avenue 4

Social Engagement Total

Social Engagement: RRI Department Stores
Nordstrom is obtaining
by far the greatest
engagement, especially
on Instagram and
Facebook. Instagram is
clearly an engagement
focus for most of these
department stores.

Social Engagement Scores
The total number of
engagement actions across
the top 6 tracked social
channels for the Q1 period
(January 1 – March 31, 2015).
Social Total Engagement
< 400k 401k to 800k 801k to 1.2M 1.21M to 1.6M > 1.61M
Potential Score 1 2 3 4 5
Barneys 4
Bergdorf Goodman 4
Bloomingdale's 2
Dillard's 1
Harrods 2
Henri Bendel 1
Lord & Taylor 1
LUISAVIAROMA 2
Macy's 5
Neiman Marcus 4
Nordstrom 5
Saks Fifth Avenue 3

Social Engagement Rate
By Social Media Channel

Social Engagement Rate: TwitterMany of these stores are
heavy tweeters each day, but
many of those tweets are not
getting much engagement.
Activity without engagement is
wasted social effort.

Twitter Engagement Rate Scores
The average number of
interactions (retweets and
favorites), per thousand
followers, of this company's
tweets during Q1 2015.
Note that best practices for
Engagement Rate on Twitter
is at least .50. Leading Twitter
social companies score 1.0 or
more on Twitter Engagement
Rate.
Average Engagement Rate - Twitter
Detail < .10 .10 to .25 .26 to .35 .36 to .50 > .50
Potential Score 1 2 3 4 5
Barneys 1
Bergdorf
Goodman1
Bloomingdale's 1
Dillard's 1
Harrods 2
Henri Bendel 2
Lord & Taylor 3
LUISAVIAROMA 1
Macy's 1
Neiman Marcus 1
Nordstrom 1
Saks Fifth
Avenue1

Social Engagement Rate: FacebookHarrods and Nordstrom are
posting to Facebook around
once per day, which is
standard practice, and they
are clearly posting content
that draws strong engagement
from their “Like” base.
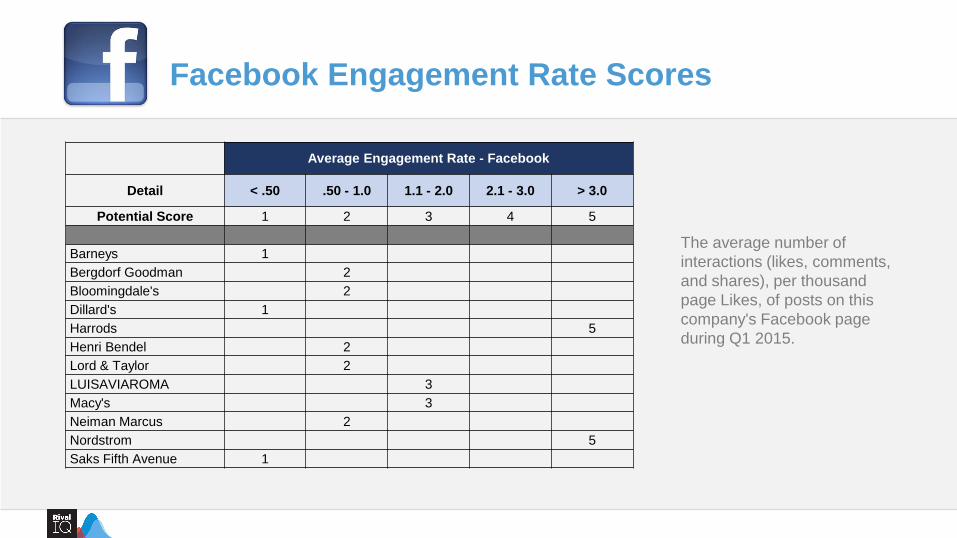
Facebook Engagement Rate Scores
The average number of
interactions (likes, comments,
and shares), per thousand
page Likes, of posts on this
company's Facebook page
during Q1 2015.
Average Engagement Rate - Facebook
Detail < .50 .50 - 1.0 1.1 - 2.0 2.1 - 3.0 > 3.0
Potential Score 1 2 3 4 5
Barneys 1
Bergdorf Goodman 2
Bloomingdale's 2
Dillard's 1
Harrods 5
Henri Bendel 2
Lord & Taylor 2
LUISAVIAROMA 3
Macy's 3
Neiman Marcus 2
Nordstrom 5
Saks Fifth Avenue 1

Social Engagement Rate: Instagram
Barneys may post the most to
Instagram, but Harrods is
ROCKING engagement with its
fan base.

Instagram Engagement Rate Scores
The average number of
interactions (likes and
comments), per thousand
followers, of posts on this
company's Instagram during
Q1 2015.
Average Engagement Rate - Instagram
< 5 5 to 10 10.1 to 15 15.1 to 20 > 20
Potential Score 1 2 3 4 5
Barneys 2
Bergdorf Goodman 3
Bloomingdale's 3
Dillard's 3
Harrods 5
Henri Bendel 4
Lord & Taylor 3
LUISAVIAROMA 2
Macy's 3
Neiman Marcus 2
Nordstrom 4
Saks Fifth Avenue 2

Twitter Mentions Potential Reach

Twitter Mentioners & Influencer Reach
Macy’s brought in the
most Mentioners and the
greatest Potential Reach
of over 150 million
Twitter followers.
Nordstrom was a close
second.

Twitter Mentioners & Influencer Reach Scores
How well are these
companies doing influencer
marketing on social media
and how do those influencers
on Twitter extend their
potential reach? Rival IQ pulls
the top 50 mentions per day
per company based on
mentioner follower count.
Twitter Mentions Potential Reach
< 10M 10M to 35M 36M to 60M 61M to 85M > 85M
Potential Score 1 2 3 4 5
Barneys 4
Bergdorf Goodman 2
Bloomingdale's 4
Dillard's 1
Harrods 3
Henri Bendel 1
Lord & Taylor 2
LUISAVIAROMA 2
Macy's 5
Neiman Marcus 4
Nordstrom 5
Saks Fifth Avenue 5

Top Social Content

Top Cross-Channel Social Content Scores
Number of top 50 posts over
Q1 2015 ranked by
Engagement Rate across
Twitter, Facebook, Instagram
and Google+ (maximum of
200 total posts)
Top Social Content
< 3 3 to 5 6 to 9 10 to 14 15+
Potential Score 1 2 3 4 5
Barneys 1
Bergdorf Goodman 2
Bloomingdale's 1
Dillard's 3
Harrods 5
Henri Bendel 5
Lord & Taylor 5
LUISAVIAROMA 1
Macy's 3
Neiman Marcus 3
Nordstrom 5
Saks Fifth Avenue 3

Top Social Content Detailed Scores
Top Social Content
Twitter Facebook Instagram Google+ Total
Barneys 0 0 0 0 0
Bergdorf Goodman 1 1 1 0 3
Bloomingdale's 1 1 0 0 2
Dillard's 0 0 0 7 7
Harrods 0 12 26 1 39
Henri Bendel 5 0 3 42 50
Lord & Taylor 13 4 10 0 27
LUISAVIAROMA 0 0 0 0 0
Macy's 8 1 0 0 9
Neiman Marcus 3 6 0 0 9
Nordstrom 15 23 9 0 47
Saks Fifth Avenue 4 2 1 0 7
Top 50 Content 50 50 50 50

Top Social Content: Twitter
Top Twitter content
based on Engagement
Rate - the average
number of Favorites
and Retweets per 1,000
followers of each
company’s tweets
during Q1 2015.
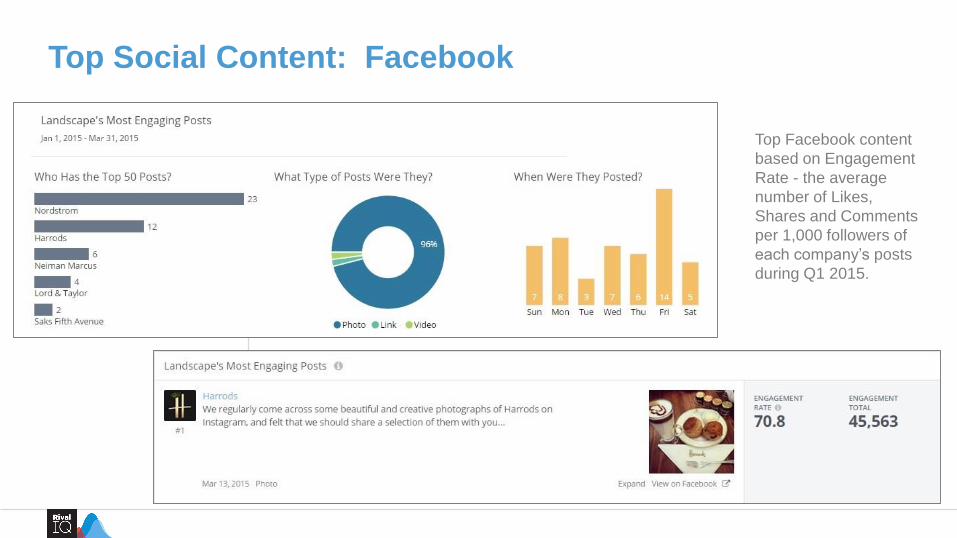
Top Social Content: Facebook
Top Facebook content
based on Engagement
Rate - the average
number of Likes,
Shares and Comments
per 1,000 followers of
each company’s posts
during Q1 2015.

Top Social Content: Instagram
Top Instagram content
based on Engagement
Rate - the average
number of Likes and
Comments per 1,000
followers of each
company’s Instagram
posts during Q1 2015.

Top Social Content: Google+
Top Twitter content
based on Engagement
Rate - the average
number of +1’s, Shares
and Comments per
1,000 followers of each
company’s Google+
posts during Q1 2015.

Thank You