risk preferences and contracting in the u.s. hog...
TRANSCRIPT
Risk Preferences and ContractingIn the U.S. Hog Industry
C. Scott Johnson and Kenneth A. Foster*
Abstrac[
Much of the increaseuse of vertical coordinationin [he U.S. swine industry has takenplace through contract production. While the incidence of contracting is much higher in non-traditional hog production areas, a growing number of Midwestern producers are being faced withcontract options. A variety of contractual arrangements are available through feed companies,integrators, genetics i%-rns,and packers. However, little is known about the profitability and riskcharacteristics of these alternatives. This research suggests that risk neutral producers in theMidwest would prefer independent production, and risk averse producers would prefer to chooseamong the various types of coordination mmngements.
Key Words: Risk, Stochastic Dominance, contract production, swine
Pork producers have little experience ordata upon which to base sound decisions about thetype of production and marketing arrangement theychoose, In the past, the choice wm simply toproduce hogs independently and market on a hveweight basis to the highest bidder. Pork producersin the United States are now faced with decisionsregarding market coordination methods that differfrom traditional independent production, Themajority of these akernatives can be broadlycategorized as contractual arrangements, A surveyof producers and contractors estimated that around10 percent of the nation’s hogs were producedunder contract in 1989 (Rhodes).
Market coordination has the potential toincrease domestic pork demand by matchingquantity and quality produced with consumer wants,Exports of pork may also be enhanced by incre~sedcoordination, According to Uedtt, only 10 percentof Japan’s pork imports come from the U.S. The
lack of consistent quantities of high quality porkproducts at forward prices was cited as the majorimpediment to the growth of Japanese pork importsfrom the U.S.’ In addition, a survey of Japaneseconsumers by Sapp and Knipe revealed concernabout the quality of U.S. pork; only 14 percent ofthe respondents rated American ham and sausagehigh in quality, With appropriate contractspecifications, processors could improve their abilityto provide the volume of forward priced highquality products that the Japanese markets desire.
Williamson (197 1, 1979) has suggested thattransactions costs and market failures will ultimatelylead to integration of successive stages ofproduction. At issue is what types(s) ofcoordination armngernents will be adopted byproducers. Rhodes found that the combination ofless market risk and more steady income was themost frequent reason(s) producers entered intocontracts, Wilson and Eidman estimated that about
*C. Scott Johnson is farm manager with Capital Agricultural Property Services, Inc. Champaign, IL. and Kenneth A.Foster is assistant professor in the Department of Agricultural Economics. Purdue University, West Lafayette, N.
The authors acknowledge the helpfitl comments of JohtI Kadlec, Chris Hurt and an anonymous reviewer. Funding forthis research was provided by the Crossroads 1990 Project through the purdue Agricultural Experiment Station. PurdueAgricultural Experiment Station Journal Paper Number 13935.
J Agr and Applied Econ 26 (2), December. 1994:393-405Copyright 1993 Southern Agricultural Economics Association
394 Johnson and Foster: Risk Prejetwces wd Contracting i}z (he U S Hog Indu.srty
78 percent of Minnesota swine producers in theirsample could be categorized as risk neutral tomoderately risk averse. The objective of this paperis to examine alternative contracts of different types,The paper accomplishes the following: 1) a briefoverview of contracting in U.S. livestock industries,2) estimate the first two moments of thedistributions of net returns for Midwestern hogproducers under different production and workingarrangements, and 3) use stochastic dominance withrespect to a fwction to rank the alternatives overranges of risk aversion.
Contract hog production in the UnitedStates initially showed rapid growth in the non-traditional hog producing areas of the southeast andparts of the south and southwest where large scalebroiler contracting had previously occurred.Contracting became more prevalent in the Midwestas the effects of the farm financial crisis of the early1980’s were felt by producers. Low profits andfinancial stress resulted in liquidation of swineherds, leaving behind empty facilities, Later,producers were reluctant or r.mble to invest thecapital necessary to re-establish their herd becauseof the high level of risk and investment required.
Many of the businesses initiating contractactivity in the corn belt were local feed dealershipsseeking to secure their feed volume, These firmscontracted the use of idle facilities and labor at lowcost, More recently, some hog producers in thisregion have begun building new facilitiesexclusively for contmct production, In addition,hog finishing contracts have provided a mechanismfor genetics firms to add value to barrows andnonselected gilts from rather large multiplier herds,
Concerns about producer autonomy and thepossibdity that contractors may seek to extractappropriable qumi rents from growers have led toproposed legislative restrictions m several states,Iowa was the first state to adopt anti-verticalintegration legislation with respect to hvcstockpacking firms. This legislation was amended in1988 to prohibit contracting by packers.
According to Hamilton and Andrews, thefollowing eight states have enacted anti-corporWefarming legislation: Iowa, Kansas, Minnesota,Nebraska, North Dakota, Oklahoma, South Dakota,and Wisconsin. They also point out that Iowa,
Kansas, and Minnesota have adopted some form oflegislation regulating production contracts inagriculture. in addition, Florida and Indiana haveconsidered legislation which would regulatecontracting.
Seveml factors determine the type ofproduction and marketing scheme that will beadopted/sustained by hog producers. The primarydeterminants include profivdbility, variability ofprofits, risk prcfcrencc, capital requirements, cashflow, equity building potential, access to technology,and any pre-existing prcfcrcnces concerning specifictypes of coordination alternatives.
The Rhodes survey revealed that 32 percentof contracting producers entered contracts to reducerisk and/or stabilize income, Zering and 13ealsexamined the financial performance of one type offinishing contract and one type of farrow-to-feederpig contract using North Carolina data. Effects onincome of such factors as marginal changes inmarket hog price, feeder pig price, and feedconversion variables, were noted. Kliebenstein andHillburn examined three Iowa finishing contractsand three Parrow-to-feeder pig contracts undervarious non-stochastic efficiency levels.
This paper exammcs the profitability of sixcoordirudtionalternatives currently used for finishingenterprises in the Midwest. They consist of fivedifferent types of contracts and independentproduction. Profitability is calculated by applyingcontract provisions and payments to a set of farmswith finishing enterprises. Generalized StochasticDorninancc ((lSD) is used to rank the sixalternatives under a variety of risk preferences. Therisk intervals examined were delineated followingthe identification of Brcakcvcn Risk AversionCoefficients (McCarl), The mnking of alternativeswas examined within a geneml classification of riskattitudes, dmwing on the work by Wilson andEidman, who mnked risk from ntmtrd to stronglyaverse,
Contracts, Franchises, and IndependentProducers
The types of coordination armngementsobserved in the U.S. swine industry span the fullspectrum from vertical integration to spot markets.The resource-providing contract generates the most
J Agr, and Applied Econ , Decenfber, 1994 395
intense controversy in the debate about therelationship betweens wine contractors and growers,Under the terms of a resource-providing finishingcontract, for example, the contractor usuallyprovides feeder pigs, feed, veterinary care,managerial assistance and all marketing functions.The grower provides buildings, equipment, utilitiesand labor, Growers are paid a fee per head, plusgraduated bonuses for feed conversion efficiencyand minimizing death loss,
Why do contracts of this form appear?Schrader’s 1986 article, which noted the similarityof swine production contracts and franchises,provides a starting point for the explanation, Tounderstand the significance of this observation, it isuseful to consider Ronald Cease’s pioneering paper,“The Nature of the Firm,” in which hc attempts toexplain the existence of firms in the economy. Whydo some economic actors combine themselves intofirms, rather than exchanging their goods andservices in the open market? Cease argues thatmarket transactions between independent units arecostly, and that the integrated firm can performrepetitive transactions at lower costs. To extend theargument, the franchise contract falls somewherebetween the two extremes of the open market andthe vertically integrated firm, and may be viewed asa hybrid between the firm and the market. Rubinargues that the franchiser will generally performfunctions with costs that fall for a substantial levelof output, while the franchisee will performfunctions whose average costs generally turn uprelatively soon. Just as franchisees are required topay a substantial fee to participate in the system,hog growers are required to invest in substantialspecialized facilities which have few or perhapseven no alternative uses,
To a Iargc extent, franchising is usedinstead of vertical integration when the franchisee isphysically removed from the franchiser so thatmonitoring the farmer’s behavior and performanceis difficult. Control mechanisms can be devised thatgive the franchisee an incentive to avoid shirkingand excessive consumption of leisure, If suchmechanisms can bc devised, it is possible that boththe franchisee and the franchiser will gain from anenlargement of the total net returns that they share.
The study of such control mechanisms isthe object of the extensive literature on the
principal-agent problem, Because it is costly tomonitor behavior, the principal uses processoutcomes as proxies for input effort. Typically, inhog finishing contracts, these observable proxiesconsist of things such as feed conversion, deathloss, and days to market.
Description of Coordination Alternatives
The measure of profitability calculated foreach finishing scenario wm designated as returns tolabor, management, and overhead (RLMOH). Thisis a measure of returns minus variable costs, withlabor, management, and overhead representing thespecific factors of production not included invariable costs. Included in the overheadclassification arc the cost of facilities andequipment, RLMOH is what is left to compensatefor these unpaid flictors of production. The valueRLMOH was calculated by applying the provisionsof each type of contract to farm production datawithin each enterprise type.z This study usedproduction data from a random sample of 17 hogfarms participating in the University of IllinoisFBFM record syslem.
Production records were gathered for sixconsecutive years, 1985-1990, A total of 953observations were identified and the average numberof hogs finished annually per farm over the sixyears was 1,033, Forty of the 95 observations camefrom farms finishing greater than 1,000 hogs in agiven year,
The calculation of RLMOH for each of the95 observations was made using the data availableon each FBFM record. A portion of the cost usedin the calculations was estimated from theUniversity of Illinois Livestock Budgets on a perhundred weight basis, The estimates of thesenonfeed costs were held at a constant per hundredweight rate for each observation, and were laterconverted to a per head basis for determiningRLMOH.
All of the contracts examined required thatthe producer provide buildings and equipment,labor, management, and nonfeed variable costs, Ofthe contract scenarios, numbers 1, 2, 3, and 4 allpay a base payment plus bonus payments for highfeed efficiency and low death loss. Contract 5 paysa base amount per head, but also stipulates that any

396 Johnson (znd I:o.vtev. Risk Ptv/c~ence.~ attd C’onmcring in the U,.S, Hog Indmlty
profits or losses earned by the contractor bc splitequally with the producer. In the contract,contractor profits are defined as gross returns minusvariable costs.
Contract 1 stipulates that the contractor paythe producer abase payment of$4.00 per head onarrival (payment in) and $4.50 per head aftermarketing (payment out). Inaddition, producers arepaid bonuses based on death loss and feedefficiency. The bonus schedule for this contract islisted in table 1.
Contract 2 has abase payment of$7 perhead sold, paid when the hogs arc marketed, and thebonus schedule is in table 2,
Contract 3 IS another traditional basepayment plus feed efficiency anddeath loss bonuscontract, The base payment is $7 per head sold,paid when the hogs are marketed, and the bonusschedule for feed efficiency and death loss isidentical to that of Contract 1 (table 1).
Contract 4 also pays producers both a baseamount and a bonus amount according to feedefficiency and death loss. The base payment is
$7.50 per head sold, which is paid when the hogsare marketed (table 3).
The base payment for Contract 5 is dividedinto two parts. The first part is $2.50 pcr headupon arrival and the second payment is $2.50 perhead at marketing, However, Contract 5 differsfrom Contracts 1 through 4 in that the bonuspayment consists of profit sharing between theproducer and the contractor, Therefore, theestimates of RLMOH for Contract 5 reflect overallprofitability in the hog finishing business, not Justdifferences in feed efticicncy and mortality ratesamong producers. The shared net return 1scalculated by subtracting variable costs (feeder pigcost, feed cost, veterinary and mcdlcine, mtcrest onproduction inventory, and marketing expense) fromthe gross receipts and the profits (or Iosscs) arcshared equally between the producer and thecontractor.
Several marmgerPdl assumptions wereneeded to make comparisons across contracts, First,
hog quality was assumed to be the same across allalternatives, Specifically, the genetic variationwithin the sample (actual records) was assumed forall contracting scenarios. This is probably areasonable assumption. Our experience with anumber of contractors in the Midwest suggests thatthey use the same or similar genetics as independentproducers of that region, It also appears that theproduction and marketing techniques used bycontractors in the Midwest are not as sophisticatedas those or theu counterparts in the Southeast,ConscquentIy, the second assumption is thatindependent management as reflected in the Illinois&ta is represermative of contract nmnagement. Thethird important assumption involves the health offeeder pigs as they enter the contract growing urut.Some independent finishers co-mingle pigs frommultiple sources. This practice increases thelikehhood of contracting swine heaith problems.Again, our experience suggests that the local feedcomparues wntmg contracts sometimes co-minglehogs in order to fill their contracts.
Table 4 lists the calculated values ofRLMOH per head for each finishing coordinationalternative examined. For the six-year periodstudied (1985- 1990), the mean RLMOH per headsold was highest for the independent scenario at$14.45. The mean RLMOH for independentfinishing operations is more than twice that ofContracts 1, 2, 3 and 4. The maximum value ofRLMOH for independent production reveals thepotential for large profits. However, the minimumvalues observed for the independent alternativesuggests that producers could experience losses inbad years that could potentially drive the producerout of business.
The variability of returns for theindependent producer (standard deviation = 10,95)is larger than for the contract alternatives. Thestandard deviation reveals the tremendous profitvariability of independent finishing compared tocontract production. Another measure used tocompare the variability of prospects with differingmeans and standard deviations is the coefficient ofvariation (CV) which is the standard deviationdivided by the mean. The C’V is an indication ofvariability per average umt of return. Theindependent scenario has six times greatervariability per unit of return than Contract 1,

J Agr, and Applied Econ, December, 1994
Table 1, Bonus Payment Schedule for Contract 1
397
Feed Efficiency Dollars per Death Loss Dollars per(lbs feed/lbs gain) Head Sold (percent) Head Sold
0.00-2.79
2.80-2,89
2.90-2,99
3.00-3,09
3.10-3.19
3.20-3,29
3.30-3,39
3.40 or above
2,00 0.00-.749 1.50
1,75 0,75-0,99 1.25
1.50 1,00-1.249 1.00
1.25 1,25-1,99 0.70
1,00 2,00-2,99 0!30
0.75 3.00 or above 0.00
0,50
0.00
Table 2, Bonus Payment Schedule for Contract 2
Feed Efllciency Dollars per Death Loss Dollars per(Ibs feedflbs gain) Head Sold (percent) Head Sold
0.00-2,59 1.50 0.00-0.99 1.50
2,60-2.79 1.00 1,00- I.99 1.00
2.80-2.99 0.50 2.00-2.99 0.50
3.00 or above 0.00 3.00 or above 0.00
Methodology: Generalized Stochastic Dominance
Meyer demonstrated a methodology toextend first and second degree stochastic dominance(GSD) techniques to order risky prospects whileconsidering a distinct set of risk attitudes. ThisGeneralized Stochastic Dominance (GSD) concept(also known as Stochastic Dominance with Respectto a Function (SDRF)) does not impose theassumption of normality on the distributions beingcompared as does mean-variance analysis, and doesnot assume a specific risk preference as do first andsecond degree Stochastic Dominance, Thus, GSDis more flexible in regard to the scenarios that canbe compared. Stochastic Dominance has been usedin a variety of agricultural settings. Dornbush andBoehlje used second order stochastic dominance to
evaluate turkey production contracts in Minnesota.Other agricultural applications of StochasticDominance to agricultural problems include but arenot limited to: Klernme; Anderson; Lee, Brown, andLovejoy; Hardaker and Tanago; Williams; andKramer and Pope.
For this study, GSD was used to rankmarket coordination alternatives based on thedistribution of RLMOH across various risk attitudeintervals. The class of decision makers consideredin any GSD problem is designated by defining anupper and lower bound of the Arrow-Pratt function(r(x)) or risk aversion coefficients (RAC’). Anindividual’s &l C is a measure of risk preferencebased on a negative exponential utility function.Generally speaking, a positive RAC implies risk

Johnson and Foster Risk Preferences and Contracting in the US. HogIndustrv
Table 3, Bonus Payment Schedule for Contract 4
Feed Efficiency, Dollars per Death Loss Dollars per(lbs feed/lbs gain) Head Sold (jercent) Head Sold
0.00-2.29 7.00 0.00-0.99 1.50
2,30-2.39 6.50 1,00-1.99 I ,00
2.40-2.49 6.00 2.00-2,99 0.50
2,50-2,59
2,60-2,69
2.70-2,79
2.80-2.89
2,90-2,99
3.00-3,09
3.10-3.19
3.20-3,29
3.30-3.39
3.40-3.49
3.50-3,59
3.60 or above
5.50 3.00 or above
5.00
4.50
4.00
3.50
3.00
2.50
2.00
1.50
1.00
0.50
0.00
0.00
Table 4. Estimated Statistics for Returns to Management, Labor, and Overhead
Return to Labor, Management andOverhead
Coordination Coeff. ofMethod N Mean” S&D Max Min Variation
Independent 95 $14.45 I0,95 40.07 -14.36 ,758
Contract 1 95 $5.46 .66 7.69 4.49 .121
Contract 2 95 $3.72 .69 5.91 2.66 .185
Contract 3 95 $3.79 .73 6,16 2.66 .193
Contract 4 95 $4.95 1.60 11,91 3.16 .323
Contract 5 95 $10.35 5.46 23.36 -4. I I .528
“All values are computed on a dollars per head basis.
J, Agr and Applled Econ , December, 1994 399
averse preference, an WC of zero implies riskneutrality, and an I/AC that is negative implies riskseeking behavior. That is,
RAC>O ~risk averse behaviorRAC=O ~risk neutral behaviorRAC <0> risk seeking behavior
RAc =u’’(x)/u’(x)where
U(x) = -e ‘“
GSD ranks risky prospects from mostpreferred to least preferred through sequential pairwise comparisons of each prospect’s expectedutility. The expected utility M a product of aprospect’s cumulative distribution curve and themarginal utility of a particular class of decisionmakers. For example, consider two prospects withprobabdity density functions ,f(x) and g(x)representing cumulative distribution functions F’(x)and G(x), with x defined in the range of [0, 1]. Theprospect F(x) is preferred to or indifferent toprospect G(x) by a decision maker with utilityfimction U(x) if and only if:
J’u (X)y(x)dx 2f
u (X)g(x)dxo (1
In other words, distribution F is preferredto distribution G if-the expected utility of F exceedsthat of G, Equivalently, integrating the aboveexpression by parts yields the condition by whichprospect F is preferred to G:
J’,[G (X)-F (x)]U ‘(X)dX > 0
The class of decision makers specified orpreference interval is defined as:
r-l(x) <u’’(x) /u’(x) <r 2(x)
where r 1 and r2 represent lower and upper boundson the RAC, and can range from strongly riskaverse to strongly risk seeking (see Meyer).5
Raskin and Cochran summarrze severalSDRF studies and corresponding estimates of rl andr2 used in previous research, There is not a clear
methodology for choosing the values of r 1 and r2due to differing outcome variables and varying riskaversion coefficient cstlmates. (Robison andCochran outline how transformation effect estimatesof r] and r2 when ranking alternatives differentscales to transform from whole farm to per unitvalues of the upper and lower bounds, it isnecessary to multiply the estimated bounds by thewhole farm scale factor. In this case we multipliedby 1,000, the average number of hogs producedannually).
In theory, the coordination system whicheventually prevails will be that which provides thedesired commodity at the lowest cost. Successfulcontmct production depends on the availability ofindependently owned physical and human capital.While feed costs and feeding pig costs are thelargest single costs in hog production, fixed costsare still a significant percentage of total productioncosts. Thus, it is reasonable to expect that currentproducers will have some control over the costsassociated with various systems via an implicitrental market. An important aspect of this study isdetermining how acceptable the contract alternativesarc for producers with various degrees of riskaversion.
The location of the RAC where the rldnkingof the prospects switch, named breakevcn riskaversion coefficients (BRAC) by McCarl, is ofinterest in order to identi~ discrete risk preferenceintervals in which the rldnkingof contmcts remainsunchanged, Attempts to rank prospects using aninterval that spans a 13RAC (i.e., the BRAC liesbetween rl and r2) will result in an inability to rankat least one pair of prospects. The goal supportingthe use of this approach was to identify the largestpreference intervals in which all prospects couldstill be ranked.
BegInning with the 95 data points from thefinishing enterprise coordination alternatives,McCarl’s computer algorithm wds used to identifythe breakeven risk aversion coefficients where ashift of preference between two alternativesoccurred, The search technique locates theparticular risk preference denoted by the Arrow-Pratt co-efficient, for which the difference incxpectcd utility between some pair of prospects iszero, The procedure makes scquentid comparisons
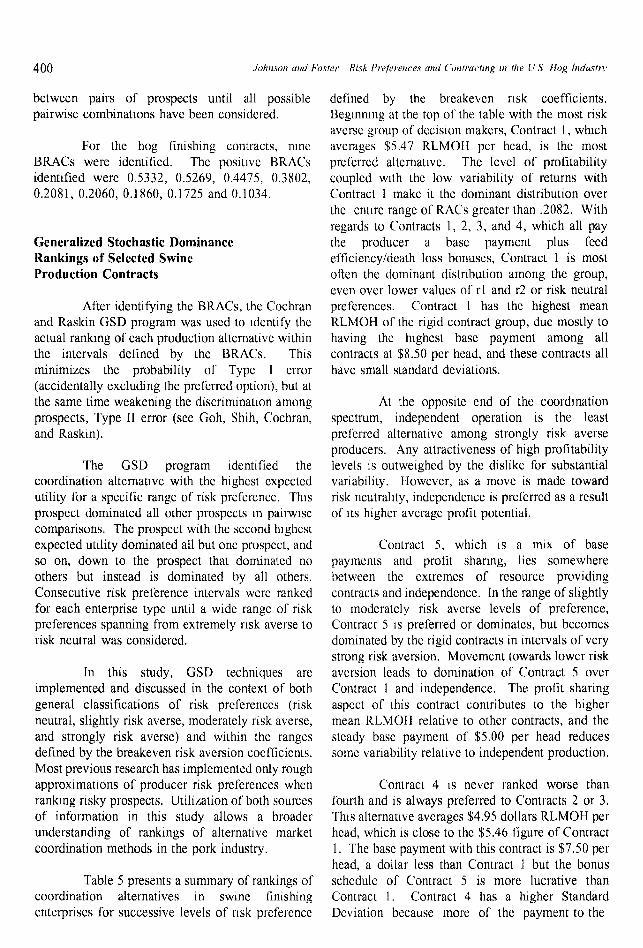
between pairs of prospects until all possiblepairwise combinations have been considered.
For the hog finishing contracts, runeBRACS were identified, The positwe BRACSidentified were 0.5332, 0.5269, 0.4475, 0.3802,
0,2081, 0.2060, 0.1860, 0,1725 and 0.1034.
Generalized Stochastic DominanceRankings of Selected SwineProduction Contracts
After identifying the BRAG, the Cochranand Raskin GSD program was used to dent ify theactual ranking of each production alternative withinthe intervals defined by the BRAC’S. Thisminimizes the probability of Type I error(accidentally excluding the preferred option), but atthe same time weakening the discrimination amongprospects, Type H error (see Gob, Shih, Cochran,and Raskin).
The GSD program identified thecoordination alternative with the highest expectedutility for a specific range of risk preference. Thisprospect dominated all other prospects m pairwusecomparisons. The prospec~ with the second highestexpected utility dominated all but one prospect, andso on, down to the prospect that dominated noothers but instead is dominated by all others,Consecutive risk preference intervals were rankedfor each enterprise type until a wide range of riskpreferences spanning from extremely nsk averse torisk neutral was considered.
In this study, GSD techniques arcimplemented and discussed in the context of’bothgeneral classifications of risk preferences (riskneutral, slightly risk averse, moderately risk averse,and strongly risk averse) and within the rangesdefined by the breakeven risk aversion coefficients.Most previous research has implemented only roughapproximations of producer risk preferences whenranking risky prospects. Utilization of both sourcesof information in this study allows a broaderunderstanding of rankings of alternative marketcoordination methods in the pork industry.
Table 5 presents a summary of rankings ofcoordination alternatives in swine finishingenterprises for successive levels of nsk preference
defined by the breakevcn nsk coefficients.Begmnmg at the top of the table with the most riskaverse group of decision makers, Contrmt 1, whichavcmges $5.47 RLMOIi per head, is the mostpreferred alternate, The level of profitabilitycoupled with the low variability of returns withContract 1 make it the dominant distribution overthe entuc range of RACS greater than .2082. Withregards to Contracts 1, 2, 3, and 4, which all paythe producer a base payment plus feedefficiency/death loss bonuses, Contract 1 is mostoften the dominant distribution among the group,even over lower values of rl and r2 or risk neutralpreferences. Contract 1 has the highest meanRLMOH of the rigid contract group, due mostly tohaving the highest base payment among allcontracts at $8.50 pcr head, and these contracts allhave small stmdard deviations.
At the opposite end of the coordinationspectrum, independent operation is the leastpreferred alternative among strongly risk averseproducers, Any attractiveness of high profitabilitylevels is outweighed by the dislike for substantialvariability. 1Iowever, as a move is made towardrisk neutrahty, independence is preferred as a resultof Its higher average profit potential.
Contract 5, which is a mix of basepayments and profit sharing, lies somewherebetween the extremes of resource providingcontracts and independcmcc. In the range of slightlyto moderately risk averse levels of preference,Contract 5 IS preferred or dominates, but becomesdominated by the rigid contracts in intervals of verystrong risk aversion, Movement towards lower riskaversion leads to domination of Contract 5 overContract 1 and independence. The profit sharingaspect of this contmct contributes to the highermean RLMOH relative to other contmcts, and thesteady base payment of $5.00 per head reducessome variability relative to independent production,
Contract 4 IS never ranked worse thanfourth and is always preferred to Contracts 2 or 3.This alternative avcmges $4.95 dollars RLMOH perhead, which is close to the $5.46 ligure of Contract1. The base payment with this contract is $7.50 perhead, a dollar less than Contract 1 but the bonusschedule of Contract 5 is more lucrative thanContract 1. Contract 4 has a higher StandardDeviation because more of the payment to the

J Agr, and Applied Econ,, December, 1994
Table 5. Ranking of Finishing Coordination Altemativcs Between Breakcven RiskAversion Coefficients (BRAC) Using GSD
Preference Interval BRAC Ranking of Coordination Alternatives
(Yl to r2) (Most Preferred to Least Preferred)
401
0.5333 to 15.00
0.5270to 0,5331
0.4476 to 0.5268
0,3803 to 0.4474
0.2082 to 0.3801
0.2067 to 0.2080
0,1861 to 0,2065
0.1726 to 0.1859
0.1035 to 0.1724
-0,3122 to 0.1033
0.5332
0.5269
0.4475
0.3802
0.2081
0.206
0.186
0.1725
0.1034
1, 4, 3, 2, 5, Ind
1, 4, 3, 5, 2, Ind
1, 4, 5, 3, 2, Ind
1, 5, 4, 3, 2, Ind
5, 1, 4, 3, 2, Ind
5, 1, 4, 3, Ind, 2
5, 1, 4, Ind, 3, 2
5, 1, Ind, 4, 3, 2
5, Ind, 1, 4, 3, 2
lnd, 5, 1, 4, 3, 2
“Ind refers to independent production and the numbers denote the number of thecorresponding contract.
producer is based on bonus incentives versus the
base payment, The variability of Contract 4 causesit to be less preferred than Contract 1 in intervals of
strong risk aversion,
A look at table 5 reveals that as risk
attitudes change from risk neutml to slightly riskaverse the ranking of independence, Contract 5 andContract 1 reverses. The range of RAC from 0.5333
to 15 is an area of very strong risk aversion, whereContract 1 is most preferred, independence is leastpreferred, and Contract 5 with its profit sharingattributes, is between the two. The range 0.1034 to
0,3801 approximates slight to moderate riskaversion and Contract 5 (profit sharing) is thepreferred alternative, The risk aversion coefficientsrange from -0.3122 to 0.1033, approximating riskneutral prc I_ercnces, and independence is thepreferred choice,
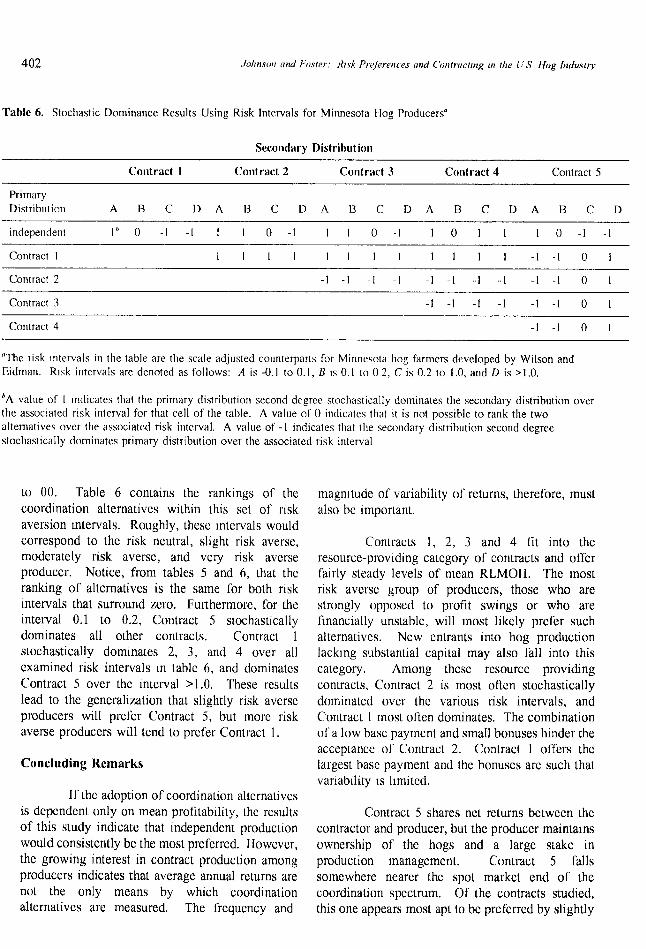
The risk preference intervals estimated byWilson and Eidrnan for Minnesota hog farmersprovide another basis for evaluating the ranking ofalternative coordination schemes with SDRF. Aftertransforming for scale, the corresponding intervalsare -0.10 to 0.10, 0.10 to 0.20, 0.20 to 1.0 and 1.0
402 Johnson ond Foster: d(sh Preferences und Con!ruc(tng m fhe li S Hog Indu.slty
Table 6. Stochastic Dominance Results Using Risk Intervals for Minnesota Hog producers”
Secondary Distribution
Contract I Contract 2 contract 3 Contract 4 Contract 5
PrimaryDistribution ABC DAi3CD
independent 11~.1.[llo-l
ABC DABCD ABCD
I 1 0 -1 I o -1 -1 1 0 -1 -1
Contract 1 1111 1111 1111 -1-101
contract 2 -1 -1 -1 -1 -1 -1 -1 -1 -1-1o1
Contract 3 -1 -1 -1 -1 -l-lo]
Contract 4 -l-tot
“The risk Intervals in the table are the scale adjusted counterparts for Minnesota bog farmers developed by Wilson andEidman. Nsk intervals are denoted as follows: A is -0.1 to 0.1, B IS 0. I to 02, C is 0,2 to 1.0, and D is >1.0.
*A value of I Indicates that the primary distribution second degree stocluistically dominates the secondary distribution overthe associate(i risk intervai for tilat ceil of ti]e tabie. A vaiue of O indicates that it is not possibie to mrrk tile twoalternatives over tile associated risk interval. A vaiue of - i indicates timt tile secondary distribution second degreestochasticaliy dominates primary distribution over tile associated risk intervai
to 00. Table 6 contains the rankings of thecoordination alternatives within this set of riskaversion intervals. Roughly, these mtcrvals wouldcorrespond to the risk neutral, slight risk averse,moderately risk averse, and very risk averseproducer. Notice, from tables 5 and 6, that theranking of alternatives is the same for both riskintervals that surround zero. Furthermore, for theinterval 0.1 to 0.2, Contract 5 stoehasticallydominates all other contracts. Contract 1stochastically dominates 2, 3, and 4 over allexamined risk intervals in table 6, and dominatesContract 5 over the interval >1,0, These resultslead to the generalization that slightly risk averseproducers will prefer Contract 5, but more riskaverse producers will tend to prefer Contract 1,
Concluding Remarks
If the adoption of coordination alternativesis dependent only on mean profitability, the rcstdts
of this study indicate that independent productionwould consistent ly be the most preferred. Iiowever,the growing interest in contract production amongproducers indicates that average annual returns arenot the only means by which coordinationalternatives are measured. The frequency and
magrutude of variability of returns, therefore, mustalso bc important.
Contracts 1, 2, 3 and 4 fit into theresource-providing category of contmcts and offerPairly steady levels of mean RLMOH, The mostrisk averse group of producers, those who arestrongly opposed to profit swings or who arefinancially unstable, will most likely prefer suchalternatives, New entrants into hog productionIacklng substantial capital may also fall into thiscategory, Among these resource providingcontracts, Contract 2 is most often stochasticallydominated over the various risk intervals, andContract 1 most often dominates, The combinationof a low base payment and sma[l bonuses hinder theacceptance of Contract 2. Contract 1 offers thelargest base payment and the bonuses are such thatvariability 1s hmitcd,
Contract 5 shares net returns between thecontractor and producer, but the producer maintamsownership of the hogs and a large stake inproduction management, Contract 5 fallssomewhere nearer the spot market end of thecoordination spectrum, Of the contracts studied,this one appears most apt to be preferred by slightly

J Agr and Apphed Econ,, Decetnher, 1994 403
risk averse producers. In addition, some of the riskinherent in independent production is passed to thecontractor at a relatively low cost to the producer interms of only slightly lower mean returns.c
It would appear that alternativecoordination efforts will continue to evolve in theU.S. pork industry. I-Iowever, because Wilson andEidman found that 78 percent of Minnesota hogfarmers were risk neutral or slightiy risk averse, theresults in tables 5 and 6 support continuedindependent farmer ownership of productionfacilities and hogs either through traditional meansor less restrictive contracts such as profit sharing ormarketing arrangements with packers. In response
to the demand for greater coordination along thepork marketing chain, the incidence of gmde andyield marketing has already increased substantially,’
Regardless of which mechanism is used toproduce and market pork in the future, a failure tomeet the demands of the domestic and exportmarkets will be devastating to the industry. Athome, consumers with unmet expectations will shiftconsumption from pork to other sources of protein.Abroad, other pork producing countries have beenquick to meet the demands of overseas markets.However, if a consistent quantity of quality productswere in greater supply, the U.S, might be morecompetitive due to Iowcr production andtransportation costs,
References
Anderson, Jock R. “Risk Efficiency in the Interpretation of Agricultural Production Research, ” Review qfMarketing and Agricultural Economics. 42( 1974) 131-184.
Anderson, Jock R., John L, Dillon, and J. Brian Hardaker. Agricuhurul Decision Analy,ris. Iowa StateUniversity Press, Ames Iowa. 1977,
Barry, Peter J, Risk Management in Agriculture. Iowa State University Press, Ames, Iowa, (1984).
Cease, R, “The Nature of the Firm,” Econometric. 4( 1937):386-407,
Cochran, Mark J, and Rob Raskin. “A User’s Gr.udeto the Generalized Stoch~stic Dominance Program forthe IBM PC Version GSD 2. 1,“ University of Arkansas Department of Agricultural Economicsand Rural Sociology Staff Paper SP0688. April, 1988.
Dillon, John L. The Anal]wis qf Response in Crop and Livestock Production. 2nd ed. Pergamon Press,Oxford, U.K. 1977.
Dornbush, Calvin W. and Michael Boehljc. “An Economic Analysis of Contracting Arrangements Usedby the Minnesota Turkey Industry,” University of Minnesota Department of Agricultural andApplied Economics, Staff Paper P88- 17, June, 1988,
Gob, Siew, Chao-Chuyan Shih, Mark J. Cochran and Rob Raskin, “A Generalized Stochastic DominanceProgram for the IBM PC.” S. J Agr. Econ. 21(1989):175-182.
Hamilton, Neil and Greg Andrcws. “State Regulation of Contract Feeding and Packer Integration in theSwine Industry.” White Paper 92-4, Agricultural Law Center, Drake University Law School,November 1992.
Hardaker, J. B, and A, G. Tanago, “Assessment of the Output of a Stochastic Decision Model.” Au.n. JAgr. Econ. 17(1973):170-178.
404 Johnson and Fos[cr Risk Prejeretrces aml Con(twc[ing in lhe U.S Hog Industn,
Jekanowski, Mark. “Vdluc Based Marketing of Pork - An Evaluation of Current and Potential Systems.”M,S, Thesis, Department of Agricultural Economics, Purdue University, May 1993,
Kauffman, R. G., E. Drachenberg, T. Hermcl, D, Iiall, and W. Kcough. “Do Pork Packers Pay forLeanness?” Unpublished Report, University of Wisconsin, Madison, WI (1988).
Klemme, Richard M. “A Stochastic Dominance Comparison of Reduced Tillage Systems in Corn andSoybean Production Under Risk.” ,4nwr. ,1.Agr. Econ, 67(1985):550-557.
Kliebcnstcin, James and Chris I[illburn. “Evaluation of Pork Production Contracts.” Iowa State UniversityDepartment of Economics.
Kramer, Randall A. and Rulon D. Pope, “Pal~icipation in Farm Commodity Programs: A StochasticDominance Analysis,” Amer. J. Agn. .ECOH.63( 1981): 119-128.
Lee, John, Deborah J. Brown, and Stephen Lovejoy, “Stochastic Efficiency versus Mean-Variance Criteriaas Predictors of Adoption of Reduced Tillagc.” Amer. J. Agr, Econ. 67(1985):839-845.
McCarl, Bruce A. “Generalized Stochastic Dommance: An Empirical Examination. ” S, J. .4gr. Econ.22(1990):49-55,
Meyer, Jack, “Choice Among Distributions,” J. ECYM.Theoiy. 14(1977):326-336.
Rwkin, Rob and Mark J. Cochrdn. “Interpretations and Transformations of Scale for the Arrow PrattAbsolute Risk Aversion Coefficient: Imphcatlons for Generalized Stochastic Dominance,” W.J.Agr. lion, 11(1986):204-210.
Rasmussen, S. “The Use of a Multi-Period LP-Model as the Core of a Decision Support System for a HogSlaughterhouse,” Social Science Series Paper 3 from the Department of Economics and NaturalResources, Royal Veterinary and Agricultural University, Denmark, 1992,
Rhodes, V. James. “U.S. Contract Production of IIogs,” Univ. Missowri Agr. Econ. l{eport No: 1990-1.University of Missouri Agricultural Experiment Station, National Pork Producer’s Council, andPork 89. 1989.
Rubin, P. “The Theory of the Firm and the Structure of the Franchise Contract.” .1 Law and Econ.21(1977):223-233,
Sapp, S. and C.L. Knipc. “Japanese Consumer Preferences for Processed Pork,” Agrilw$ine.w, 6( 1990):387-400.
Schrader, L. “Responses to Forces Shaping Agricultural Markctmg: Contracts.” Ainw, J. Agr, Econ,68(1986):161-166.
Ueda, Y. “Satis@ing Our Biggest Pork Customer,” Pork Strategies 2000: A Marketing and TechnologyDynamics SYmposiLlnl,fbr Pork Indus[ty Leaders, Des Momcs, Iowa, December 1990.
Willtiams, Jeffrey R. “A Stochastic Dominance Analysis of Tillage and Crop Insurance Practices In aSemiarid Region,” Amer. ,1.Agr. lkon, 70(1988):112-120.
J Agr and Apphed Econ , December, 1994 405
Williamson, Oliver E. “The Vertwal Integration of Production: Market Failure Considerations.” Anrer.Econ. Rev, 61(1971):112-123.
Williamson, Oliver, E, “TransactIon Cost Economics: The Govcrnancc of Contmctual Relations.” J. Lawand Em?. 22(1979):233-261.
Wilson, Paul N. and Vernon R. Ehdman. “An Ernpmcal Test of the Interval Approach for Estimating RiskPreferences.” W, J. Ag-r.Econ, 8(1983):170-182,
Zering, Kelley and Allen Beals. “Financial Characteristics of Swine Production Contracts.” ,1.Amer. Sot.Farm Managers and Run Appraisers. 54( 1990):43-53.
Endnotes
1. Denmark has been the primaly supplier of pork to Japan, The production, slaughter, proccssmg, andmarketing stages are highly coordinated by cooperatively owned slaughterhouses, Rasmussen describes thiscoordinated system,
2, Regarding the source of the contracts used in this study, two were obtained from the Iowa StateUniversity extension paper by Kliebenstein and Hillburn titled Evaluation afContract Provisions andPeyfimnance. The remaining contracts were acquired from various sources in the e~stern corn belt.
3. Only 95 observations were used (instead of the expected 102) because missing data were found in sevencases.
4. Facilities are deemed acceptable subject to the approval of the contractor (owner of the hogs).
5. For this study, risk seeking intervals are not of interest since it 1snot llkely that any pork producers couldbe viewed as risk seekers. There are likely to be other more risky prospects with higher expected payoffsthan producing pork that would attract pure risk seekers, The classes examined in this study range fromstrongly risk averse to risk neutral.
6, Packers may also be interested in these arrangements assuming that the same benefits of “harmonizing”adjacent production stages can be achieved under the profit sharing contracts as under the other contracts.Grade and yield marketing alternatives offered by most packers fill a similar coordination niche.
7, In 1988, Kauffman, et al,, estimated that 28’XO of U.S. hogs were sold on a grade and ylcld system versus36% in 1992 as estimated by Jekanowski.