risk level assessment of pipelines using a …
TRANSCRIPT

1
RISK LEVEL ASSESSMENT OF PIPELINES
USING A COMBINATION OF ANALYTICAL NETWORK
PROCESS AND RISK BASED INSPECTION METHODS
Mobin1, Hari Purnomo2
Master Program in Industrial Engineering, Faculty of Industrial Technology, Indonesian Islamic
University1
Lecturer in Industrial Engineering Master, Faculty of Industrial Technology, Indonesian Islamic
University2
Jl. Kaliurang Km. 14.5., Sleman, Yogyakarta
Email: [email protected]
ABSTRACT
Using pipelines is the most effective and efficient way to transport oil and
gas to an intended destination. However, pipelines also pose risks to humans, the
environment and business interests. This research study assessed the level of
pipeline risk of PT X. As such, it aimed to identify the efficacy of inspection and
maintenance planning using a priority scale based on the ranking of the causes of
failure. A combination of Analytical Network Process (ANP) and Risk-based
Inspection (RBI) methods was used to assess the risk level of pipeline failure.
The results using the ANP method showed that corrosion (44.64%) is the main
factor causing failure to the pipelines. The atmospheric corrosion subfactor is one
of the corrosion factors that contributed to pipeline failure (16.12%). Safety is the
most significant consequence of the impact of pipeline failure (51.54%).
Furthermore, by applying the RBI method, the Probability of Failure (PoF) value
was calculated to be 1.2028 and the Consequence of Failure (CoF) value was
4.290, resulting in a risk level of 4 on the risk matrix order of 6 x 6. Inspection
and maintenance programmes should pay special attention to the corrosion
factors and the atmospheric corrosion subfactors in order to reduce the risk level
associated with pipeline failure.
Keywords: Analytical Network Process, Risk-based Inspection, Probability of
Failure, Consequence of Failure
1. INTRODUCTION
Pipelines serve to transport fluid (liquid or gas) from one location to another.
Based on geographical aspects, pipelines are categorised as onshore pipelines and
offshore pipelines [1]. In the oil and gas industry, a pipeline is the most
economical means of transporting crude oil, natural gas and other oil products
from one point to another; it is more cost-effective than railroad transportation,
tank trucks or tankers [2]. Although pipelines have been designed as well as
possible, there is still a risk of failure. When a leak or rupture occurs on the
pipeline, it can be dangerous, and even fatal, because it may cause a fire or
explosion and result in environmental pollution [3].
There have been several pipeline leaks in Indonesia. The last incident
resulted in fire and environmental pollution due to the breakdown of the

2
submarine crude oil pipeline. To reduce the risk of failure, it is important to
conduct good inspections and to ensure proper maintenance. At present, many
companies still rely in Time-based Inspection (TBI) methods to inspect and
maintain their equipment. When the inspection and maintenance of pipelines is
not done properly, it can lead to ineffective and inefficient time management as
well as increased costs [2].
Some developed countries have shifted from TBI to Risk-based Inspection
(RBI) to assess and maintain pipelines. RBI is a risk assessment method used to
develop a planning or inspection programme based on the risk of failure and the
consequences of failure of equipment [4]. With the RBI method, it is possible to
effectively and efficiently determine the frequency and time interval of
inspections based on potential failures in order to reduce inspection costs [5].
This approach consists of a thorough examination covering corrosion, materials,
processes, plant operations and consequence analysis to identify and reduce the
risks by taking corrective, proactive and preventive actions.
The RBI process is an important element of the inspection programme based
on risk analysis. The result of RBI is a risk matrix that assigns a specific level of
risk to equipment. In terms of risk level values, scheduling inspections and
maintenance for equipment can be done based on the mechanism of damage that
occurs to the equipment. Several studies have investigated the failure of
pipelines. Shafiq and Silvianita [2] compiled a ranking of the causes of pipeline
leakage using the Analytical Hierarchy Process (AHP) method. Dawotola et al.
[3] also used the AHP method to determine the main factor that causes pipeline
failure. The AHP method can be used to determine the weight of the factors that
cause a pipeline to leak.
This present study used the Analytical Network Process (ANP) method,
which was developed from the AHP method, to evaluate the dependency
relationship between the factors or subfactors [6]. This research study aims to
identify the ranking of the factors and subfactors that cause pipeline failure as
well as the consequences of that failure. It also seeks to determine the level of
risk that is likely to occur in the pipeline using the RBI method. Furthermore,
based on the ranking of factors and subfactors that cause pipeline failure and the
resulting risk level, this paper presents some recommendations that are effective,
on target and efficient ways to reduce the risk of pipeline failure.
2. RESEARCH METHODS
2.1 Research Object
The object studied in this research is a crude oil pipeline with a diameter of
12 inches (MKSA-STN), owned by PT X, which operates in East Kalimantan.
2.2 Research Scope
This research study aimed to assess the risk level of the pipeline under
investigation in the 5 km onshore pipeline. This research framework uses the
concept of risk management by applying the RBI method to the pipeline. In terms

3
of research variables, the probability of the cause of a pipeline failure consists of
the following factors and subfactors [7]:
1. Third Party Damage Index (TPDI). This factor consists of the following
subfactors:
a. Minimum Depth of Cover (MDC)
b. Activity Level (AL)
c. Above Ground Facilities (AGF)
d. Line Locating (LL)
e. Public Education Program (PEP)
f. Right of Way (ROW)
g. Patrol Frequency (PF)
2. Corrosion Index (CI). This factor consists of the following subfactors:
a. Atmospheric Corrosion (AC)
b. Internal Corrosion (IC)
c. Subsurface Corrosion (SC)
3. Design Index (DI). This factor consists of the following subfactors:
a. Safety Factor (SF)
b. Fatigue (FAT)
c. Surge Potential (SP)
d. Integrity Verification (IV)
e. Land Movement (LM)
4. Incorrect Operation Index (IOI). This factor consists of the following
subfactors:
a. Operation (OP)
b. Maintenance (MAIN)
Moreover, according to Integrated Risk Prioritization Matrix User Guide, the
consequences of the failure of a pipeline have an impact on [8]:
1. Safety (SFT)
2. Healthy (HLT)
3. Environment (ENV)
4. Assets (AST)
2.3 Data Collection
This research study collected primary data and secondary data. Primary data
were obtained from questionnaires resulting from interviews with experts (expert
judgment) that have an understanding of pipelines. There were 29 respondents
(the experts) with different professional backgrounds, including asset integrity
specialists, facility engineers, operators (operation), health environmental and
safety (HES) representative and maintenance team. Secondary data consisted of
information about the design, specifications, history of inspections and
maintenance of the pipeline as well as standard procedures related to the pipeline.
All of the data were obtained from the database found in the Pipeline Integrity
Management System (PIMS).

4
2.4 Risk Level Assessment
The risk assessment process consisted of three stages. In the first stage, the
condition of the pipeline was assessed based on the subfactors that cause the
failure and the consequences of that failure. In the second stage, the weight of
each factor and subfactor that causes the pipeline failure was calculated as was
the weight of each of the possible consequences of the failure. This calculation
process used the ANP method. In the third stage, the Probability of Failure (PoF)
and Consequence of Failure (CoF) values are determined in order to obtain the
level of risk through the risk matrix.
2.4.1 Assessment of the Condition of the Pipeline
Assessment of the condition of the pipeline included an investigation of the
subfactors of the cause of the pipeline failure and the CoF. The results of the
average value of the assessment of the pipeline condition through the
questionnaire are the risk rating value that will be used to calculate the score.
2.4.2 Calculation of ANP
The calculation of ANP consisted of the following stages:
a. Arrange the structure of the problem by creating a network model of decision
that shows the relationships among the elements of the decision.
b. Create a paired comparison matrix between the factors that influence decisions
by assessing the importance of an element in relation to other elements.
c. If there are many respondents, there are often differences of opinion in
determining interests, so that the average geometry is needed. That is obtained
by using the following equation:
Average Geometry =
Where: R = value of the comparison between the value of Bi and Bj.
n = number of respondents.
d. Prioritise each criterion/factor.
e. Calculate the value of the priority vector (eigen vector) using the following
formula:
X =
Where: X = eigen vector
Bij = column cell values in one row (i, j = 1, 2 ... n) = total number of columns
N = number of matrices being compared.
f. Check the consistency (Consistency Ratio [CR]) with a value of no more than
10%. The following steps are used to check the CR:
1. Look for the value of λmax using the following equation:
λmax = (eigen value 1 x number of columns 1) + (eigen value 2 x number
of columns 2) + ... + n
2. Determine the Consistency Index (CI)
CI = (λmax - n) / (n - 1)
Where: CI = Consistency Index
λmax = the largest eigen value

5
n = number of matrices being compared.
3. Determine the CR value:
CR = CI/RI
Where: CR = Consistency Ratio
CI = Consistency Index
RI = Random Index
2.4.3 Calculation of the Risk Level Values
In order to obtain a PoF value, the value of the global weight of each
subfactor that causes the pipeline failure must be calculated. Then, the score of
each of these subfactors is calculated. The total score results in a PoF value for
the factor causing the failure, and it creates a CoF value associated with the
consequences of the occurrence of failure.
3. RESULTS AND DISCUSSION
3.1 Condition of the Pipeline
The first questionnaire was about assessing the conditions of the pipeline in
terms of the subfactors that cause the failure using a Linkert scale ranging from 1
to 6, as follows: strongly unsatisfactory (1), unsatisfactory (2), less than
satisfactory (3), quite satisfactory (4), satisfactory (5) and strongly satisfactory
(6). Based on the results of the questionnaire, the respondents generally gave
answers with an average Linkert scale value of 4 (quite satisfactory). The second
questionnaire was about assessing the pipeline against the CoF using a Linkert
scale ranging from 1 to 6, as follows: catastrophic (1), severe (2), major (3),
moderate (4), minor (5) and incidental (6). Based on the results of the
questionnaire, the respondents generally gave answers with an average Linkert
scale value of 4 (moderate). The results of these two questionnaires become the
rating parameter used to calculate the score.
3.2 Determination of the Dependency Relationships among the Subfactors
The third questionnaire was used to determine the dependency relationship
between the subfactors in one factor (inner dependency) and between the
subfactors in different factors (outer dependency). The results of the
questionnaire recapitulating the dependency relationships between the subfactors
are shown in Table 3.1.
Determination of the dependency relationships was based on previous
research. If the number of respondents who choose Bij is ≥ to half of N, (Bij >
N/2), where N is the total number of the respondents, it is concluded that there is
a relationship of interdependence between the subfactors [9]. For example, in the
Minimum Depth of Cover (MDC) level cells, the number of respondents is 29
and the Bij value = 24; thus, it is concluded that there is a relationship of
interdependence between MDC and Activity Level (AL).

6
Table 3.1 Recapitulation of the Dependency Relationships between the
Subfactors
Figure 3.1 Network structure of the subfactors that cause the pipeline failure
3.3 Pairwise Comparison Between the Factors and Subfactors
The fourth questionnaire was about the pairwise comparisons between the
factors and subfactors that cause a pipeline failure based on the information
presented in Figure 3.1, using a scale ranging from 1 to 9. The fifth questionnaire
was about the pairwise comparisons between the consequences of the impact of
the pipeline failure using a scale ranging from 1 to 9.
7
3.4 Data Testing
The validity test uses Correlation Item-Total Correlation and Bivariate
Pearson (Product Moment Pearson) correlation techniques [10]. If the r count is ≥
the r table with a significance level of 0.05, then the instrument is said to be valid.
The r table value with the number of respondent N = 29 having a confidence level
of 95% ( = 5%) is 0.3610.
The validity test results showed an r count value >0.3610 for all data, so the
questionnaire data is said to be valid. Next, a reliability test was conducted using
the Cronbach Alpha method [10]. From the calculation results, it is concluded
that the reliability coefficient value is >0.6, so the data are said to be reliable.
3.5 Calculation of the Weight Value of the Factors and Subfactors
At this stage, the weight value of the fourth questionnaire results were
calculated. This consisted of the pairwise comparisons among the factors and
among the subfactors that cause the pipeline failure. The questionnaire results of
the pairwise comparison are shown in Table 3.2. As seen, the TPDI factor is
0.1429-times more important than the CI factor, or the CI factor is 7-times more
important than the TPDI factor.
Table 3.2 Pairwise Comparison Matrix
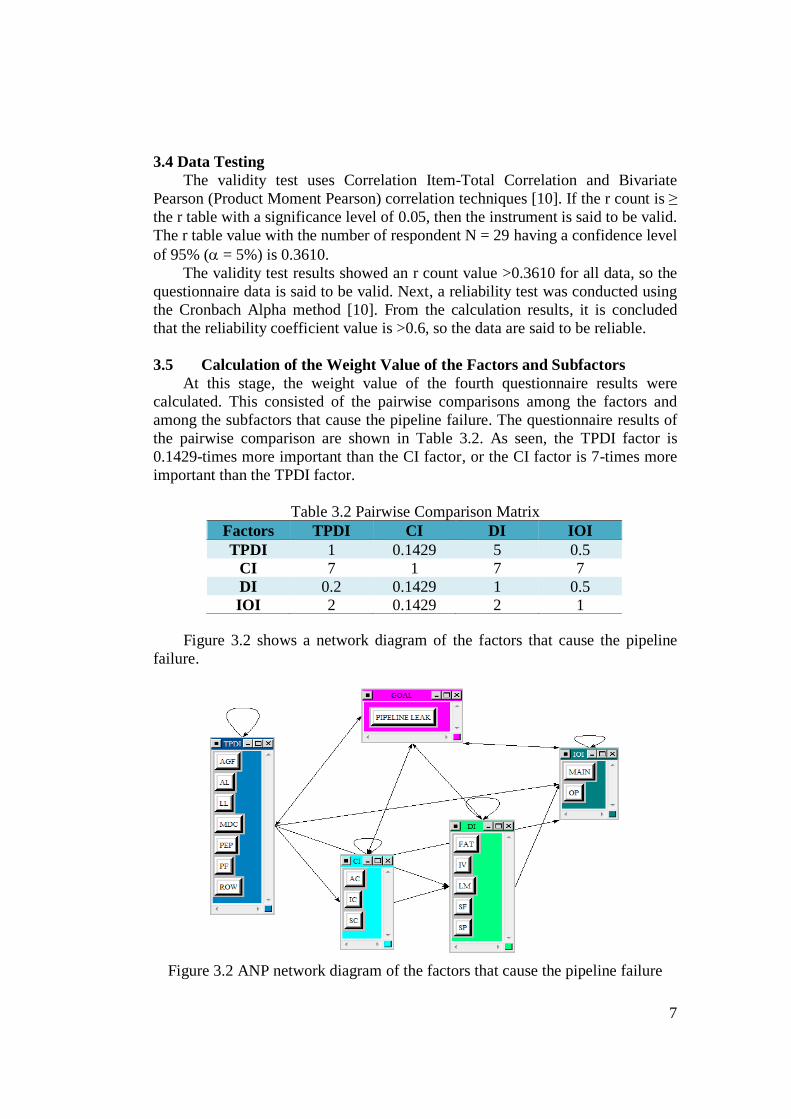
Figure 3.2 shows a network diagram of the factors that cause the pipeline
failure.
Figure 3.2 ANP network diagram of the factors that cause the pipeline failure
Factors TPDI CI DI IOI
TPDI 1 0.1429 5 0.5
CI 7 1 7 7
DI 0.2 0.1429 1 0.5
IOI 2 0.1429 2 1

8
The CR value of the calculation result is 0.0695. This value is <0.1, so the
results of the opinion questionnaire about the factors that cause the pipeline
failure is consistent. The CI factor has the highest weight value, which is 0.4464,
followed by TPDI, with a weight of 0.2641, DI, with a weight of 0.1841, and IOI,
with a weight of 0.1054.
The output of the CI value for the subfactors that cause the pipeline failure is
0.0439. This value is <0.1, so the factors and subfactors that cause the pipeline
failure are consistent. The output for the weight value of the subfactors that cause
the pipeline failure shows that the AC subfactor has a weight value of 0.1612
followed by SC, with a weight value of 0.1312. The MDC subfactor has a weight
value of 10.54%; the SF, MAIN and OP subfactors have weight values of 9.17%,
8.28% and 7.43%, respectively. The PF subfactor had the smallest weight value
(0.0058).
3.6 Calculation of the Weight Value of the Consequence Factors
The calculation of the weight of the consequence factors on the impact of the
pipeline failure also used the data from the fifth questionnaire, which contains
pairwise comparisons between the CoF of the pipeline using a scale ranging from
1 to 9. The information presented in Table 3.3 shows that the SFT factor is 5-
times more important than the HLT factor, or the HLT factor is 0.2-times more
important than the SFT factor. This holds true for the other factors (ENV and
AST).
Table 3.3 Pairwise Comparison Matrix of the Consequence Factors
against the Pipeline Failure
Factor SFT HLT ENV AST
SFT 1 5 3 6
HLT 0.2 1 0.3333 3
ENV 0.3333 3 1 5
AST 0.1667 0.3333 0.2 1
The result of the CR calculation for the CoF of the pipeline is 0.0952. This
value is <0.1, so that the consequences factor for the impact of the pipeline
failure is consistent. The SFT factor had the highest weight value of 0.5154,
followed by ENV, with a weight value of 0.2248, HLT, with a weight value of
0.1885 and AST, with a weight value of 0.0713.
3.7 Risk Level Assessment Using the Risk Matrix
The sum of the score values for all the subfactors that cause the pipeline
failure is obtained from the PoF value. The results of the risk level calculations
are as shown in Table 3.4.

9
Table 3.4 Probability of Failure (PoF) Results
Factor Factor
Weight
Sub
Factor
Weight of
Subfactor
Global
Wight
Rating Score PoF
TPDI
0.2641
MDC 0.1054 0.0278 4.4138 0.1227
1.2028
AL 0.0503 0.0133 4.3103 0.0573
AGF 0.0319 0.0084 4.4483 0.0374
LL 0.0180 0.0048 4.3448 0.0209
PEP 0.0091 0.0024 3.9310 0.0094
ROW 0.0143 0.0038 3.9655 0.0150
PF 0.0058 0.0015 3.7931 0.0057
IC
0.4464
AC 0.1612 0.0719 4.3448 0.3123
IC 0.0734 0.0328 3.7931 0.1244
SC 0.1312 0.0586 3.7931 0.2223
DI
0.1841
SF 0.0917 0.0169 4.7241 0.0798
FAT 0.0285 0.0053 4.3793 0.0232
SP 0.0361 0.0067 4.4483 0.0298
IV 0.0546 0.0101 4.3103 0.0435
LM 0.0314 0.0058 4.1379 0.0240
IOI 0.1054 OP 0.0743 0.0078 4.5862 0.0358
MAIN 0.0828 0.0087 4.5172 0.0393
The PoF score was calculated by multiplying the weight of the factor with
the rating, while the CoF value was obtained from the sum of the scores. The
results of the CoF calculation are shown in Table 3.5.
Table 3.5 The Consequence of Failure (CoF) Values for the Factors
Factor Factor Weight Rating Score CoF
SFT 0.5154 4.4483 2.2927
4.3171 HLT 0.1885 4.4828 0.8450
ENV 0.2248 4.0000 0.8992
AST 0.0713 3.9310 0.2802
Based on the calculations, the PoF value was 1.2028 and the CoF value was
4.3171. Furthermore, the level of risk that might occur was determined through
the risk matrix. The PoF value is rounded to 1 and the CoF value is rounded to 4,
then they are adjusted to the matrix, as seen in Figure 3.3. In that figure, the
encounter of the value of 1 (likely) and the value of 4 (moderate) creates the
value of 4.
This study used the Integrated Risk Prioritization Matrix compiled by PT X
[8]. The Y axis represents the likelihood of risk, or the PoF value, and the X axis
represents the CI value or the CoF.

10
Figure 3.3 Risk matrix results from the data analysis
According to the risk criteria in the Integrated Risk Prioritization Matrix, the
result with a value of 4 in the risk matrix shows that the pipeline is at high risk of
failure, and it has high consequences for the company’s SFT, HLT, ENV and
AST in the event of a pipeline failure or leak.
3.8 Inspection and Maintenance Strategy
Based on the results of the risk assessment, the inspection interval of the
recommended pipeline is 6 months for the on-stream pipeline and one year for
the off-stream pipeline [8]. If it is not possible to implement these
recommendations, other efforts are needed, such as developing plans and
strategies for maintenance checks that are effective, targeted and efficient by
involving competent engineers to carry out more detailed research on the
pipeline.
The corrosion factor had the highest risk level value, so it is likely to occur
in the pipeline. This is because the AC subfactor that is part of the corrosion
factor also had a high weight value. In general, AC occurs in parts of the splash
zone, ground/air interface, part of the pipeline that crosses trenches or small
rivers, and it is interrupted between the support and conduit pipes. The
mechanism of corrosion is due to mechanical damage that affects the paint
coating. In general, even corrosion, pitting corrosion and crevice corrosion on the
outside of the pipeline are the types of corrosion that occur. Even corrosion rarely
results in fatal damage, but it can cause other dangerous types of corrosion.
Corrosion causes thinning of the thickness of the pipeline, and it will eventually
cause leakage. A visual inspection of the pipeline is done to assess the level of
AC. The condition of the outer surface of the pipeline is inspected and the
thickness of the pipeline is measured using an Ultrasonic Test tool. This

11
measurement is conducted every 6 months at regular intervals, as recommended
above, to monitor the corrosion rate to the allowable extent. To inhibit the AC
rate, the pipeline’s paint coating should be repaired in accordance with applicable
standards so that good quality is maintained and the pipeline is protected from
corrosion.
Subsurface corrosion occurs on the outside of a pipeline embedded in the
soil. In general, the types of corrosion that occur are even corrosion and pitting
corrosion. Long Range Ultrasonic Test (LRUT) equipment is used to effectively
inspect a pipeline for subsurface corrosion. If an anomaly is found, excavation
will be carried out, and the remaining thickness of the pipeline is measured
manually using the Ultrasonic Test. Moreover, it is important to determine if the
pipeline is still protected by a cathodic protection system; that is done by
conducting a Cathodic Protection Survey or by measuring the Direct Current
Voltage Gradient (DCVG) on the channel pipe. To inhibit the AC rate, the paint
coating must be repaired. If needed, optimising the cathodic system is also a good
way to ensure that it works well so that the pipeline is protected from corrosion.
IC is the occurrence of corrosion on the inside of the pipeline. Generally, it is
caused by impurities that dissolve and are carried away by the crude oil as it
flows through the pipeline. The impurities include sea water, sulfide acid (H2S),
carbon dioxide (CO2), oxygen (O2), chloride ions, micro-organisms, in the form
of an-aerobic bacteria, and sand. Through the electrochemical process these
substances can cause corrosion on the inner walls of the pipeline. The sand
carried by crude oil can cause erosion on the inner walls of the pipeline when the
oil flows through it. To inspect for IC, a corrosion coupon should be installed and
monitored regularly. In addition, samples of crude oil at the end of the delivery
and crude oil samples from the recipients should be taken for laboratory analysis
to determine the content of the impurities. To prevent IC, chemicals, such as
corrosion inhibitors, scale inhibitors or biocides, are injected into the pipeline
depending on the cause of the corrosion. The dose of the injected chemicals
depends on the results of the laboratory analysis, and the chemicals are
periodically injected. To clean the inner walls of the distribution pipes to remove
such things as sand and other objects, a pigging is regularly launched into the
pipeline using either a rubber foam pig or a brush pig.
In addition to the above-mentioned efforts that businesses use to reduce the
level of risk of pipeline leakage or failure, a long-term plan is also needed to
conduct a thorough evaluation using an In-Line Inspection (ILI) method by
launching the Intelligent Pig inspection tool into the pipeline. The Intelligent Pig
inspection results will provide comprehensive data about the actual conditions of
the pipeline, thereby enabling an analysis of the Fit for Service (FFS) of the
pipeline.
4. CONCLUSION
The risk analysis in this research used a combination of ANP and RBI
methods to evaluate a crude oil pipeline with a diameter of 12 inches stretching
from the coastline to the location of the refining process (onshore pipeline). A

12
risk level value of 4 on the risk matrix was found, and the pipeline was in the
high-risk level category.
The CI was the factor with the highest risk of pipeline failure (44.64%). In
terms of the CoF of the pipeline, the SFT factor was ranked first at 51.54%. The
corrosion subfactors that contribute to the high risk of pipeline failure are AC
(16.12%), SC (13.12%), MDC (10.54%), SFT (9.17%), MAIN (8.28%), OP
(7.43%) and IC (7.34%).
Serious consideration must be given to the corrosion factor and its subfactors
to effectively and efficient inspect and maintain pipelines at key time intervals in
order to reduce the level of risk of failure.
REFERENCES
[1] Rahman, M.R. (2015). Perencanaan Modifikasi Pipa penyalur Minyak dengan
Adanya Penambahan Platform Produksi. Seminar Nasional Cendekiawan.
ISSN: 2460-8696. [Cited: August 27 2018]. Available at:
http://media.neliti.com/media.publications.
[2] Shafiq, N. and Silvianita. (2010). Prioritizing the Pipeline Maintenance
Approach Using Analytical Hierarchical Process. International Review of
Mechanical Engineering, Vol. 4 Issue 3, pp. 346–352.
[3] Dawotola, Alex. W., Van Gelder, P.H.A.J.M. and Vrijling, J.K. (2011).
Decision Analysis Framework for Risk Management of Crude Oil Pipelines.
Hindawi Publishing Corporation Advances in Decision Science, Article ID
456824.
[4] American Petroleum Institute (2009). Risk Based Inspection API RP 580, 2nd
Edition. Washington DC: API Publishing Service.
[5] Selvik, J.T., Scarf P. and Aven T. (2011). An Extended Methodology for Risk
Based Inspection Planning. RT&A # 01 (20). Vol. 2. [Cited: October 12
2017]. Available at: https://www. pdfs.semanticscholar.org
[6] Saaty, T. L. (1999). Fundamentals of the Analytic Network Process, ISAHP.
Kobe, Japan, [Cited: October 14 2017].
Available at: http://www.isahp2003.net.
[7] Muhlbauer, W.K. (2004). Pipeline Risk Management Manual. Ideas,
Techniques and Resources. Third Edition, Elsevier Inc. Oxford: Gulf
Professional Publishing as an Imprint of Elsevier.
[8] HES Risk Management Center of Excellence. (2011). RiskMan2, Integrated
Risk Prioritization Matrix User Guide. Chevron.
13
[9] Wibowo, M., R. A. (2010). Perancangan Model Pemilihan Mitra Kerja dalam
Penyediaan Rig Darat dengan Metode Analytical Network Process (ANP),
Tesis, Fakultas Teknik, Universitas Indonesia.
[10] Sugiyono. (2016). Statistika untuk Penelitian. Bandung: Alfabeta.
[11] American Petroleum Institute (2013). Managing System Integrity for
Hazardous Liquid Pipeline API RP 1160, 2nd edition. Washington DC: API
Publishing Service.
[12] Amir, M.T. (2015). Merancang Kuesioner. Konsep dan Panduan untuk
Penelitian Sikap, Kepribadian & Perilaku. Prenadamedia. Jakarta.
[13] Dey, P.K. (2001). A Risk Based Model for Inspection and Maintenance of
Cross-Country Petroleum Pipeline. Journal of Quality in Maintenance
Engineering. Vol. 7. Issue. 1, pp. 25–43.
[14] Saaty. R.W. (2016). Decision Making in Complex Environments: The
Analytical Network Process (ANP) for Dependence and Feedback.
Including a Tutorial for the SuperDecisions Software and Portions of the
Encyclicon of Applications, Vol. I. ISBN Number 1-888603-00-3. [Cited:
July 14 2018]. Available at: http://www.superdecisions.com.
[15] Saaty, T. L. (2004). Decision Making: The Analytic Hierarchy and Network
Process (AHP/ANP). Journal of System Science and System Engineering,
Vol. 13, No. 1, pp.1–35.