risk-based contributions in eu deposit guarantee...
TRANSCRIPT

June 2008 Final Report on Risk-Based Contributions 1
EUROPEAN COMMISSION DIRECTORATE GENERAL JRC JOINT RESEARCH CENTRE
Risk-based contributions in EU Deposit Guarantee Schemes:
current practices
European Commission, Joint Research Centre, Unit G09, Ispra (Italy)

June 2008 Final Report on Risk-Based Contributions 2
Executive summary One of the self-regulatory issues identified by the European Commission Communication on Deposit Guarantee Schemes (DGS) published in November 2006 is the voluntary introduction of risk-based contributions in EU DGS. With the objective of developing potential models for adjusting DGS contributions, the European Commission Directorate-General for Internal Market and Services asked the Joint Research Centre to investigate current practices across EU Member States (MS). This report, produced with the cooperation of the European Forum of Deposit Insurers (EFDI), is intended to lay the foundation for future developments on this subject. This report describes the risk-based models and monitoring systems applied across the EU MS. On the one hand, it broadly illustrates systems currently applied across the EU to highlight the fundamental principles underlying risk determination; on the other, it provides more technical details of each method, including a description of the mathematical tools employed. Moreover, a numerical example of each risk-based methodology is discussed in order to reproduce the individual steps of the calculation. In general, risk-based systems and mere monitoring systems use one or more indicators reflecting different aspects of their members’ activities. Although the ratios currently applied across MS are quite heterogeneous and the variables taken into account to define them are not identical, they are built in terms of ratios using balance-sheet data, financial statement data or other types of accounting data. Indicators can be grouped into three main classes, each related to one particular aspect of banks’ activities. The first class reflects their capital structure and solvency profile; the indicators in the second class measure the riskiness and/or exposure of the banks; finally, the third set of indicators covers the profitability/income profile of the DGS members. Eight EU DGS adjust the contributions of all their members, taking into account information obtained by means of indicators (only one scheme adopts an ex-post funded system). Concerning monitoring systems, nine DGS currently monitor the activities of their members, by collecting quantitative and qualitative information on their financial situation and trends. Some of the approaches taken by risk-based schemes to adjust their contributions are quite simple, but others can be more technical. However, a common principle can be seen behind the various adjustment procedures: the contributions are adjusted by decreasing or increasing them by a percentage obtained by classifying DGS members into rating classes, linked to scores from a set of indicators. The variation ranges from a minimum contribution of 75% to a maximum of 140% of the standard amount. Following the recommendation made in the Commission Communication to employ information already available to the schemes, the report also gives details of which data are currently accessible to the schemes and from which sources. Notably, one third of the schemes have access only to data referring to deposits. Around half can retrieve information on financial statements, capital adequacy ratios and

June 2008 Final Report on Risk-Based Contributions 3
risk-weighted assets. Further information, such as full balance sheets, income statements and/or other supervisory reports, is disclosed to only a few schemes. Finally, for comparison, the last part of this report describes the risk-based system applied by the US Federal Deposit Insurance Corporation, where contributions are adjusted by means of both quantitative indicators of the capital structure of the members and qualitative information aggregated by a composite indicator.
June 2008 Final Report on Risk-Based Contributions 4
Table of contents
Executive summary...................................................................................................................................2 List of figures.............................................................................................................................................5 List of tables..............................................................................................................................................5 1. Introduction ...........................................................................................................................................7 2. Overview...............................................................................................................................................9 3. Risk-based systems............................................................................................................................14
3.1 General description....................................................................................................................14 3.2 Technical details ........................................................................................................................18
3.2.1 Germany: Protection scheme of the Association of German Cooperative Banks 18 3.2.2 France: Fonds de Garantie des Dépôts 21 3.2.3 Italy: Interbank Deposit Protection Fund 25 3.2.4 Portugal: Deposit Guarantee Fund and Mutual Agricultural Credit Guarantee Fund 31 3.2.5 Finland: Deposit Guarantee Fund 34 3.2.6 Sweden: Swedish Deposit Guarantee Board 35
3.3 Comparison of the risk-based systems......................................................................................38 4. Monitoring systems .............................................................................................................................42
4.1 Brief description .........................................................................................................................42 4.2 Technical details ........................................................................................................................43
4.2.1 Italy: Deposit Guarantee Fund of Cooperative Credit Banks 43 4.2.2 Austria: Deposit Guarantee Scheme for commercial banks 46 4.2.3 Romania: Deposit Guarantee Fund in the banking system 49
5. US DGS: Risk-based contributions .....................................................................................................52 5.1. Introduction ...............................................................................................................................52 5.2 The risk-based system...............................................................................................................53 5.3 Indicators adopted .....................................................................................................................55
6. Conclusions ........................................................................................................................................59

June 2008 Final Report on Risk-Based Contributions 5
List of figures Figure 1: Possible effect of adjustment βi on contributions.....................................................................15 Figure 2: Range of variation of the contribution collected by the Association of German Cooperative Banks as a function of the contribution base ..........................................................................................20 Figure 3: Flowchart of how contributions are estimated in the French DGS ...........................................22 Figure 4: Linear transformation used by the French DGS to obtain the risk correction from the synthetic risk indicator............................................................................................................................................24 Figure 5: Flowchart of how contributions are estimated in the Italian FITD ............................................26 Figure 6: Curve for the “too big to fail” adjustment..................................................................................28 Figure 7: Range of variation of the amount of contribution for the Portuguese Deposit Guarantee Fund (left axis) and the Mutual Agricultural Credit Guarantee Fund (right axis) as a function of the contribution base ........................................................................................................................................................34 Figure 8: Example of the function U(z) used to correct the contribution on the basis of the capital adequacy ratio z. In this example a = 0.3, b = 17.2 and c = 40...............................................................36 Figure 9: Elasticity of risk-based adjustments country by country ..........................................................40
List of tables Table 1: EU DGS applying a risk-based or monitoring system; n.a. = not available; FS = financial statement; CAR = capital adequacy ratio; RWA = risk-weighted assets; CB = central bank; BSA = banking supervisory authority .................................................................................................................10 Table 2: List of indicators applied by the DGS to adjust their contributions or to monitor the behaviour of their members (RB means a risk-based system, M a monitoring system) ..............................................12 Table 3: Rating classes and corresponding risk adjustments for the Association of German Cooperative Banks......................................................................................................................................................18 Table 4: Ratios applied by the Association of German Cooperative Banks to classify its members and corresponding weights ............................................................................................................................19 Table 5: Example of calculation of contribution for the Association of German Cooperative Banks .......20 Table 6: Ranges for three indicators used to assess the risk of members of the French DGS...............23 Table 7: Ranges for the Operating Ratio (OR) used to assess the risk of members of the French DGS23 Table 8: Definition of the ratios applied by the French DGS ...................................................................23 Table 9: Example of calculation of contribution to the French DGS........................................................24 Table 10: Ratios and thresholds for classification of members of the FITD for each indicator................27 Table 11: Coefficients applied to calculate the aggregate indicator in the FITD system.........................28

June 2008 Final Report on Risk-Based Contributions 6
Table 12: Statutory position ....................................................................................................................29 Table 13: Example of aggregation to obtain the weighted average aggregate indicator ........................29 Table 14: Example of calculation of contribution to the FITD..................................................................31
Table 15: Ranges for the fixed parameter α for the Mutual Agricultural Credit Guarantee Fund ...........32
Table 16: Ranges for the risk-based adjustment βi for the Deposit Guarantee Fund .............................32 Table 17: Example of calculation of contribution to the Portuguese Deposit Guarantee Fund and the Mutual Agricultural Credit Guarantee Fund in 2006................................................................................33 Table 18: Example of calculation of contribution to the Swedish DGS ...................................................38 Table 19: Comparison of available information.......................................................................................41 Table 20: Thresholds for the indicators applied by the Italian DGS for cooperative credit banks ...........44 Table 21: Scores assigned to members of the Italian DGS for cooperative credit banks, depending on their ratios ...............................................................................................................................................44 Table 22: Groups formed by the Austrian DGS for commercial banks in the quarterly assessment of the performance of its members ...................................................................................................................47 Table 23: Indicators and corresponding thresholds applied by the Austrian DGS for commercial banks DGS ........................................................................................................................................................48 Table 24: Thresholds for assigning Pi scores to members of the Romanian DGS; the scores are aggregated using weight Ki .....................................................................................................................50 Table 25: Annual contributions to the Romanian DGS (with S < 7.5), being “r” the standard contribution................................................................................................................................................................50 Table 26: Risk classes ............................................................................................................................54 Table 27: Example of annual contribution for the FDIC .......................................................................... 55 Table 28: Thresholds for the capital ratios to determine capital groups..................................................56 Table 29: Principal factors taken into account to rate the “CAMELS” components.................................57

June 2008 Final Report on Risk-Based Contributions 7
1. Introduction In 2006 the European Commission (EC) completed its review of Directive 94/19/EC on Deposit Guarantee Schemes (DGS). The Commission Communication of November 2006, COM (2006) 7291, raised a number of self-regulatory issues with the aim of improving the functioning of DGS in the EU and defining EC policy on DGS. One of these issues is introduction of risk-based contributions in DGS across the EU on a voluntary basis. The Commission highlighted that introduction of risk-based adjustments to DGS contributions “could be a desirable enhancement to the existing framework and
could facilitate the transferability of contributions between schemes”. In practice, by increasing the contribution for credit institutions that bear more risk and by reducing it for those at less risk, risk-based adjustments would provide an incentive for sound management. Moreover, the Communication highlighted that, in the opinion of some stakeholders, “risk-based schemes could increase the
effectiveness of DGS with regard to their ability to deal with potential failures”. Finally, the Commission recommended that “the determination of risk should be based on already available and harmonised
tools (e.g. such as those within the Capital Requirements Directives framework)2”. This is relevant to all DGS, whether funded “ex-ante” or “ex-post”, since in both cases contributions have to be determined. In the light of the Communication, the Unit of Econometrics and Applied Statistics3 of the EC Joint Research Centre (JRC) was asked to analyse possible methods of incorporating risk-based adjustments to DGS contributions and to investigate approaches to monitor the soundness of DGS members. The project, carried out with the cooperation of a dedicated Working Group of the European Forum of Deposit Insurers4 (EFDI), has been organised into two successive steps. The first was to describe current practices for risk-based contributions in the EU. Based on further discussions within the EFDI, in the second step the JRC will consider proposals for risk-based models and assess the impact of alternative approaches. This report focuses on the first step and describes the risk-based models and monitoring systems applied across the EU MS. The approaches are compared by discussing and classifying which indicators are employed. For risk-based systems, the report describes in detail the ways indicators are used to estimate the contributions. A separate section provides technical details of each risk-based system, including numerical examples of how adjustments are calculated in practice.
1 http://ec.europa.eu/internal_market/bank/guarantee/index_en.htm. 2 Directive 2006/48/EC, OJ L 177, 30.6.2006, p. 1 and Directive 2006/49/EC, OJ L 177, 30.6.2006, p. 201. 3 http://finecon.jrc.it and http://farmweb.jrc.cec.eu.int/ESAF. 4 http://www.efdi.net/; the JRC would like to thank all the EFDI members for their cooperation and, in particular, the Italian FITD for its useful comments.
June 2008 Final Report on Risk-Based Contributions 8
As regards the monitoring systems, although both the quantity and quality of the information available is lower, their main characteristics are outlined and a brief description is given of the action taken as a consequence of the monitoring assessment. Another section of the report describes the US risk-based system and compares it with the methods applied in the EU. The main sources of information for this report, listed separately for each DGS, are the statutes, laws and by-laws governing the DGS along with technical reports publicly available on DGS websites. For the EU MS, some of the information was also collected by two surveys conducted by the JRC and targeting EU DGS in 20065 and 2007. The contents of the report have also been verified with the DGS concerned. The report is organised as follows: Section 2 presents a general overview of risk-based and monitoring systems. In particular, it describes and compares the indicators applied by the schemes, with the ultimate goal of building classes of indicators reflecting different aspects of the financial situation of DGS members. Section 3 focuses on the eight DGS which have adopted a risk-based system to adjust the contributions of all their members. The first part of this section gives a general, non-technical description of how the DGS use indicators to adjust their contributions. A more technical description of each system is given in the second part of Section 3, followed by an attempt at comparison in the last part. Section 4 briefly summarises the information collected on the monitoring systems. Section 5 contains a description of the risk-based system applied in the US. The last section draws conclusions. Annex I provides a table comparing the main characteristics of the risk-based systems and indicating the data necessary for calculating the contributions and the involvement of other competent authorities in gathering data. Annex II presents the questionnaire used for the 2007 survey on risk-based approaches. This report has been circulated to members of the EFDI Working Group to collect their comments and suggestions6. This report is intended to serve as a basis for further discussions. It neither commits the Commission nor limits the Commission’s discretion with regard to any current or future action or policies.
5 The 2006 survey is available at: http://finecon.jrc.ec.europa.eu/projects_deposit_guarantee_schemes.htm. 6 The JRC would like to thank all the members of the EFDI Working Group for their cooperation and fruitful comments.

June 2008 Final Report on Risk-Based Contributions 9
2. Overview Directive 94/19/EC stipulates that the costs of funding DGS should be borne by the members (i.e. the credit institutions), but gives no details of calculation of DGS contributions nor of risk-based information or of monitoring the risks borne by DGS members. Currently few DGS adjust their contributions to take account of risk-based information on their members. A few others have set up a system to monitor their members’ conduct in order to recognise any potential need for intervention, to decide on possible preventive measures or to assess the soundness of the banking system. Table 1 depicts the current situation. As indicated by the “X” in the second column, only eight DGS (DE3, DE4, FR, IT1, PT1, PT2, FI and SE) adjust the contributions of all their members, taking into account information on their risk profile. Among the MS applying a risk-based adjustment, only IT1 adopts an ex-post system. The two DGS marked “X*” (HU and RO) make slightly different use of risk-based information. These DGS do not correct the contributions of every member, but may increase just some of them on the basis of the members’ risk profile. In HU7 the DGS may increase the contribution if a member institution fails to comply with the prescribed capital adequacy ratio and/or pays its required contribution or advance contribution more than 30 days late. In RO8 the Fund is authorised to increase the annual contribution by up to double if the relevant credit institution has engaged in risky and unsound policies. The assessment is made using a rating system based on five indicators provided by the National Bank of Romania (see Section 4.2.3). Romania is in the process of introducing a new risk assessment system, which will probably be finalised in the course of 2008. On the other hand, the Polish system (marked “X**” in Table 1) does not adjust contributions using risk-based indicators, but the contribution base includes risk-related variables, such as risk-weighted total balance-sheet assets, guarantees and endorsements and the remaining risk-weighted off-balance sheet liabilities. The third column in Table 1 lists the ten DGS monitoring the conduct of their members (DE49, IT2, the five DGS in AT, PL and RO). In most cases, the DGS make use of quantitative information on the financial health of their members in order, for instance, to forecast possible interventions, prevent banking crises or impose sanctions on members involved in risky activities. Currently, little information is available on most of the monitoring systems.
7 See Section 121(6) of Act CXII of 1996 on Credit Institutions and Financial Enterprises, available at: http://www.oba.hu/. 8 See Article 9(5) of Government Ordinance No 39/1996 on the establishment and functioning of the Deposit Guarantee Fund in the banking system, republished, as subsequently amended and supplemented. 9 DE4 did not reply to the survey. The information on an active risk-based monitoring system is from the 2006 survey.

June 2008 Final Report on Risk-Based Contributions 10
Table 1: EU DGS applying a risk-based or monitoring system; n.a. = not available; FS = financial statement; CAR = capital adequacy ratio; RWA = risk-weighted assets; CB = central bank; BSA = banking supervisory authority
Risk
-bas
ed
syst
em
Moni
torin
g sy
stem
Data available to DGS Data sources
BE Total and eligible deposits DGS members BG Total, eligible and covered deposits DGS members and CB CZ Eligible deposits CB DK Total and covered deposits n.a.
DE1 X Total deposits and financial statement BSA, CB and DGS members
DE2 n.a. n.a. n.a. n.a.
DE3 X X Total, eligible and covered deposits, FS and primarily lending to customers Regional auditing assoc.
DE4 X n.a. n.a. EE Total, eligible and covered deposits, FS, CAR and RWA CB GR Total and eligible deposits DGS members ES1 Eligible deposits CB ES2 Eligible deposits CB ES3 Eligible deposits CB FR X The CB calculates the contribution to be collected BSA IE Total deposits, FS, CAR and RWA CB and BSA IT1 X Total, eligible and covered deposits. Information for the indicators CB
IT2 X Contribution base + 20% of deposits + 40% of cash loans – 40% of supervisory capital n.a.
CY1 Total, eligible and covered deposits, FS, CAR and RWA CB CY2 Total, eligible and covered deposits, FS, CAR and RWA DGS members LV Eligible and covered deposits, FS, CAR and RWA DGS members and CB
LT Eligible and covered deposits, CAR, RWA, balance sheet, income statement and capital adequacy report DGS members
LU Covered deposits BSA HU X* Total, eligible and covered deposits. Balance sheet DGS members and BSA MT Total and eligible deposits BSA NL Total deposits, CAR and RWA DGS members
AT1 X Total, eligible and covered deposits, CAR, RWA, balance sheet, external auditor’s yearly report and report from BSA CB
AT2 X Total and covered deposits, CAR, RWA, FS and monthly records DGS members and BSA AT3 X Total and covered deposits, CAR, RWA, FS and monthly records DGS members and BSA AT4 X Total and covered deposits, CAR, RWA, FS and monthly records DGS members and BSA
AT5 X Total, eligible and covered deposits, CAR, RWA, balance sheet, profit and loss accounts, external auditor’s report and report from BSA
CB
PL X** X Total, eligible and covered deposits, CAR, RWA and FS DGS members and CB PT1 X Total, eligible and covered deposits, CAR and RWA DGS members and BSA PT2 X Total and eligible deposits, CAR and RWA DGS members RO X* X Total, eligible and covered deposits, CAR and RWA DGS members and CB
SI Total, eligible and covered deposits, CAR, RWA, FS and all supervisory reports DGS members and CB
SK Total and eligible deposits DGS members and CB FI X Total, eligible and covered deposits and RWA DGS members SE X Total and covered deposits, CAR and FS DGS members and BSA UK Covered deposits n.a.
Source: 2007 survey data.

June 2008 Final Report on Risk-Based Contributions 11
In order to understand the current practices of EU MS and to gain a picture of the data currently available to each DGS, the fourth column of the table lists all the information available to DGS, including data not used for estimating DGS contributions. The situation is extremely heterogeneous, ranging from DGS with (often incomplete) information on deposits only (BE, BG, CZ, DK, GR, ES, LU, MT, SK and UK) to countries where all supervisory reports are available to the DGS (SI). The last column lists the authority/entity responsible for providing data to the DGS. DGS adjusting their contribution on the basis of risk-based information or monitoring the riskiness of their members adopt one or more indicators with the aim of establishing the banks’ profile. The indicators applied in the MS are generally built around ratios using balance-sheet data and/or financial statement data and/or other types of accounting data. The ratios applied are currently fairly heterogeneous, resulting in wide fragmentation of the information employed. In order to form classes of indicators, it is necessary to relax the definitions of the ratios used by the various DGS to identify the different aspects of bank conduct that the ratios aim to assess. In this way, indicators can be clustered into three main classes10, each describing a particular profile to be assessed. The first class reflects the capital structure and/or solvency profile of the DGS members, the second measures the riskiness and/or exposure of the banks and the third covers their profitability/income profile. Moreover, the French DGS also applies an indicator characterizing the maturity of the instruments in the portfolio of the DGS members. A similar indicator was also used in Italy up to 2006. Table 2 shows, for each class of indicator (first column), the definition of the ratios (second column) and the DGS applying them (third column) and, finally, specifies whether the scheme uses the ratio to monitor its members (M) or to make a risk-based adjustment of contributions (RB). The table clearly shows that the variables included in the definitions can be rather different from one DGS to another. A significant improvement towards reducing the heterogeneity of the indicators could be achieved by using common accounting standards, such as the International Accounting Standards (IAS), since a large proportion of the variables listed in Table 2 are linked to data managed, stored and published by members themselves based on these standards11.
10 The JRC would like to thank the Italian Interbank Deposit Protection Fund for the fruitful discussion on the classification of the indicators. 11 Regulation (EC) No 1606/2002 states that: “This Regulation has as its objective the adoption and use of international accounting standards in the Community with a view to harmonising the financial information presented by the companies referred to in Article 4 in order to ensure a high degree of transparency and comparability of financial statements and hence an efficient functioning of the Community capital market and of the Internal Market.”

June 2008 Final Report on Risk-Based Contributions 12
Table 2: List of indicators applied by the DGS to adjust their contributions or to monitor the behaviour of their members (RB means a risk-based system, M a monitoring system)
Class Indicator Country Type of system
assets Total capital Retained DE3 RB
assets weighted-Risk Capital - ITier DE3 RB
itemssheet balance-Off Assetsclaims edSubordinat -holdingsEquity - fundsOwn
+ FR RB
tsrequiremen capitaly Supervisorcapitaly Supervisor IT1 RB
capitaly Supervisorpurposesy supervisorfor Capital IT2 M
customers) (ordinary Fundingsliabilitie edSubordinat
) provisions lossesloan (including reserves and Capital+ IT2 M
deposits RepayableTier1 AT1 M
12.5 tsrequiremen Capital fundsOwn
⋅ PT RB
items)sheet balance -off (including assets weighted-RiskfundsOwn RO M
Capital structure/ Solvency profile
fundsown edconsolidat ofamount Totalrisk cover tofundsown edconsolidat ofamount Total FI RB
capital Retained loans primenot ofportion Unsecured DE3 RB
sadjustmentrisk before Earnings loans primenot ofportion Unsecured DE3 RB
umecredit volClient sector business a toumecredit volLargest DE3 RB
fundsOwn exposures eligible -nonlargest 10 of Sum FR RB
loans edSubordinat equity rs'Shareholdeloans performing -Non
+ IT1 RB
reserves and Capital lossesloan Net IT2 M
loans gOutstandin lossesloan Net IT2 M
EarningsRisk AT1 M
Riskiness/ Exposure
equivalentRisk Risk AT1 M

June 2008 Final Report on Risk-Based Contributions 13
Class Indicator Country Type of system
sinvestmentinterbank loans Total loss) and doubtful d(classifie
sinvestment interbank and loans torelated exposure Unadjusted
+ RO M
valuekeeping -bookat assets Totalassets weighted-Risk RO M
volumebusiness Average losses tradinged Unrealis- income Operating DE3 RB
profits Gross expensesadmin and Personnel DE3 RB
profits Gross businesscredit ofresult risk Net DE3 RB
operationsbank from charges-incomeother operationsbank from Income
provisionsnet provisionson depreciatiOverheads+
++ FR RB
income Gross expenses Operating IT1 RB
taxbeforeProfit )recoveries of(net lossesLoan IT1 RB
incomeNet expenses tiveadministra and General IT2 M
income Gross)recoveries of(net lossesLoan IT2 M
EarningsCost AT1 M
Tier1profitNet AT1 M
Profitability/ Income
expense Provisions - operations from Expenseprovisions from Income - income Operations RO M
Source: 2007 survey data.

June 2008 Final Report on Risk-Based Contributions 14
3. Risk-based systems 3.1 General description Typically, in the DGS which adjust their contributions using risk-based information about their members, the annual contribution for each bank (ci) is defined in terms of a contribution base (xi), usually the total
amount of eligible or covered deposits, plus or minus a percentage (βi) proportional to the risk attitude
of the members and a percentage (α) reflecting the overall conditions in the banking system in the
country:
iii xc αβ= . (1)
Coefficient α is often set in the statutes or by-laws governing the DGS and/or revised on a regular basis
by the board of the scheme, for instance to reflect any improvement or deterioration in the soundness of
the banking sector and consequent need to increase or decrease the resources collected. Coefficient α
is equal for all DGS members, irrespective of their risk profiles, and is designed to set the aggregate contributions required to face potential crises.
On the other hand, coefficient βi explicitly takes into account the riskiness of the members of the DGS: a
lower risk leads to a lower contribution and a higher risk to a higher one. βi is determined using the
indicators described in the previous section to rate the DGS members into risk classes, each
corresponding to a different adjustment βi. Figure 1 plots the most common effect of adjustment βi: for a
given contribution base (x axis), instead of having a single value for the contribution (y axis), there are a range of values depending on the percentage increase/decrease applied. For instance, for a contribution base of around €68bn, the contributions range from around €15m to around €25m. In the
case of a sound bank, coefficient βi will be low, thus producing a contribution of €15m; conversely, in
the case of a member classified as very risky, the contribution will be close to the maximum of €25m. Among the DGS applying a risk-based adjustment to their contribution, DE3, PT1, PT2 and FI apply exactly the model presented above. With some slight adjustments, the same principles can be found behind the systems applied in FR, IT and SE, despite the fact that their approaches are more technical and sophisticated. The remainder of this section describes all these systems in general terms. A more technical description of each of them follows in Section 3.2.

June 2008 Final Report on Risk-Based Contributions 15
Figure 1: Possible effect of adjustment βi on contributions
In the German scheme protecting cooperative banks (DE3) the contribution base xi is defined on the basis of the lending to customers and contingent liabilities resulting from collateral and guarantee
agreements. Coefficient βI ranges from 90% to 140%. The adjustments are based on classifying the
scheme members into eight rating classes which reflect their financial standing based on eight key indicators. The classification method relies on quantitative ratios taken primarily from the banks’ audited annual financial statements and audit reports; in particular, two ratios relate to the capital structure/solvency of the members, three to their risk structure and the last three to their
income/profitability profile (see also Table 2). Coefficient α is equal for all DGS members; in DE3 it can
vary between 0.05% and 0.2%. The are two DGS in Portugal, one protecting mutual agricultural credit institutions (FGCAM) in the Integrated Mutual Agricultural Credit System (SICAM), the other insuring all other types of credit institutions authorised to receive deposits (Deposit Guarantee Fund, DGF): both adopt almost the same system for calculating their members’ contributions. The annual contribution from each member is calculated as a percentage of its contribution base, defined as the average monthly eligible deposits over the previous year (deposits at the end of each month)12. Both DGS obtain the risk-based adjustment by classifying their members into five different risk classes, depending on their solvency
ratio. Each class corresponds to a different risk-based adjustment βi, ranging from a maximum
reduction to 80% to a maximum increase to 120%. The fixed rate α differs between the two schemes: in
12 Deposits denominated in foreign currency must be converted into euros at the exchange rate prevailing on the last working day of the month.

June 2008 Final Report on Risk-Based Contributions 16
the Deposit Guarantee Fund it is set by an instruction from the Banco de Portugal, at up to 0.2% on an annual basis13; in the Mutual Agricultural Credit Guarantee Fund it depends on the total funds and eligible deposits in the previous year. Another similar approach is the Finnish scheme, in which the contribution base xi is the amount of
covered deposits, the fixed percentage α is 0.175% and the risk-based adjustment βi is the ratio
between the minimum consolidated own funds required to cover risks and the actual consolidated own funds. A slightly different approach is followed in France, where the system is based on annual collection of a set amount (€150m for 2003-2006). This amount is apportioned to the DGS members in proportion to their contribution base corrected by a risk factor. The contribution base takes account of the total eligible deposits and of a fraction of the outstanding loans of the member, when relevant. The risk adjustment increases or decreases the contribution base from a minimum of 75% to a maximum of 125%, depending on four risk indicators which reflect the financial situation of the DGS members. For the
purposes of Equation (1), the values of βi range from 75% to 125%, whereas general adjustment α is
not applied directly since the total amount of money to be collected is set in advance. The indicators
used to obtain βi include a solvency indicator, a riskiness indicator, a profitability indicator and an
indicator based on the maturity of the assets in the members’ portfolios. Depending on the values of the
indicators, each member is assigned a set of scores whose average value determines βi.
Also in one of the Italian DGS (the Interbank Deposit Protection Fund) any contributions (the scheme is ex-post funded) are obtained by an approach somewhat differing from Equation (1). The amount of resources to be collected is divided between the DGS members on the basis of “proportional quotas”: these are defined as 1 000 times the ratio of each member’s covered deposits over the aggregate deposits insured by the whole scheme. The term “proportional quota” reflects the goal of measuring the relative weight of each member in the scheme itself. The proportional quotas are corrected twice in order to include information on the size of the members and on their profile. The first adjustment is a regressive correction, based on the “too big to fail”14 approach, which increases/decreases a member’s contribution by a percentage inversely linked to the size of the bank. Under this mechanism, the biggest banks benefit from a reduction in their proportional quota (the amount of which is divided between the banks with a lower contribution base), whereas the smallest suffer from an increase. The percentage of the increase or decrease in the proportional quotas varies from +7.5% to -7.5%. The second adjustment is based on a set of indicators, including a riskiness profile ratio, a solvency ratio and two profitability profile ratios. Depending on the values of the ratios, members are assigned a series of scores which
13 For 2006, an annual rate of 0.03% was applied. 14 Under the “too big to fail” principle, the biggest banks are considered less risky than the others, because the competent authority would act to avoid any failure which would undermine the stability of the financial market.

June 2008 Final Report on Risk-Based Contributions 17
provide a basis for their classification. To correct contributions, three observations of each ratio (one every six months) are aggregated in order to obtain a single indicator for each member, reflecting its overall risk attitude. Depending on the value of their aggregate indicator, members’ proportional quotas are either increased in proportion to their risk indicators or left unchanged or decreased to counter-balance the higher contributions. The mechanism applied in Sweden is somewhat different from the others since it uses a mathematical
model to determine the risk-based coefficients βi. However, it could be reduced to a version similar to
the one described by Equation (1) by making a few technical adjustments. As in France, the scheme collects from members an aggregate annual contribution set at between 0.1% and 0.3% of the amount of covered deposits by the DGS. The aggregate contribution is divided between the DGS members using a mathematical model in which the main input variable is the capital adequacy ratios of the DGS members and the relative amount of covered deposits. In this model higher ratios lead to lower contributions and vice versa. The Swedish DGS is currently revising its method for adjusting contributions; a new system is expected to be adopted in 2009 at the latest.

June 2008 Final Report on Risk-Based Contributions 18
3.2 Technical details
3.2.1 Germany: Protection scheme of the Association of German Cooperative Banks The Association of German Cooperative Banks introduced the current contributions system (DE3) in 2002/2003 when it developed a classification process aimed at identifying, at an early stage, any economically undesirable behaviour by any individual member bank. Using this system, the scheme has applied its independent management for preventive intervention. Thanks also to this tool, the scheme has avoided any failure amongst its members since 1934: it must be remarked that it is an institutional protection scheme, whose main institutional aim is to protect members, and this action automatically provides the coverage of depositors indicated by Directive 94/19/EC. To finance preventive intervention, annual contributions are collected, defined as a set percentage of the contributions base xi which is determined by the lending to customers and contingent liabilities resulting from collateral and guarantee agreements (see Articles 4(1) and 4(2) of the statutes). The
procedure for adjusting the contribution follows Equation (1), where the adjustment coefficient βi is a
risk-based percentage ranging from 90% to 140%. The value of βi is assigned to each bank in
accordance with a rating ranging from A+ to D. The contributions of the DGS members in the first two classes (A+ and A) are decreased, whereas for members in classes A-, B+ and B the contributions remain unchanged and, finally, for the last three classes (B-, C and D) the contributions are increased: the lower the rating, the higher the increase, as illustrated in Table 3.
Table 3: Rating classes and corresponding risk adjustments for the Association of German Cooperative Banks
Rating classes A+, A A-, B+, B B- C D
βi 90% 100% 110% 120% 140%
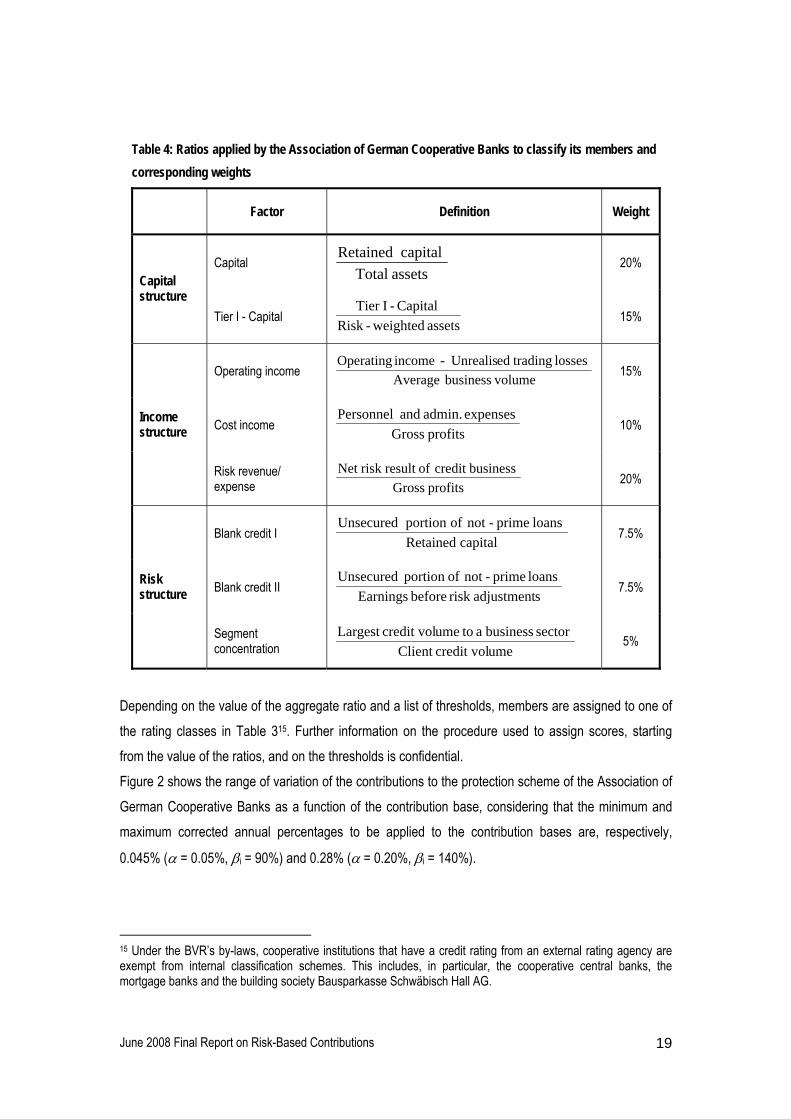
In order to categorise members into the above-mentioned rating classes, the system uses eight ratios, which cover the capital structure of the members, their income and their risk structure. The ratios are described in Table 4. These ratios are used to assign each member a score for each indicator. The scores are subsequently aggregated, applying the weightings indicated in the last column of the table. The two capital structure ratios account for 35% of the total, the three ratios relating to income for 45% and the remaining 20% is covered by the three ratios reflecting the risk structure of the DGS members.
June 2008 Final Report on Risk-Based Contributions 19
Table 4: Ratios applied by the Association of German Cooperative Banks to classify its members and corresponding weights
Factor Definition Weight
Capital assetsTotal
capital Retained 20% Capital structure
Tier I - Capital assets weighted-Risk Capital - ITier 15%
Operating income volumebusiness Average losses tradinged Unrealis- income Operating 15%
Cost income profits Gross expenses admin. and Personnel 10% Income
structure
Risk revenue/ expense profits Gross
businesscredit ofresult risk Net 20%
Blank credit I capital Retained loans prime-not ofportion Unsecured 7.5%
Blank credit II sadjustmentrisk before Earnings loans prime-not ofportion Unsecured 7.5% Risk
structure
Segment concentration umecredit volClient
sector business a toumecredit volLargest 5%
Depending on the value of the aggregate ratio and a list of thresholds, members are assigned to one of the rating classes in Table 315. Further information on the procedure used to assign scores, starting from the value of the ratios, and on the thresholds is confidential. Figure 2 shows the range of variation of the contributions to the protection scheme of the Association of German Cooperative Banks as a function of the contribution base, considering that the minimum and maximum corrected annual percentages to be applied to the contribution bases are, respectively,
0.045% (α = 0.05%, βi = 90%) and 0.28% (α = 0.20%, βi = 140%).
15 Under the BVR’s by-laws, cooperative institutions that have a credit rating from an external rating agency are exempt from internal classification schemes. This includes, in particular, the cooperative central banks, the mortgage banks and the building society Bausparkasse Schwäbisch Hall AG.

June 2008 Final Report on Risk-Based Contributions 20
0
50
100
150
200
250
300
10 20 30 40 50 60 70 80 90 100
Contribution Base (b€)
Con
tribu
tion
Ran
ge (m
€)
Figure 2: Range of variation of the contribution collected by the Association of German Cooperative Banks as a function of the contribution base
Table 5 presents an example illustrating the range of variation of the contributions when fixing
parameter α and considering possible values of factor βi. In this example the contribution base is €50bn
and α is 0.125%, which was the value adopted by the scheme in 2007.
Table 5: Example of calculation of contribution for the Association of German Cooperative Banks
Rating classes xi (b€) α β Contribution (m€)
Member 1 D 50 0.125% 140% 87.5 Member 2 C 50 0.125% 120% 75 Member 3 B- 50 0.125% 110% 68.75 Member 4 A-, B+,B 50 0.125% 100% 62.5 Member 5 A+, A 50 0.125% 90% 56.25
The results of the internal rating process provide an early-warning indicator, which the protection scheme uses as the principal tool for deciding on preventive support to members. In the past, this process has proved a powerful instrument for identifying banks that could expose the protection scheme to a higher risk. In practice, so far the banks given an A+ rating have demonstrated the lowest probability of requiring a rescue and those given a D rating the highest. Data sources and competent authorities Data on the ratio are automatically supplied to the protection scheme in electronic form by the regional audit associations responsible for the individual member banks.

June 2008 Final Report on Risk-Based Contributions 21
Sources 1) Bundesverband der Deutschen Volksbanken und Raiffeisenbanken, Association of German Cooperative Banks, Rating as a basis for prevention and a risk-adjusted contribution, Second EFDI bi-annual meeting, Padua, 8 November 2004. 2) Consolidated Annual Accounts of the Cooperative Financial Services Network, 2004. 3) Statute of the Protection Scheme, Bundesverband der Deutschen Volksbanken und Raiffeisenbanken (BVR), Association of German Cooperative Banks, available at: http://www.bvr.coop/coop/download/StatueoftheProtectionScheme_final.pdf.
3.2.2 France: Fonds de Garantie des Dépôts The French DGS has been adjusting contributions to take account of risk-based information ever since it was established in 1999. The contribution (ci) is calculated by multiplying the total amount of funds to be collected by the scheme (Overall Amount of Contribution, OAC, decided by the government) by the so called Net Share of Risk (NSR), which indicates the relative weight of each member in terms of its contribution base, adjusted by two risk factors:
iic NSROAC ⋅= ,
where i indicates the DGS members. The first adjustment corrects the contribution base to take account of the outstanding loans; the second is based on a set of indicators of different profiles of the member’s conduct. The NSR is defined as the normalised Net Risk Amount (NRAi):
⎟⎟⎠
⎞⎜⎜⎝
⎛∑
=
jj
ii
NRA
NRANSR , (2)
where j sums up all the DGS members. Thus, the net share of risk gives the percentage to be paid by each member in order to collect the fixed amount decided by the government (currently €150m). Figure 3 shows, in flowchart form, how the contribution is obtained. First, for each bank the system estimates the NRA using the adjusted contribution base and the indicators (lefthand side of the flowchart); then, the NRAs of the members are combined using Equation (2) in order to obtain the NSR. Finally, the contribution is calculated by multiplying the NSR by the OAC.

June 2008 Final Report on Risk-Based Contributions 22
Figure 3: Flowchart of how contributions are estimated in the French DGS In particular, the net risk amount is defined as:
iiii x βγ )(NRA += , (3)
where xi is the amount of eligible deposits, γi is a gross risk indicator and βi is a risk factor.
The gross risk indicator increases the contribution base to take account of the outstanding loans of each member:
γi = min {1/3 outstanding loans, contribution base}.
It is clear that at most the contribution base is doubled.
The risk factor (βi) varies between 75% and 125% and is estimated by linear transformation (see Figure
4) of another variable, ρi, describing the overall conduct of the DGS members via a set of four
indicators. In particular, variable ρi, known as the synthetic risk indicator, is defined as the average of
four scores, each covering a different aspect of DGS behaviour:
[ ])4()3()2()1(41
iiiii ρρρρρ +++= .
Each ρi(j) (j = 1, 2, 3, 4) is a score equal to 1, 2 or 3 indicating the quality of the DGS members: the
higher the score, the lower the quality. More specifically, ρi(1) is a solvency indicator, ρi(2) is a risk
diversification indicator, ρi(3) is an operating profitability indicator16 and ρi(4) is a maturity transformation
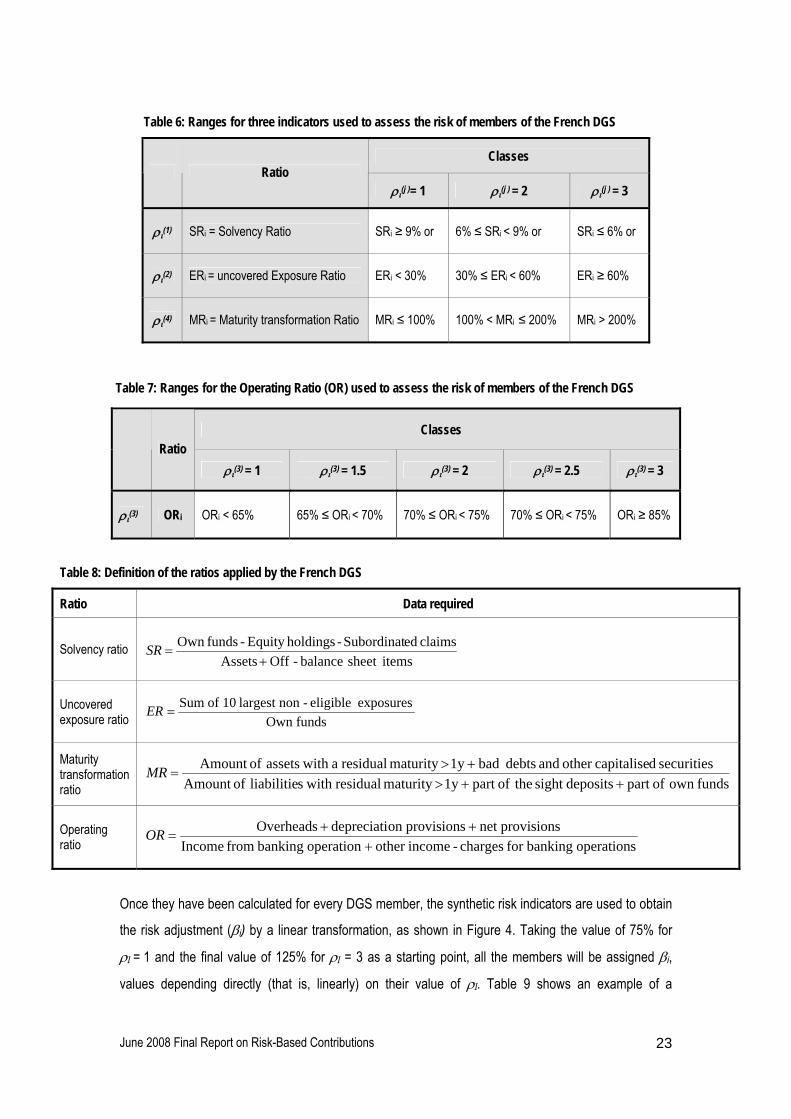
indicator. Table 6 and Table 7 explain how the scores to be assigned to each member are determined from four ratios and a series of thresholds. The ratios used by the French DGS are listed in Table 8.
16 The maturity transformation indicator has to be included only for members for which the assets and liabilities used to calculate the indicator account for at least 20% of their total assets.
June 2008 Final Report on Risk-Based Contributions 23
Table 6: Ranges for three indicators used to assess the risk of members of the French DGS
Classes Ratio
ρι(j )= 1 ρι(j ) = 2 ρι(j ) = 3
ρι(1) SRi = Solvency Ratio SRi ≥ 9% or 6% ≤ SRi < 9% or SRi ≤ 6% or
ρι(2) ERi = uncovered Exposure Ratio ERi < 30% 30% ≤ ERi < 60% ERi ≥ 60%
ρι(4) MRi = Maturity transformation Ratio MRi ≤ 100% 100% < MRi ≤ 200% MRi > 200%
Table 7: Ranges for the Operating Ratio (OR) used to assess the risk of members of the French DGS
Classes Ratio
ρι(3) = 1 ρι(3) = 1.5 ρι(3) = 2 ρι(3) = 2.5 ρι(3) = 3
ρι(3) ORi ORi < 65% 65% ≤ ORi < 70% 70% ≤ ORi < 75% 70% ≤ ORi < 75% ORi ≥ 85%
Table 8: Definition of the ratios applied by the French DGS
Ratio Data required
Solvency ratio itemssheet balance -Off Assets
claims edSubordinat -holdingsEquity - fundsOwn +
=SR
Uncovered exposure ratio fundsOwn
exposures eligible -non largest 10 of Sum=ER
Maturity transformation ratio fundsown ofpart depositssight theofpart 1y maturity residual with sliabilitie ofAmount
securities dcapitaliseother and debts bad 1y maturity residual a with assets ofAmount ++>
+>=MR
Operating ratio operations bankingfor charges-incomeother operation banking from Income
provisionsnet provisionson depreciatiOverheads+
++=OR
Once they have been calculated for every DGS member, the synthetic risk indicators are used to obtain
the risk adjustment (βi) by a linear transformation, as shown in Figure 4. Taking the value of 75% for
ρI = 1 and the final value of 125% for ρI = 3 as a starting point, all the members will be assigned βi,
values depending directly (that is, linearly) on their value of ρI. Table 9 shows an example of a
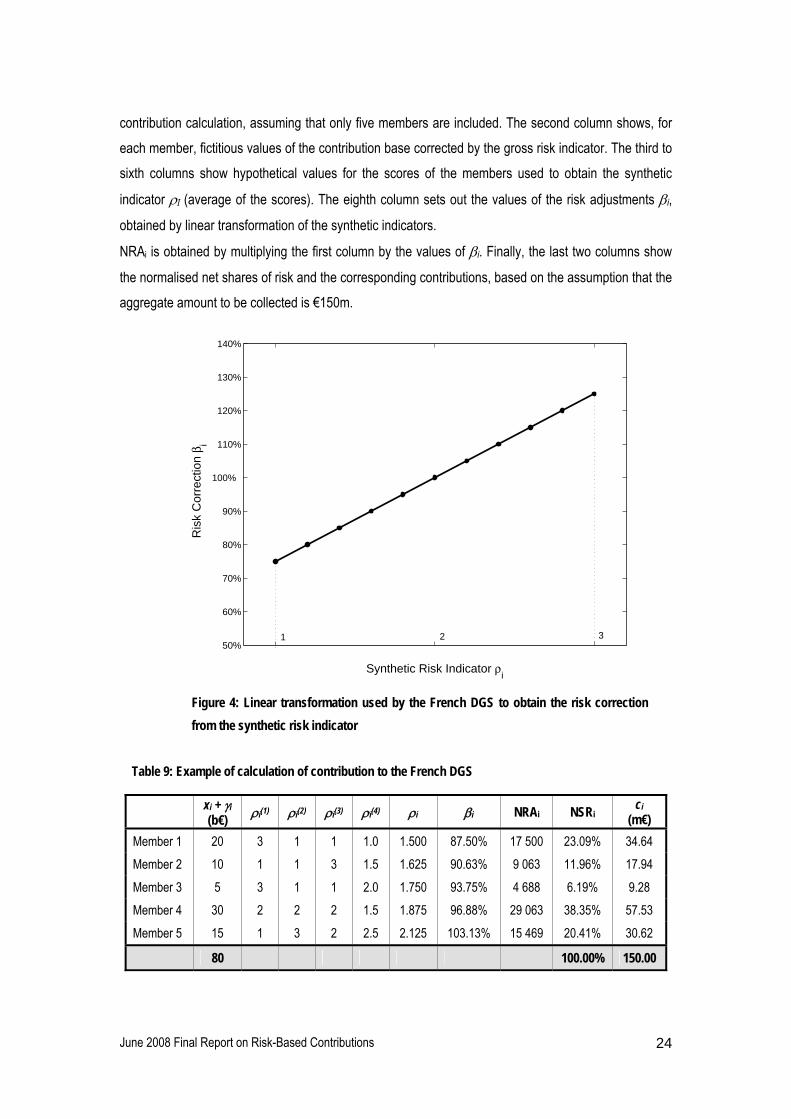
June 2008 Final Report on Risk-Based Contributions 24
contribution calculation, assuming that only five members are included. The second column shows, for each member, fictitious values of the contribution base corrected by the gross risk indicator. The third to sixth columns show hypothetical values for the scores of the members used to obtain the synthetic
indicator ρI (average of the scores). The eighth column sets out the values of the risk adjustments βi,
obtained by linear transformation of the synthetic indicators.
NRAi is obtained by multiplying the first column by the values of βi. Finally, the last two columns show
the normalised net shares of risk and the corresponding contributions, based on the assumption that the aggregate amount to be collected is €150m.
50%
60%
70%
80%
90%
100%
110%
120%
130%
140%
Synthetic Risk Indicator ρi
Ris
k C
orre
ctio
n β i
1 3 2
Figure 4: Linear transformation used by the French DGS to obtain the risk correction from the synthetic risk indicator
Table 9: Example of calculation of contribution to the French DGS
xi + γi (b€) ρi(1) ρi(2) ρi(3) ρi(4) ρi βi NRAi NSRi ci
(m€) Member 1 20 3 1 1 1.0 1.500 87.50% 17 500 23.09% 34.64 Member 2 10 1 1 3 1.5 1.625 90.63% 9 063 11.96% 17.94 Member 3 5 3 1 1 2.0 1.750 93.75% 4 688 6.19% 9.28 Member 4 30 2 2 2 1.5 1.875 96.88% 29 063 38.35% 57.53 Member 5 15 1 3 2 2.5 2.125 103.13% 15 469 20.41% 30.62
80 100.00% 150.00

June 2008 Final Report on Risk-Based Contributions 25
Data sources and competent authorities Yearly contributions are not calculated by the DGS but directly by the banking supervisory authority.
Sources 1) Regulation 99-06 of 9 July 1999 relating to the resources and operation of the deposit guarantee fund, as amended by Regulation 2000-07 of 6 September 2000. 2) Regulation CRBF No 2002-12 of 21 November 2002. 3) Regulation 91-05 of 15 February 1991 relating to the solvency ratio. 4) Regulation 95–02 of 21 July 1995 relating to prudential monitoring of market risks.
3.2.3 Italy: Interbank Deposit Protection Fund The Interbank Deposit Protection Fund (FITD, Fondo Interbancario di Tutela dei Depositanti) is the only scheme in the EU which is ex-post funded and adopts a risk-based system. Besides the potential amount necessary to cover interventions, the Fund collects a small annual contribution to cover the administrative expenses of managing the scheme. Risk-based contributions were set up when the scheme was established in 1987. The statutes of the scheme itself provide for establishment of a virtual fund which varies between 0.4% and 0.8% of the total covered deposits by the scheme. As mentioned earlier, the contribution base is defined in terms of the amount of covered deposits xi, which is used to obtain the “proportional quotas” qi for each member:
0001⋅∑
=
ii
ii x
xq .
Proportional quotas reflect the relative weight of each member in terms of covered deposits. As shown in Figure 5, in order to estimate contributions the proportional quotas are adjusted twice: first the size of the members is considered in order to obtain the “regressive quotas”, then the final “contribution quotas” are calculated using a set of weighted indicators at different points in time (the WAAI, Weighted Average Aggregated Indicator).

June 2008 Final Report on Risk-Based Contributions 26
Figure 5: Flowchart of how contributions are estimated in the Italian FITD
The FITD constantly monitors the overall situation of all its member banks with the aid of a balance-sheet indicators system, consisting of four ratios referring to three profiles: risk, solvency and profitability. 1) Risk profile: balance-sheet ratio A1 measures the capacity of a bank to face possible losses without
becoming insolvent. Indicator A1 is defined as follows:
loans edSubordinat losses)loan of estimate (includingequity rs'Shareholdeloans performing-Non A1
+=
The amount of non-performing loans (numerator of A1) is calculated net of the estimate for doubtful results.
2) Solvency profile: the aim of indicator B1 is to provide a measure of the bank’s capital, reflecting the minimum supervisory capital requirements for development of its banking activity:
tsrequiremen capitaly Supervisorcapitaly Supervisor B1=
3) Profitability profile: the third profile consists of two ratios based on the financial statement. Indicator D1 underlines one aspect of the ordinary activity of the bank, while indicator D2 measures the impact of loan losses on profit before tax:
income Gross expenses Operating1 =D ,
taxbeforeProfit )recoveries of(net lossesLoan 2 =D
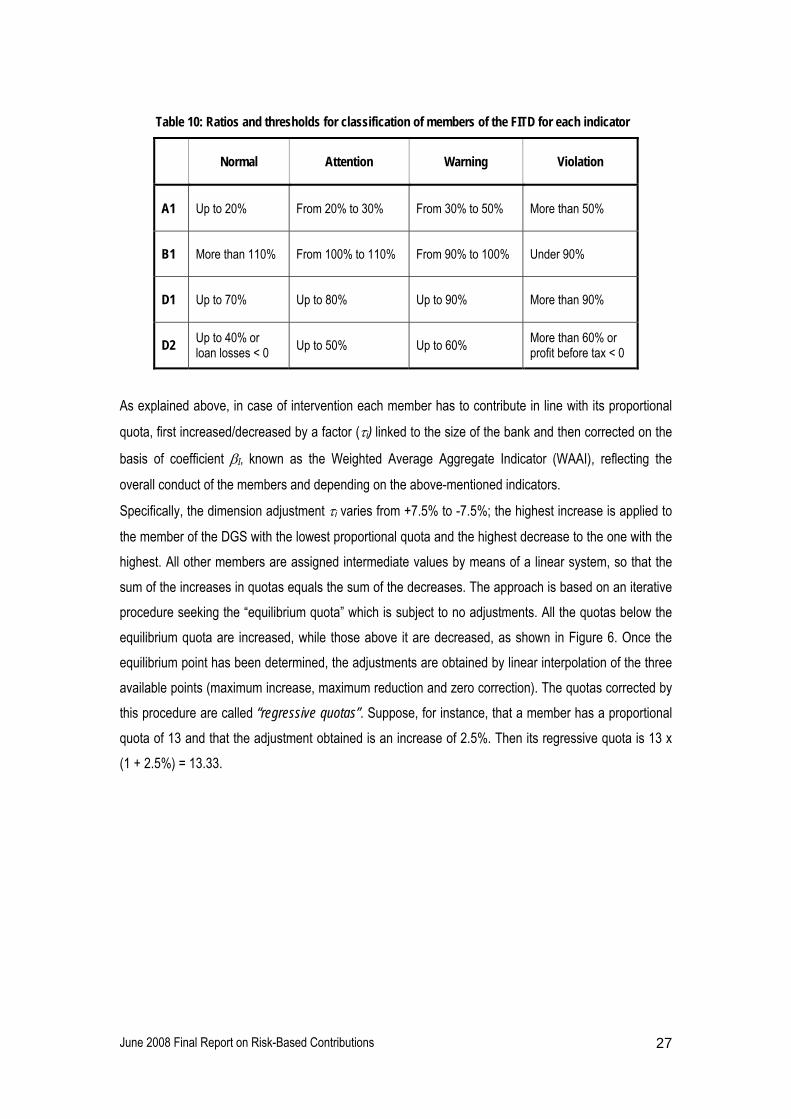
Three thresholds are set per indicator, as shown in Table 10. Depending on the value of the ratio, the behaviour of the member is classified as “Normal”, “Attention”, “Warning” or “Violation”17. 17 Member banks whose balance-sheet indicators are in the “Violation” class are liable to the following sanctions: 1) increase in the quotas paid both for contributions and for operating expenses; 2) other financial and administrative sanctions, from suspension of voting rights to exclusion from the Fund (the latter is subject to authorisation by the Bank of Italy).
June 2008 Final Report on Risk-Based Contributions 27
Table 10: Ratios and thresholds for classification of members of the FITD for each indicator
Normal Attention Warning Violation
A1 Up to 20% From 20% to 30% From 30% to 50% More than 50%
B1 More than 110% From 100% to 110% From 90% to 100% Under 90%
D1 Up to 70% Up to 80% Up to 90% More than 90%
D2 Up to 40% or loan losses < 0 Up to 50% Up to 60% More than 60% or
profit before tax < 0
As explained above, in case of intervention each member has to contribute in line with its proportional
quota, first increased/decreased by a factor (τi) linked to the size of the bank and then corrected on the
basis of coefficient βI, known as the Weighted Average Aggregate Indicator (WAAI), reflecting the
overall conduct of the members and depending on the above-mentioned indicators.
Specifically, the dimension adjustment τi varies from +7.5% to -7.5%; the highest increase is applied to
the member of the DGS with the lowest proportional quota and the highest decrease to the one with the highest. All other members are assigned intermediate values by means of a linear system, so that the sum of the increases in quotas equals the sum of the decreases. The approach is based on an iterative procedure seeking the “equilibrium quota” which is subject to no adjustments. All the quotas below the equilibrium quota are increased, while those above it are decreased, as shown in Figure 6. Once the equilibrium point has been determined, the adjustments are obtained by linear interpolation of the three available points (maximum increase, maximum reduction and zero correction). The quotas corrected by this procedure are called “regressive quotas”. Suppose, for instance, that a member has a proportional quota of 13 and that the adjustment obtained is an increase of 2.5%. Then its regressive quota is 13 x (1 + 2.5%) = 13.33.

June 2008 Final Report on Risk-Based Contributions 28
0 10 20 30 40 50 60 70 80 90−8%
−6%
−4%
−2%
0
2%
4%
6%
8%
Proportional Quota (in thousands)
Cor
rect
ion
−7.5%
+7.5%
Equilibrium quota
Figure 6: Curve for the “too big to fail” adjustment
The regressive quotas are further corrected to take account of the ratios described in the previous section as follows: Depending on the values of their ratios, members are assigned a series of scores, as described in Table 11. The sum of the scores of each member gives the Aggregate Indicator (AI). For instance, for a member with A1 = 0, B1 = 1, D1 = 1 and D2 = 0, the aggregate indicator is AI = 2. The aggregate indicator makes it possible to assign each member to a class reflecting its overall risk
behaviour, called its “statutory position”, as shown in Table 12.
Table 11: Coefficients applied to calculate the aggregate indicator in the FITD system
Class A1 B1 D1 D2
Normal 0 0 0 0
Attention 2 1 1 1
Warning 4 2 2 2
Violation 8 4 4 4
June 2008 Final Report on Risk-Based Contributions 29
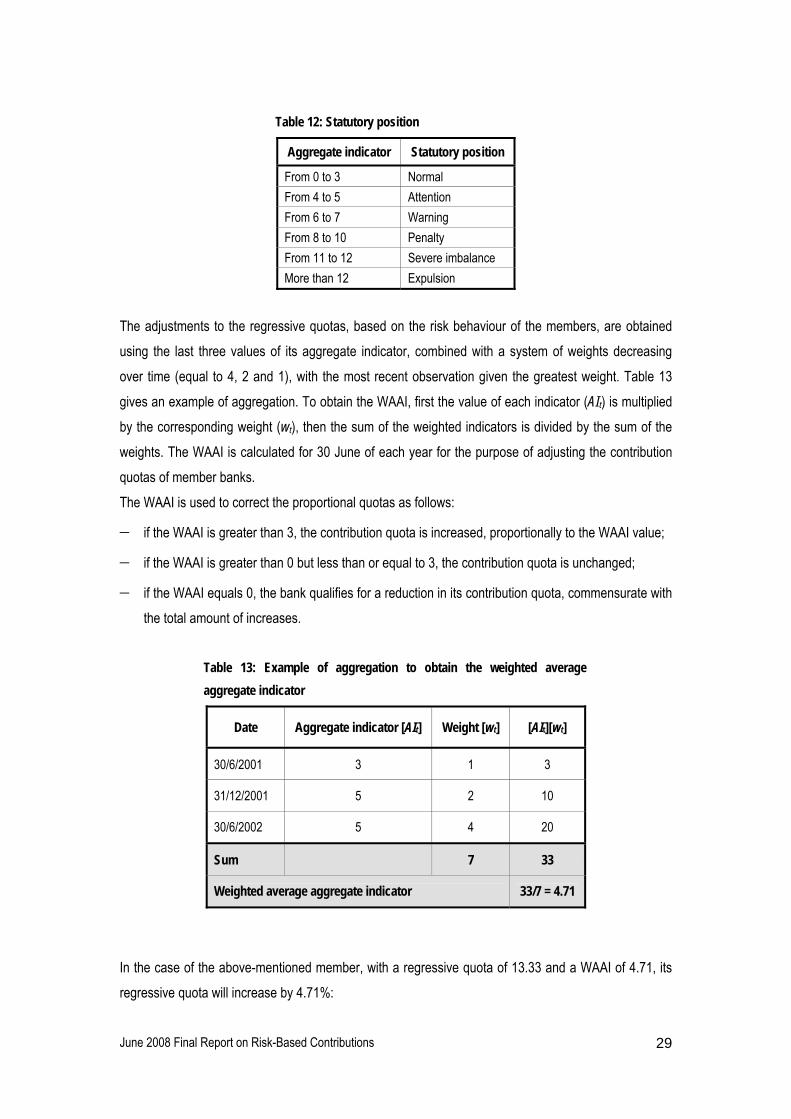
Table 12: Statutory position
Aggregate indicator Statutory position
From 0 to 3 Normal From 4 to 5 Attention From 6 to 7 Warning From 8 to 10 Penalty From 11 to 12 Severe imbalance More than 12 Expulsion
The adjustments to the regressive quotas, based on the risk behaviour of the members, are obtained using the last three values of its aggregate indicator, combined with a system of weights decreasing over time (equal to 4, 2 and 1), with the most recent observation given the greatest weight. Table 13 gives an example of aggregation. To obtain the WAAI, first the value of each indicator (AIt) is multiplied by the corresponding weight (wt), then the sum of the weighted indicators is divided by the sum of the weights. The WAAI is calculated for 30 June of each year for the purpose of adjusting the contribution quotas of member banks. The WAAI is used to correct the proportional quotas as follows:
− if the WAAI is greater than 3, the contribution quota is increased, proportionally to the WAAI value;
− if the WAAI is greater than 0 but less than or equal to 3, the contribution quota is unchanged;
− if the WAAI equals 0, the bank qualifies for a reduction in its contribution quota, commensurate with the total amount of increases.
Table 13: Example of aggregation to obtain the weighted average aggregate indicator
Date Aggregate indicator [AIt] Weight [wt] [AIt][wt]
30/6/2001 3 1 3
31/12/2001 5 2 10
30/6/2002 5 4 20
Sum 7 33
Weighted average aggregate indicator 33/7 = 4.71
In the case of the above-mentioned member, with a regressive quota of 13.33 and a WAAI of 4.71, its regressive quota will increase by 4.71%:

June 2008 Final Report on Risk-Based Contributions 30
Contribution quota = Regressive quota x (1 + 0.0471) = 13.33 x 1.0471 = 13.96.
The increase in the regressive quotas for the members with a WAAI greater than 3 is compensated by an equal decrease in the regressive quotas for the members with a WAAI equal to zero. The decrease is proportional to the proportional quotas. Suppose to consider only six members, with the amount of covered deposits shown in the first column of Table 14: the corresponding proportional quotas are obtained by dividing the amount of covered deposits by the aggregate amount (€336bn) and multiplying the result by 1 000. As shown in the table,
the regressive quotas (column D) are obtained simply by multiplying the hypothetical adjustments (τI)
shown in column C by the proportional quotas in column B. Given the values of the WAAI (column E), the regressive quota of member 1 will be increased, the quotas of members 4, 5 and 6 will remain unchanged and the quotas of members 2 and 3 will be decreased in order to compensate for the increase suffered by member 1. More specifically, the first bank will suffer from an increase of 4% in its regressive quota. This equals a variation of 3.33 thousand in its quota (from 83.18 to 86.51). To compensate for this increase, a decrease of 3.33 thousand will be divided between the two members with a WAAI equal to zero (members 2 and 3), so that the sum of the contribution quotas will still be 1 000. Considering the proportional quotas of these members, the corresponding decreases in the regressive quotas will therefore be:
Decrease for member 2 = )93.13305.119(
05.11933.3+
= 1.57
Decrease for member 3 = )93.13305.119(
93.13333.3+
= 1.76
These variations are equivalent to around 1.23% of their regressive quotas, as shown in column F. Column G lists the final quotas applied to apportion the contributions. Based on the hypothesis that the amount of contributions to be collected is €1bn, the contribution from each member is listed in column H of the table.

June 2008 Final Report on Risk-Based Contributions 31
Table 14: Example of calculation of contribution to the FITD
A B C D=B·(1+C) E F G=D·(1+F) H
Covered deposits
(€m) Proport.
quota τi Regress. quota WAAI βi Contrib.
quota Premium
(€m)
Member 1 26 000 77.38 7.50% 83.18 4 4.00% 86.51 86.5
Member 2 40 000 119.05 7.30% 127.74 0 -1.23% 126.17 126. 2
Member 3 45 000 133.93 7.00% 143.30 0 -1.23% 141.54 141.5
Member 4 50 000 148.81 0.00% 148.81 3 0.00% 148.81 148.8
Member 5 75 000 223.21 -0.50% 222.10 2 0.00% 222.10 222.1
Member 6 100 000 297.62 -7.50% 275.30 1 0.00% 275.30 275.3
336 000 1 000 - 1 000 - - 1 000 1 000
Data sources and competent authorities The data concerning the contribution base are sent directly by the members. On the other hand, ratios are calculated on the basis of a specific dataset, which the Bank of Italy sends to the Fund. Ratios are monitored on a semi-annual basis (on 31 December and 30 June), with the exception of the riskiest institutions whose ratios are checked quarterly (two additional observations on 30 March and 30 September). Sources “The FITD’s monitoring system of bank riskiness and risk-based contribution”, FITD technical document, January 2006, available at: http://www.fitd.it/en/activities/documents/FITD_MSystem_012006.pdf
3.2.4 Portugal: Deposit Guarantee Fund and Mutual Agricultural Credit Guarantee Fund The Deposit Guarantee Fund (DGF) adopted the current system in the year of its establishment in 1994. The other scheme (FGCAM, Mutual Agricultural Credit Guarantee Fund) was founded in 1984, but did not introduce the contribution adjustments system until 1999. It must be added that the main task of the FGCAM is to promote and carry out the action deemed necessary to ensure the solvency and liquidity of its members, targeted at protecting the members themselves in order to avoid failures: this automatically provides the depositors’ protection required by Directive 94/19/EC.

June 2008 Final Report on Risk-Based Contributions 32
As mentioned earlier, the annual contribution (ci) is obtained by applying to the contribution base (xi) a
fixed percentage (α), established yearly and equal for all members, and a risk adjustment (βi), which
depends on the solvency ratio of the member:
iii xc αβ= .
In the case of the Deposit Guarantee Fund, α is set by the Banco de Portugal, at up to 0.2%, on an
annual basis. For 2006, an annual rate of 0.03% was applied.
In the case of the Mutual Agricultural Credit Guarantee Fund, the rate for α depends on the coverage
ratio (CR) of the previous year, defined as:
deposits eligible ofamount Totalavailable funds ofamount TotalCR = .
Table 15 shows the percentages applied, depending on the CR. For 2006 the rate is α = 0.20%.
Table 15: Ranges for the fixed parameter α for the Mutual Agricultural Credit Guarantee Fund
CR α
CR < 0.4 0.27%
0.4 < CR < 0.6 0.25%
CR > 0.6 0.20% Table 16: Ranges for the risk-based adjustment βi for the Deposit Guarantee Fund
ASRi βi
ASRi < 8 120%
8 ≤ ASR i< 10 110%
10 ≤ ASRi < 12 100%
12 ≤ ASRi < 14 90%
ASRi ≥ 14 80%
The risk adjustment βi for each member is based on its Average Solvency Ratio (ASRi) over the
previous year, in accordance with the ranges indicated in Table 16. The solvency ratio is defined as:
12.5 tsrequiremen Capital fundsOwn SRi ⋅
=
where:
• own funds = Tier I + Tier II – regulatory deductions + Tier III;

June 2008 Final Report on Risk-Based Contributions 33
• capital requirements = capital requirements for credit risks (solvency), for dealing positions, for exchange risks, for large exposures (dealing portfolio), for settlement and counterpart, and for commodities risk and other risks.
The ASR of each institution is based on the average of two solvency ratios, on 30 June and 31 December of the previous year. Table 17 gives an example of calculation of the contribution for 2006 for each ASR bracket, assuming a contribution base of €1bn. Figure 7 shows the range of variation of the contribution as a function of the contribution base. The left axis corresponds to the Deposit Guarantee Fund, the right to the Mutual Agricultural Credit Guarantee Fund. The bounds of the range correspond to the minimum (80%) and maximum (120%) percentage for βi. The fixed percentage α is set at the 2006 value of 0.03% for the
Deposit Guarantee Fund and at 0.2% for the Mutual Agricultural Credit Guarantee Fund. The difference
between the two rates for α reflects the different types of institutions covered by the two schemes.
Table 17: Example of calculation of contribution to the Portuguese Deposit Guarantee Fund and the Mutual Agricultural Credit Guarantee Fund in 2006
Scheme xi (m€) α βi Contribution (m€)
Member 1 1 000 0.03% 120% 0.36 Member 2 1 000 0.03% 110% 0.33 Member 3 1 000 0.03% 100% 0.30 Member 4 1 000 0.03% 90% 0.27
DGF (PT1)
Member 5 1 000 0.03% 80% 0.24
Member 1 1 000 0.2% 120% 2.4 Member 2 1 000 0.2% 110% 2.2 Member 3 1 000 0.2% 100% 2.0 Member 4 1 000 0.2% 90% 1.8
FGCAM (PT2)
Member 5 1 000 0.2% 80% 1.6 Data sources and competent authorities In both cases the Fund is responsible for estimating the contributions to be collected from each member. Concerning the sources of the data: 1) Deposit Guarantee Fund: data on the ratios are provided by the supervisory authority. However, in their returns of the calculations of the annual contributions members declare their capital ratios and the Fund carries out the reconciliation of the ratios declared by members with those stated by the supervisory authority. 2) Mutual Agricultural Credit Guarantee Fund: all data needed for calculating the contribution are provided by DGS members. For the capital adequacy ratio, each member provides the data.

June 2008 Final Report on Risk-Based Contributions 34
Figure 7: Range of variation of the amount of contribution for the Portuguese Deposit Guarantee Fund (left axis) and the Mutual Agricultural Credit Guarantee Fund (right axis) as a function of the contribution base
Sources a) Deposit Guarantee Fund: Notice No 11/94 incorporating all changes introduced by Notices No 9/95, 3/96, 4/96, 11/2003, 5/2004, 6/2004 and 7/2005, available at: http://www.fgd.bportugal.pt/default_e.htm. b) Mutual Agricultural Credit Guarantee Fund: 1) Avisos do Banco de Portugal No 14/2003. 2) Decree-Law No 345/98 of the Ministry of Finance of 9 November 1998.
3.2.5 Finland: Deposit Guarantee Fund The Finnish risk-based system was introduced when the DGS was established in 1997. The contribution base for this DGS is the amount of covered deposits by the scheme. The maximum annual contribution per member is set at 0.3% of the contribution base. If the Fund reaches 2% of the aggregate amount of covered deposits, contributions will be reduced to one third of the regular contributions; moreover, if the Fund reaches 10% of the aggregate amount of covered deposits, contributions may be suspended.
Coefficient α is fixed at 0.175%. Hence, the annual contribution obtained is:
iii xc β%175.0= ,
where xi is the amount of covered deposits for the i members of the DGS and βi is a risk factor defined
as:
0
5
10
15
20
25
30
35
40
10 20 30 40 50 60 70 80 90 100
Contribution Base (b€)
Con
trib
utio
n R
ange
(m€)
50
100
150
200
250
300
0
FDG FGCAM
0
5
10
15
20
25
30
35
40
10 20 30 40 50 60 70 80 90 100
Contribution Base (b€)
Con
trib
utio
n R
ange
(m€)
50
100
150
200
250
300
0
50
100
150
200
250
300
50
100
150
200
250
300
0
FDG FGCAM

June 2008 Final Report on Risk-Based Contributions 35
fundsown edconsolidat ofamount Totalrisk cover tofundsown edconsolidat ofamount Minimum
=iβ
The total amount of consolidated own funds and the total amount of consolidated own funds required to cover risks are calculated in accordance with Chapter 55 of the Act on Credit Institutions. Data sources and competent authorities DGS members must provide the information necessary for calculation of the contribution payment and for assessment of the risk directly to the Fund. Sources 1) Act on Credit Institutions 9.2.2007/121, as amended. 2) Rules of the Deposit Guarantee Fund.
3.2.6 Sweden: Swedish Deposit Guarantee Board The Swedish DGS has been adjusting members’ contributions using risk-based information since the scheme was founded in 1996. The aggregate annual contributions to be collected must add up to a sum currently equivalent to 0.1% of the covered deposits by the scheme. The contribution from each institution must be between a minimum of 0.06% and a maximum of 0.14% of the sum of the covered deposits for that institution. The contribution base is the amount of covered deposits. The distribution of the aggregate contribution between the members depends on their contribution base and their Capital Adequacy Ratio (CAR). Specifically, the adjustment procedure uses the mathematical function U, whose main input variable is the CAR (z):
)exp()( iii czbazU −⋅+= ,
where i are the DGS members and a, b and c are three parameters chosen on the basis of the distribution of the CAR of all the DGS members. For each member U(z) must be no higher than 1, which is the case when the CAR equals the lowest possible value (e.g. 8%) and no lower than the “convergence parameter” a, which is generated for institutions that have a very high CAR.

June 2008 Final Report on Risk-Based Contributions 36
0.00
0.20
0.40
0.60
0.80
1.00
1.20
8%8.5
0% 9%9.5
0% 10%
10.50
%11
%
11.50
%12
%
12.50
%13
%
13.50
%14
%
z
U(z
)
Figure 8: Example of the function U(z) used to correct the contribution on the basis of the capital adequacy ratio z. In this example a = 0.3, b = 17.2 and c = 40.
Figure 8 gives an example of the function U(z) using the triplet of parameters a = 0.3, b = 17.2 and c = 40. The function U(z) matches the following series of desired characteristics:
• The presence of the inverse exponential ensures that each bank’s contribution is inversely proportional to its CAR, i.e. a higher CAR leads to a lower contribution, other things being equal.
• The shape of the function implies that a change in contribution caused by any given change in a low CAR is relatively high compared with that caused by a change in a high CAR.
• The use of the inverse exponential also helps to minimise the number of institutions that fall below the minimum contribution of 0.06% of the contribution base and hence to avoid many institutions with a low CAR paying the same contribution regardless of their adequacy ratio.
• The continuity of the function ensures that there are no large changes in contribution levels for arbitrarily small changes in capital adequacy ratios.
The choice of parameters allows arbitrary modelling of the shape of the function and balanced distribution of the contributions between the DGS members. For instance, the lower the curvature parameter c and/or the higher the convergence parameter a, the more “compact” the contribution pattern will be, which means that relatively few institutions fall outside the target interval. This might be convenient if there is a wide spread of CAR between institutions in the banking system. By contrast, when most of the institutions have similar capital adequacy ratios, it is best to increase the curvature by

June 2008 Final Report on Risk-Based Contributions 37
raising c. Parameter b is simply obtained by imposing the requirement that the maximum possible value of U (i.e. 1) will correspond to the members with the lowest CAR (e.g. 8%):
%)8(exp1
⋅−−
= cab .
Once the parameters have been chosen, the contributions are calculated by the following steps: 1) Calculation of the aggregate amount of contribution C to be collected:
∑=i
ixC α ,
where α is a fixed percentage (currently 0.1%) and xi is the amount of covered deposits of the i
members. The formula simply states that the total contribution to be collected is a fixed percentage of the total amount of covered deposits by the scheme.
2) Calculation of the amount of contribution to be paid by each institution (ci), using coefficient U(z) and the contribution base (xi) as follows:
∑∑ ⎟⎟⎟
⎠
⎞
⎜⎜⎜
⎝
⎛=
ii
iiii
iiii x
xzUxzUc α)(
)(,
where the amount in brackets is simply the relative weight of the member. If some of the members’ estimated contributions fall outside the target interval (from a minimum of 0.06% to a maximum of 0.14% of the amount of covered deposits by each institution), they must be adjusted upwards or downwards, so that they fall on the lower or upper limit respectively. Such upward/downward correction will require downward/upward adjustment, on a “pro rata” basis, of the contributions paid by other institutions in order to obtain the fixed aggregate annual contribution. Table 18 gives an example of a calculation based on seven institutions whose CAR is shown in the second column. The values of the ratios are randomly generated between 8% and 15%. The corresponding distribution coefficients U(z) based on the curve in Figure 8 are listed in the third column. It is assumed that the total contribution to be collected adds up to €50m. The weights in the penultimate column are the percentage contributions to be paid by each credit institution. The last column lists the final contributions.

June 2008 Final Report on Risk-Based Contributions 38
Table 18: Example of calculation of contribution to the Swedish DGS
x (m€) CAR U(z) [ ]xzU
xzU∑ )(
)( Contribution (m€)
Member 1 3 750 8% 0.907 15% 7.332
Member 2 2 500 9% 0.724 8% 3.901
Member 3 5 000 10% 0.572 12% 6.165
Member 4 7 500 11% 0.482 16% 7.797
Member 5 6 000 13% 0.413 11% 5.334
Member 6 12 250 14% 0.367 19% 9.695
Member 7 13 000 15% 0.349 20% 9.776
50 000 3.815 100% 50
Data sources and competent authorities The contribution is charged for the current year but is based on the previous year’s capital adequacy ratios and guaranteed deposits. These figures are reported by the institutions and entered in the deposit guarantee system’s register of institutions.
Sources 1) Act on the Deposit Guarantee Scheme (1995:1571). 2) Act on the Capital Adequacy and Large Exposures of Credit Institutions and Securities Companies (1994:2004). 3) Principles for determining fees for the deposit guarantee system (internal document, 2003).
3.3 Comparison of the risk-based systems As explained earlier, a full comprehensive comparison between current approaches is not completely feasible. This section makes an attempt to provide comparative information. One particularly relevant variable is the elasticity of the system, that is the potential capability to extend the range of variation of the contributions.
In Figure 9 the bars express the percentage variations in the risk-based adjustments βi currently in force
in the schemes presented in the previous section. For all the schemes the reference value is taken as 100%. The upper end of the bar marks the maximum possible increase in the contribution (current

June 2008 Final Report on Risk-Based Contributions 39
maximum) due to the risk-based adjustment; at the other end, the lower bound gives the maximum possible reduction (current minimum). The widest range is registered in DE3 (90%-140%), whereas the narrowest is observed for IT1 (81.4%-120.4%). In the case of Italy, the maximum is obtained assuming that for three consecutive semesters a bank scores an average indicator of 12 (the maximum possible score before expulsion) and, thus, its correction coefficient for calculating the contribution quotas from regressive quotas is (1 + 12%). The maximum increase is therefore obtained by multiplying the two maximum possible corrections (1 + 12% and 1 + 7.5%) related to the two adjustment procedures described in Section 3.2.3. It is not possible to estimate the minimum level, because the reduction of the contribution quotas depends on the aggregate increase in the contribution quotas and on the number of banks entitled to decrease their contributions. To proxy the minimum, the following assumptions are made: a single bank suffers from an increase in its regressive quota; the increase is the maximum possible; a single bank benefits from a reduction in its quota; and, finally, this bank has the same regressive quota as the one suffering from the increase. In this way, the correction for this bank would be (1 - 12%). Under these assumptions the maximum reduction is therefore (1 - 12%)(1 - 7.5%). Without these somewhat theoretical assumptions, it is not possible to include the lower end of the bar, i.e. the maximum possible reduction of the quota, for the Italian scheme.
The whiskers in the graphs represent the impact of the variation of coefficient α. By allowing α to vary
within the intervals declared in Section 3.2 for each country, wider ranges can be achieved, which are presented in Figure 9 by the solid lines from the potential minimum to the potential maximum. This is the case for DE3, PT1 and PT2. For example, the potential maximum in Germany would be achieved by
combining the potential maximum value allowed for α (i.e. 0.2%) with the maximum possible risk-based
adjustment (i.e. 140%). FI and SE are missing from this figure because their approach to adjust contributions does not fit into this framework.
The same approach could not be replicated in Italy and France, where there is no coefficient α and the
fixed amount is established before collecting contributions. For this reason, in the graph neither IT nor FR have any extra potential extension of the range.

June 2008 Final Report on Risk-Based Contributions 40
curr. mincurr. mincurr. mincurr. min
curr. min
pot. maxpot. max
pot. max
pot. min
pot. min
pot. min
curr. maxcurr. maxcurr. maxcurr. max
curr. max
0%
25%
50%
75%
100%
125%
150%
175%
200%
225%
250%
Germany Italy France Portugal 1 Portugal 2
Country
Perc
enta
ge
Figure 9: Elasticity of risk-based adjustments country by country
Besides the elasticity analysis in Figure 9, Table 19 summarises all the information collected on the risk-based systems described in Section 3.2. The top part of Table 19 covers several characteristics of the indicators adopted by the risk-based DGS: the number of classes obtained using the indicators, the number of indicators and the indicator profiles (see Table 2). Only three DGS (DE3, PT1 and PT2)
classify their members into predetermined classes corresponding to a specific value of β. In the others
the correction coefficient is the output of a calculation. The middle part of Table 19 indicates the type of data necessary for the premium calculation and their public availability. The bottom part of the table looks at the technical features of the methods, trying to give some insight into the mathematical tools applied in the models and issues like calibration procedures. As mentioned earlier, a pre-determined overall contribution is in force in two countries (FR and IT), while all the others
apply coefficient α. Calibration procedures are included in the Italian approach to find the equilibrium
quota and in Sweden to find the optimum parameters of the exponential function. All the functions applied by the schemes are relatively simple, being either linear (FR and IT) or exponential (SE). Finally, the Italian DGS is the only scheme including in the correction the time evolution (over three
consecutive semesters) of the risk -attitude of the members (βi).

June 2008 Final Report on Risk-Based Contributions 41
Table 19: Comparison of available information.
DE3 FR IT PT1-PT2 FI SE
Number of classes 5 - - 5 - -
Number of indicators 8 4 4 1 1 1
Solvency indicators 2 1 1 1 1 1
Exposure indicators 3 1 1
Profitability indicators 3 1 2
Data from balance sheet X X X X X CAR
Data on deposits Eligible Covered Eligible Covered Covered
Other data Lendings, Contingent liabilities
Outstanding loans, Data on
maturity transformation
Pre-determined overall amount X X
Calibration X X
Mathematical function Linear Linear Exponential
Time evolution X
Source: DGS description and JRC analysis.

June 2008 Final Report on Risk-Based Contributions 42
4. Monitoring systems 4.1 Brief description The main purpose of the monitoring systems is to investigate if there are potential threats to the DGS. In some cases they can be used to decide when to intervene to avoid failure of a member or to reduce the impact of the action by the DGS. In other circumstances, a member of the scheme may be sanctioned if the system reveals an increase in its risk exposure or unsound risk management. As explained in the introduction, the information collected on the monitoring systems is less detailed than the data obtained on risk-based DGS. Normally, monitoring systems also make use of indicators defined in terms of financial data to evaluate the performance of their members. For this reason, whenever possible, the indicators adopted have been listed in Table 2 of the Overview (Section 2). Among the DGS with an early-warning system, little information is available for DE1 and PL. The risk-scoring system adopted by the German DGS covering public banks (DE1) works on the basis of the yearly audit reports submitted by the members. On the one hand, it is a tool for monitoring their actual financial and risk situation and, on the other, a basis for special audits (Sonderprüfungen) conducted yearly in accordance with the BaFin (the German Federal Financial Supervisory Authority) on between two and four of the member banks. The risk-scoring system essentially evaluates the credit default risk, the interest rate risk, liquidity risks, the financial situation and the profit situation. These criteria are again subdivided into other (confidential) criteria. The system is currently being adapted to new reporting laws, but will remain essentially unchanged. The DGS in PL has developed a quantitative methodology based on a number of indicators aimed at assessing the following profiles of the members: solvency, profitability, types of assets and types of off-balance sheet obligations. These indicators are used to assess not only the financial situation of the banks, but also the variability of their conditions. For instance, the DGS systematically evaluates the variation over time (e.g. increase/decrease in performance) in the indicators applied. Some of the indicators18 applied by this scheme are similar to those described in the Overview (Section 2), for instance costs and provisions are measured against the profits to assess the performance of the members and the capital adequacy ratio is used to evaluate their solvency profile. Off-balance sheet obligations are also evaluated, along with the Return On Assets (ROA).
18 The detailed list of indicators is not available for the Polish Bank Guarantee Fund. A qualitative description of some of the indicators was obtained by translating from Polish tables in an internal report describing the full monitoring method adopted by the scheme.

June 2008 Final Report on Risk-Based Contributions 43
The remainder of this section presents three monitoring systems applied by the Italian DGS covering cooperative credit banks, by the Austrian DGS covering private commercial banks and by the Romanian scheme. The preventive risk-monitoring system applied by German cooperative banks (DE3) has already been described in Section 3.2.1 and is equivalent to the system adopted to adjust the contribution.
4.2 Technical details
4.2.1 Italy: Deposit Guarantee Fund of Cooperative Credit Banks The Italian DGS for cooperative credit banks (CCB) assesses the overall situation of members by means of complementary monitoring systems. Banks identified by one of the early-warning tools are placed under direct monitoring by the Deposit Guarantee Fund.
Statutory indicators Historically, the system employed is based on a set of balance-sheet ratio indicators, known as statutory indicators. The system is made up of two ratios related to the risk profile of the DGS members (A1 and A2), two ratios related to solvency (B1 and B2) and, finally, two indicators of the economic performance of the members (D1 and D2)19. The system of indicators is as follows:
reserves and Capitalloans performing -Non1 =A
loans gOutstandin loans performing -Non2 =A
capitaly Supervisorpurposesy supervisorfor Capital1 =B
customers)(ordinary Fundingsliabilitie esSubordinat ) provisions lossesloan (including reserves and Capital2 +
=B
income Grossexpenses tiveadministra and General1 =D
taxbeforeProfit ) recoveries of(net lossesLoan 2 =D .
Three thresholds are set for each indicator (see Table 20), identifying four classes, each corresponding to a coefficient, as indicated in Table 21. The sum of the coefficients for each member provides an aggregate indicator of the overall situation of the bank.
19 A maturity transformation indicator was also applied until 2006.

June 2008 Final Report on Risk-Based Contributions 44
Aggregate indicators are calculated semi-annually, on the basis of the report of the balance-sheet ratios, and are used to promote a specific path (no more details are publicly available) to bring the value of the aggregate indicator back under the “Attention” threshold and to correct the critical situation.
Table 20: Thresholds for the indicators applied by the Italian DGS for cooperative credit banks
Normal Attention Warning Violation
A1 Under 40 From 40 to 60 From 60 to 100 Over 100
A2 Under 6 From 6 to 8 From 8 to 12 Over 12
B1 Over 120 From 120 to 100 From 100 to 80 Under 80
B2 Over 12 From 12 to 10 From 10 to 6 Under 6
D1 Under 70 From 70 to 75 From 75 to 85 Over 85
D2 Under 50 From 50 to 60 From 60 to 80 Over 80
Table 21: Scores assigned to members of the Italian DGS for cooperative credit banks, depending on their ratios
Situation Coefficient
Normal 0
Attention 1
Warning 2
Conventional indicators Besides the statutory approach, a complementary statistical analysis is performed: back-testing has found that the following are two good indicators of an impending crisis:
purposesy supervisorfor Capital loans performing -Non1 =IC
purposesy supervisorfor Capitalloans Doubtful loans performing -Non2 +
=IC .
A first sign is given by exceeding specific thresholds, set at 12% for IC1 and at 40% for IC2. A further sign is sent if the values of the indicators are increasing over time, within intervals which depend on the geographical zone where the cooperative bank is operating.
Statistical indicators In addition, a more sophisticated statistical analysis has been put in place: three statistical indicators are used to provide an extra quantitative view of members’ efficiency. In particular, a sign is sent to the central authority if at least two of the three following relations are detected:

June 2008 Final Report on Risk-Based Contributions 45
%86.18fundsOwn
loans performing -Non 1 ≥=IS
%53.2assets Total
income lOperationa2 ≥=IS
%93.43expenses tiveadministra and General
costs Employment3 ≤=IS .
The specific values of the thresholds are obtained by an iterative, rather technical, procedure from the statistical literature.
Additional support interventions Member banks which are subject to additional support intervention, decided by the Fund in previous years, are placed under monitoring by the Fund to assess correct, effective implementation of the solutions submitted in the recovery plan.
Specific solvency coefficient The solvency coefficient imposed by the Central Bank is currently set at 8% of the risk-weighted assets. In some cases the Central Bank has decided to assign a specific solvency coefficient. The Fund has selected the member banks which are subject to a higher solvency coefficient.
Concentration of the risk (large exposures) In 2007 the Fund conducted a survey on the concentration of:
• Loans (ordinary customers);
• Funding (ordinary customers);
• Ownership securities;
• Securities of a third party. Banks which reported a deviation of 100% from the average recorded in the relevant local federation for each of the above-mentioned aspects have been placed under monitoring. Member banks selected in the previous action plan (2006-2007) but showing persisting signs of difficulties have been placed, once again, under the supervision of the Fund.
Newly constituted CCBs Due to the high failure rate among newly constituted cooperative credit banks, all the CCBs established since 2005 have been selected for monitoring of correct and effective implementation of their industrial plan and to avoid the eventuality of default.
Sources 1) By-laws on the Deposit Guarantee Fund of cooperative credit banks. 2) Technical internal document: “Nota metodologica: piano attivita’ 2008”.

June 2008 Final Report on Risk-Based Contributions 46
4.2.2 Austria: Deposit Guarantee Scheme for commercial banks The early-warning system developed by the Austrian DGS for commercial banks is based on several assessments, performed with different frequency over the financial year. There are monthly, quarterly, semi-annual and yearly assessments. The monthly, quarterly and semi-annual assessments are qualitative and do not imply taking any measure. The yearly assessment serves to classify banks into seven classes (A, A/B, B, B/C, C, C/D and D) using six key performance indicators and a series of thresholds and criteria. For the banks in the three lowest classes, different types of measures are adopted, such as discussing the situation with the regulatory authority, informing the other member banks and the other Austrian deposit insurance schemes or preparing funds for intervention. The monthly assessment is based on reports from the Austrian National Bank and focuses on the development of business activities. From these reports the following information on the member banks is analysed: - Selected balance-sheet data in comparison with the month before and with the same month in the
previous year; - Equity and solvency data: amounts, structure, ratios and surplus (in comparison with the month
before and with the same month in the previous year); - Major investments: amount, in absolute terms and in relation to equity amounts (in comparison with
the month before and with the same month in the previous year). The quarterly assessment: is based on the members’ income statements. The data received are compared with the figures for the preceding quarter and for the same quarter in the previous year and also on a year-on-year basis with the preceding year. Data are taken from the income statement, both in absolute terms and in the form of key performance indicators like the cost/income ratio, risk/earnings ratio, Return On Equity (ROE) and risk burden in relation to risk-weighted assets. Based on their business characteristics, the member banks are allocated into six different groups, as shown in Table 22. Within each group members are ranked on the basis of several criteria, for instance the amount of guaranteed deposits, solvency ratios, ROE, net profit and internal rating scale. On request, each member institute can see how its performance compares with the average performance of the group to which it belongs. The semi-annual data assessment evaluates the amount of guaranteed deposits to investigate, for instance how it has developed over several periods of time, and also the level of deposits in comparison with the amount of tier 1 capital or surplus of tier 1 capital or the percentage of all the liabilities to customers.

June 2008 Final Report on Risk-Based Contributions 47
Table 22: Groups formed by the Austrian DGS for commercial banks in the quarterly assessment of the performance of its members
Group Description Group 1 Building societies Group 2 Universal banks with a high amount of guaranteed deposits (> €20 million) Group 3 Universal banks with a lower amount of guaranteed deposits Group 4 Car-financing, credit-card, mobile-phone and lease-finance institutes Group 5 Securities management and custodian business Group 6 Special-purpose institutes, including own-investment vehicles
Annual data assessment: In the annual assessment, the member banks are classified on an internal rating scale using six key performance indicators: net profit, risk burden, cost/income ratio, hidden reserves, non-performing assets, liabilities to customers and guaranteed customer deposits. The ratios used to evaluate the members are listed in the first column of Table 23. Five rating classes are built using these indicators (A, A/B, B, C/D and D). Ranking class B serves as a basis for the classification of DGS members. Members are classified in this class if their key performance indicators are within the ranges indicated in the second column of Table 23. An upgrade by one class (from B to A/B) is possible if R4 lies between 10% and 20% and R5 is higher than 100%. A further upgrade (to the top ranking A) is possible if R4 is higher than 20% and R5 is higher than 200%. Members will be ranked lower than B if at least three of the six key performance indicators are worse than the base range. If a DGS member is ranked in class C, a discussion will be held with the member and with the consultative board and the regulatory authority. A C/D ranking means a direct risk of insolvency and entails immediate discussions facilitating successful crisis management. At this stage, considering possible counter-productive effects (such as cancellation of credit lines), the other member banks and other Austrian deposit insurance schemes might be warned. Finally, a D ranking means that the member bank concerned has already failed to meet its financial obligations. The deposit insurance scheme is then in charge of repayment of depositors.

June 2008 Final Report on Risk-Based Contributions 48
Table 23: Indicators and corresponding thresholds applied by the Austrian DGS for commercial banks DGS
Ratio Thresholds for class B
EarningsCost1 =R Between 55% and 65%
EarningsRisk2 =R Between 8% and 16%
equivalentRisk Risk3 =R Between 0.5% and 1.0%
1Tier profitNet 4 =R Between 5% and 10%
deposits Repayable1Tier 5 =R Between 50% and 100%
equivalentRisk 1Tier 6 =R Between 5% and 10%
Data sources and competent authorities The member banks are obliged to communicate to the deposit insurers all the information they need to perform their duties. In particular, member banks have to notify the DGS of the annual appointment of their auditors and deliver financial statements (including consolidated financial statements) and the separate supervision audit reports and hidden reserves report immediately. Monthly and quarterly reports have to be submitted to the regulatory bodies within four weeks and additional papers and data on request by the deposit insurer. Moreover, any auditors or special reviewers appointed by the board or by regulatory authorities have to present their reports and are exempt from confidentiality in relation to the DGS. Finally, any reports given to the Austrian National Bank can be requested by the DGS.
Sources 1) 2007 JRC survey.
2) “Risk monitoring within the Deposit Guarantee Scheme of the Austrian commercial banks”,
presentation at the EFDI meeting in Stockholm in September 2005.

June 2008 Final Report on Risk-Based Contributions 49
4.2.3 Romania: Deposit Guarantee Fund in the banking system The Romanian DGS uses a set of indicators to monitor members’ risk conduct and determine whether a credit institution has been engaged in risky and unsound policies. The five indicators are defined as follows: 1) Solvency Ratio (SR):
items)sheet balance-off (including assets weighted-Risk fundsOwn
=SR
2) Credit Risk and interbank investments Ratio (CRR):
sinvestmentInterbank loans Total loss) and doubtful d(classifie sinvestmentinterbank and loans torelated exposure Unadjusted
+=CRR
The unadjusted exposure covers banking and non-banking loans and interbank investments plus the related interest. The denominator (total loans + interbank investments) also includes the interest. In addition, both numerator and denominator also include off-balance sheet items. 3) General Risk Ratio (GRR):
valuekeeping-bookat assets Totalassets weighted-Risk
=GRR
Both the risk-weighted assets and the total assets at book-keeping value also include off-balance sheet items. 4) Rate of Return on Basic Activities (RBA):
expense Provisions - operations from Expenseprovisions from Income - income Operations
=RBA
5) Liquidity Indicator (LI):
liquidity Requiredliquidity Effective
=LI
Depending on the values of these indicators, DGS members are assigned a series of five scores based on the thresholds set out in Table 24. These scores are subsequently aggregated applying the weights indicated in the second and fifth columns of Table 24. The two most important indicators (weight equal to 2.00) are the solvency indicator and the credit risk and interbank investments indicator. The general risk ratio has a weight of 1.75 and the last two (rate of return on basic activities and liquidity indicator) 1.25 and 1.00 respectively. The aggregate indicator of the overall riskiness of a member is obtained as the weighted average of the five scores:
∑=i
ii KPS .

June 2008 Final Report on Risk-Based Contributions 50
The aggregate indicator is used to monitor the behaviour of the DGS members and to increase the contribution from members with S < 7.5, which are liable to up to twice the annual contribution, as specified in Table 25.
Table 24: Thresholds for assigning Pi scores to members of the Romanian DGS; the scores are aggregated using weight Ki
Ki Thresholds Pi Ki Thresholds Pi
SR 2.00
≤ 0% 0.1% - 3.9% 4.0% - 7.9% 8.0% - 11.9% 12% 12.1% - 14.0% 14.1% - 16.0% 16.1% - 18.0% > 18%
0.00 0.25 0.50 0.75 1.00 1.25 1.50 1.75 2.00
RBA 1.25
< 100% 100.0% - 107.9% 108.0% - 115.9% 116.0% - 124.9% 125% 125.1% - 133.0% 133.1% - 141.0% 141.1% - 150.0% > 150%
0.00 0.25 0.50 0.75 1.00 1.25 1.50 1.75 2.00
CRR 2.00
≤ 2.0% 2.1% - 3% 3.1% - 4% 4.1% - 4.9% 5% 5.1% - 7.0% 7.1% - 9.0% 9.1% - 10.0% > 10.0%
2.00 1.75 1.50 1.25 1.00 0.75 0.50 0.25 0.00
LI 1.00
< 0.70 0.70 - 0.79 0.80 - 0.89 0.90 - 0.99 1 1.01 - 1.10 1.11 - 1.20 1.21 - 1.30 > 1.30
0.00 0.25 0.50 0.75 1.00 1.25 1.50 1.75 2.00
GRR 1.75
≤ -50.1% (-50.0%) - (-33.4%) (-33.3%) - (-16.7%) (-16.6%) - (members’ average) Members’ average (members’ average) - (+16.6%) (+16.7%) - (+33.3%) (+33.4%) - (+50.0%) ≥ (+50.1%)
2.00 1.75 1.50 1.25 1.00 0.75 0.50 0.25 0.00
Table 25: Annual contributions to the Romanian DGS (with S < 7.5), being “r” the standard contribution
S Annual contribution
Minimum 7.5 r
5.00 – 7.49 1.25·r
3.00 – 4.99 1.50·r
2.00 – 2.99 1.75·r
< 2 2·r

June 2008 Final Report on Risk-Based Contributions 51
Romania is in the process of introducing a new risk assessment system. In the new system an exposure coverage ratio target will be set and, consequently, both the annual contribution rate and the amount of the stand-by lines of credit (which have to be granted yearly to the Romanian DGS by its members) will be established. The new system will probably be finalised in the course of 2008. It aims at decreasing the costs for the member credit institutions by taking into account the size of the Fund’s financial resources and the current and future soundness of the Romanian banking system.
Sources 2007 JRC survey.
June 2008 Final Report on Risk-Based Contributions 52
5. US DGS: Risk-based contributions 5.1. Introduction This section presents the US ex-ante risk-based mechanism, applied by the Federal Deposit Insurance Corporation20 (FDIC), an independent Federal agency that maintains the stability of and public confidence in the national financial system by insuring deposits, examining and supervising financial institutions and managing receiverships. The contributions collected in advance by the FDIC aim at reflecting the soundness and solidity of the financial institutions and at monitoring and providing an incentive to reduce risk-taking. The 1991 Federal Deposit Insurance Corporation Improvement Act21 introduced a requirement to apply a risk-based assessment system to US financial institutions. The FDIC has been implementing this requirement since 1993, classifying DGS members into four risk categories with a two-step process, based first on capital levels and then on supervisory ratings. The first step considers three capital ratios to investigate if the institution is adequately capitalised. The second was initially based on the Uniform Financial Institutions Rating System (UFIRS) adopted in 1979 by the Federal Financial Institutions Examination Council22 (FFIEC) to monitor the soundness of the financial institutions and to identify if an FDIC member calls for special attention or concern. The UFIRS was amended in 1996 to include a new indicator and renamed “CAMELS”, which is an acronym of the six financial indicators making up the rating. Currently the rules adopted by the FDIC Board in November 2006 and in force since 2007 set a contribution for the four risk categories that varies between 5 and 43 cents per $100 of the member’s assessable deposit, also known as total assessment base. The FDIC has to collect and maintain a minimum level of resources and may adjust rates upwards or downwards by 3 base points from the base rate schedule in case of need. The Fund, which by law23 must be in the range of between 1.15% and 1.50% of the total amount of covered deposits held by members, is currently equal to nearly 1.22% of this amount. The next section describes in detail both the system and the indicators adopted by the FDIC to assign the financial institutions to the risk categories.
20 FDIC website: http://www.fdic.gov/index.html. 21 The Federal Deposit Insurance Corporation Improvement Act is reported in FDIC law, page 8549 et seq.: http://www.fdic.gov/regulations/laws/rules/8000-120.html. 22 The FFIEC is an interagency body with the aim of laying down uniform principles, standards and report forms for Federal examination of financial institutions. FFIEC website: http://www.ffiec.gov/. 23 The Federal Deposit Insurance Reform Act23 (FDIRA) of 2006 is available at: http://frwebgate.access.gpo.gov/cgi-bin/getdoc.cgi?dbname=109_cong_public_laws&docid=f:publ171.109.pdf.

June 2008 Final Report on Risk-Based Contributions 53
5.2 The risk-based system
The general soundness of banks and thrift institutions is monitored by collecting information from on-site examinations and periodical surveys on balance-sheet data. This task is performed by the FDIC in cooperation with other Federal agencies. In particular, the Office of the Comptroller of the Currency24 (OCC) contributes to the examinations of members and the FFIEC provides support for developing the risk-based method (see below for further details). The OCC, founded in 1863 as a bureau of the US Department of the Treasury, charters, regulates and supervises all national banks and also supervises the Federal branches and agencies of foreign banks. By law25, a full on-site examination of the institutions has to be conducted at least once during each 12-month period, which may be extended to 18 months in special cases. Bank examinations are carried out periodically for a number of purposes: to maintain public confidence in the integrity of the banking system; to determine the bank’s compliance with laws and regulations; to prevent problematic situations; and, in particular, to provide a sound factual foundation for corrective measures. The last point generally corresponds to the second step of the risk-based assessment system, when the supervisory rating is assigned to the financial institution. The FFIEC sets the “CAMELS” indicators and regulates the reporting requirements for the Consolidated Reports of Condition and Income and the Thrift Financial Report, required every quarter from all US banks by the Federal Reserve Act of 1913. These quarterly reports collect basic financial data in the form of a balance sheet, an income statement and supporting schedules, providing details of assets, liabilities, capital accounts, income and expenses. Financial data collected from the reports are the primary source of information for supervision and regulation of US banks. In particular, they make it possible to assess the capital group (first step of the risk-based assessment system) and to determine the amount of the contributions. The FDIC determines the institution’s risk assessment after the end of each quarter and the contribution is collected at the end of the following quarter. For example, the amount established at the end of March is paid by members on the 30th day of June through the Federal Reserve’s Automated Clearing House, the only payment system available. As explained above, the FDIC applies a risk-differentiation system to its members which is based on two steps aimed at identifying the amount of risk borne by the financial institutions. In the first step each member is placed into one of three capital groups – well capitalised, adequately capitalised and undercapitalised – depending on a set of leverage ratios and capital ratios. In the second step three supervisory subgroups (A, B and C) are built using the “CAMELS” indicators. Specifically, at the end of the on-site bank examination the supervisor assigns a composite rating, obtained from the following six
24 OCC web-site: http://www.occ.treas.gov/. 25 Federal Deposit Insurance Act, Section 10/d.

June 2008 Final Report on Risk-Based Contributions 54
“CAMELS” indicators: Capital adequacy, Asset quality, Management capability, Earnings quantity and quality, Liquidity adequacy and Sensitivity to market risk. After the risk assessment, the amount of the contribution is determined by allocating each DGS member to a risk class. The latest changes to the rules consolidated the nine risk categories obtainable with the two-step procedure into four risk classes, as shown in Table 26, class I being the least risky and class IV the riskiest.
Table 26: Risk classes
Supervisory subgroup
Capital group A B C
Well capitalised I Adequately capitalised II
III
Undercapitalised III IV Depending on the class to which it is allocated, each member is assigned a rate which determines the amount of contribution to be paid. The contribution is calculated by applying the rate to the total assessment base (total deposit liabilities – total allowable exclusions) declared by the FDIC members in the quarterly reports26. Common annual rates are set for all members in classes II, III and IV, respectively of 10 cents, 28 cents and 43 cents per $100 of assessable deposits held by the institution. In the case of class I, for each institution a specific rate in the range between 5 and 7 cents27 is set by an additional procedure. Depending on the amount of assets and on the rating (if any) of long-term bonds, two different methods are used. For institutions with less than $10bn in assets or without long-term debt issuer ratings, the base assessment rate is determined by combining the “CAMELS” composite rating with other financial ratios (“financial ratio method”). For the other institutions in class I, rates are obtained by weighting the “CAMELS” indicators with a score reflecting the long-term debt issuer ratings (“debt rating method”)28. Class I is particularly significant because it covers around 95% of the total number of financial institutions and around 98% of all US deposits. Moreover, starting from 2010, the rate assigned to institutions in class I will change. Instead of the full spectrum of rates between 5 and 7 cents, only two rates will be used: 2 cents for the less risky banks and 4 cents for the others.
26 Information about quarterly reports can be gathered from the FFIEC website at: http://www.ffiec.gov/forms041.htm. 27 These assessment rates are three base points above the base rate schedule set in the final rule which will be applied in the US starting from 2010, thus lowering the rates to a minimum of 2 cents and a maximum of 40 cents per $100 of assessable deposits. 28 Further technical details of the procedures currently applied by the FDIC to assign a rate to institutions in class I are available at: http://www.fdic.gov/deposit/insurance/risk/2007_01/fr_risk.html. These methodologies will cease to be used from 2010 on.

June 2008 Final Report on Risk-Based Contributions 55
The FDIC, as collection agent, also gathers an additional contribution to repay the 30-year non-callable thrift bonds issued by the Financial Corporation29 (FICO) between 1987 and 1989, with principal totalling approximately $8.1bn. This corporation was created with the sole purpose of serving as a financial vehicle, in case of extraordinary need for resources to reimburse depositors. Since 1991, however, it is no longer responsible for this role. The additional contribution is calculated by applying a set rate to the amount of assessable deposits. The impact of the FICO, which is 118 cents per $100 of assessable deposits, is significantly higher than the above-mentioned rates based on the risk classes and will expire in 2019 when the final bonds mature. Table 27 shows three examples to allow a better understanding of how the payments by the FDIC members are calculated. The second to fourth columns cover the four classes and the last the FICO component. The first two rows list the rates to be applied, the third indicates the formulas for obtaining the contributions and the last three rows show the contributions to be paid for each class, considering three different assessment bases ($0.5bn, $2bn and $5bn). For class II both the minimum and maximum contributions possible are shown. Table 27: Example of annual contribution for the FDIC
Class I Class II Class III Class IV FICO# Rate (cents per 100$) (5 / 7) 10 28 43 118 Rate (dollars per 1$) (0.0005 / 0.0007) 0.0010 0.0028 0.0043 1.18 Formula X·(0.0005 / 0.0007) X·0.0010 X·0.0028 X·0.0043 X·1.18 Contribution (X = $0.5bn) 250 000 / 350 000 500 000 1 400 000 2 150 000 6 150 000 Contribution (X = $2bn) 1 000 000 / 1 400 000 2 000 000 5 600 000 8 600 000 24 600 000 Contribution (X = $5bn) 2 500 000 / 3 500 000 5 000 000 14 000 000 21 500 000 61 500 000
X = total assessment base of the financial institution; # average rate for FICO in 2007
To obtain the quarterly contribution to be paid by each member, the rate for the risk classes and the FICO rate are first multiplied by the total assessment base and then added up. For instance, the quarterly contribution by an institution with a total assessment base of $2bn and classified in risk class II will be $6 650 000 ($2m + $24.6m divided by the number of quarters).
5.3 Indicators adopted This section takes a closer look at the procedures applied to measure the risk borne by financial institutions and to determine the amount of contributions collected by the FDIC. First, the indicators necessary to determine the capital groups are presented and then the CAMELS rating system is briefly explained.
29 Further information on FICO is available at: http://www.fdic.gov/deposit/insurance/risk/assesrte.html.

June 2008 Final Report on Risk-Based Contributions 56
The capital group assignments are made quarterly by the method agreed by the FFIEC Surveillance Task Force for calculating the capital ratios, using only data transmitted by members in the reports. The capital groups (well capitalised, adequately capitalised and undercapitalised) are based on three ratios: the total risk-based capital ratio (r1), the tier 1 risk-based capital ratio (r2) and the tier 1 leverage capital ratio (r3). These are defined as follows30:
assets weighted-Riskcapital Total
1 =r assets weighted-Risk
capital 1Tier 2 =r
assets Averagecapital 1Tier
3 =r .
For each ratio specific parameters are laid down by law to determine the group assessment, as shown in Table 28. To be allocated in a given class, the constraints on all the ratios have to be met. For example, an institution with r1 = 10%, r2 = 6% and r3 = 4.5% will be assigned to the adequately capitalised class.
Table 28: Thresholds for the capital ratios to determine capital groups
Capital ratio Capital group Total risk-based Tier 1 risk-based Tier 1 leverage Well capitalised r1 ≥ 10% r2 ≥ 6% r3 ≥ 5% Adequately capitalised r1 ≥ 8% r2 ≥ 4% r3 ≥ 4% Undercapitalised r1 < 8% r2 < 4% r3 < 4%
The procedure to establish the supervisory subgroups is more complex than the capital group assessment. It is based on the “CAMELS” composite rating, which is set during the on-site examinations of members and generally does not change in the quarterly assessment. The composite indicator rating is a score from 1 (the best) to 5 (the worst), obtained by considering a set of qualitative scores based on the 6 “CAMELS” items (Capital adequacy, Asset quality, Management capability, Earnings quantity and quality, Liquidity adequacy and Sensitivity to market risk), each based on a number of factors. Specifically, depending on the values of the indicators, each member is assigned 6 grades from 1 to 5. There are no specific rules for aggregating “CAMELS” scores into the composite indicator, for instance one indicator may be given more weight than others, depending on the situation. Once the “CAMELS” composite rating is set, the supervisory subgroups are formed: usually financial institutions with a rating of 1 or 2 are assigned to supervisory subgroup A, those with a rating of 3 are placed in supervisory subgroup B and the rest (with a rating of 4 or 5) are allocated to the last subgroup (C). Institutions with a rating of 1 (the least risky) are sound in every respect and any weaknesses are minor and can be handled in a routine manner by the board of directors and the management. These
30 More detailed definitions of the ratios are available at: http://www.fdic.gov/regulations/resources/directors_college/sfcb/capital/instruction2.html.

June 2008 Final Report on Risk-Based Contributions 57
are the members which show the strongest performance and the best risk management practices and which are resistant to external economic and financial disturbances. Institutions with a “CAMELS” rating of 5 exhibit extremely unsafe and unsound practices and a critically deficient performance and often use inadequate risk measures not commensurate to their size, complexity and business position. Usually, this category is reserved for institutions with an extremely high immediate or near-term probability of failure that pose a significant risk to the deposit insurance fund. The other institutions show financial conditions in the middle, between extremely sound and near-to-failure. The main goal of the “CAMELS” components is to investigate specific features of the DGS member and the relationship between them, with the aim of evaluating the sustainability of the business and measuring the risk of possible future negative effects on the fund collected by the FDIC. Each indicator is based on a number of evaluation factors and on the information that the examination authority considers relevant. Table 29 summarises the principal factors used to determine the “CAMELS” ratings. Table 29: Principal factors taken into account to rate the “CAMELS” components
Principal evaluation factors
Capital adequacy
- Level, quality and sources of capital, considering the general financial condition - Balance composition: nature of problem assets, concentration risk and non-traditional
activities
Assets quality
- Diversification, quality and adequacy of allowance for loan and investment portfolios - Risk identification practices and credit risk exposure arising from off-balance sheet
transactions
Management - Impact on performance, risk profile, collection of information and risk monitoring system - The ability to respond to risks that may arise from changing business conditions.
Earnings - Exposure to adverse changes in interest rates, foreign exchange rates and commodity
prices - Level, quality and sources, including trends and stability
Liquidity - The adequacy of sources and the availability of assets convertible to cash without loss - Diversification of funding sources, access to money markets, trend and stability of deposits
Sensitivity - Method to identify, measure, monitor and control market risk exposure - Sensitivity of the soundness to market risks and economic risks.
The institution’s “capital adequacy” is examined in relation to the volume of risky assets and to the possibility of capital deterioration due to the ability of measuring, monitoring and controlling financial risks. The “asset quality” rating reflects the quantity of existing and potential credit risk associated with the loan and investment portfolios, also considering the diversification of credits held. Special attention is paid to the “management” component when assigning the “CAMELS” composite rating, as the ability of directors to respond to changing conditions and to address the risks that may arise from changes in the market is perceived as very significant. The managers must provide clear guidance on acceptable risk exposure levels and ensure that appropriate policies, procedures and practices have been established.

June 2008 Final Report on Risk-Based Contributions 58
The “earnings” rating measures their performance, but also evaluates factors that could affect the quality of the profits and their ability to cover losses and provide adequate capital protection. The adequacy of “liquidity” is connected to two factors. On the one hand, the current and the prospective level of liquidity, compared with funding needs, must be considered. On the other, the rating reflects the ability of the institution to find new resources in case of need and to liquidate assets with minimal loss. Finally, the “sensitivity“ to market risk considers the possibility of deterioration of all the previous variables in the event of adverse changes in interest rates, foreign exchange rates or commodity and equity prices.
Sources Information was gathered from: FDIC website: http://www.fdic.gov/index.html. FFIEC website: http://www.ffiec.gov/. OCC website: http://www.occ.treas.gov/.

June 2008 Final Report on Risk-Based Contributions 59
6. Conclusions One of the self-regulatory issues raised by the European Commission Communication on Deposit Guarantee Schemes (DGS) is voluntary introduction of a common risk-based approach to adjust the contributions paid by DGS members. Increasing the contribution for credit institutions at more risk and reducing it for those at less provides incentives for better risk management and ensures fair treatment of banks and, thus, a level playing field. This report has reviewed current approaches applied across the EU to adjust DGS contributions on the basis of information on the members’ conduct, in order to investigate and compare the indicators applied and the methods used to adjust contributions. To complete the picture, the report has also described the methods applied by other DGS to monitor the conduct of their members, for instance to decide on support interventions or to apply one-off sanctions, even though their contributions are not adjusted to take account of risk-based data. In general, DGS define contributions as a set percentage of a measure of exposure, generally related to the amount of covered deposits by the scheme. Risk-based systems adjust these contributions using one or more indicators of different aspects of their members’ activities. In many cases, indicators are applied to classify DGS members into rating classes, each corresponding to a different adjustment to contributions. Only eight DGS (two in DE, FR, IT1, PT1, PT2, FI and SE) adjust the contributions of all their members, taking into account information on their risk profile, increasing the contributions of the members bearing a greater risk and reducing them for those at less risk. Among them, only IT1 has adopted an ex-post funded system. In two other MS (HU and RO) the DGS may increase members’ contribution only if they are engaged in risky and unsound policies. Finally, although the Polish DGS has not adopted any indicator to adjust contributions, some risk-based information is included in the contribution base, such as the risk-weighted total balance sheet assets, the guarantees and endorsements and the remaining risk-weighted off-balance sheet liabilities. Concerning monitoring systems, 9 DGS (DE1, IT2, PL, RO and the five Austrian DGS) currently supervise the activities of their members by collecting quantitative information on their financial soundness. Among them, the cooperative system in Germany (DE3) uses no qualitative data in the classification system, but adds quantitative information when a member bank is identified as “critical” and is placed under prevention management. In some cases observations are used to decide if/when to intervene in a preventive way to avoid failure of a member or to reduce the impact of the action by the DGS. In other circumstances, results are employed to sanction a member of the scheme in cases where the monitoring system has revealed an increase in its risk exposure or unsound risk management. Little information is available on some of these schemes. In some cases the activities of the members are monitored using quantitative information, such as balance-sheet data aggregated in indicators.

June 2008 Final Report on Risk-Based Contributions 60
According to the information collected, the indicators applied by the DGS to adjust contributions or to monitor their members’ activities generally take the form of ratios using balance-sheet data and/or financial statement data and/or other types of accounting data. Although the ratios applied across MS are currently rather heterogeneous and the variables taken into account to define them are not identical, they can be grouped into three main classes, each related to one particular aspect of the DGS members to be assessed. The first class aims at reflecting the capital structure and/or the solvency profile of the DGS members; the ratios in this class are quite similar across the DGS and are aimed at measuring, for instance, the capital set aside by the members for supervisory purposes or to cover their risk exposure. By contrast, the indicators in the second class measure the riskiness and/or exposure of the banks and are very different from one DGS to another; ratios in this group can be used, for instance, to investigate the volume/quality of the loans of the members or the granularity of their exposure to specific sectors. The third set of indicators covers the profitability/income profile of the DGS members; many ratios in this class compare the income/profit of the schemes’ members with their costs (for instance, their administrative/operating costs). The report has also shown that the way indicators are used by the DGS to adjust contributions is somewhat similar. In general, the contribution base is first multiplied by a set percentage, reflecting the total annual contribution the scheme would like to collect, and is then decreased/increased by a risk-based percentage based on the indicators adopted by the DGS. Members are generally classified into rating classes, the best of which qualify for a decrease in their contribution and the worst for an increase. The reductions range, across the different DGS, from a minimum cutting the contribution to 90% to a maximum lowering it to 75%; the increases vary, taking the contribution up to between 120% and 140%. The methods for obtaining the percentages are quite simple for some schemes, e.g. in PT and FI a single solvency/capital indicator is used. In others (FR, DE3 and IT1), more than one indicator is considered and they are subsequently aggregated, applying a weighting system, in order to obtain a final score/rating for each member. In some DGS the approach can be quite complex and include, for instance, a linear transformation which makes it possible to set the maximum reduction and increase and then obtain the adjustment for each member proportionally to their aggregate score. One specific section of this report compared different approaches, identifying key factors in each system and illustrating the range of variation of the premium adjustment, DGS by DGS. Moreover, since the Commission Communication recommended employing information already available to the schemes to build a common risk-based approach to DGS contributions, the report has also briefly discussed which data are currently accessible to the schemes and from which sources. For 12 DGS only information on deposits is available; for them voluntary application of a risk-based approach would imply collecting additional data. The remaining schemes have access to additional

June 2008 Final Report on Risk-Based Contributions 61
types of information, such as the financial statements of their members (14 DGS), their capital adequacy ratio (19 DGS) and the risk-weighted assets (18 DGS). Few DGS have access to other information, such as the entire balance sheets of their members, their income statements or other supervisory reports. Most DGS collect data directly from their members (18 DGS) and/or receive information from the Central Bank (17 DGS). In the case of 9 DGS the Banking Supervisory Authority (BSA) is also involved. Finally, the last part of the report described the risk-based system applied by the US DGS. The main features of the American approach concern the information available to the DGS and the procedure applied to determine the contribution to be paid by members. The general financial condition of the members is monitored by analysing quarterly reports to be transmitted by the institutions and periodic on-site examinations by a dedicated Federal agency. As regards the contributions, a two-step process, based on three quantitative capital ratios and on qualitative information, is used to assign the members to four risk categories, each corresponding to a different contribution rate. The objective of the ratios is to establish the institution’s capital adequacy. The qualitative information, which is summarised in the form of the “CAMELS” composite indicator and obtained during the on-site examination, analyses the general situation and solidity of the members. This report marks the first step towards proposing a possible risk-based approach for voluntary adoption by the EU MS: it lays the foundation for an open discussion guided by the EFDI WG dealing with this topic.