risk analysis in aquaculture: a step-by-step …pubs.iclarm.net/resource_centre/2015-08.pdfin...
TRANSCRIPT

Risk analysis in aquaculture: A step-by-step introduction with worked examples

2
AuthorsCurtis E. Lind,1 Genya V. Dana,2 Ramesh P. Perera3 and Michael J. Phillips1
Authors Affiliations1 Aquaculture and Genetics Discipline, WorldFish, Penang, Malaysia2 Dana & Sharpe Risk Associates, Arlington, VA 22206, USA
[Disclaimer: This article was written prior to the current employment of G.V. Dana at the US Department of State. The views expressed in this article are those of the author(s), and do not necessarily reflect those of the US Department of State or the US Government.]
3 Biosecurity Australia, GPO Box 858, Canberra ACT 2601, Australia
CitationThis publication should be cited as: Lind CE, Dana GV, Perera RP and Phillips MJ. 2015. Risk analysis in aquaculture: A step-by-step introduction with worked examples. WorldFish, Penang, Malaysia. Manual: 2015-08.
Acknowledgments This research was supported by funding from the Food and Agriculture Organization of the United Nations (FAO) and the CGIAR Research Program on Livestock and Fish. We are thankful to Melba Reantaso, Rohana Subashinghe and Elena Irde (FAO) for their contributions to the design and implementation of the workshop and for the participants who contributed to the workshop outputs that were used in the development of this publication.
Risk AnAlysis in AquACultuRe: A step-by-step intRoduCtion with woRked exAmples
Risk AnAlysis in AquACultuRe: A step-by-step intRoduCtion with w
oRked exAmples

3
Contents
List of boxes 4
List of figures 5
List of tables 6
List of maps 7
Introduction 8
Hypothetical scenario for a risk analysis 9
Methodology and risk analysis approach 11Risk analysis overview 11Scoping the risk analysis 11
Stakeholder identification 11Boundaries and objectives 12Conceptual modeling 14Assessment end points and measurement end points 16
Hazard Identification 17Risk assessment 19
Exposure and effects 19Uncertainty analysis 23
Risk management 26Risk communication 28
Conclusion 29
Notes 30
References 31
Appendices 34
I. Oreochromis species ranges in Zambia 34
II. Additional examples of key stages of a risk analysis – Ecological risks from an introduction of an improved strain of Nile tilapia (Oreochromis niloticus) from Asia to Zambia 38
III. Additional examples of key stages of a risk analysis - Pathogen risks from the introduction of African catfish, Clarias gariepinus, from Nigeria to Zambia for aquaculture 45
Contents

4
list of boxes
list of boxes Box 1 Potential stakeholders relevant to the introduction of GIFT to
Zambia for aquaculture. 12
Box 2 Boundaries and objectives of a risk analysis for the importation of GIFT into Zambia. 13
Box 3 Conceptual model of the potential interactions and linkages that may be affected by genetic impacts associated with the introduction of GIFT to Zambia. 15
Box 4 Assessment and measurement end points for a risk analysis of the potential genetic impacts of introducing GIFT to Zambia for aquaculture. 17
Box 5 Hazards identified that may lead to genetic impacts from the introduction of GIFT into Zambia, and a fault tree diagram highlighting the chain of events that must happen for genetic introgression to occur. 18
Box 6 Evaluating and estimating components of risk regarding the potential genetic impacts caused by a proposed GIFT introduction into Zambia. 20
Box 7 Addressing uncertainty. 25
Box 8 Risk management options for minimizing the likelihood or consequence of potential harms caused by the introduction of GIFT to Zambia for aquaculture. 27
Box 9 Example of an approach for a risk communication strategy for GIFT introduction into Zambia. 28

5
list of figuReslist of figuRes Figure 1 Map of Zambia, highlighting important fisheries areas. 9
Figure 2 Example of a risk evaluation matrix, highlighting differing severity of likelihood, consequence and risk categories, and a cutoff point of an acceptable level of risk (ALOR). 19
Figure 3 Example of data that could be used to inform risk assessment scoring. This figure highlights the replacement of O. mortimeri by introduced
O. niloticus in gillnet catches in Lake Kariba, Zambia. 22
Figure 4 Screenshots from “Subjective Risk Assessment” tool (ACERA), as used for the assessment of GIFT introduction into Zambia. 22
Figure 5 Example of conceptual model developed by workshop participants. 39
Figure 6 Participants’ example of an event tree from escape of GIFT to adverse change in native tilapia species. 40
Figure 7 Conceptual model of the receiving environment and potential interactions relevant to pathogen transfer. 48
Figure 8 Commodity distribution pathway diagram. 50

6
list of tAbles
list of tAbles Table 1 Likelihood table used for risk assessment 20
Table 2 Definition of consequence scores for each end point assessed 20
Table 3 Key publications and sources of information used that may influence and support likelihood and consequence scores 21
Table 4 Common sources of uncertainty encountered in risk analysis 24
Table 5 Hazards Table 41
Table 6 Likelihood table 41
Table 7 Consequences for species richness and/or composition 41
Table 8 Consequences for sustainable fisheries production 42
Table 9 Consequences for nursery zones 42
Table 10 Risk management 44
Table 11 Risk communication 44
Table 12 Hazard Identification Table 49
Table 13 Nomenclature for qualitative likelihoods 51
Table 14 Matrix of ‘rules’ for combining descriptive likelihoods 51
Table 15 Matrix for estimating the ‘likely consequences’ for each outbreak scenario 52
Table 16 Risk estimation matrix 53
Table 17 Risk communication 55
Table 18 Risk analysis 55

7
list of mAps
list of mAps Map 1 Species range of Oreochromis andersonii 34
Map 2 Species range of Oreochromis macrochir 35
Map 3 Species range of Oreochromis mortimeri 36
Map 4 Species range of Oreochromis mossambicus 37

8
intRoduCtion
intRoduCtion This publication is based on materials covered and outputs generated during the Workshop on Risk Assessment Methodologies and Tools for Aquaculture in Sub-Saharan Africa, which was jointly held by WorldFish and FAO in Siavonga, Zambia on 28 June–2 July 2010. The workshop was delivered as a training exercise to 17 participants from seven sub-Saharan countries and was designed to highlight current methodologies and tools available for environmental risk analysis in aquaculture development. A key focus of the workshop was to encourage participants to consider hypothetical but realistic scenarios and to discuss issues relevant to evaluating the environmental risks of a given activity or scenario. This publication presents selected scenarios from the workshop and the outcomes of the deliberative process as developed by the participants. The full workshop prospectus and agenda, including the participants list, can be downloaded at [http://www.worldfishcenter.org/resource_centre/FAO-WFC-Zambia-RA-Workshop-Prospectus.24.June.2010.pdf ] This publication is factual but not comprehensive, therefore any statements or estimations of risk do not represent the actual risks arising from the described scenario. It is intended to serve as an easily readable introduction to risk analysis, highlighting worked examples that will provide guidance on how a risk analysis may be approached in a similar situation.
9
hypothetiCAl sCenARio foR A Risk AnAlysis
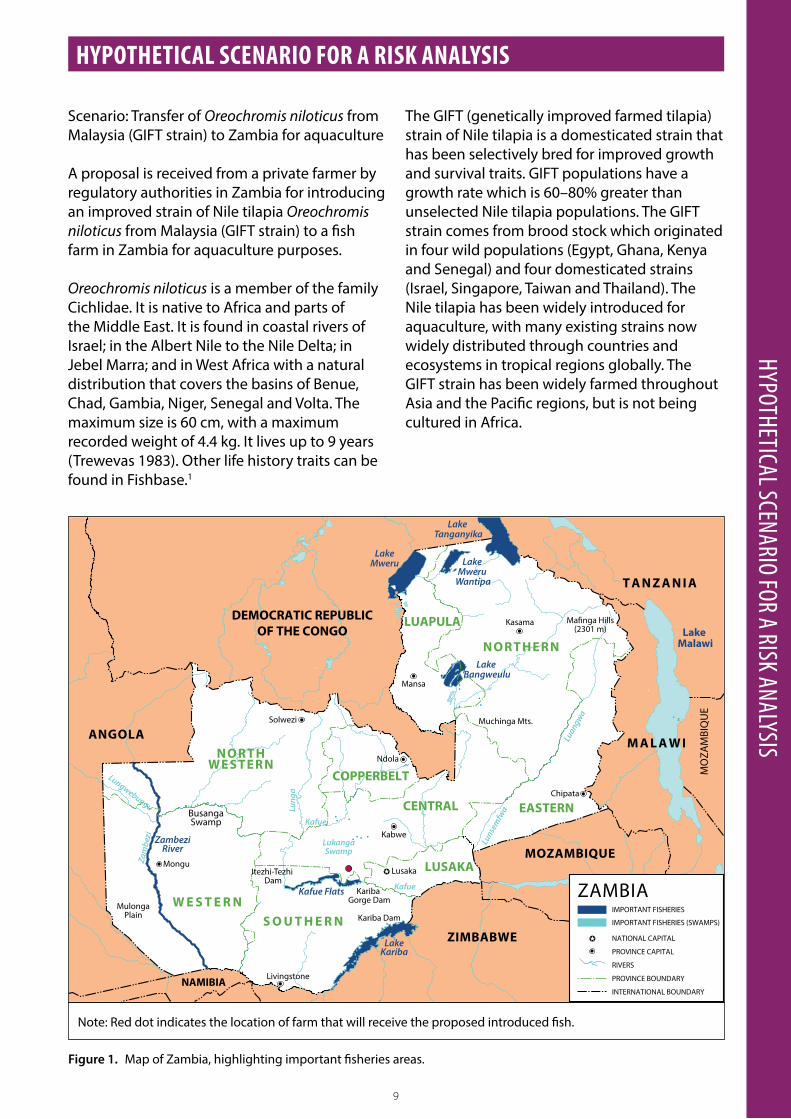
Figure 1. Map of Zambia, highlighting important fisheries areas.
Mongu
Solwezi
Mansa
Ndola
MulongaPlain
Kabwe
Kasama
Muchinga Mts.
Livingstone
Chipata
Lusaka
NORTHWESTERN
W E S T E R NS O U T H E R N
LUSAKA
CENTRAL
LUAPULA
EASTERN
COPPERBELT
NAMIBIA
ANGOLA
DEMOCRATIC REPUBLICOF THE CONGO
MOZAMBIQUE
ZIMBABWE
MO
ZAM
BIQ
UE
T A N Z A N I A
M A L A W I
NORTHERN
Lake Tanganyika
Lake Mweru
Wantipa
Lake Bangweulu
LakeMweru
Lungwebungu
ZambeziRiver
BusangaSwamp
Kafue Flats Kafue
Lung
a
Kafue
LukangaSwamp
Lunse
mfw
a
Luangw
a
LakeKariba
Kariba Dam
Kariba Gorge Dam
Zam
bezi
Lake Malawi
Itezhi-Tezhi Dam
INTERNATIONAL BOUNDARY
RIVERS
NATIONAL CAPITAL
PROVINCE CAPITAL
PROVINCE BOUNDARY
ZAMBIAIMPORTANT FISHERIES
IMPORTANT FISHERIES (SWAMPS)
Scenario: Transfer of Oreochromis niloticus from Malaysia (GIFT strain) to Zambia for aquaculture
A proposal is received from a private farmer by regulatory authorities in Zambia for introducing an improved strain of Nile tilapia Oreochromis niloticus from Malaysia (GIFT strain) to a fish farm in Zambia for aquaculture purposes.
Oreochromis niloticus is a member of the family Cichlidae. It is native to Africa and parts of the Middle East. It is found in coastal rivers of Israel; in the Albert Nile to the Nile Delta; in Jebel Marra; and in West Africa with a natural distribution that covers the basins of Benue, Chad, Gambia, Niger, Senegal and Volta. The maximum size is 60 cm, with a maximum recorded weight of 4.4 kg. It lives up to 9 years (Trewevas 1983). Other life history traits can be found in Fishbase.1
The GIFT (genetically improved farmed tilapia) strain of Nile tilapia is a domesticated strain that has been selectively bred for improved growth and survival traits. GIFT populations have a growth rate which is 60–80% greater than unselected Nile tilapia populations. The GIFT strain comes from brood stock which originated in four wild populations (Egypt, Ghana, Kenya and Senegal) and four domesticated strains (Israel, Singapore, Taiwan and Thailand). The Nile tilapia has been widely introduced for aquaculture, with many existing strains now widely distributed through countries and ecosystems in tropical regions globally. The GIFT strain has been widely farmed throughout Asia and the Pacific regions, but is not being cultured in Africa.
HypotHetical scenario for a risK analysis
Note: Red dot indicates the location of farm that will receive the proposed introduced fish.

10
hypothetiCAl sCenARio foR A Risk AnAlysis
The species occurs in a wide variety of freshwater habitats such as rivers, lakes, sewage canals and irrigation channels. It is mainly diurnal and feeds largely on phytoplankton or benthic algae. Several countries report ecological impacts after its introduction, due to competition with native species and genetic concerns, although the spread of free-living (non-captive) tilapias to areas outside their native ranges has had both both positive and negative effects. Some free-living populations of tilapia that were introduced as alien species for fisheries enhancement or aquaculture provide important sources of food and income, e.g. in Papua New Guinea and Sri Lanka. However, concerns have also been raised over the negative impact of escaped and purposefully released alien tilapia on biodiversity. The numerous documented accounts of interspecific hybridization amongst different tilapia species through artificial or natural mating, has raised significant concerns about the potential genetic impacts of hybridization and genetic introgression of introduced tilapias in Africa.
In this scenario, the species is being considered for introduction into a hatchery and ponds in a watershed near Kafue (near Lusaka) in Zambia. The core breeding nucleus of GIFT is currently maintained by WorldFish at a research station in Kedah state, Malaysia, and would be the origin of fingerlings in the proposed scenario. Fry of Nile tilapia will be introduced and will be reared until they are mature and will be used for subsequent breeding. The original animals will be kept in ponds and tanks in the hatchery/farm complex, but subsequent generations of fry may be distributed to farmers. No special confinement measures are planned, except for the normal farming practices (high pond dikes to avoid flooding losses, care in handling etc.) to avoid losses of an economically important crop. Figure 1 shows the location of the farm.
The surrounding environments are wetlands, a lake and small rivers that drain into the Zambezi River. Flooding is an occasional problem. The location is subject to some disturbance and has a diverse fish fauna (see details in IUCN and associated reports in references). The three-spot tilapia (O. andersonii) and the Kariba tilapia (O. mortimeri) are also present in freshwater systems of Zambia. These species
each have current or potential commercial significance for fisheries and aquaculture in Zambia, but may be prone to adverse impacts from the presence of O. niloticus.
This hypothetical scenario will serve as a basis for a risk analysis, with a focus on the potential genetic impacts of introducing GIFT from Malaysia for aquaculture in Zambia.
11
methodology And Risk AnAlysis AppRoACh
Risk analysis overviewEnvironmental risk analysis is a broad and diverse field. It was first used in ecotoxicology and chemical contamination, but risk analysis approaches are currently being used to address many other environmental issues. Such issues include assessing the risks of pathogen spread, or potential ecological and genetic impacts caused by non-native species introductions. As the field of risk analysis has progressed and evolved, several generalized risk analysis frameworks have emerged that are widely promoted by various governments, organizations and institutions. Although there may be slight variations among the different frameworks and guidelines for risk analysis, in most instances, analogous elements and stages common to all are clearly discernible. The major stages of risk analysis are: (i) scoping or problem formulation, (ii) hazard identification, (iii) risk assessment or characterization, (iv) risk management and (v) risk communication. The worked example outlined in this document follows this general approach, and is based on the risk analysis principles and methodologies described in detail in in the following publications:
• Arthur JR, Bondad-Reantaso MG, Campbell ML, Hewitt CL, Phillips MJ and Subasinghe RP. 2010. Understanding and applying risk analysis in aquaculture: A manual for decision-makers. FAO Fisheries and Aquaculture Technical Paper 519/1. 113pp.
• Burgman MA. 2005. Risks and decisions for conservation and environmental management. Cambridge, UK: Cambridge University Press. 488pp.
• FAO. 2008. FAO Technical Guidelines for Responsible Fisheries. Aquaculture development 3. Genetic resource management. 125pp.
• GESAMP. 2008. Assessment and communication of environmental risks in coastal aquaculture. Reports and Studies GESAMP No. 76: 198pp. FAO, Rome.
• Kapuscinski AR, Li S, Hayes KR, Dana G. 2007. Environmental Risk Assessment of Genetically Modified Organisms. Volume 3. Methodologies for Transgenic Fish. CAB International, Oxfordshire, UK. 304pp.
MetHodology and risK analysis approacH
scoping the risk analysisClearly defining the problem or issue to be assessed is one of the most fundamental components in a risk analysis. All subsequent reasoning and logical argument of the assessment are based on this important step. Successful completion of this step will facilitate an explicit statement of the goals and unambiguously define the boundaries of an analysis.
The ‘scoping’ or problem formulation stage can benefit from further separation into smaller components. Here, we outline several common steps that can contribute towards clearly and explicitly defining a risk analysis and can significantly improve its transparency and defensibility. The following sections outline the different problem formulation stages of stakeholder identification, defining boundaries and objectives, describing a conceptual model, and devising assessment end points and measurement end points of a risk analysis.
Stakeholder identificationThe incorporation of stakeholders’ views and opinions is a key element of modern environmental risk analyses. Since stakeholders of any given socio-ecological system are invariably those who will bear the burden of any potential adverse impact(s) arising from a proposed activity or introduction, their input is considered to be critical in achieving a defensible and trustworthy analysis of risks. This step identifies the stakeholders relevant to the introduction of GIFT in Zambia, as described in Section 1.
Specific questions that an analyst might ask in order to identify important stakeholders are as follows.
• Who are the competent regulatory authorities?
• Who is initiating the proposal? (research institution or development agency or some other partnership)
• Who will buy the fish? • Who are the people or groups that may be
affected by introductions to natural waters?• Are there any other stakeholders?
12
methodology And Risk AnAlysis AppRoACh
Boundaries and objectives It is not always possible to evaluate every single risk in one assessment. Often this is because of limitations in time or financial resources needed to conduct an all-encompassing assessment. In acknowledging such limitations, it is important to delineate what an analysis will and will not investigate. The outcome of this step should result in concise and explicit statement(s) that accurately describes the intent and the scope of the analysis, while avoiding vague or ambiguous terms and phrasing.
During this step, the working group could use a range of available resources such as:
• maps of the receiving environment• description of aquaculture systems and the
community sectors who are likely to adopt it• other reference materials available in the
literature
An example of a potential list of stakeholders relevant to the scenario described in Section 1 is shown in Box 1.
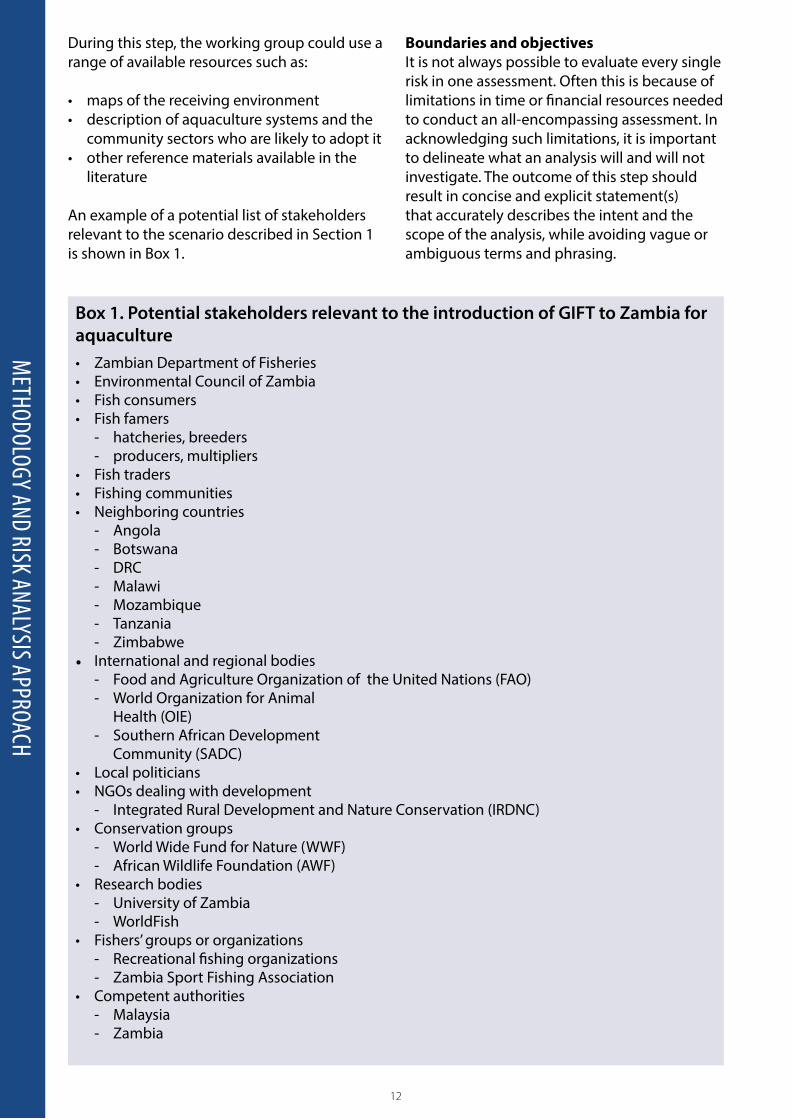
Box 1. Potential stakeholders relevant to the introduction of GIFT to Zambia for aquaculture• ZambianDepartmentofFisheries• EnvironmentalCouncilofZambia• Fishconsumers• Fishfamers
- hatcheries, breeders- producers, multipliers
• Fishtraders• Fishingcommunities• Neighboringcountries
- Angola- Botswana- DRC- Malawi- Mozambique- Tanzania- Zimbabwe
• International and regional bodies- Food and Agriculture Organization of the United Nations (FAO)- World Organization for Animal Health (OIE)- Southern African Development Community (SADC)
• Localpoliticians• NGOsdealingwithdevelopment
- Integrated Rural Development and Nature Conservation (IRDNC)• Conservationgroups
- World Wide Fund for Nature (WWF)- African Wildlife Foundation (AWF)
• Researchbodies- University of Zambia- WorldFish
• Fishers’groupsororganizations- Recreational fishing organizations- Zambia Sport Fishing Association
• Competentauthorities- Malaysia- Zambia

13
methodology And Risk AnAlysis AppRoACh
Box 2. Boundaries and objectives of a risk analysis for the importation of GIFT into ZambiaDomain (type of impacts): The risk analysis will focus on the potential genetic impacts of introduced Nile tilapia on native tilapia species. It will target direct genetic impacts only, namely, the risk of hybridization and genetic introgression.
Geographic scope: The analysis will be restricted to the potential risks that may occur within the Kafue River (Zambia) and the Middle and Lower Zambezi River system (Zambia, Zimbabwe and Mozambique).
Temporal scope: The analysis will consider the potential impacts that are likely to occur within a 10-year time frame. Shorter (one year) and longer (>20 years) time frames were also considered, but after discussion, it was felt this would they would either be too short for detectable impactsto show up, or too long to make realistic and confident predictions of risk.
Statement of risk analysis objective: Combining the above factors, the stated objective for the risk analysis was devised as follows:
“To assess the risk of adverse impacts of genetic introgression and hybridization from Malaysian GIFT with native tilapia species in the Kafue River and middle and lower Zambezi River systems if introduced for aquaculture use.”
Specific questions that an analyst might ask when defining the boundaries and objectives include the following.
• What are the geographic boundaries of the analysis?
• What temporal scale will be assumed when considering potential environmental impacts?
• Can the ‘domain’ of environmental risk or impacts be refined?- e.g. disease risks, genetic risks or
ecological risks• Is there a specific life-cycle stage of the
subject organism that we are concerned with?• Are there budget or time restrictions for
conducting the analysis?
During this step, a range of resource materials to help to define the boundaries and objectives of the analysis can be used. These include:
• maps of receiving environment (watersheds, natural or man-made barriers)
• natural distribution of tilapia species in Zambia
• hatchery manuals (e.g. GIFT Technology Manual, SPC Hatchery Manual).
This step will include consideration of the importation and subsequent movement of Nile tilapia (GIFT strain) and how long impacts may take to materialize or be caught during a monitoring program. An example of the hypothetical boundaries and objectives for the scenario described in Section 1 is shown in Box 2.

14
During this step, the working group should use the generic material available on conceptual modeling, and resource materials such as:
• generic risk analysis resource materials• studies of potential receiving waters
- Zambia - FAO Fishery and Aquaculture Country Profile
- Zambia - FAO Aquaculture Sector Overview- FishBase (Zambia data)
• species profiles from various sources (FAO factsheets, FishBase, IUCN vulnerability lists, other databases) which includes the following information:
- taxonomy - closely related species present in the
receiving environment (same family)- geographical distribution (native and
introduced, within Africa only)- biological tolerance (water parameters:
salinity, temperature etc.)- natural diet- aquaculture practices (hatcheries, farms,
ponds, cages; extensive, intensive etc.) • articles on the freshwater ecology of Zambia.
An example of a conceptual model for the scenario described in Section 1 is shown in Box 3.
methodology And Risk AnAlysis AppRoACh
Conceptual modelingEvery risk analysis that is conducted is based on some conceptual understanding of the system it is investigating. Yet, an explicit description of how an analyst understands or interprets a system and its components is often absent in an analysis. This can provide the foundation upon which logical arguments and reasoning are based downstream in the analysis, such as evaluating the likelihood or consequence of any given event. By describing a conceptual ‘model’ of the system being investigated, it allows a reader (e.g. decision-maker, scientific expert or other stakeholder) to follow the logic and reasoning of the analyst. This offers additional transparency to the analysis and provides an opportunity to identify any possible inaccuracies or inconsistencies. A conceptual model can be presented in many forms, although is most often presented as a graphical representation of a system (such as an influence diagram) accompanied by supporting text (Suter 1999; Landis 2003).
In this step, a conceptual model of the potential receiving system for introduction of Nile tilapia will be developed which considers the components of the receiving environment and their relationships. Elements that commonly appear in conceptual models include: other native fish species; introduced species; crustaceans; amphibians; plants; microorganisms; livestock; and abiotic components such as water flow rate, water quality and water quantity. Values for abiotic components are not required, but could be included in the model as interacting with biotic factors.
Potential reference materials should target information about biotic and abiotic components of potential receiving environments, such as:
• biodiversity surveys or databases- e.g. FishBase, IUCN vulnerable species lists
• studies of potential receiving environments (e.g. water bodies)
• stakeholder interviews.
15
methodology And Risk AnAlysis AppRoACh
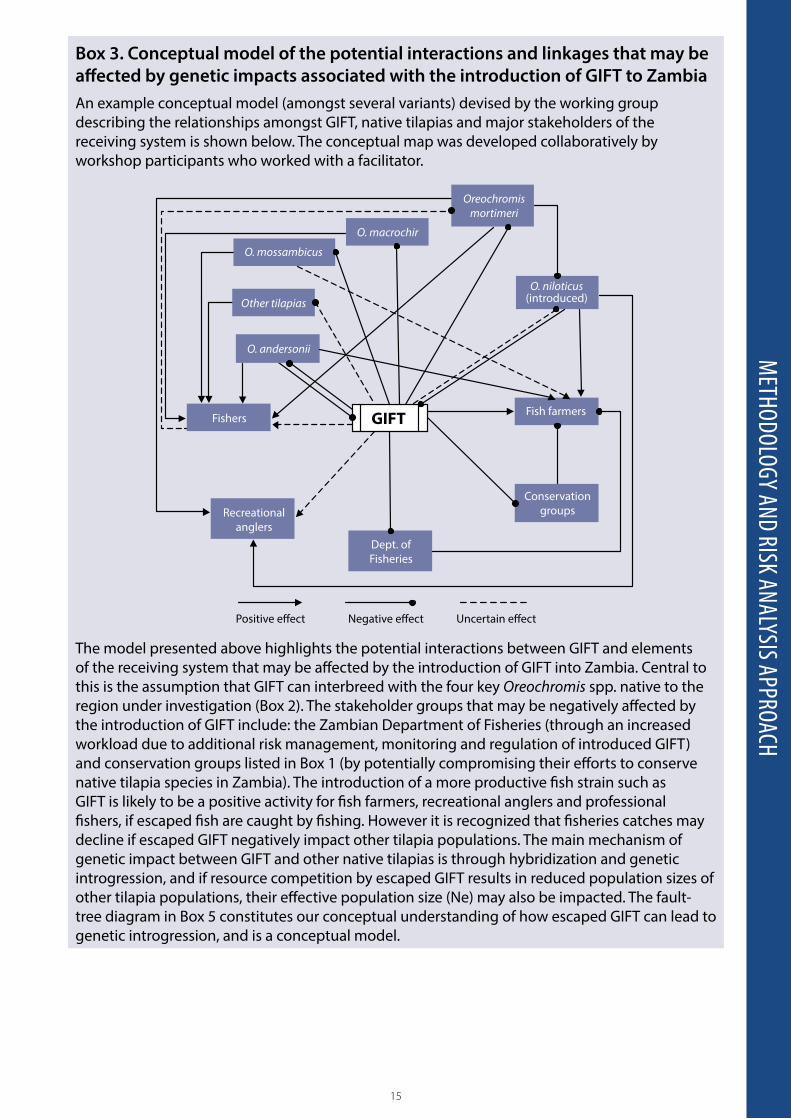
Box 3. Conceptual model of the potential interactions and linkages that may be affected by genetic impacts associated with the introduction of GIFT to ZambiaAn example conceptual model (amongst several variants) devised by the working group describing the relationships amongst GIFT, native tilapias and major stakeholders of the receiving system is shown below. The conceptual map was developed collaboratively by workshop participants who worked with a facilitator.
The model presented above highlights the potential interactions between GIFT and elements of the receiving system that may be affected by the introduction of GIFT into Zambia. Central to this is the assumption that GIFT can interbreed with the four key Oreochromis spp. native to the region under investigation (Box 2). The stakeholder groups that may be negatively affected by the introduction of GIFT include: the Zambian Department of Fisheries (through an increased workload due to additional risk management, monitoring and regulation of introduced GIFT) and conservation groups listed in Box 1 (by potentially compromising their efforts to conserve native tilapia species in Zambia). The introduction of a more productive fish strain such as GIFT is likely to be a positive activity for fish farmers, recreational anglers and professional fishers, if escaped fish are caught by fishing. However it is recognized that fisheries catches may decline if escaped GIFT negatively impact other tilapia populations. The main mechanism of genetic impact between GIFT and other native tilapias is through hybridization and genetic introgression, and if resource competition by escaped GIFT results in reduced population sizes of other tilapia populations, their effective population size (Ne) may also be impacted. The fault-tree diagram in Box 5 constitutes our conceptual understanding of how escaped GIFT can lead to genetic introgression, and is a conceptual model.
Oreochromis mortimeri
O. macrochir
O. niloticus(introduced)
Fishers Fish farmers
Conservation groups
Dept. of Fisheries
Recreational anglers
Positive effect Negative effect Uncertain effect
GIFT
O. mossambicus
Other tilapias
O. andersonii

16
methodology And Risk AnAlysis AppRoACh
Assessment end points and measurement end pointsAssessment end points can be defined as a “formal expression of the environmental values to be protected” (Kapuscinski et al. 2007), and are essential components of a risk analysis. It gives the analysis focus and can lead to approaches that are hypothesis driven. Assessment end points in environmental risk analysis should reflect a valued component of a system and are inherently subjective. The analyst should not depend only upon themselves to decide which assessment end points the analysis will target, and stakeholder input and validation should become a key component of this step. Following Suter (2002), assessment end points should be biologically relevant, operationally feasible, important to society, unambiguously defined, susceptible to the hazard, predictable, and measureable. They should also be related to the conceptual model of the system. The purpose of this step is to identify the assessment end points for the risk analysis for introduction of Nile tilapia. A measurement end point (or monitoring end point) is the metric used to monitor changes in the assessment end point (Kapuscinski et al. 2007). The end point should be something around which a decision can be made and that is measurable, and can inform a “risk acceptance criteria” discussion at a later stage (i.e. how much change in the end point is “acceptable” to stakeholders). An assessment end point may be for example: “decreased freshwater biodiversity” (preferable to simply “biodiversity”), which may be monitored or measured by changes in a species richness index (the measurement end point).
Important questions an analyst should address when determining end points include the following.
• What are the key elements of the socio-ecological system that are valued by stakeholders and are potentially impacted by the proposed activity?- e.g. biodiversity, fisheries catch, genetic
diversity of species X • Are the end points biologically relevant,
operationally feasible, important to society, unambiguously defined, susceptible to the hazard, predictable, and measureable?
Key information sources that may be useful when defining end points are:
• stakeholder meetings, interviews or workshops• government policies• international conventions or guidelines
(e.g. FAO Code of Conduct for Responsible Fisheries (1995), Cartagena Protocol of the Convention on Biological Diversity (2000), ICES Codes of Practice (1988, 2005). See Bartley et al. (2005) for a review)
• a clear and well-defined conceptual model of the receiving system
• expert consultation or literature reviews for defining monitoring end points.
To facilitate a decision to either accept or reject a proposed technology (such as a GIFT introduction), it must be determined what level of risk is acceptable or not for the various assessment end points. It is critical that this step involve stakeholder inputs in determining acceptable levels of risk (occasionally referred to as ALOR). It is important to note that what constitutes an acceptable risk is likely to differ from country to country or regionally, depending on the proposed scenario. Regulatory standards or policy frameworks (such as those mentioned above) may often provide sound guidance to what is an acceptable risk, however, stakeholder consultation is strongly recommended at this stage of the risk analysis process in order to provide robustness and defensibility to subsequent decision-making processes.
The assessment and measurement end points determined for the scenario of GIFT introduction into Zambia are presented in Box 4.

17
methodology And Risk AnAlysis AppRoACh
hazard identificationIn the context of environmental risk analysis,
a hazard is “an act or phenomenon that has the potential to produce harm or other undesirable consequences to what humans value” (Kapuscinski et al. 2007). The hazard identification stage should enable us to identify, characterize and prioritize hazards. There are many different techniques and approaches to identify hazards in risk analysis (e.g. Hayes 2002, 2003; Carey et al. 2007) which can range from unstructured brainstorming to sophisticated exercises. Whereas some approaches are more ‘formalized’ and time-consuming, they are less likely to result in potentially important hazards being overlooked than less rigorous, quicker approaches. The purpose of this step is to identify the hazards associated with the introduction of Nile tilapia with special reference to the potential genetic impacts of the introduction. In this case one may consider:
• the escape of fish into the wild (“a hazard”) which may lead to hybridization or genetic introgression, or other adverse genetic effects (a “harm”) on native wild or cultured stocks;
• an escaped fish encountering a wild fish, which may lead to interbreeding;
• the native tilapia in the region and their conservation status.
During this step, potentially useful information could include:
• life-cycle information of Nile tilapia and other native tilapia from FishBase (Froese and Pauly 2011);
• freshwater ecological studies of Zambia• examples of fault tree diagrams;• IUCN Red List of Threatened Species (www.iucnredlist.org); • studies demonstrating crossbreeding ability
amongst tilapia species or hybridization in the wild.
By examining the above information, this step could create a list of potential species that may be at risk of harm due to the introduction of GIFT into Zambia. If an analysis with greater resolution is necessary, it may be worthwhile considering the chain of events that must occur for a genetic impact (such as hybridization) to occur. To assist the visualization and conceptual understanding of how genetic impacts may arise in the case of GIFT introduction into
Box 4. Assessment and measurementend points for a risk analysis of the potential genetic impacts of introducing GIFT to Zambia for aquaculture Following a ‘silent brainstorming’ and subsequent discussion, three recurring assessment end points emerged (with associated measurement end points) from the group, reflecting valued components of the potentially impacted system. These were used to devise the assessment end points that will guide the next stages of the risk analysis process and provide focus to the analysis.
A. Assessment end point: Purity of native tilapia species• Rationale: Tilapia are a valued group of
native species in Zambia. Hybridization between species is documented to increase the likelihood of extinction of a species (Rhymer and Simberloff 1996). Native tilapia are deemed an important component of healthy aquatic ecosystems in Zambia and it would be undesirable to have this compromised.
• Measured by: Proportion of hybrids in population, occurrence of hybrids
B. Assessment end point: Genetic diversity of native tilapias• Rationale: Tilapia are a valued group
of native species in Zambia. Genetic diversity is a key factor contributing to population resilience and survival (Booy et al. 2000). It may also provide an exploitable genetic resource for potential aquaculture industries in the future (Pullin 1988; Lind et al. 2013), which could be important for Zambian aquaculture in the years ahead.
• Measured by: Molecular genetic diversity indices, allele frequencies
C Assessment end point: Maintenance of subsistence fisheries• Rationale: Tilapias constitute a major
component of consumed fish in Zambia and sub-Saharan Africa. For reasons of food security and upholding the livelihoods of fisher folk, it is deemed highly important that subsistence fisheries are maintained.
• Measured by: Catch per unit effort rates, socioeconomic indices of subsistence fishers

18
methodology And Risk AnAlysis AppRoACh
Introgression: Formation of BC1 individuals
Presence of sexually mature F1 individuals
Sexually mature F1 encounter
mature wild tilapia
Sexually mature wild native
tilapias
Successful mating
Survival of F1 individuals to
sexual maturity
Successful mating
Sexually mature GIFT enter wild
population
Sexually mature GIFT encounter
mature wild native tilapia
AND gate. Output occurs when all inputs are present
OR gate. Output occurs when any input is present
Basic initiating event
Top event. Primary undesired event of interest
Presence of mature GIFT fish
in natural waterbody
Survival to maturity of GIFT
escapees
Sexually mature GIFT escape into
natural waterbody
Formation of F1 hybrid
individuals
Sexually immature GIFT
escape into natural
water body
Box 5. Hazards identified that may lead to genetic impacts from the introduction of GIFT into Zambia, and a fault tree diagram highlighting the chain of events that must happen for genetic introgression to occur
The potential hazards identified in this step were identified through a facilitated brainstorming, based on the assumption that GIFT could only have direct genetic impacts on other tilapia species (sources: FishBase; Froese and Pauly 2011; IUCN Red List)
• InteractionofGIFTwithOreochromis andersonii (native to Zambia)• InteractionofGIFTwithO. macrochir (native to Zambia)• InteractionofGIFTwithO. mortimeri (native to Zambia)• InteractionofGIFTwithO. mossambicus (native to Lower Zambezi River) • InteractionofGIFTwith“othertilapias”
- Tilapia rendalli (very common in the region)- O. mweruensis (occurring only in marginal areas within the geographical boundaries of
analysis)- O. tanganicae (occurring only in marginal areas within the geographical boundaries of
analysis)
Further examination of the published literature, for example, may also help to identify potential hazards that may have been overlooked during a group discussion.
Fault tree exercise:Exercise to elaborate in further detail the chain of events that are necessary for the escape of introduced GIFT fish to impact assessment end point 1 or 2 (from Box 4) through introgression
Figure and event chain adapted from Kapuscinski et al. (2007). Further reading on faulttrees can be found in Hayes (2002)

19
methodology And Risk AnAlysis AppRoACh
Zambia, a fault tree diagram of events from the point of fish escape to a potential impact will be considered as well (Box 5). The purpose of hazard ID is to identify a range of hazards; if the hazards identified are too numerous to be practically evaluated, it may be necessary to prioritize a list of hazards for further evaluation during risk assessment. It may be useful for the analyst (or analysis team) to discuss a variety of hazards; where on the event chain they fall, what the harms might be along the way; and how each hazard may relate to previously identified assessment and measurement end points and the conceptual model. To enhance transparency of an analysis, it is important to document potential hazards that were discussed or identified but deemed to be less important or as high priority as others and not evaluated in further steps.
Risk assessmentThere are multiple methodologies described in the literature for evaluating risk within an environmental risk analysis context (Burgman 2005; Kapuscinski et al. 2007; Vose 2008). These methodologies can range from highly statistical quantitative approaches, to more subjective, opinion-based judgments to inform qualitative and semi-quantitative approaches to risk analysis.
To evaluate the risk of each hazard identified in the previous step, we will use a qualitative approach based on “expert” opinion. The qualitative approach to risk assessment is amongst the most simple and flexible approaches for estimating risk, but it is highly prone to several types of bias and suffers several flaws (Burgman 2001). These shortcomings must be well understood and addressed as thoroughly as possible when taking this approach. Hayes et al. (2007) outline several ways to help maintain the scientific credibility of qualitative and semi-quantitative risk assessment. It is beyond the scope of this document to discuss in detail the various additional approaches to risk assessment; however, further information can be found in the key references listed in section 2.1.
Exposure and effectsThis step attempts to evaluate the exposure to the selected hazards and the effects of this exposure on the various end points identified in earlier stages of the risk analysis. Qualitative and semi-quantitative risk assessments attempt to estimate risk of a particular hazard by multiplying qualitative rankings of the
likelihood that a hazard occurs, with the ranking of consequence (i.e. severity) of the subsequent impact, given the hazard has occurred.
Likelihood and consequence scores are based on clearly defined categories that increase on nominal scales (e.g. from least to most likely, ranging from 1 to 5). The combination of the likelihood and consequence scores is the risk (risk = likelihood x consequence). There are many examples of likelihood and consequence categories in the literature, for example, those outlined by Hewitt et al. (2006). The likelihood and consequence tables used to address the genetic risks of GIFT introduction into Zambia can be seen in Box 6. The risk scores for each hazard can be evaluated using a risk matrix, which helps in the categorization of differing levels of risk. Risk matrices also have various shortcomings that should be well understood (Cox et al. 2005; Cox 2008). A risk evaluation matrix may look like the following:
Questions may be asked for any hazard identified, but we need to ensure that the consequences “to what” are clearly defined (e.g. consequences in terms of numbers of non-native fish in the system, consequences to genetic integrity of native fish and introduced fish, consequences to water quality, etc.).
Figure 2. Example of a risk evaluation matrix, highlighting differing severity of likelihood, consequence and risk categories, and a cutoff point of an acceptable level of risk (ALOR).
Like
lihoo
d of
exp
osur
e1
Significance of consequences2
RISK3
Neg
ligib
le
Negligible
Unshaded Acceptable risk Unacceptable risk
Negligible
Low
Low
Low
Med
ium
Medium
Medium
Hig
h
High
High
Catastrophic
Cert
ain
5
4
3
2
111
22
4
6
8
10
2
33
6
9
12
15
3
44
8
12
16
20
4
55
10
15
20
255
Shaded
1 Usually further defined in an accompanying likelihood table
2 Usually further defined in an accompanying consequence table
3 Cutoff point for permissible risk is defined as the acceptable level of risk (ALOR), determined through stakeholder and government consultation.

20
Box 6. Evaluating and estimating components of risk regarding the potential genetic impacts caused by a proposed GIFT introduction into Zambia
A semi-quantitative risk assessment was conducted on hazards potentially affecting each of the three assessment end points outlined above. Each “expert assessor” gave their respective likelihood and consequence estimates for four hazards per assessment end point.
The hazards assessed were:
• The interaction of GIFT with Oreochromis andersonii• The interaction of GIFT with O. macrochir• The interaction of GIFT with O. mortimeri• The interaction of GIFT with O. mossambicus
Other potential hazards identified in Box 5 were not considered in this risk assessment because priority was given to the most commercially significant species of the genus Oreochromis. Of the six Oreochromis species in the IUCN Red List of Threatened Species (www.iucnredlist.org) that are present in Zambia, two were classified as “Least concern” and are not considered in this risk assessment. Hazards not included in this assessment may warrant further investigation in an extended analysis in the future.
Each hazard was independently given a likelihood score (range 1–5) and a consequence score (range 1–5) by six different “expert assessors”. A risk score was calculated as the product of the likelihood and consequence scores (possible range of 1–25). The following tables were used to guide the scoring.
methodology And Risk AnAlysis AppRoACh
Table 1. Likelihood table used for risk assessment.
Likelihood Score Description1. Rare May occur only in exceptional circumstances2. Unlikely Could occur at some time3. Possible Might occur at some time4. Likely Will probably occur in most circumstances5. Almost certain Is expected to occur in most circumstances
Table 2. Definition of consequence scores for each end point assessed.*
End point A End point B End point CConsequence Score and Rating
Purity of native tilapia populations
Genetic diversity of native tilapia populations
Maintenance of subsistence fisheries
1. Very low 0.0–2.5% occurrence of hybrids in population
0.0–1% change in allele frequencies
0.0–5% reduction catch per unit effort
2. Low 2.6–5.0% occurrence of hybrids in population
1.01–3% change in allele frequencies
6–10% reduction catch per unit effort
3. Moderate 5.1–7.5% occurrence of hybrids in population
3.01–5% change in allele frequencies
11–20% reduction catch per unit effort
4. High 7.6–10 % occurrence of hybrids in population
5.01–7% change in allele frequencies
21–40% reduction catch per unit effort
5. Extremely high >10% occurrence of hybrids in population
>7% change in allele frequencies
>40% reduction catch per unit effort
* Note that these definitions are hypothetical and may not reflect actual values or relative consequences in a real-life scenario with similar consequences. Ideally each consequence category would be validated through stakeholder input and consultation and supported by published literature if available.

21
Table 3. Key publications and sources of information used that may influence and support likelihood and consequence scores.
methodology And Risk AnAlysis AppRoACh
Several key sources of information were used by the group to determine the likelihood and consequence scores for each hazard to the three end points (Table 3). Likelihood-consequence scores of each assessor were summarized and graphically represented using “Subjective Risk Assessment” software from ACERA.2 This software is not necessary to calculate simple risk scores, but it provides a useful and simple tool to identify (and potentially reduce) uncertainty in the scores of different assessors and the range of different risk scores that have been nominated by the
various ‘experts’ consulted. Additionally, its ability to display those assessors who score similarly and those who differ, provides a prompt to ask why is this so? Is it, for instance, because one has had the read pertinent literature and another has not, or is it because of a genuine difference of opinion? A carefully moderated discussion help resolve uncertainty due to misunderstanding or misinterpretation of data or unawareness of literature, and risk scores may be subsequently modified to more appropriately describe risk. Screenshots are shown in Figure 4.
Topic or issue Key information Publication or sourceConservation status of native tilapia species
Oreochromis andersonii: VulnerableO. macrochir: VulnerableO. mortimeri: Critically endangeredO. mossambicus: Near threatened
IUCN Red List of Threatened Species www.iucnredlist.org
Native range overlap with proposed activity
Oreochromis andersonii: YesO. macrochir: YesO. mortimeri: MarginallyO. mossambicus: Downstream only
IUCN Red List of Threatened Species www.iucnredlist.org; see Appendix for maps
Evidence of hybridization with O. niloticus is possible
Oreochromis andersonii: yes, in the wild; Evidence that O. andersonii x O. macrochir hybrids are viable from artificial crossesO. macrochir: Yes, artificially; F2 are sterile O. mortimeri: None found. Evidence that
O. macrochir x O. mortimeri hybrids are possible from artificial crosses
O. mossambicus: Yes, in the wild and artificially
Leveque 1997; Deines et al. 2014; http://goo.gl/v5wEH;
Wohlfarth 1994; Micha et al. 1996; Gregg 1998Leveque 1997;
Wohlfarth 1994; D’ Amato et al. 2006
Importance as a commercial species
Oreochromis andersonii: Important aquaculture and angling speciesO. macrochir: Commercial fishery; commonly
used for aquacultureO. mortimeri: Previously the dominant tilapia
species caught in Lake Kariba, now being replaced by the introduced O. niloticus
O. mossambicus: Important aquaculture species globally; important commercial fishery species in countries where it has been introduced, however, local importance in Zambia is uncertain. Likely to be a common by-catch
Gopalakrishnan 1988; Froese and Pauly 2011
FAO 2004–2011; Froese and Pauly 2011 Darwall et al. 2009 (see Figure 3)
FAO 2004–2011; Froese and Pauly 2011
Documented occurences of introduced O. niloticus in Zambia
Kafue Flats [Common in lower reaches (eastern), rare or absent in upper river sections (north and western)]; Lake Kariba; Northern, Copperbelt; Northwestern, Central and Lusaka Provinces
Schwanck 1995; Canonico et al. 2005 (and references therein); Darwall et al. 2009

22
methodology And Risk AnAlysis AppRoACh
Figure 3. Example of data that could be used to inform risk assessment scoring. This figure highlights the replacement of O. mortimeri by introduced O. niloticus in gill net catches in Lake Kariba, Zambia. Source: Darwall et al. (2009)
Figure 4. Screenshots from “Subjective Risk Assessment” tool (ACERA), as used for the assessment of GIFT introduction into Zambia.
0.8O. niloticus
O. mortimeri0.6
0.4
0.2
1990 1995 2000 2005
No
per n
et s
ettin
g1.0
0.6
0.8
0.4
0.2
0.0
1990 1995 2000 2005
O. n
ilotic
us a
s a
prop
ortio
n of
th
e O
reoc
hrom
is c
atch
In reference to Figure 4, each hazard is entered separately (Figure 4A); in this case, the alphabetical prefix before each species name refers to the three different assessment end points. Multiple assessors can participate (Figure 4B), and each will enter their likelihood and consequence scores for each hazard individually (Figure 4C). In cases where there is
uncertainty, a range of values can be entered. Risk scores for each hazard can be summarized in several ways, for example, as a bar chart (Figure 4D) showing the range of scores across all assessors (red bars) and the average score (black dot) for each hazard. A large range in risk score could indicate high uncertainty and thus provides a tool to identify and address this.

23
methodology And Risk AnAlysis AppRoACh
The prefix code of each hazard (in the screenshots) refers to a consequence specific to the following assessment end points A) ‘Purity’ of native tilapia species; B) Genetic diversity of native tilapias; C) Maintenance of subsistence fisheries. (NOTE: Due caution is required when directly comparing relative risk scores across assessment end points. This is because for each assessment end point, a different consequence table was used.) The risk scores for the various hazards were not measured against and an acceptable level of risk (ALOR) criterion, as this was not determined by the group. A key observation from the risk assessment excersise in this instance is the large variation in risk scores for most hazards assessed (Figure 4D). This represents uncertainty, which would not be easily identifiably if, for example, only average risk scores were used. In this worked excercise, if we assume the ALOR is acceptable for all risk scores below 10, in using only the average score (without considering the range) for the hazard of GIFT hybridization with O. macrochir (A-O.macr in Figure 4D) one would deem that this was an acceptable risk. However, in considering the full range of risk scores for this hazard, it is difficult to ignore that at least one assessor judged this hazard to be of the highest possible risk (score 25). The question must then be asked why is this so? Is it because one assesor is more informed than others? Or perhaps misinformed? A frank and well facilitated discussion amongst assessors should proceed to determine whether this discrepancy in risk scores is due to misunderstanding of an issue (for instance, not knowing about a recent publication), or whether it is a bona fide difference of opinion despite sound understanding of the issue. If it is the former, risk scores may be reassessed and adjusted if necessary. If it is the latter, and risk scores are not swayed even after discussion and knowledge sharing, it is still perfectly acceptable. The particular issue is uncertain and it is important that this uncertainty should be carried through the remainder of the assessment. A similar approach should ideally be taken for all hazards assessed. In taking this approach, several of the flaws of qualitative or semi-quantitative risk analysis can be minimized or avoided. In some cases, it may also be possible to put statistical parameters around the uncertainty of expert opinions and formulate a more sophisticated, probablistic approach to treating uncertainty and its
implications for risk-based decision-making (for further reading on this topic see Vose 2008).
Uncertainty analysisRisk analysis will always involve a degree of uncertainty. Uncertainty can arise in several different forms, which are broadly categorized in the table below. Wherever possible, it is always preferable to minimize uncertainty in a risk analysis. However, in some instances the nature of an uncertain factor cannot be reduced, even if further data is collected (see Table 4). This step involves an analysis of uncertainty and modifying any identified sources to reduce it (or capture it), wherever possible. The types of uncertainty should be identified, thus allowing stakeholders to understand the assumptions being made.

24
methodology And Risk AnAlysis AppRoACh
Source of Uncertainty
Brief Description Example Relevant to Aquaculture
LinguisticAmbiguity Word or phrase can take on
multiple meaningsA “genetically enhanced” fish could be a selectively bred or transgenic fish
Context dependence
Context or relativity of a term is not understood
“Long-term”, “small-scale” or “highly productive” are all context dependent terms
Underspecificity Unwanted generality of a term The statement “catfish will be imported into Fiji” is underspecified with respect to the importation (is it a one-off or a continued, periodic importation?) and the geographic area (will it be imported and used on every Fijian island, or only some?)
Vagueness Occurs when definitive interpretation or categorization is unclear, especially in borderline cases
A concern of a fish introduction may be that it could cause “algal blooms” and subsequently, “fish kills”. Both these terms are vague, as it is unclear what would be the cut off of what does and does not constitute an algal bloom or fish kill. The magnitude of either in this instance is important, since there is always some amount of algae or fish death in a waterbody.
Variability Naturally occurring variation in a process or quantity
Anything that can fluctuate naturally within a system, such as water temperature, fish population size or abundance. Variability is better understood but cannot be reduced by collecting additional data.
IncertitudeMeasurement error
Difference between measured and true value of a quantity, caused by imperfections in observation or equipment
You may be interested in knowing the heterozygosity of an individual if concerned with genetic impacts. Molecular markers can be used to estimate heterozygosity but unless the full genome sequence is known, any estimate is likely to be slightly different from the true value.
Model uncertainty
Incomplete understanding or oversimplification of the potential interactions of the system under investigation
Is usually more important in quantitative risk assessment than qualitative. For example, it may not be known whether an escaped fish will consume all, some, or no species of native aquatic invertebrates and if this will have a positive, negative, or negligible effect on other aquatic communities. A clear conceptual model can help identify or highlight model uncertainty.
Subjective judgment
Uncertainty caused by the subjective interpretation of data or observation
A controlled aquarium trial may show an aquaculture species outcompetes a native species for food or habitat. Uncertainty from subjective judgment may occur if two individuals interpret differently how this result could apply to a natural environment.
Based on Burgman (2005) and Hayes et al. (2007)
Table 4. Common sources of uncertainty encountered in risk analysis.
25
methodology And Risk AnAlysis AppRoACh
The genetic aspects (or others, such as ecological) of the introduction will likely involve several uncertainties; this may include:
• Subjective judgments• Lack of data or information• Variability in the data• Causality – relations between cause and effect
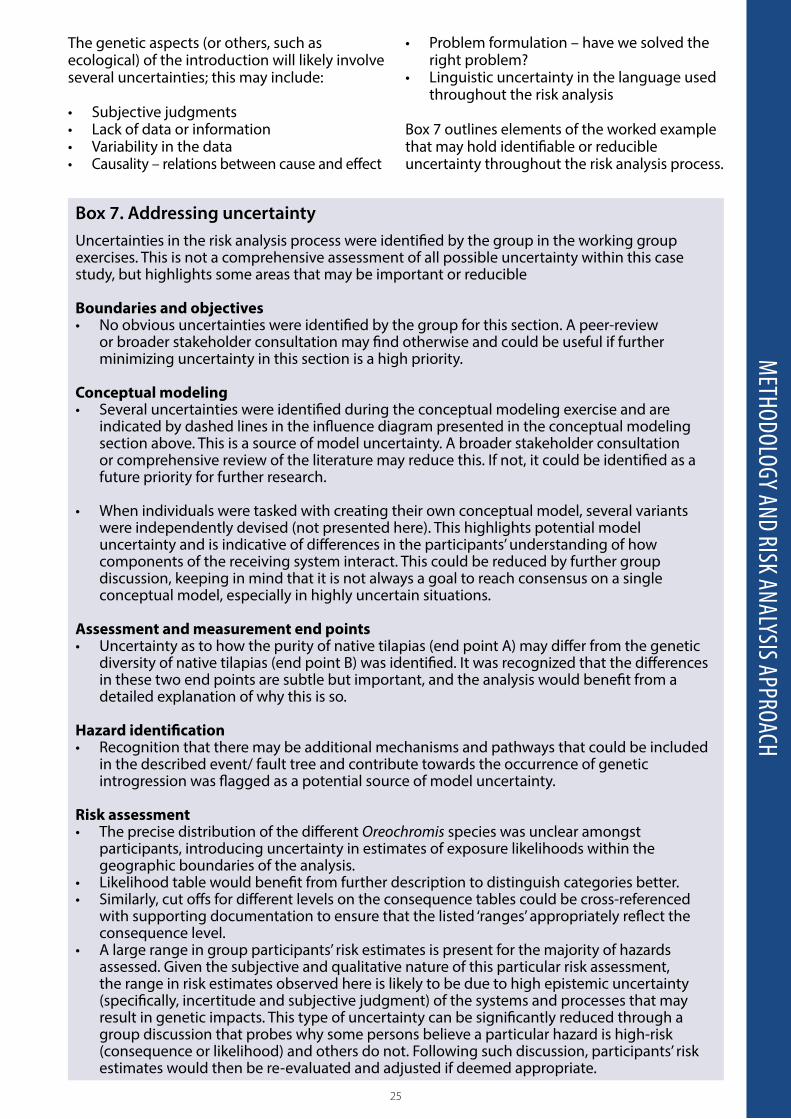
Box 7. Addressing uncertaintyUncertainties in the risk analysis process were identified by the group in the working group exercises. This is not a comprehensive assessment of all possible uncertainty within this case study, but highlights some areas that may be important or reducible
Boundaries and objectives• No obvious uncertainties were identified by the group for this section. A peer-review
or broader stakeholder consultation may find otherwise and could be useful if further minimizing uncertainty in this section is a high priority.
Conceptual modeling• Several uncertainties were identified during the conceptual modeling exercise and are
indicated by dashed lines in the influence diagram presented in the conceptual modeling section above. This is a source of model uncertainty. A broader stakeholder consultation or comprehensive review of the literature may reduce this. If not, it could be identified as a future priority for further research.
• When individuals were tasked with creating their own conceptual model, several variants were independently devised (not presented here). This highlights potential model uncertainty and is indicative of differences in the participants’ understanding of how components of the receiving system interact. This could be reduced by further group discussion, keeping in mind that it is not always a goal to reach consensus on a single conceptual model, especially in highly uncertain situations.
Assessment and measurement end points• Uncertainty as to how the purity of native tilapias (end point A) may differ from the genetic
diversity of native tilapias (end point B) was identified. It was recognized that the differences in these two end points are subtle but important, and the analysis would benefit from a detailed explanation of why this is so.
Hazard identification• Recognition that there may be additional mechanisms and pathways that could be included
in the described event/ fault tree and contribute towards the occurrence of genetic introgression was flagged as a potential source of model uncertainty.
Risk assessment• The precise distribution of the different Oreochromis species was unclear amongst
participants, introducing uncertainty in estimates of exposure likelihoods within the geographic boundaries of the analysis.
• Likelihood table would benefit from further description to distinguish categories better.• Similarly, cut offs for different levels on the consequence tables could be cross-referenced
with supporting documentation to ensure that the listed ‘ranges’ appropriately reflect the consequence level.
• A large range in group participants’ risk estimates is present for the majority of hazards assessed. Given the subjective and qualitative nature of this particular risk assessment, the range in risk estimates observed here is likely to be due to high epistemic uncertainty (specifically, incertitude and subjective judgment) of the systems and processes that may result in genetic impacts. This type of uncertainty can be significantly reduced through a group discussion that probes why some persons believe a particular hazard is high-risk (consequence or likelihood) and others do not. Following such discussion, participants’ risk estimates would then be re-evaluated and adjusted if deemed appropriate.
• Problem formulation – have we solved the right problem?
• Linguistic uncertainty in the language used throughout the risk analysis
Box 7 outlines elements of the worked example that may hold identifiable or reducible uncertainty throughout the risk analysis process.

26
methodology And Risk AnAlysis AppRoACh
Risk managementHere we consider what can be done to reduce risk, either by reducing the likelihood of the hazard happening or mitigating the consequences of the hazard once they are realized. Management objectives will depend on the stage of entry, spread, and/or establishment of the organism in the receiving environment (e.g. one may be addressing whether a certain activity will increase the spread of an already established organism). It is generally true that risk management initiatives for aquatic organisms will be more effective in minimizing the likelihood component of risk than attempting to minimize consequence. Minimizing the consequences of an escaped fish may be possible, but actions such as pest control to reduce feral fish populations can be laborious and costly (and in many cases ineffective). Therefore, reducing the likelihood of the fish escaping in the first place would be a more cost-effective approach to risk management, and addresses the risk at its source.
Stakeholder consultations can also significantly benefit the development of risk management options, by providing feedback as to whether or not a suggested approach is likely to be feasible in a given region. For example, complex pest management approaches implemented in developed countries (such as electric fish barriers or strict licensing restrictions) may be prohibitively expensive or may be too demanding in some regions.
In addition to identifying and implementing risk management measures for a given activity, a suitable monitoring program should be put in place. The output of a risk analysis is only a prediction, irrespective of how much data is available for the risk assessment. Validating this prediction through an adequate monitoring program is a critical step towards sound environmental management and ensuring a risk analysis is effective at minimizing potential dverse impacts. For example, an analyst may recommend that installing mesh screens on all pond outlets would be an effective risk management approach to minimize escapes but if there is no monitoring strategy to confirm this as an effective strategy (e.g. by checking compliance of farmers or reliability of screens), the effort to minimize risk is essentially futile.
Risk management measures for addressing genetic risk related to the introduction of Nile tilapia might consider:
• documentation and controls on movement of live Nile tilapia for farming purposes
• A reporting system for escapes• creating zones for aquaculture activities,
away from important wild populations • improved technology to reduce escape risks• development of targeted Nile tilapia
fisheries• development of sterile fish production
systems.
Risk management options for monitoring its effectiveness for the scenario of introducing GIFT into Zambia for aquaculture are outlined in Box 8.
27
methodology And Risk AnAlysis AppRoACh
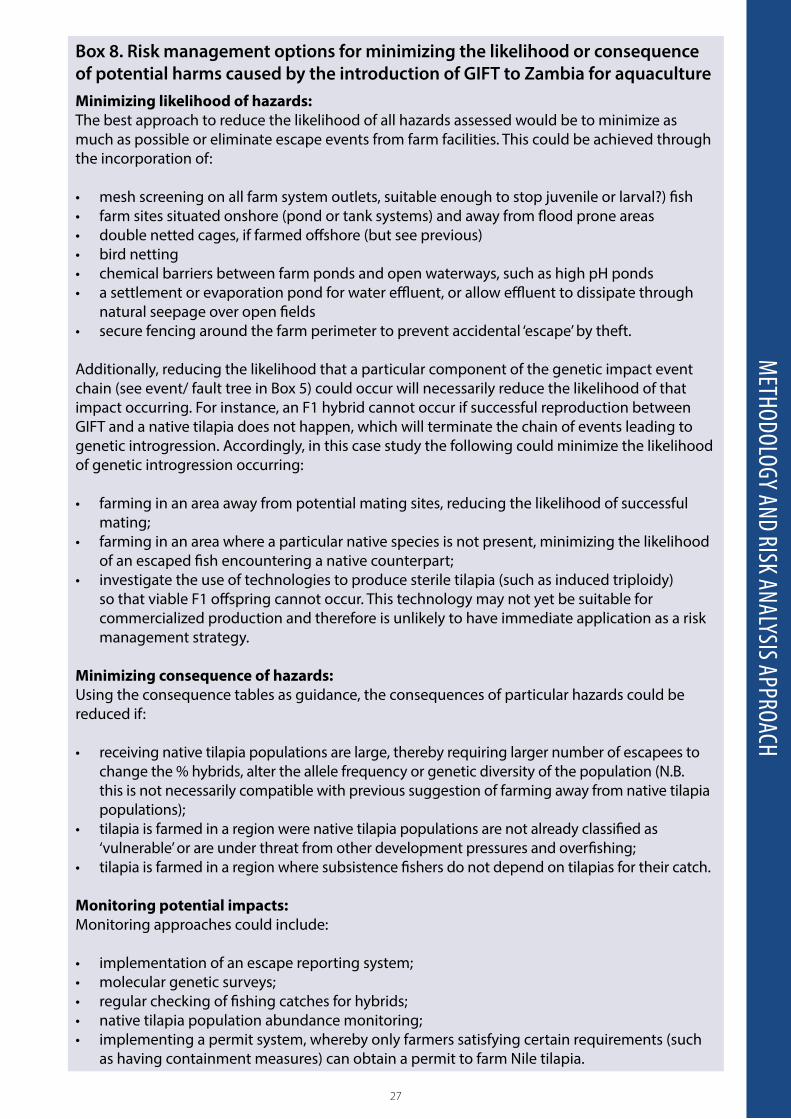
Box 8. Risk management options for minimizing the likelihood or consequence of potential harms caused by the introduction of GIFT to Zambia for aquacultureMinimizing likelihood of hazards:The best approach to reduce the likelihood of all hazards assessed would be to minimize as much as possible or eliminate escape events from farm facilities. This could be achieved through the incorporation of:
• mesh screening on all farm system outlets, suitable enough to stop juvenile or larval?) fish• farm sites situated onshore (pond or tank systems) and away from flood prone areas• double netted cages, if farmed offshore (but see previous)• bird netting• chemical barriers between farm ponds and open waterways, such as high pH ponds • a settlement or evaporation pond for water effluent, or allow effluent to dissipate through
natural seepage over open fields• secure fencing around the farm perimeter to prevent accidental ‘escape’ by theft.
Additionally, reducing the likelihood that a particular component of the genetic impact event chain (see event/ fault tree in Box 5) could occur will necessarily reduce the likelihood of that impact occurring. For instance, an F1 hybrid cannot occur if successful reproduction between GIFT and a native tilapia does not happen, which will terminate the chain of events leading to genetic introgression. Accordingly, in this case study the following could minimize the likelihood of genetic introgression occurring:
• farming in an area away from potential mating sites, reducing the likelihood of successful mating;
• farming in an area where a particular native species is not present, minimizing the likelihood of an escaped fish encountering a native counterpart;
• investigate the use of technologies to produce sterile tilapia (such as induced triploidy) so that viable F1 offspring cannot occur. This technology may not yet be suitable for commercialized production and therefore is unlikely to have immediate application as a risk management strategy.
Minimizing consequence of hazards:Using the consequence tables as guidance, the consequences of particular hazards could be reduced if:
• receiving native tilapia populations are large, thereby requiring larger number of escapees to change the % hybrids, alter the allele frequency or genetic diversity of the population (N.B. this is not necessarily compatible with previous suggestion of farming away from native tilapia populations);
• tilapia is farmed in a region were native tilapia populations are not already classified as ‘vulnerable’ or are under threat from other development pressures and overfishing;
• tilapia is farmed in a region where subsistence fishers do not depend on tilapias for their catch.
Monitoring potential impacts:Monitoring approaches could include:
• implementation of an escape reporting system;• molecular genetic surveys;• regular checking of fishing catches for hybrids;• native tilapia population abundance monitoring;• implementing a permit system, whereby only farmers satisfying certain requirements (such
as having containment measures) can obtain a permit to farm Nile tilapia.

28
methodology And Risk AnAlysis AppRoACh
Risk communicationA clear risk communication strategy is a key component of risk analysis. It can serve as a mechanism to inform stakeholders of the outcomes and findings of an analysis, and can help to inform and guide the analysis. Risk communication may include broad-scale activities, such as public announcements of the conduct of a risk analysis, or it may solicit highly targeted inputs from important stakeholders to assist in the formulation of elements such as assessment end points, conceptual models or a risk assessment. Both factors will contribute
towards the transparency and defensibility of any risk analysis, the benefits of which have been highlighted in previous sections. A good risk communication strategy will help to increase public trust and acceptability of important decisions that are subsequently based upon the outcomes of a risk analysis.
This step considers the risk communication approaches that should be developed with reference to stakeholder identification in earlier steps. Elements of what could contribute towards a risk communication strategy are highlighted in Box 9.
Box 9. Example of an approach for a risk communication strategy for GIFT introduction into ZambiaElements of a risk communication strategy are presented in the following table:
During group discussions, it was collectively agreed and endorsed that all stakeholders need to be informed of all the potential impacts of a given proposal. However, how to balance stakeholder input and communication with the ability or right of the proposal initiators to withhold confidential or commercially sensitive information was discussed. It is expected that this could be a key challenge and a reality for most risk communication strategies, and warrants careful and due attention.
What Who When How
Informing proposal initiator of the conduct of a risk analysis
Dept. of Fisheries Competent authorities
Initial proposal for introduction
Government policy briefs or fact sheets
Obtaining initial stakeholder input on valued components of the system and acceptable level of risk
All affected stakeholders
After boundaries and objectives have been defined but before the risk assessment has been conducted
Targeted letters to major stakeholders; stakeholders register as an interested or affected party, followed by workshop or meeting
Specialist scientific input from outside RA team
Scientific experts and scientific community
During and after completion of risk assessment stage, before final decision or recommendation is made
Peer review; symposia or workshop meeting
Community education of environmental impacts of introduced species
Dept of Education, Dept of Fisheries, conservation groups
Ongoing Community events, agriculture field days, school excursions, aquaculture extension officers

29
ConClusionConClusion This document provides a brief and generalized introduction to the specific steps of an environmental risk analysis, and through the use of worked examples in each step, we trust it can help to highlight the key components in an easily readable format. Throughout the process, we recommend that future risk analyses should place particular emphasis on the importance of stakeholder input (and should document it) and should properly treat uncertainty, minimizing it where possible (e.g. linguistically) or capture it when it is not possible to minimize it any further. Additional examples of the key steps of a risk analysis are presented in Appendix II and III, which highlight alternative risk scenarios, such as hazards from aquaculture activities that may pose ecological or pathogenic risks. This document is not intended to be comprehensive but the many references and methodologies highlighted throughout can contribute significantly towards the conduct of a transparent, honest and defensible risk analyses, and are highly recommended for further guidance.

30
notes 1 FishBase is the largest online database of finfish species on the internet.
2 Australian Centre of Excellence for Risk Analysis: http://www.acera.unimelb.edu.au
notes

31
RefeRenCesRefeRenCes Arthur JR, Bondad-Reantaso MG, Campbell ML, Hewitt CL, Phillips MJ and Subasinghe RP. 2010. Understanding and applying risk analysis in aquaculture: A manual for decision-makers. FAO Fisheries and Aquaculture Technical Paper 519/1: 113pp.
Bartley, D.M.; Bhujel, R.C.; Funge-Smith, S.; Olin, P.G.; Phillips, M.J. (eds.). 2005. International mechanisms for the control and responsible use of alien species in aquatic ecosystems. Report of an Ad Hoc Expert Consultation. Xishuangbanna, People’s Republic of China, 27–30 August 2003. Rome, FAO. 195pp.
Booy G, Hendriks RJJ, Smulders MJM, van Groenendael JM and Vosman B. 2000. Genetic diversity and the survival of populations. Plant Biology 2:379–395.
Burgman MA. 2001. Flaws in subjective assessments of ecological risks and means for correcting them. Australian Journal of Environmental Management 8(4):219–226.
Burgman MA. 2005. Risks and Decisions for Conservation and Environmental Management. Cambridge, UK: Cambridge University Press.
Canonico GC, Arthington A, McCrary JK and Thieme ML. 2005. The effects of introduced tilapias on native biodiversity. Aquatic Conservation: Marine and Freshwater Ecosystems 15(5):463–483.
Carey JM, Beilin R, Boxshall A, Burgman MA and Louisa Flander L. 2007. Risk-based approaches to deal with uncertainty in a data-poor system: Stakeholder involvement in hazard identification for marine national parks and marine sanctuaries in Victoria, Australia. Risk Analysis 27(1):271–81.
[CBD] Convention on Biological Diversity. 2000. Cartagena Protocol on Biosafety to the Convention on Biological Diversity: text and annexes. Secretariat of the Convention on Biological Diversity, Montreal, Canada. Available at: http://bch.cbd.int/protocol/text/
Cox LA. 2008. What’s wrong with risk matrices? Risk Analysis 28(2):497–512.
Cox LA, Babayev D and Huber W. 2005. Some limitations of qualitative risk rating systems. Risk Analysis: An Official Publication of the Society for Risk Analysis 25(3):651–62.
D’Amato ME, Esterhuyse MM, Waal BCW, Brink D and Volckaert FAM. 2006. Hybridization and phylogeography of the Mozambique tilapia Oreochromis mossambicus in southern Africa evidenced by mitochondrial and microsatellite DNA genotyping. Conservation Genetics 8(2):475–488.
Darwall WRT, Smith KG, Tweddle D and Skelton P, eds. 2009. The Status and Distribution of Freshwater Biodiversity in Southern Africa. Gland, Switzerland: IUCN and Grahamstown, South Africa: SAIAB.
Deines AM, Bbole I, Katongo C, Feder JL and Lodge DM. 2014. Hybridisation between native Oreochromis species and introduced Nile tilapia O. niloticus in the Kafue River, Zambia. African Journal of Aquatic Science 39(1):23–34.
[FAO] Food and Agriculture Organization of the United Nations. 1995. Code of Conduct for Responsible Fisheries. 41pp. FAO, Rome.
[FAO] Food and Agriculture Organization of the United Nations. 2008. FAO Technical Guidelines for Responsible Fisheries. Aquaculture Development 3. Genetic Resource Management. 125pp. FAO, Rome.

32
RefeRenCes
Froese R and Pauly D. 2011. FishBase. World Wide Web electronic publication. www.fishbase.org, version (06/2011)
GESAMP. 2008. Assessment and Communication of Environmental Risks in Coastal Aquaculture. Reports and Studies GESAMP No. 76: 198 pp. FAO, Rome.
Gopalakrishnan V. 1988. Role of tilapia (Oreochromis andersonii) in integrated farming systems in Zambia. In Pullin RSV, Bhukaswan T, Tonguthai K and Maclean JL, eds. The Second International Symposium on Tilapia in Aquaculture, Bangkok, Thailand, 16–20 March 1987, 15:21–28. ICLARM, The WorldFish Center. Bogor, Indonesia: CIFOR.
Gregg R. 1998. Introgressive hybridization of tilapias in Zimbabwe. Journal of Fish Biology 52(1):1–10.
Hayes KR, Regan HM and Burgman MA. 2007. Introduction to the concepts and methods of uncertainty analysis. Environmental Risk Assessment of Genetically Modified Organisms: Methodologies for Transgenic Fish 3:188–208.
Hayes KR. 2002. Identifying hazards in complex ecological systems. Part 1: Fault-tree analysis for biological invasions. Biological Invasions 4(3):235–249.
Hayes KR. 2003. Biodiversity sector ecological implications of GMOs. Robust methodologies for ecological risk assessment. Final report: Inductive hazard analysis for GMOs (April).
Hewitt CL, Campbell ML and Gollasch S. 2006. Alien Species in Aquaculture. Considerations for Responsible Use. World. Gland, Switzerland and Cambridge, UK: IUCN.
Kapuscinski AR, Hayes KR, Li S and Dana G, eds. 2007. Environmental Risk Assessment of Genetically Modified Organisms. Volume 3: Methodologies for Transgenic Fish. Oxfordshire, UK: CAB International.
[ICES] The International Council for the Exploration of the Sea. 1988. Codes of Practice and Manual of Procedures for Consideration of Introductions and Transfers of Marine and Freshwater Organisms. Cooperative Research Report, No. 159. 44pp.
[ICES] The International Council for the Exploration of the Sea. 2005. ICES Code of Practice on the Introductions and Transfers of Marine Organisms. 30pp.
[IUCN] International Union for the Conservation of Nature Red List. web resource: http://www.iucnredlist.org/ (accesible April 2014)
Landis WG. 2003. Ecological risk assessment conceptual model formulation for nonindigenous species. Risk Analysis 24(4):847–58.
Lévêque C. 1997. Biodiversity Dynamics and Conservation: The Freshwater Fish of Tropical Africa. Cambridge University Press.
Lind CE, Brummett RE and Ponzoni RW. 2012. Exploitation and conservation of fish genetic resources in Africa: Issues and priorities for aquaculture development and research. Reviews in Aquaculture 4: 125-141.
Micha J-C, Cuvelier R, Tilquin CH, Muraille B and Bourgois M. 1996. Comparitive growth of hybrids (F1, F2 and F3) of Oreochromis niloticus (L.) and O. macrochir (Blgr.). In Pullin RSV, Lazard J, Legendre M, Kothais JBA and Pauly D, eds. The Third International Symposium on Tilapia in Aquaculture, 354–360. ICLARM Conference Proceedings.
Pullin RSV, ed. 1988. Tilapia genetic resources for aquaculture. Proceedings of the Workshop on Tilapia Genetic Resources for Aquaculture 23-24 March 1987 Bangkok, Thailand. ICLARM

33
RefeRenCesConference Proceedings 16. 108 p. International Center for Living Aquatic Resources Management, Manila. Philippines. http://ideas.repec.org/b/wfi/wfbook/1762.html.
Rhymer JM and Simberloff D. 1996. Extinction by hybridization and introgression. Annual Review of Ecology and Systematics 27(1):83–109.
Schwanck EJ. 1995. The introduced Oreochromis niloticus is spreading on the Kafue floodplain, Zambia. Hydrobiologia 315(2):143–147.
Suter II GW. 1999. Developing conceptual models for complex ecological risk assessments. Human and Ecological Risk Assessment 5(2):375–396.
Suter II GW. 2002. Generic assessment end points are needed for ecological risk assessment. Risk Analysis 20(2):173–8.
Trewevas E. 1983. Tilapiine fishes of the genera Sarotherodon, Oreochromis and Danakilia. British Museum Natural History, London. 583p
Vose D. 2008. Risk Analysis: A Quantitative Guide. 3rd ed. West Sussex, England: John Wiley & Sons.
Wohlfarth GW. 1994. The unexploited potential of tilapia hybrids in aquaculture. Aquaculture Research 25(8): 781–788.

34
Appendix i. OreOchrOmis speCies RAnges in ZAm
biA
Appendix i. Oreochromis species ranges in Zambia
Map 1. Species range of Oreochromis andersonii
Source. IUCN (International Union for Conservation of Nature)
Legend:range type (native)
Extant national boundaries
Probably extant lakes, rivers, canals
salt pans, intermittent rivers
Angola
Zambia
Zimbabwe
Namibia
Botswana
Democratic Republic of the Congo

35
Appendix i. OreOchrOmis speCies RAnges in ZAm
biA
Map 2. Species range of Oreochromis macrochir
Source. IUCN (International Union for Conservation of Nature)
Legend:range type (native)
Extant national boundaries
Probably extant lakes, rivers, canals
salt pans, intermittent rivers
TanzaniaDemocratic Republic of the Congo
Zimbabwe
BotswanaNamibia
Mozambique
MalawiZambia
Angola

36
Appendix i. OreOchrOmis speCies RAnges in ZAm
biA Map 3. Species range of Oreochromis mortimeri
Source. IUCN (International Union for Conservation of Nature)
Legend:range type (native)
Extant national boundaries
Probably extant lakes, rivers, canals
salt pans, intermittent rivers
Tanzania
Angola
Malawi
Mozambique
Zimbabwe
Zambia
Botswana
Democratic Republic of the Congo

37
Appendix i. OreOchrOmis speCies RAnges in ZAm
biA
Map 4. Species range of Oreochromis mossambicus
Source. IUCN (International Union for Conservation of Nature)
Legend:range type (native)
Extant national boundaries
Probably extant lakes, rivers, canals
salt pans, intermittent rivers
Madagascar
Lesotho
South Africa
Malawi
Mozambique
Zimbabwe
Zambia
Botswana

38
Appendix ii. AdditionAl exAmples of key stAges of A Risk AnAlysis
Appendix ii. Additional examples of key stages of a risk analysis
Scenario: Ecological risks from an introduction of an improved strain of Nile tilapia (Oreochromis niloticus) from Asia to ZambiaUsing the scenario outlined in Section 1 of the main document, the following highlights the outputs of key risk analysis steps that might arise when considering potential ecological risks of introducing and improved strain of Nile tilapia from Asia to Zambia. As with the example presented in the main body text, the outputs presented here should not be taken as comprehensive and thorough, and are given for demonstrative purposes only.
Step 1: Scoping a risk analysis
Stakeholder identificationPossible stakeholders identified by workshop participants:
• Department of Fisheries, Ministry of Livestock and Fisheries• Environmental Council of Zambia• Commercial aquaculture farmers• Zambia Wildlife Authority• Local fishers• Research institutes (e.g. UNZA, NISIR)• Environmental NGOs• Traditional leaders• Market associations• Pharmaceutical industry/veterinarians• Consumer organizations• Zambezi River Authority• National Food and Nutrition Commission• Initiator of the proposal (WorldFish and African research institutes) Boundaries and objectives Possible boundaries and objectives identified by workshop participants:
Domain: Focus on ecological impacts of the proposed introduction. However, participants recognized that there might be economic impacts from the introduction, resulting from consumer preference for GIFT versus native tilapia. Depending on consumer preference, fishers farming or harvesting the “unpopular” species could suffer economically from reduced demand for their product. This impact should be bracketed and investigated by the relevant authority.
Geographic area: The analysis should be limited to a) the Lower Kafue River 100 km, or b) the Mid-Lower Zambezi basin
Temporal scope: Analysis should encompass the next 5 years, as that is the time frame necessary before adverse effects are visible. Native tilapias reproduce relatively quickly, and other population level changes have been seen 2 years after other introductions.

39
Appendix ii. AdditionAl exAmples of key stAges of A Risk AnAlysis
Conceptual modeling
Positive effect Negative effect Uncertain effect
Fish Farmers
Other Fish Species
Molluscs Crustaceans
Native Tilapias
Non-native TilapiasGIFT (Genetically
Improved Farmed Tilapia
Fishers
Phytoplankton
Zooplankton
Water Quality Effluent
Macrophytes
NurseryZones
Assessment end pointsExample assessment end points identified by workshop participants
• Indigenous tilapia (the entity we value)- Sustained population levels in terms of composition and abundance of indigenous tilapia
species (what we can measure)• CPUE, stock assessment, distribution patterns, disease prevalence (specific measurement
metrics or tools)• Nursery grounds (the entity we value)
- Integrity of the nursery grounds in terms of % vegetative cover, number of juveniles that survive/year (what we can measure)• CPUE, stock assessment, vegetative composition (specific measurement metrics or tools)
• Fisherpersons and fish farmers (the entity we value)- Increase the number of Fish Farmers while maintaining the number of Fisherpersons in terms
of sustainable production and MSY (what we can measure)• Catch assessment surveys, stock assessment (specific measurement metrics or tools)
• Aquatic biodiversity (the entity we value)- Species composition and richness and appropriate roles and relationships between species
(what we can measure)• Species richness index, functional status of different species (specific measurement
metrics or tools)• GIFT (the entity we value)
- Increasing population numbers in terms of % mortality/time and % growth/time (what we can measure)• Survival rates and growth rates, catch assessment surveys (specific measurement metrics
or tools)• Water quality (the entity we value)
- Maintain baseline water quality in terms of pH, dissolved oxygen and turbidity (what we can measure)
- Physical and chemical parameters (specific measurement metrics)
Figure 5. Example of conceptual model developed by workshop participants.

40
Appendix ii. AdditionAl exAmples of key stAges of A Risk AnAlysis
Step 2: Hazard Identification
Assessment end point=Indigeous Tilapia spp.
From a flood or dam failure
Adverse Change in Indigenous Tilapia Species (i.e., the harm)
StuntingChange in
size @ maturity
Change in fecundity
Competition for food
Competition for space
Competition for spawning
sites
GIFT population (not necessarily
viable)
Viable GIFT population
Hybrid tilapia
Pathway not
analyzed
The hazard
The hazard
Successful mating
AND
Viable native tilapia
population
GIFT population established
GIFT survive in receiving
environment
One-time escape of GIFT
GIFT survive in receiving
environment
Continuous escape of GIFT
From birds, water effluent, theft
Figure 6. Participants’ example of an event tree from escape of GIFT to adverse change in native tilapia species.
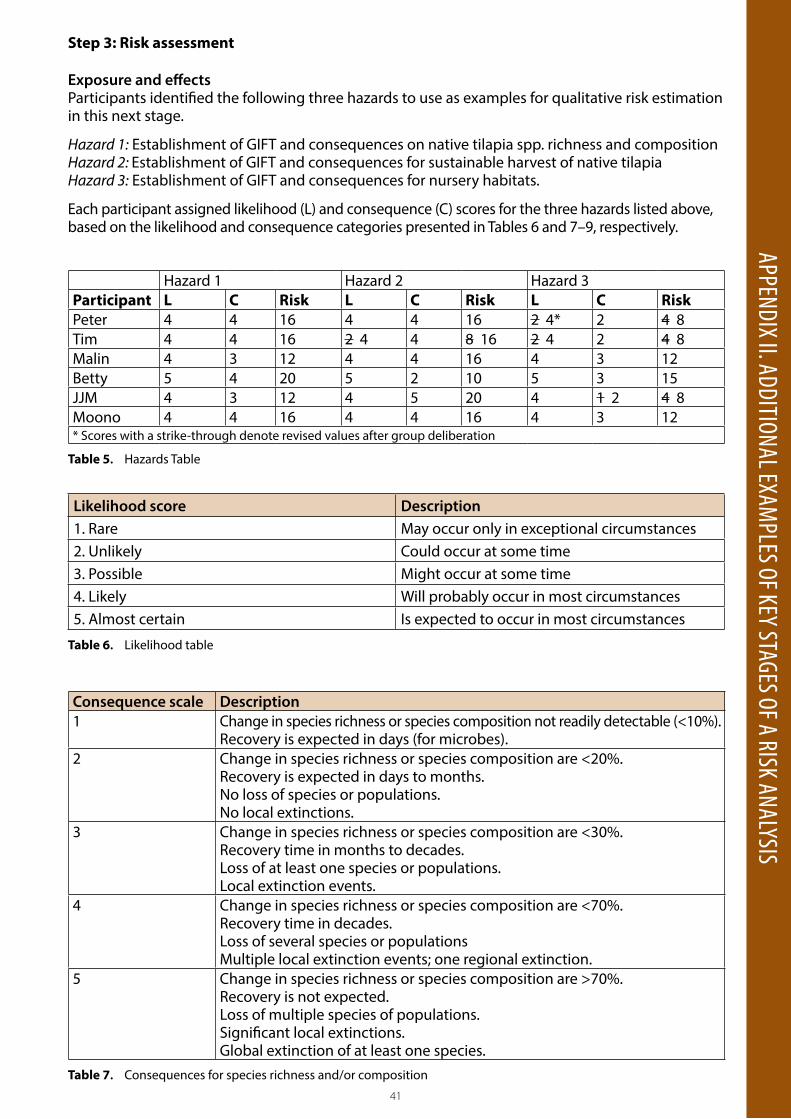
41
Appendix ii. AdditionAl exAmples of key stAges of A Risk AnAlysis
Hazard 1 Hazard 2 Hazard 3Participant L C Risk L C Risk L C RiskPeter 4 4 16 4 4 16 2 4* 2 4 8Tim 4 4 16 2 4 4 8 16 2 4 2 4 8Malin 4 3 12 4 4 16 4 3 12Betty 5 4 20 5 2 10 5 3 15JJM 4 3 12 4 5 20 4 1 2 4 8Moono 4 4 16 4 4 16 4 3 12* Scores with a strike-through denote revised values after group deliberation
Likelihood score Description1. Rare May occur only in exceptional circumstances2. Unlikely Could occur at some time3. Possible Might occur at some time4. Likely Will probably occur in most circumstances5. Almost certain Is expected to occur in most circumstances
Consequence scale Description1 Change in species richness or species composition not readily detectable (<10%).
Recovery is expected in days (for microbes).2 Change in species richness or species composition are <20%.
Recovery is expected in days to months.No loss of species or populations.No local extinctions.
3 Change in species richness or species composition are <30%.Recovery time in months to decades.Loss of at least one species or populations.Local extinction events.
4 Change in species richness or species composition are <70%.Recovery time in decades.Loss of several species or populationsMultiple local extinction events; one regional extinction.
5 Change in species richness or species composition are >70%.Recovery is not expected.Loss of multiple species of populations.Significant local extinctions.Global extinction of at least one species.
Step 3: Risk assessment
Exposure and effectsParticipants identified the following three hazards to use as examples for qualitative risk estimation in this next stage.
Hazard 1: Establishment of GIFT and consequences on native tilapia spp. richness and compositionHazard 2: Establishment of GIFT and consequences for sustainable harvest of native tilapiaHazard 3: Establishment of GIFT and consequences for nursery habitats.
Each participant assigned likelihood (L) and consequence (C) scores for the three hazards listed above, based on the likelihood and consequence categories presented in Tables 6 and 7–9, respectively.
Table 6. Likelihood table
Table 5. Hazards Table
Table 7. Consequences for species richness and/or composition

42
Appendix ii. AdditionAl exAmples of key stAges of A Risk AnAlysis
Species richness: the number of species in a given area.Species composition: the relative abundance of different species (or of different functional groups of species).
Consequence score Description1 0.0 –5% reduction catch per unit effort2 6 –10% reduction catch per unit effort3 11–20% reduction catch per unit effort4 21–40% reduction catch per unit effort5 >40% reduction catch per unit effort
Consequence scale Description1 No significant changes in habitat types.
No new habitat type observed.Populations of habitat forming species not affected (<1% change).No change in area or space availableNo change in vegetative cover or other shelter
2 Measurable changes to habitat type.New habitat type observed.<10% reduction in population abundance of habitat forming species<10% reduction in area or space<10% change in vegetative cover or other shelter
3 <30% of habitat area affected or removed.Moderate changes to habitat type.New habitat types observed.Possible loss of habitat type.<30% reduction in population abundance of habitat forming species<30% reduction in area or space<30% change in vegetative cover or other shelter
4 <70% of habitat area affected or removed.Major changes to habitat type.New habitat types observed.<70% reduction in population abundance of habitat forming species.<70% reduction in area or space<70% change in vegetative cover or other shelter
5 >70% of habitat area affected or removed.Significant changes to habitat type.No preexisting habitat types exist.>70% reduction in population abundance of habitat forming species.>70% reduction in area or space>70% change in vegetative cover or other shelter
Table 8. Consequences for sustainable fisheries production
Table 9. Consequences for nursery zones

43
Appendix ii. AdditionAl exAmples of key stAges of A Risk AnAlysis
Step 4: Uncertainty analysis
Example uncertainties identified by workshop participants at each ERA stepBoundaries and scope:
• The definitions of ecological and environmental are different, so ensure that participants understand which type of assessment they are conducting. Ecological is strictly limited to distributions, abundance and relations of organisms and their interactions with the environment.
• The mandate and scope of the analysis could be constrained, depending on the entity tasked with the assessment and their authority and jurisdiction.
Conceptual modeling:
• Definitions of native fish could be misunderstood. Participants changed “native” to “indigenous”.• There were different pathways and mental models, which necessarily contained different
components and potential assessment end points. Using a different conceptual model could change the focus or results of an analysis.
• Genetically Improved Farmed Tilapia is not a GMO as it was not created by recombinant DNA technology. It was created through selective breeding. It is important to make that clear.
• Definition of Nursery Zones was clarified.
Assessment end points:
• There was uncertainty about what comprises the end point aquatic biodiversity. It does not include hippos and crocodiles.
• Clarified the definition of biodiversity and discussed whether biodiversity itself as a concept is a feasible end point.
• Clarified the definition of “sustainable” in sustainable fisheries end point.
Hazard ID:
• There are alternative pathways to reach the same adverse effect (or harm), primarily through hybrid tilapia. Lack of clarity or analysis could introduce model uncertainty.
• Clarified the difference between a “viable” versus “established” population for the purposes of our event tree.
Risk assessment:
• Definitions of likelihood need to be quantified• Need to define what is meant by “major”, “significant”, etc.

44
Appendix ii. AdditionAl exAmples of key stAges of A Risk AnAlysis
Step 5: Risk management
Participants evaluated the different ways that GIFT tilapia could escape from two systems: hatcheries and ponds, and possible risk management measures.
System Escape route Potential risk management measuresHP Floods Official demarcation of elevation at which hatchery can be placed, using
high water beaconsCoordinated dam management to regulate water levels below reservoirsInspections and enforcement of zoning
P Theft Provide adequate pay and compensation to workersEnsure safe working conditionsMaintain adequate fencingInstitute a tracking system for persons entering and leaving the facilityConduct fish population checksProvide incentives for productivity or safetyTrack movement of fingerlings between facilities
HP Birds NettingScarecrowsDrummers or noisemakersPersons keeping watch and scaring away birds
HP Effluent Install screens that are micrometer meshSedimentation ponds (at least three)Dry and aerate sedimentation pond sand before disposalDispose of effluent on land or agricultural lands
HP= Hatcheries and ponds
Step 6: Risk communication
Participants evaluated how and when to communicate with each stakeholder group during an ERA.
Stakeholder group Boundaries and scope
Conceptual modeling
Assessment end points
Hazard Id Risk assessment
Uncertainty analysis
Risk mgmt
Dept of Fisheries ∆ ∆ ∆ ∆ ∆ ∆ ∆Environmental Council ∆ ∆ ∆ ∆ ∆ ∆ ∆Commercial aquaculture farmers
∆ ∆ ∆ ◊ ◊ ◊ ∆
Zambia Wildlife Authority
* * * * * * *
Local fishers ∆ ∆ ∆ ∆ ◊ ◊ ◊Research institutes ∆ ∆ ∆ ∆ ∆ ∆ ∆Env NGOs √ √ √ √ √ √ √Traditional leaders ∆ ◊ ◊ ◊ ◊ ◊ ◊Fish Markets Inform of final decision via extension officer or fish trader associationsPharmaceuticals * * * * * * *Consumer orgs Inform of final decision via meeting or trade showsZambezi River Authority
◊ via formal contacts
Ntl Food and Nutrition Comm
Inform of final decision via meetings or trade shows
Initiator of proposal ◊ ◊ ◊ ◊ ◊ ◊ ◊∆ = Essential involvement ◊ = Consultation √ =Auditors * = Case by case basis
Table 10. Risk management
Table 11. Risk communication

45
Appendix iii. AdditionAl exAmples of key stAges of A Risk AnAlysis
Scenario: Pathogen risks from the introduction of African catfish, Clarias gariepinus, from Nigeria to Zambia for aquaculture. This example highlights a scenario considering potential pathogen risks of an aquaculture activity. A brief description of the scenario considered is outlined below:
1. Consider a proposal to import a stock of an improved strain of catfish from a country in west Africa (Nigeria) to a country in east Africa (Uganda). The potential impact from the unintentional transfer of aquatic pathogens has raised concern, in terms of risks to aquaculture (current and planned), capture fisheries and freshwater ecosystems. As the relevant authority in the importing country, you are required to assess the pathogen risks associated with the proposal and to make a recommendation on whether or not to allow the translocation and, if allowed, determine the conditions (risk management measures) under which importation can occur.
2. The proposed import is for 10,000 fingerlings of the African Catfish (Clarias gariepinus) for a commercial grow-out enterprise in Lake Kariba.
3. Assume that there is no current catfish aquaculture (pond or cage) in Lake Kariba.4. Consider only the pathogen risks.5. Assume that there is insufficient information to determine Nigeria’s health status with respect
to the hazards identified.6. Assume that the importing country (Zambia) is free of the agents of concern or that the health
status is not known.
The following presents the step-by-step approach used to consider the pathogen risks associated with this proposed activity, following the principles outlined in the main document. The method used has been adapted from that used by the Government of Australia Department of Agriculture in conducting import risk analysis for animal and plant commodities.
Step 1: Scoping a risk analysis
Stakeholder IdentificationTask: Within the discussion group begin identifying important stakeholders and stakeholder groups. Stakeholders are interested or affected persons or parties.
Working group outputDirectly affected groups
• Fish farmers – Importer and exporter, local/Zambian, other farmers• Angling/Sports groups• Capture fisheries groups• Consumer associations/seafood retailers• Feed (fish) companies• Fish transport companies
Government agencies
• Environmental Council of Zambia• Exporting country authorities• Governments of other countriesinvolved – shared watersheds/ neighbours• Local authorities/politicians• Local community – traditional leaders• Operational/ extension staff• Public health authorities• Veterinary and fisheries authorities (Zambia) – Minister’s office, Environment, Foreign Affairs and
other national Government Departments/Ministries;
Appendix iii. Additional examples of key stages of a risk analysis.

46
Appendix iii. AdditionAl exAmples of key stAges of A Risk AnAlysis
Information sources
• Technical expertise – diagnosticians, diagnostic labs, universities, research centers, other experts (including clinicians or fish pathologists)
• International NGOs (e.g. FAO, IUCN, OIE, WWF, WorldFish)• Pharmaceutical/vaccine companies
Boundaries and objectivesTask:
Identify:
1. The possible geographic scope of the analysis. Important questions to ask include a) whether the analysis is of a particular region or natural area (e.g., a watershed), and b) what type of aquatic systems are important (e.g., streams, rivers, ponds).
2. The possible temporal scope of the analysis. Important questions include how far into the future one would need to look to see impacts materialize.
3. The possible type of impacts analyzed. Important questions include whether an analysis will focus on ecological impacts only.
Working group outputThe working group determined that the geographic scope of the assessment would be the whole country, i.e. the risk assessment would determine the risks to the whole country. In this context, the geographical extent would be limited to the waters where host species susceptible to the pathogen of concern exist.
The working group decided that there are two elements to the temporal scope:
The period of time for which the likelihood of disease entry and exposure would be determined – this was decided at one year. This would allow for seasonal changes in environmental, biological and industry factors.
No specific timeframes were set around the period of time over which impacts of disease establishment and spread would be considered as these may be immediate or prolonged. Generally, 20 years was considered would coverall any type of impact.
The need for consistency in these timeframes between different risk assessments was considered essential to ensure consistency and comparability of risk assessments, and consistent application of a country’s ALOP.
The group determined that consistency with WTO and OIE membership required consideration of the types of impacts for pathogen risk assessments as per the international OIE standard, namely:
Direct consequences Aquatic animal infection, disease, production losses and facility closures Adverse, and possibly
irreversible, consequences to the environment Public health consequences.
Indirect consequences Surveillance and control costs Compensation costs Potential trade losses Adverse consumer
reaction.

47
Appendix iii. AdditionAl exAmples of key stAges of A Risk AnAlysis
Conceptual modeling using an influence diagram
1. Using the influence diagram attached as a reference, complete an influence diagram of the receiving system for your case study. Choose five elements from the attached list of socio-ecological components to add to your influence diagram.
2. Add any additional components not on the list that you think might be important to include. 3. Draw in the appropriate types of lines to represent possible relationships between your
components. 4. Add additional components from group discussion to your conceptual model (optional).
Working group outputThe working group recognized that development of conceptual diagram would be of benefit in the consequence assessment component of the risk assessment. The group first identified the following components of the receiving system as being appropriate for consideration in terms of the consequence assessment part of the pathogen risk assessment:
Biotic
• Pathogen• Wild Clarias species• Other fish species• Vertebrate predators• Zooplankton• Phytoplankton• Benthos
Abiotic
• Detritus• Water quality
Socioeconomic
• Recreational fishing/tourism• Capture fisheries• Vessel maintenance industry• Fish consumers• Surveillance/ control/ containment costs• Scientific support

48
Appendix iii. AdditionAl exAmples of key stAges of A Risk AnAlysis
The relationships between these elements are represented in the figure below:
Step 2: Hazard ID
1. Use the hazard identification table format in the handout to identify 10 potential hazards based on the OIE Code and other materials provided.
2. Refine selection of these pathogens by applying the refinement criteria (below) and identify those pathogens considered to required detailed risk assessment. Consider: a. if the disease agent (hazard) is associated with (may be present in) the commodity, b. if the agent is exotic to the receiving environment/country (or is under a control programme), and c. if it could cause significant impact.
3. Select a single disease agent on which to undertake a risk assessment.
Working group outputA hazard identification exercise was conducted using the OE listed diseases and information available on the Internet as well as the knowledge of the participants.
The hazard identification table is provided below.
The group decided that for purposes of the workshop, detailed risk assessment would be conducted on Edwardsiella ictaluri, which causes enteric septicaemias of catfish (ESC)
Figure 7. Conceptual model of the receiving environment and potential interactions relevant to pathogen transfer.
OTHER FISH SPECIES
SURVEILLANCE, CONTROL,
CONTAINMENT COSTS
VERTEBRATE PREDATORS
OTHER FISH SPECIES
CAPTURE FISHERIES
SURVEILLANCE, CONTROL,
CONTAINMENT COSTSVESSELS/
MAINTENANCE AND
CONSUMERS
SCIENTIFIC SUPPORT
RECREATIONAL FISHERS/TOURISM
ZOOPLANKTON PHYTOPLANKTON
DETRITUS
WATER QUALITY
PATHOGENWILD CLARIUS SPECIES

49
Appendix iii. AdditionAl exAmples of key stAges of A Risk AnAlysis
Pathogen Exotic to country/environment or controls in place?
Pathogen associated with the commodity/species?
Potential to cause significant disease in the importing country/environment?
Retained for risk assessment?
Edwardsiella ictaluri YES YES YES YES
Flavobacterium columnare NO YES YES NO
Epizootic ulcerative syndrome (Aphanomyces invadans)
NO (Controls in place)
YES YES YES
Gyrodactylus rysavyi NO YES NO NO
Ichthyophthirius multifiliis NO YES NO NO
Saprolegniasis NO YES NO NO
Gnathostomiasis NO YES YES (Zoonotic) NO
Diplostomum NO YES NO NO
Aeromonas hydrophila NO YES NO NO
Channel catfish virus disease
YES YES YES YES
Edwardsiella tarda YES YES YES YES
Step 3: Risk assessment: Edwardsiella ictaluri
Task:
1. Identify exposure groups.2. Draw commodity distribution pathway diagram (from source population to exposure groups).3. Construct (based on the commodity distribution diagram) release and exposure pathway
diagrams that identify key risk determinant steps of pathways. 4. Determine consequences (impacts) in terms of animal health, environmental and socio-
economic impacts that would occur in the event of successful pathogen entry and exposure. 5. Estimate overall unrestricted risk.
Working group outputEstimation of the Likelihood of Entry and Exposure
Two exposure groups were identified:• farmed catfish in Lake Kariba • wild catfish in Lake Kariba
Table 12. Hazard Identification Table.

50
Appendix iii. AdditionAl exAmples of key stAges of A Risk AnAlysis
SOURCE POPULATION
(LIVE JUVENILE FISH IN EXPORTING COUNTRY)
ARRIVAL AT PORT OF ENTRY IN ZAMBIA
SATELLITE HATCHERY/QUARANTINE
RELEASE/ESCAPE OF INFECTED FISH INTO
THE LAKE
SUSCEPTIBLE WILD FISH IN LAKE KARIBA
ESTABLISHMENT AND SPREAD
EXPOSURE
RELEASE
PROCESSING EFFLUENT
DISPOSAL OF MORTS
FOMITES Release/escape etc
Susceptible wild fish in other watersheds in Zambia
HUMAN FOOD WASTE
FARM CAGES IN LAKE KARIBA ILLEGAL SALE TO OTHER FARMS
The following commodity distribution pathway diagram was constructed, incorporating release and exposure pathways.
The bold arrows represent pathways of release, exposure or establishment and spread that are considered most significant.
Figure 8. Commodity distribution pathway diagram.

51
Appendix iii. AdditionAl exAmples of key stAges of A Risk AnAlysis
The following biological and commodity factors were considered relevant to the determination of release and exposure likelihoods:
Biological factors
• There is (an assumed) carrier state• Transmission by faecal/oral exposure, predation and direct contact• The pathogen can remain viable in water for over a week• The stocking density of fish in cages is high – farm conditions increased likelihood of disease
spread and spread to fish in the vicinity of the cages • There is broad range of susceptible fish species in Lake Kariba• The pathogen is highly transmissible• Catfish fingerlings pose the same risk as adult fish
Commodity factors
• Commodity of concern is live fish, which can carry the pathogen• Large number of fish to be imported –10,000• All imported fish to be put in a single site – large point source of infectious material• Waste disposal a source of spread (mot fish are killed at the farm and sold for drying, smoking or
cooking).• The production cycle is about 6 months.
Likelihood estimations were made using Tables 1 and 2 below.
High Moderate Low Very low Extremely low NegligibleHigh High Moderate Low Very low Extremely low NegligibleModerate Low Low Very low Extremely low NegligibleLow Very low Very low Extremely low NegligibleVery low Extremely low Extremely low NegligibleExtremely low Negligible NegligibleNegligible Negligible
Likelihood Descriptive definitionHigh The event would be very likely to occurModerate The event would occur with an even probabilityLow The event would be unlikely to occurVery low The event would be very unlikely to occurExtremely low The event would be extremely unlikely to occurNegligible The event would almost certainly not occurLikelihoods for the release and exposure assessment were combined using the matrix of ‘rules’ for combining descriptive likelihoods shown in Table 2.
Table 13. Nomenclature for qualitative likelihoods
Table 14. Matrix of ‘rules’ for combining descriptive likelihoods
The overall likelihood of release was determined to be HIGH.The overall likelihood of exposure was determined to be HIGH.
The overall Likelihood of Entry and Exposure was determined to be:
Release x Exposure = HIGH x HIGH = HIGH

52
Appendix iii. AdditionAl exAmples of key stAges of A Risk AnAlysis
Estimation of the likelihood of establishment and spreadBecause of time limitation, only a single outbreak scenario was considered; namely, that there is an outbreak in the farm as a result of import juveniles carrying the pathogen, and that the disease spreads other farm cage fish and to other susceptible wild fish species in Lake Kariba.
The working group considered that the likelihood of establishment and spread would be high if prevalence in the farmed fish was greater than 5% or that farm practices favored transmission (e.g. mortalities were not removed promptly or of environmental conditions caused stress). If, however, good farm practices were in place (e.g. good biosecurity practices aimed at reducing transmission) as is likely to be the case or if prevalence of infection remained below 5%, then the likelihood of establishment and spread would be MODERATE.
Estimation of impactsBecause of time limitations, a simplistic approach was taken to estimating impacts, examining qualitatively the potential biological, economic and social impacts of disease establishment and spread.
The overall estimation of impacts associated with the outbreak scenario was determined to be MODERATE because:
• Wild vertebrate predator populations that fed on catfish would be affected.• Catfish were considered important to the natural ecology of the lake.• Harvest of wild catfish populations important to the local subsistence fishery would be affected.• There was no documented evidence that E. ictaluri caused significant wild fish kills, but taking a
precautionary approach, it was assumed that this could happen.• International trade implications resulting form the establishment of ESC in Lake Kariba were
determined to be minimal.
Estimation of likely consequencesThe likely consequences were determined using table 3
Like
lihoo
d of
est
ablis
hmen
t or
spre
ad
High Negligible Very low Low Moderate High Extreme
Moderate Negligible Very low Low Moderate High Extreme
Low Negligible Negligible Very low Low Moderate High
Very low Negligible Negligible Negligible Very low Low Moderate
Extremely low Negligible Negligible Negligible Negligible Very low Low
Negligible Negligible Negligible Negligible Negligible Negligible Very low
Negligible Very low Low Moderate High Extreme
Consequences of establishment or spread
Table 15. Matrix for estimating the ‘likely consequences’ for each outbreak scenario
The Likely consequences were determined to be (using table 3):
Likelihood of Establishment and Spread x Impacts = MODERATE x MODERATE = MODRATE

53
Appendix iii. AdditionAl exAmples of key stAges of A Risk AnAlysis
Unrestricted risk estimationThe overall unrestricted risk for the farmed fish exposure group was determined using table 4
Step 4: Uncertainty analysis
Table 16. Risk estimation matrix
Like
lihoo
d of
ent
ry a
nd e
xpos
ure
High likelihood
Negligible risk
Very low risk
Low risk Moderate risk
High risk Extreme risk
Moderatelikelihood
Negligible risk
Very low risk
Low risk Moderate risk
High risk Extreme risk
Low likelihood
Negligible risk
Negligible risk
Very low risk
Low risk Moderate risk
High risk
Very low likelihood
Negligible risk
Negligible risk
Negligible risk
Very low risk
Low risk Moderate risk
Extremely low likelihood
Negligible risk
Negligible risk
Negligible risk
Negligible risk
Very low risk
Low risk
Negligible likelihood
Negligible risk
Negligible risk
Negligible risk
Negligible risk
Negligible risk
Very low risk
Negligible impact
Very low impact
Low impact
Moderate impact
High impact
Extreme impact
Consequences of entry and exposure
The overall unrestricted risk for the farmed fish exposure group was estimated to be (using table 4):
Likelihood of Entry and Exposure x Likely Consequences = HIGH x MODERATE = MODERATE
Task:1. Identify uncertainties in the following steps of the risk analysis process that your group has just
completed: Boundaries and Scope, Hazard ID, and Risk Assessment.2. Refer to the handout of definitions of different types of uncertainty if you get stuck.3. Write down 2–3 examples of uncertainty at each designated risk analysis step:
Boundaries and scope
Hazard ID
Risk assessment
Are there any other steps you think might also contain uncertainty?

54
Appendix iii. AdditionAl exAmples of key stAges of A Risk AnAlysis
Step 5: Risk management
Task:1. Determine need for risk management – comparing unrestricted risk against ALOP.2. List risk management options.3. Determine restricted risk for some options or combination of options.4. Determine least trade-restrictive option or combination of options.
Working group outputAppropriate level of protection or acceptable level of risk using the methodology provided is VERY LOW.
Thus, using table 4, the unrestricted risk (MODERATE) is considered too high and as requiring risk management.
Potential risk management measures that would reduce the likelihood of release (from HIGH to):1. Quarantine observation MODERATE2. Specific pathogen free stock (tested free over time) LOW3. Pathogen free zone/compartment LOW4. Pre-export treatment MODERATE5. Pre-export batch testing LOW6. Limit life stage imported to eggs or broodstock to quarantine facility NEGLIGIBLE7. Pre-export stress testing HIGH (no change)
Potential risk management measures that would reduce the likelihood of exposure (from HIGH to):8. Treatment post-arrival MODERATE9. Quarantine observation (post-arrival) MODERATE10. Post-arrival batch testing LOW11. Post-import facility management/biosecurity MODERATE
The following risk management measures or combinations of measures were considered to reduce the overall risk (ie the restricted risk) to an acceptable level.
• Option 6 would reduce the overall risk to NEGLIGIBLE• Options 5 and 10 would reduce the overall risk to VERY LOW• Options 2 and 3 would reduce the overall risk to VERY LOW• Options 2 and 10 would reduce the overall risk to VERY LOW• Options 3 and 10 would reduce the overall risk to VERY LOW

55
Appendix iii. AdditionAl exAmples of key stAges of A Risk AnAlysis
Step 6: Risk communication
Working group outputThe working group identified three groups of stakeholders for risk communication as per the first exercise and corresponding modes of communication with each group:
PHASE OF ANALYSIS TARGET AUDIENCE TOPICPRE-SCOPING government agencies:
public health, environment, foreign affairs, provincial governments; chief veterinary officer
• commodity description• end-use• source country
SCOPING all stakeholders • commodity description• end-use• source country
HAZARD ID all stakeholders • draft list of hazards• technical issues
RISK ASSESSMENT/MANAGEMENT all stakeholders • draft assessment and proposed management measures
IMPLEMENTATION importers exporters competent authorities in exporting countries
• detailed import requirements
STAKEHOLDER GROUP MODES OF COMMUNICATION• Directly affected stakeholders, e.g. capture
fisheries groups or tourism groups• Radio, newspaper• Extension services• Community meetings• ‘Mobile loudspeaker’ announcements• Internet• Industry association newsletters
• Government agencies e.g. Environmental Council of Zambia or the competent authority in potential exporting countries
• Email/list server• Letters from local government authority
• Technical groups, e.g. university academics and diagnostic laboratories/diagnosticians.
• Email/letters• Industry association newsletters
For each phase of the risk analysis process, the working group identified who would be consulted (TARGET AUDIENCE) and the topic of consultation as follows:
Table 17. Risk communication
Table 18. Risk analysis

This publication should be cited as: Lind CE, Dana GV, Perera RP, Phillips MJ. 2015. Risk analysis in aquaculture: A step-by-step introduction with worked examples. WorldFish, Penang, Malaysia. Manual: 2015-08.
About the CGIAR Research Program on Livestock and FishIn developing countries, poor people, especially women and children, consume very little meat, milk and fish. This contributes to nutrient deficiencies and poor physical and cognitive development for children; and poor health and livelihood outcomes for adults. Additionally, the productivity of small- and medium-scale livestock and fish producers and marketing systems in developing countries lags far behind those in other parts of the world. The CGIAR Research Program on Livestock and Fish seeks to increase the productivity of small-scale livestock and fish systems in sustainable ways, making meat, milk and fish more available and affordable to poor consumers across the developing world.
© 2015. WorldFish. All rights reserved. This publication may be reproduced without the permission of, but with acknowledgment to, WorldFish.
Paper made fromrecycled material
100% RECYCLED
Contact Details:WorldFish, PO Box 500 GPO,10670 Penang, MALAYSIAwww.worldfishcenter.org
Photo credit: Front cover, Peter Fredenburg/WorldFishPhoto credit: Back cover, Stevie Mann/WorldFish