risk adjusters: an update
TRANSCRIPT

RECORD OF SOCIETY OF ACTUARIES
1995 VOL. 21 NO. 4B
RISK ADJUSTERS: AN UPDATE
Moderator: JAMES N. ROBERTSPanelists: DAN DUNN*
GARY M. KOSCIELNYALICE ROSENBLATT
Recorder: JAMES N. ROBERTS
This panel will present the results ofrisk adjuster research and discuss the potential use ofrisk adjusters in healthcare reform efforts.
MR. JAMES N. ROBERTS: We have two topics that we're going to be discussing. Oneof them is an update on the Society-sponsored research study on risk adjusters. To bringus up to date on that, we have Alice Rosenblatt, who's a principal at Coopers & Lybrandand is also the chairperson of the risk adjusters work group.
With Alice, we have Dan Dunn. Dan is a senior research economist at the Department ofHealth, Policy, and Management at the Harvard School of Public Health. Dan has beenworking over the past year as the principal investigator on the Society-sponsored studythat compared different methods of risk assessment. Previous to that, Dan worked for aneight-year period as the technical director of the resource based relative value schedule(RBRVS) project at Harvard, which is probably of interest to many of us. In addition tohis work at Harvard, Dan is the director of research at Cambridge Health EconomicsGroup.
On a second topic, Gary Koscielny is going to give us an update on the experience of therisk adjustment technique being used in the New York small-group reform statutes. Garyis vice president and chief actuary at Amalgamated Life, and his company is the adminis-trator of that program in New York state.
MS. ALICE ROSENBLATI': I'm going to be talking about the research paper as Jimmentioned. The name of the research paper is "A Comparative Analysis of Methods ofHealth Care Assessment." This was the project that followed a path that we're hoping willcontinue to be used on many of these types of projects where there's a public policy issue.In this case, the public policy issue is the subject of risk adjustment and its use in healthcare reform. I'll be talking a little bit more about that later.
The American Academy of Actuaries (AAA) published a monograph on the subject of riskadjustment. I chaired the work group as Jim mentioned, and one of the things that wasdone in that monograph was an identification of the need for actuaries to do more re-search. That led to a request for proposal from the SOA, and selection of a joint teamfrom Harvard University and Coopers & Lybrand. Dan and I jointly are going to walkyou through a very brief summary of the report, which has just been completed.
The research team was a joint team consisting of Harvard University and Coopers &Lybrand people. The oversight was provided by the SOA risk adjustment task force. That
*Mr.Dunn,not amemberof the sponsoringorganizations,is SeniorResearchEconomistat the DepartmentofHealth,Policy,andManagementat theHarvardSchoolof PublicHealthinCambridge,MA.
767

RECORD, VOLUME 21
was one of the task forces created as a result of the Academy work group determining thatthis is an area that needs some research. We also created an advisory committee thatconsisted of health economists, as well as actuaries. The team studied data that wereprovided by insurance carriers.
The research team from Harvard University included Dan Dunn, who will be speaking,Debra Tarra, Eric Lattermer, Peter Braun, and Susan Bush. And just to delineate the areasof responsibility, it was Harvard that dealt with all of the data, and all of the data prob-lems, which I think was the real hard part. I'd like to give a great deal of credit to Danand the team who I think worked incredibly hard over the past year on this project.
On the Coopers & Lybrand side, in addition to myself, John Bertko was involved as wasTom Stoiber. We provided much of the linkage in terms of the public policy implicationsand how actuaries normally look at this. We hope the audience will be both actuaries andhealthcare researchers, and of coarse, policymakers.
We had a very illustrious advisory committee. We had Jim Hickman, whom many of youmay know from his activities in the Society. Jim provided much of the statistical knowl-edge that we needed in terms of how to measure the results and how to set up the differentmodeling techniques that could be used to test the methods. Bill Hsiao, in connection withHarvard, was on the advisory committee. Hal Luft, a speaker here, is from the Universityof California at San Francisco. He spoke at the Vancouver meeting on the subject of riskadjustment. He's one of the healthcare researchers who has done a great deal in the studyof risk adjustment. From having worked with Dan, he let us know where some of the"glitches" were in the data. Joe Newhouse, who is also at Harvard University, has alsodone a large amount of work on risk adjustment, particularly in connection with theMedicare program and the adjusted average per capita cost (AAPCC). The SOA riskadjustment task force included Bill Lane as Chairperson.
I'm starting out with basic definitions. The definition of risk assessment is measuring thedeviation of each individual's expected cost from the average cost. We're defining riskadjustment in a healthcare reform type of scenario as methods used to compensate fordifference in risk. If one imagines some kind of alliance structure in a healthcare reformenvironment, carriers with the higher risk individuals would receive payments from anoverall pool, and the carriers with the lower risk individuals would make payments intothe pool.
Risk adjustment was actually mentioned in the Clinton plan, and some of the otherversions ofhealthcare reform. It's also being discussed at the state level. But what leadsto the need for risk adjustment are a couple of factors. First of all, much of the alliancestructures involve individual selection of plans in a multiple choice environment, asopposed to the employer selecting a plan, and all the employees being insured with oneplan, that leads to selection bias. Also, in the small-group market and in the individualmarket we're seeing compression of premiums through some form of community rating.If you think about community rating in its strictest sense, we're only varying rates forbenefit design, and maybe for individual versus family coverage. You can think about thefact that, if one carrier in the marketplace had all of the bad risks, it would have very highrates even if it was low cost from the point of view of how it reimbursed providers, andhow it performed utilization review and things like that. It might be the most efficient, butthe public would see a very high rate because of the high risk. The intent is for a risk
768

RISK ADJUSTERS: AN UPDATE
adjustment mechanism to he found that would make community rating work in an idealworld. It must be one that would promote competition based on efficiency and qualityrather than on which carder is the best cherry picker or which carrier can select the bestrisk.
The primary research objective of the study compares the predictive accuracy of thedifferent risk assessment methods. Dan will be talking about the different risk assessmentmethods. Some of them, like age/sex, are what we, as actuaries, are very familiar with.We will also throw some new initials on the table. Also, the study compares different riskassessment methods based on other criteria, such as, is it practical? Can it be done? Doesit do what we just said, encourage efficiency? We all think about the distribution ofclaims cost. We know that it's the tail of that distribution that causes the problem in termsof healthcare. We know that 4% of the claimants drive 50% of the claim cost, so it's veryimportant to look at those high-cost individuals and claimants.
Some other research objectives compare a prospective versus retrospective approach torisk assessment--I'll define that shortly. To compare the predictive accuracy for anonrandom subpopulation, the study asks a question. When you have a carrier in themarket with all the high risks and another carder with all the low risks, do any of theserisk assessment methods just blow up because of the nonrandomness of the population thatwe're dealing with? The study looks also at the sensitivity of study findings to the type ofhealth plan, and the mix of enrollees. This is where this research project differs tremen-dously from some of the previous research projects. A good deal of the previous researchwas done on one HMO, for example, so that everybody in the population belonged to agiven HMO. In this study, we received HMO data, indemnity data, PPO data, and we haddata from many different carders who were doing claim recording in different ways.Some of our findings are first-time findings because we had that wealth of data that wewere working with.
I'm going to briefly go over some of the state applications of risk adjustment. I'm notgoing to spend much time on New York because Gary will be talking about New York.Basically, there's a demographic adjustment that relies on age, gender, and family size.There's also a high-cost procedure and condition pool. Connecticut adopted a mechanismthat's similar to New York's high-cost pool. Washington State does not have riskadjustment in place, but it is studying risk adjustment on the state employee group of300,000. Florida has just taken risk adjustment under study.
California has three forms of risk adjustment. California has a Health Insurance Purchas-ing Corporation (HIPC) for small groups. Because in California the small groups can beage rated, the demographic adjustment there depends on gender and family size. There'salso a set of high-cost marker conditions. There's a much longer list of conditions than theNew York approach, and it uses a weighted average to develop the risk adjustmenttransfers. There's also California Public Employees' Retirement System (CALPERS)which is the plan that insures the employees of the state, and demographic risk factors areused to establish targets for rate negotiations with the carriers. There's also a group oflarge employers called the Pacific Business Group on Health. They are studying riskadjustment for use in negotiations with insurers and HMOs.
I promised a definition of retrospective-versus prospective-risk adjustment. You'reprobably familiar with those terms in connection with experience rating. This idea is
769

RECORD, VOLUME 21
similar here. You can do both assessment and adjustment prospectively and retrospec-tively. On the assessment side just to define it by example; you would take the 1995attributes to predict 1996 experience--for example, use diagnostic conditions a givenindividual had in 1995 to predict claim costs in 1996. Retrospectively, at the end of 1996,you look back and say, which diagnostic conditions were experienced? And that's goingto derive an average claim cost.
On the adjustment side, where we're actually transferring money between carriers,prospectively we could make an estimate of what those transfers are going to be and buildthat estimate into the premium. That would be a prospective form of adjustment.Retrospectively we might transfer based on the actual usage and the risk. For example,stop loss, a reinsurance mechanism that you're all familiar with, could be considered aretrospective adjustment.
Some of the types of health risk assessment methods, and Dan's going to get into this inmore detail, would include demographic models. It's just what we're familiar with,age/sex. Then the AAPCC also uses location and institutional status. Health statusmodels are generally based on actual diagnosis. There's also a questionnaire called theSF36 that asks questions such as, Can you walk up stairs? Can you feed yourself?. Canyou dress yourself?. Is your health condition now better then it was a year ago? Thatwould be self reported. And then there are also prior use models based on actual priorusage.
I am at this point going to turn it over to Dan who will talk about some of the riskassessment methods tested.
MR. DAN DUNN: I'll fill you in on some of the methods and data we use, and talk aboutour results for the predictive accuracy part. Alice will then come back and talk aboutsome of the practical considerations, which are certainly as important as the predictiveaccuracy findings. I then will summarize.
Note there are a number of different ways to assess risk. We're only looking at basicallytwo classes of those types. Of course, there are demographic models, which wouldinclude simple age and sex. Then there are a group of models that are based on previousdiagnosis, like the health-status and clinical based models. All these models are based oninformation that could be found on administrative claim forms that insurance carriers
typically collect.
We looked at two subcategories within the groupings of our clinical based models. One isambulatory care groups, which includes the ambulatory care group (ACG) model as wellas a subset ambulatory diagnostics groups (ADGs). I'll describe what these are. Welooked at two diagnostic cost group (DCG) models, one which is based on inpatientinformation, and the second DCG model includes additional information.
I won't go over the methodology in detail. It can be quite complicated, just groupingdifferent people into different categories at the end. The grouping is based on thediagnosis, age, and sex. After applying the logic, you'll end up in an ACG or DCG. Itmay seem complex, but one of the nice things about these models is that their developershave been quite open about all the assumptions that are used, and are usually helpful inhelping you to understand exactly how things work.
770
RISK ADJUSTERS: AN UPDATE
For the purposes here, the key information for these models is what's used in assigning theindividuals to each ACG or DCG. ACGs are based on outpatient diagnosis. Coded usingICD-9 diagnosis coding system, each diagnosis is first categorized into one of the 34ADGs based on what clinicians and statisticians argue would be homogenous clinically aswell as resource intensive groupings. These individual ADGs are actually one of ourmodels, so it's an intermediate step of the ACG model. Finally, based on the ADGs, ageand sex, patients are grouped into one of 52 ACGs. Someone can have more then oneADG if he or she has multiple diagnoses that are somewhat different, but everyone isassigned to one and only one ACG.
The first of the two DCG models we looked at is called the principal inpatient DCGmodel, which we termed the PIPDCG. All the PIP diagnoses are recorded for an individ-ual for a year. Each diagnosis is categorized into one of 12 DCGs, which are groupingsbased on their expected cost related to that diagnosis. Finally, each individual is assignedto the highest expected cost DCG.
The initial PIP model had tried to distinguish between discretionary and nondiscretionaryhospital admissions. This would get around the potential incentives for admitting a patientto get a higher risk grouping, and thus a higher payment; however the model that we usedremoved this qualification. The way they did it before was they got together a panel ofphysicians and had them assign the relative discretionary areas. In the end, this didn'thelp all that much in terms of predictive accuracy. The current PIP model doesn't accountfor that.
The second DCG model might be considered something of a kitchen sink relative to theother. We call it the expanded DCG (EDCGDX) model with high-cost conditions. Ituses both inpatient and outpatient diagnoses. Like the PIP model, it categorizes eachdiagnosis into one of 12 DCGs. However, with this model, a distinction is made betweenwhether they're inpatient or outpatient diagnoses. It gives more weight to the inpatientones with the rationale being that they'll probably be related to higher costs. Again, theseare assigned to the highest expected cost DCG. In addition, they identify 25 high-costcoexisting conditions. These are conditions other than the diagnosis that was related to theDCG assignment, to try to pick up eo-morbidities. Examples of these are diabetes, someinfectious diseases and so on. These would be expected to take care of the higher costindividuals in the modeling.
This is a summary of the five models we talked about here. The age and sex model had 28age and sex groups with 14 each males and females, and with five-year age bandsapproximately for each one. We had no elderly individuals in the database since we'reonly talking about individuals under 65. ACGs had 52 groups, based on ambulatorydiagnostic information. For ADGs, we actually added the age and sex groupings sinceADGs, unlike ACGs, do not account for age and sex. The PIP model, again, uses onlyinpatient information. The EDCGDX model includes quite a number of risk factors,namely 12 EDCGDXs, 28 age and sex groups, and 25 or 50 high-cost coexisting condi-tions and includes both inpatient and outpatient information.
As Alice had mentioned, we were lucky enough to receive quite a rich database from anumber of national insurance carders. We ended up with the final analysis using datafrom seven carriers, and it described enrollees for 1991-92. Thus, we had two years towork with. Approximately four-and-a-half million nonelderly enrollees were included.
771

RECORD, VOLUME 21
These areboth the claimants and the nonclaimants that we're picking up with these data.Again, as Alice had mentioned, we had a range of health plan types: indemnity, HMOs,and PPOs, plus we had a range of deductible levels to look at.
The databases were actually designed to test the models that we evaluated. They included,in addition to the plan type, enrollee demographics including their locations, based on zipcode, age, and sex. A complete record of their expenditures and utilization was obtained,and the clinical diagnosis code using ICD9. These are the key variables to group thepatients with these models.
The analytic methods are pretty straightforward and consist of a number of discrete steps.First, we assigned each enrollee to a risk group according to the risk assessment methods.So for age/sex, each enrollee is placed in an age/sex group. The ACGs are based on theirdiagnosis, age, and sex. Each individual is assigned to only one group for each model.The risk adjustment formula is tested using the expenditure data, and we're using totalexpenditures for the year for each individual for these models. Examples of the riskweights employed are the average cost for males between 35 and 39, or the average costfor ACG5.
Next, predicted expenditures are calculated for each enrollee for each method. So basedon which risk group they're in, and based on the risk rate assigned to that group, we cancome up with a predicted value. Finally, we also have their actual expenditures, and cancompare those with the amounts predicted and that becomes the essence for our measuresof predictive accuracy.
We use both prospective and retrospective applications. For the prospective applicationwe're using 1991 information and trying to predict their 1992 costs. For the retrospectiveapplication, we're using 1992 data to predict 1992 cost. Thus, we can not only comparethe methods within prospective applications but we can also compare between prospectiveand retrospective.
A final important point on our methods is that, in order to narrow down the potential noisethat was related to the extreme skewness that you usually observe, we truncated expendi-tures for the primary diagnosis at $25,000. When we looked at the high-cost conditions,we relaxed that assumption and looked at every dollar.
FROM THE FLOOR: How did you handle geographic differences?
MR. DUNN: Given we were working with data from across the country, we were leftwith the problem of controlling for things such as price differences and differences inintensity of care. We explored a number of different adjustment methods. There are veryfew that can deal with cost difference and also with the problem that some parts of thecountry have more hospital days per person or more doctor visits or whatever. Thedifferences are related to a number of different things. Here we're most interested innetting the differences out, so we could be looking at a level of XXXX. We ended upusing what was the AAPCC that Medicare uses. It basically is a measure of the relativeexpenditures per enrollee for across the country. There are certain problems using thatmethod. However, given its uniformity across the country as well as its availability, it wasprobably the best approach we could use.
772

RISK ADJUSTERS: AN UPDATE
We did some sensitivity testing to see how the models would change if we had useddifferent approaches. It ends up that the methods weren't sensitive to the approach.
And also, there will be a fairly lengthy and fairly detailed final report that will describe ingreat detail all the assumptions and results. We're just giving you a synopsis in thissession.
There has been some debate over what is the best measure of predictive accuracy for thesemodels. Some people argue that all the models need to do is predict well for groups ofenrollees, because differences across individuals would tend to cancel themselves out.Given that insurance is the pooling of risk across individuals, that should be the target forthe models. However, given the potential issues and incentives for risk selection, thisargument ignores the incentives which plans may have to try to seek out the lower riskindividuals or avoid the higher cost individuals. If that's the case, then you also need toconsider predictive accuracy for individuals, as well as for nonrandom groups. Ratherthan pick individuals versus groups as the one measure of predictive accuracy, we'll lookat both individuals and groups and also look at nonrandom groups. I'll come back to theseshortly.
In terms of predictive accuracy, we used a number of measurcs. Three were the individualmeasures. I'll come back and talk about what the r2 is---the mean absolute percentageprediction error. It is just the percent difference between the predicted value and theactual value observed for an individual. We determined the percent errors within aparticular range, such as within $500, $1,000, greater than $5,000, and so on.
FROM THE FLOOR: Did you test the sensitivity to truncating claims at $25,000?
MR. DUNN: We have done a little of that. We actually had two reasons for using ourapproach. One, our approach had been used previously in other studies on risk assess-ment, and it gave us a chance to link that with these studies. This maybe isn't the perfectreason, but it was nice. Second, our approach was looking at what the tail of expenditureslooked like, and $25,000 seemed somewhat reasonable based on that.
But to answer your question, we actually reran a number of the analyses after the fact, at$50,000 and with no truncation, and all those results are in the final report.
I'm giving you very much of an overview of the results. The report itself has more thanyou'd ever want in terms of all the measures. In fact, it may be too much, but in thissession, we're just pulling out some of the key things to give you a flavor.
It tums out that all the other individual measures we looked at showed a very highcorrelation as measured by r2 so this is a very representative measure. For the retrospec-tive model, the age and sex didn't do nearly as well as the clinical based approaches. ThePIPDCG model, which is based on only inpatient information, performs better. Themethod really picks out those patients who have the greatest cost of those who werehospitalized. The ADG and EDCGDX models follow somewhat close behind. Again,these are retrospective models based on what actually happened for that year.
For the prospective models, age and sex again fall short of the clinical-based approaches.However, as expected, the clinical-based approach comes a little closer. The ADG model,
773

RECORD, VOLUME 21
which is based only on outpatient information, performs slightly better then the EDCGDXmodel, which really has quite a few clinical variables involved. Again, as expected, theprospective models were not able to predict cost as well as those applied retrospectively.Those are the results for individuals.
For random groups, we randomly selected 2,500 enrollees from each insurance plan andcompared their predicted amounts for the entire group with the actual amounts for theentire group. We did this 100 times. So we're repeatedly selecting 2,500 enrolleesrandomly again and again. These measures of prediction are basically a summary acrossthose 100 random groups.
As shown, there's actually very little difference between the models, in terms of how wellthey predict for random groups. All of them do pretty well. Interestingly, there aren'tmany differences between retrospective and prospective models. So even something assimple as age and sex does quite well for random groups of 2,500 individuals. We alsolooked at different sized groups, and results didn't really change that much. But certainlywith smaller groups the r2 is increasing and vice versa.
Probably one of the more interesting analyses we did was to look at nonrandom groups.These were groups of individuals of expected high or low risk, where we might think themodels would fall short. They're also groupings that you might expect if the carriers aregoing to perform selection based on information that they have at their disposal. Wereally used two different types of groups. One is nonrandom groups based on previousexpenditures. We looked at the 1991 expenditures for an enrollee and how large or smallthey were relative to the average for all enrollees in that year. We then saw how the modeldid in forecasting expenditures for 1992 for those individuals.
The second approach for nonrandom groups uses clinical conditions, which I'll get toshortly. A ratio greater than one means an overprediction and less than one is anunderprediction. In terms of risk adjustment, it would result in an over- or underpaymentfor those groups of individuals.
Age and sex actually does not do very well for these groupings. It greatly overpredicts theexpenditures for those with previously low claim amounts and greatly underpredicts thosefor individuals with higher claim amounts individually. For the individuals with theexpenditures greater than, say, $7,000 in the previous year, age and sex is predicting only$0.38 on the dollar. Some of the other models do better. But, again, there's a verysystematic relationship between previous expenditures and the inability of the models topredict. The ADG model seems to do best.
We created three different nonrandom groups for high-cost conditions. One was forindividuals with heart disease in the previous year. A second, for individuals with cancer,and a third for all other individuals with hospitalization. Again, some of the models arebetter, but overall they don't do that well. Age and sex for cancer patients pays roughly$0.22 on the dollar under risk adjustment. For heart disease, $0.38 and for all other peoplewith an inpatient admission in the previous year, it still falls short. The best model here isthe EDCGDX model, which pays about right for those with previous inpatient admissionsand underpays, but not by as much as the others, for cancer and heart disease patients.
774

RISK ADJUSTERS: AN UPDATE
If they had worse illness the next year and the models were able to predict that, which iswhat their goal is, then it would be a problem. But this is saying that even after weaccount for everything in the models, there's still noise left over and it's systematic in thisdirection. It says, they're sick, sicker in the following year, and they're even sicker thanthe model was able to tell us to expect.
And these are probably the most problematic results for risk adjustment, because these areall based on information that's at the plan's disposal in the previous year. And also, theseare the types of conditions that create the greatest equity problems in a risk transferprocess. So a plan that ends up with most of the cancer and heart disease patients under anage/sex approach faces great underpayments.
Briefly, one of the things Alice had mentioned is that we had a number of different healthplan types at our disposal. And these are the findings for the individuals for r2 for someselected pools. We actually had 19 of what we call "pools" or health plans, in the data.Those that begin with an 'T' are indemnity plans; plans with "P" are PPO plans; and "H"are HMO plans. But, in general, any way we sliced it, the models all did about as well, oras poorly, on predicting the cost. So they apply in the same way across plan types.
As Alice had mentioned, we also looked at some of the issues and results for high-costpatients. We did this for two reasons. First, we had truncated expenditures at $25,000 foreach analysis group that I just showed you. Second, a number of states, including NewYork, Connecticut, and California, have been looking at high-cost pools as a way to dealwith the truly high-risk patients. We wanted to see if we could identify some high-costconditions, add them to the models and see how much it increased the predictive accuracy.We ended up identifying 43 high-cost conditions. One obvious point is that, on average,they are high cost. Another point is that they're actually quite infrequent, with a fewexceptions such as some of the heart disease conditions there. There are not too many ofthese folks in the typical health plan enrollment. However, and not surprisingly, if youlook at the distribution of enrollees, all those over $25,000, which is less then 1% of allindividuals, are responsible for 25% of the total cost. So, in terms of dollars, these arecertainly important; patients are also important for risk adjustment.
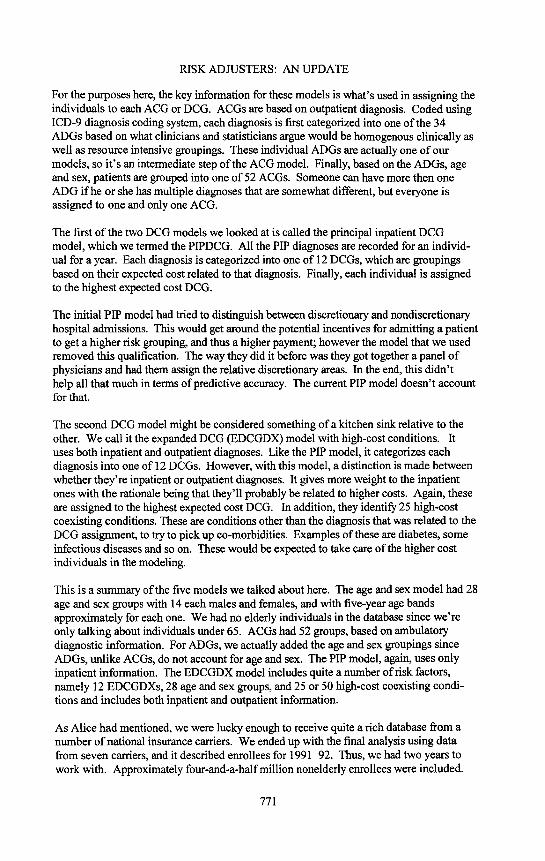
We modeled these high-cost groups by basically saying, if an enrollee was in one of thegroups with really high prospective rates, we're going to reimburse the plan at the averagecost for all individuals in that condition and then add these to the models (Chart 1). Sincethe PIP and EDCGDX model are actually doing somewhat of a high-cost conditionapproach, we didn't add them to those models. Instead, we added them to a simple ageand sex model, and the ADG model, in looking at outpatient events, is more looking at ahigh cost event.
The first four columns are the results without high-cost conditions. Of the two columns onthe right, the first column is what you get if you add the high conditions to simple age andsex; so obviously it helps quite a bit. The far right column is what you get if you add thehigh-cost condition to the ADG model, which, again, was only outpatient on diagnosis.All of these are run without any truncations. Alice is going to talk a little bit about someof the practical considerations we looked at.
775

RECORD, VOLUME 21
CHART 1ANALYSIS OF HIGH-COST CONDITIONS,
SUMMARY OF PREDICTIVE ACCURACY, RETROSPECTIVE MODELNO TRUCULATION
INDIVIDUAL RESULTS--ADJUSTED R2
0.3
0.25 0.272 0,272 0.235
<_ 0.2n, i
_o15!"_ 0.112
< o.1
0.050.012
0'
• Age/sex• ADGLT] PIPDCG[] EDCGDX[] Age/sex& principlehighcostcondition[] ADG& principlehighcostcondition
MS. ROSENBLATT: One of the unique things that we did in this study is that manytimes we actually went on to test the concept of risk adjustment. Most of the otherresearch that has been done has stopped at testing risk assessments. But we went on toactually test the monetary transfer that would occur if all of these data had represented riskpools within an alliance structure. Gary is going to talk more about the New Yorkmechanism. But, very simply, what we're trying to do is use these different measurementsto develop risk assessment. If you had a group and you had an age/sex/weight for thatgroup or for a particular carrier's pool within an alliance, and compared it to the othercarriers within that alliance, those with the low age/sex factor would pay into the pool,those with the high age/sex factor would get money from the pool.
That's what we're doing in these simulations. The first one actually uses the age/sexfactors. The weights were developed from the actual data. We actually went through thedata and asked how males age 40-44 compare to the total risk pools of those under age 65.Then we developed different weights and applied those weights for the entire pool. Youcan see in Table 1 that for all 7 pools you get a weight of 1. For example, pool IA had aweight of 0.932, and pool IH had a weight of 1.185. The New York method uses a similartype of demographic adjustment. Here, we're using a simplified version of it. We'recalculating the average claims cost per person for each of the pools. So, based on the0.932 example, the model would predict an average of $1,271 per person. However, thecost actually came in at $1,330. The transfer ratio is just the difference between one andthe age/sex factor of 0.932. And if we apply that 0.068 to the average, we get a transferamount of $93.
776

RISK ADJUSTERS: AN UPDATE
Consider the situation where within an alliance structure, transfer is going to be built intothe premium. Keep in mind we're dealing only with the claims cost portion of thepremium. Of course, in a real world scenario, you need to account for things like reten-tion. But we're just dealing with claims here. We developed an adjusted premium, whichbecause we're dealing with claims, we called a pure premium. We get an adjusted purepremium rate, which is the sum of that transfer amount plus what we're saying thepremium started out to be. Then we calculate the total amount of premium based on thenumber of enrollees, which is not quite the total claims. You get an adjustment amountthat you need to then spread across the pool. In this case, it was $259,000 that we spread.We got a final adjnstment just to give you a sense of what kind of transfer amounts we'retalking about. Our pool IH with the high age/sex factor of 1.185 would get money in fromeverybody else at $43 million dollars. The other carders who had the age/sex factors lessthan one, would pay in amounts like $14 million or $18 million and so on. Across thewhole pool it's zero sum total.
You can obviously do the same thing for all of the different methods like ADG, thePIPDCG and so on. Then you can simulate that, and we would end up with differentresults. The carder that received the approximately $43 million under one method, mayhave to pay under another method. That's the real issue from a public policy point ofview. The really scary thing is that that did, in fact, happen. For pool HD, an HMO, wehad a situation where we had an age/sex factor of 0.953 and the ADG value was 1.638.We did all sorts of checking for quality and that is a real result. For that HD pool othermethods produced factors of 1.361 and 0.933. In some instances, pool HD would receivepayments of $16 million or $9 million, and in other cases HD would pay minor amountslike $1 million or $2 million. You can imagine the carriers sitting around the conferencetable having done these simulations and trying to agree on which method to use to do riskadjustment. We're talking about pretty major monetary transfers here, so it's a tremen-dons public policy issue.
Let me show you some of the reasons that are causing those results. Basically, Dan andhis team did a great deal of testing. Why are we coming up with a factor like 1.637 Whatwas occurring were differences in reporting and coding of diagnoses, particularly onambulatory encounters. The HMO pools had a greater percentage of enrollees with claimsand greater intensity of ambnlatory diagnosis per enrollee.
Table 2 is just a sample. It shows some of the ADGs and gives you some of the descrip-tions of the ADGs. For example, consider a condition that's time limited. The 9.6% ofthe people in the pools fell into that particular ADG description. In an indemnity pool, itwas 5.4%, but if you look at that HMO pool that I was emphasizing, it is 16.7%. If youlook at malignancy, there is not as much of a difference, 1.9% and 4%. But administrativeprevention was a real big difference: all pools, 17.9%; the indemnity pool, 7.6%; and theHMO pool, 50.3%. You can also see for no ADGs at all, you had across all pools 38%, inthe indemnity pool, 47%, and in the HMO pool, 14%. There was a big difference.
Our database included not only claims, but also enrollees who did not have claims. Acrossall pools, 34% of the population had no claim; in the indemnity pool, 32%; and in theHMO pool, 14%. One of the reasons, obviously, for that is the plan design. The indem-nity plans had deductibles, and there's probably a great deal of underreporting thatoccurred. For the HMOs with copayments like $5 and $10, we're probably getting allclaims, even minor ones.
777

TABLE 1
SIMULATION OF RISK ADJUSTMENT TRANSFER PROCESS USING DIFFERENT ASSESSMENT METHODSEXAMPLE OF CALCULATING OF TRANSFER AMOUNTS USING AGE/SEX METHOD
Pool IA PoolPA PoolHA Pool IH PoolHD PoolPC PoolHB All 7 Pools
(a) Ratio of each pool predicted to average 0.932 0.919 0.923 1.185 0.953 0.979 0.990 1.000
(b) Predicted Average claims cost per person $1,271 $1,254 $1,259 $1,617 $1,300 $1,335 $1,351 $1,364
(el Actual average claims cost per person $1,330 $1,339 $1,400 $1,806 $1,375 $1,102 $1,246 $1,364 £3O
(d) Transfer ratio 0.068 0.081 0.077 {0.185) 0.047 0.021 0.010 0.000
oo (e) Transfer based on "average cost" per capita 93 110 105 (253) 64 29 13 O
(f) Adjusted pure premium (c) + (e) $1,423 $1,449 $1,505 $1,553 $1,439 $1,131 $1,259 $1,364!
(gl Number of enrollees 153,526 169,513 20,098 171,764 18,498 204,351 120,965 858,715
(h) Total Transfer (e) x (g) ('000s) $14,278 $18,646 $2,110 ($43,456) $1,184 $5,926 $1,573 $259
(I) Adjustments to achieve zero as sum of ($58) ($64) ($8) $0 ($7) ($78) ($46) ($259)amounts in (h) {'O00s)
(j) Transfer after adjustment ('O00s) $14,220 $18,582 $2,103 ($43,456) $1,177 $5,849 $1,527 $0

RISK ADJUSTERS: AN UPDATE
TABLE 2DISTRIBUTION OF AMBULATORY DIAGNOSTIC GROUPS (ADGs) BY POOL
ADG Description AllPools PoolIH PoolHD
I TimeLimited:Minor 9.6% 5.4% 16,7%2 TimeLimited:Minor-PrimaryInfections 1.6 8,0 31.83 TimeLimited:Major 3.8 2.6 9.0
10 ChronicMedical:Stable 10.8 8.9 24.128 Signs/Symptoms:Major 1.3 7.9 23.731 Prevention/Administrative 17.9 7.6 50.332 Malignancy 2.1 1.9 4.033 Pregnancy 2.2 0.9 3.3
No ADGs 38.4 47.5 13.7
NoClaims 34.0% 31.7% 13.7%
Let me get into some of the less technical areas of comparison. First consider practicalityand administrative cost. The age/sex model is the most practical. The PIPDCG model,which requires only inpatient data collection, probably also runs lower cost than the otherdiagnosis based methods. Because there are fewer inpatient claims, you need to collectless data. But it would be extremely difficult to obtain consistent and high qualityinformation on ambulatory diagnoses. Plus, these encounters may be missing completely.For example, staff model HMOs may not be coding the ambulatory data at all. Similarsituations might exist in some HMOs that are capitating.
One of the other big issues is the ability to restrict manipulation. The age/sex modelwould be least likely to be manipulated. Also, it could be subject to easy audits. For themethods that depend on diagnosis like ACG, ADG, and DCG, we could get upcoding.Upcoding means that the providers of care would actually learn to code a higher diagnosis,because there would be greater payment from the risk adjustment mechanism. And again,this probably is more difficult to game on the inpatient side than on the ambulatory side.
Timeliness and predictability is one of the big issues. You notice we're using 1991-92data, and this is 1995. We have similar problems if we think about an alliance. How longdoes it take to get the data collected? How long does it take to go through cleansing of thedata and reasonableness checking of the data? You can end up applying the data with asizable time lag. From that point of view, our methodology was not realistic, because wewere using 1991-92. In a real world situation, you might end up with more of a two-yearlag. The longer that lag time is, the less predictive the models are going to be. Weweren't able to test for that because we only had the two years of data. But it would seemreasonable that if you ended up with a longer time lag, all the ratios that Dan was showingyou in terms of predictive accuracy would drop.
On the retrospective side, there are a number of practical issues you come up with as youthink about a given state having this type of mechanism. People who are in small groupsmay join large groups, or move out of state, and so on. By the time you make the adjust-ments for this type of activity, you might have a risk pool that looks very different. So youget into equity issues and then, of course, there are cash-flow issues. If there's one carrierthat is supposed to receive a sizable payment, and you have it adjusted on a cash-flowbasis, with a $42 million payment, for example, you could even end up with solvencyconcerns.
779

RECORD, VOLUME 21
I mentioned up-front that one of the reasons for doing this is to get away from measuringcarders based on their ability to select the best risk. The objective is to get toward thesystem that actually has people selecting carders based on efficiency and quality of care.Do these methods provide that incentive? The age/sex model really doesn't do muchabout that. The retrospective models might provide a greater incentive to actually increasecost and utilization because a higher payment is allowed. Some of the models may also, ifthey're looking at just inpatient services, provide incentives to treat on an inpatient basisrather than on an outpatient basis.
Aside from predictability, age and sex is the best, in terms of being practical, and we canaudit it. But as you saw, the numbers are pretty low, in terms of the predictive accuracy.On the diagnosis based models, the prospective models provide greater incentives forefficiency. But as was shown by that HMO that I highlighted, there's a big issue in termsof the data on the ambulatory care side.
MR. DUNN: In terms of predictive accuracy, all methods as you saw perform with allrandom groups for reasons that we talked about. For individuals, retrospective modelsoutperform prospective applications. For individuals in nonrandom groups, age and sex iscertainly better than no adjustment. However, the diagnosis-based models have much toadd to the age and sex approaches. Of course, you need to consider the practical problemswith them, but there's some promise there.
Finally, we concluded that there's room for improvement since even the best models stillprovide some incentives for risk selection. Also, they could hold some inequities for planswith the higher risk patients.
What does this all mean? We certainly need risk adjustment. It's going to be a crucialpart of anything we do, in terms of reforming the way health insurance is organized in theU.S. But alone, our results say it's not enough. Are you going to need some of thereforms related to the rules of the game such as guaranteed issue? Not having exclusionfor pre-existing conditions and so on? Certainly these reforms of roles of the game havebeen thrown out before. Practical issues must be resolved. Data systems, auditing, andtimeliness are certainly problems for some types of models. Methods using only inpatientdiagnosis, such as the PIPDCG model may hold the greatest promise as an interimapproach, all things considered. Further research, based on our findings, is unlikely toprovide a major breakthrough or go much beyond the predictive accuracy of the modelswe tested. The alternative then would be to try to work with things like the high costcondition pools on top of these models to deal with the truly higher risk patients whoaren't able to be modeled in the ACG or DCG models. Another alternative is some sort of
blended payment systems, which are combinations of the good qualities of a prospectiveapproach, and the extra predictive accuracy of a retrospective model.
MR. GARY M. KOSCIELNY: I will be talking about the risk adjustment systemcurrently used in New York. I'll discuss what we're currently doing, and I have someinitial results to share with you. Also I'll talk briefly about where this is going in NewYork.
The laws were passed and the risk adjustment was set up in 1992. Starting in 1993, themechanism covers the individual, small group, and Medicare supplement markets. Thelaws implemented community rating and open enrollment, and set up the risk adjustment
780

RISK ADJUSTERS: AN UPDATE
pool. The individual small group market has a specified medical condition pool and ademographic pool. The Medicare supplement market just has a demographic pool.
The risk adjustment mechanism recognizes the geographic variation by carving the stateup into seven different regions, and then operating the pools independently within eachregion. There are actually 21 independent pools operating in New York State.
The specified condition pool is a reinsurance type pool. There is a quarterly premiumrequired. The premium is $5 for a single contract and $10 for a family contract. There aretwo categories that are recognized: the hospital only and the major medical only.Hospital is $3.75 and major medical is $1.25, and for a family contract, the rates are twicethat.
There is a very short list of specified medical conditions that are recognized. These arecalled the table one conditions, including the transplants and the neonates. The amountshown in this table are the maximum amounts that will be reimbursed to a carder from a
pool. Ifa carder does not pay more than these amounts for the patient, then only theamount paid will get transferred to the carder. The idea behind this was to encouragecarriers to keep their costs down by using managed care. We would get a dollar for dollarsavings for any dollars that they can save.
The second type of conditions contains only two categories. Table two conditions areHIV and ventilator dependency. They're reimbursed on a monthly basis. Anytime acarder has one of tbese conditions, it would submit claims and get up to these amounts:$2,000 for HIV, and $13,000 for ventilator dependency.
There's a two-step claims process. First there is something called a prenotification, whichis essentially a one-page claim form, that identifies the patient, the carrier, and thecondition. There are two reasons for doing this. One was we were hoping that it wouldhelp with some money management. Some of the conditions are relatively infrequent andhigh cost, and so we felt that, if we had some prenotification of these, that would help us.That turned out not to be the case. Virtually everyone submitted their claims right beforethe deadline.
The second reason relates to another problem. The deadline for 1993 claims was Decem-ber 1994; for 1994, it's December 1995. There's about a year-and-a-half to two-yearwindow to submit. Amounts paid are on a per-patient basis. If two carriers cover thesame individual, we have to split up the payment, and so this gives us a warning that wehave to look out for that.
The second step is a formal claim. This involves a longer claim form requiring patient'sname, social security number, address, and things like that. There's something called theproof of payment form, and this includes actual copies of bills for bills over $1,000, asimplified claims listing or explanation of benefits for smaller amounts. There are alsoselected medical records submitted, including doctor notes or hospital records of somesort. Such documents would just simply identify things that we would need to know to besure that the condition did actually occur, usually not more than two or three pages percondition.
781

RECORD, VOLUME 21
Let's turn to some initial results for 1993, which is for a nine-month period. Claims of $6million were paid to carriers for neonates, $7.2 million for transplants, ventilators forunder $69,000, and probably the real surprise was HIV at only $97,000.
Then the number of claims was 77 each for the neonates and transplants; 3 ventilatoreases, and 14 HIVs. Probably the surprise there is the low number of HIV cases. Thereason has to do with the criteria in the regulation for an HIV case. The criteria is CD4count below 50 on 2 consecutive tests taken a month apart. The problem with that is thatthe CD4 count is a result of a blood test, and it's not ordinarily collected as part of thenormal claims processing. So, in order to get that, the carrier has to ask the patient, theprovider, or a lab to send in that information. None of those are normally all that willingto do it without prodding. Their concern is confidentiality because this is HIV. A numberof carriers are reluctant to even ask the question because of concerns of confidentiality.That's why there are so few of those.
Where is the money going? Again, this is nine months of 1993. I've broken the state intothree types of carriers. First are the Article 43s (the Blues), the traditional large players inthese markets. They've put in the most money and also are getting the most out of thispool. The other types are the commercials and HMOs. The big thing here is, everyoneseems to be losing from this pool. No one is collecting more money than they're payingin.
There are a couple of reasons for that. One is that HIV was originally anticipated to be amore sizable condition than it was, and a large source of distributions to carriers. Thisturned out not to be the case. Second is that, when these pools were getting started, thepools were hit with lawsuits from the HMOs and later by the commercial carders. Isuspect that some of the carders felt that these pools might not be around. In fact, theHMOs won their initial lawsuit, and so the carders may have felt that this legislationmight not be around, and it wasn't worth making the extra effort. It was surprising that anumber of carriers did not submit any claims at all. Two of the largest Article 43s, two ofthe largest blues, did not submit any claims, and the single largest commercial carrierdidn't submit any claims for 1993. In fact, to this date, through mid 1995, none of thosethree groups have submitted claims. Two of them actually called me within the pastcouple of weeks asking for the instructions on how to submit a claim, so I suspect thatthey'll follow through with the submission.
An interesting question to ask is, how much risk adjustment is being done with this? Fornine months of 1993, $22.1 million was collected. Annualized premium for this block ofbusiness was $3.6 billion, that works out to 0.8% of premium. That is probably not agood indication of how much risk is being adjusted. Suppose that everyone collectedexactly what they paid in to the pool. How much risk adjustment is being done in thatcase? Well, if everyone gets out exactly what they paid in, there's no risk adjustment. Soanother way of looking at it, I think a better way than just looking at the annualizedpremium, is to take the difference between what's paid in and what's taken out for eachcarrier, and add those up. When you do that, you come up with $10.5 million, or 0.4% ofpremium. An odd year was 1993, because it was a start-up year, and we didn't have thatmany claims, and there's the HIV problem, and so forth. We'll have to watch that later, tosee how that works out.
782

RISK ADJUSTERS: AN UPDATE
Let's turn to the demographic pool. First, we'll go over some of the simpler concepts.There's an average demographic factor that is determined for each carder in each region.It's just a weighted average demographic factor. It attempts to assess the risk that a carrieris assuming in that region.
Next is a regional demographic factor that's simply the weighted average of all theaverage demographic factors in a given region. The weighting is done on the annualizedpremium. The factors are based on age, sex and family status. They're similar to factorsyou might see in a rate manual. The payment disbursement formula is very simple.Claims are the first factor, and then there's the adjustment factor, which is simply the RDFminus the ADF or the difference between the regional average and the carrier's averagefor the given region, divided by the ADF.
Now how are we administering this? There are two cycles that go on. One is a quarterlycycle where we collect data, analyze premium, expected loss ratios, and the averagedemographic factors. We also do preliminary contributions and distributions. In this case,what we use for the claims portion is the annualized premium times the expected lossratio. We start out using projected claims. On top of that is the second cycle, which is theannual cycle. It's called the annual reconciliation. For that, we collect actual claimsincurred for each region, for each cartier, and substitute that into the formula. Weultimately use actual claims times the risk adjustment factors. Since we've alreadycollected the preliminary amounts on the quarterly cycle, we compare what the carrierwould have paid or collected on the annual cycle with what it has done so far. Then wemake further payments, require further payments, or make the carrier's distributions to getto the annual cycle. We do an annual reconciliation twice for each year. In fact, we'restill finishing off 1993 at this point. The first reconciliation requires a larger estimate ofclaim lag, and the idea is that by the second reconciliation there isn't much of an estimateto deal with.
Let's take a quick look at some of the regional demographic factors and how they behave(Chart 2). Most of them I think are pretty stable. New York has been very stable. Buffaloon the bottom has not been stable, but the reason for the big jump you see is that thelargest carder in that region decided that it wasn't doing the calculations right in the firstplace. So it discovered its mistake and adjusted it.
I don't recall whether this came about because of our audits of them, or whether they justfigured the problem out on their own. I think it does emphasize the point that you have todo audits with these. In New York, everyone is audited once every three years.
Where's the money going? On the left side of Chart 3 is 1993, and that's nine months.On the right side you have 1994, and I've broken it out by the three types of carriers. Asyou can see, the Article 43s are pulling out the vast majority of the money, $83.4 millionin 1993, and it's expected to be about $99.9 million in 1994. Again, 1994 is 12 months, sothat should be much larger. The commercials and HMOs are putting in most of themoney.
How much risk adjustment does that involve? Quite a lot compared to the specifiedmedical condition (SMC) pool; a total of $160 million dollars. I'm measuring riskadjustment the same way that I did before. I look at each carder and take the differencebetween what they paid in and what they're pulling out, and then add it up for each carder.
783

RECORD, VOLUME 21
And it comes out to $164 million in 1993, which is 6.0% of annualized premium. In 1994
it will be about $200.6 million, which is 5.7% of annualized premium.
CHART 2I/SG DEMOGRAPHIC POOL--RDFS
APRIL 1993 TO JULY 1995
1,09
-I NewYork/
1.08i
1.07I;
1,06i
i1.05i
Buffalo1.1)4
1,03 -
1,02
1.01 -1993 1994 1995
2 3 1 2 3 4 1 2
CHART 31993 (9 MONTHS) AND 1994 I/SG DEMOGRAPHIC POOLCONTRIBUTION/DISTRIBUTION ($MILLION) BY CARRIER
lO,O
784

RISK ADJUSTERS: AN UPDATE
Where is all this going? It's going away, at least the demographic pools are. Senate Bill5469A is going to phase out the demographic pools by 2000. There will be a gradualreduction in the contributions step down over the next four years, and it's going to expandthe SMC pool to take the place of the demographic pool. Based on the risk adjustmentbeing done, you can see that it's going to take a great deal of expansion to get the sameamount of risk adjustment. Why is that being done? I guess I would characterize it as adeal with the HMOs to offer point of service plans and drug coverage, which is notsomething that they have done universally.
MR. STEPHEN G. BUTZ: I have a question regarding the ratio of predicted to actualexpenditures in the prospective model. You mentioned something interesting--the claimswere actually higher than the model predicted for certain diagnoses, like cancer and heartdisease. I wonder if the model that predicted that was based on the individual predictionsor was it based on the pools? Do you take into account the possibility that the rates aredifferent before movement of people from one pool to another?
MR. DUNN: I think I can answer the first part of the question. Alice will have to help meon the second part. You're right in that there are certain models that were providingsignificantly lower payments than actual claims. For certain conditions, we had shownyou the results for heart and cancer conditions. Was this result somewhat sensitive towhich pool we were looking at? In fact, this result was quite robust. We found it for boththe HMO plans, PPOs plans as well as the indemnity plans.
MS. ROSENBLATT: We couldn't test for a spiraling effect. It would be very unlikely.We were using national data sets, and no area would have enough weight for one carrier tosort of dominate the data set to that extent. I would say it's pretty unlikely we weregetting any sort of adverse selection spiral in the two years of data we had.
FROM THE FLOOR: Was the model based on previous extrapolations from one year toanother year?
MR. DUNN: No, we had two years of data--year one to predict year two, as well asusing year one to identify who has the cancer condition, a heart condition, and so on.
MS. ROSENBLATT: Let me try to answer your question. This is not experience rating;instead, it's closer to age/sex weighting factors and relating age/sex weights with anaverage claim cost. When Dan is saying the models predict, we're saying that based onwhether it's an age/sex category or an ACG category, you're using the experience ofeither the previous year or that same year. Based on people who fall into that category andthe model which you say, the average for that category is what the prediction is.
FROM THE FLOOR: So the model was based on the group of individuals regardless ofwhich pool they were in, right?
MR. DUNN: We performed analysis pool by pool except for the transfer analysis thatAlice presented. Within each pool the weights were particular to that pool.
MS. ROSENBLATT: I might add that the weights also differed. One of the things thatwe didn't get into in this synopsis but that is in the report, is that, if you look at theweights across the different pools, there are differences.
785

RECORD, VOLUME 21
MR. W. RANDOLPH ADAMS: I'd like to know if you included claims for mental healthtreatment.
MR. DUNN: We did not exclude those claims.
MR. ADAMS: I didn't see them in your table of high cost procedures, and I know thatmental health claims account for a very high percentage of premiums that are collected forhealth insurance.
MR. DUNN: Right. It wasn't an exhaustive list of the high cost conditions. One of theproblems with mental health diagnoses is that we're working with plans of potentiallydifferent benefit packages, limits, and so on. This is one of the reasons why we didn't.Much of our analysis is plan by plan. We did not explicitly throw out those types ofclaims---they were in if they were reported, and if they weren't, then we didn't have them.
MR. ADAMS: Did you get ICD9 codes that would identify specific conditions such asschizophrenia, manic depression, and so on, or were they all lumped together into onecode?
MR. DUNN: If the ICD9 psychiatric codes we had were the principal reasons for theencounter, either inpatient or ambulatory, then that's what we had reported.
MR. ADAMS: When will the report be available, and how may one obtain the report?
MS. ROSENBLATT: Tom Edwalds has told me that the research committee needs to
approve the final report, and that will probably occur soon. [The completed report, alsotitled, "A Comparative Analysis of Methods of Health Risk Assessment" was published in1996 in monograph form. It is available for $35.00 through the SOA books department.]
MR. PAUL J. DONAHUE: I wonder if you reached any conclusions. You mentioned thepossibility of the need for market reforms, in addition to predictors. Did you concludewhether reform worked for state programs? Would there have to be market reform on, forexample, controls on marketing, in addition to the use of risk adjusters? Is perhaps one ofthe reasons the HIV pool had so few claims that there has been an improvement in theaverage monthly costs so that fewer claims qualify for the $2,000 threshold?
MR. DUNN: I can give you a quick answer. Our conclusion was that, based on theindividual nonrandom group results, these models alone would not remove all incentivesfor risk selection or with the outcome of such behavior. Therefore, unless there is sometype of measure being put into place that limits risk selection behavior, then the modelsthemselves are not enough.
MR. KOSCIELNY: With regard to the HIV results, I think it's the criteria in the CD4concept. Of the 14 claims that we received, I think 10 or 11 of them came from onecompany. It was a small company actually, but one that was very active in getting thoseclaims. I think it's the criteria. We don't have any information to judge whether the$2,000 is a barrier or not because we just didn't get any claims.
786