financial strategy and risk update
TRANSCRIPT

aegon.com
Darryl Button
CFO
Analyst & Investor Conference
New York City – June 25, 2014
Financial strategy and risk update
Tom Grondin
CRO

2
Key messages
Strong enterprise risk management key to long-term success
Disciplined capital management
► Cash flow generation driving capital deployment
► Capital deployment plan update
► Solvency II implementation on track, uncertainties remain
On track to achieve financial 2015 targets
3
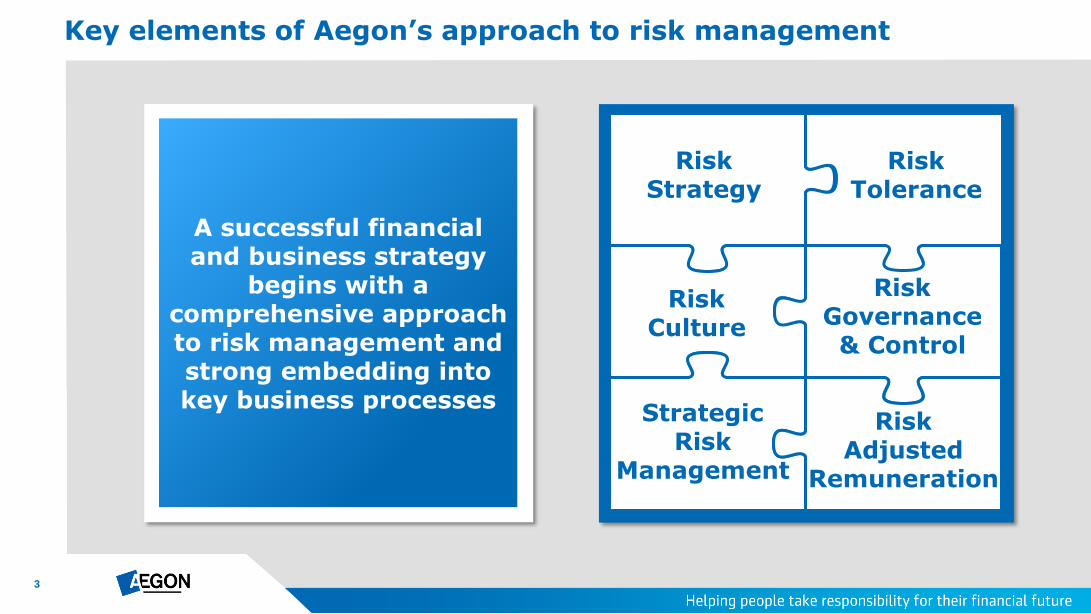
Key elements of Aegon’s approach to risk management
Risk Strategy
Risk Culture
Strategic Risk
Management
Risk Tolerance
Risk Governance & Control
Risk Adjusted
Remuneration
A successful financial and business strategy
begins with a comprehensive approach to risk management and strong embedding into key business processes

4
Risk strategy guides decision making
Risk strategy provides group-wide framework that drives
risk taking decisions
Each risk assessed for strategic fit
Hedging programs designed based on targeted risk profile
Does the risk help us meet a customer need?
Don’t offer / accept
Supports Strategy
Do we have the competence to manage the risk?
Don’t offer / accept
Risk Competence
Do we like the risk?
Hedge / mitigate
Risk Preference
Do we have remaining capacity?
Hedge / mitigate
Risk Tolerance
Keep / accept the risk
Targeted Risk Profile
Risk Strategy

5
Risk tolerance takes all constraints into consideration
Risk Tolerance
Focal area Purpose Description
Financial Strength
Supports strategy to compete in local and international markets
Assessment of capital adequacy
Continuity Demonstrates ability to fulfill commitments to stakeholders
Extreme event test of capitalization
Culture Sends a strong message on desired risk culture
Quantitative and qualitative statements set the tone for operational risk tolerance
Risk Balance Encourages diversification and steering of risk preference
Assessment of each risk type compared to risk strategy resulting in targeted risk profile

6
81
71
83
89
92
79
74
68
74
80
12
18
10
9
7
15
18
22
16
13
7
11
7
2
1
6
9
10
10
7
% Favorable % Neutral % Unfavorable
Promoting a culture of risk management at all levels
Environment where all are accountable for managing risk
All employees encouraged to raise issues and concerns with
emphasis on ensuring customers are treated fairly
Remuneration framework discourages excessive risk taking
and rewards consideration of long-term stakeholder
interests
Risk Culture
* Risk culture statements included in the annual employee survey; respondents asked to indicate to what extent they agree with the statements
In my team, we are encouraged to openly discuss problems and concerns
In my team we anticipated and proactively address potential issues before a problem has occurred
In my team we learn from past mistakes to minimize future problems and risks
I have a good understanding of risk management practices, policies and procedures that relate to my work
I have the skills and knowledge to assess risks related to my work
I have access to the information and resources needed to help manage problems and risk in my work
People in my team seek to resolve problems even when they are outside their area of responsibility
Thinking and acting in the interests of customers is recognized and rewarded
Managers within my team admit when they have made mistakes
My manager takes decisive action when problems occur
2014 Aegon global employee survey results*
+2
+3
+2
+2
+1
+2
+3
+3
+3
+2
2014 vs. 2013
CLEAR STRENGTH
CLEAR STRENGTH
CLEAR STRENGTH
CLEAR STRENGTH
CLEAR STRENGTH
CLEAR STRENGTH
MODERATE STRENGTH
MODERATE STRENGTH
MODERATE STRENGTH
MODERATE STRENGTH

7
Internal Audit
Group Risk and Capital Committee
(GRCC)
Risk governance and control based on 3 lines of defense
All levels of the organization represented in Aegon’s risk
governance framework
Based on 3 lines of defense
Ensures coherent and integrated approach to risk
management
MB / EB
Risk
Risk Governance &
Control
Enterprise Risk Management Committee
Regional / Business unit
RCC’s
Management & Executive Board
1st Line of Defense
2nd Line of Defense
3rd Line of Defense
Decisions taken in line with the MB Charter
Supervisory Board Supervisory Board Risk Committee

8
Strategic risk management surrounds all aspects of the business
Corporate strategy
► Business development
► Mergers, acquisitions and divestments
Balance sheet management (ALM)
Capital management
► Balancing leverage and returns
► Managing capital through various cycles
Pricing & product development
► Customer needs matched with our competencies
► Risks we can manage and risks we want
► CFO/CRO certification
► Embedded market conduct principles
► All stakeholders considered
Strategic Risk Management
Important client considerations
Identify client need and value added
Identify target market for which the product is suited
Make as simple as possible while meeting customer demand
Ensure product transparency (options, benefits, charges)
Ensure servicing capability and operational management
Ensure fair, cost-efficient and competitive price for client

9
Actively managed pricing policy yields results
2012 2013 2014
Ireland: Variable annuities (re-priced)
US: Fixed annuities (de-emphasized)
India: Money Back Plus Plan (terminated)
Canada: Segregated funds (terminated)
NL: Disability protection (re-priced)
Asia: UL secondary guarantee (revised)
US: UL secondary guarantee (revised)
US: Long term care (revised)
NL: P&C (distribution adjusted)
US: A&H (distribution adjusted)
US: Variable annuities (revised)
Market consistent value of new business (EUR million, % of PVNBP)
Key actions taken to manage profitability
125 117 173
204 232
202
285 268 223
1.0% 1.0%
1.3%
1.6%
1.9%
1.4%
1.8%
1.5% 1.6%
1Q12 2Q12 3Q12 4Q12 1Q13 2Q13 3Q13 4Q13 1Q14
MCVNB Negative MCVNB MCVNB/PVNBP

10
Risk adjusted remuneration providing right incentives
Risk Adjusted Remuneration
Focal area Purpose Description
Balanced target setting
Ensures effective risk management as an integral part of target setting
Balance of risk-based financial and non-financial performance targets
Aligned with risk strategy and tolerance
Continuity Supports and aligned with desired risk culture
Encourages balanced risk management
Promotes early and effective management of issues
Supports accountability
Culture Remuneration balanced between short and long term goals
Deferred variable remuneration promotes long term focus
Challenge & oversight
Framework overseen and challenged by all 3 lines of defense
Management sets targets Challenged by Risk team Overseen by Internal Audit

11
Disciplined capital management policy
Buffer level
Target level
Floor level
Local excess capital Buffers assessed at least annually
Buffer to ensure stable dividends to the holding, based on assessment of: Volatility of local capital position Threats to local capital position Forecasted capital generation capacity
Adequate capitalization level Satisfies local regulatory and rating
agency requirements Fluctuations around Target expected
Threshold for local capitalization Falling below Floor could result in
pressure from regulators
Strengthen local balance
sheet
Dividends to the
holding
Fungibility analysis Dividends to the holding
increased above plan
Desired capitalization Dividends to the holding per plan
Restore capitalization Dividends to the holding subject
to additional internal governance
Restore capitalization Dividends to the holding
suspended
Local capital policy Management action Use of operational free cash flows
Dividends from subsidiaries to the holding may be subject to regulatory approval

12
~285%
~245% ~245% ~240% ~240%
Q1 13 Q2 13 Q3 13 Q4 13 Q1 14
~900 ~800
~900
~500
~800
Q1 13 Q2 13 Q3 13 Q4 13 Q1 14
Q1 2014 group IGD solvency ratio of ~212%
USD ~800 million above S&P AA level in the United States
► NAIC RBC ratio well above 450%
► USD 600 million dividend paid to the holding in Q2 2014
IGD solvency ratio in the Netherlands and the UK at desired levels
Maintaining strong capitalization levels across the group
Target level Buffer level
700
0
* Includes excess capital at UK holding level
~125% ~130% ~140%
~150% ~150%
Q1 13 Q2 13 Q3 13 Q4 13 Q1 14
United States (USD million over S&P AA)
The Netherlands (IGD ratio ex. Bank)
United Kingdom (Pillar 1 ratio incl. with profit fund*)
250%
200%
165%
145%

13
2013 operational free cash flows in target range of EUR 1.3 - 1.6 billion
Americas and the Netherlands expected to remain stable
UK cash flow target of GBP 150 – 200 million in 2015 on reduced commissions, cost reductions, lower investments and wind-down of securitization repayments
New Markets contributing to increasing operational free cash flow going forward
Operational free cash flows reflect strong capital generation
Strong cash flows at the units… (EUR billion)
2013
Americas 0.8
Netherlands 0.3
United Kingdom 0.1
New Markets 0.1
Normalized operational free cash flow 1.3
Market impacts & one-time items 0.2
Operational free cash flow 1.5
… translate into dividends to the holding (EUR billion)
2013
Americas 0.9
Netherlands 0.5
United Kingdom 0.0
New Markets 0.1
Dividends to the holding 1.5

14
2010 2011 2012 2013 1Q 14
Lower leverage and holding expenses reduce holding excess capital floor level
Capital above the floor level available to support units during stress events,
provide stability of common dividends and accelerated deployment
Elevated holding excess capital expected while Solvency II remains unclear
Holding excess capital ensures flexibility
1.7
1.2
2.0
2.2
1.5x annual holding costs of EUR ~0.4 billion
Floor level: EUR 0.6b
Holding excess capital (EUR billion)
Capital available for accelerated deployment
Stability of dividends
Capital support for businesses during stress
1.7

15
Over EUR 2.0 billion of deleveraging since 2011
Announced deleveraging concludes in 2014
► USD 550 million 6.875% capital securities called in March
► USD 1,050 million 7.25% capital securities replaced by EUR 700 million 4.0% subordinated securities in April
► EUR 500 million senior debt to be retired in December
Improvements support “AA” financial strength rating
► Both metrics expected to be in target ranges at year-end 2014
Reduced leverage improving financial flexibility
8.7 7.7
6.8
34% 32%
33%
~30%
2011 2012 2013* 2014 target
520
444 403
~300
3.8x
4.8x
5.2x
6-8x
2011 2012 2013* 2014 target
* Restated to reflect DAC and longevity accounting changes
9.2
Gross leverage (EUR billion, %)
Funding costs (EUR million, fixed charge coverage)

16
Free cash flow up strongly as a result of higher operational free cash flow (OFCF) from business growth and lower holding expenses
► OFCF growth from fee-based businesses more than offsets lower spread-related cash flows
► Holding expenses halved as result of cost savings and capital management actions
Currently, approximately 50% of our free cash flow is paid out to shareholders
Strong free cash flow growth
1.0-1.2
1.3-1.6
2010 2015e
(0.6)
(0.3)
2010 2015e
0.4-0.6
1.0-1.3
2010 2015e
+ =
* Operational free cash flow excluding market impacts and one-time items
Targeted growth of OFCF* (EUR billion)
Reduced holding expenses (EUR billion)
Doubling of free cash flow (EUR billion)
+30% -50% ~2x

17
Free cash flow growth translating into increased use of cash for dividends
► Capital management actions have reduced funding costs by EUR ~220 million since 2011
► Payout ratio improved to ~50% with full cash dividend commitment
Continued dividend growth dependent on capital position and cash flow
Free cash flow growth supports sustainable dividend growth
Free cash flow and payout ratio (EUR million)
2013 Actual
2013 Adjusted
Normalized operational free cash flows 1,335 1,335
Holding expenses (460) (460)
Free cash flow 875 875
Common dividends 340 460*
Dividend payout % 39% 53% 0 0
140
340
460**
2010 2011 2012 2013 2014E
Cash allocated to dividends (EUR million)
** Assumes 2014 interim dividend maintained at EUR 0.11 per share
*Assuming current full cash dividend commitment

18
Capital deployment plan 2014 – 2015
Strong cash flows support business unit dividends to the holding
Announced deleveraging on track to conclude in 2014
Committed to sustainable growth of full-cash dividend
Intention to neutralize dilutive EPS effect of preferred share transaction
Holding excess capital EUR 2.2 billion at YE-2013
Accelerated capital released from non-core and businesses under
review
EUR million
Net dividends to the holding from business units ~2.5
Estimated funding & operating expenses ~(0.7)
Available for deployment 2014-2015 ~1.8
2014 deleveraging actions ~(1.0)
Available for shareholders 2014-2015 ~0.8
Dividends to shareholders* ~(1.0)
Neutralization of preferred share transaction ~(0.4)
Capital from other sources ~(0.6)
* Assumes dividend maintained at current level
19
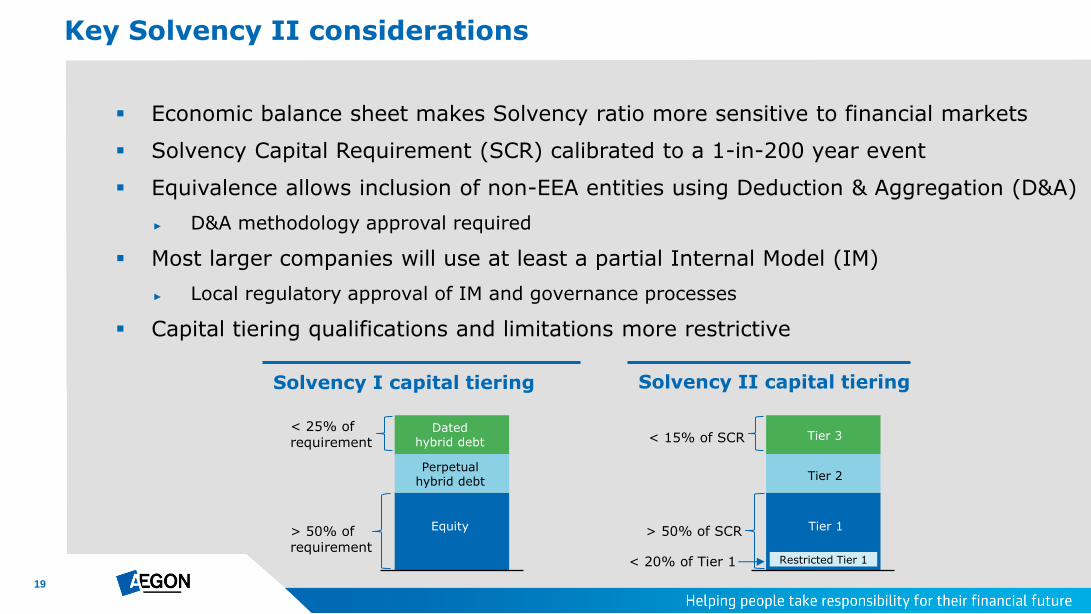
Key Solvency II considerations
Economic balance sheet makes Solvency ratio more sensitive to financial markets
Solvency Capital Requirement (SCR) calibrated to a 1-in-200 year event
Equivalence allows inclusion of non-EEA entities using Deduction & Aggregation (D&A)
► D&A methodology approval required
Most larger companies will use at least a partial Internal Model (IM)
► Local regulatory approval of IM and governance processes
Capital tiering qualifications and limitations more restrictive
Tier 1
Tier 2
Tier 3
> 50% of SCR
Solvency I capital tiering Solvency II capital tiering
< 15% of SCR
Restricted Tier 1 < 20% of Tier 1
Equity
Perpetual hybrid debt
Dated hybrid debt
> 50% of requirement
< 25% of requirement

20
Solvency II implementation on track, uncertainties remain
EEA
Netherlands
United Kingdom
CEE
Spain
Ireland
Non-EEA
United States
Bermuda
Canada
Asia
Aegon Group Solvency II SCR Ratio
150% 200%
Group Solvency II ratio comfortably within
150% to 200% range
Key assumptions
► US business consolidated at 200% RBC ratio*
► Matching adjustment applied for UK annuity
portfolio
► Volatility Adjuster applied for NL
Uncertainties remain for all business units
► Final Solvency II specifications, such as
• Matching Adjustment
• Volatility Adjuster
• Treatment of sovereigns
► Final calibration/approval of internal model and deduction & aggregation methodology
* 200% Company Action Level (CAL) required capital

21
Progress towards 2015 targets
See slide 24 for main economic assumptions * Excluding market impact and one-time items. Trailing four quarters OFCF corresponds with Free Cash Flow of EUR 0.9 billion
30-35%
Fee-based earnings as % of underlying earnings by 2015
€ 1.3-1.6
Annual operational free cash flow by 2015* in billions
7-10%
Grow underlying earnings on average per annum between 2012 and 2015
10-12%
Return on equity by 2015
37%
Q1 2014
€ 1.3
OFCF in trailing four quarters* in billions
7%
Q1 2014 vs. Q1 2013
8.4%
Q1 2014 (9.1% excl. run-off capital)

22
Key messages
Strong enterprise risk management key to long-term success
Disciplined capital management
► Cash flow generation driving capital deployment
► Capital deployment plan update
► Solvency II implementation on track, uncertainties remain
On track to achieve financial 2015 targets

23
Appendix

24
10-year US Treasury assumed to grade over ten years to 4.25%
Credit spreads are assumed to grade over two years to 110 bps
Bond funds are assumed to return 4% for 10 years and 6% thereafter
Money market rates are assumed to remain flat at 0.1% for two years followed by a 3-year grading to 3%
Annual gross equity market returns of 8% (price appreciation + dividends)
Main economic assumptions
Main US economic assumptions
Assumptions NL UK
10-year interest rate 2.5% 2.9%
3-month interest rate 0.3% 0.4%
Annual gross equity market return (price appreciation + dividends)
7% 7%
EUR/USD rate of 1.35
EUR/GBP rate of 0.84

Thank you
For questions please contact Investor Relations +31 70 344 8305 [email protected] P.O. Box 85 2501 CB The Hague The Netherlands

26
Cautionary note regarding non-IFRS measures This document includes the non-IFRS financial measures: underlying earnings before tax, income tax, income before tax and market consistent value of new business. These non-IFRS measures are calculated by consolidating on a proportionate basis Aegon’s joint ventures and associated companies. The reconciliation of these measures, except for market consistent value of new business, to the most comparable IFRS measure is provided in note 3 ‘Segment information’ of Aegon’s Condensed Consolidated Interim Financial Statements. Market consistent value of new business is not based on IFRS, which are used to report Aegon’s primary financial statements and should not be viewed as a substitute for IFRS financial measures. Aegon may define and calculate market consistent value of new business differently than other companies. Aegon believes that its non-IFRS measures, together with the IFRS information, provide meaningful information about the underlying operating results of Aegon’s business including insight into the financial measures that senior management uses in managing the business. In addition, return on equity is a ratio using a non-GAAP measure and is calculated by dividing the net underlying earnings after cost of leverage by the average shareholders’ equity excluding the preferred shares, the revaluation reserve and the reserves related to defined benefit plans. Local currencies and constant currency exchange rates This document contains certain information about Aegon’s results, financial condition and revenue generating investments presented in USD for the Americas and GBP for the United Kingdom, because those businesses operate and are managed primarily in those currencies. Certain comparative information presented on a constant currency basis eliminates the effects of changes in currency exchange rates. None of this information is a substitute for or superior to financial information about Aegon presented in EUR, which is the currency of Aegon’s primary financial statements. Forward-looking statements The statements contained in this document that are not historical facts are forward-looking statements as defined in the US Private Securities Litigation Reform Act of 1995. The following are words that identify such forward-looking statements: aim, believe, estimate, target, intend, may, expect, anticipate, predict, project, counting on, plan, continue, want, forecast, goal, should, would, is confident, will, and similar expressions as they relate to Aegon. These statements are not guarantees of future performance and involve risks, uncertainties and assumptions that are difficult to predict. Aegon undertakes no obligation to publicly update or revise any forward-looking statements. Readers are cautioned not to place undue reliance on these forward-looking statements, which merely reflect company expectations at the time of writing. Actual results may differ materially from expectations conveyed in forward-looking statements due to changes caused by various risks and uncertainties. Such risks and uncertainties include but are not limited to the following: Changes in general economic conditions, particularly in the United States, the Netherlands and the United Kingdom; Changes in the performance of financial markets, including emerging markets, such as with regard to:
► The frequency and severity of defaults by issuers in Aegon’s fixed income investment portfolios; ► The effects of corporate bankruptcies and/or accounting restatements on the financial markets and the resulting decline in the value of equity and debt securities Aegon holds; and ► The effects of declining creditworthiness of certain private sector securities and the resulting decline in the value of sovereign exposure that Aegon holds;
Changes in the performance of Aegon’s investment portfolio and decline in ratings of Aegon’s counterparties; Consequences of a potential (partial) break-up of the euro or the potential independence of Scotland from the United Kingdom The frequency and severity of insured loss events; Changes affecting longevity, mortality, morbidity, persistence and other factors that may impact the profitability of Aegon’s insurance products; Reinsurers to whom Aegon has ceded significant underwriting risks may fail to meet their obligations; Changes affecting interest rate levels and continuing low or rapidly changing interest rate levels; Changes affecting currency exchange rates, in particular the EUR/USD and EUR/GBP exchange rates; Changes in the availability of, and costs associated with, liquidity sources such as bank and capital markets funding, as well as conditions in the credit markets in general such as changes in borrower and counterparty creditworthiness; Increasing levels of competition in the United States, the Netherlands, the United Kingdom and emerging markets; Changes in laws and regulations, particularly those affecting Aegon’s operations, ability to hire and retain key personnel, the products Aegon sells, and the attractiveness of certain products to its consumers; Regulatory changes relating to the insurance industry in the jurisdictions in which Aegon operates; Changes in customer behavior and public opinion in general related to, among other things, the type of products also Aegon sells, including legal, regulatory or commercial necessity to meet changing customer expectations; Acts of God, acts of terrorism, acts of war and pandemics; Changes in the policies of central banks and/or governments; Lowering of one or more of Aegon’s debt ratings issued by recognized rating organizations and the adverse impact such action may have on Aegon’s ability to raise capital and on its liquidity and financial condition; Lowering of one or more of insurer financial strength ratings of Aegon’s insurance subsidiaries and the adverse impact such action may have on the premium writings, policy retention, profitability and liquidity of its insurance subsidiaries; The effect of the European Union’s Solvency II requirements and other regulations in other jurisdictions affecting the capital Aegon is required to maintain; Litigation or regulatory action that could require Aegon to pay significant damages or change the way Aegon does business; As Aegon’s operations support complex transactions and are highly dependent on the proper functioning of information technology, a computer system failure or security breach may disrupt Aegon’s business, damage its reputation and adversely affect its
results of operations, financial condition and cash flows; Customer responsiveness to both new products and distribution channels; Competitive, legal, regulatory, or tax changes that affect profitability, the distribution cost of or demand for Aegon’s products; Changes in accounting regulations and policies or a change by Aegon in applying such regulations and policies, voluntarily or otherwise, may affect Aegon’s reported results and shareholders’ equity; The impact of acquisitions and divestitures, restructurings, product withdrawals and other unusual items, including Aegon’s ability to integrate acquisitions and to obtain the anticipated results and synergies from acquisitions; Catastrophic events, either manmade or by nature, could result in material losses and significantly interrupt Aegon’s business; and Aegon’s failure to achieve anticipated levels of earnings or operational efficiencies as well as other cost saving and excess capital and leverage ratio management initiatives. Further details of potential risks and uncertainties affecting Aegon are described in its filings with the Netherlands Authority for the Financial Markets and the US Securities and Exchange Commission, including the Annual Report. These forward-looking statements speak only as of the date of this document. Except as required by any applicable law or regulation, Aegon expressly disclaims any obligation or undertaking to release publicly any updates or revisions to any forward-looking statements contained herein to reflect any change in Aegon’s expectations with regard thereto or any change in events, conditions or circumstances on which any such statement is based.
Disclaimers