rising atmospheric co2, crop quality and human nutrition
TRANSCRIPT

Hidden shift of the ionome of plants exposed to elevated CO2 depletes minerals at the base of human nutrition. - F1000PrimeKWWSIFRPSULPH
http://f1000.com/prime/718432028 1/2
Save/Follow
expand all
31 Jul 2014Exceptional
CONFIRMATION | GOOD FOR TEACHING | NEW FINDING
DOI: 10.3410/f.718432028.793497713
more »
Hidden shift of the ionome of plants exposed to elevatedCO2 depletes minerals at the base of human nutrition.Loladze Ielife. 2014;; 3:e02245
| |
Recommendations:
This global synthesis of the impact of elevated CO2 on mineral nutrition in plant tissues is a marvellous piece of careful assessment of our current knowledge with significantimplications for human well-being. It is rare that I keep reading a paper from front to end, word for word. I recommend strongly that ecologists, agronomists, plant physiologists,and experts of human nutrition read this paper. The authors bring clear evidence that offering plants CO2 concentrations that are to be expected for the late 21st century changestissue composition far beyond the established trend of reduced protein concentration by an average 8% decline in overall mineral nutrient concentration. This happensirrespective of plant species, plant organ, geographical location, or the method of CO2 enrichment.
I would have appreciated a clear distinction between the dilution effect by higher non-structural carbohydrate (NSC) concentrations from a signal without NSCs, but the availabledata are presumably insufficient (the author discusses the issue). The fact that there was no effect on manganese (Mn) concentration in bulk plant mass (key for mitochondrialrespiration) actually means that there was more Mn per unit NSC-free biomass. The paper offers a lot of highly sophisticated statistics for all key chemical elements in organismictissues. The human nutrition scenarios of the recent past (40% rise in CO2) and for the next 30-80 years (doubling the pre-industrial concentration) indicate the possibility ofcritical malnutrition in certain diet groups.
My only critique is that the data were not stratified by soil conditions (amended or natural), a distinction far more significant than the way elevated CO2 was simulated 1. Thisanalysis is really a gem of lasting impact and perfectly suitable for classwork with students. It is symptomatic of the policy of the funding agencies I know that such a tremendouslyimportant synthesis does not meet funding criteria (as the author experienced with the US National Science Foundation [NSF]).
References
1. Nutrients and sink activity drive plant CO2 responses - caution with literature-based analysis
Körner C. New Phytologist159(3):537-538DOI: 10.1046/j.1469-8137.2003.00870.x
Disclosures
None declared
Add a comment
Abstract:
Mineral malnutrition stemming from undiversified plant-based diets is a top global challenge. In C3 plants (e.g., rice, wheat), elevated concentrations of atmospheric carbondioxide (eCO2) reduce protein and nitrogen concentrations, and can increase the total non-structural carbohydrates (TNC;; mainly starch, sugars). However, contradictoryfindings have obscured the effect of eCO2 on the ionome-the mineral and trace-element composition-of plants. Consequently, CO2-induced shifts in plant quality have beenignored in the estimation of the...impact of global change on humans. This study shows that eCO2 reduces the overall mineral concentrations (-8%, 95% confidence interval: -9.1 to -6.9, p<0.00001) andincreases TNC:minerals > carbon:minerals in C3 plants. The meta-analysis of 7761 observations, including 2264 observations at state of the art FACE centers, covers 130species/cultivars. The attained statistical power reveals that the shift is systemic and global. Its potential to exacerbate the prevalence of 'hidden hunger' and obesity isdiscussed.DOI: http://dx.doi.org/10.7554/eLife.02245.001.
Copyright © 2014, Loladze.DOI: 10.7554/eLife.02245PMID: 24867639
Abstract courtesy of PubMed: A service of the NationalLibrary of Medicine and the National Institutes ofHealth.
3
Export Get Article
RECOMMENDATIONS 1 ABSTRACT COMMENTS
Christian Koerner F1000 Ecology
University of Basel, Basel, Switzerland.
ABSTRACT
Article Recommendations Advanced
ARTICLE RECOMMENDATIONS RANKINGS F1000PRIME REPORTS F1000 FACULTY JOURNAL CLUBS BLOG MyF1000 SIGN OUT
elifesciences.org
Loladze. eLife 2014;3:e02245. DOI: 10.7554/eLife.02245 1 of 29
Hidden shift of the ionome of plants exposed to elevated CO2 depletes minerals at the base of human nutritionIrakli Loladze1*
1Department of Mathematics Education, The Catholic University of Daegu, Gyeongsan, Republic of Korea
Abstract Mineral malnutrition stemming from undiversified plant-based diets is a top global challenge. In C3 plants (e.g., rice, wheat), elevated concentrations of atmospheric carbon dioxide (eCO2) reduce protein and nitrogen concentrations, and can increase the total non-structural carbohydrates (TNC; mainly starch, sugars). However, contradictory findings have obscured the effect of eCO2 on the ionome—the mineral and trace-element composition—of plants. Consequently, CO2-induced shifts in plant quality have been ignored in the estimation of the impact of global change on humans. This study shows that eCO2 reduces the overall mineral concentrations (−8%, 95% confidence interval: −9.1 to −6.9, p<0.00001) and increases TNC:minerals > carbon:minerals in C3 plants. The meta-analysis of 7761 observations, including 2264 observations at state of the art FACE centers, covers 130 species/cultivars. The attained statistical power reveals that the shift is systemic and global. Its potential to exacerbate the prevalence of ‘hidden hunger’ and obesity is discussed.DOI: 10.7554/eLife.02245.001
IntroductionMankind's ultimate source of carbohydrates is atmospheric carbon dioxide (CO2) converted by photo-synthesis to sugars. The bulk of the terrestrial conversion of CO2-to-carbohydrates is done by C3 plants, which account for over three quarters of global primary production and for over 90% of Earth's plant species (Still and Berry, 2003). (If not stated otherwise, hereafter, terms ‘plant(s)’ and ‘crop(s)’ refer to C3 species). When exposed to CO2 concentrations twice the preindustrial level of ฏ280 ppm, plants increase the synthesis of carbohydrates by 19–46% (Leakey et al., 2009). Currently, CO2 concentrations are reaching 400 ppm—the highest level since the dawn of agriculture and likely to be the highest since the rise of modern humans (Siegenthaler et al., 2005). Within a single human lifespan, CO2 levels are projected to reach 421–936 ppm (IPCC, 2013). Will rising CO2 concentrations—one of the most certain and pervasive aspects of global climate change—alter the quality of crops and wild plants? Will the CO2-induced stimulation of carbohydrate synthesis increase the carbohydrates-to-minerals ratio in crops? Can such shifts in crop quality affect human nutrition and health?
Elevated CO2 effects on plant quantity (productivity and total biomass) have been extensively studied and show higher agricultural yields for crops, including wheat, rice, barley, and potato. But eCO2 effects on plant quality, and possible cascading effects on human nutrition, have been largely ignored in the estimation of the impact of eCO2 on humans. Notably, IPCC (2007, 2013) and AAAC Climate Science Panel (2014) include direct CO2 effects (e.g., ocean acidification) in their climate change assessments but do not mention any CO2 effects on crop or wild plant quality. However, it is unwarranted to assume that plants will balance the increased carbohydrate synthesis with other adjust-ments to their physiology to maintain the nutritional quality for their consumers in a state of unper-turbed homeostasis. The stoichiometry—the relative ratios of chemical elements—in plants is plastic and, to a considerable degree, reflects their environment (Sterner and Elser, 2002). However, detecting CO2-induced shifts in plant quality is challenging for several reasons. First, plant quality involves
*For correspondence: [email protected]
Competing interests: The author declares that no competing interests exist.
Funding: See page 22
Received: 08 January 2014Accepted: 25 April 2014Published: 07 May 2014
Reviewing editor: Ian T Baldwin, Max Planck Institute for Chemical Ecology, Germany
Copyright Loladze. This article is distributed under the terms of the Creative Commons Attribution License, which permits unrestricted use and redistribution provided that the original author and source are credited.
RESEARCH ARTICLE
Ecology | Epidemiology and global health
Loladze. eLife 2014;3:e02245. DOI: 10.7554/eLife.02245 2 of 29
Research article
multiple nutritional currencies, for example macronutrients (carbohydrates, protein, and fat) and micronutrients (minerals, vitamins and phytonutrients). Assessing relative changes within and among multiple currencies requires significantly more effort and funding than measuring only plant quantity (e.g., yield). Second, plant quality, including the plant ionome—all the minerals and trace-elements found in a plant (Lahner et al., 2003; Salt et al., 2008)—is inherently variable; and measurement imprecisions further amplify the variability. For example, Stefan et al. (1997) report the accuracy test for 39 facilities that analyzed samples of the same plant tissues: the inter-laboratory variance was 6.5% for N, but twice as large for phosphorus (P) and calcium (Ca), and reached 130% for sodium (Na). Therefore, CO2-induced changes in the plant ionome (the signal) can be easily lost amid highly variable data (the noise), especially when such data are limited and sample sizes are small. However, it is important to bear in mind that a low signal-to-noise ratio does not imply that the signal is practically insignificant, especially if it is global and sustained—a point revisited in the ‘Discussion’.
Elusive CO2 effect on the plant ionome: contradictory findingsThe first empirical evidence of lower mineral content in plants exposed to eCO2 appeared at least over a quarter century ago (e.g., Porter and Grodzinski, 1984; Peet et al., 1986; O’Neill et al., 1987). Physiological mechanisms responsible for the overall decline of plant mineral content—with expected changes being non-uniform across minerals—have been proposed: the increased carbohydrate production combined with other eCO2 effects such as reduced transpiration (Loladze, 2002; McGrath and Lobell, 2013). However, most of the experimental evidence showing CO2-induced mineral declines came from artificial facilities, mainly closed chambers and glasshouses, and many results were statistically non-significant. This led some research groups to challenge altogether the notion of lower mineral content in plants exposed to eCO2 in field conditions. Such conditions are most accurately represented in Free-Air Carbon dioxide Enrichment (FACE) centers, which have been established in at least 11 countries.
eLife digest Rice and wheat provide two out every five calories that humans consume. Like other plants, crop plants convert carbon dioxide (or CO2) from the air into sugars and other carbohydrates. They also take up minerals and other nutrients from the soil.
The increase in CO2 in the atmosphere that has happened since the Industrial Revolution is thought to have increased the production of sugars and other carbohydrates in plants by up to 46%. CO2 levels are expected to rise even further in the coming decades; and higher levels of CO2 are known to lead to lower levels of proteins in plants. But less is known about the effects of CO2 levels on the concentrations of minerals and other nutrients in plants.
Loladze has investigated the effect of rising CO2 levels on the nutrient levels in food plants by analyzing data on 130 varieties of plants: his dataset includes the results of 7761 observations made over the last 30 years, by researchers around the world. Elevated CO2 levels were found to reduce the overall concentration of 25 important minerals—including calcium, potassium, zinc, and iron—in plants by 8% on average. Furthermore, Loladze found that an increased exposure to CO2 also increased the ratio of carbohydrates to minerals in these plants.
This reduction in the nutritional value of plants could have profound impacts on human health: a diet that is deficient in minerals and other nutrients can cause malnutrition, even if a person consumes enough calories. This type of malnutrition is common around the world because many people eat only a limited number of staple crops, and do not eat enough foods that are rich in minerals, such as fruits, vegetables, dairy and meats. Diets that are poor in minerals (in particular, zinc and iron) lead to reduced growth in childhood, to a reduced ability to fight off infections, and to higher rates of maternal and child deaths.
Loladze argues that these changes might contribute to the rise in obesity, as people eat increasingly starchy plant-based foods, and eat more to compensate for the lower mineral levels found in crops. Looking to the future, these findings highlight the importance of breeding food crops to be more nutritious as the world's CO2 levels continue to rise.DOI: 10.7554/eLife.02245.002
Ecology | Epidemiology and global health
Loladze. eLife 2014;3:e02245. DOI: 10.7554/eLife.02245 3 of 29
Research article
In the grains of rice harvested at four FACE paddies in Japan, Lieffering et al. (2004) found no decline in any of the minerals but lower N content. The result disagreed with Seneweera and Conroy (1997), who were the first to report lower iron (Fe) and zinc (Zn) in grains of rice grown at eCO2 and warned that altered rice quality can negatively affect developing countries. Lieffering et al. (2004), however, argued that the result of Seneweera and Conroy (1997) could be an artifact of growing rice in pots, which restrict rooting volumes. They hypothesized that in FACE studies, which provide unrestricted rooting volumes, plants would increase uptake of all minerals to balance the increased carbohydrate production. This hypothesis, however, found no support in the FACE studies of Pang et al. (2005) and Yang et al. (2007) (carried out in China and latitudinally not very far from the study in Japan), who found that eCO2 significantly altered the content of several minerals in rice grains.
The contradictory results coming from these studies on rice seem perplexing, especially in light of the very robust effect that eCO2 has on N in non-leguminous plants. Elevated CO2 reduces N concen-trations by 10–18% systemically throughout various tissues: leaves, stems, roots, tubers, reproductive and edible parts, including seeds and grains (Cotrufo et al., 1998; Jablonski et al., 2002; Taub et al., 2008). If the increased carbohydrate production dilutes the nutrient content in plants, why does the dichotomy seem to exist between the responses of N and minerals to eCO2? In addition to the carbo-hydrate dilution and reduced transpiration, eCO2 can further lower N concentrations in plants by: (1) reducing concentrations of Rubisco—one of the most abundant proteins on Earth that comprises a sizable N-pool in plants (Drake et al., 1997), and (2) inhibiting nitrate assimilation (Bloom et al., 2010). Hence, it is reasonable to expect the effect of eCO2 on N to be larger and, thus, easier to dis-cern than its effect on most minerals. The stronger signal for N, combined with the plentiful and less noisy data on this element, can help explain why by the end of last century the effect of eCO2 on N had been already elucidated (Cotrufo et al., 1998), but its effect on minerals has remained elusive.
The obscure nature of the effect of eCO2 on minerals becomes particularly apparent in the largest to date meta-analysis on the issue by Duval et al. (2011), who fragmented data from 56 eCO2 studies into 67 cases. In 47 of the cases, the effect of eCO2 on minerals was statistically non-significant, that is the 95% Confidence Interval (CI) for the effect size overlapped with 0. The remaining 20 cases were statistically significant but showed no pattern: for example, Fe increased in grasses but decreased in trees, Zn increased in roots but decreased in stems, while in grains only sulfur (S) decreased. Duval et al. (2011) concluded: “A major finding of this synthesis is the lack of effect of CO2 on crop grains nutrient concentration”. This would imply laying to rest the hypothesis that eCO2 consistently alters the plant ionome and would render mitigation efforts to combat declining crop mineral concentra-tions in the rising CO2 world unnecessary. However, a closer examination of the results of Duval et al. (2011) reveals that every statistically significant increase in mineral concentrations was obtained by bootstrapping a sample of size 2, 4 or 5—a recipe for generating invalid 95% CIs. Ioannidis (2005) showed that false research findings, stemming from small sample sizes and associated low statistical power, are a persistent problem in biomedical sciences.
‘Power failure’ and the plant ionomeCalling the problem as ‘power failure’, Button et al. (2013) emphasized that the probability of a research finding to reflect a true effect drops drastically if the statistical power is reduced from 0.80 (considered as appropriate) to low levels, for example <0.30. Since the power of a statistical test drops non-linearly with the effect size, a sample size that is sufficient for detecting a 15% effect, for example a decline in N content, can be inadequate for detecting a 5% effect, for example a decline in a mineral content. Considering that the standard deviation of mineral concentrations in a plant tissue can reach 25% (Duquesnay et al., 2000; Lahner et al., 2003), the 5% effect size standardized as Cohen's d is d = 5/25 = 0.2. A t test applied for d = 0.2 to a sample size of 3–5—a typical size used in eCO2 studies—yields the power of 0.06–0.10 (Faul et al., 2007). (Unfortunately, MetaWin (Rosenberg et al., 2000), a statistical package routinely used in meta-analytic and other CO2 studies in ecology, provides neither a priori nor post-hoc power estimates.) Such a small power not only raises the probability of obtaining a false negative to 90–94% but also increases the likelihood that a statistically significant result does not reflect a true effect (Button et al., 2013).
Answering questions with adequate powerAs of this writing, researchers on four continents have generated data sufficient for answering with an adequate statistical power, the following questions:
Ecology | Epidemiology and global health
Loladze. eLife 2014;3:e02245. DOI: 10.7554/eLife.02245 4 of 29
Research article
1. Does eCO2 shift the plant ionome? If yes, what are the direction and magnitude of shifts for indi-vidual chemical elements? How does the effect of eCO2 on N compares to its effect on minerals?
2. Do FACE studies differ principally from non-FACE studies in their effect on the plant ionome?3. Do the plant ionomes in temperate and subtropical/tropical regions differ in their response to eCO2?4. Do the ionomes of photosynthetic tissues and edible parts differ in their response to eCO2? How
does eCO2 affect the ionomes of various plant groups (woody/herbaceous, wild/crops, C3/C4) and grains of the world's top C3 cereals—wheat, rice, and barley?
ResultsFor brevity, hereafter ‘minerals’ refer to all elements except C, hydrogen (H), oxygen (O), and N. All results are for C3 plants except when noted otherwise.
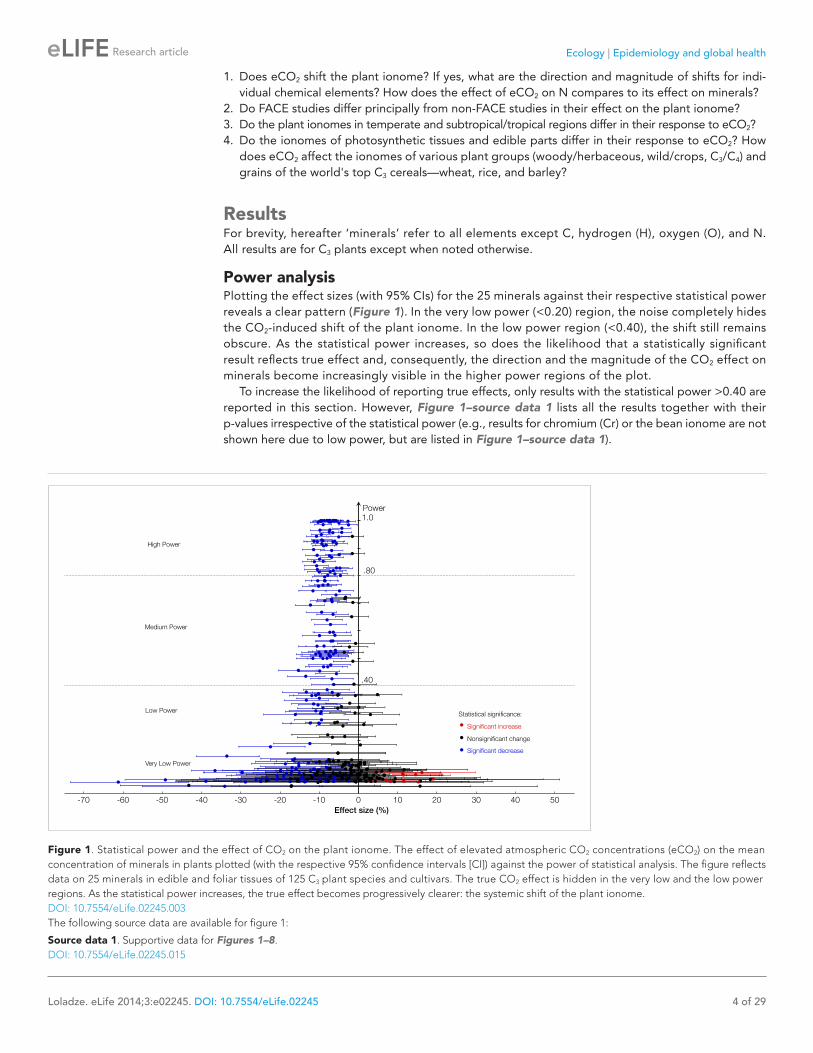
Power analysisPlotting the effect sizes (with 95% CIs) for the 25 minerals against their respective statistical power reveals a clear pattern (Figure 1). In the very low power (<0.20) region, the noise completely hides the CO2-induced shift of the plant ionome. In the low power region (<0.40), the shift still remains obscure. As the statistical power increases, so does the likelihood that a statistically significant result reflects true effect and, consequently, the direction and the magnitude of the CO2 effect on minerals become increasingly visible in the higher power regions of the plot.
To increase the likelihood of reporting true effects, only results with the statistical power >0.40 are reported in this section. However, Figure 1–source data 1 lists all the results together with their p-values irrespective of the statistical power (e.g., results for chromium (Cr) or the bean ionome are not shown here due to low power, but are listed in Figure 1–source data 1).
Figure 1. Statistical power and the effect of CO2 on the plant ionome. The effect of elevated atmospheric CO2 concentrations (eCO2) on the mean concentration of minerals in plants plotted (with the respective 95% confidence intervals [CI]) against the power of statistical analysis. The figure reflects data on 25 minerals in edible and foliar tissues of 125 C3 plant species and cultivars. The true CO2 effect is hidden in the very low and the low power regions. As the statistical power increases, the true effect becomes progressively clearer: the systemic shift of the plant ionome.DOI: 10.7554/eLife.02245.003The following source data are available for figure 1:
Source data 1. Supportive data for Figures 1–8.DOI: 10.7554/eLife.02245.015
Ecology | Epidemiology and global health
Loladze. eLife 2014;3:e02245. DOI: 10.7554/eLife.02245 5 of 29
Research article
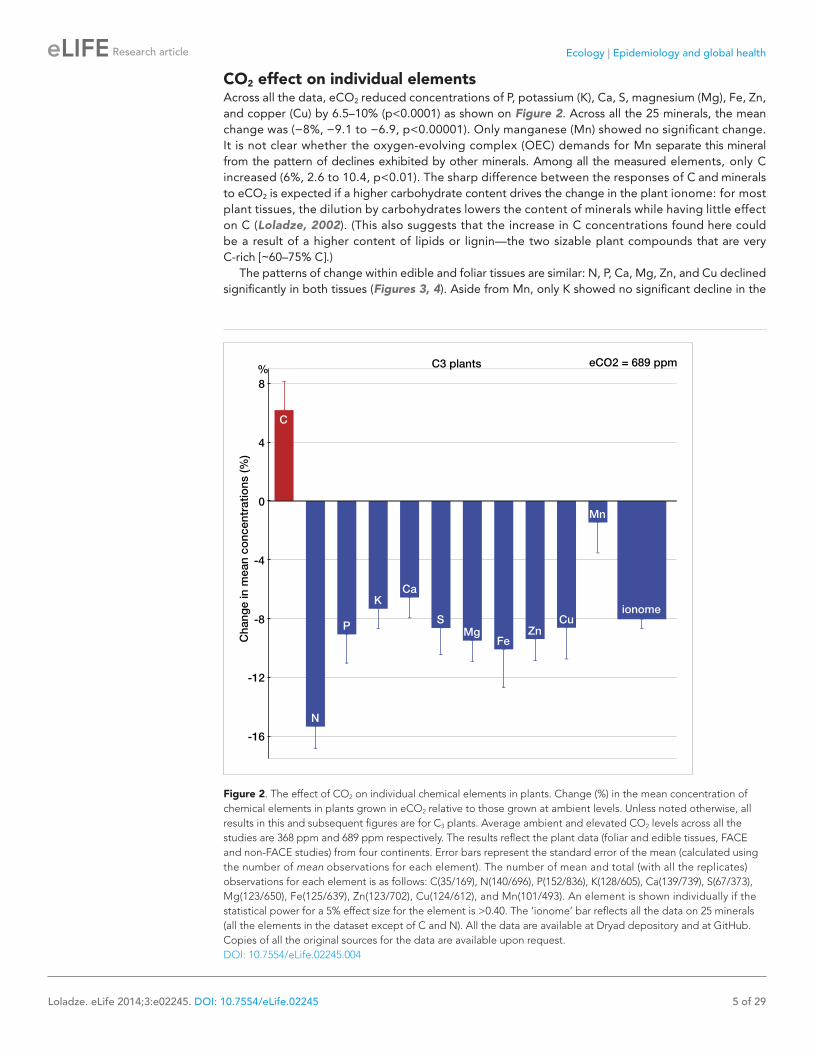
CO2 effect on individual elementsAcross all the data, eCO2 reduced concentrations of P, potassium (K), Ca, S, magnesium (Mg), Fe, Zn, and copper (Cu) by 6.5–10% (p<0.0001) as shown on Figure 2. Across all the 25 minerals, the mean change was (−8%, −9.1 to −6.9, p<0.00001). Only manganese (Mn) showed no significant change. It is not clear whether the oxygen-evolving complex (OEC) demands for Mn separate this mineral from the pattern of declines exhibited by other minerals. Among all the measured elements, only C increased (6%, 2.6 to 10.4, p<0.01). The sharp difference between the responses of C and minerals to eCO2 is expected if a higher carbohydrate content drives the change in the plant ionome: for most plant tissues, the dilution by carbohydrates lowers the content of minerals while having little effect on C (Loladze, 2002). (This also suggests that the increase in C concentrations found here could be a result of a higher content of lipids or lignin—the two sizable plant compounds that are very C-rich [ฏ60–75% C].)
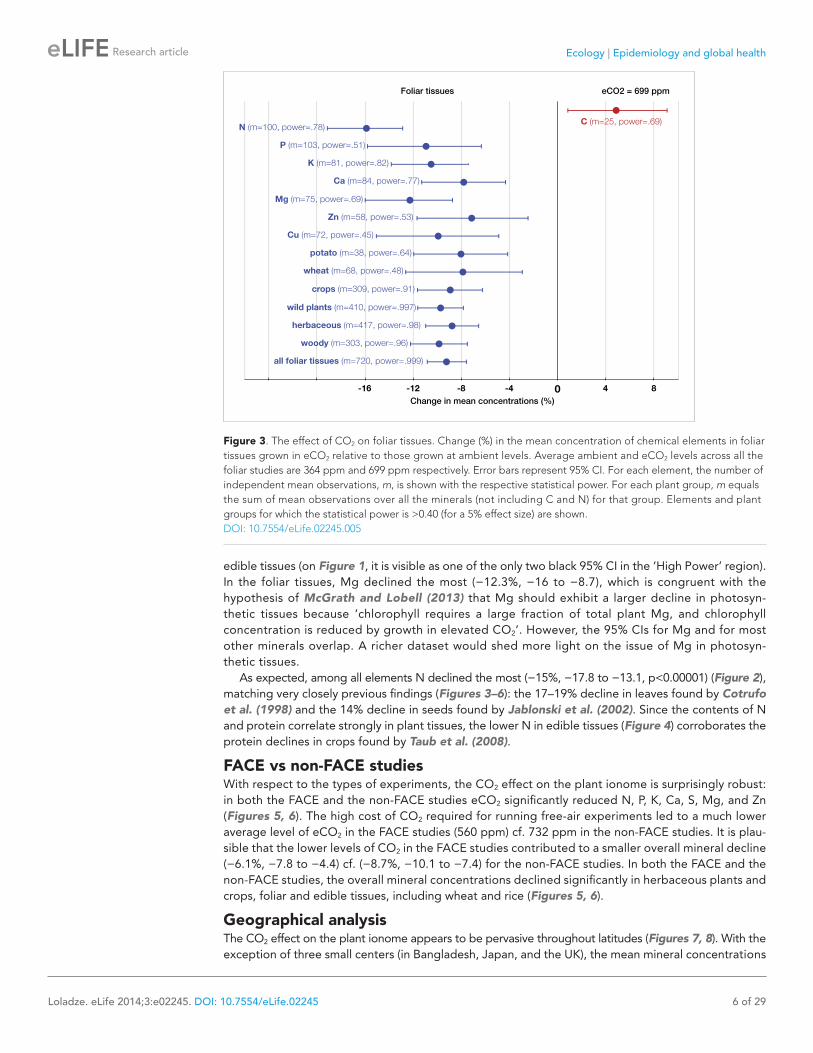
The patterns of change within edible and foliar tissues are similar: N, P, Ca, Mg, Zn, and Cu declined significantly in both tissues (Figures 3, 4). Aside from Mn, only K showed no significant decline in the
Figure 2. The effect of CO2 on individual chemical elements in plants. Change (%) in the mean concentration of chemical elements in plants grown in eCO2 relative to those grown at ambient levels. Unless noted otherwise, all results in this and subsequent figures are for C3 plants. Average ambient and elevated CO2 levels across all the studies are 368 ppm and 689 ppm respectively. The results reflect the plant data (foliar and edible tissues, FACE and non-FACE studies) from four continents. Error bars represent the standard error of the mean (calculated using the number of mean observations for each element). The number of mean and total (with all the replicates) observations for each element is as follows: C(35/169), N(140/696), P(152/836), K(128/605), Ca(139/739), S(67/373), Mg(123/650), Fe(125/639), Zn(123/702), Cu(124/612), and Mn(101/493). An element is shown individually if the statistical power for a 5% effect size for the element is >0.40. The ‘ionome’ bar reflects all the data on 25 minerals (all the elements in the dataset except of C and N). All the data are available at Dryad depository and at GitHub. Copies of all the original sources for the data are available upon request.DOI: 10.7554/eLife.02245.004
Ecology | Epidemiology and global health
Loladze. eLife 2014;3:e02245. DOI: 10.7554/eLife.02245 6 of 29
Research article
edible tissues (on Figure 1, it is visible as one of the only two black 95% CI in the ‘High Power’ region). In the foliar tissues, Mg declined the most (−12.3%, −16 to −8.7), which is congruent with the hypothesis of McGrath and Lobell (2013) that Mg should exhibit a larger decline in photosyn-thetic tissues because ‘chlorophyll requires a large fraction of total plant Mg, and chlorophyll concentration is reduced by growth in elevated CO2’. However, the 95% CIs for Mg and for most other minerals overlap. A richer dataset would shed more light on the issue of Mg in photosyn-thetic tissues.
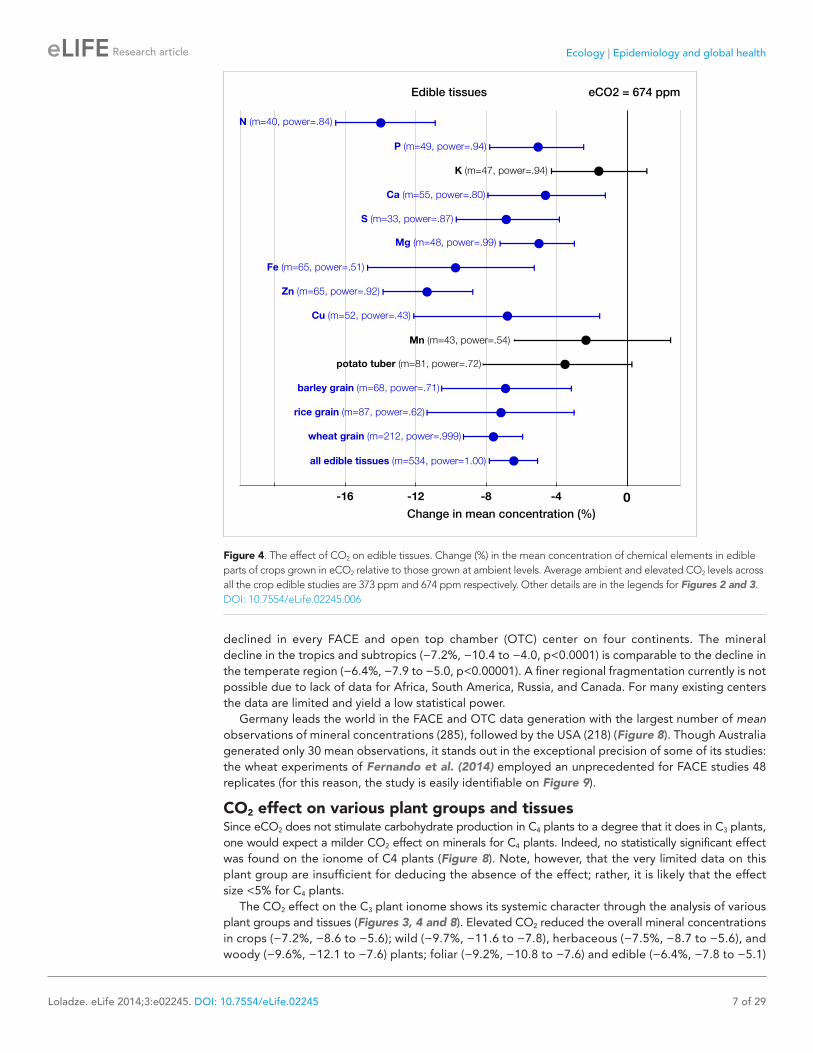
As expected, among all elements N declined the most (−15%, −17.8 to −13.1, p<0.00001) (Figure 2), matching very closely previous findings (Figures 3–6): the 17–19% decline in leaves found by Cotrufo et al. (1998) and the 14% decline in seeds found by Jablonski et al. (2002). Since the contents of N and protein correlate strongly in plant tissues, the lower N in edible tissues (Figure 4) corroborates the protein declines in crops found by Taub et al. (2008).
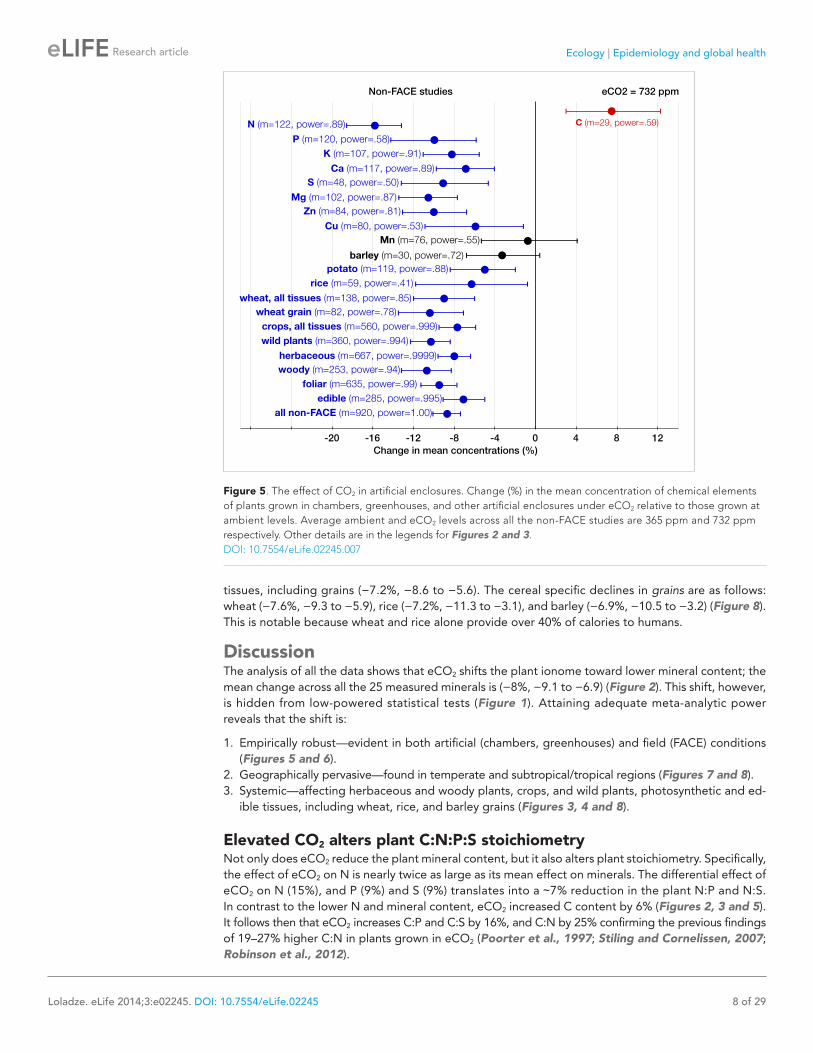
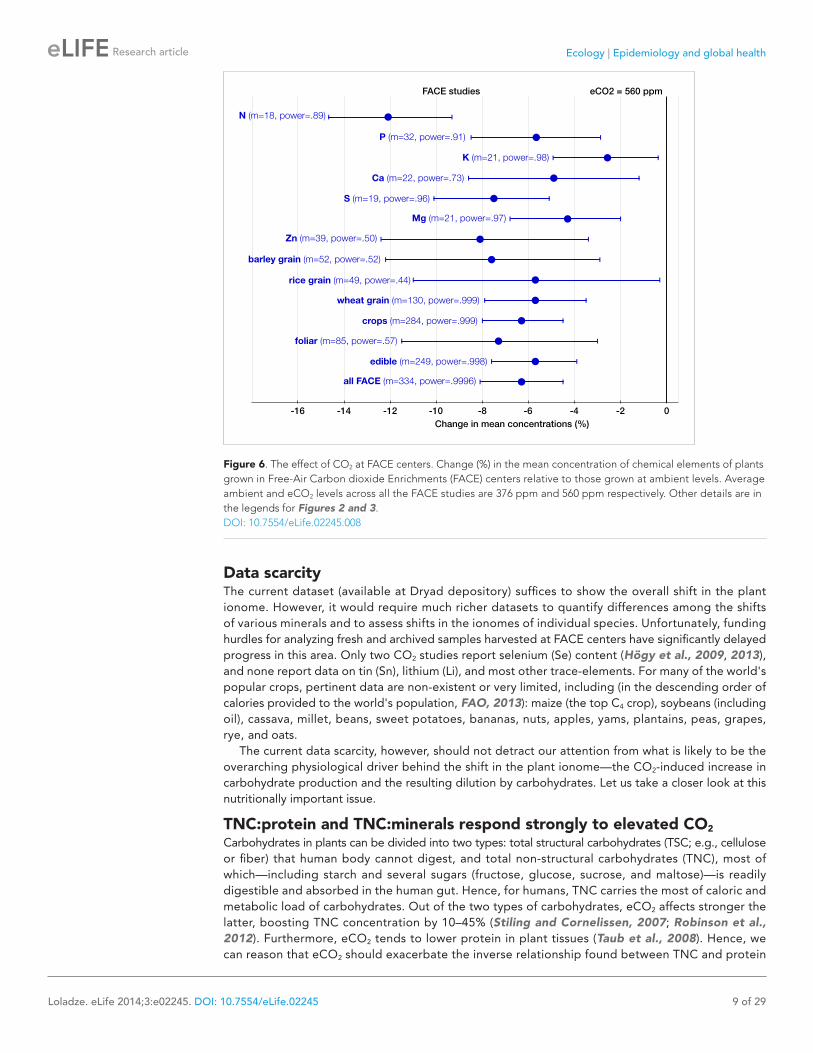
FACE vs non-FACE studiesWith respect to the types of experiments, the CO2 effect on the plant ionome is surprisingly robust: in both the FACE and the non-FACE studies eCO2 significantly reduced N, P, K, Ca, S, Mg, and Zn (Figures 5, 6). The high cost of CO2 required for running free-air experiments led to a much lower average level of eCO2 in the FACE studies (560 ppm) cf. 732 ppm in the non-FACE studies. It is plau-sible that the lower levels of CO2 in the FACE studies contributed to a smaller overall mineral decline (−6.1%, −7.8 to −4.4) cf. (−8.7%, −10.1 to −7.4) for the non-FACE studies. In both the FACE and the non-FACE studies, the overall mineral concentrations declined significantly in herbaceous plants and crops, foliar and edible tissues, including wheat and rice (Figures 5, 6).
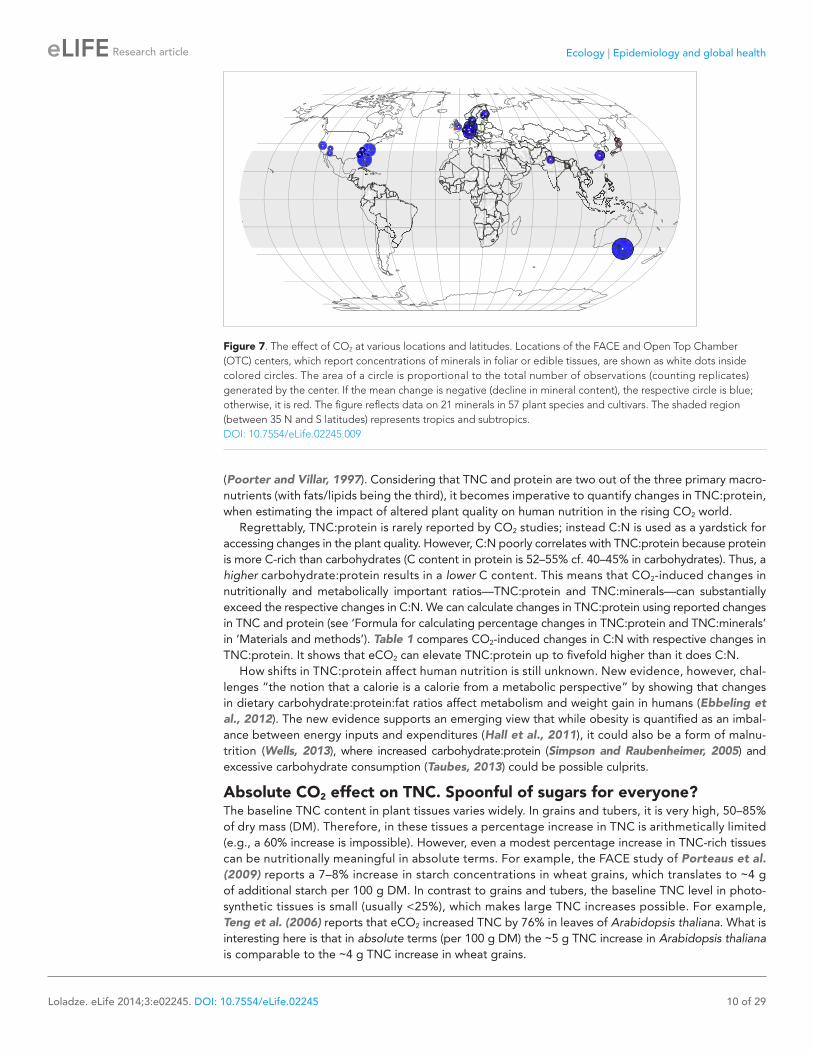
Geographical analysisThe CO2 effect on the plant ionome appears to be pervasive throughout latitudes (Figures 7, 8). With the exception of three small centers (in Bangladesh, Japan, and the UK), the mean mineral concentrations
Figure 3. The effect of CO2 on foliar tissues. Change (%) in the mean concentration of chemical elements in foliar tissues grown in eCO2 relative to those grown at ambient levels. Average ambient and eCO2 levels across all the foliar studies are 364 ppm and 699 ppm respectively. Error bars represent 95% CI. For each element, the number of independent mean observations, m, is shown with the respective statistical power. For each plant group, m equals the sum of mean observations over all the minerals (not including C and N) for that group. Elements and plant groups for which the statistical power is >0.40 (for a 5% effect size) are shown.DOI: 10.7554/eLife.02245.005
Ecology | Epidemiology and global health
Loladze. eLife 2014;3:e02245. DOI: 10.7554/eLife.02245 7 of 29
Research article
declined in every FACE and open top chamber (OTC) center on four continents. The mineral decline in the tropics and subtropics (−7.2%, −10.4 to −4.0, p<0.0001) is comparable to the decline in the temperate region (−6.4%, −7.9 to −5.0, p<0.00001). A finer regional fragmentation currently is not possible due to lack of data for Africa, South America, Russia, and Canada. For many existing centers the data are limited and yield a low statistical power.
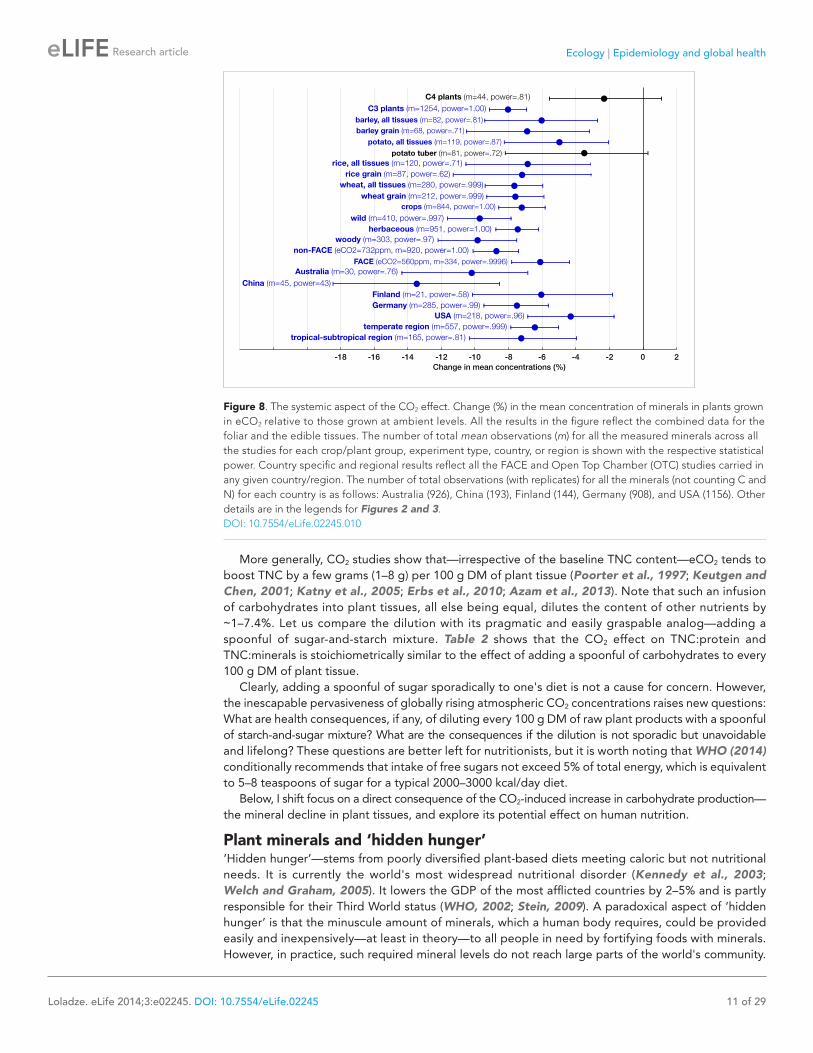
Germany leads the world in the FACE and OTC data generation with the largest number of mean observations of mineral concentrations (285), followed by the USA (218) (Figure 8). Though Australia generated only 30 mean observations, it stands out in the exceptional precision of some of its studies: the wheat experiments of Fernando et al. (2014) employed an unprecedented for FACE studies 48 replicates (for this reason, the study is easily identifiable on Figure 9).
CO2 effect on various plant groups and tissuesSince eCO2 does not stimulate carbohydrate production in C4 plants to a degree that it does in C3 plants, one would expect a milder CO2 effect on minerals for C4 plants. Indeed, no statistically significant effect was found on the ionome of C4 plants (Figure 8). Note, however, that the very limited data on this plant group are insufficient for deducing the absence of the effect; rather, it is likely that the effect size <5% for C4 plants.
The CO2 effect on the C3 plant ionome shows its systemic character through the analysis of various plant groups and tissues (Figures 3, 4 and 8). Elevated CO2 reduced the overall mineral concentrations in crops (−7.2%, −8.6 to −5.6); wild (−9.7%, −11.6 to −7.8), herbaceous (−7.5%, −8.7 to −5.6), and woody (−9.6%, −12.1 to −7.6) plants; foliar (−9.2%, −10.8 to −7.6) and edible (−6.4%, −7.8 to −5.1)
Figure 4. The effect of CO2 on edible tissues. Change (%) in the mean concentration of chemical elements in edible parts of crops grown in eCO2 relative to those grown at ambient levels. Average ambient and elevated CO2 levels across all the crop edible studies are 373 ppm and 674 ppm respectively. Other details are in the legends for Figures 2 and 3.DOI: 10.7554/eLife.02245.006
Ecology | Epidemiology and global health
Loladze. eLife 2014;3:e02245. DOI: 10.7554/eLife.02245 8 of 29
Research article
tissues, including grains (−7.2%, −8.6 to −5.6). The cereal specific declines in grains are as follows: wheat (−7.6%, −9.3 to −5.9), rice (−7.2%, −11.3 to −3.1), and barley (−6.9%, −10.5 to −3.2) (Figure 8). This is notable because wheat and rice alone provide over 40% of calories to humans.
DiscussionThe analysis of all the data shows that eCO2 shifts the plant ionome toward lower mineral content; the mean change across all the 25 measured minerals is (−8%, −9.1 to −6.9) (Figure 2). This shift, however, is hidden from low-powered statistical tests (Figure 1). Attaining adequate meta-analytic power reveals that the shift is: 1. Empirically robust—evident in both artificial (chambers, greenhouses) and field (FACE) conditions
(Figures 5 and 6).2. Geographically pervasive—found in temperate and subtropical/tropical regions (Figures 7 and 8).3. Systemic—affecting herbaceous and woody plants, crops, and wild plants, photosynthetic and ed-
ible tissues, including wheat, rice, and barley grains (Figures 3, 4 and 8).
Elevated CO2 alters plant C:N:P:S stoichiometryNot only does eCO2 reduce the plant mineral content, but it also alters plant stoichiometry. Specifically, the effect of eCO2 on N is nearly twice as large as its mean effect on minerals. The differential effect of eCO2 on N (15%), and P (9%) and S (9%) translates into a ฏ7% reduction in the plant N:P and N:S. In contrast to the lower N and mineral content, eCO2 increased C content by 6% (Figures 2, 3 and 5). It follows then that eCO2 increases C:P and C:S by 16%, and C:N by 25% confirming the previous findings of 19–27% higher C:N in plants grown in eCO2 (Poorter et al., 1997; Stiling and Cornelissen, 2007; Robinson et al., 2012).
Figure 5. The effect of CO2 in artificial enclosures. Change (%) in the mean concentration of chemical elements of plants grown in chambers, greenhouses, and other artificial enclosures under eCO2 relative to those grown at ambient levels. Average ambient and eCO2 levels across all the non-FACE studies are 365 ppm and 732 ppm respectively. Other details are in the legends for Figures 2 and 3.DOI: 10.7554/eLife.02245.007
Ecology | Epidemiology and global health
Loladze. eLife 2014;3:e02245. DOI: 10.7554/eLife.02245 9 of 29
Research article
Data scarcityThe current dataset (available at Dryad depository) suffices to show the overall shift in the plant ionome. However, it would require much richer datasets to quantify differences among the shifts of various minerals and to assess shifts in the ionomes of individual species. Unfortunately, funding hurdles for analyzing fresh and archived samples harvested at FACE centers have significantly delayed progress in this area. Only two CO2 studies report selenium (Se) content (Högy et al., 2009, 2013), and none report data on tin (Sn), lithium (Li), and most other trace-elements. For many of the world's popular crops, pertinent data are non-existent or very limited, including (in the descending order of calories provided to the world's population, FAO, 2013): maize (the top C4 crop), soybeans (including oil), cassava, millet, beans, sweet potatoes, bananas, nuts, apples, yams, plantains, peas, grapes, rye, and oats.
The current data scarcity, however, should not detract our attention from what is likely to be the overarching physiological driver behind the shift in the plant ionome—the CO2-induced increase in carbohydrate production and the resulting dilution by carbohydrates. Let us take a closer look at this nutritionally important issue.
TNC:protein and TNC:minerals respond strongly to elevated CO2
Carbohydrates in plants can be divided into two types: total structural carbohydrates (TSC; e.g., cellulose or fiber) that human body cannot digest, and total non-structural carbohydrates (TNC), most of which—including starch and several sugars (fructose, glucose, sucrose, and maltose)—is readily digestible and absorbed in the human gut. Hence, for humans, TNC carries the most of caloric and metabolic load of carbohydrates. Out of the two types of carbohydrates, eCO2 affects stronger the latter, boosting TNC concentration by 10–45% (Stiling and Cornelissen, 2007; Robinson et al., 2012). Furthermore, eCO2 tends to lower protein in plant tissues (Taub et al., 2008). Hence, we can reason that eCO2 should exacerbate the inverse relationship found between TNC and protein
Figure 6. The effect of CO2 at FACE centers. Change (%) in the mean concentration of chemical elements of plants grown in Free-Air Carbon dioxide Enrichments (FACE) centers relative to those grown at ambient levels. Average ambient and eCO2 levels across all the FACE studies are 376 ppm and 560 ppm respectively. Other details are in the legends for Figures 2 and 3.DOI: 10.7554/eLife.02245.008
Ecology | Epidemiology and global health
Loladze. eLife 2014;3:e02245. DOI: 10.7554/eLife.02245 10 of 29
Research article
(Poorter and Villar, 1997). Considering that TNC and protein are two out of the three primary macro-nutrients (with fats/lipids being the third), it becomes imperative to quantify changes in TNC:protein, when estimating the impact of altered plant quality on human nutrition in the rising CO2 world.
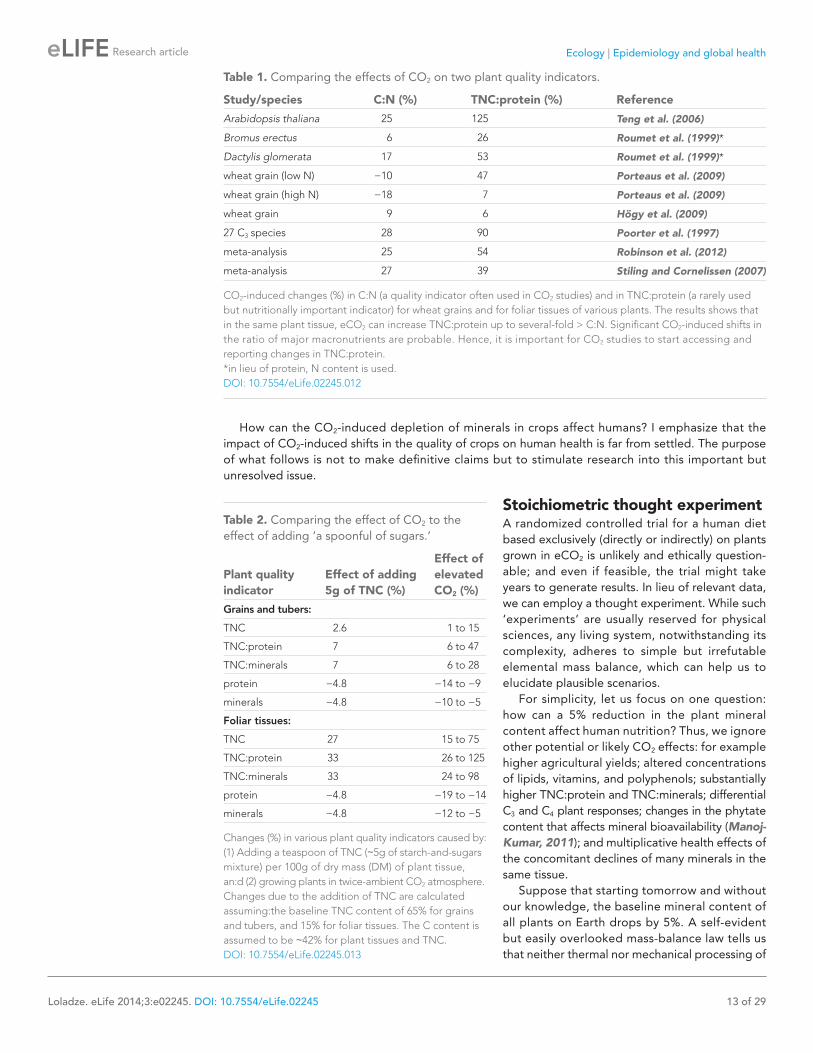
Regrettably, TNC:protein is rarely reported by CO2 studies; instead C:N is used as a yardstick for accessing changes in the plant quality. However, C:N poorly correlates with TNC:protein because protein is more C-rich than carbohydrates (C content in protein is 52–55% cf. 40–45% in carbohydrates). Thus, a higher carbohydrate:protein results in a lower C content. This means that CO2-induced changes in nutritionally and metabolically important ratios—TNC:protein and TNC:minerals—can substantially exceed the respective changes in C:N. We can calculate changes in TNC:protein using reported changes in TNC and protein (see ‘Formula for calculating percentage changes in TNC:protein and TNC:minerals’ in ‘Materials and methods’). Table 1 compares CO2-induced changes in C:N with respective changes in TNC:protein. It shows that eCO2 can elevate TNC:protein up to fivefold higher than it does C:N.
How shifts in TNC:protein affect human nutrition is still unknown. New evidence, however, chal-lenges “the notion that a calorie is a calorie from a metabolic perspective” by showing that changes in dietary carbohydrate:protein:fat ratios affect metabolism and weight gain in humans (Ebbeling et al., 2012). The new evidence supports an emerging view that while obesity is quantified as an imbal-ance between energy inputs and expenditures (Hall et al., 2011), it could also be a form of malnu-trition (Wells, 2013), where increased carbohydrate:protein (Simpson and Raubenheimer, 2005) and excessive carbohydrate consumption (Taubes, 2013) could be possible culprits.
Absolute CO2 effect on TNC. Spoonful of sugars for everyone?The baseline TNC content in plant tissues varies widely. In grains and tubers, it is very high, 50–85% of dry mass (DM). Therefore, in these tissues a percentage increase in TNC is arithmetically limited (e.g., a 60% increase is impossible). However, even a modest percentage increase in TNC-rich tissues can be nutritionally meaningful in absolute terms. For example, the FACE study of Porteaus et al. (2009) reports a 7–8% increase in starch concentrations in wheat grains, which translates to ฏ4 g of additional starch per 100 g DM. In contrast to grains and tubers, the baseline TNC level in photo-synthetic tissues is small (usually <25%), which makes large TNC increases possible. For example, Teng et al. (2006) reports that eCO2 increased TNC by 76% in leaves of Arabidopsis thaliana. What is interesting here is that in absolute terms (per 100 g DM) the ฏ5 g TNC increase in Arabidopsis thaliana is comparable to the ฏ4 g TNC increase in wheat grains.
Figure 7. The effect of CO2 at various locations and latitudes. Locations of the FACE and Open Top Chamber (OTC) centers, which report concentrations of minerals in foliar or edible tissues, are shown as white dots inside colored circles. The area of a circle is proportional to the total number of observations (counting replicates) generated by the center. If the mean change is negative (decline in mineral content), the respective circle is blue; otherwise, it is red. The figure reflects data on 21 minerals in 57 plant species and cultivars. The shaded region (between 35 N and S latitudes) represents tropics and subtropics.DOI: 10.7554/eLife.02245.009
Ecology | Epidemiology and global health
Loladze. eLife 2014;3:e02245. DOI: 10.7554/eLife.02245 11 of 29
Research article
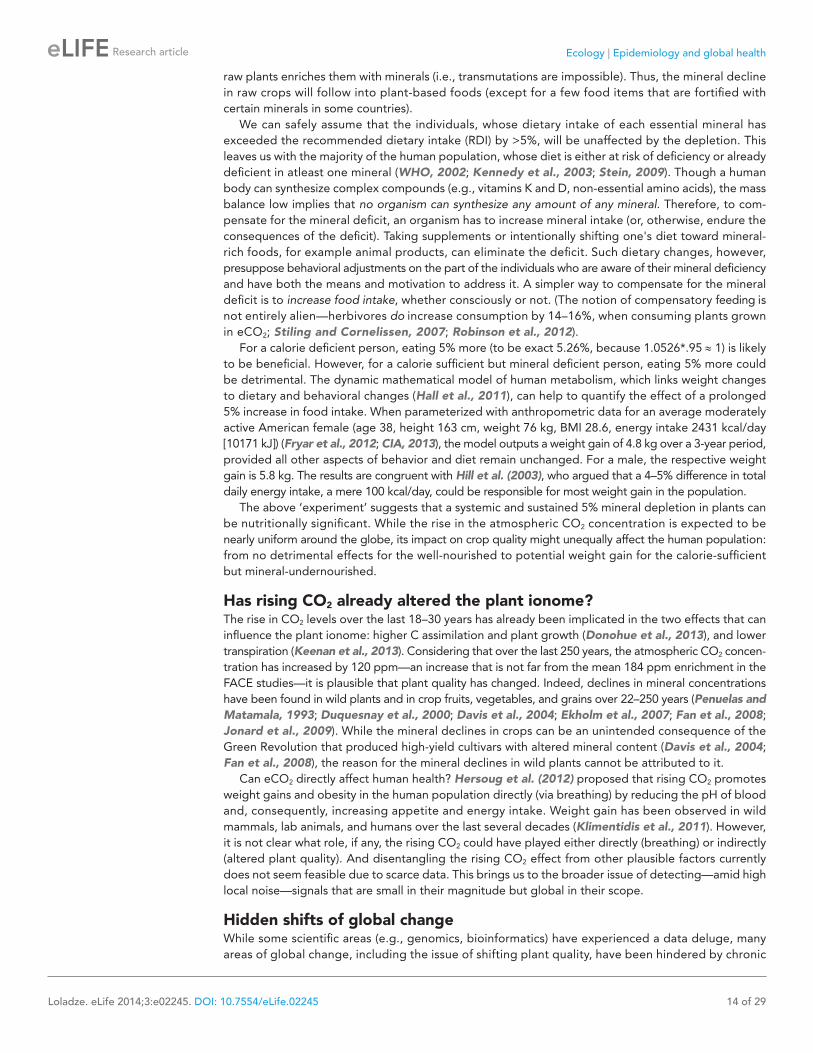
More generally, CO2 studies show that—irrespective of the baseline TNC content—eCO2 tends to boost TNC by a few grams (1–8 g) per 100 g DM of plant tissue (Poorter et al., 1997; Keutgen and Chen, 2001; Katny et al., 2005; Erbs et al., 2010; Azam et al., 2013). Note that such an infusion of carbohydrates into plant tissues, all else being equal, dilutes the content of other nutrients by ฏ1–7.4%. Let us compare the dilution with its pragmatic and easily graspable analog—adding a spoonful of sugar-and-starch mixture. Table 2 shows that the CO2 effect on TNC:protein and TNC:minerals is stoichiometrically similar to the effect of adding a spoonful of carbohydrates to every 100 g DM of plant tissue.
Clearly, adding a spoonful of sugar sporadically to one's diet is not a cause for concern. However, the inescapable pervasiveness of globally rising atmospheric CO2 concentrations raises new questions: What are health consequences, if any, of diluting every 100 g DM of raw plant products with a spoonful of starch-and-sugar mixture? What are the consequences if the dilution is not sporadic but unavoidable and lifelong? These questions are better left for nutritionists, but it is worth noting that WHO (2014) conditionally recommends that intake of free sugars not exceed 5% of total energy, which is equivalent to 5–8 teaspoons of sugar for a typical 2000–3000 kcal/day diet.
Below, I shift focus on a direct consequence of the CO2-induced increase in carbohydrate production—the mineral decline in plant tissues, and explore its potential effect on human nutrition.
Plant minerals and ‘hidden hunger’‘Hidden hunger’—stems from poorly diversified plant-based diets meeting caloric but not nutritional needs. It is currently the world's most widespread nutritional disorder (Kennedy et al., 2003; Welch and Graham, 2005). It lowers the GDP of the most afflicted countries by 2–5% and is partly responsible for their Third World status (WHO, 2002; Stein, 2009). A paradoxical aspect of ‘hidden hunger’ is that the minuscule amount of minerals, which a human body requires, could be provided easily and inexpensively—at least in theory—to all people in need by fortifying foods with minerals. However, in practice, such required mineral levels do not reach large parts of the world's community.
Figure 8. The systemic aspect of the CO2 effect. Change (%) in the mean concentration of minerals in plants grown in eCO2 relative to those grown at ambient levels. All the results in the figure reflect the combined data for the foliar and the edible tissues. The number of total mean observations (m) for all the measured minerals across all the studies for each crop/plant group, experiment type, country, or region is shown with the respective statistical power. Country specific and regional results reflect all the FACE and Open Top Chamber (OTC) studies carried in any given country/region. The number of total observations (with replicates) for all the minerals (not counting C and N) for each country is as follows: Australia (926), China (193), Finland (144), Germany (908), and USA (1156). Other details are in the legends for Figures 2 and 3.DOI: 10.7554/eLife.02245.010
Ecology | Epidemiology and global health
Loladze. eLife 2014;3:e02245. DOI: 10.7554/eLife.02245 12 of 29
Research article
The case of iodine is illustrative: although iodized table salt nearly wiped out iodine deficiency in the industrialized world, a billion people still have no regular access to it, making iodine deficiency the leading cause of preventable brain damage, cretinism, and lower IQ in children (Welch and Graham, 1999; WHO, 2002). Hence, the reality of logistic, economic, and cultural hurdles for fortification leaves the natural and bioavailable mineral content in food, and in plants in particular, to be the major, and sometimes the only, consistent mineral supply for a large part of mankind (White and Broadley, 2009; Bouis and Welch, 2010). This supply, unfortunately, is suboptimal for human nutrition with some of the consequences outlined below.
Every third person in the world is at risk of inadequate Zn intake with its deficiency substantially contributing to stunting, compromised immunity, and child mortality (Brown et al., 2001; UNICEF, 2009). Iron deficiency affects at least 2 billion people and is the leading cause of anemia that increases maternal mortality (WHO, 2002; UNICEF, 2009). Millions are Ca, Mg, and Se deficient (Stein, 2009; White and Broadley, 2009), including some population segments of developed countries (Rayman, 2007; Khokhar et al., 2012). Ironically, a person can be obese and mineral undernourished—the so called ‘hunger-obesity paradox’ (Scheier, 2005), for example the many homeless in the US who rely on “cheap and energy-dense but low-nutrient” foods (Koh et al., 2012). With every third adult in the world being overweight or obese (Keats and Wiggins, 2014), WHO ranks both mineral undernutrition and obesity among the top 20 global health risks (WHO, 2002; Hill et al., 2003; Stein, 2009). While the role of mineral deficiency in obesity is still unclear, intriguing links have been found between the lower blood serum concentrations of Ca, Cr, Fe, Mg, Mn, Se, Zn, and increased body mass index (BMI), with most of the findings appearing in the last decade (Singh et al., 1998; Martin et al., 2006; Arnaud et al., 2007; García et al., 2009; Payahoo et al., 2013; Yerlikaya et al., 2013).
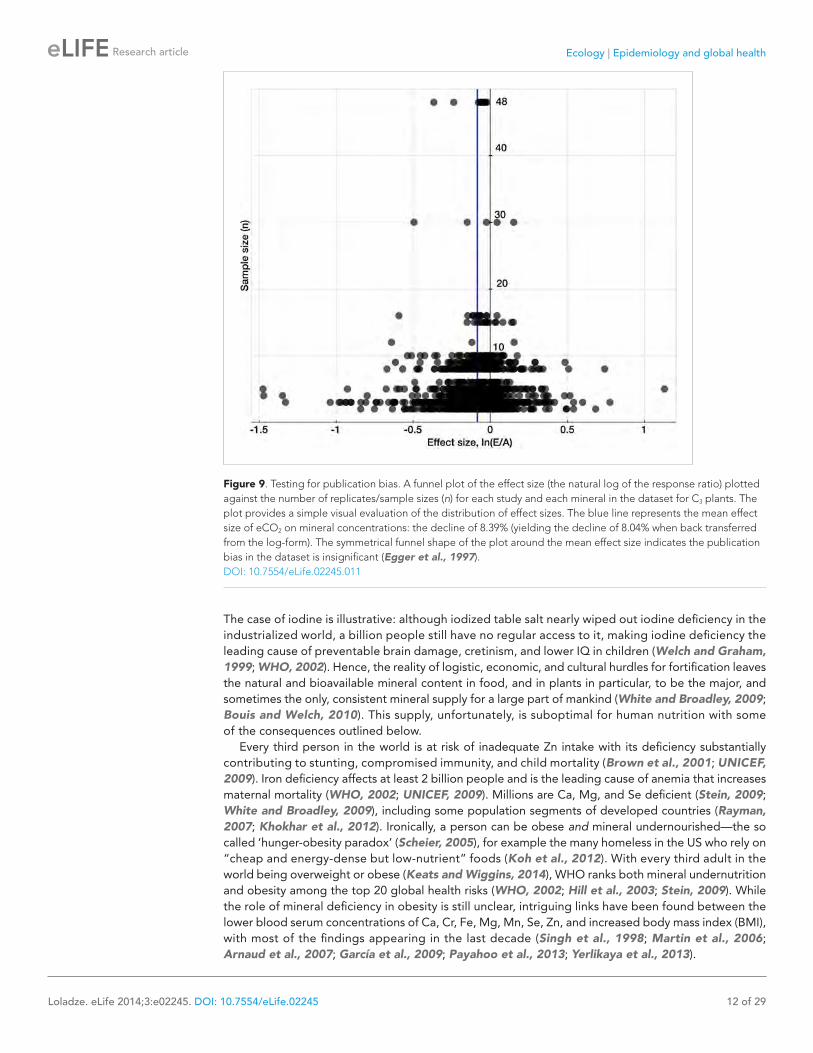
Figure 9. Testing for publication bias. A funnel plot of the effect size (the natural log of the response ratio) plotted against the number of replicates/sample sizes (n) for each study and each mineral in the dataset for C3 plants. The plot provides a simple visual evaluation of the distribution of effect sizes. The blue line represents the mean effect size of eCO2 on mineral concentrations: the decline of 8.39% (yielding the decline of 8.04% when back transferred from the log-form). The symmetrical funnel shape of the plot around the mean effect size indicates the publication bias in the dataset is insignificant (Egger et al., 1997).DOI: 10.7554/eLife.02245.011
Ecology | Epidemiology and global health
Loladze. eLife 2014;3:e02245. DOI: 10.7554/eLife.02245 13 of 29
Research article
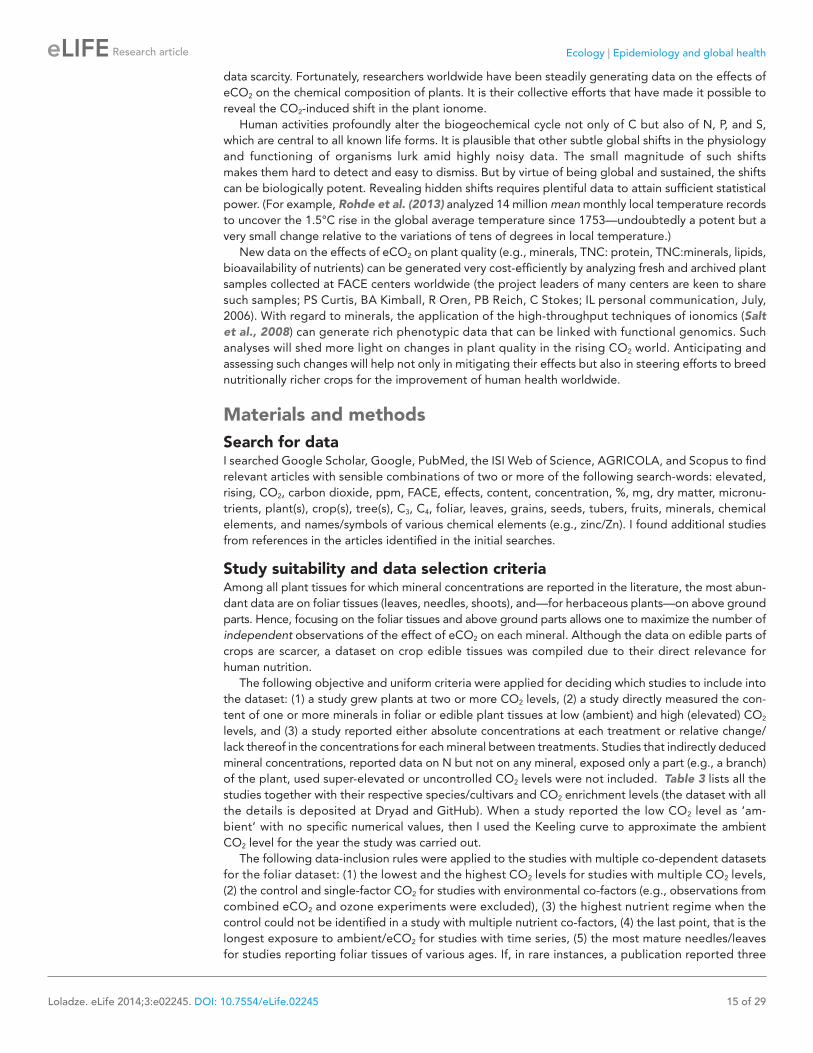
How can the CO2-induced depletion of minerals in crops affect humans? I emphasize that the impact of CO2-induced shifts in the quality of crops on human health is far from settled. The purpose of what follows is not to make definitive claims but to stimulate research into this important but unresolved issue.
Stoichiometric thought experimentA randomized controlled trial for a human diet based exclusively (directly or indirectly) on plants grown in eCO2 is unlikely and ethically question-able; and even if feasible, the trial might take years to generate results. In lieu of relevant data, we can employ a thought experiment. While such ‘experiments’ are usually reserved for physical sciences, any living system, notwithstanding its complexity, adheres to simple but irrefutable elemental mass balance, which can help us to elucidate plausible scenarios.
For simplicity, let us focus on one question: how can a 5% reduction in the plant mineral content affect human nutrition? Thus, we ignore other potential or likely CO2 effects: for example higher agricultural yields; altered concentrations of lipids, vitamins, and polyphenols; substantially higher TNC:protein and TNC:minerals; differential C3 and C4 plant responses; changes in the phytate content that affects mineral bioavailability (Manoj-Kumar, 2011); and multiplicative health effects of the concomitant declines of many minerals in the same tissue.
Suppose that starting tomorrow and without our knowledge, the baseline mineral content of all plants on Earth drops by 5%. A self-evident but easily overlooked mass-balance law tells us that neither thermal nor mechanical processing of
Table 1. Comparing the effects of CO2 on two plant quality indicators.
Study/species C:N (%) TNC:protein (%) ReferenceArabidopsis thaliana 25 125 Teng et al. (2006)
Bromus erectus 6 26 Roumet et al. (1999)*
Dactylis glomerata 17 53 Roumet et al. (1999)*
wheat grain (low N) −10 47 Porteaus et al. (2009)
wheat grain (high N) −18 7 Porteaus et al. (2009)
wheat grain 9 6 Högy et al. (2009)
27 C3 species 28 90 Poorter et al. (1997)
meta-analysis 25 54 Robinson et al. (2012)
meta-analysis 27 39 Stiling and Cornelissen (2007)
CO2-induced changes (%) in C:N (a quality indicator often used in CO2 studies) and in TNC:protein (a rarely used but nutritionally important indicator) for wheat grains and for foliar tissues of various plants. The results shows that in the same plant tissue, eCO2 can increase TNC:protein up to several-fold > C:N. Significant CO2-induced shifts in the ratio of major macronutrients are probable. Hence, it is important for CO2 studies to start accessing and reporting changes in TNC:protein.*in lieu of protein, N content is used.DOI: 10.7554/eLife.02245.012
Table 2. Comparing the effect of CO2 to the effect of adding ‘a spoonful of sugars.’
Plant quality indicator
Effect of adding 5g of TNC (%)
Effect of elevated CO2 (%)
Grains and tubers:
TNC 2.6 1 to 15
TNC:protein 7 6 to 47
TNC:minerals 7 6 to 28
protein −4.8 −14 to −9
minerals −4.8 −10 to −5
Foliar tissues:
TNC 27 15 to 75
TNC:protein 33 26 to 125
TNC:minerals 33 24 to 98
protein −4.8 −19 to −14
minerals −4.8 −12 to −5
Changes (%) in various plant quality indicators caused by: (1) Adding a teaspoon of TNC (ฏ5g of starch-and-sugars mixture) per 100g of dry mass (DM) of plant tissue, an:d (2) growing plants in twice-ambient CO2 atmosphere. Changes due to the addition of TNC are calculated assuming:the baseline TNC content of 65% for grains and tubers, and 15% for foliar tissues. The C content is assumed to be ฏ42% for plant tissues and TNC.DOI: 10.7554/eLife.02245.013
Ecology | Epidemiology and global health
Loladze. eLife 2014;3:e02245. DOI: 10.7554/eLife.02245 14 of 29
Research article
raw plants enriches them with minerals (i.e., transmutations are impossible). Thus, the mineral decline in raw crops will follow into plant-based foods (except for a few food items that are fortified with certain minerals in some countries).
We can safely assume that the individuals, whose dietary intake of each essential mineral has exceeded the recommended dietary intake (RDI) by >5%, will be unaffected by the depletion. This leaves us with the majority of the human population, whose diet is either at risk of deficiency or already deficient in atleast one mineral (WHO, 2002; Kennedy et al., 2003; Stein, 2009). Though a human body can synthesize complex compounds (e.g., vitamins K and D, non-essential amino acids), the mass balance low implies that no organism can synthesize any amount of any mineral. Therefore, to com-pensate for the mineral deficit, an organism has to increase mineral intake (or, otherwise, endure the consequences of the deficit). Taking supplements or intentionally shifting one's diet toward mineral-rich foods, for example animal products, can eliminate the deficit. Such dietary changes, however, presuppose behavioral adjustments on the part of the individuals who are aware of their mineral deficiency and have both the means and motivation to address it. A simpler way to compensate for the mineral deficit is to increase food intake, whether consciously or not. (The notion of compensatory feeding is not entirely alien—herbivores do increase consumption by 14–16%, when consuming plants grown in eCO2; Stiling and Cornelissen, 2007; Robinson et al., 2012).
For a calorie deficient person, eating 5% more (to be exact 5.26%, because 1.0526*.95 | 1) is likely to be beneficial. However, for a calorie sufficient but mineral deficient person, eating 5% more could be detrimental. The dynamic mathematical model of human metabolism, which links weight changes to dietary and behavioral changes (Hall et al., 2011), can help to quantify the effect of a prolonged 5% increase in food intake. When parameterized with anthropometric data for an average moderately active American female (age 38, height 163 cm, weight 76 kg, BMI 28.6, energy intake 2431 kcal/day [10171 kJ]) (Fryar et al., 2012; CIA, 2013), the model outputs a weight gain of 4.8 kg over a 3-year period, provided all other aspects of behavior and diet remain unchanged. For a male, the respective weight gain is 5.8 kg. The results are congruent with Hill et al. (2003), who argued that a 4–5% difference in total daily energy intake, a mere 100 kcal/day, could be responsible for most weight gain in the population.
The above ‘experiment’ suggests that a systemic and sustained 5% mineral depletion in plants can be nutritionally significant. While the rise in the atmospheric CO2 concentration is expected to be nearly uniform around the globe, its impact on crop quality might unequally affect the human population: from no detrimental effects for the well-nourished to potential weight gain for the calorie-sufficient but mineral-undernourished.
Has rising CO2 already altered the plant ionome?The rise in CO2 levels over the last 18–30 years has already been implicated in the two effects that can influence the plant ionome: higher C assimilation and plant growth (Donohue et al., 2013), and lower transpiration (Keenan et al., 2013). Considering that over the last 250 years, the atmospheric CO2 concen-tration has increased by 120 ppm—an increase that is not far from the mean 184 ppm enrichment in the FACE studies—it is plausible that plant quality has changed. Indeed, declines in mineral concentrations have been found in wild plants and in crop fruits, vegetables, and grains over 22–250 years (Penuelas and Matamala, 1993; Duquesnay et al., 2000; Davis et al., 2004; Ekholm et al., 2007; Fan et al., 2008; Jonard et al., 2009). While the mineral declines in crops can be an unintended consequence of the Green Revolution that produced high-yield cultivars with altered mineral content (Davis et al., 2004; Fan et al., 2008), the reason for the mineral declines in wild plants cannot be attributed to it.
Can eCO2 directly affect human health? Hersoug et al. (2012) proposed that rising CO2 promotes weight gains and obesity in the human population directly (via breathing) by reducing the pH of blood and, consequently, increasing appetite and energy intake. Weight gain has been observed in wild mammals, lab animals, and humans over the last several decades (Klimentidis et al., 2011). However, it is not clear what role, if any, the rising CO2 could have played either directly (breathing) or indirectly (altered plant quality). And disentangling the rising CO2 effect from other plausible factors currently does not seem feasible due to scarce data. This brings us to the broader issue of detecting—amid high local noise—signals that are small in their magnitude but global in their scope.
Hidden shifts of global changeWhile some scientific areas (e.g., genomics, bioinformatics) have experienced a data deluge, many areas of global change, including the issue of shifting plant quality, have been hindered by chronic
Ecology | Epidemiology and global health
Loladze. eLife 2014;3:e02245. DOI: 10.7554/eLife.02245 15 of 29
Research article
data scarcity. Fortunately, researchers worldwide have been steadily generating data on the effects of eCO2 on the chemical composition of plants. It is their collective efforts that have made it possible to reveal the CO2-induced shift in the plant ionome.
Human activities profoundly alter the biogeochemical cycle not only of C but also of N, P, and S, which are central to all known life forms. It is plausible that other subtle global shifts in the physiology and functioning of organisms lurk amid highly noisy data. The small magnitude of such shifts makes them hard to detect and easy to dismiss. But by virtue of being global and sustained, the shifts can be biologically potent. Revealing hidden shifts requires plentiful data to attain sufficient statistical power. (For example, Rohde et al. (2013) analyzed 14 million mean monthly local temperature records to uncover the 1.5°C rise in the global average temperature since 1753—undoubtedly a potent but a very small change relative to the variations of tens of degrees in local temperature.)
New data on the effects of eCO2 on plant quality (e.g., minerals, TNC: protein, TNC:minerals, lipids, bioavailability of nutrients) can be generated very cost-efficiently by analyzing fresh and archived plant samples collected at FACE centers worldwide (the project leaders of many centers are keen to share such samples; PS Curtis, BA Kimball, R Oren, PB Reich, C Stokes; IL personal communication, July, 2006). With regard to minerals, the application of the high-throughput techniques of ionomics (Salt et al., 2008) can generate rich phenotypic data that can be linked with functional genomics. Such analyses will shed more light on changes in plant quality in the rising CO2 world. Anticipating and assessing such changes will help not only in mitigating their effects but also in steering efforts to breed nutritionally richer crops for the improvement of human health worldwide.
Materials and methodsSearch for dataI searched Google Scholar, Google, PubMed, the ISI Web of Science, AGRICOLA, and Scopus to find relevant articles with sensible combinations of two or more of the following search-words: elevated, rising, CO2, carbon dioxide, ppm, FACE, effects, content, concentration, %, mg, dry matter, micronu-trients, plant(s), crop(s), tree(s), C3, C4, foliar, leaves, grains, seeds, tubers, fruits, minerals, chemical elements, and names/symbols of various chemical elements (e.g., zinc/Zn). I found additional studies from references in the articles identified in the initial searches.
Study suitability and data selection criteriaAmong all plant tissues for which mineral concentrations are reported in the literature, the most abun-dant data are on foliar tissues (leaves, needles, shoots), and—for herbaceous plants—on above ground parts. Hence, focusing on the foliar tissues and above ground parts allows one to maximize the number of independent observations of the effect of eCO2 on each mineral. Although the data on edible parts of crops are scarcer, a dataset on crop edible tissues was compiled due to their direct relevance for human nutrition.
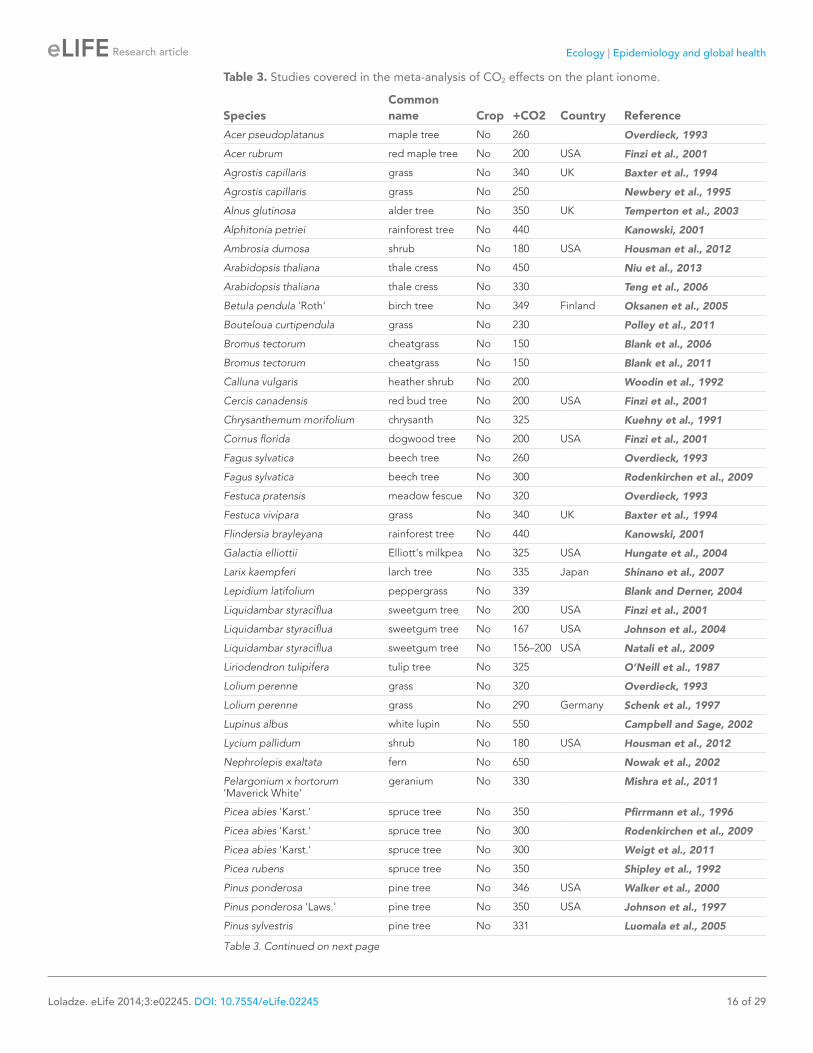
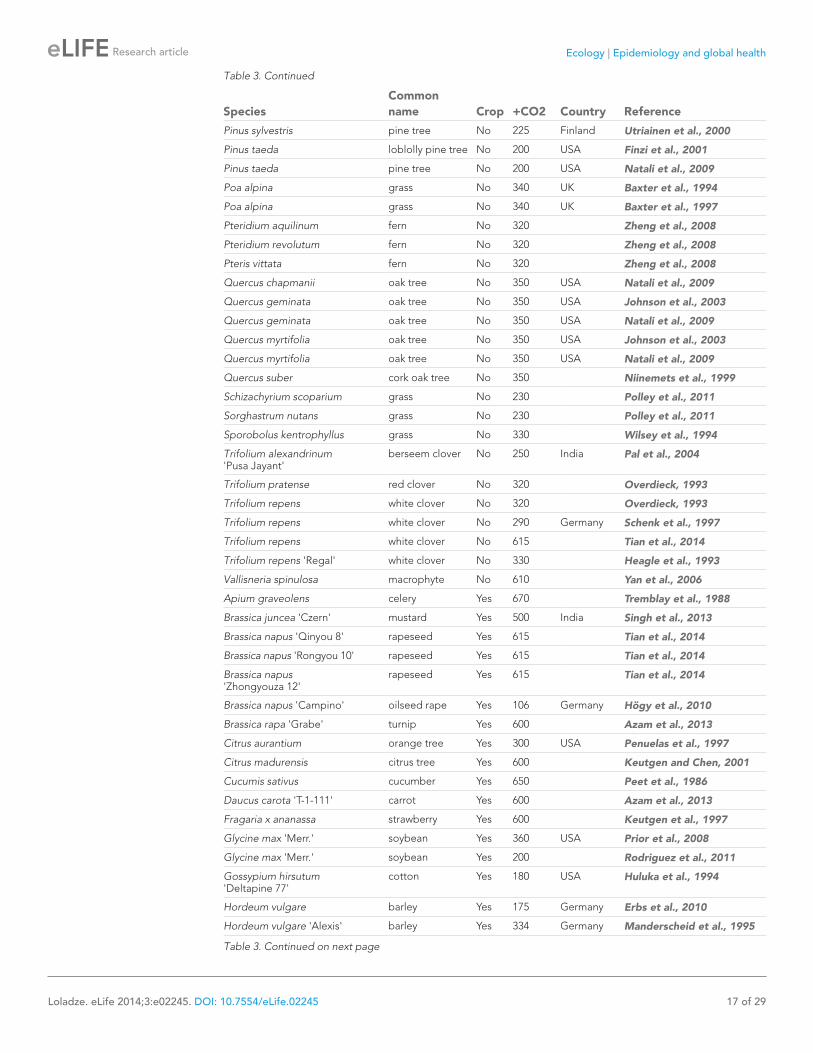
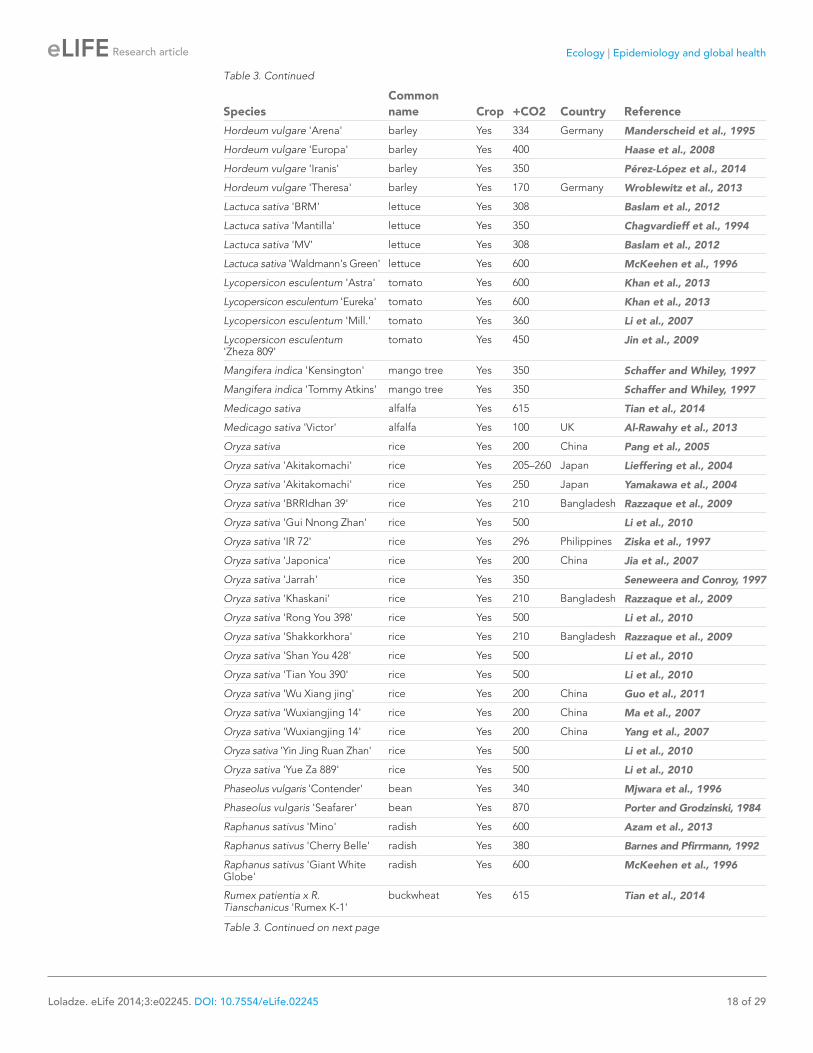
The following objective and uniform criteria were applied for deciding which studies to include into the dataset: (1) a study grew plants at two or more CO2 levels, (2) a study directly measured the con-tent of one or more minerals in foliar or edible plant tissues at low (ambient) and high (elevated) CO2 levels, and (3) a study reported either absolute concentrations at each treatment or relative change/lack thereof in the concentrations for each mineral between treatments. Studies that indirectly deduced mineral concentrations, reported data on N but not on any mineral, exposed only a part (e.g., a branch) of the plant, used super-elevated or uncontrolled CO2 levels were not included. Table 3 lists all the studies together with their respective species/cultivars and CO2 enrichment levels (the dataset with all the details is deposited at Dryad and GitHub). When a study reported the low CO2 level as ‘am-bient’ with no specific numerical values, then I used the Keeling curve to approximate the ambient CO2 level for the year the study was carried out.
The following data-inclusion rules were applied to the studies with multiple co-dependent datasets for the foliar dataset: (1) the lowest and the highest CO2 levels for studies with multiple CO2 levels, (2) the control and single-factor CO2 for studies with environmental co-factors (e.g., observations from combined eCO2 and ozone experiments were excluded), (3) the highest nutrient regime when the control could not be identified in a study with multiple nutrient co-factors, (4) the last point, that is the longest exposure to ambient/eCO2 for studies with time series, (5) the most mature needles/leaves for studies reporting foliar tissues of various ages. If, in rare instances, a publication reported three
Ecology | Epidemiology and global health
Loladze. eLife 2014;3:e02245. DOI: 10.7554/eLife.02245 16 of 29
Research article
Table 3. Studies covered in the meta-analysis of CO2 effects on the plant ionome.
SpeciesCommon name Crop +CO2 Country Reference
Acer pseudoplatanus maple tree No 260 Overdieck, 1993
Acer rubrum red maple tree No 200 USA Finzi et al., 2001
Agrostis capillaris grass No 340 UK Baxter et al., 1994
Agrostis capillaris grass No 250 Newbery et al., 1995
Alnus glutinosa alder tree No 350 UK Temperton et al., 2003
Alphitonia petriei rainforest tree No 440 Kanowski, 2001
Ambrosia dumosa shrub No 180 USA Housman et al., 2012
Arabidopsis thaliana thale cress No 450 Niu et al., 2013
Arabidopsis thaliana thale cress No 330 Teng et al., 2006
Betula pendula 'Roth' birch tree No 349 Finland Oksanen et al., 2005
Bouteloua curtipendula grass No 230 Polley et al., 2011
Bromus tectorum cheatgrass No 150 Blank et al., 2006
Bromus tectorum cheatgrass No 150 Blank et al., 2011
Calluna vulgaris heather shrub No 200 Woodin et al., 1992
Cercis canadensis red bud tree No 200 USA Finzi et al., 2001
Chrysanthemum morifolium chrysanth No 325 Kuehny et al., 1991
Cornus florida dogwood tree No 200 USA Finzi et al., 2001
Fagus sylvatica beech tree No 260 Overdieck, 1993
Fagus sylvatica beech tree No 300 Rodenkirchen et al., 2009
Festuca pratensis meadow fescue No 320 Overdieck, 1993
Festuca vivipara grass No 340 UK Baxter et al., 1994
Flindersia brayleyana rainforest tree No 440 Kanowski, 2001
Galactia elliottii Elliott's milkpea No 325 USA Hungate et al., 2004
Larix kaempferi larch tree No 335 Japan Shinano et al., 2007
Lepidium latifolium peppergrass No 339 Blank and Derner, 2004
Liquidambar styraciflua sweetgum tree No 200 USA Finzi et al., 2001
Liquidambar styraciflua sweetgum tree No 167 USA Johnson et al., 2004
Liquidambar styraciflua sweetgum tree No 156–200 USA Natali et al., 2009
Liriodendron tulipifera tulip tree No 325 O’Neill et al., 1987
Lolium perenne grass No 320 Overdieck, 1993
Lolium perenne grass No 290 Germany Schenk et al., 1997
Lupinus albus white lupin No 550 Campbell and Sage, 2002
Lycium pallidum shrub No 180 USA Housman et al., 2012
Nephrolepis exaltata fern No 650 Nowak et al., 2002
Pelargonium x hortorum 'Maverick White'
geranium No 330 Mishra et al., 2011
Picea abies 'Karst.' spruce tree No 350 Pfirrmann et al., 1996
Picea abies 'Karst.' spruce tree No 300 Rodenkirchen et al., 2009
Picea abies 'Karst.' spruce tree No 300 Weigt et al., 2011
Picea rubens spruce tree No 350 Shipley et al., 1992
Pinus ponderosa pine tree No 346 USA Walker et al., 2000
Pinus ponderosa 'Laws.' pine tree No 350 USA Johnson et al., 1997
Pinus sylvestris pine tree No 331 Luomala et al., 2005
Table 3. Continued on next page
Ecology | Epidemiology and global health
Loladze. eLife 2014;3:e02245. DOI: 10.7554/eLife.02245 17 of 29
Research article
SpeciesCommon name Crop +CO2 Country Reference
Pinus sylvestris pine tree No 225 Finland Utriainen et al., 2000
Pinus taeda loblolly pine tree No 200 USA Finzi et al., 2001
Pinus taeda pine tree No 200 USA Natali et al., 2009
Poa alpina grass No 340 UK Baxter et al., 1994
Poa alpina grass No 340 UK Baxter et al., 1997
Pteridium aquilinum fern No 320 Zheng et al., 2008
Pteridium revolutum fern No 320 Zheng et al., 2008
Pteris vittata fern No 320 Zheng et al., 2008
Quercus chapmanii oak tree No 350 USA Natali et al., 2009
Quercus geminata oak tree No 350 USA Johnson et al., 2003
Quercus geminata oak tree No 350 USA Natali et al., 2009
Quercus myrtifolia oak tree No 350 USA Johnson et al., 2003
Quercus myrtifolia oak tree No 350 USA Natali et al., 2009
Quercus suber cork oak tree No 350 Niinemets et al., 1999
Schizachyrium scoparium grass No 230 Polley et al., 2011
Sorghastrum nutans grass No 230 Polley et al., 2011
Sporobolus kentrophyllus grass No 330 Wilsey et al., 1994
Trifolium alexandrinum 'Pusa Jayant'
berseem clover No 250 India Pal et al., 2004
Trifolium pratense red clover No 320 Overdieck, 1993
Trifolium repens white clover No 320 Overdieck, 1993
Trifolium repens white clover No 290 Germany Schenk et al., 1997
Trifolium repens white clover No 615 Tian et al., 2014
Trifolium repens 'Regal' white clover No 330 Heagle et al., 1993
Vallisneria spinulosa macrophyte No 610 Yan et al., 2006
Apium graveolens celery Yes 670 Tremblay et al., 1988
Brassica juncea 'Czern' mustard Yes 500 India Singh et al., 2013
Brassica napus 'Qinyou 8' rapeseed Yes 615 Tian et al., 2014
Brassica napus 'Rongyou 10' rapeseed Yes 615 Tian et al., 2014
Brassica napus 'Zhongyouza 12'
rapeseed Yes 615 Tian et al., 2014
Brassica napus 'Campino' oilseed rape Yes 106 Germany Högy et al., 2010
Brassica rapa 'Grabe' turnip Yes 600 Azam et al., 2013
Citrus aurantium orange tree Yes 300 USA Penuelas et al., 1997
Citrus madurensis citrus tree Yes 600 Keutgen and Chen, 2001
Cucumis sativus cucumber Yes 650 Peet et al., 1986
Daucus carota 'T-1-111' carrot Yes 600 Azam et al., 2013
Fragaria x ananassa strawberry Yes 600 Keutgen et al., 1997
Glycine max 'Merr.' soybean Yes 360 USA Prior et al., 2008
Glycine max 'Merr.' soybean Yes 200 Rodriguez et al., 2011
Gossypium hirsutum 'Deltapine 77'
cotton Yes 180 USA Huluka et al., 1994
Hordeum vulgare barley Yes 175 Germany Erbs et al., 2010
Hordeum vulgare 'Alexis' barley Yes 334 Germany Manderscheid et al., 1995
Table 3. Continued
Table 3. Continued on next page
Ecology | Epidemiology and global health
Loladze. eLife 2014;3:e02245. DOI: 10.7554/eLife.02245 18 of 29
Research article
SpeciesCommon name Crop +CO2 Country Reference
Hordeum vulgare 'Arena' barley Yes 334 Germany Manderscheid et al., 1995
Hordeum vulgare 'Europa' barley Yes 400 Haase et al., 2008
Hordeum vulgare 'Iranis' barley Yes 350 Pérez-López et al., 2014
Hordeum vulgare 'Theresa' barley Yes 170 Germany Wroblewitz et al., 2013
Lactuca sativa 'BRM' lettuce Yes 308 Baslam et al., 2012
Lactuca sativa 'Mantilla' lettuce Yes 350 Chagvardieff et al., 1994
Lactuca sativa 'MV' lettuce Yes 308 Baslam et al., 2012
Lactuca sativa 'Waldmann's Green' lettuce Yes 600 McKeehen et al., 1996
Lycopersicon esculentum 'Astra' tomato Yes 600 Khan et al., 2013
Lycopersicon esculentum 'Eureka' tomato Yes 600 Khan et al., 2013
Lycopersicon esculentum 'Mill.' tomato Yes 360 Li et al., 2007
Lycopersicon esculentum 'Zheza 809'
tomato Yes 450 Jin et al., 2009
Mangifera indica 'Kensington' mango tree Yes 350 Schaffer and Whiley, 1997
Mangifera indica 'Tommy Atkins' mango tree Yes 350 Schaffer and Whiley, 1997
Medicago sativa alfalfa Yes 615 Tian et al., 2014
Medicago sativa 'Victor' alfalfa Yes 100 UK Al-Rawahy et al., 2013
Oryza sativa rice Yes 200 China Pang et al., 2005
Oryza sativa 'Akitakomachi' rice Yes 205–260 Japan Lieffering et al., 2004
Oryza sativa 'Akitakomachi' rice Yes 250 Japan Yamakawa et al., 2004
Oryza sativa 'BRRIdhan 39' rice Yes 210 Bangladesh Razzaque et al., 2009
Oryza sativa 'Gui Nnong Zhan' rice Yes 500 Li et al., 2010
Oryza sativa 'IR 72' rice Yes 296 Philippines Ziska et al., 1997
Oryza sativa 'Japonica' rice Yes 200 China Jia et al., 2007
Oryza sativa 'Jarrah' rice Yes 350 Seneweera and Conroy, 1997
Oryza sativa 'Khaskani' rice Yes 210 Bangladesh Razzaque et al., 2009
Oryza sativa 'Rong You 398' rice Yes 500 Li et al., 2010
Oryza sativa 'Shakkorkhora' rice Yes 210 Bangladesh Razzaque et al., 2009
Oryza sativa 'Shan You 428' rice Yes 500 Li et al., 2010
Oryza sativa 'Tian You 390' rice Yes 500 Li et al., 2010
Oryza sativa 'Wu Xiang jing' rice Yes 200 China Guo et al., 2011
Oryza sativa 'Wuxiangjing 14' rice Yes 200 China Ma et al., 2007
Oryza sativa 'Wuxiangjing 14' rice Yes 200 China Yang et al., 2007
Oryza sativa 'Yin Jing Ruan Zhan' rice Yes 500 Li et al., 2010
Oryza sativa 'Yue Za 889' rice Yes 500 Li et al., 2010
Phaseolus vulgaris 'Contender' bean Yes 340 Mjwara et al., 1996
Phaseolus vulgaris 'Seafarer' bean Yes 870 Porter and Grodzinski, 1984
Raphanus sativus 'Mino' radish Yes 600 Azam et al., 2013
Raphanus sativus 'Cherry Belle' radish Yes 380 Barnes and Pfirrmann, 1992
Raphanus sativus 'Giant White Globe'
radish Yes 600 McKeehen et al., 1996
Rumex patientia x R. Tianschanicus 'Rumex K-1'
buckwheat Yes 615 Tian et al., 2014
Table 3. Continued
Table 3. Continued on next page
Ecology | Epidemiology and global health
Loladze. eLife 2014;3:e02245. DOI: 10.7554/eLife.02245 19 of 29
Research article
or more separate datasets for the same species or cultivar, the data were averaged prior to the inclu-sion into the foliar dataset. For the edible tissue dataset, the study inclusion rules were the same as for the foliar dataset with the following exception: due to relative scarcity of data for edible tissues, the data with co-factors were included in the dataset (e.g., observations from combined eCO2 and ozone experiments were included). The ‘Additional info’ column in the dataset specifies exactly what datasets were extracted from each study with multiple datasets.
SpeciesCommon name Crop +CO2 Country Reference
Secale cereale 'Wintergrazer-70' rye Yes 615 Tian et al., 2014
Solanum lycopersicum '76R MYC+'tomato Yes 590 Cavagnaro et al., 2007
Solanum lycopersicum 'rmc' tomato Yes 590 Cavagnaro et al., 2007
Solanum tuberosum potato Yes 500 Cao and Tibbitts, 1997
Solanum tuberosum 'Bintje' potato Yes 170 Germany Högy and Fangmeier, 2009
Solanum tuberosum 'Bintje' potato Yes 278-281 Sweden Piikki et al., 2007
Solanum tuberosum 'Bintje' potato Yes 305-320 Europe Fangmeier et al., 2002
Solanum tuberosum 'Dark Red Norland'
potato Yes 345 USA Heagle et al., 2003
Solanum tuberosum 'Superior' potato Yes 345 USA Heagle et al., 2003
Sorghum bicolor sorghum Yes 360 USA Prior et al., 2008
Spinacia oleracea spinach Yes 250 India Jain et al., 2007
Trigonella foenum-graecum fenugreek Yes 250 India Jain et al., 2007
Triticum aestivum wheat Yes 175 Germany Erbs et al., 2010
Triticum aestivum 'Ningmai 9' wheat Yes 200 China Ma et al., 2007
Triticum aestivum 'Triso' wheat Yes 150 Germany Högy et al., 2009
Triticum aestivum 'Triso' wheat Yes 150 Germany Högy et al., 2013
Triticum aestivum 'Alcazar' wheat Yes 350 de la Puente et al., 2000
Triticum aestivum 'Batis' wheat Yes 170 Germany Wroblewitz et al., 2013
Triticum aestivum 'Dragon' wheat Yes 305-320 Sweden Pleijel and Danielsson, 2009
Triticum aestivum 'HD-2285' wheat Yes 250 India Pal et al., 2003
Triticum aestivum 'Janz' wheat Yes 166 Australia Fernando et al., 2014
Triticum aestivum 'Jinnong 4' wheat Yes 615 Tian et al., 2014
Triticum aestivum 'Minaret' wheat Yes 278 Germany Fangmeier et al., 1997
Triticum aestivum 'Minaret' wheat Yes 300 Europe Fangmeier et al., 1999
Triticum aestivum 'Rinconada' wheat Yes 350 de la Puente et al., 2000
Triticum aestivum 'Star' wheat Yes 334 Germany Manderscheid et al., 1995
Triticum aestivum 'Turbo' wheat Yes 334 Germany Manderscheid et al., 1995
Triticum aestivum 'Turbo' wheat Yes 350 Wu et al., 2004
Triticum aestivum 'Veery 10' wheat Yes 410 Carlisle et al., 2012
Triticum aestivum 'Yangmai' wheat Yes 200 China Guo et al., 2011
Triticum aestivum 'Yitpi' wheat Yes 166 Australia Fernando et al., 2012a
Triticum aestivum 'Yitpi' wheat Yes 166 Australia Fernando et al., 2012b
Triticum aestivum 'Yitpi' wheat Yes 166 Australia Fernando et al., 2012c
Triticum aestivum 'Yitpi' wheat Yes 166 Australia Fernando et al., 2014
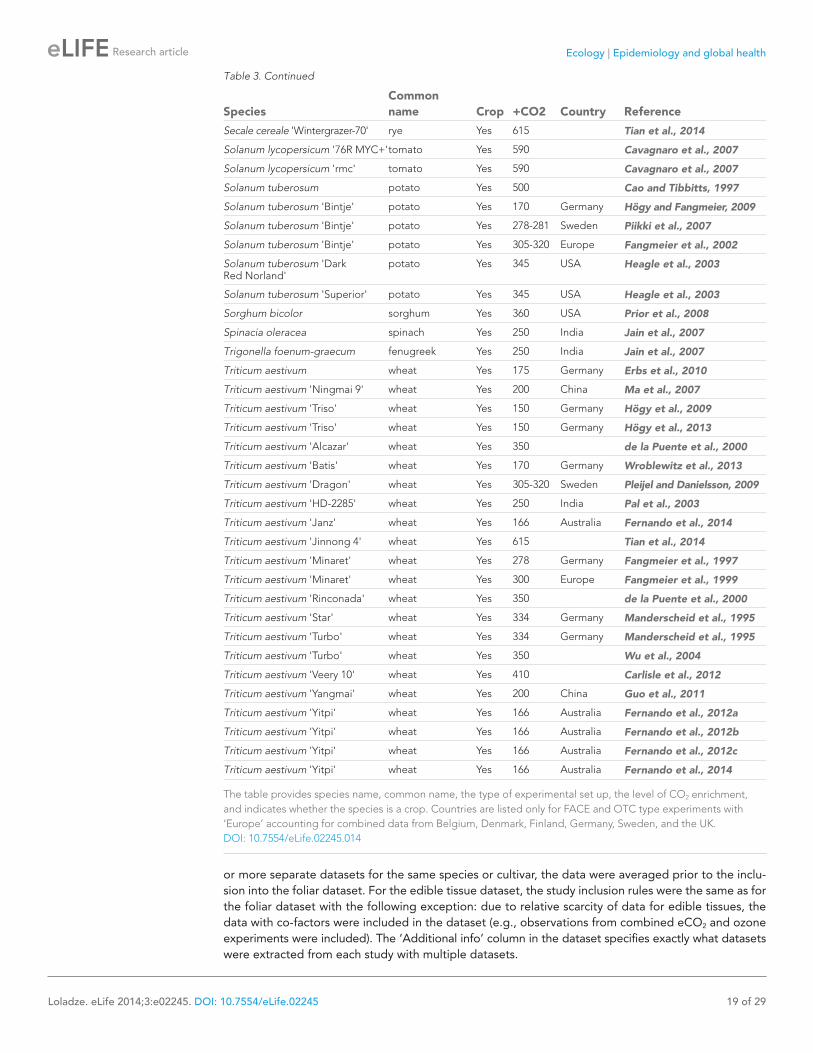
The table provides species name, common name, the type of experimental set up, the level of CO2 enrichment, and indicates whether the species is a crop. Countries are listed only for FACE and OTC type experiments with ‘Europe’ accounting for combined data from Belgium, Denmark, Finland, Germany, Sweden, and the UK.DOI: 10.7554/eLife.02245.014
Table 3. Continued
Ecology | Epidemiology and global health
Loladze. eLife 2014;3:e02245. DOI: 10.7554/eLife.02245 20 of 29
Research article
The above publication-inclusion and data-inclusion rules allow treating each study as independent in the dataset. At no instance, potentially co-dependent observations (e.g., multiple observations of the same plant throughout a growing season or observations of various parts of the same plant) were included in either the foliar or the edible dataset as separate studies. I used GraphClick v.3.0 and PixelStick v.2.5 to digitize data presented in a graphical form, for example bar charts.
The foliar dataset covers 4733 observations of 25 chemical elements in 110 species and cultivars. The edible tissues dataset covers 3028 observations of 23 elements in 41 species and cultivars. The FACE studies cover 2264 observations of 24 elements in 25 species and cultivars. The two datasets reflect data on 125 C3 and 5 C4 species/cultivars.
Effect size measureWhile the amount of statistical details provided in each study varies considerably, the following data were extractable from each study: (1) the relative change (or lack thereof) in the mean concentration between the low and the high CO2 treatments: (E-A)/A, where A and E are the mean concentrations of an element at the low and the high CO2 treatments respectively, (2) the sample size or the number of replicates (n).
Since a decrease in the concentration of a mineral is limited to 100%, but an increase in its concentration is theoretically unlimited, a standard technique was applied to reduce biases towards increases. Specifically, the natural log of the response ratio, that is ln(E/A), was used as the effect size metric (e.g., Hedges et al., 1999; Jablonski et al., 2002; Taub et al., 2008). The response ratio, r = E/A, was calculated from the relative change as follows: r = 1+(E-A)/A. After performing statistical analyses, I converted all the results back from the log form to report them as ordinary percent changes.
Making results replicablePublished meta-analytic and biostatistical results need to be replicable and reproducible, and the pro-cess of replication needs to be made as easy as possible and clearly traceable to the original sources (Peng, 2009). In this regard, I have made the following efforts to ease the replication (from the original sources) of each and every result presented here: 1. While copyright restrictions do not permit posting the original published data sources online, I
will share, upon request, all the data sources in PDF form, where all the pertinent data are clearly marked for easy identification, thus removing any potential ambiguity about what data were ex-tracted from each study.
2. The entire dataset for the foliar and the edible tissues is available at Dryad digital depository, www.datadryad.org, under 10.5061/dryad.6356f. The dataset is available as an Excel file (formatted for easy viewing) and as a ‘CSV’ file; the latter is made-ready (tidy) for analysis with open-source (R Core Team, 2014) and commercial statistical packages (e.g., SPSS).
3. An executable R code to generate individual results is available with the dataset at the above-mentioned depository and at GitHub: https://github.com/loladze/co2. Assistance for replicating any result and figure presented in this study will be provided to any interested party.
Statistical analysisI performed all the analyses using R (R Core Team, 2014), SPSS v. 21 (IBM, Armonk, NY, USA) and G*Power 3 (Faul et al., 2007). Meta-analytic studies often weight effect sizes by the reciprocal of their variance, which tends to give a greater weight to studies with greater precision. However, many eCO2 studies do not report measures of variation in the data (standard error, standard deviation, or variance). In lieu of the measures of variance, studies can be weighted by the number of replicates (n) or, alter-natively, each study can be assigned equal weight, that is, unweighted method (Jablonski et al., 2002). I used both methods (weighted and unweighted) to calculate the means of effect sizes with 95% CIs and compared the results of both methods. Nearly in all instances, the difference between the weighted and the unweighted means was small and lesser than the standard error of the unweighted mean. For example, across all the FACE studies, the overall mineral change was −6.1% (−7.8 to −4.4) when unweighted cf. the −6.5% (−8.0 to −5.1) when weighted. For the reason of close similarity between weighted and unweighted approaches, I used the simpler out of the two methods, that is the unweighted one, when reporting the results.
Since the distribution of effect sizes is not necessarily normal, I applied both parametric (t test) and non-parametric (bootstrapping with 10,000 replacements) tests for calculating the 95% CI for the
Ecology | Epidemiology and global health
Loladze. eLife 2014;3:e02245. DOI: 10.7554/eLife.02245 21 of 29
Research article
mean effect size and the statistical power. The latter was calculated for: (1) an absolute effect size of 5%, and (2) the probability of Type I error, ˞ = 0.05. If the variance of a small sample << the true pop-ulation variance, then this leads to substantial overestimations of Cohen's d and the statistical power. To be conservative when estimating power for small samples (m <20), I used the larger of the sample standard deviation or 0.21, which is the standard deviation for the entire mineral dataset.
The results from the parametric and non-parametric tests were very close. For example, for Zn in edible tissues (sample size = 65), t test yields (−11.4%, −14.0 to −8.7) and 0.91 power cf. (−11.4%, −13.9 to −8.7) and 0.92 power for the bootstrapping procedure. A close similarity between the results of t test and non-parametric test is expected when sample size (m, the number of independent observations for each mineral) is >30, which often was the case in this study. For reporting purposes, I used the 95% CI and the power generated by the non-parametric method, that is, the bootstrapping procedure.
Testing for publication biasTo test for publication bias or ‘the file drawer effect’ in the dataset, I plotted effect sizes against corre-sponding sample sizes/replicates, n, to provide a simple visual evaluation of the distribution of effect sizes (Figure 9). The resulting cloud of points is funnel-shaped, narrowing toward larger sample sizes, and overall is symmetrical along the mean effect size. This indicates the absence of any significant publication bias (Egger et al., 1997).
Fragmenting the dataset into categoriesMeta-analytic CO2 studies often partition their datasets into various categories (e.g., plant group, plant tissue, fertilization, or water regime) to estimate effect sizes for each category. Such data fragmentation, however, is warranted only if the statistical power of the resulting test for each category is adequate. Otherwise, low power can lead to non-significant outcomes and Type II errors. As tempting as it can be to partition the current dataset into many categories and cases (e.g., Zn in fruits, Fe in tuber, Cu in annuals, multiple CO2 levels), only by fragmenting the data into sufficiently large categories an adequate statistical power can be retained. Such categories include: foliar tissues, edible tissues, woody plants (trees and shrubs), herbaceous plants, FACE studies, non-FACE studies, crops, wild plants (all non-crops, including ornamental plants), C3 plants, C4 plants, rice, wheat, barley, and potato. Furthermore, I fragmented the data for C3 plants, the foliar and the edible tissues, the non-FACE and the FACE studies into individual chemical ele-ments and into individual common plant names (e.g., all rice cultivars grouped under ‘rice’). For the regional analysis, I used only OTC and FACE studies because they reflect local environment much more accurately than studies using complete-enclosures (e.g., closed chamber, glasshouse). If an OTC or FACE study did not report precise geographic coordinates, then the latitude and longi-tude of a nearby research facility or city was used (all coordinates in the dataset are in decimal units). Figures 1–7 include results with the statistical power >0.40 for each element, country, region, plant tissue or category. Generally, power >0.80 is considered acceptable (Cohen, 1988). Unfortunately, such a level was achievable only for elements for which the data are most abundant and for the ionomes of some plant groups and species. Note that the power was calculated for a 5% effect size, while the true effect size is likely to be larger (ฏ8%); therefore, the true power is likely to be higher than the calculated power for most results. All the results, irrespective of the statistical power, can be found in Figure 1–source data 1. Furthermore, Figure 1 shows the mean effect sizes (with their 95% CI) plotted against their respective statistical powers for all the minerals and all the plant groups/tissues.
Formula for calculating percentage changes in TNC:protein and TNC:mineralsIf the concentration of substance X in a plant increases by and concomitantly the concentration of substance Y decreases by in the plant, then the X-to-Y ratio of the plant (X:Y) increases by:
y (1)
ProofLet us denote the initial concentrations of substances X and Y in a plant as xA and yA, respectively. Suppose the X and Y contents in the plant changed by x% and −y%, respectively. Then the new X content in the plant, xE, is
Ecology | Epidemiology and global health
Loladze. eLife 2014;3:e02245. DOI: 10.7554/eLife.02245 22 of 29
Research article
y
and the new Y content in the plant,yE, is
y
The original ฉ , while the new ฉ . Since the percentage change in the X:Y equals to:
100% = 1 100%,new original new
original original
¬ ¸ ¸ ®
substituting and for the original and the new, respectively, yields:
yy
y
An advantage of Equation 1 is that it holds true irrespective of whether the decrease in Y is driven by some reason applicable only to Y or by the increase in X, that is the dilution by X.
AcknowledgementsThe author thanks George Kordzakhia, Nik Loladze and Marina Van for discussions, David Salt and four anonymous referees for comments, and Dmitri Logvinenko for providing access to library resources. The author acknowledges NSF rejections to support this research (proposals Nos. 0548181, 0644300, 0746795).
Additional information
Funding
Funder Author
The author declares that there was no external funding for this work.
Author contributionsIL, Conception and design, Acquisition of data, Analysis and interpretation of data, Drafting or revising the article
Additional filesMajor datasetThe following dataset was generated:
Author(s) Year Dataset title Dataset ID and/or URLDatabase, license, and accessibility information
Loladze I 2014 CO2 Dataset (CSV format); CO2 Dataset (XLSX format); R Code for the CO2 dataset
http://dx.doi.org/10.5061/ dryad.6356f
Available at Dryad Digital Repository under a CC0 Public Domain Dedication.
ReferencesAAAC Climate Science Panel. 2014. What we know: the reality, risks and response to climate change. URL
http://whatweknow.aaas.orgAl-Rawahy SH, Sulaiman H, Farooq Sa, Karam MF, Sherwani N. 2013. Effect of O3 and CO2 levels on growth,
biochemical and nutrient parameters of alfalfa (Medicago Sativa). APCBEE Procedia 5:288–295. doi: 10.1016/j.apcbee.2013.05.050.
Arnaud J, Bertrais S, Roussel AM, Arnault N, Ruffieux D, Favier A, Berthelin S, Estaquio C, Galan P, Czernichow S, Hercberg S. 2007. Serum selenium determinants in French adults: the SU.VI.M.AX study. British Journal of Nutrition 95:313–320. doi: 10.1079/BJN20051528.
Ecology | Epidemiology and global health
Loladze. eLife 2014;3:e02245. DOI: 10.7554/eLife.02245 23 of 29
Research article
Azam A, Khan I, Mahmood A. 2013. Yield, chemical composition and nutritional quality responses of carrot, radish and turnip to elevated atmospheric carbon dioxide. Journal of the Science of Food and Agriculture 93:3237–3244. doi: 10.1002/jsfa.6165.
Barnes J, Pfirrmann T. 1992. The influence of CO2 and O3, singly and in combination, on gas exchange, growth and nutrient status of radish. New Phytologist 121:403–412. doi: 10.1111/j.1469-8137.1992.tb02940.x.
Baslam M, Garmendia I, Goicoechea N. 2012. Elevated CO2 may impair the beneficial effect of arbuscular mycorrhizal fungi on the mineral and phytochemical quality of lettuce. Annals of Applied Biology 161:180–191. doi: 10.1111/j.1744-7348.2012.00563.x.
Baxter R, Ashenden TW, Farrar JF. 1997. Effect of elevated CO2 and nutrient status on growth, dry matter partitioning and nutrient content of Poa alpina var. vivipara L. Journal of Experimental Botany 48:1477–1486. doi: 10.1093/jxb/48.7.1477.
Baxter R, Gantley M, Ashenden TW, Farrar JF. 1994. Effects of elevated carbon dioxide on three grass species from montane pasture II. Nutrient uptake, allocation and efficiency of use. Journal of Experimental Botany 45:1267–1278. doi: 10.1093/jxb/45.9.1267.
Blank R, Morgan T, Ziska L, White R. 2011. Effect of atmospheric CO2 levels on nutrients in cheatgrass tissue. Natural Resources and Environmental Issues 16:1–5.
Blank RR, Derner JD. 2004. Effects of CO2 enrichment on plant-soil relationships of Lepidium latifolium. Plant and Soil 262:159–167. doi: 10.1023/B:PLSO.0000037032.43098.5c.
Blank RR, White RH, Ziska LH. 2006. Combustion properties of Bromus tectorum L.: influence of ecotype and growth under four CO2 concentrations. International Journal of Wildland Fire 15:227–236. doi: 10.1071/WF05055.
Bloom AJ, Burger M, Rubio Asensio JS, Cousins AB. 2010. Carbon dioxide enrichment inhibits nitrate assimilation in wheat and Arabidopsis. Science 328:899–903. doi: 10.1126/science.1186440.
Bouis HE, Welch RM. 2010. Biofortification – a sustainable agricultural strategy for reducing micronutrient malnutrition in the global South. Crop Science 50(Suppl 1):S–20–S–32. doi: 10.2135/cropsci2009.09.0531.
Brown KH, Wuehler SE, Peerson JM. 2001. The importance of zinc in human nutrition and estimation of the global prevalence of zinc deficiency. Food and Nutrition Bulletin 22:113–125.
Button KS, Ioannidis JP, Mokrysz C, Nosek BA, Flint J, Robinson ES, Munafò MR. 2013. Power failure: why small sample size undermines the reliability of neuroscience. Nature Reviews Neuroscience 14:365–376. doi: 10.1038/nrn3475.
Campbell CD, Sage RF. 2002. Interactions between atmospheric CO2 concentration and phosphorus nutrition on the formation of proteoid roots in white lupin (Lupinus albus L.). Plant, Cell & Environment 25:1051–1059. doi: 10.1046/j.1365-3040.2002.00883.x.
Cao W, Tibbitts TW. 1997. Starch concentration and impact on specific leaf weight and element concentra-tions in potato leaves under varied carbon dioxide and temperature. Journal of Plant Nutrition 20:871–881. doi: 10.1080/01904169709365302.
Carlisle E, Myers S, Raboy V, Bloom A. 2012. The effects of inorganic nitrogen form and CO2 concentration on wheat yield and nutrient accumulation and distribution. Frontiers in Plant Science 3:195. doi: 10.3389/fpls.2012.00195.
Cavagnaro TR, Sokolow SK, Jackson LE. 2007. Mycorrhizal effects on growth and nutrition of tomato under elevated atmospheric carbon dioxide. Functional Plant Biology 34:730–736. doi: 10.1071/FP06340.
Chagvardieff P, D’Aletto T, Andre M. 1994. Specific effects of irradiance and CO2 concentration doublings on productivity and mineral content in lettuce. Advances in Space Research 14:269–275. doi: 10.1016/ 0273-1177(94)90307-7.
CIA. 2013. The World Factbook. Central Intelligence Agency. URL https://www.cia.gov/library/publications/the-world-factbook/
Cohen J. 1988. Statistical power analysis for the behavioral sciencies. Hillsdale, NJ: Erlbaum. 2nd edition.Cotrufo MF, Ineson P, Scott A. 1998. Elevated CO2 reduces the nitrogen concentration of plant tissues. Global
Change Biology 4:43–54. doi: 10.1046/j.1365-2486.1998.00101.x.Davis DR, Epp MD, Riordan HD. 2004. Changes in USDA food composition data for 43 garden crops, 1950 to
1999. Journal of the American College of Nutrition 23:669–682. doi: 10.1080/07315724.2004.10719409.de la Puente LS, Perez PP, Martinez-Carrasco R, Morcuende RM, del Molino IMM. 2000. Action of elevated
CO2 and high temperatures on the mineral chemical composition of two varieties of wheat. Agrochimica 44:221–230.
Donohue RJ, Roderick ML, McVicar TR, Farquhar GD. 2013. Impact of CO2 fertilization on maximum foliage cover across the globe's warm, arid environments. Geophysical Research Letters 40:3031–3035. doi: 10.1002/grl.50563.
Drake BG, Gonzalez-Meler Ma, Long SP. 1997. More efficient plants: a consequence of rising atmospheric CO2? Annual Review of Plant Physiology and Plant Molecular Biology 48:609–639. doi: 10.1146/annurev.arplant.48.1.609.
Duquesnay A, Dupouey JL, Clement A, Ulrich E, Le Tacon F. 2000. Spatial and temporal variability of foliar mineral concentration in beech (Fagus sylvatica) stands in northeastern France. Tree Physiology 20:13–22. doi: 10.1093/treephys/20.1.13.
Duval BD, Blankinship JC, Dijkstra P, Hungate BA. 2011. CO2 effects on plant nutrient concentration depend on plant functional group and available nitrogen: a meta-analysis. Plant Ecology 213:505–521. doi: 10.1007/s11258-011-9998-8.
Ebbeling CB, Swain JF, Feldman HA, Wong WW, Hachey DL, Garcia-Lago E, Ludwig DS. 2012. Effects of dietary composition on energy expenditure during weight-loss maintenance. The Journal of the American Medical Association 307:2627–2634. doi: 10.1001/jama.2012.6607.
Ecology | Epidemiology and global health
Loladze. eLife 2014;3:e02245. DOI: 10.7554/eLife.02245 24 of 29
Research article
Egger M, Smith GD, Schneider M, Minder C. 1997. Bias in meta-analysis detected by a simple, graphical test. British Medical Journal 315:629–634. doi: 10.1136/bmj.315.7109.629.
Ekholm P, Reinivuo H, Mattila P, Pakkala H, Koponen J, Happonen A, Hellström J, Ovaskainen M-L. 2007. Changes in the mineral and trace element contents of cereals, fruits and vegetables in Finland. Journal of Food Composition and Analysis 20:487–495. doi: 10.1016/j.jfca.2007.02.007.
Erbs M, Manderscheid R, Jansen G, Seddig S, Pacholski A, Weigel H. 2010. Effects of free-air CO2 enrichment and nitrogen supply on grain quality parameters and elemental composition of wheat and barley grown in a crop rotation. Agriculture, Ecosystems & Environment 136:59–68. doi: 10.1016/j.agee.2009.11.009.
Fan M-S, Zhao F-J, Fairweather-tait SJ, Poulton PR, Dunham SJ, Mcgrath SP. 2008. Evidence of decreasing mineral density in wheat grain over the last 160 years. Journal of Trace Elements in Medicine and Biology 22:315–324. doi: 10.1016/j.jtemb.2008.07.002.
Fangmeier A, De Temmerman L, Black C, Persson K, Vorne V. 2002. Effects of elevated CO2 and/or ozone on nutrient concentrations and nutrient uptake of potatoes. European Journal of Agronomy 17:353–368. doi: 10.1016/S1161-0301(02)00071-0.
Fangmeier A, De Temmerman L, Mortensen L, Kemp K, Burke J, Mitchell R, van Oijen M, Weigel H-J. 1999. Effects on nutrients and on grain quality in spring wheat crops grown under elevated CO2 concentrations and stress conditions in the European, multiple-site experiment “ESPACE-wheat”. European Journal of Agronomy 10:215–229. doi: 10.1016/S1161-0301(99)00012-X.
Fangmeier A, Grüters U, Högy P, Vermehren B, Jäger H-J. 1997. Effects of elevated CO2, nitrogen supply and tropospheric ozone on spring wheat—II. Nutrients (N, P, K, S, Ca, Mg, Fe, Mn, Zn). Environmental Pollution 96:43–59. doi: 10.1016/S0269-7491(97)00013-4.
FAO. 2013. Food and Agriculture Organization of the United Nations, FAOSTAT database. Rome: Food and Agriculture Organization of the United Nations. URL http://faostat.fao.org/
Faul F, Erdfelder E, Lang A-G, Buchner A. 2007. G*Power 3: a flexible statistical power analysis program for the social, behavioral, and biomedical sciences. Behavior Research Methods 39:175–191. doi: 10.3758/BF03193146.
Fernando N, Panozzo J, Tausz M, Norton RM, Fitzgerald GJ, Myers S, Walker C, Stangoulis J, Seneweera S. 2012c. Wheat grain quality under increasing atmospheric CO2 concentrations in a semi-arid cropping system. Journal of Cereal Science 56:684–690. doi: 10.1016/j.jcs.2012.07.010.
Fernando N, Panozzo J, Tausz M, Norton R, Fitzgerald G, Seneweera S. 2012a. Rising atmospheric CO2 concentration affects mineral nutrient and protein concentration of wheat grain. Food Chemistry 133:1307–1311. doi: 10.1016/j.foodchem.2012.01.105.
Fernando N, Panozzo J, Tausz M, Norton RM, Fitzgerald G, Seneweera S. 2012b. Elevated atmospheric CO2 affects grain sulfur concentration and grain nitrogen/sulfur ratio of wheat (Triticum aestivum L.). In: De Kok LJ, Tabe L, Tausz M, Hawkesford MJ, Hoefgen R, McManus MT, Schnug E, (Eds), Metabolism in Plants. Dordrecht, Netherlands: Sp(ringer. p. 231–236. doi: 10.1007/978-94-007-4450-9_28.
Fernando N, Panozzo J, Tausz M, Norton RM, Neumann N, Fitzgerald GJ, Seneweera S. 2014. Elevated CO2 alters grain quality of two bread wheat cultivars grown under different environmental conditions. Agriculture, Ecosystems & Environment 185:24–33. doi: 10.1016/j.agee.2013.11.023.
Finzi AC, Allen AS, DeLucia EH, Ellsworth DS, Schlesinger WH. 2001. Forest litter production, chemistry, and decomposition following two years of free-air CO2 enrichment. Ecology 82:470–484. doi: 10.1890/0012-9658(2001)082[0470:FLPCAD]2.0.CO;2.
Fryar CD, Gu Q, Ogden CL. 2012. Anthropometric reference data for children and adults: United States, 2007–2010. National Center for Health Statistics Vital and Health Statistics 11:1–40.
García OP, Long KZ, Rosado JL. 2009. Impact of micronutrient deficiencies on obesity. Nutrition Reviews 67:559–572. doi: 10.1111/j.1753-4887.2009.00228.x.
Guo H, Zhu J, Zhou H, Sun Y, Yin Y, Pei D, Ji R, Wu J, Wang X. 2011. Elevated CO2 levels affects the concentrations of copper and cadmium in crops grown in soil contaminated with heavy metals under fully open-air field conditions. Environmental Science & Technology 45:6997–7003. doi: 10.1021/es2001584.
Haase S, Rothe A, Kania A, Wasaki J, Römheld V, Engels C, Kandeler E, Neumann G. 2008. Responses to iron limitation in Hordeum vulgare L. as affected by the atmospheric CO2 concentration. Journal of Environmental Quality 37:1254–1262. doi: 10.2134/jeq2006.0136.
Hall KD, Sacks G, Chandramohan D, Chow CC, Wang YC, Gortmaker SL, Swinburn BA. 2011. Quantification of the effect of energy imbalance on bodyweight. Lancet 378:826–837. doi: 10.1016/S0140-6736(11)60812-X.
Heagle AS, Miller JE, Pursley WA. 2003. Growth and yield responses of potato to mixtures of carbon dioxide and ozone. Journal of Environment Quality 32:1603–1610. doi: 10.2134/jeq2003.1603.
Heagle AS, Miller JE, Sherrill DE, Rawlings JO. 1993. Effects of ozone and carbon dioxide mixtures on two clones of white clover. New Phytologist 123:751–762. doi: 10.1111/j.1469-8137.1993.tb03786.x.
Hedges LV, Gurevitch J, Curtis PS. 1999. The meta-analysis of response ratios in experimental ecology. Ecology 80:1150–1156. doi: 10.1890/0012-9658(1999)080[1150:TMAORR]2.0.CO;2.
Hersoug L-G, Sjödin A, Astrup A. 2012. A proposed potential role for increasing atmospheric CO2 as a promoter of weight gain and obesity. Nutrition & Diabetes 2:e31. doi: 10.1038/nutd.2012.2.
Hill JO, Wyatt HR, Reed GW, Peters JC. 2003. Obesity and the environment: where do we go from here? Science 299:853–855. doi: 10.1126/science.1079857.
Högy P, Brunnbauer M, Koehler P, Schwadorf K, Breuer J, Franzaring J, Zhunusbayeva D, Fangmeier A. 2013. Grain quality characteristics of spring wheat (Triticum aestivum) as affected by free-air CO2 enrichment. Environmental and Experimental Botany 88:11–18. doi: 10.1016/j.envexpbot.2011.12.007.
Ecology | Epidemiology and global health
Loladze. eLife 2014;3:e02245. DOI: 10.7554/eLife.02245 25 of 29
Research article
Högy P, Fangmeier A. 2009. Atmospheric CO2 enrichment affects potatoes: 2. Tuber quality traits. European Journal of Agronomy 30:85–94. doi: 10.1016/j.eja.2008.07.006.
Högy P, Franzaring J, Schwadorf K, Breuer J, Schütze W, Fangmeier A. 2010. Effects of free-air CO2 enrichment on energy traits and seed quality of oilseed rape. Agriculture, Ecosystems & Environment 139:239–244. doi: 10.1016/j.agee.2010.08.009.
Högy P, Wieser H, Köhler P. 2008. Does elevated atmospheric CO2 allow for sufficient wheat grain quality in the future? Journal of Applied Botany and Food Quality 82:114–121. doi: 10.5073/jabfq.2089.82.2.114-121.
Högy P, Wieser H, Köhler P, Schwadorf K, Breuer J, Franzaring J, Muntifering R, Fangmeier A. 2009. Effects of elevated CO2 on grain yield and quality of wheat: results from a 3-year free-air CO2 enrichment experiment. Plant Biology 11(Suppl 1):60–69. doi: 10.1111/j.1438-8677.2009.00230.x.
Housman DC, Killingbeck KT, Dave Evans R, Charlet TN, Smith SD. 2012. Foliar nutrient resorption in two Mojave Desert shrubs exposed to Free-Air CO2 Enrichment (FACE). Journal of Arid Environments 78:26–32. doi: 10.1016/j.jaridenv.2011.11.007.
Huluka G, Hileman D, Biswas P, Lewin K, Nagy J, Hendrey G. 1994. Effects of elevated CO2 and water stress on mineral concentration of cotton. Agricultural and Forest Meteorology 70:141–152. doi: 10.1016/0168-1923(94)90053-1.
Hungate BA, Stiling PD, Dijkstra P, Johnson DW, Ketterer ME, Hymus GJ, Hinkle CR, Drake BG. 2004. CO2 elicits long-term decline in nitrogen fixation. Science 304:1291. doi: 10.1126/science.1095549.
Ioannidis JPA. 2005. Why most published research findings are false. PLOS Medicine 2:e124. doi: 10.1371/journal.pmed.0020124.
IPCC. 2007. Climate change 2007: synthesis report. An Assessment of the Intergovernmental Panel on Climate Change. URL https://www.ipcc.ch/pdf/assessment-report/ar4/syr/ar4_syr.pdf
IPCC. 2013. Climate change 2013. The physical science Basis. Working group I Contribution to the IPCC Fifth assessment report. Summary for Policymakers. URL http://www.climatechange2013.org/images/report/WG1AR5_SPM_FINAL.pdf
Jablonski LM, Wang X, Curtis PS. 2002. Plant reproduction under elevated CO2 conditions: a meta-analysis of reports on 79 crop and wild species. New Phytologist 156:9–26. doi: 10.1046/j.1469-8137.2002.00494.x.
Jain V, Pal M, Raj A, Khetarpal S. 2007. Photosynthesis and nutrient composition of spinach and fenugreek grown under elevated carbon dioxide concentration. Biologia Plantarum 51:559–562. doi: 10.1007/s10535-007-0122-9.
Jia H, Guo H, Yin Y, Wang Q, Sun Q, Wang X, Zhu J. 2007. Responses of rice growth to copper stress under free-air CO2 enrichment (FACE). Chinese Science Bulletin 52:2636–2641. doi: 10.1007/s11434-007-0362-2.
Jin CW, Du ST, Chen WW, Li GX, Zhang YS, Zheng SJ. 2009. Elevated carbon dioxide improves plant iron nutrition through enhancing the iron-deficiency-induced responses under iron-limited conditions in tomato. Plant Physiology 150:272–280. doi: 10.1104/pp.109.136721.
Johnson D, Ball J, Walker R. 1997. Effects of CO2 and nitrogen fertilization on vegetation and soil nutrient content in juvenile ponderosa pine. Plant and Soil 190:29–40. doi: 10.1023/A:1004213826833.
Johnson DW, Cheng W, Joslin JD, Norby RJ, Edwards NT, Todd DE. 2004. Effects of elevated CO2 on nutrient cycling in a sweetgum plantation. Biogeochemistry 69:379–403. doi: 10.1023/B:BIOG. 0000031054.19158.7c.
Johnson DW, Hungate BA, Dijkstra P, Hymus G, Hinkle CR, Stiling P, Drake BG. 2003. The effects of elevated CO2 on nutrient distribution in a fire-adapted scrub oak forest. Ecological Applications 13:1388–1399. doi: 10.1890/02-5139.
Jonard M, André F, Dambrine E, Ponette Q, Ulrich E. 2009. Temporal trends in the foliar nutritional status of the French, Walloon and Luxembourg broad-leaved plots of forest monitoring. Annals of Forest Science 66:412–412. doi: 10.1051/forest/2009014.
Kanowski J. 2001. Effects of elevated CO2 on the foliar chemistry of seedlings of two rainforest trees from north-east Australia: implications for folivorous marsupials. Austral Ecology 26:165–172. doi: 10.1046/ j.1442-9993.2001.01103.x.
Katny MAC, Hoffmann-Thoma G, Schrier AA, Fangmeier A, Jäger H-J, van Bel AJE. 2005. Increase of photosynthesis and starch in potato under elevated CO2 is dependent on leaf age. Journal of Plant Physiology 162:429–438. doi: 10.1016/j.jplph.2004.07.005.
Keats S, Wiggins S. 2014. Future diets. Implications for agriculture and food prices, London: Overseas Development Institute. Report.
Keenan TF, Hollinger DY, Bohrer G, Dragoni D, Munger JW, Schmid HP, Richardson AD. 2013. Increase in forest water-use efficiency as atmospheric carbon dioxide concentrations rise. Nature 499:324–327. doi: 10.1038/nature12291.
Kennedy G, Nantel G, Shetty P. 2003. The scourge of “hidden hunger”: global dimensions of micronutrient deficiencies. Food Nutrition and Agriculture 32:8–16.
Keutgen N, Chen K. 2001. Responses of citrus leaf photosynthesis, chlorophyll fluorescence, macronutrient and carbohydrate contents to elevated CO2. Journal of Plant Physiology 158:1307–1316. doi: 10.1078/ 0176-1617-00564.
Keutgen N, Chen K, Lenz F. 1997. Responses of strawberry leaf photosynthesis, chlorophyll fluorescence and macronutrient contents to elevated CO2. Journal of Plant Physiology 150:395–400. doi: 10.1016/S0176-1617(97)80088-0.
Khan I, Azam A, Mahmood A. 2013. The impact of enhanced atmospheric carbon dioxide on yield, proximate composition, elemental concentration, fatty acid and vitamin C contents of tomato (Lycopersicon esculentum). Environmental Monitoring and Assessment 185:205–214. doi: 10.1007/s10661-012-2544-x.
Ecology | Epidemiology and global health
Loladze. eLife 2014;3:e02245. DOI: 10.7554/eLife.02245 26 of 29
Research article
Khokhar S, Garduño-Diaz SD, Marletta L, Shahar DR, Ireland JD, Jansen-van der Vliet M, de Henauw S. 2012. Mineral composition of commonly consumed ethnic foods in Europe. Food & Nutrition Research 56:1–8. doi: 10.3402/fnr.v56i0.17665.
Klimentidis YC, Beasley TM, Lin H-Y, Murati G, Glass GE, Guyton M, Newton W, Jorgensen M, Heymsfield SB, Kemnitz J, Fairbanks L, Allison DB. 2011. Canaries in the coal mine: a cross-species analysis of the plurality of obesity epidemics. Proceedings Biological Sciences/the Royal Society 278:1626–1632. doi: 10.1098/rspb.2010.1890.
Koh KA, Hoy JS, O’Connell JJ, Montgomery P. 2012. The Hunger-obesity paradox: obesity in the homeless. Journal of Urban Health 89:952–964. doi: 10.1007/s11524-012-9708-4.
Kuehny JS, Peet MM, Nelson PV, Willits DH. 1991. Nutrient dilution by starch in CO2 -enriched Chrysanthemum. Journal of Experimental Botany 42:711–716. doi: 10.1093/jxb/42.6.711.
Lahner B, Gong J, Mahmoudian M, Smith EL, Abid KB, Rogers EE, Guerinot ML, Harper JF, Ward JM, McIntyre L, Schroeder JI, Salt DE. 2003. Genomic scale profiling of nutrient and trace elements in Arabidopsis thaliana. Nature Biotechnology 21:1215–1221. doi: 10.1038/nbt865.
Leakey ADB, Ainsworth EA, Bernacchi CJ, Rogers A, Long SP, Ort DR. 2009. Elevated CO2 effects on plant carbon, nitrogen, and water relations: six important lessons from FACE. Journal of Experimental Botany 60:2859–2876. doi: 10.1093/jxb/erp096.
Li J, Zhou J-M, Duan Z-Q, Du C-W, Wang H-Y. 2007. Effect of CO2 enrichment on the growth and nutrient uptake of tomato seedlings. Pedosphere 17:343–351. doi: 10.1016/S1002-0160(07)60041-1.
Li Z, Tang S, Deng X, Wang R, Song Z. 2010. Contrasting effects of elevated CO2 on Cu and Cd uptake by different rice varieties grown on contaminated soils with two levels of metals: implication for phytoextraction and food safety. Journal of Hazardous Materials 177:352–361. doi: 10.1016/j.jhazmat.2009.12.039.
Lieffering M, Kim H-Y, Kobayashi K, Okada M. 2004. The impact of elevated CO2 on the elemental concentra-tions of field-grown rice grains. Field Crops Research 88:279–286. doi: 10.1016/j.fcr.2004.01.004.
Loladze I. 2002. Rising atmospheric CO2 and human nutrition: toward globally imbalanced plant stoichiometry? Trends in Ecology & Evolution 17:457–461. doi: 10.1016/S0169-5347(02)02587-9.
Luomala E, Laitinen K, Sutinen S, Kellomaki S, Vapaavuori E, Kellomäki S. 2005. Stomatal density, anatomy and nutrient concentrations of Scots pine needles are affected by elevated CO2 and temperature. Plant, Cell & Environment 28:733–749. doi: 10.1111/j.1365-3040.2005.01319.x.
Ma H, Zhu J, Xie Z, Liu G, Zeng Q, Han Y. 2007. Responses of rice and winter wheat to free-air CO2 enrichment (China FACE) at rice/wheat rotation system. Plant and Soil 294:137–146. doi: 10.1007/s11104-007-9241-5.
Manderscheid R, Bender J, Jäger H-J, Weigel HJ. 1995. Effects of season long CO2 enrichment on cereals. II. Nutrient concentrations and grain quality. Agriculture, Ecosystems & Environment 54:175–185. doi: 10.1016/0167-8809(95)00602-O.
Manoj-Kumar. 2011. Will rising CO2 affect Zn and Fe bioavailability in food grains? Current Science 101:467. doi: 10.1080/17429145.2010.513483.
Martin J, Wang ZQ, Zhang XH, Wachtel D, Volaufova J, Matthews DE, Cefalu WT. 2006. Chromium picolinate supplementation attenuates body weight gain and increases insulin sensitivity in subjects with type 2 diabetes. Diabetes Care 29:1826–1832. doi: 10.2337/dc06-0254.
McGrath JM, Lobell DB. 2013. Reduction of transpiration and altered nutrient allocation contribute to nutrient decline of crops grown in elevated CO2 concentrations. Plant, Cell & Environment 36:697–705. doi: 10.1111/pce.12007.
McKeehen JD, Smart DJ, Mackowiak CL, Wheeler RM, Nielsen SS. 1996. Effect of CO2 levels on nutrient content of lettuce and radish. Advances in Space Research 18:85–92. doi: 10.1016/0273-1177(95)00864-B.
Mishra S, Heckathorn SA, Frantz JM. 2011. Elevated CO2 affects plant responses to variation in boron availabil-ity. Plant and Soil 350:117–130. doi: 10.1007/s11104-011-0888-6.
Mjwara JM, Botha CEJ, Radloff SE. 1996. Photosynthesis, growth and nutrient changes in non-nodulated Phaseolus vulgaris grown under atmospheric and elevated carbon dioxide conditions. Physiologia Plantarum 97:754–763. doi: 10.1111/j.1399-3054.1996.tb00541.x.
Natali SM, Sañudo-Wilhelmy SA, Lerdau MT. 2009. Plant and soil mediation of elevated CO2 impacts on trace metals. Ecosystems 12:715–727. doi: 10.1007/s10021-009-9251-7.
Newbery R, Wolfenden J, Mansfield T, Harrison A. 1995. Nitrogen, phosphorus and potassium uptake and demand in Agrostis capillaris: the influence of elevated CO2 and nutrient supply. New Phytologist 130:565–574. doi: 10.1111/j.1469-8137.1995.tb04333.x.
Niinemets U, Tenhunen JD, Canta NR, Chaves MM, Faria T, Pereira JS, Reynolds JF. 1999. Interactive effects of nitrogen and phosphorus on the acclimation potential of foliage photosynthetic properties of cork oak, Quercus suber, to elevated atmospheric CO2 concentrations. Global Change Biology 5:455–470. doi: 10.1046/j.1365-2486.1999.00241.x.
Niu Y, Chai R, Dong H, Wang H, Tang C, Zhang Y. 2013. Effect of elevated CO2 on phosphorus nutrition of phosphate-deficient Arabidopsis thaliana (L.) Heynh under different nitrogen forms. Journal of Experimental Botany 64:355–367. doi: 10.1093/jxb/ers341.
Nowak J, Sroka S, Matysiak B. 2002. Effects of light level, CO2 enrichment, and concentration of nutrient solution on growth, leaf nutrient content, and chlorophyll fluorescence of boston fern microcuttings. Journal of Plant Nutrition 25:2161–2171. doi: 10.1081/PLN-120014068.
O’Neill EG, Luxmoore RJ, Norby RJ. 1987. Elevated atmospheric CO2 effects on seedling growth, nutrient uptake, and rhizosphere bacterial populations of Liriodendron tulipifera L. Plant and Soil 104:3–11. doi: 10.1007/BF02370618.
Ecology | Epidemiology and global health
Loladze. eLife 2014;3:e02245. DOI: 10.7554/eLife.02245 27 of 29
Research article
Oksanen E, Riikonen J, Kaakinen S, Holopainen T, Vapaavuori E. 2005. Structural characteristics and chemical composition of birch (Betula pendula) leaves are modified by increasing CO2 and ozone. Global Change Biology 11:732–748. doi: 10.1111/j.1365-2486.2005.00938.x.
Overdieck D. 1993. Elevated CO2 and the mineral content of herbaceous and woody plants. Vegetatio 104–105:403–411. doi: 10.1007/BF00048169.
Pal M, Karthikeyapandian V, Jain V, Srivastava AC, Anupam Raj, Sengupta UK. 2004. Biomass production and nutritional levels of berseem (Trifolium alexandrium) grown under elevated CO2. Agriculture, Ecosystems & Environment 101:31–38. doi: 10.1016/S0167-8809(03)00202-0.
Pal M, Rao L, Srivastava A, Jain V, Sengupta U. 2003. Impact of CO2 enrichment and variable nitrogen supplies on composition and partitioning of essential nutrients of wheat. Biologia Plantarum 47:227–231. doi: 10.1023/ B:BIOP.0000022256.60122.fc.
Pang J, Zhu J, Xie Z, Chen G-P, Liu G, Zhang Y. 2005. Effects of elevated pCO2 on nutrient uptake by rice and nutrient contents in rice grain. Chinese Journal of Rice Science 19:350–354.
Payahoo L, Ostadrahimi A, Mobasseri M, Khaje Bishak Y, Farrin N, Asghari Jafarabadi M, Mahluji S. 2013. Effects of zinc supplementation on the anthropometric measurements, lipid profiles and fasting blood glucose in the healthy obese adults. Advanced Pharmaceutical Bulletin 3:161–165. doi: 10.5681/apb.2013.027.
Peet MM, Huber SC, Patterson DT. 1986. Acclimation to high CO2 in monoecious cucumbers. Ii. Carbon exchange rates, enzyme activities, and starch and nutrient concentrations. Plant Physiology 80:63–67. doi: 10.1104/pp.80.1.63.
Peng RD. 2009. Reproducible research and Biostatistics. Biostatistics 10:405–408. doi: 10.1093/biostatistics/kxp014.Penuelas J, Idso SB, Ribas A, Kimball BA. 1997. Effects of long-term atmospheric CO2 enrichment on the mineral
concentration of Citrus aurantium leaves. New Phytologist 135:439–444. doi: 10.1046/j.1469-8137.1997.00676.x.Penuelas J, Matamala R. 1993. Variations in the mineral composition of herbarium plant species collected during
the last three centuries. Journal of Experimental Botany 44:1523–1525. doi: 10.1093/jxb/44.9.1523.Pérez-López U, Miranda-Apodaca J, Mena-Petite A, Muñoz-Rueda A. 2014. Responses of nutrient dynamics in
barley seedlings to the interaction of salinity and carbon dioxide enrichment. Environmental and Experimental Botany 99:86–99. doi: 10.1016/j.envexpbot.2013.11.004.
Pfirrmann T, Barnes JD, Steiner K, Schramel P, Busch U, Kuchenhoff H, Payer H-D. 1996. Effects of elevated CO2, O3 and K deficiency on Norway spruce (Picea abies): nutrient supply, content and leaching. New Phytologist 134:267–278. doi: 10.1111/j.1469-8137.1996.tb04631.x.
Piikki K, Vorne V, Ojanperä K, Pleijel H. 2007. Impact of elevated O3 and CO2 exposure on potato (Solanum tuberosum L. cv. Bintje) tuber macronutrients (N, P, K, Mg, Ca). Agriculture, Ecosystems & Environment 118:55–64. doi: 10.1016/j.agee.2006.04.012.
Pleijel H, Danielsson H. 2009. Yield dilution of grain Zn in wheat grown in open-top chamber experiments with elevated CO2 and O3 exposure. Journal of Cereal Science 50:278–282. doi: 10.1016/j.jcs.2009.06.009.
Polley HW, Fay PA, Jin VL, Combs GF. 2011. CO2 enrichment increases element concentrations in grass mixtures by changing species abundances. Plant Ecology 212:945–957. doi: 10.1007/s11258-010-9874-y.
Poorter H, Van Berkel Y, Baxter R, Den Hertog J, Dijkstra P, Gifford RM, Griffin KL, Roumet C, Roy J, Wong SC. 1997. The effect of elevated CO2 on the chemical composition and construction costs of leaves of 27 C3 species. Plant, Cell & Environment 20:472–482. doi: 10.1046/j.1365-3040.1997.d01-84.x.
Poorter H, Villar R. 1997. The fate of acquired carbon in plants: chemical composition and construction costs. In: Bazzaz FA, Grace J (Eds), Plant resource allocation. San Diego: Academic Press. p. 39–72. doi: 10.1016/B978-012083490-7/50003-7.
Porteaus F, Hill J, Ball AS, Pinter PJ, Kimball BA, Wall GW, Adamsen FJ, Hunsaker DJ, LaMorte RL, Leavitt SW, Thompson TL, Matthias AD, Brooks TJ, Morris CF. 2009. Effect of Free Air Carbon dioxide Enrichment (FACE) on the chemical composition and nutritive value of wheat grain and straw. Animal Feed Science and Technology 149:322–332. doi: 10.1016/j.anifeedsci.2008.07.003.
Porter MA, Grodzinski B. 1984. Acclimation to high CO2 in bean: Carbonic anhydrase and ribulose bisphosphate carboxylase. Plant Physiology 74:413–416. doi: 10.1104/pp.74.2.413.
Prior SA, Runion GB, Rogers HH, Torbert HA. 2008. Effects of atmospheric CO2 enrichment on crop nutrient dynamics under no-till conditions. Journal of Plant Nutrition 31:758–773. doi: 10.1080/01904160801928364.
R Core Team. 2014. R: a language and environment for statistical computing. R Foundation for Statistical Computing. Vienna, Austria. URL http://www.R-project.org/
Rayman MP. 2007. The use of high-selenium yeast to raise selenium status: how does it measure up? British Journal of Nutrition 92:557. doi: 10.1079/BJN20041251.
Razzaque MA, Haque MM, Khaliq QA, Solaiman ARM. 2009. The effect of different nitrogen levels and enrichment CO2 on the nutrient contents of rice cultivars. Bangladesh Journal of Scientific and Industrial Research 44:241–246.
Robinson EA, Ryan GD, Newman JA. 2012. A meta-analytical review of the effects of elevated CO2 on plant-arthropod interactions. The New Phytologist 194:321–336. doi: 10.1111/j.1469-8137.2012.04074.x.
Rodenkirchen H, Göttlein A, Kozovits AR, Matyssek R, Grams TEE. 2009. Nutrient contents and efficiencies of beech and spruce saplings as influenced by competition and O3/CO2 regime. European Journal of Forest Research 128:117–128. doi: 10.1007/s10342-008-0221-y.
Rodriguez JH, Klumpp A, Fangmeier A, Pignata ML. 2011. Effects of elevated CO2 concentrations and fly ash amended soils on trace element accumulation and translocation among roots, stems and seeds of Glycine max (L.) Merr. Journal of Hazardous Materials 187:58–66. doi: 10.1016/j.jhazmat.2010.11.068.
Rohde R, Muller RA, Jacobsen R, Muller E, Perlmutter S, Rosenfeld A, Wurtele J, Groom D, Wickham C. 2013. A new estimate of the Average Earth Surface Land Temperature Spanning 1753 to 2011. Geoinformatics & Geostatistics 01:1771–1789. doi: 10.4172/2327-4581.1000101.
Ecology | Epidemiology and global health
Loladze. eLife 2014;3:e02245. DOI: 10.7554/eLife.02245 28 of 29
Research article
Rosenberg MS, Adams DC, Gurevitch J. 2000. MetaWin: statistical software for meta-analysis. Sunderland, Massachusetts: Sinauer Associates. URL http://www.metawinsoft.com/
Roumet C, Laurent G, Roy J. 1999. Leaf structure and chemical composition as affected by elevated CO2: genotypic responses of two perennial grasses. New Phytologist 143:73–81. doi: 10.1046/j.1469- 8137.1999.00437.x.
Salt DE, Baxter I, Lahner B. 2008. Ionomics and the study of the plant ionome. Annual Review of Plant Biology 59:709–733. doi: 10.1146/annurev.arplant.59.032607.092942.
Schaffer B, Whiley A. 1997. Leaf gas exchange, dry matter partitioning, and mineral element concentrations in mango as influenced by elevated atmospheric carbon dioxide and root restriction. Journal of the American Society for Horticultural Science 122:849–855.
Scheier LM. 2005. What is the hunger-obesity paradox? Journal of the Academy of Nutrition and Dietetics 105:883–884, 886. doi: 10.1016/j.jada.2005.04.013.
Schenk U, Jager H-J, Weigel H-J. 1997. The response of perennial ryegrass/white clover mini-swards to elevated atmospheric CO2 concentrations: effects on yield and fodder quality. Grass and Forage Science 52:232–241. doi: 10.1046/j.1365-2494.1997.00069.x.
Seneweera SP, Conroy JP. 1997. Growth, grain yield and quality of rice (Oryza sativa L.) in response to elevated CO2 and phosphorus nutrition. Soil Science and Plant Nutrition 43:1131–1136.
Shinano T, Yamamoto T, Tawaraya K, Tadokoro M, Koike T, Osaki M. 2007. Effects of elevated atmospheric CO2 concentration on the nutrient uptake characteristics of Japanese larch (Larix kaempferi). Tree Physiology 27:97–104. doi: 10.1093/treephys/27.1.97.
Shipley B, Lechowicz M, Dumont S, Hendershot WH. 1992. Interacting effects of nutrients, pH - al and elevated CO2 on the growth of red spruce (Picea rubens Sarg.) seedlings. Water, Air, & Soil Pollution 64:585–600. doi: 10.1007/BF00483368.
Siegenthaler U, Stocker TF, Monnin E, Lüthi D, Schwander J, Stauffer B, Raynaud D, Barnola JM, Fischer H, Masson-Delmotte V, Jouzel J. 2005. Stable carbon cycle-climate relationship during the Late Pleistocene. Science 310:1313–1317. doi: 10.1126/science.1120130.
Simpson SJ, Raubenheimer D. 2005. Obesity: the protein leverage hypothesis. Obesity Reviews 6:133–142. doi: 10.1111/j.1467-789X.2005.00178.x.
Singh R, Beegom R, Rastogi S, Gaoli Z, Shoumin Z. 1998. Association of low plasma concentrations of antioxidant vitamins, magnesium and zinc with high body fat per cent measured by bioelectrical impedance analysis in Indian men. Magnesium Research 11:3–10.
Singh S, Bhatia A, Tomer R, Kumar V, Singh B, Singh SD. 2013. Synergistic action of tropospheric ozone and carbon dioxide on yield and nutritional quality of Indian mustard (Brassica juncea (L.) Czern.). Environmental Monitoring and Assessment 185:6517–6529. doi: 10.1007/s10661-012-3043-9.
Stefan K, Fürst A, Hacker R, Bartels U. 1997. Needle/leaf interlaboratory test 1995/1996. In: United Nations Economic Commision for Europe, Forest Foliar Condition in Europe Results: Results of large-scale foliar chemistry surveys 1995. European Commission, Brussels.
Stein AJ. 2009. Global impacts of human mineral malnutrition. Plant and Soil 335:133–154. doi: 10.1007/s11104-009-0228-2.
Sterner RW, Elser JJ. 2002. Ecological stoichiometry: the biology of elements from molecules to the biosphere. Princeton, NJ, USA: Princeton University Press. p. 584.
Stiling PD, Cornelissen T. 2007. How does elevated carbon dioxide (CO2) affect plant–herbivore interactions? Global Change Biology 13:1823–1842. doi: 10.1111/j.1365-2486.2007.01392.x.
Still CJ, Berry JA, Collatz GJ, DeFries RS. 2003. Global distribution of C3 and C4 vegetation: carbon cycle implications. Global Biogeochemical Cycles 17:6–1. doi: 10.1029/2001GB001807.
Taub DR, Miller B, Allen H. 2008. Effects of elevated CO2 on the protein concentration of food crops: a meta-analysis. Global Change Biology 14:565–575. doi: 10.1111/j.1365-2486.2007.01511.x.
Taubes G. 2013. The science of obesity: what do we really know about what makes us fat? British Medical Journal 346:f1050. doi: 10.1136/bmj.f1050.
Temperton VM, Grayston SJ, Jackson G, Barton CVM, Millard P, Jarvis PG. 2003. Effects of elevated carbon dioxide concentration on growth and nitrogen fixation in Alnus glutinosa in a long-term field experiment. Tree Physiology 23:1051–1059. doi: 10.1093/treephys/23.15.1051.
Teng N, Wang J, Chen T, Wu X, Wang Y, Lin J. 2006. Elevated CO2 induces physiological, biochemical and structural changes in leaves of Arabidopsis thaliana. The New Phytologist 172:92–103. doi: 10.1111/j. 1469-8137.2006.01818.x.
Tian S, Jia Y, Ding Y, Wang R, Feng R, Song Z, Guo J, Zhou L. 2014. Elevated atmospheric CO2 enhances copper uptake in crops and pasture species grown in copper-contaminated soils in a micro-plot study. CLEAN–Soil, Air, Water 42:347–354. doi: 10.1002/clen.201200401.
Tremblay N, Yelle S, Gosselin A. 1988. Effects of CO2 enrichment, nitrogen and phosphorus fertilization during the nursery period on mineral composition of celery. Journal of Plant Nutrition 11:37–49. doi: 10.1080/01904168809363783.
UNICEF. 2009. Investing in the future: a united call to action on vitamin and mineral deficiencies: global report. micronutrient initiative. Ontario. URL http://www.unitedcalltoaction.org/documents/Investing_in_the_future.pdf
Utriainen J, Janhunen S, Helmisaari H-S, Holopainen T. 2000. Biomass allocation, needle structural characteristics and nutrient composition in Scots pine seedlings exposed to elevated CO2 and O3 concentrations. Trees 14:475–484. doi: 10.1007/s004680000062.
Ecology | Epidemiology and global health
Loladze. eLife 2014;3:e02245. DOI: 10.7554/eLife.02245 29 of 29
Research article
Walker RF, Johnson DW, Geisinger DR, Ball JT. 2000. Growth, nutrition, and water relations of ponderosa pine in a field soil as influenced by long-term exposure to elevated atmospheric CO2. Forest Ecology and Management 137:1–11. doi: 10.1016/S0378-1127(99)00308-4.
Weigt RB, Raidl S, Verma R, Rodenkirchen H, Göttlein A, Agerer R. 2011. Effects of twice-ambient carbon dioxide and nitrogen amendment on biomass, nutrient contents and carbon costs of Norway spruce seedlings as influenced by mycorrhization with Piloderma croceum and Tomentellopsis submollis. Mycorrhiza 21:375–391. doi: 10.1007/s00572-010-0343-1.
Welch RM, Graham RD. 1999. A new paradigm for world agriculture: meeting human needs. Field Crops Research 60:1–10. doi: 10.1016/S0378-4290(98)00129-4.
Welch RM, Graham RD. 2005. Agriculture: the real nexus for enhancing bioavailable micronutrients in food crops. Journal of Trace Elements in Medicine and Biology 18:299–307. doi: 10.1016/j.jtemb.2005.03.001.
Wells JCK. 2013. Obesity as malnutrition: the dimensions beyond energy balance. European Journal of Clinical Nutrition 67:507–512. doi: 10.1038/ejcn.2013.31.
White PJ, Broadley MR. 2009. Biofortification of crops with seven mineral elements often lacking in human diets–iron, zinc, copper, calcium, magnesium, selenium and iodine. The New Phytologist 182:49–84. doi: 10.1111/j.1469-8137.2008.02738.x.
WHO. 2002. The world health report 2002-reducing risks, promoting healthy life. Geneva. URL http://www.who.int/whr/2002/en/
WHO. 2014. Draft guideline: sugars intake for adults and children. p. 1–48. URL http://www.who.int/nutrition/sugars_public_consultation/en/
Wilsey BJ, McNaughton SJ, Coleman JS. 1994. Will increases in atmospheric CO2 affect regrowth following grazing in C4 grasses from tropical grasslands? A test with Sporobolus kentrophyllus. Oecologia 99:141–144. doi: 10.1007/BF00317094.
Woodin S, Graham B, Killick A, Skiba U, Cresser M. 1992. Nutrient limitation of the long term response of heather [Calluna vulgaris (L.) Hull] to CO2 enrichment. New Phytologist 122:635–642. doi: 10.1111/j.1469-8137.1992.tb00091.x.
Wroblewitz S, Hüther L, Manderscheid R, Weigel H-J, Wätzig H, Dänicke S. 2013. The effect of free air carbon dioxide enrichment and nitrogen fertilisation on the chemical composition and nutritional value of wheat and barley grain. Archives of Animal Nutrition 67:263–278. doi: 10.1080/1745039X.2013.821781.
Wu D-X, Wang G-X, Bai Y-F, Liao J-X. 2004. Effects of elevated CO2 concentration on growth, water use, yield and grain quality of wheat under two soil water levels. Agriculture, Ecosystems & Environment 104:493–507. doi: 10.1016/j.agee.2004.01.018.
Yamakawa Y, Saigusa M, Okada M, Kobayashi K. 2004. Nutrient uptake by rice and soil solution composition under atmospheric CO2 enrichment. Plant and Soil 259:367–372. doi: 10.1023/B:PLSO.0000020988.18365.b5.
Yan X, Yu D, Li Y-K. 2006. The effects of elevated CO2 on clonal growth and nutrient content of submerge plant Vallisneria spinulosa. Chemosphere 62:595–601. doi: 10.1016/j.chemosphere.2005.06.018.
Yang L, Wang Y, Dong G, Gu H, Huang J, Zhu J, Yang H, Liu G, Han Y. 2007. The impact of free-air CO2 enrich-ment (FACE) and nitrogen supply on grain quality of rice. Field Crops Research 102:128–140. doi: 10.1016/j.fcr.2007.03.006.
Yerlikaya FH, Toker A, Arıbaġ A. 2013. Serum trace elements in obese women with or without diabetes. The Indian Journal of Medical Research 137:339–345.
Zheng J, Wang H, Li Z, Tang S, Chen Z. 2008. Using elevated carbon dioxide to enhance copper accumula-tion in Pteridium revolutum, a copper-tolerant plant, under experimental conditions. International Journal of Phytoremediation 10:161–172. doi: 10.1080/15226510801913934.
Ziska L, Namuco O, Moya T, Quilang J. 1997. Growth and yield response of field-grown tropical rice to increasing carbon dioxide and air temperature. Agronomy Journal 89:45–53. doi: 10.2134/agronj1997.00021962008900010007x.