climate change, co and allergies: the atmospheric co2 ... · 3 2. co 2, plants and contact...
TRANSCRIPT

1
Lewis H. Ziska, USDA-ARS
Thanks to:Linda Ford, MD American Lung Association, Omaha, NE
James Straka, PhD, Macalester College, St. Paul, MNDavid Frenz, MD, the Bethesda Clinic, St. Paul, MNJonathan Patz, MD Johns Hopkins, Baltimore, MD
Dennis Gebhard, Multidata Inc., St. Paul, MNPaul Epstein, MD, Harvard, Boston, MA
Climate Change, CO2 and Allergies: the
Plant Perspective.
COLA allergy conference
Atmospheric CO2
So what if CO2 goes up?
1990 1995 2000 2005 2010
CO
2 Em
issi
ons
(GtC
y-1)
5
6
7
8
9
10Actual emissions: CDIACActual emissions: EIA450ppm stabilisation650ppm stabilisationA1FI A1B A1T A2 B1 B2
20062005
2007
I. An indirect effect of rising carbon dioxide: warmer temperatures.
0.05 to 1.00
Water (H2O)
0.04 up to 0.100
Carbon Dioxide (CO2)
0.93Argon (Ar)
20.1Oxygen (O2)
78.1Nitrogen (N2)
%Gas
No H2O and CO2? Surface temperature would be –18oC. With H2O and CO2? Surface temperature is 15oC.
H2O vs. CO2Poles
Deserts
Winter
If water vapor is high, it will be the dominant warming gas….little effect of CO2If water vapor is low, adding CO2 will increase the surface temperature.
Equator
altitude
Polar Melting.CO2, warming and public health.
• Changes in range of insect or rodent borne diseases.
• Changes in water or seafood borne diseases.
• Increasing ground-level ozone, and respiratory ailments.
• Contamination of drinking water due to excessive flooding.
• Heat-related deaths / fewer cold related.

2
So what if CO2 goes up?, Part II, direct impacts
Carbon dioxide is the source of carbon for photosynthesis, and consequently for 99% of all life.
CO2 + H2O + light → O2 + organic C + chemical energy
Nutrients, H2O
CO2
Food, GloriousFood!
Plants are Important.
“People who imagined that life on earth consisted of animals moving against a green background, seriously misunderstood what they were seeing. That green background was busily alive. Plants grew, moved, twisted and turned, fighting for [resources]; and they interacted continuously with animals—discouraging some with bark and thorns, poisoning others, and feeding still others with pollen and seeds. It was a complex, dynamic process…one which most people didn’t understand. “
Michael Crichton, Page 86, “Jurassic Park”
Plants are necessary for the flow of energy and carbon through ecosystems. 90% of all living matter consists of plant life.
With the exception of a few subterranean organisms, if plantsdid not exist, life would not exist.
Plant growth however is dependent on four physical inputs.
Any perturbation in these inputs will alter all living systems.
But isn’t more plant growth desirable?
“We are living in an increasingly lush environment of plants and animals as a result of the carbon dioxide increase. This is a wonderful and unexpected gift from the industrial revolution.”WSJ
CO2 is a VERY smart molecule.
Green is not always good.
How can plants affect public health?How can plants affect public health?Some direct effects:Some direct effects:
Allergies / Asthma:Allergies / Asthma:Contact dermatitis:Contact dermatitis:Poison/Toxicology:Poison/Toxicology:
3. CO2, plants and poison
Devils trumpet
Deadly Nightshade
Wolfsbane
Suicide tree
Apple of Sodom
Stinging nettle
Death Camas

3
2. CO2, plants and contact dermatitis
Can rising CO2 alter plant based dermatitis?
The Duke University FACE Site: State of the Art.
Poison ivy at Duke Face ring.
Poison ivy plants grow faster at elevated CO2
1999 2000 2001 2002 2003 20040
1
2
3
4
5
6
7
8
9
10370 ul/l
570 ul/l
Poison ivy allergenicity
Elevated CO2
Ambient CO2
saturatedα−monoeneβ−monoenedienetriene
Uns
atur
ated
:Sat
urat
ed C
ogen
ers
0
5
10
15
20
**
Ambient Elevated
Duke University, USDA study, PNAS 103:9086-9089
1. CO1. CO22, plants and allergies, plants and allergies
Principle Fall Allergen
~35 million sufferers
Common ragweed.

4
Determining Ragweed Pollen Determining Ragweed Pollen
ProductionProduction
Sampling pollen from ragweed catkins.
Response of common ragweed to CO2
0
100
200
300
400
280280 600600370370
g plantg plant--11
Chamber Study, USDAFunctional Plant Biology 27:893-898Functional Plant Biology 32:667-670
• Pollen Production280 ppm 4.8 g370 ppm 10.9 g*600 ppm 20.5 g*
Antigen Amb a1 ELISA / mg protein280 ppm 4490370 ppm 5290600 ppm 8180*
Ragweed in real lifeAll this is “blue-sky” hypothetical &*^$%# anyway. It won’t happen in real-life, and even if it does, temperature and carbon dioxide effects are a long ways away.
Mauna Loa, “Official” CO2 data.
10,000 feet on a mountaintop in Hawaii.
Is the rise in COIs the rise in CO22 the same the same everywhere?everywhere?
Change in average day-time CO2 concentration (ppm) from downtown Baltimore to an organic (rural) farm.
300
400
500
Farm Park City
386.2402.2
455.5
Is the increase in temperature the same?
• Change in average daily temperature (oC) from downtown Baltimore to an organic (rural) farm (2002).
15
17
19
21
23
Farm Park City
19.120.7
18.6
Urbanization and climate change.Daytime Carbon Dioxide (ppm)
Location 2002 2003 2004 2005___________________________________
Rural 381 373 380 386Suburban 394 370 400 413Urban 458 520 456 458____________________________________
Daytime Air Temperature (oC)
Location 2002 2003 2004 2005___________________________________
Rural 25.1 22.5 24.4 25.3Suburban 25.8 23.9 25.3 26.0Urban 26.6 24.7 26.3 27.2____________________________________
Night-time Temperature (oC)
Location 2002 2003 2004 2005___________________________________
Rural 19.6 18.0 19.0 19.0Suburban 19.3 18.6 19.2 19.3Urban 22.3 21.3 22.5 22.7____________________________________
Change in season length (days)
2002 2003 2004 2005___________________________________
Urban-Rural 36 41 52 39____________________________________
Day of year
210 215 220 225 230 235 240 245
Ave
rage
day
time
CO
2 diff
eren
ce (u
rban
-rur
al)
0
20
40
60
80
100
120
140
Average = 89.0+9.9
Are these differences consistent?
What about other meteorological variables?
Day of Year (2004)
100 120 140 160 180 200 220 240 260 280
8-h
ozon
e av
erag
e (n
l O3 l
-1 o
f air)
0
10
20
30
40
50
60
70
80
90
8-h daytime ozone. 2004 season
CO2 differencesAugust, 2004
Overall: Urban-induced increases in carbon dioxide, air temperature and growing season are consistent with most IPCC near-term scenarios. With the exception of N deposition, othervariables did not differ consistency, but N low relative to soil N.
George et al. Oecologia, 159:637-647 .
5
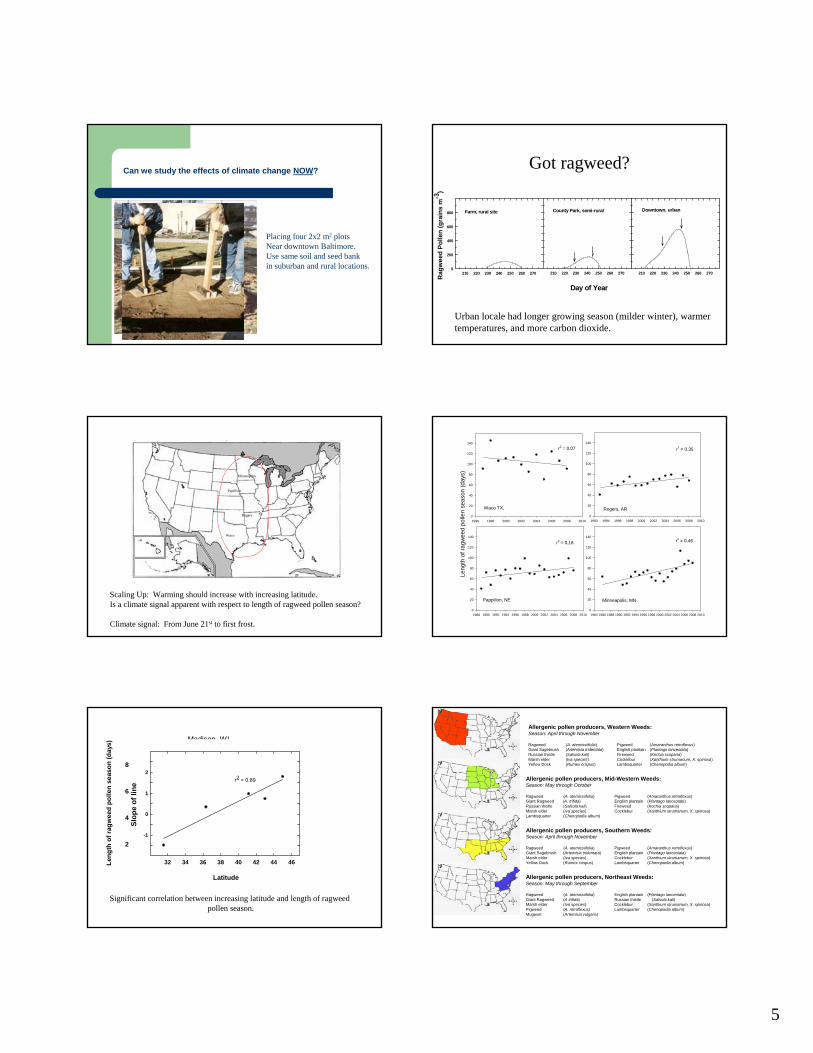
Can we study the effects of climate change NOW?
Placing four 2x2 m2 plots Near downtown Baltimore.Use same soil and seed bankin suburban and rural locations.
2006
Got ragweed?
210 220 230 240 250 260 270
Rag
wee
d Po
llen
(gra
ins
m-3
)
0
200
400
600
800
210 220 230 240 250 260 270 210 220 230 240 250 260 270
Farm, rural site County Park, semi-rural Downtown, urban
Day of Year
Urban locale had longer growing season (milder winter), warmertemperatures, and more carbon dioxide.
Scaling Up: Warming should increase with increasing latitude. Is a climate signal apparent with respect to length of ragweed pollen season?
Climate signal: From June 21st to first frost.
Waco
Rogers
Papillion
Minneapolis
1996 1998 2000 2002 2004 2006 2008 20100
20
40
60
80
100
120
140
r2 = 0.07
Waco TX,
1992 1994 1996 1998 2000 2002 2004 2006 2008 20100
20
40
60
80
100
120
140
r2 = 0.35
Rogers, AR
1988 1990 1992 1994 1996 1998 2000 2002 2004 2006 2008 20100
20
40
60
80
100
120
140
Pappilion, NE
r2 = 0.18
1984 1986 1988 1990 1992 1994 1996 1998 2000 2002 2004 2006 2008 20100
20
40
60
80
100
120
140r2 = 0.46
Minneapolis, MN
Leng
th o
f rag
wee
d po
llen
seas
on (d
ays)
Madison, WI
1970 1980 1990 2000 2010
20
40
60
80
r2 = 0.44
Leng
th o
f rag
wee
d po
llen
seas
on (d
ays)
Latitude
32 34 36 38 40 42 44 46
Slop
e of
line
-1
0
1
2r2 = 0.89
Significant correlation between increasing latitude and length of ragweed pollen season.
Allergenic pollen producers, Northeast Weeds:Season: May through September
Ragweed (A. atemissiifolia) English plantain (Plantago lanceolata)Giant Ragweed (A trifida) Russian thistle (Salsola kali) Marsh elder (Iva species) Cocklebur (Xanthium strumarium, X. spinosa)Pigweed (A. retroflexus) Lambsquarter (Chenopodia album)Mugwort (Artemisia vulgaris)
Allergenic pollen producers, Mid-Western Weeds:Season: May through October
Ragweed (A. atemissiifolia) Pigweed (Amaranthus retroflexus)Giant Ragweed (A. trifida) English plantain (Plantago lanceolata)Russian thistle (Salsola kali) Fireweed (Kochia scoparia)Marsh elder (Iva species) Cocklebur (Xanthium strumarium, X. spinosa)Lambsquarter (Chenopodia album)
Allergenic pollen producers, Southern Weeds:Season: April through November
Ragweed (A. atemissiifolia) Pigweed (Amaranthus retroflexus)Giant Sagebrush (Artemisia tridentata) English plantain (Plantago lanceolata)Marsh elder (Iva species) Cocklebur (Xanthium strumarium, X. spinosa)Yellow Dock (Rumex crispus) Lambsquarter (Chenopodia album)
Allergenic pollen producers, Western Weeds:Season: April through November
Ragweed (A. atemissiifolia) Pigweed (Amaranthus retroflexus)Giant Sagebrush (Artemisia tridentata) English plantain (Plantago lanceolata)Russian thistle (Salsola kali) Fireweed (Kochia scoparia)Marsh elder (Iva species) Cocklebur (Xanthium strumarium, X. spinosa)Yellow Dock (Rumex crispus) Lambsquarter (Chenopodia album)

6
8 10 12 14
1213
1415
1617
leaf C:N
ln(A
.alte
rnat
a sp
ores
/ gr
am le
af)
ln(spores) = 10.56 + 0.34*C:N
experimental timothy grassfield-collected grass mixture
Fungal decomposition of plants.
Alternaria alternata has been associated with a number of respiratory problems such as rhinitis, asthma, allergic dermatitis and allergic sinusitis. The spores are the cause of the allergic reactions. Rising CO2 increases C:N ratios, with subsequent effects on spore production.
How can plants affect public health? How can plants affect public health?
Some indirect effectsSome indirect effects::
•Nutrition.
•Medicines / Narcotics.
•Disease vector biology.
•Pesticide use.
1. CO2 and human nutrition.
Recent cooperative work with NIH indicates an increase in omega-3-fatty acids in mung bean with rising CO2.
Percent change in protein concentration with elevated CO2
-20 -15 -10 -5 0 5
Potato
Soybean
Wheat
Rice
Barley
2a. CO2, plants and medicine
________________________________________________________________Drug Action/Clinical Use Species_________________________________________________________________
Acetyldigoxin Cardiotonic Digitalis lanataAllyl isothiocyanate Rubefacient Brassica nigraAtropine Antichotinergic Atropa belladonnaBerberine Bacillary dysentery Berberis vulgarisCodeine Analgesic, antitussive Papaver somniferumDanthron Laxative Cassia spp.L-Dopa Anti-Parkinson Mucuna spp.Digitoxin Cardiotonic Digitalis purpureaEphedrine Antihistamine Ephedra sinicaGalanthamine Cholinesterase inhibitor Lycoris squamigeraKawain Tranquilizer Piper methysticumLapachol Anti-cancer, anti-tumor Tabebuia spp.Ouabain Cardiotonic Strophanthus gratusQuinine Anti-malarial Cinchona ledgerianaSalicin Analgesic Salix albaTaxol Anti-tumor Podophyllum peltatumVasicine Cerebral stimulant Vinca minorVincristine Anti-leukemic agent Catharanthus roseus_________________________________________________________________
Approximately 15% of all current pharmaceuticals in developed countries are derived solely from plants (85% in undeveloped countries).
Alkaloids derived from plants
AtropineCaffeine
Cocaine
CodeineMorphine
Nicotine
Scopolamine Thebaine
Atropine and scopolamineAtropine and scopolamine

7
Cure for malaria?Cure for malaria?
Artemisia annua
artemisinin
2b. CO2b. CO22, plants and narcotics., plants and narcotics.
Effects unknown Growth increases. Anecdotal evidence
Papaver setigerum DC.Papaver setigerum DC.(Wild poppy)(Wild poppy)
Quantify growth and alkaloid production to carbon dioxide
300 ppm ~1950
400 ppm Current
500 ppm ~2050
600 ppm ~2090
Papaver setigerumA
bove
gro
und
biom
ass
at m
atur
ity (g
)
0
5
10
15
20
25
Leaf
are
a at
mat
urity
(cm
2 )
0
500
1000
1500
2000
2500
300 400 500 600
CO2 concentration (µmol mol-1)
P. setigerum is sensitive to even small (100 ppm) increases in carbon dioxide.
Greatest relative stimulation has occurred with recent (last few decades) CO2 increase.
Averages P-value
Variable 300 400 500 600 CO2 Effect____________________________________________________________
Capsule No. 14.6 29.4 32.9 52.1 ***
Capsule Wt. (g) 1.44 2.47 3.55 4.30 ***
Latex (mg) 97 198 259 363 ***
Morphine (%) 2.20 2.34 2.56 2.67 0.06
Concentration of other alkaloids did not increase with increasing CO2.
Alk
aloi
d pr
oduc
tion
(mg
per p
lant
)
0
5
10
15
CO2 concentration (µmol mol-1)300 400 500 600
0
10
20
30
40
300 400 500 600
r2 = 0.98r2 = 0.81
r2 = 0.99
r2 = 0.95
A. Morphine B. Codeine
C. Papaverine D. Noscapine
a
b
c
d
a
b
b
c
a
a
b
c
a
bb
c
3-4 x increase in alkaloid production in wild poppy with recent and projected CO2 increases. Accepted in Climatic Change

8
Nicotine production
Nic
otin
e pe
r pla
nt (m
g)
0
20
40
60
80
100
120
Col 1 vs Col 2 Plot 1 RegrCol 1 vs Col 4 Plot 2 RegrCol 1 vs Col 6 Plot 3 Regr
Days after sowing (DAS)
25 30 35 40 45 50 550
20
40
60
80
100
120
294 µatm.378 µatm.690 µatm.
A.
B.
Nicotine Concentration
294 ppm 4.7 µg g-1
378 ppm 4.4 µg g-1
690 ppm 3.6 µg g-1
3. CO3. CO22, plants and disease vectors, plants and disease vectorsplants are not vectors per se, but:plants are not vectors per se, but:
CO2 / temperature
Hanta virus Nectar & pollen
4. CO4. CO22, plants and pesticide usage., plants and pesticide usage.
As carbon dioxide increases, glyphosate efficacy is reduced
Why can’t we just control these weeds?
Ambient CO2 Future CO2
Canada thistle: Best of the worst.
0.0
0.5
1.0
1.5
2.0
2.5
3.0
Shoot Root
2000 2001
*
*
*a
b
0.0
0.5
1.0
1.5
2.0
2.5
3.02003
Shoot ShootRoot Root
*
*
b
a
Elev
ated
/ A
mbi
ent
Canada Thistle
3 years of field trials at +250 ppm above ambient.
A synopsis of COA synopsis of CO22 impacts on herbicide efficacyimpacts on herbicide efficacy
Gro
wth
rate
(g /
day)
0.0
0.5
1.0
1.5
2.0
Can
ada
this
tle
Can
ada
this
tle1
Lam
bsqu
arte
rs (d
eath
)
Red
-roo
t pig
wee
d (d
eath
)
Qua
ckgr
ass
(dea
th)
0.0
0.5
1.0
1.5
2.0
Can
ada
this
tle
Can
ada
this
tle1
Lam
bsqu
arte
rs
Red
-roo
t pig
wee
d Qua
ckgr
ass
A.
B.
Efficacy is reduced in a number of studies. The basis for the reduction isnot entirely known. However, if more pesticides are needed to kill weeds, thenmore trace chemicals are likely in theenvironment.
Climate change, plants and public healthClimate change, plants and public health
Direct EffectsDirect EffectsAllergiesAllergiesContact dermatitisContact dermatitisToxicologyToxicology
Indirect EffectsIndirect EffectsNutrition/Food SupplyNutrition/Food SupplyMedicine / NarcoticsMedicine / NarcoticsSpread of disease vectorsSpread of disease vectorsIncreased pesticide use.Increased pesticide use.

9
Research and Education.
Investment in AgriculturalResearch, United States.
0
200
400
600
800
1,000
1,200
2005 2006 2007 2008
ARSby year
Highlights:
1999, 10 scientists, own lab
2008, National Program onclimate change eliminated.
2009, 3 scientists, no lab, no national program. 52, 60, 61.