rights / license: research collection in copyright - non ...14495/... · impact of process...
TRANSCRIPT
Research Collection
Doctoral Thesis
Impact of Process Parameters on Cell Growth, Metabolism andAntibody Glycosylation
Author(s): Ivarsson, Marija
Publication Date: 2014
Permanent Link: https://doi.org/10.3929/ethz-a-010239626
Rights / License: In Copyright - Non-Commercial Use Permitted
This page was generated automatically upon download from the ETH Zurich Research Collection. For moreinformation please consult the Terms of use.
ETH Library

DISS. ETH NO. 22069
Impact of Process Parameters on Cell Growth,
Metabolism and Antibody Glycosylation
A thesis submitted to attain the degree of
DOCTOR OF SCIENCES of ETH ZURICH
(Dr. sc. ETH Zurich)
presented by
MARIJA IVARSSON
Dipl.-Ing. University of Natural Resources and Applied Life Sciences, Vienna
born on April 4th, 1986
citizen of Croatia
accepted on the recommendation of
Prof. Massimo Morbidelli, examiner
Prof. Markus Aebi, co-examiner
Dr. Miroslav Soos, co-examiner
2014


“The process is the product.”


I
Acknowledgements
My gratitude goes to Prof. Massimo Morbidelli who gave me the opportunity to work
in his group. I appreciate the freedom he gave me with my research. I wish to thank
him for his trust and the scientific guidance and support. Also I would like to thank
Prof. Markus Aebi for agreeing to be co-examiner, and him and his group, in particular
Dr. Robert Gauss and Chia-wei Lin, for useful scientific discussions.
From the scientific point of view, my greatest thanks go to Dr. Miroslav Soos for his
supervision over the last 4 years. I am impressed by his dedication to research and his
indefatigable patience. Likewise, I would like to thank all my colleagues from
upstream, in particular Benjamin Neunstöcklin, Thomas Villiger, Jochen Sieck, Daniel
Karst and Vania Bertrand for sharing their knowledge with me and for fruitful
discussions. Also my colleagues from downstream, especially Thomas Müller-Späth,
Martin Krättli, David Getaz, Bertrand de Neuville and Bertrand Guelat, who always
gave me the feeling of being part in their team and helped me solving technical
problems with my HPLC.
I am indebted to my Master thesis students Robin, Teja, Heeju and Tobias. My thanks
go to the Functional Genomic Center Zurich for MALDI TOF measurements and Dr.
Peter Gehrig for sharing his expertise with me. I would further like to thank Adriana
Primorac-Sliwa for her help with the real-time PCR measurements. I also acknowledge
the funding of the European Union in the frame of the OPTICO project and the
resulting collaboration with Prof. Mantalaris’ group from Imperial College London. I
particularly enjoyed the collaborative work with David Garcia-Münzer and Chon
Usaku.
Of course, a big thank you goes to all my colleagues, co-workers and lab mates from
the Morbidelli group. I spent a wonderful time in the group and we shared great
moments together, not only in the lab but also at conferences and outside the lab.
Thank you for providing me with an amazing working atmosphere, which made
coming to Hönggerberg every day something to look forward to. Especially, I would
like to thank Stefano Lazzari, Bertrand de Neuville, Fabio Codari, Paolo Arosio and

Benjamin Neunstöcklin, who, apart from being great colleagues, also became great
friends.
I am very grateful to my parents and my sister for their everlasting and doubtless
support. I thank them for the education that I received and for standing behind all my
decisions.
A very special thank you goes to my husband, Mattias, for his love and his support, the
patience and encouragement he gives me every day. I am very lucky to have you by
my side.

III
Abstract
Bioreactor process parameters influence the growth behavior and metabolism of
mammalian cell culture, and the quality of the produced monoclonal antibodies
(mAbs). A systematic assessment of their impact allows for a better link between
process-related parameters and cellular processes, such as N-linked glycosylation,
lactate metabolism and cell cycle transition. Thus, understanding the effect of process
parameters is a prerequisite for providing better controllability over cell growth,
productivity and mAb critical product quality.
Initially, we investigated the effect of single and combined process parameters on the
glycan microheterogeneity of an IgG1 antibody using a shift-experiment procedure in
batch culture of a hybridoma cell line. The N-linked glycosylation profile of the
murine IgG1 was found to be highly complex since it included terminal galactosylation
and sialylation, as well as variable core-fucosylation. Within a pH range of 6.8 to 8.0,
differences in galactosylation and sialylation of approximately 50% were obtained.
Variation of dissolved O2 (10 – 90% air saturation) resulted in a maximum variability
of 20% in galactosylation and 30% in sialylation. In contrast, no significant effect on
the glycosylation profile was observed when osmolarity increased from 320 to 420
mOsm/kg and sparging from 0.05 to 0.2 vvm.
Apart from its role in glycosylation, pH alteration during the early exponential growth
phase was found to control lactate formation and consumption. In particular, lactate
consumption was induced even at high glucose concentrations at pH 6.8, whereas
highly increased production of lactate was obtained at pH 7.8. Lactate accumulation in
mammalian cell culture is known to impede cellular growth and productivity.
Consequently, constraint-based metabolic flux analysis was used to examine pH-
induced metabolic states in the same growth state. We demonstrated that lactate influx
at pH 6.8 led cells to maintain high fluxes in the TCA cycle and malate-aspartate
shuttle resulting in a high ATP production rate. In contrast, under increased pH
conditions, less ATP was generated and different ATP sources were utilized. Gene
expression analysis led to the conclusion that lactate formation at high pH was enabled
by gluconeogenic pathways in addition to facilitated glucose uptake. The obtained

IV ABSTRACT
results provide new insights into the influence of pH on cellular metabolism, and are
of importance when considering pH heterogeneities typically present in large-scale
industrial bioreactors.
On industrial scale, fed-batch processes are mainly used for mammalian cell
cultivation and protein production. Cell productivity in fed-batch processes can be
increased by cell cycle arrest through mild hypothermia. Since hypothermia can
simultaneously reduce cell growth, which is regulated by the cell cycle, temperature
shifts have to be considered on the cell cycle level. Consequently, the time point for
the temperature shift is important and requires optimization. An unstructured cell cycle
model including the distribution of proliferating (G1, S, G2/M) and arrested cells (G0)
has been proposed in order to predict the time point of temperature shift in fed-batch
culture. The mathematical model is generally applicable and a procedure on how to
evaluate the required model parameters is described. The parameters are estimated
from batch and fed-batch cultivations, each carried out once at 37 °C and once at 33
°C in order to characterize temperature dependency. The batch cultures are also used
to evaluate substrate depletion and fed-batch cultures are used to study the impact of
metabolite accumulation on the cell cycle, in particular on the quiescent cell cycle
phase. The reliability of the proposed procedure for parameter estimation is validated
using a mAb-producing hybridoma cell culture and the model predicts hypothermic
transitions within the cell population at different shift time points. Thus, this
framework can be used to optimize the time point of the temperature shift, which is
commonly adjusted in industrial fed-batch processes in order to obtain a good balance
between temperature induced growth limitation and cell cycle specific enhanced
productivity.
In this work, a better understanding of bioprocess-related parameters affecting growth,
metabolism and critical quality attributes under the scope of quality by design (QbD)
is provided and can bring us one step closer towards stable process performance while
ensuring desired glycosylation for therapeutic proteins.
V
Zusammenfassung
Prozessparameter in Bioreaktoren bestimmen das Wachstumsverhalten sowie den
Stoffwechsel tierischer Zellen und beeinflussen gleichzeitig die Qualität der
produzierten monoklonalen Antikörper (mAb). Für eine bessere Verknüpfung von
prozessabhängigen Parametern und zellulären Prozessen, wie Glykosylierung,
Laktatstoffwechsel und Zellzyklus, bedarf es einer systematischen Untersuchung der
einzelnen Parametereinflüsse. Eine solche Untersuchung ist daher eine Voraussetzung
für die bessere Kontrolle des Zellwachstums, der Produktivität und der kritischen mAb
Qualtität.
In dieser Arbeit wurden HFN 7.1 Hybridomazellen zunächst im Batch-Modus
kultiviert und während der exponentiellen Wachstumsphase die Veränderung einzelner
sowie kombinierter Prozessparameter vorgenommen. Auf diese Weise konnten die
Parametereinflüsse auf die Verteilung der Glykanstrukturen eines IgG1 Moleküles
untersucht werden. Aufgrund terminaler Galaktosylierung and Sialylierung, sowie
variabler Fukosylierung, stellte sich das N-Glykosylierungprofil als äussert komplex
dar. Die Unterschiede in terminaler Galaktosylierung und Sialylierung innerhalb eines
pH-Bereiches von 6.8 bis 8.0 lagen bei ungefähr 50%, wohingegen die Variation des
Gelöstsauerstoffes (10 – 90% Luftsättigung) in einer Änderung von 20% in
Galaktosylierung und 30% in Sialylierung resultierte. Im Gegensatz dazu, führte eine
abrupte Veränderung der Osmolarität in einem Bereich zwischen 320 und 420
mOsm/kg, sowie eine Änderung der Begasungsraten von 0.05 bis 0.2 vvm zu keinem
Unterschied im Glykosylierungsprofil.
Neben dem signifikanten Einfluss auf die N-Glykosylierung, konnte gezeigt werden,
dass gezielte Veränderungen des pH Wertes während der früh-exponentiellen
Wachstumsphase zur Kontrolle der Laktatproduktion und der Laktataufnahme
verwendet werden können. Genauer gesagt, bewirkte eine Erniedrigung des pH Wertes
auf 6.8, selbst bei hoher Glukose Konzentration die Aufnahme von Laktat. Eine
Erhöhung des pH Wertes auf 7.8 führte hingegen zu einer deutlich gesteigerten
Laktatproduktion. In diesem Zusammenhang ist zu erwähnen, dass Laktat-

VI ZUSAMMENFASSUNG
Akkumulation in der tierischen Zellkultur für ein schlechteres Zellwachstum und eine
erniedrigte mAb Produktivität verantwortlich ist. Folglich wurden die durch pH
Modifikation hervorgerufenen Stoffwechselzustände mit Hilfe einer Stoffflussanalyse
untersucht. Die Berechnung der intrazellulären Flüsse zeigte deutlich, dass der
Einstrom von Laktat bei pH 6.8 zu hohen Flussraten innerhalb des Citratzyklus und
des Malat-Aspartat-Shuttles führte und vermehrt ATP produziert wurde. Bei hohen pH
Werten hingegen wurde unter der Verwendung von anderen Stoffwechselwegen,
verhältnismäßig weniger ATP generiert. Ferner, konnte durch eine
Genexpressionsanalyse aufgezeigt werden, dass die erhöhte Laktatproduktion bei
hohem pH Wert sowohl aufgrund der Aktivierung des gluconeogenetischen
Stoffwechselweges, als auch durch gesteigerte Glukoseaufnahme bedingt war. Diese
Ergebnisse liefern neue Einblicke in die Wirkungsweise von unterschiedlichen pH
Werten auf den Zellstoffwechsel und sind hinsichtlich der in industriellen
Produktionsbioreaktoren vorkommenden pH Heterogenitäten von Bedeutung.
Im industriellen Maßstab werden in der tierischen Zellkultur für die Proteinherstellung
überwiegend Fed-Batch-Prozesse eingesetzt. Die Kultivierung der in dieser Studie
eingesetzten Hybridomazellen im Fed-Batch-Modus, führte zu einer Verdoppelung der
Zellkonzentration, sowie des Produkttiters. Des weiteren wurde gezeigt, dass
Hypothermie während einer Fed-Batch Kultivierung Auswirkungen auf den Zellzyklus
und somit auf das Zellwachstum und die Produktivität haben kann. Zellwachstum und
Zellteilung sind Prozesse, die durch den Zellzyklus reguliert sind. Aus diesem Grund
wurde ein mathematisches Model des Zellzykluses entwickelt, welches die Verteilung
in proliferierende (G1, S, G2/M) und ruhende Zellen (G0) berücksichtigt. Hiermit
konnte der Einfluss von Temperaturänderungen von 37 °C auf 33 °C in Batch und
Fed-Batch Kulturen vorhergesagen werden. Das Model ist fähig hypothermische
Übergänge innerhalb einer Zellpopulation zu beschreiben und Auswirkungen einer
Temperaturveränderung zu unterschiedlichen Zeitpunkten vorherzusagen. Überdies
können Einflüsse von Substraterschöpfung und Metabolitakkumulation vorausgesagt
werden. Die lebende Zellkonzentrationen, der wesentliche Stoffwechsel sowie die
resultierenden Antikörperkonzentrationen in Batch und Fed-Batch wurden bei zwei
unterschiedlichen Temperaturen modelliert und experimentell validiert. Zielsetzung ist

eine Optimierung des Zeitpunktes, an dem eine Temperaturänderung vorzunehmen ist
um ein gutes Gleichgewicht zwischen temperaturbedingter Wachstumslimitation und
erhöhter zellzyklusspezifischer Produktivität zu erhalten.
Durch diese Arbeit konnte ein besseres Verständnis prozessabhängiger Parameter und
deren Auswirkung auf das Wachstum, den Stoffwechsel und die kritische
Produktqualität gewonnen werden. Diese Arbeit ist ein weiterer Schritt in Richtung
verbesserter Prozessstabilität mit dem Ziel die Glykosylierung von zukünftigen
therapeutische Proteinen besser kontrollieren zu können.


IX
Table of Contents
Acknowledgements .......................................................................................................... I
Abstract ......................................................................................................................... III
Zusammenfassung .......................................................................................................... V
1 Introduction ............................................................................................................. 1
1.1 Mammalian Cell Culture Technology ............................................................... 1
1.2 Operating Conditions in Bioreactor Systems .................................................... 3
1.3 Glycosylation of Monoclonal Antibodies ......................................................... 4
2 Evaluating the Impact of Cell Culture Process Parameters on Monoclonal
Antibody N-Glycosylation ............................................................................................. 7
2.1 Introduction ....................................................................................................... 7
2.2 Material and Methods ........................................................................................ 9
2.2.1 Cell Line and Cell Culture .......................................................................... 9
2.2.2 Monoclonal Antibody Purification ........................................................... 10
2.2.3 Calculations .............................................................................................. 11
2.3 Results and Discussion .................................................................................... 13
2.3.1 Process Parameter Shift Experiments ....................................................... 13
2.3.2 Growth Rate Dependency on Bioreactor Process Parameters .................. 14
2.3.3 Analysis of N-linked Glycan Microheterogeneity ................................... 17
2.3.4 Variation in N-linked Glycan Microheterogeneity .................................. 18
2.3.5 Impact of Chemical and Mechanical Stress Parameters on N-linked
Glycan Microheterogeneity ................................................................................... 21
2.4 Conclusions ..................................................................................................... 26
2.5 Remark ............................................................................................................ 26
3 Insights into pH-induced Metabolic Switch by Flux Balance Analysis ................ 27

X TABLE OF CONTENTS
3.1 Introduction ..................................................................................................... 27
3.2 Material and Methods ...................................................................................... 29
3.2.1 Cell Line and Media ................................................................................. 29
3.2.2 Bioreactor Setup and pH Shift Experiments ............................................ 29
3.2.3 TaqMan® Gene Expression Assay ........................................................... 30
3.2.4 Flux Balance Analysis (FBA) .................................................................. 31
3.3 Results and Discussion .................................................................................... 33
3.3.1 Characteristics of Cell Growth and Metabolism ...................................... 33
3.3.2 Metabolic Flux Distribution of Standard Cultivation during Exponential
Growth Phase ......................................................................................................... 37
3.3.3 Metabolic Flux Distribution in Lactate Production and Lactate
Consumption State ................................................................................................. 38
3.3.4 Metabolic Flux Distribution in Unfavorable Lactate Over-Production
State 40
3.3.5 Consequences of pH-Shifts on the Energy Metabolism ........................... 43
3.3.6 Relevance of pH-induced Metabolic States for the Design and Scale-up of
Industrial Bioprocesses .......................................................................................... 45
3.4 Conclusions ..................................................................................................... 46
3.5 Remark ............................................................................................................ 47
4 An Unstructured Model of Metabolite and Temperature Dependent Cell Cycle
Arrest in Hybridoma Batch and Fed-Batch Cultures .................................................... 49
4.1 Introduction ..................................................................................................... 49
4.2 Materials and Methods .................................................................................... 51
4.2.1 Cell line and Media................................................................................... 51
4.2.2 Shake Flask Batch Culture ....................................................................... 51
4.2.3 Fed-Batch Cell Culture ............................................................................. 52

TABLE OF CONTENTS XI
4.2.4 Cell Cycle Analysis .................................................................................. 53
4.2.5 Metabolic Profiling ................................................................................... 53
4.2.6 Extracellular Antibody Quantification ..................................................... 54
4.3 Modeling Aspects ............................................................................................ 54
4.3.1 Model Structure ........................................................................................ 54
4.3.2 Temperature Dependent Population Transition ....................................... 58
4.3.3 Global Sensitivity Analysis and Parameter Estimation ............................ 59
4.4 Results ............................................................................................................. 60
4.4.1 Global Sensitivity Analysis and Parameter Estimation ............................ 60
4.4.2 Temperature Shifted Batch Cultures ........................................................ 63
4.4.3 Temperature Shifted Fed-Batch Cultures ................................................. 66
4.4.4 Prediction of Temperature Shift Time in Fed-Batch Cultures ................. 70
4.5 Discussion ....................................................................................................... 74
4.6 Conclusions ..................................................................................................... 75
4.7 Remark ............................................................................................................ 76
5 Concluding Remarks ............................................................................................. 77
6 Outlook .................................................................................................................. 79
7 Appendix ............................................................................................................... 81
7.1 Appendix for “Evaluating the Impact of Cell Culture Process Parameters on
Monoclonal Antibody N-Glycosylation” .................................................................. 81
7.1.1 Deglycosylation by PNGase F and 2-AB Labeling .................................. 81
7.1.2 HPLC Separation of 2-AB Labeled Oligosaccharides ............................. 81
7.1.3 N-linked Oligosaccharide Analysis by Matrix-Assisted Laser
Desorption/Ionization Time-Of-Flight (MALDI-TOF) Mass Spectrometry (MS)82
7.2 Appendix for “Insights into pH induced Metabolic Switch by Flux Balance
Analysis” ................................................................................................................... 86

XII TABLE OF CONTENTS
7.2.1 Gene Expression Analysis ........................................................................ 86
7.2.2 Metabolic Network for Flux Balance Analysis ........................................ 88
7.2.3 Calculated Intracellular Fluxes from Flux Balance Model ...................... 96
7.3 Appendix for “An Unstructured Model of Metabolite and Temperature
Dependent Cell Cycle Arrest in Hybridoma Batch and Fed-Batch Cultures” .......... 99
7.3.1 Model Parameter Estimation .................................................................... 99
8 References ........................................................................................................... 101
9 Figure and Table Index ........................................................................................ 123
9.1 List of Figures ............................................................................................... 123
9.2 List of Tables ................................................................................................. 127

1
1 Introduction
Around 30% of all drugs approved by the European Medical Agency (EMA) up to
2012 were biologically-derived. Among them glycoproteins are the largest and fastest
growing group [1]. Mammalian cells are the predominant production system of
glycoproteins due to their ability to express large proteins and perform post-
translational modifications, such as glycosylation [2]. Therapeutic glycoproteins
require glycosylation for their biological function, and mammalian cells possess the
machinery to provide proper glycosylation that is human-like and therefore shows a
reduced risk of immunogenicity [3]. Only recent advances in yeast and plant
technology have led to the first approvals of a P. pastoris-derived glycoprotein [4],
and a genetically modified plant cell-derived glycoprotein [5] by the US Food and
Drug Administration (FDA). Nonetheless, the use of mammalian cell culture for the
production of complex, large, recombinant proteins for therapeutic or diagnostic
purpose remains unparalleled to date.
1.1 Mammalian Cell Culture Technology
Mammalian cell culture technology has evolved dramatically since its first use for
large-scale vaccine production in the 1960s [6]. The biggest advances in mammalian
cell culture technology included the establishment of continuous, immortal cell lines
that could be grown in suspension in contrast to earlier adherent primary cell lines [7].
Thus, immortal cells, such as baby hamster kidney cells (BHK) for veterinary use, and
later Chinese hamster ovary (CHO), myeloma (Sp2/0, NS0) and human embryonic
kidney (HEK) cells, facilitated the production in large-scale bioreactor systems. Due to
the simpler scale up by volume instead of surface, reactor scales could be extended to
10 000 L systems, such as for the production of interferon alpha in the 1980s [8]. In
addition, immortal cell lines could be genetically modified with emerging recombinant
DNA technology. As a result, tissue-type plasminogen activator protein was the first
commercial recombinant protein produced in a CHO cell line [9].
Over the years a variety of recombinant proteins was generated from mammalian cell
culture such as cytokines, hormones, growth factors, clotting factors, vaccines, fusion

2 CHAPTER 1: INTRODUCTION
proteins and monoclonal antibodies (mAbs) [10], [11]. Since the first approval of a
monoclonal antibody drug in 1987 [12], therapeutic mAbs mainly used for the
treatment of cancer, anti-immune and inflammatory diseases, have witnessed an
incredible growth. Nowadays, they represent the most important drug product class
with currently 40 FDA-approved mAbs, and annual sales of around $ 50 billion [13],
which represents around 40% of the total biologically-derived drug market [11]. The
increase in monoclonal antibody drugs also fostered a corresponding improvement of
the production processes to meet the high product demand of several tons/year [14].
Such a development was achieved by the generation of high-producer cell lines,
mostly CHO cells, using optimal gene amplification systems [15] and by including
growth-promoting genes [16]. Such genetic engineering approaches resulted in a 2-
fold increase in specific productivity [17]. More interestingly, a 20-fold increase in
volumetric productivity could be obtained in the same time frame through
optimization of bioprocess conditions including the control of the culture environment
and the development of chemically defined media and optimized feeding techniques
[7], [17]. As a consequence, newly developed fed-batch production processes are
reported to produce mAb titers of more than 10 g/L [15], [18].
Considering the recent emergence of biosimilar drugs [10], the focus in mammalian
cell culture technology and bioprocess development is shifting increasingly towards
matching given product attributes, rather than aiming exclusively at increased growth
and productivity. Small differences in the three-dimensional structure, charge variants
profile or post-translational modifications of the protein can arise from minor
variations in the production process and can result in differences in drug efficacy in
comparison to the originator drug [19], [20]. Considering post-translational
modifications, different levels of core-fucosylation in the glycosylation pattern have
been shown to have severe consequences on the effector function of a mAb [21]. Thus
the process as a whole has to be put into focus in order to qualify for biosimilarity
[10]. Moreover, methods that can link individual process steps to product quality
require development.

CHAPTER 1: INTRODUCTION 3
1.2 Operating Conditions in Bioreactor Systems
Mammalian cells for the production of recombinant proteins are typically cultured in
stirred tank bioreactors in a scale from 10 L to 20 000 L. Such reactors require a
suitable design to provide proper mixing and mass transfer of oxygen and carbon
dioxide (CO2) [22]. Physical control parameters are the inlet gas flow rate, stirring
speed and temperature, whereas pH, osmolarity, dissolved oxygen (DO) and dissolved
C02 are considered chemical control parameters. Process parameters are used to define
the optimal culture environment that is intended to provide homogenous conditions to
the cultured cells. Sensors and control systems are used to monitor and adjust the
culture environment. pH is controlled through CO2 sparging and base addition, while
constant dissolved oxygen levels are provided by sparging air or oxygen into the
culture at constant gas flow rates. While initial limitations regarding shear stress
sensitivity of mammalian cells by agitation and aeration have been mostly overcome
[23–25], other process parameters are still known to cause variations in growth,
productivity and product quality, in particular during scale-up. pH heterogeneity can
arise from base addition in poorly mixed bioreactors [26]. Poor mixing can possibly
also lead to gradients in temperature and osmolarity due to the addition of base and
feed close to the surface [27]. Insufficient CO2 removal in large-scale bioreactors is
likewise a common problem and is connected to low agitation rates, insufficient gas
transfer and small bubble size [28]. Since high levels of dissolved CO2 negatively
influence cell growth and product quality [27], [29], [30], the presence of different
dissolved CO2 levels in different reactor scales has to be avoided. In this context,
variability in the culture environment and thus in single process parameters should be
linked to cellular processes that are related to growth, productivity and product quality.
By understanding the impact of relevant parameter ranges it should be possible to
better provide optimal operating conditions at all bioreactor scales.
Apart from process parameter control, improvement of the culture media played an
important role in the development of cell culture processes. The adaptation of
mammalian cells to serum-free conditions and the replacement of serum proteins by
chemically defined, protein- and peptide-free media increased process reproducibility,
facilitated downstream processing, excluded the risk of contamination by animal-

4 CHAPTER 1: INTRODUCTION
derived components and led to a general cost reduction [22], [28]. The main
components of chemically defined, commercial or proprietary media are glucose,
amino acids, vitamins, trace elements, inorganic salts and lipids. Determining the
optimal ratio of components requires systematic studies using different available
techniques [31] and is often dependent on the cell line. Likewise the composition of
feed solutions and the feeding strategies need to be investigated with the additional
aim of reducing by-product accumulation (lactate and ammonia). Optimization of
media and feeding strategies has proved to have a dramatic benefit on culture
longevity and specific productivity. More recently, control of glycosylation has also
been achieved by the addition of certain media components [32–37].
1.3 Glycosylation of Monoclonal Antibodies
Monoclonal antibodies of the immunoglobulin G (IgG) isotype are the most common
therapeutic antibodies [38]. An IgG molecule consists of 4 polypeptide chains (2
heavy chains and 2 light chains) that are bound covalently through disulfide bridges.
The target specificity, and thus the antigen binding, of IgG arises from the
hypervariable region formed by the variable domains of the heavy and the light chain.
Two constant domains of the heavy chains form the crystallizable fragment (Fc)-
region that is responsible for the immune effector functions [39]. Activation of
immune effector functions such as antibody-dependent cellular cytotoxicity (ADCC)
or complement-dependent cytotoxicity (CDC) is mostly dependent on the binding to
the FcγRIII receptor and to the C1q component of complement, and triggers a cascade
that ultimately leads to the death of target cells [40]. This mode of action is used by
monoclonal antibodies for treatment of cancer and infectious diseases [41]. Instead,
binding of IgG-Fc to the FcγRIIb receptor is exploited for the treatment of
autoimmune diseases as it leads to a modulation of the immune response [42], [43].
The binding of the Fc region to Fc receptors or the C1q component of complement is
critically dependent on N-linked glycosylation [3], [44], [45]. N-linked glycosylation
of therapeutic monoclonal antibodies implies the presence of oligosaccharide
structures, so called glycans, in the Fc region of the IgG molecule [3]. Glycosylation
of the Fab-fragment which has an involvement in antigen binding affinity [46] and
CHAPTER 1: INTRODUCTION 5
antibody half-life [47], is less common for therapeutic antibodies but has also been
reported [48].
Monoclonal antibodies were initially produced in hybridoma cells formed by the
fusion of a mouse B cell and a human cancer cell [49]. The resulting murine antibodies
are specific to a single antigen, but have the disadvantage of carrying murine-type
glycosylation, which can induce immune reactions in humans. This stimulated further
developments including the generation of chimeric mouse-human antibodies and
humanized antibodies that could reduce immunogenicity [50]. Later, the development
of transgenic mice [51], [52] as well as the use of phage display technology [53]
allowed the production of fully human antibodies, which have replaced hybridoma
cells for monoclonal antibody generation. Nowadays, monoclonal antibodies are
further engineered to overcome immunogenicity, improve their biological function and
their biophysical properties such as solubility and half-life [54–58]. At the same time
bispecific antibodies, as well as antibody-drug conjugates have been developed and are
reviewed elsewhere [59], [60].
In this work, we have cultivated HFN 7.1 hybridoma cells in batch and fed-batch
culture. HFN 7.1 cells produce a murine IgG1 antibody against human fibronectin,
commonly used in diagnostics. The antibody is characterized by high oligosaccharide
content and represents a good model protein for the study of antibody glycosylation. In
Chapter 2, we present a methodology to study the influence of different bioreactor
process parameter ranges on glycan microheterogeneity, in particular on terminal
galactosylation, sialylation and core-fucosylation. The degrees of glycosylation
obtained within relevant process parameter ranges are compared to simultaneous
variations of multiple process parameters and to literature. The study revealed the
importance of pH for IgG glycosylation.
In Chapter 3, the impact of pH alterations on the cellular metabolism was further
investigated. We have identified high pH to cause overexpression of metabolic
enzymes, which results in changes in cell metabolism, in particular the lactate
metabolism. Additionally, high pH showed negative effects on cell growth and
antibody production, whereas low pH improved antibody productivity. At the same

6 CHAPTER 1: INTRODUCTION
time, low pH resulted in reduced lactate accumulation. Flux balance analysis was
applied to give more insight into the redistribution of the main energy metabolism at
different pH values that mimic heterogeneities in large-scale bioreactor systems.
Apart from the implication of process parameters in scale-up, they can be actively used
to optimize process conditions. In this context, hypothermia is known to prolong
culture longevity through its action on the cell cycle. In Chapter 4, an unstructured
model based on cell cycle transition and quiescence that was developed and employed
to predict temperature-shifts in fed-batch culture is presented. At the same time,
metabolic cell cycle arrest, induced by nutrient depletion and production of toxic
metabolites was evaluated and included in the model. The model was able to capture
growth, basic metabolism and mAb production characteristics. Following the
described procedure it can be employed to optimize the temperature shift time point in
order to obtain a good balance between cell growth and productivity.
7
2 Evaluating the Impact of Cell Culture Process
Parameters on Monoclonal Antibody
N-Glycosylation
2.1 Introduction
The relevance of monoclonal antibodies as therapeutic agents against cancer,
autoimmune and inflammatory diseases has been widely recognized. Most of the
mAbs approved to date are based on the immunoglobulin (IgG) isotype, carrying a
consensus N-linked glycosylation site on the CH2 domain of each heavy chain [61]
and further possible, but less common, N-linked glycosylation sites on the antigen-
binding fragment (Fab) [48]. Glycosylation is a complex process of oligosaccharide
attachment to the polypeptide backbone of a protein taking place in the endoplasmic
reticulum (ER) and Golgi apparatus. Presence or absence of certain oligosaccharides
can critically impact mAb stability [62], effector functions [38], immunogenicity [63],
[64], and clearance rate[65], [66], through a clearly defined structure/function
relationship. More precisely, reduced terminal galactosylation decreases complement-
dependent cytotoxicity (CDC) [67–69], absence of core-fucosylation results in
increased antibody-dependent cytotoxicity (ADCC) [70–72], and high sialylation
levels reduce ADCC activity and impact inflammatory responses [73], [74].
Furthermore, the use of CHO cells, mouse NS0 cells or Sp2/0 mouse myeloma cells
for mAb production can introduce non-human epitopes such as galactose-alpha-1,3-
galactose (α-gal) and N-glycolylneuraminic acid (NGNA) residues that act
immunogenically [75], [76].
Moreover, it is understood that variations in the N-linked glycan profile
(microheterogeneity) can occur during the mAb production process and therefore
glycosylation is considered a critical quality attribute of the end product. Studying the
impact of various environmental factors and process conditions can enlarge the
understanding of the glycosylation machinery and at the same time provide potential to
control and target desired mAb glycoforms. Multiple cell culture conditions during

8 CHAPTER 2: ANTIBODY GLYCOSYLATION
upstream processing such as different feeding regimes [32–35], media
supplementation [36], [37], as well as waste metabolite accumulation [77–79] can
affect glycosylation. Bo et al. (2013) recently showed a reduction in terminal
galactosylation for a chimeric heavy chain antibody at limiting glucose concentrations
in fed-batch culture. Moreover, supplementation with manganese chloride, galactose
and uridine can provide control over galactosylation during fed-batch cultivation [80],
[81]. Apart from metabolic control, bioreactor process parameters can lead to
variability in the glycoform profile and thus, play an important role in manipulating
the product quality. pH, temperature, dissolved O2 and CO2 levels, and shear stress
through agitation and sparging are classical process parameters. On the one hand they
can be applied to actively control the glycan microheterogeneity; on the other hand
such parameters are partially bioreactor scale-dependent and can inadvertently lead to
inconsistent glycosylation during scale-up. The impact of process parameters on N-
linked glycosylation has been summarized in literature [82], [83], however the effects
shown are often incoherent and incomplete, and therefore do not allow general
conclusions. This is partly due to the fact that glycosylation is dependent on the cell
line [84], [85] and the structure of the glycoprotein [86], but it is also influenced by the
experimental methodology that is used to study process-related impact factors.
In this work, we systematically investigated multiple process parameters using shift-
experiments in batch culture which allowed us to study each process parameter
individually. We focused on pH, dissolved O2 (DO) and osmolarity as chemical stress
parameters and sparging as a mechanical stress parameter assessing their impact on
cellular level and protein quality level. In addition, we compared the impact of single
parameters to combined effects (pH/ osmolarity). Using hydrophilic interaction
chromatography (HILIC) and MALDI TOF mass spectrometry we were able to
identify the impact of process parameters on N-linked glycosylation of a murine IgG1.
The present study provides a systematic procedure carried out in controlled
bioreactors, thus minimizing interaction effects, which can help to identify most
profound process-related factors affecting mAb glycosylation. Apart from commonly
assessed variations in terminal galactosylation, sialylation and core-fucosylation, less
common structures carrying α-gal and NGNA residues were investigated.

CHAPTER 2: ANTIBODY GLYCOSYLATION 9
2.2 Material and Methods
2.2.1 Cell Line and Cell Culture
The murine hybridoma cell line HFN 7.1 [87], producing an immunoglobulin G1
(IgG1) antibody against human fibronectin was obtained from the American Type
Culture Collection (ATCC CRL-1606) and adapted to the protein- and peptide-free
culture media Turbodoma® TP6 (Cell Culture Technologies) supplemented with 4.5
g/L D-glucose, 4 mmol/L L-glutamine and 0.1% (w/v) pluronic F-68.
Cells were expanded for 14 days in suspension in a humidified atmosphere (5% CO2)
at 37 °C and cultivated in a DasGip bioreactor system (DasGip) equipped with a
pitched-blade impeller and a porous sparger (10 µm). Exponentially growing cells
from the expansion were inoculated into the reactor at a seeding concentration of 0.6 x
106 cells/ mL. Standard batch cultures were carried out at a working volume of 1 L,
temperature equal to 37 °C, dissolved O2 (DO) set to 50% air saturation, stirring speed
of 150 rpm and an aeration rate of 0.05 vvm. pH was controlled at 7.2 with CO2
sparging.
A shift in one of the process parameters pH, DO, sparging or osmolarity was
performed during batch cultivation once the viable cell concentration reached 1.5 x 10⁶
cells/mL. After the process parameter was shifted to the new setpoint it was kept
constant until the end of the cultivation. pH was shifted by base (1 M sodium
hydroxide) or acid (1 M hydrochloric acid) addition. During the shift, the pH
controller was turned off and only after the new setpoint was reached the pH was again
controlled by base addition and CO2 sparging. The increase in osmolarity due to acid
or base addition was below 5% and this was considered to have a negligible effect on
cells. The DO shift was performed by changing the inlet gas composition through the
DO controller. The time needed for the adjustment of the new pH and DO setpoints
was in the range of a few minutes. The osmolarity shift was performed by addition of
6 M sodium chloride (NaCl) and monitored by offline measurements using an
OsmoLab One osmometer (LLA Instruments GmbH). The sparging shift was
performed by changing the gas flow rate in the controlled bioreactor system.
Perturbations of the system, in particular DO and pH, due to the new gas flow rate

10 CHAPTER 2: ANTIBODY GLYCOSYLATION
were negligible. In this manner an operating range of pH from 6.5 to 8.5, DO from
10% to 90% air saturation, sparging from 0.05 vvm to 0.2 vvm and osmolarity from
320 mOsm/kg to 450 mOsm/kg was investigated. Moreover, the combined effect of
pH and osmolarity was studied in cross experiments by performing a shift of both
parameters at the same time point following the same procedure as described above.
Cell culture samples were taken twice a day and in addition right after the parameter
shift. Cell number and viability were determined by the trypan blue exclusion method
[88] using a CedeX cell counter (Innovatis). Glucose and lactate concentrations were
determined enzymatically using a Super GL compact instrument (Hitado). Ammonium
and glutamine concentrations were determined using the L-Glutamine/Ammonia
(Rapid) Assay Kit (Megazyme). Samples were spun down and supernatants were
stored at -20 °C and later used for measurement of antibody concentration (PA
ImmunoDetection® Sensor Cartridge, Applied Biosystems) and N-linked
glycosylation analysis.
Profiles of the viable cell concentration were calculated using a generalized logistic
fitting equation containing 4 non-negative model parameters A, B, C and D (Eq. 2-1)
[89]. The specific growth rate µ was calculated by differentiating the fitted viable cell
concentration profile X according to Eq. 2-2.
X =A
exp(B𝑑) + C exp(-Dt) (2-1)
µ =
1𝑉
d𝑉d𝑑
(2-2)
2.2.2 Monoclonal Antibody Purification
200 µg of mAb was purified from the supernatant of each batch cultivation using the
Vivapure® miniprepG purification kit (Sartorius Stedim Biotech) according to the
manufacturer’s protocol. The kit contains pre-packed Protein G resin plugs and utilizes
affinity purification to separate the monoclonal antibody from the supernatant. Protein

CHAPTER 2: ANTIBODY GLYCOSYLATION 11
G affinity purification was used for the mouse IgG1, as it only showed weak binding
affinities to Protein A. The purified monoclonal antibody was concentrated to 20 µL
with a Vivaspin® 500 (30 kDa) centrifugation filter (Sartorius Stedim Biotech) at
1800 g (4 °C) and used for analysis of the glycosylation profile as described in the
Appendix (6.1).
2.2.3 Calculations
Monoclonal antibody samples were taken from each batch culture at the end of
cultivation (tend) and prior to the parameter shift (tshift). Glycosylation profiles were
determined at both time points by HPLC. The relative peak area (%Area) of the
detected glycoforms was extracted from the HPLC analysis and was equal to the mole
fraction xi of each species. The aim was to identify the change in glycosylation of each
species xi produced between the shift time point (tshift) and the end time point (tend). In
order to account for differences in cell productivity under different operating
conditions, xi was normalized to the difference in mAb concentration (cmAb) between
the two time points, calculated using the molar mass of IgG1 of 150 kDa. Assuming a
constant macroheterogeneity during the culture, the change in each glycoform fraction
∆Fi was calculated according to Eq. 2-3.
∆𝐹𝑖 =𝑐𝑚𝐴𝑏,𝑒𝑛𝑑 × 𝑥𝑖,𝑒𝑛𝑑 − 𝑐𝑚𝐴𝑏,𝑠ℎ𝑖𝑓𝑡 × 𝑥𝑖,𝑠ℎ𝑖𝑓𝑡
𝑐𝑚𝐴𝑏,𝑒𝑛𝑑 − 𝑐𝑚𝐴𝑏,𝑠ℎ𝑖𝑓𝑡 (2-3)
The degree of galactosylation (GI) [90] was calculated according to Eq. 2-4 as the
fraction of tri-galactosylated (G3), di-galactosylated (G2), mono-galactosylated (G1)
and non-galactosylated (G0) structures:
𝐺𝐼 =3 × 𝐺3 + 2 × 𝐺2 + 𝐺1
(𝐺0 + 𝐺1 + 𝐺2 + 𝐺3) × 3 (2-4)
In the same manner the sialylation (SI) [90] and fucosylation (FI) indices were
calculated (Eq. 2-5 and Eq. 2-6), where only di-sialylated (S2), mono-sialylated (S1)

12 CHAPTER 2: ANTIBODY GLYCOSYLATION
and non-sialylated (S0) structures, and mono-fucosylated (F1) and non-fucosylated
(F0) structures respectively, were observed:
𝑆𝐼 =2 × 𝑆2 + 𝑆1
(𝑆0 + 𝑆1 + 𝑆2) × 2 (2-5)
𝐹𝐼 =𝐹1
𝐹0 + 𝐹1 (2-6)

CHAPTER 2: ANTIBODY GLYCOSYLATION 13
2.3 Results and Discussion
2.3.1 Process Parameter Shift Experiments
Murine hybridoma cells (ATCC CRL 1606) were adapted to a commercial, protein-
and peptide-free media (Turbodoma® TP6) and showed a similar growth and
metabolic behavior as when cultivated with zinc supplemented IMDM media as
reported elsewhere [91]. In
Figure 2-1 a typical batch culture averaged from four independent experiments is
shown. The maximum viable cell concentration of 3.1 (± 0.2) x 106 cells/mL was
reached after 54 hours (Figure 2-1A) coinciding with glutamine depletion (Figure
2-1D), which led to a stop in glucose consumption (Figure 2-1B). The culture was
continued until 80 hours and reached a final monoclonal antibody concentration of
98.9 (± 7.2) mg/L (Figure 2-1C). The production of by-products (lactate and ammonia)
did not exceed growth-inhibiting concentrations of 40 mM for lactate and 4 mM for
ammonia [92] (Figure 2-1B, D).
A shift in one of the investigated process parameters (pH, osmolarity, dissolved O2 and
sparging) was performed during the early exponential growth phase of a standard
batch culture in order to systematically study the impact of chemical and mechanical
stress parameters on cell growth, productivity and N-linked glycosylation. Due to the
controlled bioreactor environment, one parameter at a time could be shifted and
subsequently kept constant until the end of the cultivation.
For illustration, Figure 2-2 shows the influence of pH on viable cell concentration,
viability and monoclonal antibody concentration in 7 shift-experiments. Each
experiment was started at standard pH 7.2 and shifted at the indicated time point
(dashed line). While under standard conditions the culture reached the highest viable
cell concentration, all pH shifts led to reduced growth profiles (Figure 2-2A). In the
case of pH 6.5 and 8.5 the culture immediately entered death phase, as evident from
the viability profiles (Figure 2-2B). In comparison, a shift to pH 6.8 resulted in a
beneficial behavior regarding antibody concentration, with an 11% increase in final
mAb concentration compared to standard conditions (Figure 2-2C).

14 CHAPTER 2: ANTIBODY GLYCOSYLATION
Due to the complexity of the shift experiments described above, in the following we
will analyze the corresponding results in a more synthetic way.
Figure 2-1: Standard batch cultivation of murine hybridoma cells in a controlled
bioreactor system (n=4). Profile of (A) viable cell concentration, (B) glucose ()
and lactate (), (C) monoclonal antibody and (D) glutamine () and ammonia
() concentrations.
2.3.2 Growth Rate Dependency on Bioreactor Process Parameters
The specific growth rate µ was calculated during the exponential growth phase of the
batch culture 10 hours after the respective parameter shift according to Eq.2-2. As
evident from Figure 2-3, the highest growth rate was reached under standard
conditions. Consequently, this value was used for normalizing all other specific
growth rate values. The most severe reduction of the specific growth rate was induced
with a shift in pH. A drop to pH 6.8 resulted in 32% reduction of the specific growth
rate whereas an increase to pH 8.0 led to a reduction of 53% (Figure 2-3).
0 10 20 30 40 50 60 70 80 900.00.51.01.52.02.53.03.5
0 10 20 30 40 50 60 70 80 908
12
16
20
24
0 10 20 30 40 50 60 70 80 90020406080
100120
0 10 20 30 40 50 60 70 80 900
1
2
3
4DC
B
Viab
le Ce
ll Co
nc. (
106 ce
ll/m
L)
Time (h)
Gluc
ose C
on. (
mm
ol/L
)
Time (h)
681012141618
Lacta
te Co
nc. (
mm
ol/L
)
mAb
Con
c. (m
g/L)
Time (h)
A
Glut
amin
e Con
c. (m
mol
/L)
Time (h)
0
1
2
3
4
Amm
oniu
m C
onc.
(mm
ol/L
)

CHAPTER 2: ANTIBODY GLYCOSYLATION 15
Figure 2-2: pH shift experiments during batch cultivation of murine hybridoma
cells. Starting at standard pH condition 7.2 a pH shift was performed in the early
exponential phase indicated by a dashed line and covered a pH range from 6.5 –
8.5. Profile of (A) viable cell concentration, (B) viability and (C) mAb
concentration at different pH setpoints.
0 10 20 30 40 50 60 70 80 900.00.51.01.52.02.53.03.5
0 10 20 30 40 50 60 70 80 9020
40
60
80
100
0 10 20 30 40 50 60 70 80 90020406080
100120140
pH 6.5 pH 6.8 pH 7.0 pH 7.2 pH 7.5 pH 7.8 pH 8.0 pH 8.5
Viab
le Ce
ll Co
nc. (
106 ce
ll/m
L)
Time (h)
Viab
ility
(%)
Time (h)C
B
A
mAb
Con
cent
ratio
n (m
g/L)
Time (h)
16 CHAPTER 2: ANTIBODY GLYCOSYLATION
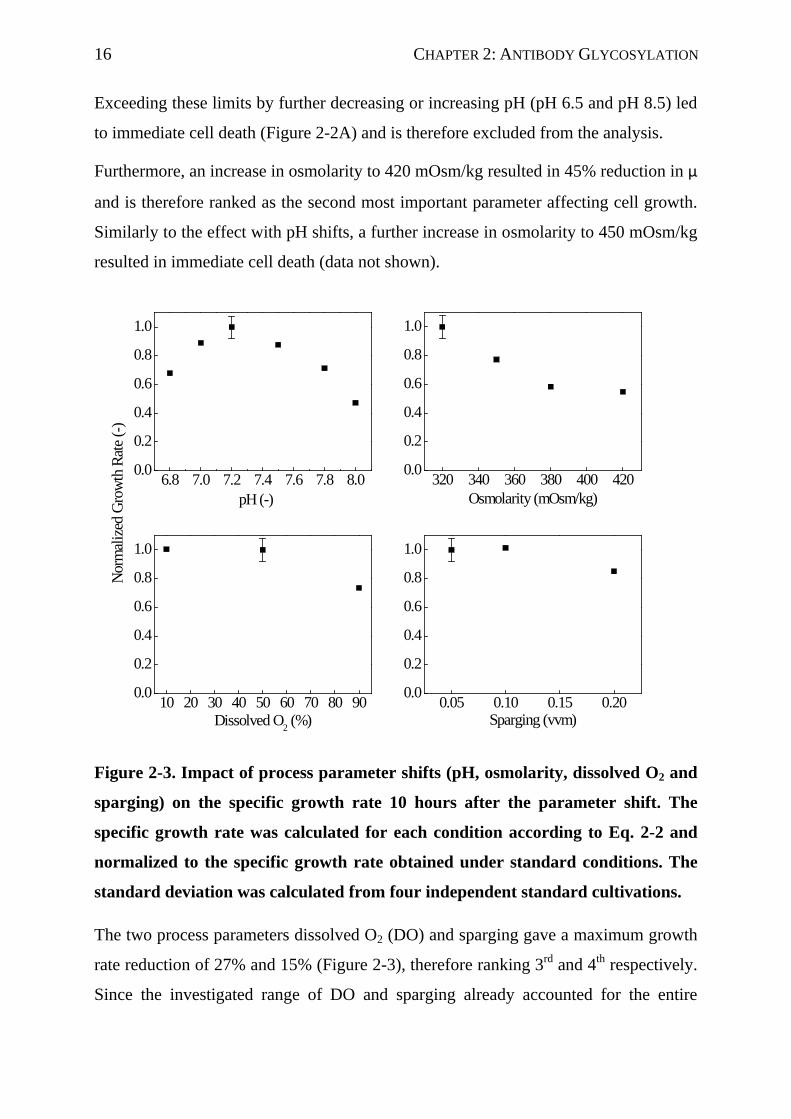
Exceeding these limits by further decreasing or increasing pH (pH 6.5 and pH 8.5) led
to immediate cell death (Figure 2-2A) and is therefore excluded from the analysis.
Furthermore, an increase in osmolarity to 420 mOsm/kg resulted in 45% reduction in µ
and is therefore ranked as the second most important parameter affecting cell growth.
Similarly to the effect with pH shifts, a further increase in osmolarity to 450 mOsm/kg
resulted in immediate cell death (data not shown).
Figure 2-3. Impact of process parameter shifts (pH, osmolarity, dissolved O2 and
sparging) on the specific growth rate 10 hours after the parameter shift. The
specific growth rate was calculated for each condition according to Eq. 2-2 and
normalized to the specific growth rate obtained under standard conditions. The
standard deviation was calculated from four independent standard cultivations.
The two process parameters dissolved O2 (DO) and sparging gave a maximum growth
rate reduction of 27% and 15% (Figure 2-3), therefore ranking 3rd and 4th respectively.
Since the investigated range of DO and sparging already accounted for the entire
6.8 7.0 7.2 7.4 7.6 7.8 8.00.0
0.2
0.4
0.6
0.8
1.0
320 340 360 380 400 4200.0
0.2
0.4
0.6
0.8
1.0
10 20 30 40 50 60 70 80 900.0
0.2
0.4
0.6
0.8
1.0
0.05 0.10 0.15 0.200.0
0.2
0.4
0.6
0.8
1.0
pH (-)
Osmolarity (mOsm/kg)
Norm
alize
d Gr
owth
Rate
(-)
Dissolved O2 (%)
Sparging (vvm)

CHAPTER 2: ANTIBODY GLYCOSYLATION 17
operating range in common mammalian cell bioprocesses [93], a further extension was
not considered.
Growth rate dependencies were determined in order to define the parameter ranges in
which the change in glycosylation should be investigated. In these parameter ranges,
cells are in the growth state and produce IgG1, crucial for the subsequent analysis of
glycosylation which focuses on glycoforms produced between the time of the
parameter shift and the end of the cultivation. The parameter range could vary
depending on the cell line and the experimental procedure used to introduce
environmental perturbations. It is worth noting that the obtained specific growth rate
dependency was comparable with previous literature reports for pH [93–96],
osmolarity [93], [97], hyperoxia [98] as well as sparging [96], [99].
2.3.3 Analysis of N-linked Glycan Microheterogeneity
In order to evaluate the differences in the glycosylation profiles (microheterogeneity)
induced by process parameter shifts, oligosaccharides were enzymatically released by
PNGase F from affinity-purified IgG1 antibody, fluorescently labeled with 2-AB and
characterized by MALDI TOF mass spectrometry. All determined oligosaccharide
masses obtained by MALDI-TOF MS in reflectron positive and negative ion mode
using DHB matrix are shown in the Appendix (Figure A 1). In positive ion mode,
oligosaccharides formed sodium or potassium adducts with sodium adducts having the
higher intensity. Structures of oligosaccharides were assigned either through database
comparison (GlycoWorkBench2) [100] or by comparison to the glycosylation profile
of Cetuximab, a commercially available antibody with known glycosylation profile,
obtained by hydrophilic interaction chromatography (HILIC) [48]. In some cases,
structures were further determined from the fragmentation pattern obtained by
MALDI-TOF MS/MS, as shown in the Appendix (Figure A 1C) for a core-
fucosylated, bi-antennary structure carrying one terminal galactose (G1F). All clearly
identifiable glycan structures are of the complex type containing terminal galactose, α-
linked galactose and/or sialic acid residues. Both types of terminal sialic acid residues
(NGNA and NANA) were detected, whereas terminal NGNA residues were
predominant. The proposed glycoforms are given in the Appendix (Table A 1).

18 CHAPTER 2: ANTIBODY GLYCOSYLATION
In addition, fluorescently labeled glycoforms were separated by HILIC
chromatography and the mass of each well separated fraction was likewise determined
by MALDI-TOF MS and compared to the characterized oligosaccharide structures
given in the Appendix (Table A 1). The glycan structures could subsequently be
assigned to each well separated fraction in the HILIC glycosylation profile (Figure
2-4). The glycosylation profile demonstrated the separation of oligosaccharides
between 35 and 84 minutes. The profile is characterized by three major structures, one
eluting after 39 and two structures co-eluting after 46 minutes. These three glycan
structures contributed to 57% of the whole glycosylation profile. Through MALDI-
TOF MS/MS, it was found that the major glycans represent core-fucosylated, bi-
antennary structures with none or one terminal galactose, G0F and G1F respectively,
where the two co-eluting glycans are assumed to be G1F carrying the galactose either
on the α(1→6) or the α(1→3) arm. All characterized glycan structures that could be
identified through MALDI-TOF MS and assigned to the HILIC profile are shown in
Figure 2-4. They represent 90% of the whole glycosylation profile of the HFN 7.1
antibody.
2.3.4 Variation in N-linked Glycan Microheterogeneity
Under standard cultivation conditions, the N-linked glycosylation profile of HFN 7.1
is dominated by a bi-antennary, fucosylated structure with one terminal galactose
(G1F), which comprised 31% (± 2%) of the overall oligosaccharides, followed by the
G0F structure, which accounted for 26% (± 2%). The fully galactosylated and
fucosylated bi-antennary structure G2F only contributed to 8% of the total glycan
pool. Other oligosaccharide structures released from HFN 7.1, apart from the non-
fucosylated and non-galactosylated G0 structure, showed higher complexity, carrying
mostly terminal N-glycolylneuraminic acid residues and/or α-linked galactose residues
(Figure 2-4), both typical for murine-derived IgG proteins [48], [64], [101].

CHAPTER 2: ANTIBODY GLYCOSYLATION 19
Figure 2-4: N-linked glycosylation profile of HFN 7.1 antibody (IgG1). The
antibody was purified at the end of a standard batch culture, glycans were
released by PNGase F, labeled with 2-AB and fluorescently detected by HILIC.
The predominant peaks were fractionated and the masses were measured by
MALDI TOF MS and compared to characterized oligosaccharide structures.
Sugar residues are as reported in the Appendix (Table A 1).
Before investigating the impact of bioprocess parameters on N-linked glycosylation of
IgG1, variations in the glycosylation profile over the course of a standard batch culture
were considered [102] in order to rule out the presence of degradative enzymes in the
supernatant. Released glycosidases and sialidases are known to cleave terminal sugar
residues (galactose and sialic acids) particularly towards the end of the culture due to
cytolysis [103–105]. Simultaneously, nutrient limitations, such as glucose and
glutamine towards the late-stage of the culture, can potentially affect nucleotide sugar
substrate availability [106–108]. Furthermore, the accumulation of ammonia can lead
to variations in the glycoform profile [78]. To check whether post-secretory
degradation, substrate limitation or waste metabolite accumulation affect glycosylation
of HFN 7.1 over time, the secreted monoclonal antibody was purified from three
repeated batch cultures at three different time points and the glycosylation profile was
determined (Figure 2-5A). The relative peak area of nine glycoforms was compared
after 26 hours corresponding to early exponential growth phase tshift, after 54 hours
30 40 50 60 70 80 900
2
4
6
8
G2F-NGNA2
G2F-GalNGNA
G2F-NGNA
G0F-GalNGNA
G3FG2F
G1F
G0F
Fluo
resc
ent i
nten
sity
(LU)
Retention time (min)
G0

20 CHAPTER 2: ANTIBODY GLYCOSYLATION
when maximum viable cell concentration was typically reached tXv and at the end of
the culture after 80 hours tend.
Figure 2-5: N-linked glycosylation profile of purified monoclonal antibody
analyzed at three different time points throughout a batch culture [t (shift) = 26h,
t (max. Xv) = 54 hours, t (end) = 80 hours]. Relative peak areas of (A) a standard
batch culture without process parameter shift were compared to (B) pH-shifted
culture to pH 7.8.
Throughout the course of standard batch cultures the relative peak area remained
constant (Figure 2-5A) and therefore we concluded that N-linked glycosylation did not
vary within the time frame of a standard batch culture. In contrast, when pH was
shifted to 7.8, the glycosylation profile changed over the time course of the
G0G0F G1F G2F
G0F-GalNGNA G3F
G2F-NGNA
G2F-GalNGNA
G2F-NGNA205
101520253035
B
Peak
area
%
t (shift) t (Xv) t (end)
G0G0F G1F G2F
G0F-GalNGNA G3F
G2F-NGNA
G2F-GalNGNA
G2F-NGNA205
101520253035
A
Peak
area
%
t (shift) t (Xv) t (end)

CHAPTER 2: ANTIBODY GLYCOSYLATION 21
exponential growth phase, as is most evident from the decrease of terminal
galactosylation (G1F and G2F) and the increase of the relative peak area of G0F by
6% from tshift to tXv (Figure 2-5B). However, the glycosylation profile remained
unchanged within the last 26 culture hours from tXv to tend indicating that post-secretory
degradation was not observed in the shifted culture even though culture viability was
low (see Figure 2-2B). To conclude, changes in the glycan microheterogeneity evident
from the relative peak area of the most abundant glycoforms were induced solely by
process parameter shifts.
2.3.5 Impact of Chemical and Mechanical Stress Parameters on N-linked
Glycan Microheterogeneity
In order to evaluate the effect of multiple process parameters on glycosylation of a
monoclonal antibody, the glycoform profile of the investigated IgG1 protein was
determined prior to the parameter shift and at the end of the culture. Since cell
productivity was influenced differently by each process parameter shift, changes in the
glycan profile are further expressed relative to changes in mAb concentration
produced within the same time frame, in order to provide better comparability. In this
way the fraction of each glycoform could be determined as a function of process
parameter and mAb concentration according to Eq. 2-3. Figure 2-6 shows the impact
of pH and DO, Figure 2-7 the impact of sparging and osmolarity on the proportion of
the most abundant glycoforms. In order to summarize the observed effects the
galactosylation (GI), sialylation (SI) and fucosylation (FI) indices [90] were calculated
according to Eq. 2-4, Eq. 2-5 and Eq. 2-6.
A shift in pH in the early exponential growth phase led to most profound changes in
glycan microheterogeneity of the IgG1 antibody. Terminal galactosylation and
sialylation (NGNA) decreased steadily with increased pH (see Figure 2-6A), which is
further reflected in the decrease of the GI from 0.43 to 0.24 and of the SI from 0.15 to
0.08 between pH 6.8 and 8.0 (Table 2-1), leading to a gradual increase in the G0F
fraction from 16 to 35% (Figure 2-6A). Simultaneously, the afucosylated structure G0
increased with increasing pH, resulting in a reduction of the FI from 0.99 to 0.94 (see
Table 2-1). It is worth noting that the range of variability in galactosylation reached in
the studied pH region is significant, but remarkably smaller compared to a GI range

22 CHAPTER 2: ANTIBODY GLYCOSYLATION
reported for glucose limited cultures (GI = 0.35 – 0.72) [32]. Nevertheless, both
process conditions could be applied to control galactosylation in the determined range.
The effect of culture pH on glycosylation has been investigated earlier for different
glycoproteins produced in a variety of cell lines. While Muthing et al. (2003) reported
an increase in galactosylation (G2F) with increased culture pH for an IgG3 protein
produced in a hybridoma cell line, Seo et al. (2013) showed the opposite behavior for
a mAb produced in a human cell line. At the same time, Muthing et al. (2003)
observed an increase in afucosylation. In terms of sialylation, Yoon et al. (2005)
reported decreased sialic acid content in Epo with increasing culture pH (pH 7.8).
Other reports showed differences in the NANA/NGNA ratio at different pH values
[109], as well as no effect of pH 6.8–7.3 on the NANA content [95]. A juxtaposition of
the obtained results to earlier literature reports revealed that, as a process parameter,
pH can dramatically affect glycosylation of multiple glycoproteins produced in various
cell lines, including HFN 7.1 produced in murine hybridoma cells. Nevertheless, a
generally valid conclusion on the degree and direction of pH-induced variation of N-
linked glycosylation cannot be drawn. Indeed, the impact of pH as well as other
process parameters has to be assessed case-by-case depending both on the cell line and
the expressed protein. The mechanism of glycosylation is in fact at the same time
influenced by cell line-dependent differences, such as the expression levels of
glycosylation genes [82], and by the accessibility of the glycosylation site which is
protein-specific [110]. In addition, different experimental procedures were previously
applied to study the effect of culture pH on glycosylation and it has been shown that
the procedure itself can influence glycosylation [111]. Nevertheless, the obtained
results extend the knowledge of pH-induced variations in N-glycosylation, using a
model system that is characterized by a complex glycosylation profile.
Osmolarity shifts, while ranked second in the cell growth analysis, did not affect
glycosylation of the investigated IgG1 protein (see Figure 2-7B), as likewise reported
for β-IFN [112]. However, increased osmolarity was shown to increase the antibody
Man5 level [113], a glycoform not detected in the HFN 7.1 glycosylation profile.

CHAPTER 2: ANTIBODY GLYCOSYLATION 23
Figure 2-6: Change in each glycoform fraction ∆Fi induced by process parameter
(A) pH and (B) dissolved O2 (DO). The change in glycoform fraction is expressed
as difference of the produced glycoform between the parameter shift time and the
end of the culture, normalized to the change in antibody concentration and was
calculated according to Eq. 2-3. () G0F, () G1F, () G2F, () G3F, () G0,
() G2F-NGNA, () G2F-NGNA2, () G2F-GalNGNA, () G0F-GalNGNA.
Sugar residues are as reported in the Appendix (Table A 1).
Apart from single parameter changes, osmolarity and pH were investigated in cross
experiments in order to evaluate their combined effect on glycosylation. pH and
osmolarity are important during fed-batch cultivation where increases in osmolarity
can be related to pH control by base addition or to feed addition. At the same time it
has been shown that low pH and high osmolarity can increase the mAb production rate
in hybridoma cell culture [114]. Thus, both parameters were shifted simultaneously in
the early exponential growth phase combining low pH with high osmolarity as well as
high pH with high osmolarity. For comparison an intermediate pH and osmolarity
cross-condition was included (Table 2-1). The combined effect on glycosylation was
compared to the GI, SI and FI reached from single process parameter shifts. As evident
10
20
30
40
10
20
30
40
6.8 7.0 7.2 7.4 7.6 7.8 8.00
2
4
6
8
10
0 20 40 60 80 1000
2
4
6
8
10
∆ F i (%
)
pH
BA
DO (%)

24 CHAPTER 2: ANTIBODY GLYCOSYLATION
from Table 2-1, in the low pH 6.8 and high osmolarity (420 mOsm/kg) cross
experiment the effect of pH was predominant and the degree of galactosylation,
sialylation and fucosylation was comparable to a pH-shift to pH 6.8 alone. In the other
two cross conditions where pH and osmolarity were increased (pH 7.5/ 380 mOsm/kg;
pH 7.8/ 420 mOsm/kg) the GI, SI and FI followed the osmolarity behavior with
consistent glycosylation.
Table 2-1: Degree of galactosylation (GI), sialylation (SI) and fucosylation (FI) as
a function of the single shift parameter pH or osmolarity (mOsm/kg), and as a
function of the combined effect of pH and osmolarity.
pH Osmolarity GI SI FI
6.8 320 0.43 0.15 0.99
7.0 320 0.37 0.13 0.99
7.2 320 0.35 0.11 0.98
7.5 320 0.31 0.10 0.97
7.8 320 0.25 0.10 0.95
8.0 320 0.24 0.08 0.94
7.2 350 0.34 0.11 0.99
7.2 380 0.32 0.10 0.98
7.2 420 0.34 0.09 0.99
6.8 420 0.43 0.13 1.00
7.5 380 0.38 0.14 0.99
7.8 420 0.37 0.13 0.98
Regarding other chemical stress parameters, DO shifts resulted in slight changes of the
glycoform fractions (Figure 2-6B). In particular, with DO of 10% and 90% air
saturation the GI increased to 0.44 and 0.42 and the SI increased to 0.16 and 0.13
respectively, whereas at 50% air saturation, both indices remained slightly lower (GI =
0.35; SI = 0.11). Earlier literature reports demonstrate rather consistent glycosylation

CHAPTER 2: ANTIBODY GLYCOSYLATION 25
at DO levels from 10 – 100% air saturation with small increases in sialylation of the
follicle-stimulating hormone (FSH) [115] and in terminal galactosylation (G2) of an
IgG [116], both at increased DO levels (90 – 100 % air saturation). Therefore, when
assessing chemical stress parameters and their effect on glycosylation, DO is ranked as
second most important single parameter that causes variations in HFN 7.1
glycosylation.
Finally, the mechanical stress parameter of sparging (in a range of 0.05 – 0.2 vvm) was
studied as an impact parameter of glycosylation. Our results suggest no significant
difference in any of the glycoforms within this sparging range (Figure 2-7A), whereas
hydrodynamic stress induced by sparging was earlier reported to result in a minor
increase of the G0F fraction [25].
Figure 2-7: Change in each glycoform fraction ∆Fi induced by process parameter
(A) sparging and (B) osmolarity. The change in glycoform fraction is expressed as
difference of the produced glycoform between the parameter shift time and the
end of the culture, normalized to the change in antibody concentration and was
calculated according to Eq. 2-3. () G0F, () G1F, () G2F, () G3F, () G0,
() G2F-NGNA, () G2F-NGNA2, () G2F-GalNGNA, () G0F-GalNGNA.
10
20
30
40
10
20
30
40
0.05 0.10 0.15 0.200
2
4
6
8
10
320 340 360 380 400 4200
2
4
6
8
10
∆ F i (%
)
Sparging (vvm)
BA
Osmolarity (mOsm/kg)

26 CHAPTER 2: ANTIBODY GLYCOSYLATION
2.4 Conclusions
We propose a shift-experiment methodology that can be applied to systematically
investigate the effect of varying chemical and mechanical stress parameters that
constitute common bioreactor process parameters, on cellular growth and
glycosylation of a monoclonal antibody. Applying this methodology, we could show a
comprehensive picture of variations in complex N-linked glycosylation of one
particular glycoprotein, HFN 7.1, characterized in this study. An initial assessment of
the cell growth rate dependency on process parameters was used to define an operating
range in which cells were viable and produced monoclonal antibodies. As a result, pH
and osmolarity were considered as critical parameters in terms of growth, whereas
sparging and DO did not impact the specific growth rate in the relevant range.
Regarding the effect of process parameters on glycosylation, pH showed the most
profound impact on the variation of glycan microheterogeneity, followed by DO,
which had a slight impact on galactosylation and sialylation. Osmolarity and sparging
did not affect glycan microheterogeneity significantly. However, high osmolarity
prevailed regarding GI, SI and FI in combination with high pH, whereas the combined
effect of low pH with high osmolarity showed pH predominance on glycan
microheterogeneity.
Monitoring of process parameters and their impact on N-linked glycosylation is crucial
to provide desired as well as consistent product quality throughout a bioprocess. The
methodology we have presented here can provide an initial ranking of the impact of
environmental parameters that have to be considered under the Quality by Design
(QbD) scope. Furthermore, data obtained can be used for validation of recently
available mathematical models of mAb glycosylation [117], [118] and improve their
ability to capture the effect of process conditions. Ideally, this methodology can be
further applied in a high-throughput setting and connected to high-throughput
analytical techniques [119].
2.5 Remark
The work presented in this chapter has been partially submitted for publication to the
Journal of Biotechnology.

27
3 Insights into pH-induced Metabolic Switch by
Flux Balance Analysis
3.1 Introduction
Mammalian cells are used for the production of recombinant proteins that are large,
complex and require post-translational modifications [7]. With the increased medical
and economic demand for recombinant proteins, primarily mAbs, particular attention
has been paid to mammalian cell culture processes with the aim to consistently
produce high quality material. Over the past 25 years, bioprocesses have been
prolonged through process modifications and media optimization as well as through
genetic engineering, resulting in substantial increases of maximum viable cell
concentrations and product concentrations [17].
Nevertheless, mammalian cells are characterized by an inefficient metabolism [120].
With the increase in glycolytic rate observed under growth conditions, and with excess
glucose [121], pyruvate is preferentially reduced to lactate by lactate dehydrogenase A
(LDH A), instead of entering the mitochondria and being further metabolized in the
tricarboxylic acid (TCA) cycle. This has a negative impact on the energy yield which
can be achieved from glucose. Furthermore, it has been shown that lactate itself can
downregulate enzymes in the glycolytic process, namely hexokinase (HK) and
phosphofructokinase (PFK), thereby altering the cellular metabolism during fed-batch
cultivation [122], [123]. In addition, lactate accumulation results in reduced cell
growth in batch and fed-batch cultures [124], [125] and has a negative impact on cell
productivity [126]. Different strategies have been developed in an attempt to limit the
secretion of lactate and the associated adverse effects. Apart from approaches where
metabolic pathways were genetically modified [127], [128], several strategies for
operating the bioreactor were proposed that aim to reduce lactate accumulation and
often even result in lactate consumption. The latter are centered on the optimization of
the media and feeding strategies by reducing the initial glucose concentration [129],
[130] or feeding galactose [131] or even lactate directly [132] as alternative carbon
sources. Finally, lactate secretion can also be affected externally by pH alteration. As

28 CHAPTER 3: LACTATE METABOLISM
demonstrated by Osman et al. (2001), lactate consumption can be induced in GS-NS0
cells by reducing pH below 7.5, with concomitant decreases in cell growth and glucose
uptake. They also showed that the specific lactate consumption rate increased as the
pH value was further reduced, while the specific lactate production rate increased
when pH was set above 8.0. A similar behavior was observed in a different study using
a CHO cell line [95].
Efforts to characterize the cell metabolism have included 13C metabolic flux analysis
(MFA) as well as constraint-based flux balance analysis (FBA). 13C-MFA is a
powerful method which can be used to identify the split ratio of fluxes at branch points
or in cyclic pathways, such as the diversion of glucose to the partially cyclic pentose
phosphate pathway [134]. However, this technique relies on isotopomer measurements
and requires the use of 13C-labelled substrates in order to investigate intracellular flux
distributions. Despite the accuracy of MFA estimations, this method is experimentally
tedious and expensive, in particular when working on bioreactor scale. FBA on the
other hand, fully depends on the mass balance and can be applied effectively to
underdetermined systems by including thermodynamic and regulatory constraints.
These constraints play a key role in reducing the solution space [135]. Thus, the
intracellular flux distribution can be obtained from optimization towards a given
objective. FBA has been used to calculate the flow of metabolites through primary
metabolic pathways [136], [137]. The accuracy of FBA estimations using the objective
function ‘maximize ATP’ has been successfully validated in hybridoma cell culture
using experimental 13C-determined flux data [138]. In recent studies, both 13C-MFA
and FBA have been applied as tools to study lactate metabolism under glucose
depletion [139], and to compare different growth phases during fed-batch cultivation
[121], [123], [140], and different cell lines [141].
In this work, flux balance analysis was used to investigate the effect of pH on the
lactate metabolism of a murine hybridoma cell line during the exponential growth
phase of the culture. Lactate consumption was induced even at high glucose
concentrations by altering the pH from standard pH 7.2 to a lower value (pH 6.8),
whereas lactate production was highly increased once pH was set to a higher value (pH
7.8). While in other studies metabolic states were compared before and after the lactate

CHAPTER 3: LACTATE METABOLISM 29
switch [123], [139], we altered the pH in parallel controlled batch cultures and
analyzed the metabolic states considering the effect of culture time and thus the
growth phase of the cells. Furthermore, gene expression analysis by real-time PCR
was implemented to capture the pH-induced changes on the enzymes involved in the
central metabolism of murine hybridoma cells at the transcriptional level. The
information obtained thereby led to the identification of a regeneration pathway that
was activated at pH 7.8, and on this basis the metabolic network was enlarged. Finally,
simulation results were used to identify the consequences of pH alterations on energy
metabolism.
3.2 Material and Methods
3.2.1 Cell Line and Media
The hybridoma cell line HFN 7.1 (ATCC CRL-1606) [87], producing an
immunoglobulin G1 (IgG1) antibody against human fibronectin was used in this study.
The initially serum-dependent cells were sequentially adapted to the chemically
defined protein- and peptide-free culture media Turbodoma® TP6 (Cell Culture
Technologies) supplemented with 4.5 g/L D-glucose, 4 mM L-glutamine and 0.1%
(w/v) pluronic F-68. Cells were expanded as suspension cultures for 2 weeks in 50 mL
spinner flasks and 2 L roller bottles in a humidified atmosphere containing 5% carbon
dioxide (CO2) at constant temperature of 37 °C.
3.2.2 Bioreactor Setup and pH Shift Experiments
A DasGip bioreactor system (DasGip) was used for the cultivation of HFN 7.1 cells
under controlled culture conditions. The exponentially growing cells were transferred
to the bioreactor at a concentration of 2 x 10⁶ cells/mL and diluted to a working
volume of 1 L to result in a seeding cell concentration of 0.6 x 10⁶ cells/mL. Batch
cultivation was performed under standard conditions with temperature equal to 37 °C,
dissolved oxygen set to 50% air saturation and stirrer speed equal to 150 rpm. The pH
was controlled at 7.2 with CO2 sparging. Once viable cell concentration reached
1 x 10⁶ cells/mL, a single pH shift was performed by the addition of a defined volume
of 1 M sodium hydroxide (NaOH) or 1 M hydrochloric acid (HCl). Due to the small
base or acid amount used, the time needed to shift the pH to the new setpoint was in

30 CHAPTER 3: LACTATE METABOLISM
the range of a few minutes. During the shift, the pH controller was turned off and only
after the new setpoint was reached the pH was again controlled by base and CO2
sparging in order to keep the pH constant at the new setpoint until the end of
cultivation. The osmolarity of each culture was measured with an OsmoLab One
osmometer (LLA Instruments). The increase in osmolarity due to acid or base addition
was below 5% and this was considered to have a negligible effect on the cells.
Cell culture samples were taken twice a day and additionally before and after the pH
shift. Cell number and viability were determined using a CedeX cell counter
(Innovatis). Glucose and lactate concentrations were determined using a Hitado Super
GL compact instrument (Hitado). Samples were spun down and supernatants were
stored at -20 °C and later used for measurement of antibody concentration (PA
ImmunoDetection® Sensor Cartridge, Applied Biosystems) and amino acid
concentration (ZORBAX Eclipse Plus C18 4.6mm x 150mm, Agilent Technologies)
by HPLC. Prior to amino acid measurement, supernatant samples were filtrated using a
Vivaspin® 500 (5kDa) centrifugation filter (Satorius Stedim Biotech) at 4000 rcf at 4
°C for 25 minutes. Derivatization of amino acids with ortho-phthalaldehyde (OPA)
was performed with an online injector program according to Agilent’s application note
[142].
3.2.3 TaqMan® Gene Expression Assay
Cell samples lysed in TRIzol® reagent (Life Technologies) at day 1.1 and 1.9 from
each culture were stored at -80 °C. RNA was extracted from cell samples according to
the manufacturer’s recommendations. Quantity and quality of isolated RNA was
assessed by spectrophotometry with a NanoDrop 1000 (Thermo Scientific). All RNA
samples had an A260/A280 ratio within 2.00 to 2.03, which represents high purity of
RNA.
For each reaction, cDNA was prepared from 2 µg of RNA using the High Capacity
cDNA Reverse Transcription Kit (Applied Biosystems) according to the
manufacturer’s recommendations. A TaqMan® gene expression assay containing a
predesigned array of murine oligonucleotide primers and probes for target genes
involved in murine central metabolism (Appendix Table A 2) was purchased from Life
Technologies. Quantitative PCR reactions were performed in triplicates according to

CHAPTER 3: LACTATE METABOLISM 31
supplier’s protocol using TaqMan® Gene Expression Master Mix (2x) (Rox; Life
Technologies) in an AB 7900 HT Real-Time PCR System (Life Technologies, USA).
The results were analyzed by applying the comparative CT method (2−ΔΔCT method)
[143] with glyceraldehyde-3-phosphate dehydrogenase Gapdh as an internal control
gene for the normalization of mRNA expression levels. The expression of each target
gene relative to the internal control gene after pH-shift (at day 1.9) was compared to
the relative expression before pH-shift (at day 1.1), for both pH-shifted conditions
respectively.
3.2.4 Flux Balance Analysis (FBA)
Flux balance analysis as described previously [144] was applied to the central
metabolic network based on Mulukutla et al. (2012). The network is
compartmentalized into mitochondria and cytosol and contains reactions of the main
energy metabolism of glycolysis, glutaminolysis and TCA cycle, as well as biomass
and antibody synthesis. The carbon shunt into the pentose phosphate pathway (PPP)
cannot be resolved and was assumed to only result in DNA and RNA synthesis.
Amino acid degradation and synthesis pathways have been adjusted according to the
KEGG database for Mus musculus [145]. Apart from the main energy metabolism, the
malate-aspartate shuttle has been included in the metabolic network to capture the
regeneration of the cofactor NAD+ in the cytosol. Since the cofactor requirement of
some enzymatic reactions is still under investigation and due to possible mitochondrial
transhydrogenase action, the cofactors NADH and NADPH were lumped together. The
total production of NAD(P)H and FADH2 was calculated from the network and a
theoretical P/O value of 2.5 and 1.5 respectively was considered for ATP production in
oxidative phosphorylation. Further, reactions that can restore the phosphoenolpyruvate
and therefore pyruvate level in the cytosol have been added to the metabolic network
after identification of high expression levels of the mitochondrial
phosphoenolpyruvate carboxykinase (PEPCK2) at culture pH 7.8 from gene
expression data. The reactions and metabolites considered in the metabolic network
are listed in the Appendix (Table A 3), together with the scheme of the metabolic
network (Figure A 2).

32 CHAPTER 3: LACTATE METABOLISM
Metabolite consumption and production profiles were fitted using a logistic decline
equation (Eq. 3-1) to describe metabolite consumption and a logistic growth function
(Eq. 3-2) to describe metabolite production. Viable cell concentration data can be
fitted using a generalized logistic equation containing non-negative model parameters
A, B, C, D and E (Eq. 3-3).[89] The parameter E used in all equations has been added
to account for data that do not start from zero or converge to zero, as follows:
𝑁 =A
exp(B𝑑) + C + E (3-1)
𝑃 =A
1 + C exp(−D𝑑)+ E (3-2)
X=A
exp(B𝑑) + C exp(-Dt)+ E (3-3)
Specific metabolite consumption rates qN and specific production rates qP were
calculated by differentiating the fitted logistic equations and consequently used as an
input in FBA:
𝑞N =
1𝑉
d𝑁d𝑑
(3-4)
𝑞P =
1𝑉
d𝑃d𝑑
(3-5)
The biomass composition for hybridoma cell lines has been described previously
[146–148] and is provided in the Appendix 6.2.
Flux balance analysis using maximization of ATP production as an objective function
was employed to estimate intracellular fluxes. ‘Maximization of ATP’ has proven to
be a valid objective function for hybridoma cells due to their hyperactive, cancer-like
metabolic behavior [138], [149]. The reactions in the network were programmed in
Matlab using the SimBiology® model object and a sequential quadratic programming

CHAPTER 3: LACTATE METABOLISM 33
algorithm was utilized to solve the optimization problem. The 95% confidence interval
was calculated as two times the estimated standard error. Finally, the reaction network
and the validity of the objective function were verified using literature data from 13C-
tracer studies [121], [150]. Comparison of the calculated intracellular fluxes with the
experimentally determined values gave an acceptable agreement within the main
energy metabolism with expected discrepancies in the pentose phosphate pathway and
in the anaplerotic reaction of pyruvate to oxaloacetate (data not shown).
3.3 Results and Discussion
3.3.1 Characteristics of Cell Growth and Metabolism
pH-shift experiments to high (pH 7.8) and low pH (pH 6.8) were performed in
duplicates during HFN 7.1 batch cultivation in controlled bioreactors once cells were
growing exponentially and had reached a cell concentration of 1 x 10⁶ cells/mL.
Profiles of viable cell, antibody, glucose and lactate concentrations were compared to
an averaged standard cultivation from four independent experiments with constant pH
7.2 (Figure 3-1). Under standard conditions the peak viable cell concentration of
3.3 (± 0.3) x 106 cells/mL as well as a maximum growth rate of 1.1 d-1 were reached
during the exponential growth phase. In contrast, the highest mAb concentration was
observed in the pH 6.8 shifted culture, even though growth was reduced compared to
standard cultivation conditions.
The lowest growth profile was obtained at pH 7.8, where a growth rate equal to 0.70 d-
1 was measured during the exponential phase, resulting in a maximum viable cell
concentration of 2.1 x 10⁶ cells/mL with a final mAb concentration 27% lower
compared to standard conditions (see Figure 3-1A, B). It is worth noting that the
observed variations in growth rate and productivity are in agreement with previously
published pH-shift experiments using a GS-NS0 mouse myeloma cell line [133].
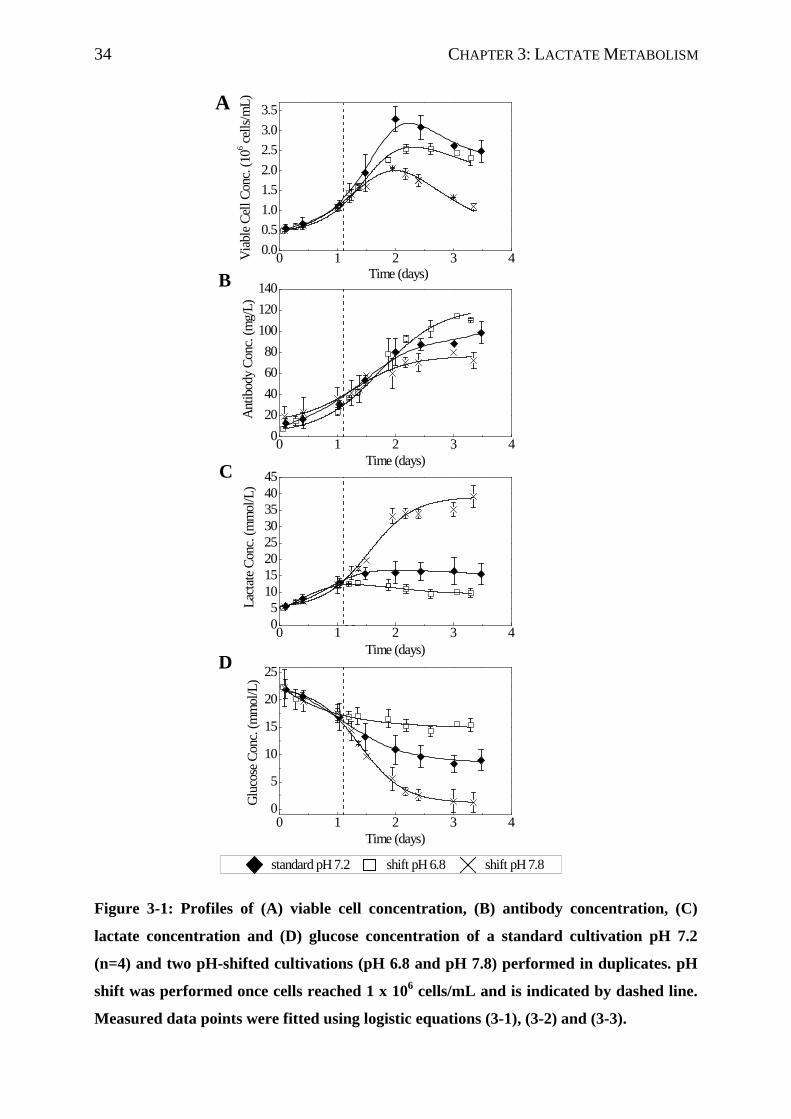
34 CHAPTER 3: LACTATE METABOLISM
Figure 3-1: Profiles of (A) viable cell concentration, (B) antibody concentration, (C)
lactate concentration and (D) glucose concentration of a standard cultivation pH 7.2
(n=4) and two pH-shifted cultivations (pH 6.8 and pH 7.8) performed in duplicates. pH
shift was performed once cells reached 1 x 10⁶ cells/mL and is indicated by dashed line.
Measured data points were fitted using logistic equations (3-1), (3-2) and (3-3).
0 1 2 3 40.00.51.01.52.02.53.03.5
0 1 2 3 4020406080
100120140
0 1 2 3 405
1015202530354045
0 1 2 3 40
5
10
15
20
25
standard pH 7.2 shift pH 6.8 shift pH 7.8
D
C
B
Viab
le Ce
ll Co
nc. (
106 ce
lls/m
L)
Time (days)
Antib
ody
Conc
. (m
g/L)
Time (days)
Lacta
te Co
nc. (
mm
ol/L
)
Time (days)
A
Gluc
ose C
onc.
(mm
ol/L
)
Time (days)

CHAPTER 3: LACTATE METABOLISM 35
More interestingly, lactate and glucose metabolism was instantly affected by pH shift
(Figure 3-1C, D), also as reported earlier [93], [94], [133]. Once pH was reduced to
6.8, the lactate concentration decreased, indicating a lactate consumption state that was
triggered by pH and remained present throughout the cultivation. Concurrently,
glucose uptake was substantially reduced. In contrast, the lactate concentration
increased dramatically as soon as pH was set to 7.8 resulting in a final lactate
concentration of 39.3 (±3.3) mmol/L compared to 15.6 (±3.3) mmol/L under standard
conditions. The increase in lactate concentration was connected to an increase in
glucose consumption (see Figure 3-1 C, D).
Specific consumption and production rates of all measured metabolites were calculated
over the time of the exponential growth phase (WD 1.0, WD 1.5, WD 1.9) for the
averaged standard cultivation, and compared in order to assess the effect of culture
time on specific rates. As can be seen from Figure 3-2A, specific production and
consumption rates of basic metabolites, amino acids, as well as biomass and mAb
decreased over time. Therefore, a fair comparison between different conditions can
only be made at the same time point, so as to exclude metabolic alteration due to
culture time. Consequently, specific consumption and production rates for the pH-
shifted conditions were calculated at working day 1.9 and compared to standard
conditions at the same time point (see Figure 3-2B, C). Apart from changes in glucose
and lactate metabolism, consumption and production of several other amino acids was
clearly altered, e.g. the metabolism of glycine switched from consumption to
production in the high lactate production state and at the same time glutamate
production was significantly increased. Specific rates from Figure 3-2 were used as
input fluxes vm in the subsequent flux balance analysis.
The HFN 7.1 batch cultivation is characterized by glutamine depletion after 2.1 days.
Therefore, data after 2.1 days were not considered in flux balance and gene expression
analysis.

36 CHAPTER 3: LACTATE METABOLISM
Figure 3-2: Specific consumption and production rates of glucose, lactate, various
amino acids (nmol/106cells/h), biomass and mAb (µg/106 cells/h) under different
pH conditions. (A) Standard batch cultivation (pH 7.2) at three time points (WD
1.0, WD 1.5 and WD 1.9) during exponential growth phase. (B) Comparison of
two metabolic states at pH 7.2 and at pH 6.8 evaluated 17 hours after pH-shift
(WD 1.9). (C) Comparison of two metabolic states at pH 7.2 and at pH 7.8
evaluated 17 hours after pH-shift (WD 1.9). Indicated time points were
considered in FBA.
GLCLAC
GLN-400-300-200-100
0100200300400500
Spe
cific
rate
(nm
ol/1
06 cells
/h)
GLUALA
SER
GLYASPARG HIS CYS
THR ILEVAL
PHE
TYRLYS
LEUPR
OMET
ASN-30-25-20-15-10-505
101520
WD 1.0 WD 1.5 WD 1.9
Biomass mAb
0
5
10
15
20
25
30
Spe
cific
rate
(µg/
106 ce
lls/h
)
GLCLAC
GLN-400-300-200-100
0100200300400500
Spe
cific
rate
(nm
ol/1
06 cells
/h)
GLUALA
SER
GLYASPARG HIS CYS
THR ILEVAL
PHE
TYRLYS
LEUPR
OMET
ASN-20-15-10-505
101520
pH 7.2 pH 6.8
Biomass mAb
0
5
Spe
cific
rate
(µg/
106 ce
lls/h
)
GLCLAC
GLN-400-300-200-100
0100200300400500
Spe
cific
rate
(nm
ol/1
06 cells
/h)
GLU
ALASE
RGLY
ASPARG HIS CYSTHR ILE
VALPH
ETYR
LYSLEU
PRO
METASN
-20-15-10-505
101520
pH 7.2 pH 7.8
Biomass mAb0
2468
101214
C
B
A
Spe
cific
rate
(µg/
106 ce
lls/h
)

CHAPTER 3: LACTATE METABOLISM 37
3.3.2 Metabolic Flux Distribution of Standard Cultivation during
Exponential Growth Phase
The metabolic model based on Mulukutla et al. (2012) contains 4 degrees of freedom
coming from the pyruvate carboxylation reaction as an alternative entry to the TCA
cycle, from two malate to pyruvate pathways located in the cytosol and in the
mitochondria respectively, and the last one from an amino acid synthesis pathway. The
flux distribution in the central metabolic network was investigated using a flux balance
approach with ‘maximization of ATP production’ as the objective function as
suggested and validated for hybridoma cells [138].
The average of the calculated fluxes is shown in Figure 3-3 with error bars
representing the 95% confidence interval corresponding to the variation of input fluxes
calculated from 4 repeated standard cultivations. For convenience, amino acid
synthesis and degradation pathways are not shown. A representation of all intracellular
fluxes is presented in the Appendix (Figure A 3). As shown in Figure 3-3, intracellular
fluxes decrease over time during exponential growth at pH 7.2, which is most apparent
in the glycolytic pathway. Nevertheless, TCA fluxes remain high over the first 12
hours by reducing the lactate flux and therefore increasing the pyruvate influx.
Consequently, the malate-aspartate flux is retained at high rates in order to maintain
the NAD+/NADH balance in the cytosol. At working day 1.9 intracellular fluxes were
significantly reduced compared to the early exponential phase, corresponding to a
reduction of the growth rate by 36% to 0.70 d-1.
The distribution of intracellular fluxes during the short time frame of the exponential
growth phase furthermore clearly demonstrated the effect of culture time, which
should consequently be considered when comparing distinct metabolic states,
especially under the impact of additional external parameters such as pH. This is also
relevant, but often neglected, when differentiating between lactate consumption states
in the stationary growth phase and lactate production states during exponential growth
of fed-batch cultures.

38 CHAPTER 3: LACTATE METABOLISM
Figure 3-3: Intracellular flux distribution within glycolysis, TCA cycle, malate-
aspartate shuttle, glutaminolysis, biomass and mAb synthesis of standard batch
cultivation at three time points during exponential growth phase. The pathways
of amino acid metabolism are not shown. Values of all calculated fluxes are
reported in the Appendix (Figure A 3).
3.3.3 Metabolic Flux Distribution in Lactate Production and Lactate
Consumption State
The two metabolic states of lactate production under standard conditions and lactate
consumption triggered by pH 6.8 are compared in Figure 3-4. While the glucose
uptake rate at low pH (32 nmol/106 cells/h) was reduced compared to standard
conditions (88 nmol/106 cells/h), pH-induced lactate consumption contributed to a
comparable influx into the TCA cycle through pyruvate and triggered a 37% increase
in glutamine uptake. Similarly, high fluxes through the malate-aspartate shuttle were
maintained, presumably due to the requirement of cofactor balancing in the cytosol
[123], [151]. While under standard conditions cytosolic NADH produced by
glyceraldehyde phosphate dehydrogenase (GAPDH) in the glycolytic process is

CHAPTER 3: LACTATE METABOLISM 39
primarily regenerated by lactate dehydrogenase A (LDH-A) reducing pyruvate to
lactate, a switch to lactate consumption causes an additional generation of NADH, and
therefore requires an increased activation of the malate-aspartate shuttle to regenerate
the cofactor NAD+. Thus, the influx into mitochondria was preserved through the
pyruvate node, glutaminolysis and the malate-aspartate shuttle, and resulted only in an
insignificant reduction of the final TCA flux. Therefore, pH-triggered lactate
consumption had no severe consequences on the flux distribution within the main
metabolic network compared to pH 7.2. Nevertheless a 35% increased mAb synthesis
rate was obtained at pH 6.8 mainly due to altered amino acid utilization (Appendix
Figure A 4).
Figure 3-4: Intracellular flux distribution within glycolysis, TCA cycle, malate-
aspartate shuttle, glutaminolysis, biomass and mAb synthesis in lactate
consumption state (pH 6.8) compared to lactate production state at standard
conditions (pH 7.2) at working day 1.9. The pathways of amino acid metabolism
are not shown. Values of all calculated fluxes are reported in the Appendix
(Figure A 4).

40 CHAPTER 3: LACTATE METABOLISM
Mechanistic explanations of the pH effect on cell metabolism, in particular glycolysis
and lactate production/consumption, have been proposed earlier [93], [133]. As
discussed by these authors, lactate consumption might be triggered by a self-regulation
mechanism of the cell trying to counteract the extracellular pH by importing lactate
through the monocarboxylate transporter (MCT), which requires the symport of H+
ions [152]. The authors also argue that pH might alter the activity of glycolytic
enzymes or the membrane potential, which affects the glucose uptake rate and
therefore lactate production and consumption. Even though gene expression of
glycolytic enzymes at pH 6.8 and pH 7.2 does not differ (see Figure 3-5), enzyme
activity can still be affected by pH and is not reflected within gene expression analysis.
At this point, we do not provide any further explanation of the mechanism of action of
pH reduction on the cell metabolism. However, we were able to reveal the
consequences of pH reduction on the intracellular metabolism by FBA.
3.3.4 Metabolic Flux Distribution in Unfavorable Lactate Over-Production
State
The metabolic state of cells at pH 6.8 was the opposite to that observed in cultures at
pH 7.8. Lactate was overproduced, again being triggered by either a self-regulation
mechanism of the cell, by altered membrane potential or by higher enzyme activity in
glycolysis. However, the latter cause of lactate overproduction is yet again not
apparent from gene expression analysis (see Figure 3-5).
Figure 3-5: Gene expression of 32 genes involved in the central murine
metabolism. Data were measured in triplicates and mRNA expression of the two
pH-shifted conditions was compared relative to mRNA expression at the time of
pH shift. 50% over- or under-expression is considered as not significant.
Hk1Hk2 Pfkl
Pgam
2Pk
m2Pep
ck1Pep
ck2Ldha PcxPdha1
Pdha2Dlat
Pdk1
Pdk2
Pdk3 Cs
Idh3aOgdhSd
ha Fh1Mdh1Mdh2AclyMe1Me2Me3
Gpt2Got1Got2Glud
1 GlsG6pd
x-1.0-0.50.00.51.01.52.0
Fold
Cha
nge
pH6.8 pH7.8
CHAPTER 3: LACTATE METABOLISM 41
Together with the high lactate production, an increase in the glucose uptake rate was
observed (196 nmol/106 cells/h compared to 88 nmol/106 cells/h) which was necessary
to keep up with the carbon requirements to produce lactate. A closer look further
revealed that the ratio of total carbon channeled to lactate could not be met solely by
the measured glucose uptake rate (∆L/∆G=2.2) and therefore an additional pathway
had to be active, which could provide more pyruvate for lactate formation. Two PEP
regeneration pathways (OAA → PEP, OAAm → PEPm), that are part of the
gluconeogenic pathway, were considered to fulfill the pyruvate balance. However, due
to the presence of two cyclic pathways and the thereby increased complexity around
the pyruvate node, a unique optimized solution could not be obtained. To identify the
active pathway, mRNA expression of the involved enzymes has hence been taken into
consideration (see Figure 3-5). Considering the conversion of oxaloacetate to
phosphoenolpyruvate, Pepck1 and Pepck2 are the two genes encoding either the
cytosolic or mitochondrial enzyme phosphoenolpyruvate carboxykinase. According to
gene expression analysis, mRNA level of the cytosolic form Pepck1 did not exceed the
threshold value in the qPCR reaction after 36 PCR cycles and therefore was
considered as not expressed. This led to the conclusion that the cytosolic reaction of
oxaloacetate to phosphoenolpyruvate was inactive under all pH conditions and was
therefore not considered in the metabolic network. In contrast, the mitochondrial form
Pepck2 showed a 1.2-fold higher expression at pH 7.8. Thus, under the assumption
that gene expression correlates with enzyme activity, the mitochondrial reaction
OAAm → PEPm has been included in the metabolic network. Furthermore, the
phosphoenolpyruvate transport flux from mitochondria to cytosol was unbound. Other
theoretically possible pathways that could replenish the pyruvate requirements [141],
including the malate to pyruvate conversion by malic enzymes (ME1, ME2 or ME3)
and the cytosolic malate to oxaloacetate conversion by malate dehydrogenase (MDH1)
were excluded after consideration of mRNA expression data (see Figure 3-5). Hence, a
validation of the metabolic network was performed based on gene expression data.
Finally, the identified PEP regeneration reactions were constrained to zero at all pH
conditions other than pH 7.8. However, even without constraining them, this pathway
was not chosen under standard and low pH conditions due to the objective function
requirement ‘maximization of ATP production’, as the mitochondrial PEP

42 CHAPTER 3: LACTATE METABOLISM
regeneration requires ATP and additionally takes away flux from the TCA cycle (data
not shown). Even though this metabolic state appears highly energy-inefficient, it is
further confirmed by a 1.2 fold increase in Pdk2 expression. The Pdk2-encoded protein
phosphorylates pyruvate dehydrogenase, down-regulating the activity of the
mitochondrial pyruvate dehydrogenase complex that drives pyruvate decarboxylation
(PYRm → AcCoAm). The calculated flux distribution is presented in Figure 3-6. By
considering the above described regulatory constraints, the tremendous lactate
formation was fulfilled using PEP regeneration in addition to increased glycolytic
fluxes. As a result, the TCA cycle and malate-aspartate shuttle were almost shut off.
Only an increased glutamate flux by amino acid degradation pathways being converted
to α-ketoglutarate (AKGm) resulted in minor fluxes in the lower part of TCA.
To conclude, the unfavorable pH of 7.8 led to the expression of enzymes that are
traditionally considered to be involved in gluconeogenesis but were recently found to
play an important role in the transition of CHO cells from growth to stationary phase
of fed-batch production [141]. Further, such genes are involved in the regulation of the
TCA cycle activity and concurrently the energy metabolism in different cell types
[153], [154].
Finally, a detailed understanding of the pH effect on intracellular metabolism was
provided, even though the signaling pathway on regulatory level remained unknown. It
is assumed that pH-induced changes were guided by the combination of proton
gradient maintenance, redox balancing and pathway regulation, e.g. inhibition of
glycolytic enzymes. In order to gain a mechanistic understanding of the effect of pH
on cell metabolism, activities of glycolytic enzymes and expression of signaling and
regulatory factors as well as transporters should be further investigated. Likewise, the
intracellular flux redistribution through phosphoenolpyruvate should be confirmed by
isotope measurements using 13C-MFA in an appropriate experimental setup in order to
provide additional evidence to transcript data.

CHAPTER 3: LACTATE METABOLISM 43
Figure 3-6: Intracellular flux distribution including additional mitochondrial
PEP recycle pathway of high pH condition (pH 7.8) compared to lactate
production state at standard conditions (pH 7.2) at working day 1.9. The
pathways of amino acid metabolism are not shown. Values of all calculated fluxes
are reported in the Appendix (Figure A 5).
3.3.5 Consequences of pH-Shifts on the Energy Metabolism
In order to gain more insight into the energy metabolism at different pH conditions,
the ATP production rates were evaluated from the calculated fluxes by applying the
theoretical P/O ratio of 2.5 for NAD(P)H and 1.5 for FADH2 respectively, and are
represented in Figure 3-7. Throughout the exponential growth phase of the standard
batch culture (WD 1.0, WD 1.5 and WD 1.9), the total ATP production qATP decreased
from 5530 (±574) nmol/106cells/h to 2168 (±702) nmol/106cells/h within almost 24
hours and thereby followed the same trend as the intracellular flux distribution (Figure
3-3). Even though the total ATP production rate decreased over time, the ratio between
the different originating pathways remained equal between working day 1.0 and
working day 1.9. The main substance contributing to energy generation was

44 CHAPTER 3: LACTATE METABOLISM
NAD(P)H, which, together with FADH2, was utilized to produce up to 84-87% of the
total ATP by oxidative phosphorylation. The redox cofactors, i.e. NAD(P)H and
FADH2, involved in oxidative phosphorylation can originate either from the TCA
cycle (65-72%), or from other reactions such as the pyruvate decarboxylation reaction
(PYRm → AcCoAm) and reactions within the amino acid metabolism (14-19%) (see
Figure 3-7). Glycolysis accounted for 7-9% of the total ATP production rate and
succinyl CoA synthetase in the TCA cycle contributed to 7% of the ATP production
(Figure 3-7: WD 1.0, WD 1.5, WD 1.9). Throughout the exponential growth phase of
HFN 7.1 cells, the majority of the energy (72% to 79%) was generated in the TCA
cycle either directly in the form of ATP or through oxidative phosphorylation. ATP
utilization for biomass formation, mAb synthesis, amino acid synthesis and
degradation was not considered in this analysis.
Figure 3-7: Comparison of energy metabolism of lactate consumption state (pH
6.8) and lactate overproduction state (pH 7.8) with lactate production state
during the exponential growth phase at standard conditions (pH 7.2). Total ATP
production rate by ATP, NADH and FADH2 was calculated considering different
originating pathways. A P/O ratio of 2.5 for NADH and 1.5 for FADH2 was
assumed.
Comparison of the ATP production rates and the originating pathways was made
between the standard culture on working day 1.9 and pH-shifted conditions (Figure
3-7: pH 6.8, pH 7.8). The metabolic state at pH 6.8 resulted in a slightly lower qATP of
0
1000
2000
3000
4000
5000
6000
pH 7.8pH 6.8 WD 1.9WD 1.5
ATP
flux
(nm
ol/1
06 cells
/h)
Oxi-P(others) TCA Glycolysis Oxi-P(TCA)
WD 1.0

CHAPTER 3: LACTATE METABOLISM 45
1752 (±770) nmol/106cells/h. Energy in the form of ATP was likewise primarily
generated by oxidative phosphorylation (TCA: 73%, others: 17%) and further by
succinyl CoA synthetase in the lower part of the TCA cycle (7%). Furthermore, energy
efficiency of the lactate production and consumption state was compared by
calculating the total ATP production per total carbon moles of substrate. The pH-
triggered lactate consumption state corresponded to an energy efficiency of 4.8 mol
ATP/C-mol, whereas under standard conditions the energy equivalent was equal to 4.1
mol ATP/C-mol. Hence, pH reduction induced a slightly more energy efficient
metabolic state and should therefore be considered similar to glucose depletion in
CHO fed-batch cultures [139], as a trigger for the initiation of energy-efficient
metabolic states.
In the lactate overproduction state at pH 7.8 the low fluxes in TCA and malate-
aspartate shuttle led to an overall decrease in total ATP production of 71% (634 (±172)
nmol/106 cells/h ATP) compared to standard conditions. At the same time NAD(P)H
was no longer the main contributor to the overall ATP production (Figure 3-7).
Instead, more than two-thirds of the produced energy came from ATP directly
generated in glycolysis (68% of total ATP production).
3.3.6 Relevance of pH-induced Metabolic States for the Design and Scale-
up of Industrial Bioprocesses
It is well known that pH has a significant influence on cell performance [97], [155]
and product quality [82], [156] during mammalian cell cultivation. Therefore, pH is
commonly investigated in design of experiments (DOE) approaches and tightly
controlled in an optimal range during cultivation. However, it has been shown that pH
heterogeneities within the bioreactor are present due to carbon dioxide accumulation
or base addition [26]. This is particularly significant when comparing small-scale
bioreactors used for process development and large-scale reactors applied in
production. Therefore, pH heterogeneities should be kept in mind when alterations in
cellular metabolism, particularly in lactate, appear throughout process development
and scale-up. The present study showed that a pH reduction to pH 6.8, which in a
large-scale bioreactor could be caused by CO2 accumulation, instantly induced lactate
consumption and a metabolic state that was energetically more efficient with increased

46 CHAPTER 3: LACTATE METABOLISM
cell productivity. In contrast, at pH 7.8, a pH region that cells could easily experience
locally during alkali addition in large-scale bioreactors, less ATP was generated due to
the fact that glucose was used for lactate formation instead of entering the TCA cycle.
Furthermore, the unusually high lactate formation was afforded not only by increased
glucose uptake, but also by a PEP regeneration pathway. The presented approach can
be applied to increase large-scale process understanding (e.g. heterogeneous culture
conditions), as well as to deduce recommendations for bioprocess control strategies,
such as avoiding the use of base for pH control and rather accept shifts to lower pH
values (up to pH 6.8). According to our results, low pH showed no negative effect on
the culture in terms of energy metabolism but, in contrast, resulted in increased mAb
production.
Hence, by focusing on the whole cellular metabolism, and in particular on the related
energy requirements, rather than just on purely macroscopic variables, we became
aware of additional possibilities for process optimization in murine hybridoma cell
culture.
3.4 Conclusions
This work provides the first example of using a flux balance model containing the
major metabolic pathways of glycolysis, glutaminolysis and the TCA cycle, as well as
the malate-aspartate shuttle for cofactor balancing, to analyze the influence of pH on
cell metabolism during mammalian cell cultivation. Due to a residual degree of
freedom in the model, ‘maximization of ATP’ has been chosen as objective function
and the calculated fluxes were sufficiently tight to describe the metabolic behavior of
murine hybridoma cells. Furthermore, gene expression analysis of metabolic enzymes
was employed for validation of the proposed metabolic network. The analysis
additionally revealed the presence of a pathway that was only activated under high pH
conditions.
Before applying FBA to pH-shifted cultures, the intracellular flux distribution of a
standard cultivation with constant pH was calculated at different time points to
emphasize the often neglected effect of time on cell metabolism. Thus, a comparative
analysis of the two distinct pH-induced metabolic states of lactate consumption and

CHAPTER 3: LACTATE METABOLISM 47
lactate overproduction was performed at the same time point. The presented results
demonstrate the ability of mammalian cells to switch to more energy-efficient states at
low pH and additionally led to the discovery of undesirable changes in metabolic
pathways required to fulfill an increased lactate production at high pH. Finally,
implications of such metabolic states in process control and optimization are provided.
3.5 Remark
The work presented in this chapter has been partially submitted for publication to
Biotechnology Progress.


49
4 An Unstructured Model of Metabolite and
Temperature Dependent Cell Cycle Arrest in
Hybridoma Batch and Fed-Batch Cultures
4.1 Introduction
Fed-batch processes for the production of monoclonal antibodies are well established
at industrial scale. The complexity of these proteins, in particular the requirement of
post-translational modifications, necessitates the use of mammalian cell culture for
their expression. Since the initial use of cell culture technology for mAb production
[12], the biggest achievement in mammalian cell culture over the last three decades
has been the increase in cell productivity [17]. This has on the one hand been achieved
by the use of advanced production cell lines, originating from CHO cells [157]. On the
other hand, optimized culture media [16] and a better comprehension of fed-batch
processes have fostered this improvement. Regarding the latter, process parameters
used to provide control over the culture environment can be tuned to maximize cell
growth as well as productivity [95]. A decrease in the bioreactor pH setpoint, for
instance, increased productivity in multiple mAb producing cell lines [95], [158],
[159].
Temperature, a process parameter that can be rather easily controlled, has been
reported to similarly influence the mAb production rate, particularly when applying
mild hypothermic conditions. NS0 cells, when grown at 34 °C accumulated in the G1
phase and achieved higher antibody production rates, while reaching higher maximal
viable cell concentration with prolonged cell viability [160]. Similarly, CHO cells
showed cell arrest in G1 with a 1.7-fold increase in specific productivity at 30 °C
accompanied by a reduced cell growth rate [161]. The reported effect of temperature is
not limited to the G1 phase, as others have reported cell blockage in the G2/M phase
post temperature shift [162], or even a rapid decrease in the S phase [163]. Moreover,
Ducommun et al. [164] reported a 6-fold increase in the specific production rate and a
stabilization of the viable cell concentration in continuous CHO cell culture with

50 CHAPTER 4: CELL CYCLE TRANSITION
temperature decrease to 32 °C. Similarly, Schatz et al. [165] showed a 38-fold increase
in product yield with a temperature shift from 37 °C to 28 °C. Nevertheless,
temperature shifts do not always result in an increased product yield. Some reports
showed a prolonged cell viability [166] or higher maximum viable cell concentration
[167] at lower temperatures, accompanied by a lower antibody yield. Others yet have
reported a longer lag phase at 33 °C but achieved comparable cell densities to 37 °C,
together with reduced productivity [168]. Moreover, temperature influenced the cell
cycle, as evident from an increased G1 phase fraction [169], though this was not linked
to a positive effect on mAb titer.
Literature reports are variable and the results seem to depend on the cell lines, the
expression systems, and the expressed recombinant product [170], [171]. To some
extent, the differences can be attributed to the complex link between the cell cycle
being at the center of cellular growth, death, and productivity [172], [173]. In order to
find a good balance between temperature-induced growth limitation (and consequently
the integral viable cell density – IVCD [174]) and cell-specific productivity [171],
temperature dependency has to be investigated and the time point of the temperature
shift needs to be optimized with the aim to increase the final antibody titer.
A quantitative understanding of the effect of temperature can aid bioprocess
development to improve product titer and product quality. Different temperature
conditions and shift strategies are investigated during industrial bioprocess
development. However, these investigations are empirical and lack a systematic,
model-based approach. The development of relevant mathematical models can help
define optimal temperature profiles and is therefore of practical importance. Early
contributions [175], [176], initiated the study and analysis of the temperature effect on
the cell cycle by employing and formulating mathematical models. Further
developments of cell cycle models to study and analyze conditions that enhanced
antibody production have been reported [177–180], although without accounting for
temperature effects. Temperature was however considered in the study of Fox et al.
[181] with the aim to optimize temperature shift times, albeit without considering the
cell cycle. Recently, Karra et al. [96] proposed a detailed mass-based population
balance model with cell cycle segregation and linked it to an unstructured model

CHAPTER 4: CELL CYCLE TRANSITION 51
including the temperature effect. Unfortunately, the model was validated only during
batch culture, which lacks industrial relevance.
Herein we formulate a temperature-dependent cell cycle model for a mAb producing
mammalian cell line. The model is developed for cultures in batch and fed-batch mode
– covering a range of nutrient conditions – while capturing the distribution of cells in
different cell cycle phases, including the quiescent state (G0). We validate the model
experimentally and use it to predict the time points for temperature shifts in fed-batch
culture. The overall methodology maps the path to systematically develop industrially
relevant mathematical models with the aim to optimize cultivation temperature
profiles.
4.2 Materials and Methods
4.2.1 Cell line and Media
HFN 7.1 murine hybridoma cells (ATCC CRL-1606) [87] adapted to chemically
defined, protein- and peptide-free culture media Turbodoma® TP6 (Cell Culture
Technologies) were used in this study. The media was prepared following the vendor’s
instruction and supplemented with 4.5 g/L D-glucose, 4 mM L-glutamine and 0.1%
(w/v) pluronic F-68. Cells were sub-cultured in suspension for 14 days at 37 °C in a
humidified incubator containing 5% CO2 and subsequently used for batch and fed-
batch cultivations.
4.2.2 Shake Flask Batch Culture
HFN 7.1 cells were cultured in triplicates in 1 L Erlenmeyer flasks (Corning) with 240
mL working volume at a seeding cell concentration of 0.6 x 10⁶ cells/mL. At the start
of each batch experiment the temperature was set to either 37 °C or 33 °C. Mixing was
accomplished using a Stuart SSL1 orbital shaker (Bibby Scientific) at 125 rpm. Viable
cell concentration and viability were evaluated manually by a dye-exclusion method
using Erythrosin-B stain solution. Samples were counted using a haemocytometer
under the Leica DM-IL inverted phase microscope (Leica). Samples were taken twice
a day and centrifuged at 660rpm for 3 minutes. The supernatant was stored at -20 °C
for metabolic profiling and antibody titer determination. 1 x 10⁶ cells were fixed by

52 CHAPTER 4: CELL CYCLE TRANSITION
drop wise addition of 1 mL of 75% v/v ice-cold ethanol for DNA analysis. The fixed
cells were stored at -20 °C prior to cell cycle analysis.
4.2.3 Fed-Batch Cell Culture
Fed-batch cultures were performed in a parallel bioreactor system (DasGip) equipped
with online temperature, pH and dissolved oxygen measurement probes (Mettler-
Toledo), a pitched-blade impeller and a porous sparger (10 µm). Cells were seeded
into the bioreactor at a cell concentration of 0.6 x 10⁶ cells/mL in a working volume of
1 L. Dissolved oxygen was controlled at 50% air saturation with a constant airflow of
3 L/h and an oxygen on demand strategy. pH setpoint was set equal to 7.2 over the
whole culture and controlled initially by CO2 sparging and in some cases by base
addition (2 mol/L sodium hydroxide) depending on the lactate production of the
growing cells. Temperature was either set to 37 °C and kept constant throughout the
culture or shifted to mild hypothermia (33 °C) at three different time points (t = 0 h,
t = 30 h, t = 76 h) by changing the controller setpoint. The time required for the reactor
to reach the new temperature setpoint was negligible short.
A continuous feed of amino acids (RPMI-1640 50x, Sigma), vitamins (RPMI-1640
100x, Sigma), trace elements (trace element mix 1000x, Bioconcept) and L-glutamine
(64 mmol/L) was initiated 30 hours after inoculation with a constant pump rate of 2.33
mL/h. D-glucose feeding solution (1 mol/L) was fed from the beginning of the culture
in order to keep the glucose concentration in the bioreactor at a setpoint of 20 mM.
The pump rate of the glucose solution was adjusted every 12 hours according to the
measured viable cell concentration and specific glucose consumption rate resulting in
a semi-continuous feeding mode.
Samples were taken twice a day and the viable cell concentration was determined by a
CedeX cell counter (Innovatis) using the trypan blue exclusion method [88].
Concentrations of glucose and lactate were measured immediately using a Super GL
compact instrument (Hitado). Samples were stored at -20 °C for later analysis of
metabolites and IgG1 concentration.
Once a day 2 x 10⁶ cells were fixed by drop wise addition of 2 mL of 75% v/v ice-cold
ethanol. The fixed cells were stored at -20 °C prior to cell cycle analysis.

CHAPTER 4: CELL CYCLE TRANSITION 53
4.2.4 Cell Cycle Analysis
Prior to flow cytometric analysis, fixed cell samples from the batch culture were
washed with a rinsing solution with 1% w/v bovine serum albumin (Sigma) and 0.01%
w/v sodium azide (Sigma Aldrich) in PBS [182]. DNA staining was performed for 30
minutes in the dark, followed by the addition of 1mL of 50 μg/mL propidium iodide
(PI; Sigma, P4170) and of 100 μg/mL ribonuclease A (Sigma, R4875) in PBS at room
temperature. Fixed fed-batch cell samples were washed twice with 1% w/v fetal
bovine serum (PAN Biotech GmbH) in PBS and re-suspended in 200 µL washing
solution. 100 µL of the cell suspension was incubated with 5 µL FITC conjugated
Mouse Anti-Human Ki-67 antibody (556026, BD Pharmingen) for 30 minutes in the
dark at room temperature. Ki-67 staining is used to determine the proliferating cell
population (G1, S, G2/M). After incubation with Ki-67 antibody, the excess stain was
washed with 1% w/v fetal bovine serum (PAN Biotech GmbH) in PBS. DNA was
stained by the addition of 0.5 mL propidium iodide (1 μg/ml) (P4864, Sigma) and 100
μg/ml ribonuclease A (EN053, Thermo Scientific) in PBS and incubated for 30
minutes in the dark at room temperature.
Flow cytometry was performed on a LSRFortessa (BD) with an excitation wavelength
of 561 nm, or on a Calibur flow cytometer (BD) with an excitation wavelength of 488
nm. The data were collected with a 582/15 filter for PI on FACS LSRFortessa, or a
585/42 filter for PI on FACS Calibur and a 530/30 filter for FITC on FACS Calibur.
To reduce the spillover of FITC into the PI channel, compensation was performed
using a FITC single color control sample. Between 10,000-20,000 events/sample were
collected. The data were analyzed using FlowJo software (Tree Star Inc).
4.2.5 Metabolic Profiling
The extracellular concentrations of ammonium, lactate, glutamine and glucose in the
batch culture were measured from the supernatant samples using a Nova BioProfile
400 Analyzer (Nova Biomedical).
Glutamine concentrations in the fed-batch culture were measured from the supernatant
by HPLC (ZORBAX Eclipse Plus C18 4.6 mm x 150 mm, Agilent Technologies)
according to Agilent’s application note (5990-3283EN). Prior to the HPLC

54 CHAPTER 4: CELL CYCLE TRANSITION
measurement, supernatant samples were filtered at 4000 rcf, 4 °C for 25 minutes using
a Vivaspin500 (5 kDa) centrifugation filter (Satorius Stedim). Ammonium
concentrations were determined using the L-Glutamine/Ammonia (Rapid) Assay Kit
(K-GLNAM, Megazyme) following the vendor’s protocol.
4.2.6 Extracellular Antibody Quantification
Monoclonal antibody concentrations were determined from the supernatant by
standard affinity chromatography using a PA ImmunoDetection® Sensor Cartridge
(Applied Biosystems) containing immobilized protein G.
4.3 Modeling Aspects
4.3.1 Model Structure
The model was developed on basis of previous models [183–185] that included the
description of the cell cycle phases (XG0, XG1, XS, XG2M). The model is stated in the
form of ordinary differential equations (Eq.4-1 – Eq. 4-4). The transition between the
phases is schematically presented in Figure 4-1.
G1 phase:
𝑑(𝑉𝐺1𝑉)𝑑𝑑
= 2𝑘𝐺2/𝑀−𝐺1𝑉𝐺2/𝑀𝑉 − 𝑘𝐺1−𝑆𝑉𝐺1𝑉 − 𝑘𝐺1−𝐺0𝑉𝐺1𝑉
− 𝑘𝑑𝑉𝐺1𝑉 − 𝐹𝑂𝑈𝑇𝑉𝐺1 (4-1)
S phase: 𝑑(𝑉𝑆𝑉)𝑑𝑑
= 𝑘𝐺1−𝑆𝑚𝑠𝑡𝑟𝑒𝑠𝑠𝑉𝐺1𝑉 − 𝑘𝑆−𝐺2/𝑀𝑉𝑆𝑉 − 𝑘𝑑𝑉𝑆𝑉 − 𝐹𝑂𝑈𝑇𝑉𝑆 (4-2)
G2/M
phase:
𝑑�𝑉𝐺2/𝑀𝑉�𝑑𝑑
= 𝑘𝑆−𝐺2/𝑀𝑉𝑆𝑉 − 𝑘𝐺2/𝑀−𝐺1𝑉𝐺2/𝑀𝑉 − 𝑘𝑑𝑉𝐺2/𝑀𝑉
− 𝐹𝑂𝑈𝑇𝑉𝐺2/𝑀 (4-3)
G0 phase:
𝑑(𝑉𝐺0𝑉)𝑑𝑑
= 𝑘𝐺1−𝑆(1 −𝑚𝑠𝑡𝑟𝑒𝑠𝑠)𝑉𝐺1𝑉 + 𝑘𝐺1−𝐺0𝑉𝐺1𝑉 − 𝑘𝑑𝑉𝐺0𝑉
− 𝐹𝑂𝑈𝑇𝑉𝐺0 (4-4)
Viable
cells: 𝑑(𝑉𝑉𝑉)𝑑𝑑
=𝑑(𝑉𝐺0𝑉)
𝑑𝑑+𝑑(𝑉𝐺1𝑉)
𝑑𝑑+𝑑(𝑉𝑆𝑉)𝑑𝑑
+𝑑(𝑉𝐺2/𝑀𝑉)
𝑑𝑑 (4-5)

CHAPTER 4: CELL CYCLE TRANSITION 55
Dead cells: 𝑑(𝑉𝑉𝐷)𝑑𝑑
= 𝑉𝑉𝑘𝑑𝑉 − 𝑉𝐷𝑘𝑙𝑦𝑠𝑉 (4-6)
Cell Cycle
fractions: 𝑓𝑖=𝐺0,𝐺1,𝑆,𝐺2/𝑀 =
𝑉𝑖𝑉𝑉
(4-7)
The viable cell population (XV) is calculated as the sum of all cell cycle phases (Eq. 4-
5). The dead cell population (XD) can be estimated from the viable cells (Eq. 4-6).
Thus, the cell cycle fractions (fi) can be calculated according to equation 4-7.
The transition rates between the subpopulations XG1-XS (k1G1-S) (Eq. 4-8), XS-XG2/M (kS-
G2M) (Eq. 4-9), and XG2/M-XG1 (kG2/M-G1) (Eq. 4-10) are stated as previously derived
[183]. The transition to the G0 phase is triggered by two types of stresses: temperature-
dependent stress (kG1-G0) (Eq. 4-11), which is expected to have a constant rate rT when
lowered from 37 °C to 33 °C and/or metabolic stresses (mstress,) (Eq. 4-12). The
metabolic stress is defined as the product of the substrate limitation, toxic metabolite
inhibition, and a certain resistance to such stresses (fres).
G1 to S: kG1−S = �µ +FOUT
V� �
2 − fG1fG1
� (4-8)
S to G2/M: kS−G2/M = �µ +FOUT
V� �
1 + fG2/M
fS� (4-9)
G2/M to
G1: kG2/M−G1 = �µ +
FOUTV
� �1
fG2/M� (4-10)
G1 to G0: kG1−G0 = �T = 33 °C = rTT = 37 °C = 0 � (4-11)
Metabolic
stresses: mstress = � if finh1finh2flim1fres > 1 = 1
else = finh1finh2flim1fres (4-12)
As can be seen from equations 4-8 – 4-10, the growth-associated transitions are
dependent on the growth rate (μ) (Eq. 4-13), which is formulated as a function of the
characteristic times that are required to complete every cell cycle phase (tG1, tS, tG2/M,)
(Eq. 4-14). Several biological contributions were considered to affect these

56 CHAPTER 4: CELL CYCLE TRANSITION
characteristic times including temperature (kT) (Eq. 4-15) [186], the availability of
substrate (flim1) (Eq. 4-16), and the toxic effect of metabolites (finh1/inh2) (Eq. 4-17)
[125]. In the case of the last two, a Monod kinetics form was assumed [187]. The
death rate (kd,) (Eq. 4-18) is formulated based on previous reports [187], [188],
including glutamine limitation (flim1), and it is considered that death can occur at any of
the cell cycle phases.
Growth
rate: 𝜇 =
ln (2)𝑑𝐺1 + 𝑑𝑆 + 𝑑𝐺2/𝑀
(4-13)
Cell cycle
times: 𝑑𝐺1,𝐺2/𝑀 =
𝑑𝐺1,𝐺2/𝑀 𝑖𝑛𝑖𝑡𝑖𝑎𝑙𝑘𝑇flim1finh2finh1
𝑛 𝑑𝑆 =𝑑𝑆 𝑖𝑛𝑖𝑡𝑖𝑎𝑙 + 𝑘𝑇
flim1finh2finh12 (4-14)
Cell cycle
temperature
factor
𝑘𝑇 = ��𝑇 = 33°𝐶 = 𝑘𝑇𝑇 = 37°𝐶 = 1 � (4-15)
Limiting
functions: flim1 =
[Gln]𝐾𝐺𝑙𝑛 + [Gln] (4-16)
Inhibition
functions: finh1 =𝐾𝐿𝑎𝑐
𝐾𝐿𝑎𝑐 + [𝐿𝑎𝑐] finh2 =𝐾𝐴𝑚𝑛
𝐾𝐴𝑚𝑛 + [𝐴𝑚𝑛] (4-17)
Death rate: 𝑘𝑑 =𝑘𝑑𝑀𝐴𝑋
�1 + flim1𝐾𝑑𝐴𝑚𝑚[𝐴𝑀𝑀]�
(4-18)
The changes in substrate and metabolite concentrations are calculated by performing a
mass balance around the bioreactor while accounting for the cell metabolism [187],
[188]. The bioreactor functions under the assumptions of perfect mixing and operates
under batch and fed-batch mode. The change in volume (V) is therefore related to
feeding (FGlc, FGln) or sampling (Fout) (Eq. 4-19). The change in glutamine
concentration [Gln] is dependent on the glutamine uptake (QGln), glutamine
degradation into ammonia (Kdeg), and the presence of glutamine in the feed ([Glnfeed])
(Eq. 4-20). The glutamine uptake depends on the cell growth rate considering a
specific yield on glutamine (YGln), an uptake limitation function following Monod
kinetics (fupt), and a maintenance term (mGln) [189] (Eq. 4-21). The ammonia

CHAPTER 4: CELL CYCLE TRANSITION 57
concentration [Amm] is closely linked to the glutamine changes by the yield of
ammonia on the glutamine consumption (YAmm) and the degradation of glutamine (Eq.
4-22), as described above.
Reactor
volume: 𝑑𝑉𝑑𝑑
= 𝐹𝐺𝑙𝑐 + 𝐹𝐺𝑙𝑛 − 𝐹𝑂𝑈𝑇 (4-19)
Glutamine:
𝑑([𝐺𝑙𝑛]𝑉)𝑑𝑑
= −𝑄𝐺𝑙𝑛𝑉𝑉𝑉 − 𝐾𝑑𝑒𝑔[𝐺𝑙𝑛]𝑉 + 𝐹𝐺𝑙𝑛[𝐺𝑙𝑛𝐹𝑒𝑒𝑑]
− 𝐹𝑂𝑈𝑇[𝐺𝑙𝑛] (4-20)
𝑄𝐺𝑙𝑛 = �𝜇𝑌𝐺𝑙𝑛
� fupt + 𝑚𝐺𝑙𝑛 fupt =[Gln]
𝐾𝐺𝑙𝑛 + [Gln] (4-21)
mGln =α1[Gln]α2 + [Gln]
Ammonium: 𝑑([𝐴𝑚𝑛]𝑉)𝑑𝑑
= 𝑄𝐺𝑙𝑛𝑌𝐴𝑚𝑛𝑉𝑉𝑉 + 𝐾𝑑𝑒𝑔[𝐺𝑙𝑛]𝑉 − 𝐹𝑂𝑈𝑇[𝐴𝑚𝑛] (4-22)
The glucose concentration [Glc] (Eq. 4-23) depends on the glucose uptake rate (QGlc),
the glucose maintenance consumption (mGlc), and the glucose concentration in the feed
([Glcfeed]). QGlc has been formulated considering glutamine being an essential
biosynthetic precursor for cells [190], and glucose consumption being temperature-
dependent [166], as well as inhibited by lactate [151]. Equation 4-24 combines those
three effects on glucose uptake (Eq. 4-24). Moreover, it is assumed that cells in the
quiescent state G0 will consume glucose at a maintenance rate, as in this phase there is
minimal cell growth [191]. The lactate balance [Lac] (Eq. 4-25) is connected to
glucose consumption (QGlc, mGlc) by a variable yield of lactate on glucose (YLac)
induced by a feedback inhibition as previously reported [125] (Eq. 4-26).
Glucose:
𝑑([𝐺𝑙𝑐]𝑉)𝑑𝑑
= −𝑄𝐺𝑙𝑐𝑉𝑉(1 − 𝑓𝐺0)𝑉 −𝑚𝐺𝑙𝑐𝑉𝑉𝑓𝐺0𝑉
+ 𝐹𝐺𝑙𝑐[𝐺𝑙𝑐𝐹𝑒𝑒𝑑] − 𝐹𝑂𝑈𝑇[𝐺𝑙𝑐] (4-23)
𝑄𝐺𝑙𝑐 = �𝜇𝑌𝐺𝑙𝑐
� fuptfinh1𝑘𝑇 (4-24)

58 CHAPTER 4: CELL CYCLE TRANSITION
Lactate:
𝑑([𝐿𝑎𝑐]𝑉)𝑑𝑑
= 𝑌𝐿𝑎𝑐𝑄𝐺𝑙𝑐𝑉𝑉(1 − 𝑓𝐺0)𝑉 − 𝑌𝐿𝑎𝑐𝑚𝐺𝑙𝑐𝑉𝑉𝑓𝐺0𝑉
− 𝐹𝑂𝑈𝑇[𝐿𝑎𝑐] (4-25)
𝑌𝐿𝑎𝑐 = 𝑌𝐿𝑎𝑐 𝑖𝑛𝑖𝑡𝑖𝑎𝑙finh1(𝑚+𝑘𝑇) (4-26)
The change in monoclonal antibody concentration ([mAb]) (Eq. 4-27) is growth
associated and separated in antibody specific cell cycle productivity rates (qi).
Antibody:
𝑑([𝑚𝐴𝑏]𝑉)𝑑𝑑
= 𝜇�𝑞𝐺1/𝐺0(𝑉𝐺1 + 𝑉𝐺0) + 𝑞𝑆𝑉𝑆 + 𝑞𝐺2/𝑀𝑉𝐺2/𝑀�
− 𝐹𝑂𝑈𝑇[𝑚𝐴𝑏] (4-27)
4.3.2 Temperature Dependent Population Transition
An important aspect of the proposed population modelling is the cell behavior at the
time of temperature transition. Given that the cell growth (μ) has been formulated as
being temperature-dependent, cell growth transition takes place when the reactor
temperature is switched (i.e. from normal conditions at 37 °C to mild hypothermia at
33 °C). This formulation reflects the dynamic and adaptive process of cell growth.
Therefore, the temperature shift is not expected to be reflected instantaneously in the
cell growth. Such behavior has been previously reported after a temperature shift as a
gradual decrease in the S phase [163], a partial blockage in the G2/M [162] and an
eventual increase in the G1 cell phase [160]. In order to capture such dynamics, it is
herein assumed that after a temperature shift the existing cell population will
proliferate at a transitory rate, where the G1 and S phase will remain at a fast rate (i.e.
37 °C) and G2/M will be affected immediately (i.e. 33 °C). However, every new born
cell of the existing population will proliferate under new reactor temperature (Figure
4-1). Therefore, the existing population will be metabolically active during transition
until this population disappears either because it completes the cell cycle, gets arrested
at G0 or dies. The cells in G0 will continue to consume glutamine at the transition
conditions until the end of the culture. Thereby cells in G0 that are still active in
biosynthesis – since glutamine plays a key role in cell metabolism [192–194] – but do
not grow or commit to apoptosis (an energy intensive process) [195], are considered.

CHAPTER 4: CELL CYCLE TRANSITION 59
On contrary, the metabolism of all newly born cells will be immediately affected and
is therefore calculated considering the new reactor temperature.
Figure 4-1: Schematic representation of the cell cycle model.
4.3.3 Global Sensitivity Analysis and Parameter Estimation
After defining the model type and structure, the uncertainty of the parameters in the
model output was studied as outlined in the mathematical modelling development
framework [196–198]. In order to systematically evaluate the output variability, global
sensitivity analysis (GSA) was performed. The full range of 27 parameters was varied
±50% from their nominal value and evaluated over 40 000 scenarios generated using
the sobolset function in Matlab. Each scenario was evaluated using the go:MATLAB
tool from gPROMs® providing the link between both softwares. The sensitivity
indexes (SIs) were calculated using the GUI-HDMR software [199].
Six outputs were evaluated (XV, fG1, fS, fG2M, fG0 and mAb) at five time points (12, 24,
36, 48, 96 and 144h) of a fed-batch culture. The SIs are the result of the GSA and vary
between 0 and 1, with 0 being not significant. The cut-off value to determine the
significant parameters was set at 0.1 since 10% can be attributed to experimental errors
[200]. Therefore, parameters that are not identified as significant can be fixed at their
nominal value and the significant parameters should be re-estimated using
experimental data to minimize the output uncertainty.

60 CHAPTER 4: CELL CYCLE TRANSITION
4.4 Results
4.4.1 Global Sensitivity Analysis and Parameter Estimation
Global sensitivity analysis allows studying the output sensitivity to the variation of the
model input parameters. This process can aid the model development as the most
significant parameters are identified (and re-estimated), whereas the non-significant
parameters can be fixed at their initial value (from literature or assumed). Herein, the
majority of the nominal values were set to literature values as previously reported
[201]. The time points for the GSA were selected in order to evaluate different phases
of a fed-batch process including a temperature shift during the exponential growth
phase at 40 hours. Specifically the time points from the lag phase (day 0.5), early
exponential (day 1), exponential phase (day 1.5), exponential after the temperature
shift (day 2), stationary phase (day 4) and decline phase (day 6) were evaluated. GSA
results in Figure 4-2 are represented at 3 time points to illustrate the time evolution of
the sensitivity index (SI) using six output parameters (XV, mAb, fG0, fG1, fS and fG2/M).
The analysis resulted in the identification of 9 significant parameters (i.e. SI above 0.1
as defined). The SIs for the output of viable cell concentration (XV) for the different
time points are shown (Figure 4-2A). XV was sensitive to the variation of the cell cycle
times (tSinitial, tG2/Minitial) at early stages of the culture and its sensitivity decreased in
time (though remaining significant). This can be attributed to the connection of
characteristic cell cycle times to the cell growth rate. In contrast, the significance of
the resistance to the metabolic stresses (fres) increased along the culture time, reaching
significance at the stationary growth phase. The sensitivity towards the yield of
biomass on glutamine (YGln) increased at early stages, peaked at day 1.5 (data point not
shown), and decreased towards the end of the culture. Comparable results were
observed for the output considering mAb concentration (Figure 4-2B). In addition to
the cell cycle times, the mAb-specific productivity for the G1/G0 phase (qG1/G0) and S
phase (qS) were found to be significant at early stages of the culture, thereby showing
the importance of defining cell cycle specific production rates. The cell cycle
temperature factor (kT) and the sensitivity of cell cycle times to lactate inhibition (n)
were significant during the stationary and decline growth phase. In these phases lactate
is likely to reach inhibitory concentrations. The G0 cell fraction (fG0) output was highly

CHAPTER 4: CELL CYCLE TRANSITION 61
sensitive to the resistance to metabolic stresses throughout the culture (Figure 4-2C).
Similarly, other cell cycle fractions showed an increasing sensitivity towards this
parameter along the culture. The G1 cell fraction (fG1) was sensitive at early stages to
the initial S phase cell cycle time and at late stages to the G2/M cell cycle time, as well
as to the initial G1 cell cycle time (tG1initial) throughout culture time (Figure 4-2D). The
S phase cell fraction (fS) was sensitive to the initial S phase cell cycle time and to the
G1 cell cycle time (Figure 4-2E), and the G2/M fraction (fG2/M) was sensitive to the
initial S phase cell cycle time and to the G2/M cell cycle time (Figure 4-2F). The three
cell cycle fractions (fG1, fS, fG2/M) associated to proliferation showed sensitivity to the
cell cycle temperature factor (kT) at the time points after the temperature shift.
The association of cell cycle time estimates to all studied GSA outputs stresses the
importance of considering the cell cycle heterogeneity. Similarly, the cell cycle
temperature factor was identified significant for the outputs of proliferating cell cycle
phases, XV and the antibody production. Such a dependency supports the importance
and critical aspect of finding a balance between growth and productivity when using
temperature to optimize fed-batch processes. Particularly, if one or more of the cell
cycle phases are associated to productivity, as obtained from GSA.
Based on these results, significant parameters were re-estimated with the gPROMS
parameter estimator (based on the maximum likelihood formulation), using
experimental data from the 37 °C and 33 °C batch and 37 °C and 33 °C fed-batch
cultivations. The chosen experimental data sets assess apart from two temperature
setpoints (37 °C and 33 °C), the effect of metabolic stresses, which are partially also
identified as sensitive parameters. Batch cultures cover nutrient depletion, that is
responsible for triggering changes in the cell behavior [202]. Similarly, fed-batch
cultures capture the dynamics of toxic metabolite accumulation due to feeding
strategies which are of industrial relevance. The new parameter set, estimated from 4
experimental data sets is reported with the 95% confidence intervals in the Appendix
(Table A 6). The largest confidence intervals are reported for cell cycle specific
productivities (qG1/G0, qS) and reflect a weak estimation of these parameters which is
due to the growth-associated antibody production of HFN 7.1 cells.

62 CHAPTER 4: CELL CYCLE TRANSITION
Figure 4-2: Sensitivity indices for parameters at simulation times (day 1, 4 and 6).
(A) viable cell concentration (Xv), (B) mAb titer, (C) G0 cell fraction (fG0), (D) G1
cell fraction (fG1) (E) S cell fraction (fS) (F) G2/M cell fraction (fG2/M). The
nomenclature is equal as in Eq. 4-1 – 4-27.
Kd (max
)K (ly
s)
Kd (Amm)
k (T)r (T
)
K (deg
)
K (Gln)
K (Lac
)
K (Amm)
K (upt)
Y (Glc)
Y (Gln)
Y (Lac
)
Y (Amm)
m (Glc)
alpha
1
alpha
2 n mf (r
es)
t (G1 i
nitial)
t (G2/M
initia
l)
t (S in
itial)
q (G1/G
0)q (
S)
q (G2/M
)0.00.10.20.30.40.50.60.70.80.9
day 1 day 4 day 6
Sens
itivity
Inde
x
A
Kd (max
)K (ly
s)
Kd (Amm)
k (T)r (T
)
K (deg
)
K (Gln)
K (Lac
)
K (Amm)
K (upt)
Y (Glc)
Y (Gln)
Y (Lac
)
Y (Amm)
m (Glc)
alpha
1
alpha
2 n mf (r
es)
t (G1 i
nitial)
t (G2/M
initia
l)
t (S in
itial)
q (G1/G
0)q (
S)
q (G2/M
)0.00.10.20.30.40.50.60.70.80.9B
day 1 day 4 day 6
Se
nsitiv
ity In
dex
Kd (max
)K (ly
s)
Kd (Amm)
k (T)r (T
)
K (deg
)
K (Gln)
K (Lac
)
K (Amm)
K (upt)
Y (Glc)
Y (Gln)
Y (Lac
)
Y (Amm)
m (Glc)
alpha
1
alpha
2 n mf (r
es)
t (G1 i
nitial)
t (G2/M
initia
l)
t (S in
itial)
q (G1/G
0)q (
S)
q (G2/M
)0.00.10.20.30.40.50.60.70.80.9C
day 1 day 4 day 6
Sens
itivity
Inde
x
Kd (max
)K (ly
s)
Kd (Amm)
k (T)r (T
)
K (deg
)
K (Gln)
K (Lac
)
K (Amm)
K (upt)
Y (Glc)
Y (Gln)
Y (Lac
)
Y (Amm)
m (Glc)
alpha
1
alpha
2 n mf (r
es)
t (G1 i
nitial)
t (G2/M
initia
l)
t (S in
itial)
q (G1/G
0)q (
S)
q (G2/M
)0.00.10.20.30.40.50.60.70.80.9D
day 1 day 4 day 6
Sens
itivity
Inde
x
Kd (max
)K (ly
s)
Kd (Amm)
k (T)r (T
)
K (deg
)
K (Gln)
K (Lac
)
K (Amm)
K (upt)
Y (Glc)
Y (Gln)
Y (Lac
)
Y (Amm)
m (Glc)
alpha
1
alpha
2 n mf (r
es)
t (G1 i
nitial)
t (G2/M
initia
l)
t (S in
itial)
q (G1/G
0)q (
S)
q (G2/M
)0.00.10.20.30.40.50.60.70.80.9E
day 1 day 4 day 6
Sens
itivity
Inde
x
Kd (max
)K (ly
s)
Kd (Amm)
k (T)r (T
)
K (deg
)
K (Gln)
K (Lac
)
K (Amm)
K (upt)
Y (Glc)
Y (Gln)
Y (Lac
)
Y (Amm)
m (Glc)
alpha
1
alpha
2 n mf (r
es)
t (G1 i
nitial)
t (G2/M
initia
l)
t (S in
itial)
q (G1/G
0)q (
S)
q (G2/M
)0.00.10.20.30.40.50.60.70.80.9F
day 1 day 4 day 6
Sens
itivity
Inde
x

CHAPTER 4: CELL CYCLE TRANSITION 63
4.4.2 Temperature Shifted Batch Cultures
The 37 °C batch culture performed in shake flasks under uncontrolled pH conditions
shows the typical batch operation profiles (Figure 4-3). Briefly, the viable cell
concentration (XV) increases exponentially after a short period of adaption (lag phase),
and peaks around the time when one of the key substrates (in this case glutamine GLN)
is exhausted. After glutamine depletion, the proliferation slows down and a significant
death rate is observed (decline phase), coinciding with the increase of the lumped
G1/G0 population and the corresponding decrease of the S and G2/M fractions. The
toxic metabolite production (LAC, AMM) is correlated to the substrate consumption
(GLC, GLN), as well as the antibody concentration (mAb) to the viable cell
concentration.
The experimental data of the 37 °C batch culture are used for parameter estimation in
the formulated model. The fit of the 37 °C batch culture is shown in Figure 4-3. The
model describes the viable cell concentration and viability trends, although there are
small deviations between absolute values of viability in the model and the experiment.
Regarding cell cycle fractions, the change in the cell cycle trend after the exhaustion of
glutamine was captured. At the same time, an initial discrepancy in the model
description for the S and G2/M cell cycle fractions is observed at early stages (~0.5
days). Substrate profiles and lactate production are well predicted by the model,
whereas the ammonia profile is consistently over-estimated. The yield of ammonia on
glutamine (Yamm) is considered constant in the model. However, it has been shown that
Yamm depends on temperature and pH [93], [203]. This can serve as a reason for the
observed discrepancies in the ammonia profile particularly in pH-uncontrolled shake-
flask cultures. Nevertheless, the overall trend describing ammonia production is
correct. The antibody titer is satisfactorily described up to around 2 days of culture.
After this point the model starts to slightly deviate from the experimental data.

64 CHAPTER 4: CELL CYCLE TRANSITION
Figure 4-3: Shake flask batch culture at 37 °C. Experimental results of viable cell
concentration (Xv), viability, antibody concentration (mAb), glucose (GLC),
lactate (LAC), glutamine (GLN) and ammonia (AMM) concentrations, and cell
cycle fractions G0/G1, S, G2/M compared to model results (solid line: Xv, LAC,
AMM, G0/G1, S, G2/M fractions; dashed lines: viability, mAb, GLC, GLN).
The 33 °C batch cultivation includes the effect of temperature reduction at the
beginning of the culture (0 days) (Figure 4-4). The trends observed for viable cell
concentration XV, viability, substrates (GLC, GLN) and toxic metabolites (LAC, AMM)
are comparable to the 37 °C culture. However, a significantly lower maximum XV is
achieved (1.8-fold smaller compared to the 37 °C batch), with a corresponding lower
final antibody concentration (1.4-fold lower compared to the 37 °C batch) despite
0
20
40
60
80
100
0.0
0.2
0.4
0.6
10
20
30
0.0
0.2
0.4
0.6
0 1 2 30
1
2
3
0 1 2 30.0
0.2
0.4
0.6
Xv viability mAb GLC LAC GLN AMMG0/G1 S G2/M
Xv (1
05 cel
ls/ m
L), V
iabi
lity (%
)
0.0
0.2
0.4
0.6
0.8
1.0
Antib
ody
Conc
. (g/
L)
G0/
G1
Frac
tion
GLC
, LAC
(mm
ol/ L
)
S Fr
actio
n
Time (d)
GLN
, AM
M (m
mol
/ L)
Time (d)
G2/
M F
ract
ion

CHAPTER 4: CELL CYCLE TRANSITION 65
having a 1.5-fold longer culture time. The substrate/toxic metabolite profiles still have
a good correlation, although the lactate production was further increased at late stages
of the culture even at low glucose consumption. The cell cycle fractions showed minor
changes during the first 0.5 day of culture. Around day 1 a significant change in the
cell cycle distribution was observed, which coincided with the initiation of exponential
growth, and was followed by rather constant cell cycle fractions until the end of the
culture. After glutamine depletion, an increased dispersion in the G1/G0 and G2/M
fractions was observed.
The experimental trends of the 33 °C batch culture that were likewise used for
parameter estimation are fitted by the proposed model (Figure 4-4). Maximum XV and
the timing at which it was achieved (day 3) are properly captured.
However, some differences are observed at early stages corresponding to a pronounced
lag phase, as well as during the decline phase. The latter is also reflected in the over-
estimation of viability compared to the experimental data. The substrate profiles (GLC,
GLN) together with the AMM and antibody profiles are satisfactorily modeled
throughout the culture. The lactate profile shows a good fit up to 3 days, even though
the experimentally observed constant increase cannot be captured by the model. It is
assumed that uncontrolled pH-conditions in the shake flask system are responsible for
the observed differences. The sharp changes in the cell cycle distribution observed at
day 1 are reflected in the model simulations, however appear earlier compared to the
experimental cell cycle fractions. The model formulation is unable to capture the
prolonged lag phase that seemed to take place while the cells were adapting to the new
temperature condition. This is due to the fact that cells are considered homogenous
within a cell cycle phase. Such differences can be attributed to specific cell cycle
transitions of cohorts or partially synchronized populations. In order to model these
particular cell cycle changes, another internal coordinate needs to be employed in a
segregated formulation such as population balance models. Additional discrepancies
appear in the simulations of lumped G1/G0 and G2/M fractions at the late stage of the
cell culture.

66 CHAPTER 4: CELL CYCLE TRANSITION
Figure 4-4: Shake flask batch culture at 33 °C. Experimental results of viable cell
concentration (Xv), viability, antibody concentration (mAb), glucose (GLC),
lactate (LAC), glutamine (GLN) and ammonia (AMM) concentrations, and cell
cycle fractions G0/G1, S, G2/M compared to model results (solid line: Xv, LAC,
AMM, G0/G1, S, G2/M fractions; dashed lines: viability, mAb, GLC, GLN).
4.4.3 Temperature Shifted Fed-Batch Cultures
Standard 37 °C fed-batch cultures were carried out as duplicates in controlled
bioreactors, and were used for parameter estimation in addition to batch cultures
(Figure 4-5). The increase in viable cell concentration by 2.1-fold compared to a
standard batch culture is attributed to a continuous feed of glucose, amino acids
0
20
40
60
80
100
0.0
0.2
0.4
0.6
10
20
30
0.0
0.2
0.4
0.6
0 1 2 3 4 50
1
2
3
0 1 2 3 4 50.0
0.2
0.4
0.6
Xv viability mAb GLC LAC GLN AMM G0/G1 S G2/M
Xv (1
05 cel
ls/ m
L), V
iabi
lity (%
)
0.0
0.2
0.4
0.6
0.8
1.0
Antib
ody
Conc
. (g/
L)
G0/
G1
Frac
tion
GLC
, LAC
(mm
ol/ L
)
S Fr
actio
n
Time (d)
GLN
, AM
M (m
mol
/ L)
Time (d)
G2/
M F
ract
ion

CHAPTER 4: CELL CYCLE TRANSITION 67
(including glutamine), vitamins and trace elements. Avoidance of key substrate
exhaustion (GLC, GLN) results in a prolonged stationary phase for several days at
maintained high viability. Glucose and glutamine are consumed throughout the
culture, although at a slower rate towards the end. The feeding strategy results in high
toxic metabolite (LAC, AMM) levels [125]. In particular, ammonia reaches 5.5-fold
higher concentrations compared to the 37 °C batch. Around day 3, ammonia exceeds
toxic concentrations and simultaneously lactate concentration plateaus. As a result, an
arrest in the G0 cell cycle phase is triggered. The G0 fraction increases steadily until
the end of the cultivation with the accumulation of lactate and ammonia over this
period. The observed experimental variation in the lactate profile is attributed to pH
control by CO2 sparging and varying amount of base (sodium hydroxide) added in the
bioreactor control strategy. Similarly the relationship of lactate production and base
addition in pH-controlled bioreactors accompanied by high osmolarity, has been
shown in industrial fed-batch processes to result in big differences in the final lactate
profile, without affecting the growth profile [204].
The model fit for the fed-batch culture at 37 °C is provided in Figure 4-5. The
increase, peak and decline of XV are closely fitted. While the viability decline in the
late stage of the culture is underestimated in batch, it is better captured in fed-batch.
This difference in the model performance can be explained by the different
experimental setups used for batch and fed-batch cultures. Initial comparative 37 °C
batch cultures performed in both cultivation systems showed good agreement, except
for cell viability profiles (data not shown). In general, viability remains higher in the
controlled bioreactor. This observation is attributed to the different cell counting
methods used to determine viable cell concentrations. In batch culture, viable cells
were counted manually, whereas in fed-batch cells they were determined automatically
with a lower cell cut-off size set at 9 µm. Moreover, hydromechanical stress rates are
considerably smaller in shake flask cultures [205] and therefore the variations in
viability can also be attributed to differences in cell lysis within the two experimental
setups, which are not considered in the model.

68 CHAPTER 4: CELL CYCLE TRANSITION
Figure 4-5: Controlled fed-batch culture at 37 °C. Experimental results of viable
cell concentration (Xv), viability, antibody concentration (mAb), glucose (GLC),
lactate (LAC), glutamine (GLN) and ammonia (AMM) concentrations, and cell
cycle fractions G0, G1, S, G2/M compared to model results (solid line: Xv, LAC,
AMM, G1, S, G2/M fractions; dashed lines: viability, mAb, GLC, GLN, G0
fraction).
Regarding the trend of cell cycle fractions (fG0, fG1, fS, fG2/M) including the timing of G0
increase triggered by metabolite accumulation (LAC, AMM), it is well described in the
model. Taking decreased substrate uptake rates along the culture into consideration, a
good description of the glutamine profile was achieved, whereas the glucose
0
20
40
60
80
100
0.0
0.2
0.4
0.6
10
20
30
40
50
60
0.0
0.2
0.4
0.6
0 1 2 3 4 5 6 7 802468
101214
0 1 2 3 4 5 6 7 80.0
0.2
0.4
0.6
Xv viability mAb GLC LAC GLN AMMG0 G1 S G2/M
Xv (1
05 cel
ls/ m
L), V
iabi
lity (%
)
0.0
0.2
0.4
0.6
0.8
1.0
Antib
ody
Conc
. (g/
L)
G0,
G1
Frac
tion
GLC
, LAC
(mm
ol/ L
)
S Fr
actio
n
Time (d)
GLN
, AM
M (m
mol
/ L)
Time (d)
G2/
M F
ract
ion

CHAPTER 4: CELL CYCLE TRANSITION 69
consumption seems to be even further decreased in the last two days of culture.
Profiles of AMM and antibody show a good fit, with some differences in antibody
concentration on the last culture day. The decrease in titer can be attributed to protein
degradation due to increased proteolytic activity towards the end of the culture [206].
The averaged lactate profile is also adequately modeled. Since experimentally
observed differences in the lactate profile did not significantly affect other model
outputs (i.e. viable cells, viability, mAb titer, cell cycle distribution), it was sufficient
to use the averaged lactate concentration as a triggering range.
A 33 °C fed-batch culture with initial temperature shift (at time point 0) represents a
further experimental data set for parameter estimation (Figure 4-6). A significantly
lower cell concentration XV is reached (2.6-fold lower when compared to the 37 °C
fed-batch culture). Due to decreased glucose consumption rates, especially towards the
end of the culture, a lower lactate concentration is obtained. However, ammonia
concentrations reach levels comparable to those at 37 °C, while less glutamine is
consumed. Most importantly, a cell arrest towards the G0 cell cycle fraction is evident
from the beginning of the culture with a steady increase over the remaining cultivation
time. Thus, cell cycle arrest is, in addition to metabolic control, also triggered by
hypothermia.
The fit of the 33 °C fed-batch culture is shown in Figure 4-6. XV is accurately fitted and
only slightly over-estimated during the decline phase. Cell viability, antibody
concentration and cell cycle fractions are well described. Substrates (GLC, GLN) as
well as the LAC profile show acceptable agreement, while the ammonia simulation
follows the data trend but is highly under-estimated. Ammonia production was
assumed to be solely dependent on glutamine. However, ammonia is also a product of
asparagine consumption [37], an amino acid present in high concentration in the feed.
In addition, amino acid consumption has been shown to be affected by temperature
[207], thus providing an explanation for the discrepancies.

70 CHAPTER 4: CELL CYCLE TRANSITION
Figure 4-6: Controlled fed-batch culture shifted to 33 °C at culture start.
Experimental results of viable cell concentration (Xv), viability, antibody
concentration (mAb), glucose (GLC), lactate (LAC), glutamine (GLN) and
ammonia (AMM) concentrations, and cell cycle fractions G0, G1, S, G2/M
compared to model results (solid line: Xv, LAC, AMM, G1, S, G2/M fractions;
dashed lines: viability, mAb, GLC, GLN, G0 fraction).
4.4.4 Prediction of Temperature Shift Time in Fed-Batch Cultures
The model was used to predict two fed-batch experiments with temperature shifts from
37 °C to 33 °C during the exponential growth phase (30 hours) and in the early
stationary phase (76 hours).
0
20
40
60
80
100
0.0
0.2
0.4
0.6
10
20
30
0.0
0.2
0.4
0.6
0 1 2 3 4 5 6 7 802468
101214
0 1 2 3 4 5 6 7 80.0
0.2
0.4
0.6
Xv viability mAb GLC LAC GLN AMMG0 G1 S G2/M
Xv (1
05 cel
ls/ m
L), V
iabi
lity (%
)
0.0
0.2
0.4
0.6
0.8
1.0
Antib
ody
Conc
. (g/
L)
G0,
G1
Frac
tion
GLC
, LAC
(mm
ol/ L
)
S Fr
actio
n
Time (d)
GLN
, AM
M (m
mol
/ L)
Time (d)
G2/
M F
ract
ion

CHAPTER 4: CELL CYCLE TRANSITION 71
Figure 4-7: Controlled fed-batch culture with temperature shift to 33 °C after 30
h. Shift is indicated by dotted line. Experimental results of viable cell
concentration (Xv), viability, antibody concentration (mAb), glucose (GLC),
lactate (LAC), glutamine (GLN) and ammonia (AMM) concentrations, and cell
cycle fractions G0, G1, S, G2/M compared to model prediction (solid line: Xv,
LAC, AMM, G1, S, G2/M fractions; dashed lines: viability, mAb, GLC, GLN, G0).
Temperature reduction after 30 hours is overall well predicted by the model (Figure
4-7). The profile of Xv follows the trend with minor discrepancies. The exponential
phase, during which the temperature shift is performed, shows an over-estimation,
whereas the prolonged stationary/decline phase is slightly under-estimated. In fact, the
resulting viable cell concentration is comparable to the 37 °C fed-batch culture (85%).
0
20
40
60
80
100
0.0
0.2
0.4
0.6
10
20
30
0.0
0.2
0.4
0.6
0 1 2 3 4 5 6 7 802468
101214
0 1 2 3 4 5 6 7 80.0
0.2
0.4
0.6
Xv viability mAb GLC LAC GLN AMMG0 G1 S G2/M
Xv (1
05 cel
ls/ m
L), V
iabi
lity (%
)
0.0
0.2
0.4
0.6
0.8
1.0
Antib
ody
Conc
. (g/
L)
G0,
G1
Frac
tion
GLC
, LAC
(mm
ol/ L
)
S Fr
actio
n
Time (d)
GLN
, AM
M (m
mol
/ L)
Time (d)
G2/
M F
ract
ion

72 CHAPTER 4: CELL CYCLE TRANSITION
The antibody concentration is slightly underestimated after day 4.5, but the prediction
of decreased final mAb concentration compared to 37 °C (90%) is met. Likewise, the
decrease in GLC consumption accompanied by a lower LAC production, as well as
ammonia production expected to remain high as in previous fed-batch cultures, is well
predicted. Glutamine consumption properly predicted until day 2, shows a systematic
difference between the model and the data suggesting that glutamine is consumed at a
higher rate than predicted. The increase in quiescent cells due to toxic metabolite
accumulation and temperature shift is represented by the increase of the G0 fraction at
the time of the temperature shift and further rise throughout the culture. Furthermore,
the shift in temperature is followed by changes in the proliferating cell cycle fractions
such as an increase in the G1 cell fraction. Initial discrepancies in the S and G2/M
fraction are in the same range as the ones observed in the 37 °C standard fed-batch
culture, even though the general trend is captured.
The second model prediction considers a fed-batch culture with temperature shift from
37 °C to 33 °C at 76 hours (Figure 4-8). A further delay of the temperature shift time is
expected to result in higher cell concentrations compared to the earlier shift time
points. Experimental data show that the viable cell concentration is affected instantly
by the temperature shift, reaching 95% of XV at standard 37 °C, and the model matches
the profile during all growth phases to satisfaction. Viability and antibody
concentration profiles show good agreement between the simulation and the data.
Final antibody titer remains at 90% of the 37 °C standard fed-batch culture and does
not show further improvement. The glucose consumption trend is well predicted, even
though after the temperature shift glucose consumption seems to be systematically
under-predicted. On the contrary, the glutamine profile shows systematic differences
by under-estimating glutamine consumption after the temperature shift. Toxic
metabolite profiles followed the prediction with similar differences as observed before.
The G0 fraction starts to increase at day 2 due to metabolic effectors and is further
triggered by the temperature shift. The model is able to predict the behavior of cell
arrest. Solely an experimentally observed decrease in G0 during the last 2 day of the
cultivation accompanied by an increase in G1 fraction is not represented in the model.

CHAPTER 4: CELL CYCLE TRANSITION 73
As in the previous cases, soon after the temperature shift the sharp change in the cell
cycle fractions is in good agreement to the model prediction.
Figure 4-8: Temperature shifted controlled fed-batch culture to 33 °C after 76 h.
Shift in indicated by a dotted line. Experimental results of viable cell
concentration (Xv), viability, antibody concentration (mAb), glucose (GLC),
lactate (LAC), glutamine (GLN) and ammonia (AMM) concentrations, and cell
cycle fractions G0, G1, S, G2/M compared to model prediction (solid line: Xv,
LAC, AMM, G1, S, G2/M fractions; dashed lines: viability, mAb, GLC, GLN, G0
fraction).
0
20
40
60
80
100
0.0
0.2
0.4
0.6
10
20
30
40
0.0
0.2
0.4
0.6
0 1 2 3 4 5 6 7 802468
101214
0 1 2 3 4 5 6 7 80.0
0.2
0.4
0.6
Xv viability mAb GLC LAC GLN AMMG0 G1 S G2/M
Xv (1
05 cel
ls/ m
L), V
iabi
lity (%
)
0.0
0.2
0.4
0.6
0.8
1.0
Antib
ody
Conc
. (g/
L)
G0,
G1
Frac
tion
GLC
, LAC
(mm
ol/ L
)
S Fr
actio
n
Time (d)
GLN
, AM
M (m
mol
/ L)
Time (d)
G2/
M F
ract
ion

74 CHAPTER 4: CELL CYCLE TRANSITION
4.5 Discussion
The presented model serves as a tool to study the temperature effect in mammalian cell
culture systems. The impact of temperature shifts is addressed by considering an
unstructured cell cycle model that captures the basic heterogeneity of the system. In
addition to temperature effects, metabolic stresses, such as substrate depletion or toxic
metabolite accumulation, are considered on the cell cycle level to account for different
process modes (batch and fed-batch). This could be accomplished by providing
experimental measurements of the quiescent cell cycle phase in addition to commonly
measured proliferating cell cycle phases for model development. Thus, the model was
formulated using first principles and further developed by using the existing model
development framework [196–198]. The framework describes a procedure that
includes the identification of sensitive parameters and their re-estimation using
experimental data from batch and fed-batch cultures at two different temperature
setpoints. When applying this model to other cell lines, such parameters can easily be
estimated from small-scale cultures used for pre-studies in bioprocess development.
The proposed procedure, validated in HFN 7.1 hybridoma cell culture was able to
capture the experimental trends of batch and fed-batch cultures, especially considering
the relationship between temperature, growth and productivity as the main focus.
Minor discrepancies are mostly observed on metabolic level. In particular, the glucose
uptake rate seemed to be even further decreased along the culture than predicted by the
model. Similarly, ammonia production was considered to only depend on glutamine
consumption and degradation, which resulted in an underestimation of experimental
results. In order to achieve a better representation of substrate and metabolite profiles,
metabolic relations need to be further redefined. Nonetheless, the model was able to
successfully predict two temperature shift scenarios and to capture most of the
experimentally observed trends, not only on growth and metabolism, but also at the
cell cycle level. Most importantly, the model correctly captured the G0 cell cycle phase
arrest. The importance of the cell arrest is reflected in a number of studies [95], [161],
[163], [173], [208] that have used this phase to increase productivity in commercially
relevant cell lines. Moreover, the relevance of considering the cell cycle segregation

CHAPTER 4: CELL CYCLE TRANSITION 75
and the temperature growth regulation is of industrial interest as this is often the
method of choice for improving productivity [186].
HFN 7.1 cells are characterized by growth-associated antibody production reflected in
a weak estimation of cell cycle specific productivities (qG1/G0, qS). On the contrary,
productivity in other cell lines has been associated to specific cell cycle phases [172],
[173], [209]. In such cases, the developed model is readily applicable and provides a
means to systematically optimize the cell cycle-to-productivity-relationship. However,
the formulation of an industrially significant cell cycle model is not limited to
temperature dependency, but also to the inclusion of biologically relevant events (e.g.
apoptosis, product quality).
This model approach can be employed to systematically study and optimize
temperature shift strategies. Particularly, the use of computational modeling is a
complementary tool that needs to be adopted in biochemical processes [210]. The
advantage of the presented approach over the commonly adopted design of experiment
(DoE) approach relies on the ability to capture the complex dynamic relations of the
mammalian culture system.
4.6 Conclusions
The importance of the results presented herein lies in the development of relevant
modeling approaches and a procedure to assist mammalian cell culture process
development. In particular, time points of temperature shifts can be predicted in fed-
batch culture in order to optimize productivity. The development of an unstructured
model of metabolic- and temperature-dependent cell cycle arrest is validated in
hybridoma batch and fed-batch cultures. Through sensitivity analysis and parameter
estimation using two batch and two fed-batch experimental data sets 9 sensitive
parameters are re-estimated and used to predict different temperature shift time points
in fed-batch culture. This model formulation allows studying complex processes of
biological systems with the experimental tools currently available.

76 CHAPTER 4: CELL CYCLE TRANSITION
4.7 Remark
The work presented in this chapter has been performed in collaboration with Prof.
Mantalaris’ group from Imperial College London. The model has been developed in
the Mantalaris group and batch cultivations have been performed in their group. Fed-
batch experiments including cell cycle analysis have been performed in the Morbidelli
group at ETH Zurich.
77
5 Concluding Remarks
Through this work, a better understanding of the influence of process parameters on
cultured cells and their expressed proteins has been obtained.
The first two studies focused on experimental approaches that can be applied to
optimize process conditions with the aim of obtaining a comparable cell behavior
regardless of bioreactor scale or aiming in desired product quality. In particular, pH
was identified as a crucial parameter, as it can be used to modify mAb glycosylation
and control lactate production and consumption. The effect of pH on glycosylation
was evaluated in controlled batch culture using MALDI-TOF and HPLC-based
glycosylation analysis. The redistribution of the cell metabolism due to pH alteration
was identified by flux balance analysis and validated by gene expression analysis. The
calculated flux distribution provides an insight into pathway utilization and energy
generation in cell metabolism. Due to the difficulties regarding pH control in large-
scale bioreactors, the findings of both studies explain observed changes in
glycosylation and metabolism during scale-up and can be further exploited for process
control and optimization.
In addition to experimental investigations, mathematical models can support process
optimization by linking complex biological system to process conditions such as
hypothermia. The last study described a mathematical model that predicts the time
point of temperature shifts on the level of cell proliferation and arrest. In addition to
temperature-dependent cell cycle arrest, the model is validated against metabolite-
dependent arrest and is applicable to different culture modes. The aim of such a model
is to achieve a good balance of cell growth and productivity in fed-batch culture.
The presented studies fit well in the scope of Quality by Design (QbD) principles,
where process parameters are investigated in order to identify their impact on critical
quality attributes. In this context, the first study assessed ranges of different physical
and chemical stress parameters representing common bioprocess conditions and
defined their ability to maintain a given glycosylation pattern. Through this analysis,
certain parameters such as sparging rate could be excluded from being qualified as

78 CHAPTER 4: CELL CYCLE TRANSITION
critical, whereas osmolarity only became important once combined with pH. The
presented methodology could in future be further applied in a high-throughput setting
for studying additional parameters such as CO2, as well as for experiments where
multiple process parameters are simultaneously changed. In this way a broad range of
process parameters could be defined as truly critical for mAb glycosylation.
The use of a QbD-based approach to assess environmental conditions is gaining
increasing importance due to the emergence of biosimilar drugs. In the case of
biosimilars, the originator drug defines the reference quality attributes such as the
glycosylation pattern. Experimental or model-based approaches such as the ones
presented here are therefore becoming an integral part of bioprocess development.

79
6 Outlook
The experimental and model-based approaches that have been presented in this thesis
were tested with one cellular system, a murine hybridoma cell line producing a
monoclonal antibody. In this way the impact of multiple process parameters on mAb
glycosylation, cellular growth and metabolism could be compared among each other.
In order to test for the generality of the approaches, the developed methodologies
require further application on multiple cellular systems, as well as on one defined cell
line producing different glycoproteins. In addition to hybridoma cells, it would be
beneficial to apply the presented procedures to CHO cells, as the most commonly used
mammalian host cells for monoclonal antibody production in industry.
In this way more general conclusions on process parameters affecting glycosylation
and on the degree of the observed changes in glycosylation, as presented in chapter 2
could be drawn. In addition, an extension of the study could include a separate
investigation of glycosylation control by nutrients and feeds using the same cellular
system. The outcome of this study could then be compared to the impact of process
parameters. This would help defining general and complete process conditions and
process parameters that can be applied as control variables to obtain the desired
glycosylation profile following the QbD approach.
The methodology used to study pH alterations on cellular metabolism, as described in
chapter 3, would also benefit from a general approach including different cell lines.
This would provide an insight into whether the flux balance model together with the
chosen objective function hold for the cultivation of multiple mammalian cell lines in
bioreactor systems. In order to confirm the calculated pathway utilization at different
pH conditions, the flux distribution requires experimental validation by isotope
measurements using 13C-metabolic flux analysis. Such measurements should however
be performed in a different, more appropriate experimental setup such as a shake flask
system, since they are not feasible in bioreactors.
The cell cycle model framework together with the described procedure to re-estimate
model parameters presented in chapter 4 will ideally be tested using a cell line that

80 CHAPTER 6: APPENDIX
shows growth-independent productivity. Such cell lines are characterized by a
production phase that appears during stationary growth and would therefore be highly
related to specific cell cycle phases. Due to the different intrinsic cellular
characteristics, such a system would provide an ideal validation of the developed
model framework.
To conclude, QbD-based studies profit from high-throughput and automatization
allowing the simultaneous investigation of multiple process conditions with high
reproducibility. Thus, it will be beneficial to perform future studies in novel high-
throughput bioreactor systems.

81
7 Appendix
7.1 Appendix for “Evaluating the Impact of Cell Culture Process
Parameters on Monoclonal Antibody N-Glycosylation”
7.1.1 Deglycosylation by PNGase F and 2-AB Labeling
N-linked oligosaccharides of each mAb preparation were enzymatically released by
addition of 2 µL of N-glycosidase F (PNGase F glycerol free) (New England Biolabs)
in the supplied buffer for 14 hours at 37 °C. Prior to deglycosylation each mAb
preparation was denatured with the supplied glycoprotein denaturing buffer at 37 °C
for 10 minutes. After deglycosylation the oligosaccharides were bound to a Supelclean
ENVI-Carb column tube (Sigma Aldrich) in 2% acetonitrile / 0.1 mol/L ammonium
acetate solution, washed and eluted with 50% acetonitrile in H2O. The eluent was
collected and evaporated to dryness in a Vacufuge® plus (Eppendorf).
N-linked oligosaccharides were fluorescently labeled with 20 µL of 0.35 mol/L 2-
aminobenzamide (2-AB) (Sigma Aldrich) in a solution of 70% DMSO, 30% glacial
acetic acid, 1 mol/L sodium cyanoborohydride according to Bigge et al. (1995) for 2
hours at 65 °C. The reaction mixture was cooled down and diluted with 380 µL
acetonitrile. Labeled oligosaccharides were purified with Whatman 3MM filter paper
disks according to Merry et al. (2002). Briefly, the reaction mixture was loaded on the
paper disk and excess 2-AB dye was washed 3 times with 95% acetonitrile. The 2-AB
labeled oligosaccharides were eluted 3 times with Milli-Q water (Millipore) and stored
at -20 °C.
7.1.2 HPLC Separation of 2-AB Labeled Oligosaccharides
30 µL of the 2-AB labeled oligosaccharides sample was diluted in 70 µL acetonitrile.
90 µL of the prepared sample was injected at a flow rate of 0.6 mL/min on an Agilent
1200 HPLC system (Agilent Technologies) equipped with a fluorescence detector for
analysis by hydrophilic interaction chromatography (HILIC) using a GlykoSep N-Plus
column (4.6 mm x 150 mm, Prozyme). N-linked oligosaccharides were separated
based on their hydrodynamic volume using a gradient system of buffer A (10 mmol/L

82 CHAPTER 7: APPENDIX
formic acid, 80% acetonitrile) and buffer B (30 mmol/L formic acid, 40% acetonitrile)
at pH 4.4 with a linear increase from 30 – 90% of buffer B over 90 min. The separated
oligosaccharides were fluorescently detected with an excitation wavelength of 250 nm
and an emission wavelength of 410 nm. The peak fractions were collected every
minute with a fraction collector FC 203B (Gilson), concentrated to approximately 10
µL in a Vacufuge® plus (Eppendorf), and stored at -20 °C for mass spectrometry
(MS) analysis.
7.1.3 N-linked Oligosaccharide Analysis by Matrix-Assisted Laser
Desorption/Ionization Time-Of-Flight (MALDI-TOF) Mass
Spectrometry (MS)
MS analysis was performed at the Functional Genomic Center Zurich using a 4800
Plus MALDI TOF/TOF system (AB SCIEX) equipped with a 200 Hz Nd:YAG laser.
2-AB labeled N-linked oligosaccharides were desalted by ZipTip µ-C18 pipette tips
(Millipore). ZipTips were wetted with 80% acetonitrile and twice equilibrated with
Milli-Q water (Millipore), 10 µL of sample was bound by 5 times pipetting up and
down and washed twice with 0.1% formic acid. 0.9 µL of 2,5-dihydroxybenzoic acid
(DHB) matrix (10 g/L) in 70% acetonitrile was pipetted 3 times up and down with the
previously prepared ZipTip µ-C18, spotted onto a 384 Opti-TOF MALDI target plate
and dried at room temperature. The MALDI-TOF mass spectrometer was operated in
reflectron positive and negative ion mode with a laser intensity of 5400 – 5600 arb.
Mass spectra were acquired by accumulating 1000 – 4000 subspectra in a mass range
from 750 m/z – 4000 m/z. Fragment ions of oligosaccharides were detected by MS/MS
with collision-induced dissociation (CID) in positive and negative ion mode. The
following parameter settings were applied in the MS/MS mode: Laser intensity: 5700 –
6000 arb, collision gas pressure: 2.5 x 10⁻⁶ Torr, timed ion selector (TIS) resolution:
150, accumulation of 2000 – 4000 subspectra.
Proposed glycan structures were either deduced from the fragmentation pattern
obtained from MS/MS analysis, by comparison of obtained masses with databases
provided in GlycoWorkBench2 [100] or by comparison of HPLC profiles with
commercial Cetuximab antibody with a known glycan profile [48].

CHAPTER 7: APPENDIX 83
Figure A 1: MALDI-TOF MS spectra of the 2-AB labeled oligosaccharide
released from HFN 7.1 antibody by PNGase F in (A) positive ion mode and (B)
negative ion mode. Peaks in positive ion mode are either detected as Na+ or K+
adducts. (C) Fragmentation pattern of G1F (m/z 1767.70) obtained by MALDI-
TOF MS/MS in positive ion mode. Sugar residues are N-acetylglucosamine
(GlcNAc, ), fucose (F, ), mannose (M, ), galactose (G, ).
1500 2000 2500 30000
20406080
100
1500 2000 2500 30000
20406080
100
2253.83
C
2091.79
1945.721929.75
1799.64
1783.67
1637.59
1621.62
1767.70
1605.65
1565.66
1402.57In
tensit
y %
m/z
1459.59
2578.15
B
2522.10
2902.30
2359.072376.08
2740.20
2197.03
2213.022050.96
2034.97
1958.841905.78
1847.87
1796.77
1733.03
1743.27
1634.70
1581.10
Inten
sity
%
m/z
A
204.12
366.19
388.17
510.25
550.26
713.35
741.33
915.39
1077.46
1118.50
1253.59
1298.55
1280.49
1402.64
1384.59
1564.69
1605.67
1621.70
500 1000 15000
20
40
60
80
100
Inten
sity
%
m/z
MS/MS at m/z 1767.70 [M+Na]+
(G1F)

84 CHAPTER 7: APPENDIX
Table A 1: Measured masses of reductively aminated oligosaccharides
determined by MALDI-TOF MS and compared to theoretical masses. Proposed
glycoforms were assigned to the glycosylation profile in Figure 2-4.
Mea
sure
d m
/z v
alue
s
[M-H
] -
- - -
1581
.10
1743
.27
1847
.87
1905
.78
-
2034
.97
2050
.96
2197
.03
[M+K
] +
- - -
1621
.62
1783
.67
-
1945
.72
- - - -
[M+N
a] +
1402
.57
1459
.59
1564
.63
1605
.65
1767
.70
-
1929
.75
2091
.79
- - -
The
oret
ical
m
ass (
Da)
1379
.53
1436
.56
1541
.59
1582
.61
1744
.67
1848
.68
1906
.72
2068
.77
2035
.76
2051
.76
2197
.81
Olig
o-sa
ccha
ride
b
Sym
bol
G0
G0F
G1F
G2F
G3F
G0F
-G
alN
GN
A
Com
posi
tiona
(Hex
NA
c2H
ex3)
FucH
exN
Ac
(Hex
NA
c2H
ex3)
Hex
NA
c2
(Hex
NA
c2H
ex3)
FucH
exN
AcH
ex
(Hex
NA
c2H
ex3)
FucH
exN
Ac2
(Hex
NA
c2H
ex3)
FucH
exN
Ac2
Hex
(Hex
NA
c2H
ex3)
FucH
exN
AcH
exN
euG
c
(Hex
NA
c2H
ex3)
FucH
exN
Ac2
Hex
2
(Hex
NA
c2H
ex3)
FucH
exN
Ac2
Hex
3
(Hex
NA
c2H
ex3)
Fuc(
Hex
NA
cHex
Neu
Ac)
H
exN
Ac
(Hex
NA
c2H
ex3)
Fuc(
Hex
NA
cHex
Neu
Gc)
H
exN
Ac
(Hex
NA
c2H
ex3)
Fuc(
Hex
NA
cHex
Neu
Ac)
H
exN
AcH
ex

CHAPTER 7: APPENDIX 85
Mea
sure
d m
/z v
alue
s
[M-H
] -
2213
.02
-
2359
.07
2375
.08
2520
.08
2578
.15
2740
.20
2902
.30
a H
ex, H
exN
Ac,
Fuc
, Neu
Gc,
Neu
Ac
indi
cate
hex
ose,
N-a
cety
lhex
osam
ine,
fuco
se, N
-gly
coly
lneu
ram
inic
aci
d an
d N
-ace
tyln
eura
min
ic
acid
, res
pect
ivel
y.
b Suga
r res
idue
s are
N-a
cety
lglu
cosa
min
e (G
lcN
Ac,
),
fuco
se (F
, )
, man
nose
(M,
), g
alac
tose
(G,
) a
nd N
-gly
coly
lneu
ram
inic
aci
d
(NG
NA
,
)
[M+K
] +
- - - - - - - -
[M+N
a] +
-
2253
.83
- - - - - -
The
oret
ical
m
ass (
Da)
2213
.81
2230
.82
2359
.87
2375
.86
2520
.90
2578
.94
2740
.99
2903
.05
Olig
o-sa
ccha
ride
b
Sym
bol
G2F
-N
GN
A
G2F
-G
alN
GN
A
G2F
-N
GN
A2
Com
posi
tiona
(Hex
NA
c2H
ex3)
Fuc(
Hex
NA
cHex
Neu
Gc)
H
exN
AcH
ex
(Hex
NA
c2H
ex3)
Fuc(
Hex
NA
cHex
2)H
exN
AcH
ex2
(Hex
NA
c2H
ex3)
Fuc(
Hex
NA
cHex
Neu
Ac)
H
exN
AcH
ex2
(Hex
NA
c2H
ex3)
Fuc(
Hex
NA
cHex
Neu
Gc)
H
exN
AcH
ex2
(Hex
NA
c2H
ex3)
Fuc(
Hex
NA
cHex
Neu
Gc)
2
(Hex
NA
c2H
ex3)
Fuc(
Hex
NA
cHex
Neu
Gc)
(H
exN
AcH
ex2)
Hex
NA
c
(Hex
NA
c2H
ex3)
Fuc(
Hex
NA
cHex
Neu
Gc)
(H
exN
AcH
ex2)
Hex
NA
cHex
(Hex
NA
c2H
ex3)
Fuc(
Hex
NA
cHex
Neu
Gc)
(H
exN
AcH
ex2)
Hex
NA
cHex
2

86 CHAPTER 7: APPENDIX
7.2 Appendix for “Insights into pH induced Metabolic Switch by
Flux Balance Analysis”
7.2.1 Gene Expression Analysis
Table A 2: List of target genes investigated by gene expression analysis.
Gene Symbol Name
1 Hk1 hexokinase 1 2 Hk2 hexokinase 2 3 Pfkl phosphofructokinase, liver 4 Pgam2 phosphoglycerate mutase 2 5 Pkm2 pyruvate kinase muscle 6 Pepck1 phosphoenolpyruvate carboxykinase 1, cytosolic 7 Pepck2 phosphoenolpyruvate carboxykinase 2, mitochondrial 8 Ldha lactate dehydrogenase A 9 Pcx pyruvate carboxylase 10 Pdha1 pyruvate dehydrogenase E1 alpha 1 11 Pdha2 pyruvate dehydrogenase E1 alpha 2 12 Dlat dihydrolipoamide S-acetyltransferase 13 Pdk1 pyruvate dehydrogenase kinase, isoenzyme 1 14 Pdk2 pyruvate dehydrogenase kinase, isoenzyme 2 15 Pdk3 pyruvate dehydrogenase kinase, isoenzyme 3 16 Cs citrate synthase 17 Idh3a isocitrate dehydrogenase 3 alpha 18 Ogdh oxoglutarate dehydrogenase 19 Sdha succinate dehydrogenase complex, subunit A 20 Fh1 fumarate hydratase 1 21 Mdh1 malate dehydrogenase 1, NAD 22 Mdh2 malate dehydrogenase 2, NAD, mitochondrial 23 Acly ATP citrate lyase 24 Me1 malic enzyme 1, cytosolic 25 Me2 malic enzyme 2, mitochondrial NADP dependent 26 Me3 malic enzyme 3, mitochondrial NAD dependent

CHAPTER 7: APPENDIX 87
27 Gpt2 glutamic pyruvic transaminase 2 28 Got1 glutamate oxaloacetate transaminase 1 29 Got2 glutamate oxaloacetate transaminase 2 30 Glud1 glutamate dehydrogenase 1 (=GDH) 31 Gls glutaminase 32 G6pdh glucose-6-phosphate dehydrogenase

88 CHAPTER 7: APPENDIX
7.2.2 Metabolic Network for Flux Balance Analysis
Table A 3: Reactions in the metabolic network used for flux balance analysis.
Glycolysis 1 GLC6P <-> F6P 2 F6P + ATP -> ADP + 2 GAP 3 GAP + NAD + ADP <-> [3PG] + NADH + ATP 4 3PG -> PEP 5 PEP + ADP + H -> PYR + ATP
Pentose Phosphate Pathway
6 GLC6P + 2 NADP + H2O -> RBL5P + 2 NADPH + CO2 7 RBL5P <-> R5P 8 RBL5P <-> X5P 9 2 X5P + R5P <-> 2 F6P + G3P
Pyruvate Metabolism
10 PYR + H -> PYR_m + H_m 11 PYR_m + CoA_m + NAD_m -> CO2 + AcCoA_m + NADH_m + H_m 12 PYR_m + HCO3_m + ATP_m -> OAA_m + ADP_m + Pi 13 MAL_m + NAD_m <-> PYR_m + NADH_m + H_m + CO2 14 MAL + NADP <-> PYR + NADPH + H + CO2
TCA Cycle 15 OAA_m + AcCoA_m + H2O <-> CIT_m + CoA_m 16 CIT_m + NAD_m + H2O <-> AKG_m + NADH_m + CO2 + H_m 17 AKG_m + NAD_m + CoA_m -> SUCCoA_m + NADH_m + H_m + CO2
18 SUCCoA_m + ADP_m + Pi_m + FAD_m <-> FUM_m + ATP_m + CoA_m + FADH2_m
19 FUM_m + H2O <-> MAL_m 20 MAL_m + NAD_m <-> OAA_m + NADH_m + H_m
Malate Aspartate Shuttle 21 OAA_m + GLU_m <-> AKG_m + ASP_m 22 AKG + ASP <-> OAA + GLU 23 ASP_m + GLU -> ASP + GLU_m 24 OAA + NADH + H <-> MAL + NAD 25 MAL + AKG_m <-> MAL_m + AKG

CHAPTER 7: APPENDIX 89
Glutaminolysis 26 GLN + H2O -> GLU + NH4 27 GLU_m + H2O + NAD_m <-> AKG_m + NADH_m + NH4 28 GLU <-> GLU_m
Acetyl CoA Formation 29 CIT + CoA + ATP + H2O -> AcCoA + OAA + ADP + Pi
Amino Acid Synthesis 30 GLU + PYR <-> AKG + ALA 31 3PG + NAD + GLU + H2O -> NADH + H + AKG + Pi + SER
32 GLU + ATP + H + NADPH + H + NADH -> ADP + NADP + Pi + H2O + NAD + PRO
33 SER + THF <-> GLY + MTHF + H2O 34 GLN + ASP + ATP + H2O <-> GLU + ASN + AMP + 2 Pi + H
Amino Acid Degradation 35 SER <-> PYR + NH4 36 THR + NAD + CoA -> GLY + AcCoA + NADH + H
37 ARG_m + H2O + AKG_m + NAD_m <-> 2 GLU_m + UREA_m + NADH_m + H_m
38 PRO_m + 2 H2O + NAD_m -> GLU_m + NADH_m + H_m 39 HIS_m + 3 H2O -> GLU_m + Formamide_m + NH4
40 LYS_m + NADPH + 2 AKG_m + 4 NAD_m + 2 H2O + 2 CoA_m -> NADP + 2 H_m + 4 NADH_m + 2 GLU_m + 2 CO2 + 2 AcCoA_m
41 PHE + NADPH + H + O2 -> TYR + NADP
42 TYR + AKG + 2 O2 + CoA + H2O <-> GLU + CO2 + 2 H + FUM_m + AcCoA + Acetate
43
VAL_m + AKG_m + CoA_m + 3 NAD_m + FAD_m + 3 H2O + ATP_m -> 2 H_m + GLU_m + SUCCoA_m + CO2 + 3 NADH_m + FADH2_m + ADP_m + Pi_m
44
ILE_m + AKG_m + 2 NAD_m + 2 CoA_m + FAD_m + H2O + HCO3_m + ATP_m -> GLU_m + SUCCoA_m + AcCoA_m + 2 NADH_m + CO2 + FADH2_m + ADP_m + Pi_m
45 LEU_m + AKG_m + NAD_m + 2 CoA_m + ATP_m + HCO3_m + H2O -> GLU_m + NADH_m + CO2 + H_m + Pi_m + ADP_m + Acetate + 2 AcCoA_m
46 CYS + AKG + SO3 + O2 + H2O -> GLU + PYR + S2O3 + 2 H
47 MET + 2 ATP + H2O + SER + CoA + NAD + HCO3 -> NH4 + CYS + CO2 + NADH + SUCCoA_m + ADP + Pi

90 CHAPTER 7: APPENDIX
Transport 48 CIT_m + MAL <-> CIT + MAL_m 49 PRO <-> PRO_m 50 ARG <-> ARG_m
PEP Regeneration 51 OAA_m + ATP_m -> ADP_m + PEP_m + CO2 52 PEP <-> PEP_m
Oxidative Phosphorylation
53 NADH_m + H_m + 0.5 O2 + 2.5 ADP_m + 2.5 Pi_m -> NAD_m + H2O + 2.5 ATP_m
54 FADH2_m + 0.5 O2 + 1.5 ADP_m + 1.5 Pi_m -> FAD_m + H2O + 1.5 ATP_m Nucleotide Synthesis
55 R5P + ATP -> PRPP + AMP
56 PRPP + 2 GLN + GLY + ASP + 4 ATP + CO2 -> IMP + 2 GLU + FUM + 4 ADP + 2 H2O
57 IMP + ASP + 2 ATP + GTP -> dATP + FUM + 2 ADP + GDP
58 IMP + GLN + 3 ATP + NAD + 2 H2O -> dGTP + GLU + 2 ADP + AMP + NADH
59 HCO3 + NH4 + ASP + PRPP + 3 ATP + NAD -> dTTP + 3 ADP + CO2 + NADH 60 dTTP + GLN + ATP -> dCTP + GLU + ADP
Uptake or Production of Substrates (Measured Fluxes) 61 GLC6P + ADP + H -> GLC_ex + ATP 62 PYR + NADH + 2 H -> LAC_ex + NAD + H 63 GLN <-> GLN_ex 64 GLU <-> GLU_ex 65 ALA -> ALA_ex 66 SER -> SER_ex 67 GLY -> GLY_ex 68 ASP -> ASP_ex 69 ARG_m -> ARG_ex 70 HIS_m -> HIS_ex 71 CYS -> CYS_ex 72 THR -> THR_ex 73 ILE_m -> ILE_ex

CHAPTER 7: APPENDIX 91
74 VAL_m -> VAL_ex 75 PHE -> PHE_ex 76 TYR -> TYR_ex 77 LYS_m -> LYS_ex 78 LEU_m -> LEU_ex 79 PRO -> PRO_ex 80 MET -> MET_ex 81 ASN -> ASN_ex
82
0.0148 dATP + 0.0099 dCTP + 0.0099 dGTP + 0.0148 dTTP + 0.07 ATP + 0.033 dATP + 0.0551 dCTP + 0.0624 dGTP + 0.033 dTTP + 0.07 ATP + 0.6 ALA + 0.377 ARG_m + 0.359 ASP + 0.288 ASN + 0.145 CYS + 0.322 GLN + 0.386 GLU + 0.538 GLY + 0.143 HIS_m + 0.324 ILE_m + 0.564 LEU_m + 0.57 LYS_m + 0.138 MET + 0.219 PHE + 0.313 PRO + 0.43 SER + 0.386 THR + 0.044 TRP + 0.182 TYR + 0.416 VAL_m + 29.04 ATP + 0.38 GLC6P + 1.3148 ATP + 0.109 GAP + 1.9184 AcCoA + 1.70476 ATP + 3.40952 NADH + 3.51852 H + 0.109 NADH + 0.008 GAP + 0.0704 AcCoA + 0.06256 ATP + 0.12512 NADH + 0.13312 H + 0.008 NADH + 0.324 AcCoA + 0.324 ATP + 0.288 NADH + 0.288 H -> Biomass + 0.07 ADP + 0.07 Pi + 0.07 ADP + 0.07 Pi + 29.04 ADP + 29.04 Pi + 1.3148 ADP + 1.3148 Pi + 1.9184 CoA + 1.70476 ADP + 1.70476 Pi + 3.40952 NAD + 1.49112 H2O + 0.109 NAD + 0.0704 CoA + 0.06256 ADP + 0.06256 Pi + 0.12512 NAD + 0.05472 H2O + 0.008 NAD + 0.162 CoA + 0.324 ADP + 0.324 Pi + 0.288 NAD + 0.162 CO2
83
0.5768 ALA + 0.411919 ASN + 0.330176 ASP + 0.35901 GLN + 0.464684 GLU + 0.683611 GLY + 0.669275 PRO + 1.010565 SER + 0.198476 ARG_m + 0.232693 CYS + 0.204171 HIS_m + 0.30046 ILE_m + 0.574408 LEU_m + 0.54615 LYS_m + 0.114338 MET + 0.366898 PHE + 0.979228 THR + 0.19333 TRP + 0.251256 TYR + 0.796933 VAL_m + 39.89 ATP -> MAB + 39.89 ADP + 39.89 Pi

92 CHAPTER 7: APPENDIX
The biomass composition of murine hybridoma cells averaged in previous work by
Altamirano et al. (2001), Selvarasu et al. (2010) and Xie and Wang (1994) was
obtained using the relative compositions from Sheikh et al. (2005) (Appendix Table A
4). The mole of each cellular component can be calculated from the biomass weight.
Dry cell weight of ATCC-CRL 1606 cells was considered as 250 pg/cell [215].
Furthermore, diphosphatidyglycerol was not taken into consideration because of its
negligible proportion in cellular composition. Therefore, protein, DNA/RNA,
carbohydrate, cholesterol, and phospholipids (phosphoglycerides and sphingomyelin)
were included in the equations of biomass formation.
In addition to biomass synthesis, monoclonal antibody synthesis was also considered
in our network by utilizing the amino acids composition of IgG1 from Quek et al.
(2010) (Appendix Table A 5). The theoretical amount of 4.3 ATP per mol amino acid
is taken into account for protein synthesis.

CHAPTER 7: APPENDIX 93
Table A 4: Averaged dry cell composition (protein, carbohydrates, nucleotides,
lipids) of murine hybridoma cells derived from literature [148].
Metabolite nmol /μg
Metabolite nmol/μg
Protein
ALA 0.6 Carbohydrates Glycogen 0.279 ARG 0.377
Nucleotides
dAMP 0.0148 ASP 0.359 dCMP 0.0099 ASN 0.288 dGMP 0.0099 CYS 0.145 dTMP 0.0148 GLN 0.322 AMP 0.033 GLU 0.386 CMP 0.0551 GLY 0.538 GMP 0.0624 HIS 0.143 UMP 0.033 ILE 0.324
Lipids
Cholesterol 0.018 LEU 0.564 Phosphatidylcholine 0.069 LYS 0.57 Phosphatidylethanolamine 0.026 MET 0.138 Phosphatidylinostitol 0.01 PHE 0.219 Phosphatidylserine 0.003 PRO 0.313 Phosphatidylglycerol 0.001 SER 0.43 Diphosphatidylglycerol 0.003 THR 0.386 Sphingomyelin 0.008 TRP 0.044 TYR 0.182 VAL 0.416

94 CHAPTER 7: APPENDIX
Table A 5: Amino acid composition of IgG1 derived from an average IgG1 protein
sequence [137].
Mass fraction Molar fraction g AA/g mAB nmol AA/μg mAB
ALA 0.041 0.577 ASN 0.047 0.412 ASP 0.038 0.33 GLN 0.046 0.359 GLU 0.06 0.465 GLY 0.039 0.684 PRO 0.065 0.669 SER 0.088 1.0106 ARG 0.031 0.198 CYS 0.024 0.233 HIS 0.028 0.204 ILE 0.034 0.3 LEU 0.065 0.574 LYS 0.07 0.546 MET 0.015 0.114 PHE 0.054 0.367 THR 0.099 0.979 TRP 0.036 0.193 TYR 0.041 0.251 VAL 0.079 0.797
sum (nmol AA/μg mAB) 9.264

CHAPTER 7: APPENDIX 95
Figure A 2: Flux balance model scheme. PEP regeneration pathway was only
active at pH 7.8 and therefore the fluxes OAAmPEPm and PEPmPEP were
constrained under all other conditions.
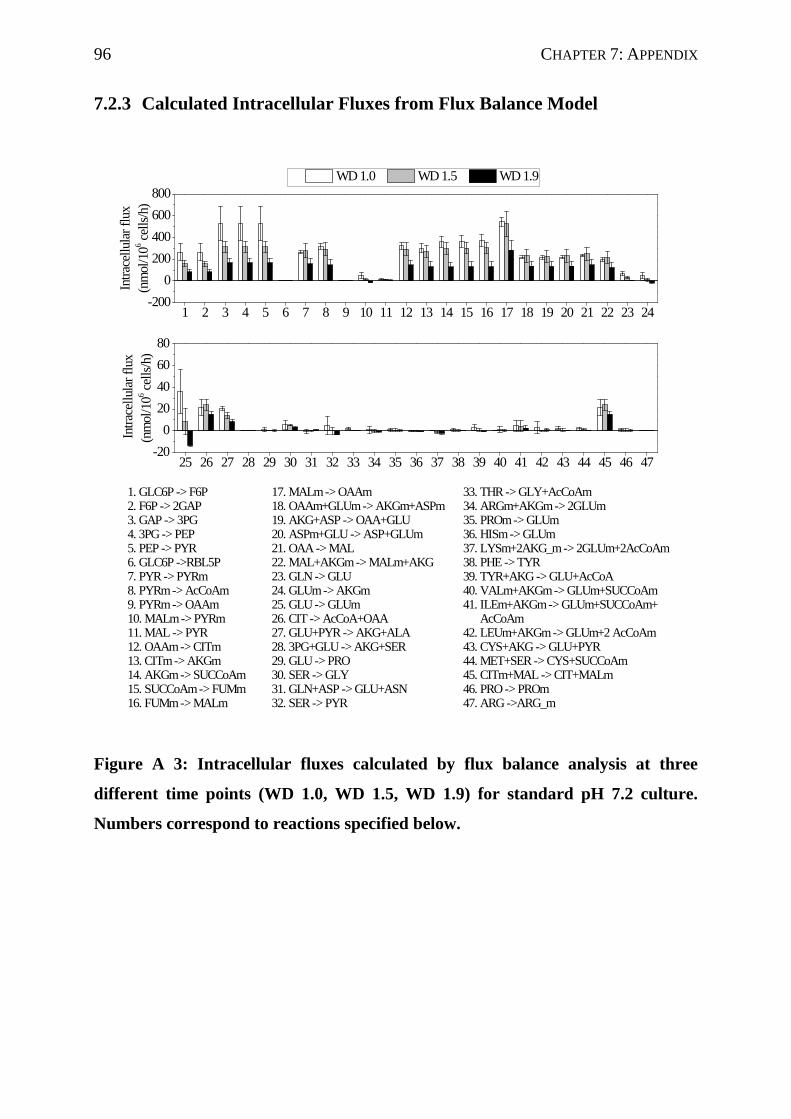
96 CHAPTER 7: APPENDIX
7.2.3 Calculated Intracellular Fluxes from Flux Balance Model
Figure A 3: Intracellular fluxes calculated by flux balance analysis at three
different time points (WD 1.0, WD 1.5, WD 1.9) for standard pH 7.2 culture.
Numbers correspond to reactions specified below.
1 2 3 4 5 6 7 8 9 10 11 12 13 14 15 16 17 18 19 20 21 22 23 24-200
0200400600800
Intra
cellu
lar fl
ux
(nm
ol/1
06 cells
/h)
WD 1.0 WD 1.5 WD 1.9
1. GLC6P -> F6P 17. MALm -> OAAm 33. THR -> GLY+AcCoAm2. F6P -> 2GAP 18. OAAm+GLUm -> AKGm+ASPm 34. ARGm+AKGm -> 2GLUm3. GAP -> 3PG 19. AKG+ASP -> OAA+GLU 35. PROm -> GLUm4. 3PG -> PEP 20. ASPm+GLU -> ASP+GLUm 36. HISm -> GLUm 5. PEP -> PYR 21. OAA -> MAL 37. LYSm+2AKG_m -> 2GLUm+2AcCoAm6. GLC6P ->RBL5P 22. MAL+AKGm -> MALm+AKG 38. PHE -> TYR7. PYR -> PYRm 23. GLN -> GLU 39. TYR+AKG -> GLU+AcCoA8. PYRm -> AcCoAm 24. GLUm -> AKGm 40. VALm+AKGm -> GLUm+SUCCoAm9. PYRm -> OAAm 25. GLU -> GLUm 41. ILEm+AKGm -> GLUm+SUCCoAm+10. MALm -> PYRm 26. CIT -> AcCoA+OAA AcCoAm11. MAL -> PYR 27. GLU+PYR -> AKG+ALA 42. LEUm+AKGm -> GLUm+2 AcCoAm12. OAAm -> CITm 28. 3PG+GLU -> AKG+SER 43. CYS+AKG -> GLU+PYR13. CITm -> AKGm 29. GLU -> PRO 44. MET+SER -> CYS+SUCCoAm14. AKGm -> SUCCoAm 30. SER -> GLY 45. CITm+MAL -> CIT+MALm15. SUCCoAm -> FUMm 31. GLN+ASP -> GLU+ASN 46. PRO -> PROm16. FUMm -> MALm 32. SER -> PYR 47. ARG ->ARG_m
25 26 27 28 29 30 31 32 33 34 35 36 37 38 39 40 41 42 43 44 45 46 47-20
020406080
Intra
cellu
lar fl
ux(n
mol
/106 ce
lls/h
)

CHAPTER 7: APPENDIX 97
Figure A 4: Comparison between intracellular fluxes at culture pH 7.2 and pH 6.8
calculated by flux balance analysis at WD 1.9. Numbers correspond to reactions
specified below.
1 2 3 4 5 6 7 8 9 10 11 12 13 14 15 16 17 18 19 20 21 22 23 24-200-100
0100200300400
Intra
cellu
lar fl
ux(n
mol
/106 ce
lls/h
)
pH 7.2 pH 6.8
25 26 27 28 29 30 31 32 33 34 35 36 37 38 39 40 41 42 43 44 45 46 47-20-10
0102030
1. GLC6P -> F6P 17. MALm -> OAAm 33. THR -> GLY+AcCoAm2. F6P -> 2GAP 18. OAAm+GLUm -> AKGm+ASPm 34. ARGm+AKGm -> 2GLUm3. GAP -> 3PG 19. AKG+ASP -> OAA+GLU 35. PROm -> GLUm4. 3PG -> PEP 20. ASPm+GLU -> ASP+GLUm 36. HISm -> GLUm 5. PEP -> PYR 21. OAA -> MAL 37. LYSm+2AKG_m -> 2GLUm+2AcCoAm6. GLC6P ->RBL5P 22. MAL+AKGm -> MALm+AKG 38. PHE -> TYR7. PYR -> PYRm 23. GLN -> GLU 39. TYR+AKG -> GLU+AcCoA8. PYRm -> AcCoAm 24. GLUm -> AKGm 40. VALm+AKGm -> GLUm+SUCCoAm9. PYRm -> OAAm 25. GLU -> GLUm 41. ILEm+AKGm -> GLUm+SUCCoAm+10. MALm -> PYRm 26. CIT -> AcCoA+OAA AcCoAm11. MAL -> PYR 27. GLU+PYR -> AKG+ALA 42. LEUm+AKGm -> GLUm+2 AcCoAm12. OAAm -> CITm 28. 3PG+GLU -> AKG+SER 43. CYS+AKG -> GLU+PYR13. CITm -> AKGm 29. GLU -> PRO 44. MET+SER -> CYS+SUCCoAm14. AKGm -> SUCCoAm 30. SER -> GLY 45. CITm+MAL -> CIT+MALm15. SUCCoAm -> FUMm 31. GLN+ASP -> GLU+ASN 46. PRO -> PROm16. FUMm -> MALm 32. SER -> PYR 47. ARG ->ARG_m
Intra
cellu
lar fl
ux(n
mol
/106 ce
lls/h
)

98 CHAPTER 7: APPENDIX
Figure A 5: Comparison between intracellular fluxes at culture pH 7.2 and pH 7.8
calculated by flux balance analysis at WD 1.9. Numbers correspond to reactions
specified below. Reactions 48 - 50 included to metabolic network as additional
constraints according to gene expression data.
1 2 3 4 5 6 7 8 9 10 11 12 13 14 15 16 17 18 19 20 21 22 23 24 25-100
0100200300400500
Intra
cellu
lar fl
ux(n
mol
/106 ce
lls/h
)
pH 7.2 pH 7.8
26 27 28 29 30 31 32 33 34 35 36 37 38 39 40 41 42 43 44 45 46 47 48 49-20-10
0102030
1. GLC6P -> F6P 18. OAAm+GLUm -> AKGm+ASPm 35. PROm -> GLUm 2. F6P -> 2GAP 19. AKG+ASP -> OAA+GLU 36. HISm -> GLUm3. GAP -> 3PG 20. ASPm+GLU -> ASP+GLUm 37. LYSm+2AKG_m -> 2GLUm+2AcCoAm4. 3PG -> PEP 21. OAA -> MAL 38. PHE -> TYR5. PEP -> PYR 22. MAL+AKGm -> MALm+AKG 39. TYR+AKG -> GLU+AcCoA 6. GLC6P ->RBL5P 23. GLN -> GLU 40. VALm+AKGm -> GLUm+SUCCoAm7. PYR -> PYRm 24. GLUm -> AKGm 41. ILEm+AKGm -> GLUm+SUCCoAm+8. PYRm -> AcCoAm 25. GLU -> GLUm AcCoAm9. PYRm -> OAAm 26. CIT -> AcCoA+OAA 42. LEUm+AKGm -> GLUm+2 AcCoAm 10. MALm -> PYRm 27. GLU+PYR -> AKG+ALA 43. CYS+AKG -> GLU+PYR11. MAL -> PYR 28. 3PG+GLU -> AKG+SER 44. MET+SER -> CYS+SUCCoAm12. OAAm -> CITm 29. GLU -> PRO 45. CITm+MAL -> CIT+MALm13. CITm -> AKGm 30. SER -> GLY 46. PRO -> PROm14. AKGm -> SUCCoAm 31. GLN+ASP -> GLU+ASN 47. ARG ->ARG_m 15. SUCCoAm -> FUMm 32. SER -> PYR 48. OAAm+ATPm -> PEPm+ADPm+CO216. FUMm -> MALm 33. THR -> GLY+AcCoAm 49. PEP -> PEPm 17. MALm -> OAAm 34. ARGm+AKGm -> 2GLUm
Intra
cellu
lar fl
ux(n
mol
/106 ce
lls/h
)

CHAPTER 7: APPENDIX 99
7.3 Appendix for “An Unstructured Model of Metabolite and
Temperature Dependent Cell Cycle Arrest in Hybridoma
Batch and Fed-Batch Cultures”
7.3.1 Model Parameter Estimation
Table A 6: Model parameter values.
Parameter Value Re-estimated value
95% confidence intervals
kdMAX 0.06
klys 0.04
KdAmm 50
kT 3 3.2 0.04
rT 0.01
Kdeg 4.8*10-3
KGln 0.08
KLac 90
KAmm 15
Kupt 0.4
YGlc 1.2*108
YGln 5.6*108 6.1*108 1*107
YLac 2
YAmm 0.6
mGlc 2.8*10-12
α1 3.4*10-13
α2 4
n 2 2
m 2

100 CHAPTER 7: APPENDIX
fres 2 1.5 0.009
tG1initial 3.3 2.7 0.094
tG2/Minitial 2.5 2.8 0.083
tSinitial 6 5.1 0.205
qG1/G0 2.8*10-11 2.0*10-11 1.1*10-11
qS 2.8*10-11 3.0*10-11 1.3*10-11
qG2/M 2.8*10-11

101
8 References
[1] S. Kyriakopoulos and C. Kontoravdi, “Analysis of the landscape of biologically-derived pharmaceuticals in Europe: Dominant production systems, molecule types on the rise and approval trends.,” European Journal of Pharmaceutical Sciences : Official Journal of the European Federation for Pharmaceutical Sciences, vol. 48, no. 3, pp. 428–441, Dec. 2012.
[2] M. Butler, “Animal cell cultures: recent achievements and perspectives in the production of biopharmaceuticals.,” Applied Microbiology and Biotechnology, vol. 68, no. 3, pp. 283–91, Aug. 2005.
[3] R. Jefferis, “Glycosylation of recombinant antibody therapeutics.,” Biotechnology Progress, vol. 21, no. 1, pp. 11–6, 2005.
[4] P. P. Jacobs, M. Inan, N. Festjens, J. Haustraete, A. Van Hecke, R. Contreras, M. M. Meagher, and N. Callewaert, “Fed-batch fermentation of GM-CSF-producing glycoengineered Pichia pastoris under controlled specific growth rate.,” Microbial Cell Factories, vol. 9, no. 1, p. 93, Jan. 2010.
[5] G. A. Grabowski, M. Golembo, and Y. Shaaltiel, “Taliglucerase alfa: An enzyme replacement therapy using plant cell expression technology.,” Molecular genetics and metabolism, vol. 112, no. 1, pp. 1–8, May 2014.
[6] G. N. Mowat and W. G. Chapman, “Growth of Foot-and-Mouth Disease Virus in a Fibroblastic Cell Line Derived from Hamster Kidneys,” Nature, vol. 194, no. 4825, pp. 253–255, Apr. 1962.
[7] S. S. Ozturk and W. Hu, Cell culture technology for pharmaceutical and cell-based therapies. New York: CRC Press, 2006.
[8] Lubiniecki, Large-Scale Mammalian Cell Culture Technology. CRC Press, 1990, p. 656.
[9] R. J. Kaufman, L. C. Wasley, A. J. Spiliotes, S. D. Gossels, S. A. Latt, G. R. Larsen, and R. M. Kay, “Coamplification and coexpression of human tissue-type plasminogen activator and murine dihydrofolate reductase sequences in Chinese hamster ovary cells.,” Molecular and cellular biology, vol. 5, no. 7, pp. 1750–9, Jul. 1985.
[10] F. Braido, S. Holgate, and G. W. Canonica, “From ‘blockbusters’ to ‘biosimilars’: an opportunity for patients, medical specialists and health care providers.,” Pulmonary Pharmacology & Therapeutics, vol. 25, no. 6, pp. 483–6, Dec. 2012.

102 CHAPTER 8: REFERENCES
[11] R. S. Aggarwal, “What’s fueling the biotech engine-2012 to 2013.,” Nature Biotechnology, vol. 32, no. 1, pp. 32–9, Jan. 2014.
[12] D. J. Norman, C. F. Shield, J. M. Barry, K. Henell, M. B. Funnell, and J. Lemon, “Therapeutic use of OKT3 monoclonal antibody for acute renal allograft rejection.,” Nephron, vol. 46 Suppl 1, pp. 41–7, Jan. 1987.
[13] M. Butler, “From the mold in Dr Florey’s coat to blockbuster drugs,” Pharmaceutical Bioprocessing, vol. 1, no. 1, pp. 3–5, Apr. 2013.
[14] B. Kelley, “Industrialization of mAb production technology: the bioprocessing industry at a crossroads.,” mAbs, vol. 1, no. 5, pp. 443–52, 2009.
[15] J. Y. Kim, Y.-G. Kim, and G. M. Lee, “CHO cells in biotechnology for production of recombinant proteins: current state and further potential.,” Applied Microbiology and Biotechnology, vol. 93, no. 3, pp. 917–30, Feb. 2012.
[16] F. M. Wurm, “Production of recombinant protein therapeutics in cultivated mammalian cells.,” Nature Biotechnology, vol. 22, no. 11, pp. 1393–8, Nov. 2004.
[17] M. De Jesus and F. M. Wurm, “Manufacturing recombinant proteins in kg-ton quantities using animal cells in bioreactors.,” European Journal of Pharmaceutics and Biopharmaceutics : Official Journal of Arbeitsgemeinschaft fur Pharmazeutische Verfahrenstechnik e.V, vol. 78, no. 2, pp. 184–188, Jan. 2011.
[18] Y.-M. Huang, W. Hu, E. Rustandi, K. Chang, H. Yusuf-Makagiansar, and T. Ryll, “Maximizing productivity of CHO cell-based fed-batch culture using chemically defined media conditions and typical manufacturing equipment.,” Biotechnology Progress, vol. 26, no. 5, pp. 1400–10, 2010.
[19] H. C. Ebbers, P. J. K. van Meer, E. H. M. Moors, A. K. Mantel-Teeuwisse, H. G. M. Leufkens, and H. Schellekens, “Measures of biosimilarity in monoclonal antibodies in oncology: the case of bevacizumab.,” Drug Discovery Today, vol. 18, no. 17–18, pp. 872–9, Sep. 2013.
[20] R. S. Kenett and D. A. Kenett, “Quality by Design applications in biosimilar pharmaceutical products,” Accreditation and Quality Assurance, vol. 13, no. 12, pp. 681–690, Sep. 2008.
[21] P. Umaña, J. Jean-Mairet, R. Moudry, H. Amstutz, and J. E. Bailey, “Engineered glycoforms of an antineuroblastoma IgG1 with optimized antibody-dependent cellular cytotoxic activity.,” Nature biotechnology, vol. 17, no. 2, pp. 176–80, Feb. 1999.
[22] J. R. Birch and A. J. Racher, “Antibody production.,” Advanced Drug Delivery Reviews, vol. 58, no. 5–6, pp. 671–85, Aug. 2006.

CHAPTER 8: REFERENCES 103
[23] A. W. Nienow, W. H. Scott, C. J. Hewitt, C. R. Thomas, G. Lewis, A. Amanullah, R. Kiss, and S. J. Meier, “Scale-down studies for assessing the impact of different stress parameters on growth and product quality during animal cell culture,” Chemical Engineering Research and Design, vol. 91, no. 11, pp. 2265–2274, Nov. 2013.
[24] R. Godoy-Silva, M. Mollet, and J. J. Chalmers, “Evaluation of the effect of chronic hydrodynamical stresses on cultures of suspensed CHO-6E6 cells.,” Biotechnology and Bioengineering, vol. 102, no. 4, pp. 1119–30, Mar. 2009.
[25] M. L. Velez-Suberbie, R. D. R. Tarrant, A. S. Tait, D. I. R. Spencer, and D. G. Bracewell, “Impact of aeration strategy on CHO cell performance during antibody production.,” Biotechnology Progress, vol. 29, no. 1, pp. 116–26, 2012.
[26] C. Langheinrich and A. W. Nienow, “Control of pH in large-scale, free suspension animal cell bioreactors: alkali addition and pH excursions.,” Biotechnology and Bioengineering, vol. 66, no. 3, pp. 171–9, Jan. 1999.
[27] M. M. Zhu, A. Goyal, D. L. Rank, S. K. Gupta, T. Vanden Boom, and S. S. Lee, “Effects of elevated pCO2 and osmolality on growth of CHO cells and production of antibody-fusion protein B1: a case study.,” Biotechnology Progress, vol. 21, no. 1, pp. 70–7, 2005.
[28] F. Li, N. Vijayasankaran, A. Y. Shen, R. Kiss, and A. Amanullah, “Cell culture processes for monoclonal antibody production,” mAbs, vol. 2, no. 5, pp. 466–479, Sep. 2010.
[29] R. Kimura and W. Miller, “Glycosylation of CHO-derived recombinant tPA produced under elevated pCO2,” Biotechnology Progress, vol. 15, no. 1, p. 146, Jan. 1999.
[30] V. M. Dezengotita, R. Kimura, and W. M. Miller, “Effects of CO2 and osmolality on hybridoma cells: growth, metabolism and monoclonal antibody production.,” Cytotechnology, vol. 28, no. 1–3, pp. 213–27, Nov. 1998.
[31] N. Vijayasankaran, J. Li, R. Shawley, A. Chen, M. Shiratori, M. Gawlitzek, F. Li, R. Kiss, and A. Amanullah, “Animal Cell Culture Media,” in Encyclopedia of Industrial Biotechnology, Hoboken, NJ, USA: John Wiley & Sons, Inc., 2010.
[32] B. Liu, M. Spearman, J. Doering, E. Lattová, H. Perreault, and M. Butler, “The availability of glucose to CHO cells affects the intracellular lipid-linked oligosaccharide distribution, site occupancy and the N-glycosylation profile of a monoclonal antibody.,” Journal of Biotechnology, vol. 170, pp. 17–27, Jan. 2014.

104 CHAPTER 8: REFERENCES
[33] N. J. Stark and E. C. Heath, “Glucose-dependent glycosylation of secretory glycoprotein in mouse myeloma cells.,” Archives of Biochemistry and Biophysics, vol. 192, no. 2, pp. 599–609, Feb. 1979.
[34] H. Tachibana, K. Taniguchi, Y. Ushio, K. Teruya, K. Osada, and H. Murakami, “Changes of monosaccharide availability of human hybridoma lead to alteration of biological properties of human monoclonal antibody.,” Cytotechnology, vol. 16, no. 3, pp. 151–7, Jan. 1994.
[35] N. S. C. Wong, L. Wati, P. M. Nissom, H. T. Feng, M. M. Lee, and M. G. S. Yap, “An investigation of intracellular glycosylation activities in CHO cells: effects of nucleotide sugar precursor feeding.,” Biotechnology and Bioengineering, vol. 107, no. 2, pp. 321–36, Oct. 2010.
[36] C. K. Crowell, G. E. Grampp, G. N. Rogers, J. Miller, and R. I. Scheinman, “Amino acid and manganese supplementation modulates the glycosylation state of erythropoietin in a CHO culture system.,” Biotechnology and Bioengineering, vol. 96, no. 3, pp. 538–49, Feb. 2007.
[37] N. A. McCracken, R. Kowle, and A. Ouyang, “Control of galactosylated glycoforms distribution in cell culture system.,” Biotechnology Progress, pp. 24–27, Apr. 2014.
[38] R. Jefferis, “Isotype and glycoform selection for antibody therapeutics.,” Archives of Biochemistry and Biophysics, vol. 526, no. 2, pp. 159–66, Oct. 2012.
[39] R. Jefferis, “Glycosylation as a strategy to improve antibody-based therapeutics.,” Nature Reviews. Drug Discovery, vol. 8, no. 3, pp. 226–34, Mar. 2009.
[40] R. Jefferis, “Recombinant antibody therapeutics: the impact of glycosylation on mechanisms of action.,” Trends in Pharmacological Sciences, vol. 30, no. 7, pp. 356–62, Jul. 2009.
[41] I. J. del Val, C. Kontoravdi, and J. M. Nagy, “Towards the implementation of quality by design to the production of therapeutic monoclonal antibodies with desired glycosylation patterns.,” Biotechnology Progress, vol. 26, no. 6, pp. 1505–27, 2010.
[42] F. Nimmerjahn and J. V Ravetch, “Fcgamma receptors: old friends and new family members.,” Immunity, vol. 24, no. 1, pp. 19–28, Jan. 2006.
[43] F. Nimmerjahn and J. V Ravetch, “Anti-inflammatory actions of intravenous immunoglobulin.,” Annual Review of Immunology, vol. 26, pp. 513–33, Jan. 2008.
[44] Y. Mimura, P. Sondermann, R. Ghirlando, J. Lund, S. P. Young, M. Goodall, and R. Jefferis, “Role of oligosaccharide residues of IgG1-Fc in Fc gamma RIIb

CHAPTER 8: REFERENCES 105
binding.,” The Journal of Biological Chemistry, vol. 276, no. 49, pp. 45539–47, Dec. 2001.
[45] S. Krapp, Y. Mimura, R. Jefferis, R. Huber, and P. Sondermann, “Structural Analysis of Human IgG-Fc Glycoforms Reveals a Correlation Between Glycosylation and Structural Integrity,” Journal of Molecular Biology, vol. 325, no. 5, pp. 979–989, Jan. 2003.
[46] S. C. Wallick, E. A. Kabat, and S. L. Morrison, “Glycosylation of a VH residue of a monoclonal antibody against alpha (1-6) dextran increases its affinity for antigen.,” The Journal of Experimental Medicine, vol. 168, no. 3, pp. 1099–109, Sep. 1988.
[47] L. Huang, S. Biolsi, K. R. Bales, and U. Kuchibhotla, “Impact of variable domain glycosylation on antibody clearance: an LC/MS characterization.,” Analytical Biochemistry, vol. 349, no. 2, pp. 197–207, Feb. 2006.
[48] J. Qian, T. Liu, L. Yang, A. Daus, R. Crowley, and Q. Zhou, “Structural characterization of N-linked oligosaccharides on monoclonal antibody cetuximab by the combination of orthogonal matrix-assisted laser desorption/ionization hybrid quadrupole-quadrupole time-of-flight tandem mass spectrometry and sequential enzy,” Analytical Biochemistry, vol. 364, no. 1, pp. 8–18, May 2007.
[49] G. Köhler and C. Milstein, “Continuous cultures of fused cells secreting antibody of predefined specificity.,” Nature, vol. 256, no. 5517, pp. 495–7, Aug. 1975.
[50] A. Nissim and Y. Chernajovsky, “Historical development of monoclonal antibody therapeutics.,” Handbook of Experimental Pharmacology, no. 181, pp. 3–18, Jan. 2008.
[51] N. Lonberg, L. D. Taylor, F. A. Harding, M. Trounstine, K. M. Higgins, S. R. Schramm, C. C. Kuo, R. Mashayekh, K. Wymore, and J. G. McCabe, “Antigen-specific human antibodies from mice comprising four distinct genetic modifications.,” Nature, vol. 368, no. 6474, pp. 856–9, Apr. 1994.
[52] L. L. Green, M. C. Hardy, C. E. Maynard-Currie, H. Tsuda, D. M. Louie, M. J. Mendez, H. Abderrahim, M. Noguchi, D. H. Smith, Y. Zeng, N. E. David, H. Sasai, D. Garza, D. G. Brenner, J. F. Hales, R. P. McGuinness, D. J. Capon, S. Klapholz, and A. Jakobovits, “Antigen-specific human monoclonal antibodies from mice engineered with human Ig heavy and light chain YACs.,” Nature Genetics, vol. 7, no. 1, pp. 13–21, May 1994.
[53] J. McCafferty, A. D. Griffiths, G. Winter, and D. J. Chiswell, “Phage antibodies: filamentous phage displaying antibody variable domains.,” Nature, vol. 348, no. 6301, pp. 552–4, Dec. 1990.

106 CHAPTER 8: REFERENCES
[54] S.-J. Wu, J. Luo, K. T. O’Neil, J. Kang, E. R. Lacy, G. Canziani, A. Baker, M. Huang, Q. M. Tang, T. S. Raju, S. A. Jacobs, A. Teplyakov, G. L. Gilliland, and Y. Feng, “Structure-based engineering of a monoclonal antibody for improved solubility.,” Protein Engineering, Design & Selection : PEDS, vol. 23, no. 8, pp. 643–51, Aug. 2010.
[55] C. Ferrara, P. Brünker, T. Suter, S. Moser, U. Püntener, and P. Umaña, “Modulation of therapeutic antibody effector functions by glycosylation engineering: influence of Golgi enzyme localization domain and co-expression of heterologous beta1, 4-N-acetylglucosaminyltransferase III and Golgi alpha-mannosidase II.,” Biotechnology and Bioengineering, vol. 93, no. 5, pp. 851–61, Apr. 2006.
[56] V. Kayser, N. Chennamsetty, V. Voynov, K. Forrer, B. Helk, and B. L. Trout, “Glycosylation influences on the aggregation propensity of therapeutic monoclonal antibodies.,” Biotechnology Journal, vol. 6, no. 1, pp. 38–44, Jan. 2011.
[57] V. Oganesyan, M. M. Damschroder, R. M. Woods, K. E. Cook, H. Wu, and W. F. Dall’acqua, “Structural characterization of a human Fc fragment engineered for extended serum half-life.,” Molecular Immunology, vol. 46, no. 8–9, pp. 1750–5, May 2009.
[58] J. Zalevsky, A. K. Chamberlain, H. M. Horton, S. Karki, I. W. L. Leung, T. J. Sproule, G. A. Lazar, D. C. Roopenian, and J. R. Desjarlais, “Enhanced antibody half-life improves in vivo activity.,” Nature Biotechnology, vol. 28, no. 2, pp. 157–9, Feb. 2010.
[59] D. Bhutani and U. N. Vaishampayan, “Monoclonal antibodies in oncology therapeutics: present and future indications.,” Expert Opinion on Biological Therapy, vol. 13, no. 2, pp. 269–82, Feb. 2013.
[60] N. A. P. S. Buss, S. J. Henderson, M. McFarlane, J. M. Shenton, and L. de Haan, “Monoclonal antibody therapeutics: history and future.,” Current Opinion in Pharmacology, vol. 12, no. 5, pp. 615–22, Oct. 2012.
[61] B. J. Sutton and D. C. Phillips, “The three-dimensional structure of the carbohydrate within the Fc fragment of immunoglobulin G.,” Biochemical Society Transactions, vol. 11, no. 2, pp. 130–2, Apr. 1983.
[62] K. Zheng, C. Bantog, and R. Bayer, “The impact of glycosylation on monoclonal antibody conformation and stability.,” mAbs, vol. 3, no. 6, pp. 568–76, 2011.
[63] N. Sethuraman and T. A. Stadheim, “Challenges in therapeutic glycoprotein production.,” Current Opinion in Biotechnology, vol. 17, no. 4, pp. 341–6, Aug. 2006.

CHAPTER 8: REFERENCES 107
[64] K. N. Baker, M. H. Rendall, A. E. Hills, M. Hoare, R. B. Freedman, and D. C. James, “Metabolic control of recombinant protein N-glycan processing in NS0 and CHO cells.,” Biotechnology and Bioengineering, vol. 73, no. 3, pp. 188–202, May 2001.
[65] Y. Kanda, T. Yamada, K. Mori, A. Okazaki, M. Inoue, K. Kitajima-Miyama, R. Kuni-Kamochi, R. Nakano, K. Yano, S. Kakita, K. Shitara, and M. Satoh, “Comparison of biological activity among nonfucosylated therapeutic IgG1 antibodies with three different N-linked Fc oligosaccharides: the high-mannose, hybrid, and complex types.,” Glycobiology, vol. 17, no. 1, pp. 104–18, Jan. 2007.
[66] A. Wright and S. L. Morrison, “Effect of C2-associated carbohydrate structure on Ig effector function: studies with chimeric mouse-human IgG1 antibodies in glycosylation mutants of Chinese hamster ovary cells.,” Journal of immunology, vol. 160, no. 7, pp. 3393–402, Apr. 1998.
[67] J. Hodoniczky, Y. Z. Zheng, and D. C. James, “Control of recombinant monoclonal antibody effector functions by Fc N-glycan remodeling in vitro.,” Biotechnology Progress, vol. 21, no. 6, pp. 1644–52, 2005.
[68] P. N. Boyd, A. C. Lines, and A. K. Patel, “The effect of the removal of sialic acid, galactose and total carbohydrate on the functional activity of Campath-1H.,” Molecular Immunology, vol. 32, no. 17–18, pp. 1311–8, Dec. 1995.
[69] N. Tsuchiya, T. Endo, K. Matsuta, S. Yoshinoya, T. Aikawa, E. Kosuge, F. Takeuchi, T. Miyamoto, and A. Kobata, “Effects of galactose depletion from oligosaccharide chains on immunological activities of human IgG.,” The Journal of Rheumatology, vol. 16, no. 3, pp. 285–90, Mar. 1989.
[70] C. Ferrara, S. Grau, C. Jäger, P. Sondermann, P. Brünker, I. Waldhauer, M. Hennig, A. Ruf, A. C. Rufer, M. Stihle, P. Umaña, and J. Benz, “Unique carbohydrate-carbohydrate interactions are required for high affinity binding between FcgammaRIII and antibodies lacking core fucose.,” Proceedings of the National Academy of Sciences of the United States of America, vol. 108, no. 31, pp. 12669–74, Aug. 2011.
[71] R. L. Shields, J. Lai, R. Keck, L. Y. O’Connell, K. Hong, Y. G. Meng, S. H. A. Weikert, and L. G. Presta, “Lack of fucose on human IgG1 N-linked oligosaccharide improves binding to human Fcgamma RIII and antibody-dependent cellular toxicity.,” The Journal of Biological Chemistry, vol. 277, no. 30, pp. 26733–40, Jul. 2002.
[72] T. Shinkawa, K. Nakamura, N. Yamane, E. Shoji-Hosaka, Y. Kanda, M. Sakurada, K. Uchida, H. Anazawa, M. Satoh, M. Yamasaki, N. Hanai, and K. Shitara, “The absence of fucose but not the presence of galactose or bisecting N-acetylglucosamine of human IgG1 complex-type oligosaccharides shows the

108 CHAPTER 8: REFERENCES
critical role of enhancing antibody-dependent cellular cytotoxicity.,” The Journal of Biological Chemistry, vol. 278, no. 5, pp. 3466–73, Jan. 2003.
[73] B. J. Scallon, S. H. Tam, S. G. McCarthy, A. N. Cai, and T. S. Raju, “Higher levels of sialylated Fc glycans in immunoglobulin G molecules can adversely impact functionality.,” Molecular Immunology, vol. 44, no. 7, pp. 1524–34, Mar. 2007.
[74] Y. Kaneko, F. Nimmerjahn, and J. V Ravetch, “Anti-inflammatory activity of immunoglobulin G resulting from Fc sialylation.,” Science (New York, N.Y.), vol. 313, no. 5787, pp. 670–3, Aug. 2006.
[75] J. A. LaVecchio, A. D. Dunne, and A. S. Edge, “Enzymatic removal of alpha-galactosyl epitopes from porcine endothelial cells diminishes the cytotoxic effect of natural antibodies.,” Transplantation, vol. 60, no. 8, pp. 841–7, Oct. 1995.
[76] T. J. Monica, S. B. Williams, C. F. Goochee, and B. L. Maiorella, “Characterization of the glycosylation of a human IgM produced by a human-mouse hybridoma.,” Glycobiology, vol. 5, no. 2, pp. 175–85, Mar. 1995.
[77] D. C. Andersen and C. F. Goochee, “The effect of ammonia on the O-linked glycosylation of granulocyte colony-stimulating factor produced by chinese hamster ovary cells.,” Biotechnology and Bioengineering, vol. 47, no. 1, pp. 96–105, Jul. 1995.
[78] M. C. Borys, D. I. Linzer, and E. T. Papoutsakis, “Ammonia affects the glycosylation patterns of recombinant mouse placental lactogen-I by chinese hamster ovary cells in a pH-dependent manner.,” Biotechnology and Bioengineering, vol. 43, no. 6, pp. 505–14, Mar. 1994.
[79] M. Yang and M. Butler, “Effects of ammonia on CHO cell growth, erythropoietin production, and glycosylation.,” Biotechnology and Bioengineering, vol. 68, no. 4, pp. 370–80, May 2000.
[80] M. J. Gramer, J. J. Eckblad, R. Donahue, J. Brown, C. Shultz, K. Vickerman, P. Priem, E. T. J. van den Bremer, J. Gerritsen, and P. H. C. van Berkel, “Modulation of antibody galactosylation through feeding of uridine, manganese chloride, and galactose.,” Biotechnology and Bioengineering, vol. 108, no. 7, pp. 1591–602, Jul. 2011.
[81] R. K. Grainger and D. C. James, “CHO cell line specific prediction and control of recombinant monoclonal antibody N-glycosylation.,” Biotechnology and Bioengineering, vol. 110, no. 11, pp. 2970–83, Nov. 2013.
[82] P. Hossler, S. F. Khattak, and Z. J. Li, “Optimal and consistent protein glycosylation in mammalian cell culture.,” Glycobiology, vol. 19, no. 9, pp. 936–49, Sep. 2009.

CHAPTER 8: REFERENCES 109
[83] M. Butler, “Optimisation of the cellular metabolism of glycosylation for recombinant proteins produced by mammalian cell systems.,” Cytotechnology, vol. 50, no. 1–3, pp. 57–76, Mar. 2006.
[84] P. H. C. van Berkel, J. Gerritsen, G. Perdok, J. Valbjørn, T. Vink, J. G. J. van de Winkel, and P. W. H. I. Parren, “N-linked glycosylation is an important parameter for optimal selection of cell lines producing biopharmaceutical human IgG.,” Biotechnology Progress, vol. 25, no. 1, pp. 244–51, 2009.
[85] P. Zhang, K. F. Chan, R. Haryadi, M. Bardor, and Z. Song, “CHO glycosylation mutants as potential host cells to produce therapeutic proteins with enhanced efficacy.,” Advances in Biochemical Engineering/Biotechnology, vol. 131, no. 2012, pp. 63–87, Jan. 2013.
[86] M. Thaysen-Andersen and N. H. Packer, “Site-specific glycoproteomics confirms that protein structure dictates formation of N-glycan type, core fucosylation and branching.,” Glycobiology, vol. 22, no. 11, pp. 1440–52, Nov. 2012.
[87] R. C. Schoen, K. L. Bentley, and R. J. Klebe, “Monoclonal antibody against human fibronectin which inhibits cell attachment.,” Hybridoma, vol. 1, no. 2, pp. 99–108, Jan. 1982.
[88] M. K. Patterson, “Measurement of growth and viability of cells in culture.,” Methods in Enzymology, vol. 58, no. 1974, pp. 141–52, Jan. 1979.
[89] C. T. Goudar, K. Joeris, K. B. Konstantinov, and J. M. Piret, “Logistic equations effectively model mammalian cell batch and fed-batch kinetics by logically constraining the fit.,” Biotechnology Progress, vol. 21, no. 4, pp. 1109–18, 2005.
[90] F. A. A. Majid, M. Butler, and M. Al-Rubeai, “Glycosylation of an immunoglobulin produced from a murine hybridoma cell line: the effect of culture mode and the anti-apoptotic gene, bcl-2.,” Biotechnology and Bioengineering, vol. 97, no. 1, pp. 156–69, May 2007.
[91] V. V. T. Wong, P. M. Nissom, S.-L. Sim, J. H. M. Yeo, S.-H. Chuah, and M. G. S. Yap, “Zinc as an insulin replacement in hybridoma cultures.,” Biotechnology and Bioengineering, vol. 93, no. 3, pp. 553–63, Feb. 2006.
[92] M. W. Glacken, “Development of mathematical descriptions of mammalian cell culture kinetics for the optimization of fed-batch bioreactors,” Massachusetts Institute of Technology, 1987.
[93] S. S. Ozturk and B. O. Palsson, “Growth, metabolic, and antibody production kinetics of hybridoma cell culture: 2. Effects of serum concentration, dissolved oxygen concentration, and medium pH in a batch reactor.,” Biotechnology Progress, vol. 7, no. 6, pp. 481–94, 1991.

110 CHAPTER 8: REFERENCES
[94] W. M. Miller, H. W. Blanch, and C. R. Wilke, “A kinetic analysis of hybridoma growth and metabolism in batch and continuous suspension culture: effect of nutrient concentration, dilution rate, and pH.,” Biotechnology and Bioengineering, vol. 32, no. 8, pp. 947–65, Oct. 1988.
[95] E. Trummer, K. Fauland, S. Seidinger, K. Schriebl, C. Lattenmayer, R. Kunert, K. Vorauer-Uhl, R. Weik, N. Borth, H. Katinger, and D. Müller, “Process parameter shifting: Part I. Effect of DOT, pH, and temperature on the performance of Epo-Fc expressing CHO cells cultivated in controlled batch bioreactors.,” Biotechnology and Bioengineering, vol. 94, no. 6, pp. 1033–44, Aug. 2006.
[96] S. Karra, B. Sager, and M. N. Karim, “Multi-Scale Modeling of Heterogeneities in Mammalian Cell Culture Processes,” Industrial & Engineering Chemistry Research, vol. 49, no. 17, pp. 7990–8006, 2010.
[97] J. A. Zanghi, A. E. Schmelzer, T. P. Mendoza, R. H. Knop, and W. M. Miller, “Bicarbonate concentration and osmolality are key determinants in the inhibition of CHO cell polysialylation under elevated pCO(2) or pH.,” Biotechnology and Bioengineering, vol. 65, no. 2, pp. 182–91, Oct. 1999.
[98] H. P. Bonarius, J. H. Houtman, G. Schmid, C. D. de Gooijer, and J. Tramper, “Metabolic-flux analysis of hybridoma cells under oxidative and reductive stress using mass balances.,” Cytotechnology, vol. 32, no. 2, pp. 97–107, Feb. 2000.
[99] S. Lakhotia, K. D. Bauer, and E. T. Papoutsakis, “Damaging agitation intensities increase DNA synthesis rate and alter cell-cycle phase distributions of CHO cells.,” Biotechnology and Bioengineering, vol. 40, no. 8, pp. 978–90, Oct. 1992.
[100] A. Ceroni, K. Maass, H. Geyer, R. Geyer, A. Dell, and S. M. Haslam, “GlycoWorkbench: a tool for the computer-assisted annotation of mass spectra of glycans.,” Journal of Proteome Research, vol. 7, no. 4, pp. 1650–9, Apr. 2008.
[101] D. M. Sheeley, B. M. Merrill, and L. C. Taylor, “Characterization of monoclonal antibody glycosylation: comparison of expression systems and identification of terminal alpha-linked galactose.,” Analytical Biochemistry, vol. 247, no. 1, pp. 102–10, Apr. 1997.
[102] A. D. Hooker, M. H. Goldman, N. H. Markham, D. C. James, A. P. Ison, A. T. Bull, P. G. Strange, I. Salmon, A. J. Baines, and N. Jenkins, “N-glycans of recombinant human interferon-gamma change during batch culture of chinese hamster ovary cells.,” Biotechnology and Bioengineering, vol. 48, no. 6, pp. 639–48, Dec. 1995.
[103] M. Gawlitzek, T. Ryll, J. Lofgren, and M. B. Sliwkowski, “Ammonium alters N-glycan structures of recombinant TNFR-IgG: degradative versus biosynthetic

CHAPTER 8: REFERENCES 111
mechanisms.,” Biotechnology and Bioengineering, vol. 68, no. 6, pp. 637–46, Jun. 2000.
[104] E. Munzert, J. Muthing, H. Büntemeyer, and J. Lehmann, “Sialidase activity in culture fluid of Chinese hamster ovary cells during batch culture and its effects on recombinant human antithrombin III integrity.,” Biotechnology Progress, vol. 12, no. 4, pp. 559–63, 1996.
[105] M. J. Gramer and C. F. Goochee, “Glycosidase activities in Chinese hamster ovary cell lysate and cell culture supernatant.,” Biotechnology Progress, vol. 9, no. 4, pp. 366–73, 1993.
[106] D. C. F. Wong, K. T. K. Wong, L. T. Goh, C. K. Heng, and M. G. S. Yap, “Impact of dynamic online fed-batch strategies on metabolism, productivity and N-glycosylation quality in CHO cell cultures.,” Biotechnology and Bioengineering, vol. 89, no. 2, pp. 164–77, Jan. 2005.
[107] G. B. Nyberg, R. R. Balcarcel, B. D. Follstad, G. Stephanopoulos, and D. I. Wang, “Metabolic effects on recombinant interferon-gamma glycosylation in continuous culture of Chinese hamster ovary cells.,” Biotechnology and Bioengineering, vol. 62, no. 3, pp. 336–47, Feb. 1999.
[108] P. M. Hayter, E. M. Curling, M. L. Gould, A. J. Baines, N. Jenkins, I. Salmon, P. G. Strange, and A. T. Bull, “The effect of the dilution rate on CHO cell physiology and recombinant interferon-gamma production in glucose-limited chemostat culture.,” Biotechnology and Bioengineering, vol. 42, no. 9, pp. 1077–85, Nov. 1993.
[109] M. C. Borys, N. G. Dalal, N. R. Abu-Absi, S. F. Khattak, Y. Jing, Z. Xing, and Z. J. Li, “Effects of culture conditions on N-glycolylneuraminic acid (Neu5Gc) content of a recombinant fusion protein produced in CHO cells.,” Biotechnology and Bioengineering, vol. 105, no. 6, pp. 1048–57, Apr. 2010.
[110] X. Gu, B. J. Harmon, and D. I. Wang, “Site- and branch-specific sialylation of recombinant human interferon-gamma in Chinese hamster ovary cell culture.,” Biotechnology and Bioengineering, vol. 55, no. 2, pp. 390–8, Jul. 1997.
[111] J. P. Kunkel, D. C. Jan, M. Butler, and J. C. Jamieson, “Comparisons of the glycosylation of a monoclonal antibody produced under nominally identical cell culture conditions in two different bioreactors.,” Biotechnology Progress, vol. 16, no. 3, pp. 462–70, 2000.
[112] M. Spearman, J. Rodriguez, N. Huzel, and K. Sunley, “Effect of Culture Conditions on Glycosylation of Recombinant beta-Interferon in CHO Cells,” in Cell Technology for Cell Products, 2007, pp. 71–85.
[113] E. Pacis, M. Yu, J. Autsen, R. Bayer, and F. Li, “Effects of cell culture conditions on antibody N-linked glycosylation-what affects high mannose 5

112 CHAPTER 8: REFERENCES
glycoform.,” Biotechnology and Bioengineering, vol. 108, no. 10, pp. 2348–2358, May 2011.
[114] T. A. Bibila and D. K. Robinson, “In pursuit of the optimal fed-batch process for monoclonal antibody production.,” Biotechnology Progress, vol. 11, no. 1, pp. 1–13, 1995.
[115] W. Chotigeat, Y. Watanapokasin, S. Mahler, and P. P. Gray, “Role of environmental conditions on the expression levels, glycoform pattern and levels of sialyltransferase for hFSH produced by recombinant CHO cells.,” Cytotechnology, vol. 15, no. 1–3, pp. 217–21, Jan. 1994.
[116] J. P. Kunkel, D. C. Jan, J. C. Jamieson, and M. Butler, “Dissolved oxygen concentration in serum-free continuous culture affects N-linked glycosylation of a monoclonal antibody.,” Journal of Biotechnology, vol. 62, no. 1, pp. 55–71, Jun. 1998.
[117] I. J. Del Val, J. M. Nagy, and C. Kontoravdi, “A dynamic mathematical model for monoclonal antibody N-linked glycosylation and nucleotide sugar donor transport within a maturing Golgi apparatus.,” Biotechnology Progress, Sep. 2011.
[118] P. Hossler, B. C. Mulukutla, and W.-S. Hu, “Systems analysis of N-glycan processing in mammalian cells.,” PloS one, vol. 2, no. 8, p. e713, Jan. 2007.
[119] J. Primack, G. C. Flynn, and H. Pan, “A high-throughput microchip-based glycan screening assay for antibody cell culture samples.,” Electrophoresis, vol. 32, no. 10, pp. 1129–32, May 2011.
[120] O. Warburg, “On the origin of cancer cells.,” Science (New York, N.Y.), vol. 123, no. 3191, pp. 309–14, Feb. 1956.
[121] W. S. Ahn and M. R. Antoniewicz, “Metabolic flux analysis of CHO cells at growth and non-growth phases using isotopic tracers and mass spectrometry.,” Metabolic Engineering, vol. 13, no. 5, pp. 598–609, Sep. 2011.
[122] T. C. Leite, R. G. Coelho, D. Da Silva, W. S. Coelho, M. M. Marinho-Carvalho, and M. Sola-Penna, “Lactate downregulates the glycolytic enzymes hexokinase and phosphofructokinase in diverse tissues from mice.,” FEBS Letters, vol. 585, no. 1, pp. 92–8, Jan. 2011.
[123] B. C. Mulukutla, M. Gramer, and W.-S. Hu, “On metabolic shift to lactate consumption in fed-batch culture of mammalian cells.,” Metabolic Engineering, vol. 14, no. 2, pp. 138–149, Jan. 2012.
[124] M. S. Lao and D. Toth, “Effects of ammonium and lactate on growth and metabolism of a recombinant Chinese hamster ovary cell culture.,” Biotechnology Progress, vol. 13, no. 5, pp. 688–91, 1997.

CHAPTER 8: REFERENCES 113
[125] S. S. Ozturk, M. R. Riley, and B. O. Palsson, “Effects of ammonia and lactate on hybridoma growth, metabolism, and antibody production.,” Biotechnology and Bioengineering, vol. 39, no. 4, pp. 418–31, Feb. 1992.
[126] K. Chen, Q. Liu, L. Xie, P. A. Sharp, and D. I. Wang, “Engineering of a mammalian cell line for reduction of lactate formation and high monoclonal antibody production.,” Biotechnology and Bioengineering, vol. 72, no. 1, pp. 55–61, Jan. 2001.
[127] C. Paredes, E. Prats, J. J. Cairó, F. Azorín, L. Cornudella, and F. Gòdia, “Modification of glucose and glutamine metabolism in hybridoma cells through metabolic engineering.,” Cytotechnology, vol. 30, no. 1–3, pp. 85–93, Jul. 1999.
[128] H. Dorai, Y. S. Kyung, D. Ellis, C. Kinney, C. Lin, D. Jan, G. Moore, and M. J. Betenbaugh, “Expression of anti-apoptosis genes alters lactate metabolism of Chinese Hamster Ovary cells in culture.,” Biotechnology and Bioengineering, vol. 103, no. 3, pp. 592–608, Jun. 2009.
[129] H. J. Cruz, A. S. Ferreira, C. M. Freitas, J. L. Moreira, and M. J. Carrondo, “Metabolic responses to different glucose and glutamine levels in baby hamster kidney cell culture.,” Applied Microbiology and Biotechnology, vol. 51, no. 5, pp. 579–85, May 1999.
[130] W. Zhou, J. Rehm, and W. S. Hu, “High viable cell concentration fed-batch cultures of hybridoma cells through on-line nutrient feeding.,” Biotechnology and Bioengineering, vol. 46, no. 6, pp. 579–87, Jun. 1995.
[131] C. Altamirano, A. Illanes, S. Becerra, J. J. Cairó, and F. Gòdia, “Considerations on the lactate consumption by CHO cells in the presence of galactose.,” Journal of Biotechnology, vol. 125, no. 4, pp. 547–556, 2006.
[132] J. Li, C. L. Wong, N. Vijayasankaran, T. Hudson, and A. Amanullah, “Feeding lactate for CHO cell culture processes: impact on culture metabolism and performance.,” Biotechnology and Bioengineering, vol. 109, no. 5, pp. 1173–86, May 2012.
[133] J. Osman, J. Birch, and J. Varley, “The response of GS-NS0 myeloma cells to pH shifts and pH perturbations.,” Biotechnology and Bioengineering, vol. 75, no. 1, pp. 63–73, Oct. 2001.
[134] W. S. Ahn and M. R. Antoniewicz, “Parallel labeling experiments with [1,2-(13)C]glucose and [U-(13)C]glutamine provide new insights into CHO cell metabolism.,” Metabolic Engineering, vol. 15, pp. 34–47, Jan. 2013.
[135] M. W. Covert and B. O. Palsson, “Constraints-based models: Regulation of Gene Expression Reduces the Steady-state Solution Space,” Journal of Theoretical Biology, vol. 221, no. 3, pp. 309–325, Apr. 2003.

114 CHAPTER 8: REFERENCES
[136] H. P. Bonarius, G. Schmid, and J. Tramper, “Flux analysis of underdetermined metabolic networks: the quest for the missing constraints,” Trends in Biotechnology, vol. 15, no. 8, pp. 308–314, 1997.
[137] L.-E. Quek, S. Dietmair, J. O. Krömer, and L. K. Nielsen, “Metabolic flux analysis in mammalian cell culture.,” Metabolic Engineering, vol. 12, no. 2, pp. 161–71, Mar. 2010.
[138] H. P. Bonarius, B. Timmerarends, C. D. de Gooijer, and J. Tramper, “Metabolite-balancing techniques vs. 13C tracer experiments to determine metabolic fluxes in hybridoma cells.,” Biotechnology and Bioengineering, vol. 58, no. 2–3, pp. 258–62, 1998.
[139] V. S. Martínez, S. Dietmair, L.-E. Quek, M. P. Hodson, P. Gray, and L. K. Nielsen, “Flux balance analysis of CHO cells before and after a metabolic switch from lactate production to consumption.,” Biotechnology and Bioengineering, vol. 110, no. 2, pp. 660–6, Feb. 2013.
[140] N. Sengupta, S. T. Rose, and J. A. Morgan, “Metabolic flux analysis of CHO cell metabolism in the late non-growth phase.,” Biotechnology and Bioengineering, vol. 108, no. 1, pp. 82–92, 2011.
[141] J. Dean and P. Reddy, “Metabolic analysis of antibody producing CHO cells in fed-batch production.,” Biotechnology and Bioengineering, vol. 110, no. 6, pp. 1735–47, Jun. 2013.
[142] J. Greene, J. H. Jr, and J. Wikswo, “Rapid and precise determination of cellular amino acid flux rates using HPLC with automated derivatization with absorbance detection,” Agilent Pub, pp. 1–8, 2009.
[143] T. D. Schmittgen and K. J. Livak, “Analyzing real-time PCR data by the comparative CT method,” Nature Protocols, vol. 3, no. 6, pp. 1101–1108, Jun. 2008.
[144] A. Varma and B. O. Palsson, “Metabolic Flux Balancing: Basic Concepts, Scientific and Practical Use.,” Nature Biotechnology, vol. 12, no. 10, pp. 994–998, Oct. 1994.
[145] M. Kanehisa and S. Goto, “KEGG: kyoto encyclopedia of genes and genomes.,” Nucleic Acids Research, vol. 28, no. 1, pp. 27–30, Jan. 2000.
[146] H. P. Bonarius, V. Hatzimanikatis, K. P. Meesters, C. D. de Gooijer, G. Schmid, and J. Tramper, “Metabolic flux analysis of hybridoma cells in different culture media using mass balances.,” Biotechnology and Bioengineering, vol. 50, no. 3, pp. 299–318, May 1996.
CHAPTER 8: REFERENCES 115
[147] S. Selvarasu, I. A. Karimi, G.-H. Ghim, and D.-Y. Lee, “Genome-scale modeling and in silico analysis of mouse cell metabolic network.,” Molecular Biosystems, vol. 6, no. 1, pp. 152–61, Jan. 2010.
[148] K. Sheikh, J. Förster, and L. K. Nielsen, “Modeling hybridoma cell metabolism using a generic genome-scale metabolic model of Mus musculus.,” Biotechnology Progress, vol. 21, no. 1, pp. 112–21, 2005.
[149] J. M. Savinell and B. O. Palsson, “Network analysis of intermediary metabolism using linear optimization,” Journal of Theoretical Biology, vol. 154, no. 4, pp. 455–473, Feb. 1992.
[150] H. P. Bonarius, A. Ozemre, B. Timmerarends, P. Skrabal, J. Tramper, G. Schmid, and E. Heinzle, “Metabolic-flux analysis of continuously cultured hybridoma cells using (13)CO(2) mass spectrometry in combination with (13)C-lactate nuclear magnetic resonance spectroscopy and metabolite balancing.,” Biotechnology and Bioengineering, vol. 74, no. 6, pp. 528–38, Sep. 2001.
[151] R. P. Nolan and K. Lee, “Dynamic model of CHO cell metabolism,” Metabolic Engineering, vol. 13, no. 1, pp. 108–124, 2011.
[152] C. Pinheiro, A. Longatto-Filho, J. Azevedo-Silva, M. Casal, F. C. Schmitt, and F. Baltazar, “Role of monocarboxylate transporters in human cancers: state of the art.,” Journal of Bioenergetics and Biomembranes, pp. 127–139, Mar. 2012.
[153] S. C. Burgess, N. Hausler, M. Merritt, F. M. H. Jeffrey, C. Storey, A. Milde, S. Koshy, J. Lindner, M. A. Magnuson, C. R. Malloy, and a D. Sherry, “Impaired tricarboxylic acid cycle activity in mouse livers lacking cytosolic phosphoenolpyruvate carboxykinase.,” The Journal of Biological Chemistry, vol. 279, no. 47, pp. 48941–9, Nov. 2004.
[154] P. Hakimi, J. Yang, G. Casadesus, D. Massillon, F. Tolentino-Silva, C. K. Nye, M. E. Cabrera, D. R. Hagen, C. B. Utter, Y. Baghdy, D. H. Johnson, D. L. Wilson, J. P. Kirwan, S. C. Kalhan, and R. W. Hanson, “Overexpression of the cytosolic form of phosphoenolpyruvate carboxykinase (GTP) in skeletal muscle repatterns energy metabolism in the mouse.,” The Journal of Biological Chemistry, vol. 282, no. 45, pp. 32844–55, Nov. 2007.
[155] S. K. Yoon, S. L. Choi, J. Y. Song, and G. M. Lee, “Effect of culture pH on erythropoietin production by Chinese hamster ovary cells grown in suspension at 32.5 and 37.0 degrees C.,” Biotechnology and Bioengineering, vol. 89, no. 3, pp. 345–56, Feb. 2005.
[156] J. Muthing, S. E. Kemminer, H. S. Conradt, D. Sagi, M. Nimtz, U. Kärst, and J. Peter-Katalinić, “Effects of buffering conditions and culture pH on production rates and glycosylation of clinical phase I anti-melanoma mouse IgG3 monoclonal antibody R24.,” Biotechnology and Bioengineering, vol. 83, no. 3, pp. 321–34, Aug. 2003.

116 CHAPTER 8: REFERENCES
[157] T. P. Munro, S. M. Mahler, E. P. Huang, D. Y. Chin, and P. P. Gray, “Bridging the gap: facilities and technologies for development of early stage therapeutic mAb candidates.,” mAbs, vol. 3, no. 5, pp. 440–52, 2011.
[158] P. W. Sauer, J. E. Burky, M. C. Wesson, H. D. Sternard, and L. Qu, “A high-yielding, generic fed-batch cell culture process for production of recombinant antibodies,” Biotechnology and Bioengineering, vol. 67, no. 5, pp. 585–597, 2000.
[159] J. Wayte, R. Boraston, H. Bland, J. Varley, and M. Brown, “pH: Effects on growth and productivity of cell lines producing monoclonal antibodies: Control in large-scale fermenters,” Genetic Engineer and Biotechnologist, vol. 17, no. 2–3, pp. 125–132, 1997.
[160] H. Swiderek and M. Al-Rubeai, “Functional genome-wide analysis of antibody producing NS0 cell line cultivated at different temperatures.,” Biotechnology and Bioengineering, vol. 98, no. 3, pp. 616–30, Oct. 2007.
[161] H. Kaufmann, X. Mazur, M. Fussenegger, and J. E. Bailey, “Influence of low temperature on productivity, proteome and protein phosphorylation of CHO cells.,” Biotechnology and Bioengineering, vol. 63, no. 5, pp. 573–82, Jun. 1999.
[162] M. Shi, Z. G. Xie, M. Yu, B. F. Shen, and N. Guo, “Controlled growth of Chinese hamster ovary cells and high expression of antibody-IL-2 fusion proteins by temperature manipulation,” Biotechnology Letters, vol. 27, no. 23–24, pp. 1879–1884, 2005.
[163] A. Moore, J. Mercer, G. Dutina, C. J. Donahue, K. D. Bauer, J. P. Mather, T. Etcheverry, and T. Ryll, “Effects of temperature shift on cell cycle, apoptosis and nucleotide pools in CHO cell batch cultues.,” Cytotechnology, vol. 23, no. 1–3, pp. 47–54, Jan. 1997.
[164] P. Ducommun, P.-A. Ruffieux, A. Kadouri, U. von Stockar, and I. W. Marison, “Monitoring of temperature effects on animal cell metabolism in a packed bed process.,” Biotechnology and Bioengineering, vol. 77, no. 7, pp. 838–42, Mar. 2002.
[165] S. M. Schatz, R. J. Kerschbaumer, G. Gerstenbauer, M. Kral, F. Dorner, and F. Scheiflinger, “Higher expression of Fab antibody fragments in a CHO cell line at reduced temperature.,” Biotechnology and Bioengineering, vol. 84, no. 4, pp. 433–8, Nov. 2003.
[166] S. Reuveny, D. Velez, J. D. Macmillan, and L. Miller, “Factors affecting monoclonal antibody production in culture.,” Developments in Biological Standardization, vol. 66, pp. 169–75, Jan. 1987.

CHAPTER 8: REFERENCES 117
[167] G. K. Sureshkumar and R. Mutharasan, “The influence of temperature on a mouse-mouse hybridoma growth and monoclonal antibody production.,” Biotechnology and Bioengineering, vol. 37, no. 3, pp. 292–5, Feb. 1991.
[168] N. Barnabé and M. Butler, “Effect of temperature on nucleotide pools and monoclonal antibody production in a mouse hybridoma.,” Biotechnology and Bioengineering, vol. 44, no. 10, pp. 1235–45, Nov. 1994.
[169] J. W. Bloemkolk, M. R. Gray, F. Merchant, and T. R. Mosmann, “Effect of temperature on hybridoma cell cycle and MAb production.,” Biotechnology and Bioengineering, vol. 40, no. 3, pp. 427–31, Jul. 1992.
[170] M. B. Al-Fageeh, R. J. Marchant, M. J. Carden, and C. M. Smales, “The cold-shock response in cultured mammalian cells: Harnessing the response for the improvement of recombinant protein production,” Biotechnology and Bioengineering, vol. 93, no. 5, pp. 829–835, 2006.
[171] K. Sunley and M. Butler, “Strategies for the enhancement of recombinant protein production from mammalian cells by growth arrest,” Biotechnology Advances, vol. 28, no. 3, pp. 385–394, 2010.
[172] M. Alrubeai and A. N. Emery, “Mechanisms and Kinetics of Monoclonal-Antibody Synthesis and Secretion in Synchronous and Asynchronous Hybridoma Cell-Cultures,” Journal of Biotechnology, vol. 16, no. 1–2, pp. 67–86, 1990.
[173] M. Alrubeai, A. N. Emery, S. Chalder, and D. C. Jan, “Specific Monoclonal-Antibody Productivity And The Cell Cycle-Comparisons Of Batch, Continuous And Perfusion Cultures,” Cytotechnology, vol. 9, no. 1–3, pp. 85–97, 1992.
[174] R. L. Dutton, J. M. Scharer, and M. Moo-Young, “Descriptive parameter evaluation in mammalian cell culture,” Cytotechnology, vol. 26, no. 2, pp. 139–152, 1998.
[175] I. Watanabe and S. Okada, “Effects of temperature on growth rate of cultured mammalian cells,” The Journal of Cell Biology, vol. 32, no. 2, pp. 309–23, Feb. 1967.
[176] M. L. Slater, S. O. Sharrow, and J. J. Gart, “Cell cycle of Saccharomycescerevisiae in populations growing at different rates.,” Proceedings of the National Academy of Sciences, vol. 74, no. 9, pp. 3850–3854, Sep. 1977.
[177] E. Suzuki and D. F. Ollis, “Cell cycle model for antibody production kinetics.,” Biotechnology and Bioengineering, vol. 34, no. 11, pp. 1398–402, Dec. 1989.
118 CHAPTER 8: REFERENCES
[178] S. J. Kromenaker and F. Srienc, “Effect of lactic acid on the kinetics of growth and antibody production in a murine hybridoma: secretion patterns during the cell cycle.,” Journal of Biotechnology, vol. 34, no. 1, pp. 13–34, Apr. 1994.
[179] T. I. Linardos, N. Kalogerakis, and L. A. Behie, “Cell cycle model for growth rate and death rate in continuous suspension hybridoma cultures.,” Biotechnology and Bioengineering, vol. 40, no. 3, pp. 359–68, Jul. 1992.
[180] L. Cazzador and L. Mariani, “Growth and Production Modeling in Hybridoma Continuous Cultures,” Biotechnology and Bioengineering, vol. 42, no. 11, pp. 1322–1330, 1993.
[181] S. R. Fox, U. A. Patel, M. G. S. Yap, and D. I. C. Wang, “Maximizing interferon-gamma production by Chinese hamster ovary cells through temperature shift optimization: Experimental and modeling,” Biotechnology and Bioengineering, vol. 85, no. 2, pp. 177–184, 2004.
[182] P. Pozarowski and Z. Darzynkiewicz, “Analysis of cell cycle by flow cytometry.,” Methods in Molecular Biology, vol. 281, pp. 301–11, Jan. 2004.
[183] K. Uchiyama and S. Shioya, “Modeling and optimization of alpha-amylase production in a recombinant yeast fed-batch culture taking account of the cell cycle population distribution,” Journal of Biotechnology, vol. 71, no. 1–3, pp. 133–141, 1999.
[184] C. M. Lam, K. Sriyudthsak, C. Kontoravdi, K. Kothari, H.-H. Park, E. N. Pistikopoulos, and A. Mantalaris, “Cell Cycle Modelling for Off-line Dynamic Optimisation of Mammalian Cultures,” 18th European Symposium on Computer Aided Process Engineering - ESCAPE18, vol. 25, pp. 109–114, 2008.
[185] B. Basse, B. C. Baguley, E. S. Marshall, W. R. Joseph, B. van Brunt, G. Wake, and D. J. N. Wall, “A mathematical model for analysis of the cell cycle in cell lines derived from human tumors,” Journal of Mathematical Biology, vol. 47, no. 4, pp. 295–312, 2003.
[186] N. Kumar, P. Gammell, and M. Clynes, “Proliferation control strategies to improve productivity and survival during CHO based production culture : A summary of recent methods employed and the effects of proliferation control in product secreting CHO cell lines.,” Cytotechnology, vol. 53, no. 1–3, pp. 33–46, Apr. 2007.
[187] C. Kontoravdi, “An integrated modelling/experimental framework for protein-producing cell cultures,” Imperial College London, 2007.
[188] D. J. Jang and J. P. Barford, “An unstructured kinetic model of macromolecular metabolism in batch and fed-batch cultures of hybridoma cells producing monoclonal antibody,” Biochemical Engineering Journal, vol. 4, no. 2, pp. 153–168, 2000.

CHAPTER 8: REFERENCES 119
[189] S. Tatiraju, M. Soroush, and R. Mutharasan, “Multi-rate nonlinear state and parameter estimation in a bioreactor.,” Biotechnology and Bioengineering, vol. 63, no. 1, pp. 22–32, Apr. 1999.
[190] L. Zhao, L. Fan, J. Q. Wang, H. X. Niu, and W. S. Tan, “Responses of GS-NS0 Myeloma Cells to Osmolality: Cell Growth, Intracellular Mass Metabolism, Energy Metabolism, and Antibody Production,” Biotechnology and Bioprocess Engineering, vol. 14, no. 5, pp. 625–632, 2009.
[191] N. Jenkins and A. Hovey, “Temperature control of growth and productivity in mutant Chinese hamster ovary cells synthesizing a recombinant protein.,” Biotechnology and Bioengineering, vol. 42, no. 9, pp. 1029–36, Nov. 1993.
[192] A. Sanfeliu and G. Stephanopoulos, “Effect of glutamine limitation on the death of attached Chinese hamster ovary cells,” Biotechnology and Bioengineering, vol. 64, no. 1, pp. 46–53, 1999.
[193] B. Rossler, H. Lubben, and G. Kretzmer, “Temperature: A simple parameter for process optimization in fed-batch cultures of recombinant Chinese hamster ovary cells,” Enzyme and Microbial Technology, vol. 18, no. 6, pp. 423–427, 1996.
[194] S. Becerra, J. Berrios, N. Osses, and C. Altamirano, “Exploring the effect of mild hypothermia on CHO cell productivity,” Biochemical Engineering Journal, vol. 60, no. 0, pp. 1–8, 2012.
[195] Y. Eguchi, S. Shimizu, and Y. Tsujimoto, “Intracellular ATP levels determine cell death fate by apoptosis or necrosis.,” Cancer Research, vol. 57, no. 10, pp. 1835–40, May 1997.
[196] C. Kontoravdi, S. P. Asprey, E. N. Pistikopoulos, and A. Mantalaris, “Development of a dynamic model of monoclonal antibody production and glycosylation for product quality monitoring,” Computers & Chemical Engineering, vol. 31, no. 5–6, pp. 392–400, 2007.
[197] F. R. Sidoli, A. Mantalaris, and S. P. Asprey, “Modelling of mammalian cells and cell culture processes,” Cytotechnology, vol. 44, no. 1–2, pp. 27–46, 2004.
[198] A. Kiparissides, M. Koutinas, C. Kontoravdi, A. Mantalaris, and E. N. Pistikopoulos, “‘Closing the loop’ in biological systems modeling — From the in silico to the in vitro,” Automatica, vol. 47, no. 6, pp. 1147–1155, Jun. 2011.
[199] T. Ziehn and A. S. Tomlin, “GUI–HDMR – A software tool for global sensitivity analysis of complex models,” Environmental Modelling & Software, vol. 24, no. 7, pp. 775–785, 2009.
[200] F. R. Sidoli, A. Mantalaris, and S. P. Asprey, “Toward global parametric estimability of a large-scale kinetic single-cell model for mammalian cell

120 CHAPTER 8: REFERENCES
cultures,” Industrial & Engineering Chemistry Research, vol. 44, no. 4, pp. 868–878, 2005.
[201] C. Kontoravdi, S. P. Asprey, E. N. Pistikopoulos, and A. Mantalaris, “Application of global sensitivity analysis to determine goals for design of experiments: An example study on antibody-producing cell cultures,” Biotechnology Progress, vol. 21, no. 4, pp. 1128–1135, 2005.
[202] C. A. Sellick, A. S. Croxford, A. R. Maqsood, G. Stephens, H. V Westerhoff, R. Goodacre, and A. J. Dickson, “Metabolite profiling of recombinant CHO cells: designing tailored feeding regimes that enhance recombinant antibody production,” Biotechnology and Bioengineering, vol. 108, no. 12, pp. 3025–3031, 2011.
[203] J. S. Seo, Y. J. Kim, J. M. Cho, E. Baek, and G. M. Lee, “Effect of culture pH on recombinant antibody production by a new human cell line, F2N78, grown in suspension at 33.0 °C and 37.0 °C.,” Applied Microbiology and Biotechnology, vol. 97, no. 12, pp. 5283–91, Jun. 2013.
[204] H. Le, S. Kabbur, L. Pollastrini, Z. Sun, K. Mills, K. Johnson, G. Karypis, and W.-S. Hu, “Multivariate analysis of cell culture bioprocess data--lactate consumption as process indicator.,” Journal of Biotechnology, vol. 162, no. 2–3, pp. 210–23, Dec. 2012.
[205] C. P. Peter, Y. Suzuki, and J. Büchs, “Hydromechanical stress in shake flasks: correlation for the maximum local energy dissipation rate.,” Biotechnology and Bioengineering, vol. 93, no. 6, pp. 1164–76, Apr. 2006.
[206] H. Sandberg, D. Lütkemeyer, S. Kuprin, M. Wrangel, A. Almstedt, P. Persson, V. Ek, and M. Mikaelsson, “Mapping and partial characterization of proteases expressed by a CHO production cell line.,” Biotechnology and Bioengineering, vol. 95, no. 5, pp. 961–71, Dec. 2006.
[207] K. Furukawa and K. Ohsuye, “Effect of culture temperature on a recombinant CHO cell line producing a C-terminal α-amidating enzyme.,” Cytotechnology, vol. 26, no. 2, pp. 153–64, Mar. 1998.
[208] V. Hendrick, P. Winnepenninckx, C. Abdelkafi, O. Vandeputte, M. Cherlet, T. Marique, G. Renemann, A. Loa, G. Kretzmer, and J. Werenne, “Increased productivity of recombinant tissular plasminogen activator (t-PA) by butyrate and shift of temperature: a cell cycle phases analysis,” Cytotechnology, vol. 36, no. 1–3, pp. 71–83, 2001.
[209] R. L. Dutton, J. Scharer, and M. Moo-Young, “Cell cycle phase dependent productivity of a recombinant Chinese hamster ovary cell line,” Cytotechnology, vol. 52, no. 1, pp. 55–69, 2006.

CHAPTER 8: REFERENCES 121
[210] J. E. Bailey, “Mathematical modeling and analysis in biochemical engineering: Past accomplishments and future opportunities,” Biotechnology Progress, vol. 14, no. 1, pp. 8–20, 1998.
[211] J. C. Bigge, T. P. Patel, J. A. Bruce, P. N. Goulding, S. M. Charles, and R. B. Parekh, “Nonselective and efficient fluorescent labeling of glycans using 2-amino benzamide and anthranilic acid.,” Analytical Biochemistry, vol. 230, no. 2, pp. 229–38, Sep. 1995.
[212] A. H. Merry, D. C. A. Neville, L. Royle, B. Matthews, D. J. Harvey, R. A. Dwek, and P. M. Rudd, “Recovery of intact 2-aminobenzamide-labeled O-glycans released from glycoproteins by hydrazinolysis.,” Analytical Biochemistry, vol. 304, no. 1, pp. 91–9, May 2002.
[213] C. Altamirano, A. Illanes, A. Casablancas, X. Gámez, J. J. Cairó, and C. Gòdia, “Analysis of CHO cells metabolic redistribution in a glutamate-based defined medium in continuous culture.,” Biotechnology Progress, vol. 17, no. 6, pp. 1032–41, 2001.
[214] L. Xie and D. I. Wang, “Stoichiometric analysis of animal cell growth and its application in medium design.,” Biotechnology and Bioengineering, vol. 43, no. 11, pp. 1164–74, May 1994.
[215] C. Zupke and G. Stephanopoulos, “Intracellular flux analysis in hybridomas using mass balances and in vitro (13)C NMR.,” Biotechnology and Bioengineering, vol. 45, no. 4, pp. 292–303, Feb. 1995.


123
9 Figure and Table Index
9.1 List of Figures
Figure 2-1: Standard batch cultivation of murine hybridoma cells in a controlled
bioreactor system (n=4). Profile of (A) viable cell concentration, (B) glucose () and
lactate (), (C) monoclonal antibody and (D) glutamine () and ammonia ()
concentrations. .............................................................................................................. 14
Figure 2-2: pH shift experiments during batch cultivation of murine hybridoma cells.
Starting at standard pH condition 7.2 a pH shift was performed in the early exponential
phase indicated by a dashed line and covered a pH range from 6.5 – 8.5. Profile of (A)
viable cell concentration, (B) viability and (C) mAb concentration at different pH
setpoints. ....................................................................................................................... 15
Figure 2-3. Impact of process parameter shifts (pH, osmolarity, dissolved O2 and
sparging) on the specific growth rate 10 hours after the parameter shift. The specific
growth rate was calculated for each condition according to Eq. 2-2 and normalized to
the specific growth rate obtained under standard conditions. The standard deviation
was calculated from four independent standard cultivations. ....................................... 16
Figure 2-4: N-linked glycosylation profile of HFN 7.1 antibody (IgG1). The antibody
was purified at the end of a standard batch culture, glycans were released by PNGase
F, labeled with 2-AB and fluorescently detected by HILIC. The predominant peaks
were fractionated and the masses were measured by MALDI TOF MS and compared
to characterized oligosaccharide structures. Sugar residues are as reported in the
Appendix (Table A 1). .................................................................................................. 19
Figure 2-5: N-linked glycosylation profile of purified monoclonal antibody analyzed at
three different time points throughout a batch culture [t (shift) = 26h, t (max. Xv) = 54
hours, t (end) = 80 hours]. Relative peak areas of (A) a standard batch culture without
process parameter shift were compared to (B) pH-shifted culture to pH 7.8. .............. 20
Figure 2-6: Change in each glycoform fraction ∆Fi induced by process parameter (A)
pH and (B) dissolved O2 (DO). The change in glycoform fraction is expressed as

124 CHAPTER 9: FIGURES AND TABLES
difference of the produced glycoform between the parameter shift time and the end of
the culture, normalized to the change in antibody concentration and was calculated
according to Eq. 2-3. () G0F, () G1F, () G2F, () G3F, () G0, () G2F-
NGNA, () G2F-NGNA2, () G2F-GalNGNA, () G0F-GalNGNA. Sugar residues
are as reported in the Appendix (Table A 1). ............................................................... 23
Figure 2-7: Change in each glycoform fraction ∆Fi induced by process parameter (A)
sparging and (B) osmolarity. The change in glycoform fraction is expressed as
difference of the produced glycoform between the parameter shift time and the end of
the culture, normalized to the change in antibody concentration and was calculated
according to Eq. 2-3. () G0F, () G1F, () G2F, () G3F, () G0, () G2F-
NGNA, () G2F-NGNA2, () G2F-GalNGNA, () G0F-GalNGNA. .................... 25
Figure 3-1: Profiles of (A) viable cell concentration, (B) antibody concentration, (C)
lactate concentration and (D) glucose concentration of a standard cultivation pH 7.2
(n=4) and two pH-shifted cultivations (pH 6.8 and pH 7.8) performed in duplicates. pH
shift was performed once cells reached 1 x 10⁶ cells/mL and is indicated by dashed
line. Measured data points were fitted using logistic equations (3-1), (3-2) and (3-3). 34
Figure 3-2: Specific consumption and production rates of glucose, lactate, various
amino acids (nmol/106cells/h), biomass and mAb (µg/106 cells/h) under different pH
conditions. (A) Standard batch cultivation (pH 7.2) at three time points (WD 1.0, WD
1.5 and WD 1.9) during exponential growth phase. (B) Comparison of two metabolic
states at pH 7.2 and at pH 6.8 evaluated 17 hours after pH-shift (WD 1.9). (C)
Comparison of two metabolic states at pH 7.2 and at pH 7.8 evaluated 17 hours after
pH-shift (WD 1.9). Indicated time points were considered in FBA. ............................ 36
Figure 3-3: Intracellular flux distribution within glycolysis, TCA cycle, malate-
aspartate shuttle, glutaminolysis, biomass and mAb synthesis of standard batch
cultivation at three time points during exponential growth phase. The pathways of
amino acid metabolism are not shown. Values of all calculated fluxes are reported in
the Appendix (Figure A 3). ........................................................................................... 38
Figure 3-4: Intracellular flux distribution within glycolysis, TCA cycle, malate-
aspartate shuttle, glutaminolysis, biomass and mAb synthesis in lactate consumption

CHAPTER 9: FIGURES AND TABLES 125
state (pH 6.8) compared to lactate production state at standard conditions (pH 7.2) at
working day 1.9. The pathways of amino acid metabolism are not shown. Values of all
calculated fluxes are reported in the Appendix (Figure A 4). ...................................... 39
Figure 3-5: Gene expression of 32 genes involved in the central murine metabolism.
Data were measured in triplicates and mRNA expression of the two pH-shifted
conditions was compared relative to mRNA expression at the time of pH shift. 50%
over- or under-expression is considered as not significant. .......................................... 40
Figure 3-6: Intracellular flux distribution including additional mitochondrial PEP
recycle pathway of high pH condition (pH 7.8) compared to lactate production state at
standard conditions (pH 7.2) at working day 1.9. The pathways of amino acid
metabolism are not shown. Values of all calculated fluxes are reported in the Appendix
(Figure A 5). .................................................................................................................. 43
Figure 3-7: Comparison of energy metabolism of lactate consumption state (pH 6.8)
and lactate overproduction state (pH 7.8) with lactate production state during the
exponential growth phase at standard conditions (pH 7.2). Total ATP production rate
by ATP, NADH and FADH2 was calculated considering different originating
pathways. A P/O ratio of 2.5 for NADH and 1.5 for FADH2 was assumed. ................ 44
Figure 4-1: Schematic representation of the cell cycle model. ..................................... 59
Figure 4-2: Sensitivity indices for parameters at simulation times (day 1, 4 and 6). (A)
viable cell concentration (Xv), (B) mAb titer, (C) G0 cell fraction (fG0), (D) G1 cell
fraction (fG1) (E) S cell fraction (fS) (F) G2/M cell fraction (fG2/M). The nomenclature is
equal as in Eq. 4-1 – 4-27. ............................................................................................ 62
Figure 4-3: Shake flask batch culture at 37 °C. Experimental results of viable cell
concentration (Xv), viability, antibody concentration (mAb), glucose (GLC), lactate
(LAC), glutamine (GLN) and ammonia (AMM) concentrations, and cell cycle
fractions G0/G1, S, G2/M compared to model results (solid line: Xv, LAC, AMM,
G0/G1, S, G2/M fractions; dashed lines: viability, mAb, GLC, GLN). ......................... 64
Figure 4-4: Shake flask batch culture at 33 °C. Experimental results of viable cell
concentration (Xv), viability, antibody concentration (mAb), glucose (GLC), lactate
(LAC), glutamine (GLN) and ammonia (AMM) concentrations, and cell cycle

126 CHAPTER 9: FIGURES AND TABLES
fractions G0/G1, S, G2/M compared to model results (solid line: Xv, LAC, AMM,
G0/G1, S, G2/M fractions; dashed lines: viability, mAb, GLC, GLN). ......................... 66
Figure 4-5: Controlled fed-batch culture at 37 °C. Experimental results of viable cell
concentration (Xv), viability, antibody concentration (mAb), glucose (GLC), lactate
(LAC), glutamine (GLN) and ammonia (AMM) concentrations, and cell cycle
fractions G0, G1, S, G2/M compared to model results (solid line: Xv, LAC, AMM, G1,
S, G2/M fractions; dashed lines: viability, mAb, GLC, GLN, G0 fraction). ................. 68
Figure 4-6: Controlled fed-batch culture shifted to 33 °C at culture start. Experimental
results of viable cell concentration (Xv), viability, antibody concentration (mAb),
glucose (GLC), lactate (LAC), glutamine (GLN) and ammonia (AMM) concentrations,
and cell cycle fractions G0, G1, S, G2/M compared to model results (solid line: Xv,
LAC, AMM, G1, S, G2/M fractions; dashed lines: viability, mAb, GLC, GLN, G0
fraction). ........................................................................................................................ 70
Figure 4-7: Controlled fed-batch culture with temperature shift to 33 °C after 30 h.
Shift is indicated by dotted line. Experimental results of viable cell concentration (Xv),
viability, antibody concentration (mAb), glucose (GLC), lactate (LAC), glutamine
(GLN) and ammonia (AMM) concentrations, and cell cycle fractions G0, G1, S, G2/M
compared to model prediction (solid line: Xv, LAC, AMM, G1, S, G2/M fractions;
dashed lines: viability, mAb, GLC, GLN, G0). ............................................................. 71
Figure 4-8: Temperature shifted controlled fed-batch culture to 33 °C after 76 h. Shift
in indicated by a dotted line. Experimental results of viable cell concentration (Xv),
viability, antibody concentration (mAb), glucose (GLC), lactate (LAC), glutamine
(GLN) and ammonia (AMM) concentrations, and cell cycle fractions G0, G1, S, G2/M
compared to model prediction (solid line: Xv, LAC, AMM, G1, S, G2/M fractions;
dashed lines: viability, mAb, GLC, GLN, G0 fraction). ............................................... 73
Figure A 1: MALDI-TOF MS spectra of the 2-AB labeled oligosaccharide released
from HFN 7.1 antibody by PNGase F in (A) positive ion mode and (B) negative ion
mode. Peaks in positive ion mode are either detected as Na+ or K+ adducts. (C)
Fragmentation pattern of G1F (m/z 1767.70) obtained by MALDI-TOF MS/MS in

CHAPTER 9: FIGURES AND TABLES 127
positive ion mode. Sugar residues are N-acetylglucosamine (GlcNAc, ), fucose (F,
), mannose (M, ), galactose (G, ). ............................................................................ 83
Figure A 2: Flux balance model scheme. PEP regeneration pathway was only active at
pH 7.8 and therefore the fluxes OAAmPEPm and PEPmPEP were constrained
under all other conditions.............................................................................................. 95
Figure A 3: Intracellular fluxes calculated by flux balance analysis at three different
time points (WD 1.0, WD 1.5, WD 1.9) for standard pH 7.2 culture. Numbers
correspond to reactions specified below. ...................................................................... 96
Figure A 4: Comparison between intracellular fluxes at culture pH 7.2 and pH 6.8
calculated by flux balance analysis at WD 1.9. Numbers correspond to reactions
specified below. ............................................................................................................ 97
Figure A 5: Comparison between intracellular fluxes at culture pH 7.2 and pH 7.8
calculated by flux balance analysis at WD 1.9. Numbers correspond to reactions
specified below. Reactions 48 - 50 included to metabolic network as additional
constraints according to gene expression data. ............................................................. 98
9.2 List of Tables
Table 2-1: Degree of galactosylation (GI), sialylation (SI) and fucosylation (FI) as a
function of the single shift parameter pH or osmolarity (mOsm/kg), and as a function
of the combined effect of pH and osmolarity. .............................................................. 24
Table A 1: Measured masses of reductively aminated oligosaccharides determined by
MALDI-TOF MS and compared to theoretical masses. Proposed glycoforms were
assigned to the glycosylation profile in Figure 2-4....................................................... 84
Table A 2: List of target genes investigated by gene expression analysis.................... 86
Table A 3: Reactions in the metabolic network used for flux balance analysis. .......... 88
Table A 4: Averaged dry cell composition (protein, carbohydrates, nucleotides, lipids)
of murine hybridoma cells derived from literature [148]. ........................................... 93
128 CHAPTER 9: FIGURES AND TABLES
Table A 5: Amino acid composition of IgG1 derived from an average IgG1 protein
sequence [137]. ............................................................................................................. 94
Table A 6: Model parameter values. ............................................................................. 99

129