rideau lakes subwatershed report 2014 · rideau lakes subwatershed report 2014 ... h i st orc s e a...
TRANSCRIPT

Rideau Lakes Subwatershed Report 2014BIG RIDEAU LAKE – RIDEAU FERRY CATCHMENT
General�Geography• The Rideau Lakes are a very popular seasonal tourist and residential
destination because of its diverse natural amenity, cultural history associatedwith the UNESCO World Heritage Site designated Rideau Canal, closeproximity to a number of large cities and towns and ease of access via theRideau Canal. Residents and vacationers flock to Rideau Lakes in the
1
!!. !!.!!.!!.
!!.!!. !!.!!.!!. !!.
!!.!!.
!!.!!.!!.!!.!!.!!.
!!.!!.
!!.!!.!!.!!.
!!.!!.!!.
!!.!!.
!!.!!.
!!.
OLD
KIN
GS
TON
RD
RIDEAU FERRY RD
ELM G
ROVE RD
MAHON RD
PORT E
LMSLE
Y RD
RID
EAU LK R
D
!!. RVCA Benthic Site
!!. Water Level Gauge
!!. RVCA Water Quality Site
Surveyed Stream
ANSI
Land Cover
Transportation
Settlement
Aggregate Site
Crop and Pasture
Grassland
Evaluated Wetland
Unevaluated Wetland
Water
Wooded Area
0 1.50.75
Kilometres ²
Rideau Lakes
Tay Valley
Drummond/North Elmsley
Big Rideau
Lake
Round Lake
AdamLake
Loon Lake
Long Lake
Murphys PointProvincial Park
The RVCA produces individual reports for eight catchments in the Rideau Lakes subwatershed. Usingdata collected and analysed by the RVCA through its watershed monitoring and land cover classificationprograms, surface water quality conditions are reported for Big Rideau Lake along with a summary ofenvironmental conditions for the surrounding countryside every six years.
This information is used to better understand the effects of human activity on our water resources, allowsus to better track environmental change over time and helps focus watershed management actions wherethey are needed the most.
The following pages of this report are a compilation of that work. For other Rideau Lakes catchments andthe Rideau�Lakes�Subwatershed�Report, please visit the RVCA website at www.rvca.ca
Catchment Facts
What’s Inside1. Surface Water Quality Conditions .......................5
BIg Rideau Lake..................................................5Round Lake ........................................................9Loon Lake.........................................................12Long Lake.........................................................16Adam Lake .......................................................19
2. Riparian Conditions...........................................233. Land Cover .......................................................254. Stewardship & Protection..................................265. Issues ...............................................................286. Opportunties for Action .....................................29
summer to take advantage of its natural heritage and recreationalopportunities such as boating, fishing and swimming. Cottages,houses, campgrounds, B&Bs and marinas stretch extensivelyalong the shoreline that was once largely untouched, puttingpressure on the natural resources that support the Rideau Lakesmany uses and users
• Newboro, Portland, Rideau Ferry and Westport are the mainsettlement areas in the Rideau Lakes subwatershed. Of these,only Rideau Ferry is located in the Big Rideau (Rideau Ferry)catchment, which supports a substantial tourist trade and is aservice centre for local residents. It is also a major boating centrein the Rideau Lakes offering marina and other services and is oneof the main gateways for visitors to access the Rideau Lakes
• Parks Canada manages water levels for recreational purposesalong the Rideau Canal/Waterway (also designated a NationalHistoric Site and a Canadian Heritage River) that runs throughthe catchment, ensuring 1.5 metres of draft during the navigationseason. In this managed system, water levels on the RideauCanal are manipulated by operation of numerous dams. In theRideau Lakes subwatershed, Parks Canada staff operate dams atWolfe Lake, the Narrows on Upper Rideau and Poonamalie at theoutlet of Lower Rideau Lake. The dams on Westport Sand Lakeand Westport Pond are operated by the Ministry of NaturalResources and Forests in cooperation with Parks Canada. Waterlevels are lowered in October throughout the Canal system to thewinter operating level that is maintained until early March whensnow, ice and precipitation data are used to estimate spring snowmelt conditions. At the onset of the spring freshet, water levelsare targeted using a rule curve (i.e. a pre-determined estimate ofwater levels to ensure a “best fit” to prevent as much as possiblehigh and low levels). In late May, levels are at the maximum forthe beginning of the navigation season. Levels decline graduallythroughout the summer until the winter level is reached onceagain. The annual range of operational water levels on the lakesis in the order of one metre

Rideau Lakes Subwatershed Report 2014Big Rideau Lake – Rideau Ferry Catchment
2
• The Rideau Lakes form part of the Frontenac Arch Biosphere Reserve(Frontenac Axis), an important intra-regional landscape feature whichsupports a wide variety of species and their movements betweenAlgonquin Park in Central Ontario and Adirondack Park in Upper NewYork State
• Big Rideau Lake (Rideau Ferry catchment) has many embaymentsincluding Bests Bay, Coutts Bay, Davidsons Bay, Jacklins Bay,McLeans Bay, McVeetys Bay, Nobles Bay and O’Mearas Bay
Physical�Geography• The northern half of the Big Rideau Lake-Rideau Ferry catchment is
located within a physiographic region known as the Smith FallsLimestone Plain which, in this area, happens to consist of olderPaleozoic quartzose sandstone, some dolostone and possiblyconglomerate which is overlain by mixed glacial sediment oftenreferred to as drift
• The southern half of the Big Rideau Lake-Rideau Ferry catchment and themajority of the Rideau Lakes subwatershed resides within the AlgonquinHighlands, which is an ancient (Precambrian) hilly area made up of thinand variable glacial deposits overlying igneous and metamorphic rockridges and knolls. In this catchment, these rocks are marble or granite.Rocks associated with geologic faults are also found here
• Organic deposits are also found throughout the catchment whereswamps and marshes are situated. A geologic fault transects the lake in anortheasterly direction and a drumlin feature is located along RideauFerry Road, west of the Port Elmsley Road
• Forty-six percent of the catchment lies within Tay Valley Township, 28 percent is in Drummond/North Elmsley Township and 26 percentwithin the Township of Rideau Lakes
• Big Rideau-Rideau Ferry catchment drainage area is 55 squarekilometres and occupies about 12 percent of the Rideau Lakessubwatershed and less than two percent of the Rideau Valley watershed
• Dominant land cover is woodland (39 percent) and water (26 percent)followed by wetland (15 percent), crop and pastureland (12 percent),settlement areas (five percent) and transportation routes (three percent)
Vulnerable�Areas• Certain lands around Big Rideau Lake are subject to flooding hazard
during the regional storm flood (the 100 year flood) conditions in thearea. Surveys and studies undertaken in accordance with provincialstandards have determined that the 100 year flood elevation for thelake is 124.51 metres above mean sea level
• The Assessment Report developed under the Ontario Clean�Water�Actidentified the catchment area as Highly Vulnerable Aquifer and aportion of the area is considered to be a Significant GroundwaterRecharge Area
Development/Trends• Given the proximity to the serviced communities of Perth, Portland,
Rideau Ferry and Smiths Falls, (which have a mix of residential,commercial and institutional uses), there is added pressure for otherresidential development beyond existing settlement areas in the Ruralzoned areas around Big Rideau Lake
• Much of this development will continue to occur along waterfronts, as ithas in the past. While many lakes have been developed to the extentthat the physiography of the region will allow, others still have somedevelopment potential. In some cases, new lot development can occuronly on marginal lands (steep slopes, shallow soils, narrowwaterfronts, low lying poorly-drained lands) as the remaining landshave been fully developed
• Most development activity is focused around redevelopment, wherecottages are being replaced with large permanent residences on small
lots. This can put additional stress on the lake environment becauselarge development envelopes on smaller lots leave less space fornatural processes (e.g., runoff, infiltration and retention, nutrientuptake, erosion control and shading) and natural features (e.g., trees,shrubs and plants) that support a healthy lake environment. Minorvariances are frequently triggered because the lots do not havesufficient area to provide for a minimum 30 metre development setbackfrom the lake
• In the Drummond/North Elmsley Township area of the catchment, theshoreline is densely developed and contains the longstandingresidential and commercial community of Rideau Ferry. Just to thewest of the village is the Coutts Bay Road neighbourhood, which hasestablished subdivisions built on the peninsulas extending into BigRideau Lake, many of which have year round dwellings on half acrelots. Newer subdivision development in this area features greater lakesetbacks and some additional protection for wetland areas. Closer toTay Valley Township, development consists of traditional cottagedevelopment occupying most of the shoreline, accessed from privateroads (namely McVeetys, Maple Crest and Wild Grape Lane), whileother areas are experiencing cottage conversion and redevelopment.Current land-use zoning in the catchment consists mainly of LimitedService Residential along the waterfront of Big Rideau Lake and Ruralelsewhere with some smaller Rural and Residential zones in RideauFerry and in adjacent subdivisions. There is also commercial andrecreational development in the catchment oriented towards theRideau Ferry Road in the vicinity of the village
• Development in the Tay Valley Township area of the catchmentconsists largely of new cottages or conversions of cottages topermanent residences around Adams Lake, Big Rideau Lake andRound Lake with access being provided by a combination of municipaland private roads. Current land-use zoning is mostly SeasonalResidential or Residential Limited Services along with a large OpenSpace block that coincides with Murphys Point Provincial Park
• In the Township of Rideau Lakes, the catchment is zonedpredominately Rural with the southern shoreline of Big Rideau Lakezoned Waterfront Residential, where intensification (i.e., conversions,expansions, upgrades) on existing lots containing smaller, oldercottages accounts for much of the redevelopment activity
Conditions�at�a�Glance• Surface water quality rating in Big Rideau Lake (Rideau Ferry
catchment) is “Fair”; “Poor” in Adams, Long and Loon Lakes and“Good” in Round Lake
• Woodland cover proportion has changed/increased by one percent (67 ha) from 2002 to 2008, due to a combination of changes in landcover/land uses and/or applied digital air photo classification methods
• In the Big Rideau Lake-Rideau Ferry catchment, the riparian buffer (30 metre wide strip along the shoreline of all lakes and streams) iscomprised of woodland (46 percent), wetland (34 percent), settlementareas (12 percent), crop and pastureland (six percent), andtransportation routes (two percent)
• Around Big Rideau Lake (in the Rideau Ferry catchment), the shorelinebuffer is made up of woodland (46 percent), settlement areas (31 percent), wetland (21 percent), transportation routes (one percent)and crop and pastureland (one percent)
• Around Adam Lake, the shoreline buffer is made up of woodland (61 percent), settlement areas (26 percent), wetland (10 percent),transportation routes (two percent) and crop and pastureland (one percent)
• Around Long Lake, the shoreline buffer is made up of woodland (63 percent), wetland (20 percent) and settlement areas (17 percent)
• Around Round Lake, the shoreline buffer is made up of woodland

Rideau Lakes Subwatershed Report 2014Big Rideau Lake – Rideau Ferry Catchment
3
(84 percent), wetland (10 percent), settlement areas (four percent) andtransportation routes (two percent)
• Along streams, the riparian buffer is comprised of wetland (46 percent),woodland (38 percent), crop and pastureland (11 percent),transportation routes (three percent) and settlement areas (twopercent) throughout the whole catchment
• Development on Big Rideau Lake (in the Rideau Ferry catchment) andin Rideau Ferry occurs on private wells (of which there are about618 water well records in the catchment) and septic systems
• Since 1987, Big Rideau Lake has been managed as a Class One, coldwater lake that can support natural reproduction of important sport fishspecies such as lake trout. Big Rideau Lake has been stocked (with ninedifferent fish species, but mainly with lake trout, over the last100 years). Stocking ceased entirely in 2009 because it was determinedthat the practice was introducing too much intra-specific stress on thenative population (to the point that more and more stocked fish wereshowing up on spawning shoals). The only remaining Rideau Lakesstocking takes place on Westport Sand Lake where walleye is stockedannually by the Westport Area Outdoors Association
• Commercial fishery quotas and conditions for the last several years onUpper, Big and Lower Rideau Lakes have remained the same with oneexception on Upper Rideau where MNR has increased the yellowperch quota based on the 2013 assessment. MNR fisheries researchspecialists confirm that inland commercial fishery quotas on the RideauLakes system are sustainable
• 2009 MNR fish population survey of Big Rideau Lake FisheriesManagement Zone 18 identified 20 large mesh net species:pumpkinseed (19%), yellow perch (17%), brown bullhead (13%), cisco(11%), alewife (7%), rock bass (6%), northern pike (6%), smallmouthbass (5%), bluegill (5%), lake trout (4%), lake whitefish (3%),largemouth bass (2%), black crappie, burbot, walleye, white sucker(2%) and four small mesh net species: gizzard shad, golden shiner,ninespine stickleback and sand shiner
Catchment�Care• Since 2000, RVCA monitors Big Rideau Lake surface water quality
through its Watershed Watch Program. In 2006, the program wasaltered to gain consistent, year to year data for the set of lakes beingmonitored. In response to the 2009 Rideau�Lakes�Watershed�Planaction to “Develop a more intensive and coordinated water qualitymonitoring program for the Rideau Lakes,” RVCA monitors surfacewater quality: on Big Rideau Lake (in the catchment) four times of theyear at one deep point site (four samples annually) and twice a year attwo shoreline sites (four samples annually); on Loon Lake four times ofthe year at one deep point site (four samples annually), twice a year atone shoreline site (two samples annually) and twice at an additionaltwo shoreline sites every fifth year (four samples in total); on RoundLake four times of the year at one deep point site (four samplesannually), twice a year at two shoreline site (four samples annually)and twice at an additional three shoreline sites every fifth year (sixsamples in total); on Long Lake four times of the year at one deeppoint site (four samples annually), twice a year at three shoreline site(six samples annually) and twice at an additional four shoreline sitesevery fifth year (eight samples in total); on Adam Lake four times of theyear at one deep point site (four samples annually), twice a year atthree shoreline site (six samples annually) and twice at an additionalfive shoreline sites every fifth year (ten samples in total)
• RVCA provides septic system re-inspection at the request of theTownship of Rideau Lakes (since 2007) and Tay Valley Township(since 2004); currently, there is no re-inspection program offered in thecatchment within Drummond/North Elmsley Township
• Tay Valley Township septic system voluntary re-inspections were
undertaken on 47 Big Rideau Lake properties in the catchment by theMississippi Rideau Septic System Office. Remedial/maintenance workwas advocated for 26 of those properties, a septic system replacementat one other property with more information supplied to a further threelandowners with septic system concerns; 17 properties were identifiedas having no concerns
• Township of Rideau Lakes septic system voluntary re-inspections wereundertaken on 20 Big Rideau Lake properties in the catchment by theMississippi Rideau Septic System Office. Remedial/maintenance workwas advocated for 10 of those properties and one septic systemreplacement at another property; nine properties were identified ashaving no concerns
• Twenty-four stewardship projects have been completed throughRVCA’s Private Land Forestry, Rural Clean Water and ShorelineNaturalization Programs (see Section 4 of this report for details)
• RVCA completed littoral zone mapping around Adam Lake, Big RideauLake, Loon Lake and Round Lake in 2013, identifying substrate type,vegetation and habitat features along with opportunities for shorelineenhancements
• Big Rideau Lake Association has worked for many decades toenhance the social community and natural environment of the RideauLake system by providing ongoing activities and programs for residentsliving along its shores from the Narrows Lock to Poonamalie (visitBig Rideau Lake Association for more information)
• Adam Lake Property Owners Association has prepared the Adam�LakeStewardship�Plan (2009) in which its residents have identified theircommunity as a tranquil and unspoiled place consisting of single familydwellings in a natural setting and where the lake should provide anopportunity for recreation and relaxation in an atmosphere of mutualrespect and consideration. To achieve this vision, residents have setquality of life related objectives to maintain and improve water quality,to make sure that development enhances and does not harm the lake,to promote responsible lake use and safe swimming and to build asense of community
• One Permit to Take Water (PTTW) has been issued for campgroundrecreational activities
• A watershed model developed by the RVCA in 2009 was used to studythe hydrologic function of wetlands in the Rideau Valley Watershed,including those found in the Big Rideau Lake-Rideau Ferry catchment
• RVCA provides flood forecasting and warning services throughout theRideau Valley watershed. In the Upper Rideau watershed, only generalflooding information has been made available historically for the lakes.In 2014, lake levels were higher than most years and more attentionwas required from RVCA and municipal staff, resulting in the decisionto review what the flood forecasting and warning program provides tothe Upper Rideau Valley
• The Townships of Drummond/North Elmsley, Rideau Lakes and TayValley have land use planning policies and zoning provisions (on lakecapacity, water setbacks, frontage, naturalized shorelines and wetlandprotection) and use site plan control to implement these policies andprovisions. Together with RVCA and Parks Canada, they work withlandowners on a case by case basis to achieve net environmentalgains (particularly with respect to shoreline vegetation protection andrehabilitation) through the use of shoreline best managementpractices. Collectively, the Townships and the agencies requestconditions on planning approvals to ensure that development andredevelopment is appropriate for the property, impacts on neighboursare minimized (particularly on very small lots) and developmentsetbacks for the shoreline are maximized
• Development in and adjacent to Provincially Significant Wetlandsand some locally significant wetlands is subject to Ontario Regulation174-06 (entitled “Development, Interference with Wetlands and

Rideau Lakes Subwatershed Report 2014Big Rideau Lake – Rideau Ferry Catchment
4
Alterations to Shorelines and Watercourses”) that protects thehydrologic function of the wetland and also protects landowners andtheir property from natural hazards (flooding, fluctuating water table,unstable soils) associated with them
• Rideau�Lakes�Basin�Carrying�Capacity�Study�(1992) evaluated thecapacity of the Rideau Lakes to support development with respect tolake trophic state (level of phosphorus and chlorophyll a) and shorelinedevelopment. Results have been used to provide land-use planningpolicy direction and guidance (in the form of a site evaluation guideline)to the municipalities of Drummond/North Elmsley, Rideau Lakes andTay Valley and the Conservation Authority. Using phosphorus as thedeterminant for lake capacity, the study attempted to identify how muchdevelopment was permissible to retain the “no net loss” in water qualityprinciple (i.e., no net increase in phosphorus loading).Recommendations from it included the need to set water qualitytargets for each lake of concern, requiring buildings to be set no closerthan 30 metres from water (with greater widths being recommended inareas with poor phosphorus retention based on soil type, slope andgeological conditions), minimizing disturbance to shoreline vegetationand no alteration to the soil mantle within the protective setback area.An update to the abovementioned site evaluation guide is currentlyunderway and is to be made available in 2015
• MNR conducts Broad-scale Monitoring of the Big Rideau Lake fisheryon a five year rotation within Fisheries Management Zone 18 toprovide information for effective fisheries management
• Parks Canada attempts to incorporate the breeding and habitat needsof fish and wildlife when determining water levels, flows and timing ofdrawdowns in the Rideau Lakes. For more information, please refer tothe “Operating Rule Curve” for Big Rideau Lake available (atwww.rvca.ca) in the 2014 Rideau�Lakes�Subwatershed�Report sectionon “Water Levels”
• Rideau�Canal�National�Historic�Site�of�Canada�Management�Plan(2005) update establishes the long term strategic direction for themanagement of the Rideau Canal
• Rideau�Canal�World�Heritage�Site�Management�Plan�(2005) specifies how its world heritage values will be protected for presentand future generations
• 2002 Rideau�Lake�State�of�the�Lake�Report�(Centre for SustainableWatersheds) seeks to give a backdrop of understanding of the lakeand the natural forces and past human activities that have shaped it
• Most of the shoreline of Big Rideau Lake is held in private ownership,so that the best opportunity for shoreline restoration/enhancementrests with private landowners. RVCA offers its Shoreline NaturalizationProgram to Rideau Lakes landowners to assist with shoreline re-vegetation (an enhanced delivery program has been put into place inresponse to the 2009 Rideau�Lakes�Watershed�Plan action to“Increase funding for the RVCA Shoreline Naturalization Program”)

Rideau Lakes Subwatershed Report 2014Big Rideau Lake – Rideau Ferry Catchment
5
Table 1WQI Ratings for Big Rideau Lake (Rideau Ferry catchment), 2008-2013
Sampling Site Location 2002-2007 RatingRVL-34 Loon Lake 52 PoorRVL-33 Round Lake 88 GoodRVL-13 Long Lake 53 PoorRVL-32 Adam Lake 53 Poor
RVL-38 Big Rideau Lake (Rocky Narrows to Rideau Ferry)
77 Fair
1. Surface Water Quality ConditionsSurface water quality conditions in the Big Rideau Lake-Rideau Ferrycatchment are monitored by the Rideau Valley Conservation Authority’s(RVCA) Watershed Watch Program and Baseline Water Quality MonitoringProgram. Watershed Watch monitors watershed lakes to assess nutrientconcentrations, water clarity, dissolved oxygen availability and pH. Thebaseline water quality program focuses on streams; data is collected for22 parameters including nutrients (total phosphorus, total Kjeldahl nitrogenand ammonia), E.�coli, metals (like aluminum and copper) and additionalchemical/physical parameters (such as alkalinity, chlorides, pH and totalsuspended solids). The locations of monitoring sites are shown in Figure 1and Table 1.
!( !(!(
!(!( !( !(
!(!( !(
!(!(
!(!(!(
!(
!(!(
!(!(
!(
!(!(!(!(
!(!(
!(!( A
D EC
BFGA
FEA
DCB
GACB AD
C
BE
R2
DP
DP
DPDP
38DP
OLD
KIN
GS
TON
RD
ELM GROVE R
D
MAHON RD
LAL
LY R
D
RIDEAU LK RD
0 21
Kilometres ²!( RVCA Watershed Watch Sites!( RVCA Baseline Sites
Figure 1 Water quality monitoring sites in the Big Rideau Lake-Rideau Ferry catchment.
1) a. Big Rideau Lake Water Quality Surface water quality conditions in Big Rideau Lake have been monitoredby RVCA’s Watershed Watch Program since 2005. Data from one deeppoint site (RVL-38) has been used to calculate the WQI rating for BigRideau Lake within this catchment, which was determined to be “Fair”(Table 1). Relatively few nutrient exceedances, good oxygen conditions forfish habitat, clear water and occasionally elevated pH levels contributed tothe rating. The following discussion explains how each of the monitoredwater quality parameters contributes to the lake’s water quality.
This report also considers data from two additional sites that aremonitored near the shoreline. These sites have not been included in thecalculation of the CCME WQI rating as they are not monitored with thesame frequency as deep point sites. However, they do provide importantinformation on water quality conditions in the near shore areas. Forlocations of shoreline sites please see Figure 1.
The 2009 Rideau�Lakes�Watershed�Plan stated that Big Rideau Lakewas in good ecological health but showed signs of stress resulting fromrecreational use, climate change and development pressure (RideauValley Conservation Authority, 2009). The data presented in this reportindicates that this continues to be the case and that a proactivecautionary program of best management practices is important to ensurethe protection of the lake environment.
NutrientsTotal phosphorus (TP) is used as a primary indicator of excessive nutrientloading and may contribute to abundant aquatic vegetation growth anddepleted dissolved oxygen levels. The Provincial Water Quality Objective(PWQO) is used as the TP Guideline and states that in lakes,concentrations greater than 0.020 mg/l indicate an excessive amount ofTP within the water column.
Total Kjeldahl nitrogen (TKN) is used as a secondary indicator of nutrientloading. RVCA uses a guideline of 0.500 mg/l to assess TKN1 withinsurface waters.
At the Deep PointOne deep point site is monitored within this catchment. Average nutrientconcentrations at this site is summarized in Table 3 as well as theproportion of results that meet the guideline.
Rating Index ScoreVery good (Excellent) 95-100
Good 80-94Fair 65-79
Poor (Marginal) 45-64Very poor (Poor) 0-44
Table 2 WQI Ratings (RVCA terminology, original WQI category names in brackets) andcorresponding index scores
1 No Ontario guideline for TKN is presently available; however, waters not influencedby excessive organic inputs typically range from 0.100 to 0.500 mg/l, EnvironmentCanada (1979) Water�Quality�Sourcebook,�A�Guide�to�Water�Quality�Parameters,Inland Waters Directorate, Water Quality Branch, Ottawa, Canada
The water quality ratings for this catchment range from “Poor” to “Good”(Table 1) as determined by the CCME Water Quality Index. Eachparameter is evaluated against established guidelines to determine waterquality conditions. Those parameters that frequently exceed guidelines arepresented below. There is limited data available for the majority of lakesprior to 2006 thus only 2008-2013 data is considered in this report. Table 1shows the overall rating for the monitored surface water quality sites withinthe Big Rideau-Rideau Ferry catchment and Table 2 outlines the WaterQuality Index (WQI) scores and their corresponding ratings.

Rideau Lakes Subwatershed Report 2014Big Rideau Lake – Rideau Ferry Catchment
6
Figure 2 Total phosphorus sampling results at deep point sites in Big Rideau Lake(Rideau Ferry catchment), 2008-2013
Figure 3 Total Kjeldahl nitrogen sampling results at deep point sites in Big Rideau Lake(Rideau Ferry catchment), 2008-2013
Figure 4 Average total phosphorus at deep point sites in Big Rideau Lake (Rideau Ferrycatchment), 2008-2013
Figure 5 Average total Kjeldahl nitrogen at deep point sites in Big Rideau Lake (RideauFerry catchment), 2008-2013
TP and TKN sampling results are presented in Figures 2 and 3. Themajority (95 percent) of samples analyzed for TP were less than the TPguideline and the average concentration was 0.013 mg/l (Table 3). TKNconcentrations were also minimal; all reported results were below the TKNguideline as was the average concentration at 0.299 mg/l (Table 3).Average year to year concentrations have varied for both TP and TKN(Figures 4 and 5) but do not indicate a general trend; all average resultsare below guidelines. Overall the data presented indicates that nutrientenrichment is not a significant concern at this mid-lake, deep water site onBig Rideau Lake.
Around the Lake Limited data exists for shoreline sites on Big Rideau within thiscatchment, as sites A and R2 are only monitored every fifth year. Site Ais located just upstream of the Rideau Ferry bridge while R2 is at theentrance to Coutts Bay.
Total phosphorous concentrations are below the TP guideline at both sites(Figure 6), indicating nutrient enrichment does not appear to be a problemat either location.
Total Phosphorus 2008-2013
Site Average (mg/l) Below Guideline No. Samples
RVL-38 0.013 95% 21
Total Kjeldahl Nitrogen 2008-2013
Site Average (mg/l) Below Guideline No. Samples
RVL-38 0.299 100% 21
Table 3 Summary of nutrient results for Big Rideau Lake (Rideau Ferry catchment),2008-2013

SummaryThis data indicates that waters are very clear and sufficient sunlight is ableto penetrate the water column to support aquatic life and provide sufficientvisibility for safe recreational use (i.e., boating, swimming, etc.).
Fish HabitatTwo other factors, dissolved oxygen/temperature and pH were alsoassessed to provide an overall sense of the health of Big Rideau Lake froma fish habitat perspective.
Dissolved Oxygen and TemperatureThe red bars in Figure 9 show the depths where suitable conditions exist forwarm water fish species (temperature less than 25°C and dissolved oxygengreater than 4 mg/l) at the monitored deep point. The vertical axisrepresents the total lake depth at each site where the profile is taken.Suitable oxygen temperatures exist to an average depth of 37 metres.
Optimal conditions for lake trout habitat (temperature less than 10°C anddissolved oxygen greater than 7 mg/l) are also shown by the blue points.There are typically good conditions for lake trout habitat but as temperatureswarm throughout the summer available habitat becomes more limited in theupper portions of the water column.
Rideau Lakes Subwatershed Report 2014Big Rideau Lake – Rideau Ferry Catchment
7
SummaryWithin Big Rideau Lake (Rideau Ferry catchment) nutrient concentrationsgenerally meet guidelines. TP concentrations are comparable to the 2002State�of�Rideau�Lake�Report�(Centre for Sustainable Watersheds, 2003)which noted TP typically fell between 0.01 mg/l-0.02 mg/l and TKN wasbelow 0.500 mg/l.
Efforts such as the diversion of runoff and enhanced shoreline buffers areimportant to continue to protect and enhance water quality. Given the highboat traffic just upstream of Rideau Ferry continued responsible boatingpractices are encouraged particularly in the “no wake” zone which helps toprevent erosion, and thus additional nutrient loading. All residents canhelp reduce their impact on the lake by reducing nutrient inputs throughpractices such as proper maintenance of septic systems, keepingshorelines natural and using phosphate free soaps and detergents.
Figure 6 Average total phosphorus concentration at additional monitoring sites on BigRideau Lake (Rideau Ferry catchment), 2008-2013
Figure 7 Average total Kjeldahl nitrogen concentration at additional monitoring sites onBig Rideau Lake (Rideau Ferry catchment), 2008-2013
Secchi depth 2008-2013
Site Average (m) Above Guideline No. Samples
RVL-38 7.6 100% 21
Figure 8 Recorded Secchi depths at deep point sites in Big Rideau Lake (Rideau Ferrycatchment), 2008-2013
Table 4 Summary of Secchi depths recorded at deep point sites in Big Rideau Lake(Rideau Ferry catchment), 2008-2013
Water ClarityWater clarity is measured using a Secchi disk during each deep pointsample. Table 4 summarizes the recorded depths and shows that allreadings have exceeded the minimum PWQO of 2 metres indicating goodwater clarity, the average Secchi depth is 7.6 metres Figure 8 shows that noindividual reading has been below the guideline and measured depthsrange from 4.5 metres to 11 metres It should be noted that Secchi depths inmany waterbodies have been influenced by the colonization of zebramussels resulting in clearer waters than may have been seen prior to theintroduction of this species. Zebra mussels are present in Big Rideau Lake.
TKN concentrations were also below the guideline at both sites (Figure 7).These results provide further support that nutrient enrichment is limited.Given the high level of development at both the sites it is important thatproperty owners and recreational users continue to employ methods toprotect water quality and make improvements wherever possible.

In some areas of the Rideau Lakes subwatershed, surface waters tend to bea bit more alkaline (higher pH) which can generally be attributed to geologyrather than anthropogenic activities; biological activities such asphotosynthesis may also affect pH.
SummaryOverall the water chemistry data at the deep point describes good habitatconditions for warm and cold water fish species. pH conditions are typicallywithin the range recommended for the protection of aquatic life, indicating ahealthy environment for aquatic species.
Rideau Lakes Subwatershed Report 2014Big Rideau Lake – Rideau Ferry Catchment
8
pH 2008–2013
Site Average % that meet guideline No. Samples
RVL-38 8.1 89% 18
Table 5 Summary of pH results for deep point sites in Big Rideau Lake (RideauFerry catchment)
pHpH is a basic water quality parameter used to assess the acidity of water, animportant factor for aquatic life. Figure 10 shows pH concentrations in BigRideau Lake (Rideau Ferry catchment) and Figure 11 summarizes averageconcentrations by year.
Figure 9 Depths suitable for warm water fish (red bars) and lake trout (blue points) atsite RVL-38 in Big Rideau Lake (Rideau Ferry catchment)
Figure 10 pH concentration at the deep point sites in Big Rideau Lake (Rideau Ferrycatchment), 2008-2013.
Figure 11 Average pH concentrations at the deep point sites in Big Rideau Lake (RideauFerry catchment), 2008-2013
Eighty-nine percent of samples (Table 5) were within guidelines established by the PWQO which state that pH should be between 6.5 and 8.5 to protect aquatic life and prevent irritation for anyone using thewaters for recreational purposes.

1) b. Round Lake Water Quality Surface water quality conditions for Round Lake (RVL-33) have beenmonitored by RVCA’s Watershed Watch Program since 2005. Data fromthe deep point site has been used to calculate the WQI rating for RoundLake, which was determined to be “Good” (Table 1). Low nutrientconcentrations, good conditions for fish habitat, clear water andoccasionally elevated pH levels contributed to the rating. The followingdiscussion explains how each of the monitored water quality parameterscontributes to the lake’s water quality.
This report also considers data from five additional shoreline sites that areregularly monitored around the lake. These sites have not been included inthe calculation of the CCME WQI rating as they are not monitored with thesame frequency as deep point sites. However, they do provide importantinformation on water quality conditions in the near shore areas. Forlocations of shoreline sites please see Figure 1.
NutrientsTotal phosphorus (TP) is used as a primary indicator of excessive nutrientloading and may contribute to abundant aquatic vegetation growth anddepleted dissolved oxygen levels. The Provincial Water Quality Objective(PWQO) is used as the TP Guideline and states that in lakes,concentrations greater than 0.020 mg/l indicate an excessive amount ofTP within the water column.
Total Kjeldahl nitrogen (TKN) is used as a secondary indicator of nutrientloading. RVCA uses a guideline of 0.500 mg/l to assess TKN3 within surfacewaters.
At the Deep PointsOne deep point site is monitored within this lake. Average nutrientconcentrations are summarized in Table 7 as well as the proportion ofresults that meet the guideline.
Rideau Lakes Subwatershed Report 2014Big Rideau Lake – Rideau Ferry Catchment
9
Figure 12 Geometric mean of shoreline sites monitored on Big Rideau Lake (RideauFerry catchment), 2008-2013
E. coliE.�coli�is sampled at monitored shoreline sites twice each sampling seasondata. E.�coli was not used in the calculations of the WQI rating for the lakedue to differences in sampling frequency and site locations. All sampleswere below the E.�coli guideline of 100 colony forming units (CFU) per 100 ml set by the PWQO; across the lake the count at the geometric mean2
was only 4 CFU/100ml (Table 6). Figure 12 shows that samples across allsites were well below the guideline.
E. coli 2008–2013
SiteGeometric mean
(CFU/100ml)Below Guideline No. Samples
RVL-38 4 100% 4
Table 6 Summary of E. coli results for Big Rideau Lake (Rideau Ferry catchment), 2008-2013
SummaryThe results indicate that bacterial contamination is not a significant concernin Big Rideau Lake and the water should be safe for recreational use suchas swimming and boating.
2 A type of mean or average, which indicates the central tendency or typical value of a set of numbers by using the product of their values (as opposed to the arithmetic meanwhich uses their sum). It is often used to summarize a variable that varies over several orders of magnitude, such as E.�coli�counts
3 No Ontario guideline for TKN is presently available; however, waters not influenced by excessive organic inputs typically range from 0.100 to 0.500 mg/l, EnvironmentCanada (1979) Water�Quality�Sourcebook,�A�Guide�to�Water�Quality�Parameters, Inland Waters Directorate, Water Quality Branch, Ottawa, Canada
Total Phosphorus 2008–2013
Site Average (mg/l) Below Guideline No. Samples
RVL-33 0.009 100% 24
Total Kjeldahl Nitrogen 2008-2013
Site Average (mg/l) Below Guideline No. Samples
RVL-33 0.308 100% 24
Table 7 Summary of nutrient results for Round Lake, 2008-2013
TP and TKN sampling results are presented in Figures 13 and 14. Allsamples analyzed for TP were less than the TP guideline and the averageconcentration was 0.009 mg/l (Table 7). TKN concentrations were low aswell with all results below the TKN guideline, and an average concentrationof 0.308 mg/l (Table 7). Average year to year concentrations have varied forboth TP and TKN but are continually below their respective guidelines(Figure 15 and 16). Overall, the data presented indicates that elevatednutrients concentrations are not a problem in Round Lake.

Rideau Lakes Subwatershed Report 2014Big Rideau Lake – Rideau Ferry Catchment
10
Figure 17 Average total phosphorus concentration at shoreline monitoring sites on RoundLake, 2008-2013
Figure 18 Average total Kjeldahl nitrogen concentration at shoreline monitoring sites onRound Lake, 2008-2013
Figure 15 Average total phosphorus at the deep point in Round Lake, 2008-2013
Figure 16 Average total Kjeldahl nitrogen at the deep point in Round Lake, 2008-2013
Around the LakeThe average nutrient concentrations at monitored sites around the lake varyfrom year to year (Figures 17 and 18). Please note that sites A and B aremonitored each year while other sites are monitored every fifth year.
Figure 13 Total phosphorus sampling results at the deep point in Round Lake, 2008-2013
Figure 14 Total Kjeldahl nitrogen sampling results at the deep point in Round Lake,2008-2013
Total phosphorous concentrations were below the TP guideline at all sites.TKN concentrations were below the guideline at the majority of shorelinesites with the exception of site A in 2013. It is possible that elevatedconcentrations are due to inflow from the adjacent wetland. Wetlandsystems have nutrient rich soils that hold high concentrations of organicnitrogen; during periods of high flows this may result in higherconcentrations at the outflow into the lake.

11
Rideau Lakes Subwatershed Report 2014
Big Rideau Lake – Rideau Ferry Catchment
Figure 19 Recorded Secchi depths at the deep point in Round Lake, 2008-2013
Figure 20 Depths suitable for warm water fish species at the deep point in Round Lake,2008-2013
SummaryThere is little development around the lake and what does exist is isolatedto the north east shoreline. The actions of current property owners and lakeusers to minimize nutrient inputs will continue to protect water quality. Agingof the lake can be slowed with the help of all catchment residents byreducing nutrient inputs through practices such as proper maintenance ofseptic systems, keeping shorelines natural, minimizing runoff and usingphosphate free soaps and detergents.
Water ClarityWater clarity is measured using a Secchi disk during each deep pointsample. Table 8 summarizes the recorded depths and shows that allreadings have exceeded the minimum PWQO of 2 metres indicating goodwater clarity; the average Secchi depth is 5.1 metres . Figure 19 shows thatno individual reading has been below the guideline and measured depthsrange from 3 metres to 7 metres. In many cases around the watershedwater clarity has been influenced by the colonization of zebra mussels;however at this time there is no evidence of an established population inRound Lake.
SummaryThis data indicates that waters are clear and adequate sunlight is able topenetrate the water column to support aquatic life and provide sufficientvisibility for safe recreational use (i.e., boating, swimming).
Fish HabitatTwo other factors, dissolved oxygen/temperature and pH were alsoassessed to provide an overall sense of the health of Round Lake from afish habitat perspective.
Dissolved Oxygen and TemperatureThe red bars in Figure 20 show the depths where suitable conditions existfor warm water fish species (temperature less than 25°C and dissolvedoxygen greater than 4 mg/l) at the monitored point. The vertical axisrepresents the total lake depth at each site where the profile is taken.Suitable oxygen temperatures exist over an average depth of 14 metres.
Secchi depth 2008-2013
Site Average (m) Above Guideline No. Samples
RVL-33 5.1 100% 22
Table 8 Summary of Secchi depths recorded at the deep point in Round Lake, 2008-2013
There is some evidence of a reduction of suitable habitat conditions in thelate summer-early fall due to warming of surface waters and limited oxygenavailability in the deep waters habitat in the late summer-early fall. This ishighlighted in 2011 and 2013 (Figure 20).
pHpH is a basic water quality parameter used to assess the acidity of water, animportant factor for aquatic life. Figure 21 shows pH concentrations inRound Lake and Figure 22 summarizes average concentrations by year.
Fifty-eight percent of samples (Table 9) were within guidelines establishedby the PWQO which state that pH should be between 6.5 and 8.5 to protect aquatic life and prevent irritation for anyone using the waters forrecreational purposes.
Figure 21 pH concentrations at the deep point in Round Lake, 2008-2013

Rideau Lakes Subwatershed Report 2014Big Rideau Lake – Rideau Ferry Catchment
12
Figure 22 Average pH concentrations at the deep point in Round Lake, 2008-2013 Figure 23 Geometric mean of shoreline sites monitored on Round Lake, 2008-2013
In some areas of the Rideau Lakes watershed, surface waters tend to be abit more alkaline (higher pH) which can generally be attributed to geologyrather than anthropogenic activities; biological activities such asphotosynthesis may also affect pH. This is observed in Round Lake asresults tend to border on or exceed the upper end of the guideline.
SummaryOverall the water chemistry data at the deep point describes good habitatconditions for warm water fish species such as pickerel, bass and pike. Thewarming of the water column in summer months may limit the amount ofhabitat available and cause stress to some aquatic communities. pHconditions are usually within the range recommended for the protection ofaquatic life, indicating a healthy environment for aquatic species.
E. coliE.�coli�is sampled at monitored shoreline sites twice each sampling season.E.�coli�data was not used in the calculations of the WQI rating for the lakedue to differences in sampling frequency and site locations. Almost allsamples (95 percent) were below the E.�coli�guideline of 100 colony formingunits (CFU) per 100 ml set by the PWQO; across the lake the count at thegeometric mean4 was only 5 CFU/100ml (Table 10). Figure 23 shows thatsamples across all sites were well below the guideline.
Table 10 Summary of E.�coli results for Round Lake, 2008-2013
SummaryThe results presented above provide evidence that bacterial contaminationis not a significant concern in Round Lake and the water should be safe forrecreational use such as swimming and boating activities.
1) c. Loon Lake Water Quality Surface water quality conditions in Loon Lake (RVL-34) have beenmonitored by RVCA’s Watershed Watch Program since 2005. Data fromthe deep point site has been used to calculate the WQI rating for LoonLake, which was determined to be “Poor” (Table 1). Elevated nutrientconcentrations, periods of reduced oxygen availability, clear water andoccasionally elevated pH levels contributed to the rating. The followingdiscussion explains how each of the monitored water quality parameterscontributes to the lake’s water quality.
This report also considers data from three additional shoreline sites that areregularly monitored around the lake. These sites have not been included inthe calculation of the CCME WQI rating as they are not monitored with thesame frequency as deep point sites. However, they do provide importantinformation on water quality conditions in the near shore areas. Forlocations of shoreline sites please see Figure 1.
NutrientsTotal phosphorus (TP) is used as a primary indicator of excessive nutrientloading and may contribute to abundant aquatic vegetation growth anddepleted dissolved oxygen levels. The Provincial Water Quality Objective(PWQO) is used as the TP Guideline and states that in lakes,concentrations greater than 0.020 mg/l indicate an excessive amount of TPwithin the water column.
Total Kjeldahl nitrogen (TKN) is used as a secondary indicator of nutrientloading. RVCA uses a guideline of 0.500 mg/l to assess TKN5 withinsurface waters.
pH 2008-2013
Site Average Within Guidelines No. Samples
RVL-33 8.2 58% 19
E. coli 2008-2013
SiteGeometric mean
(CFU/100ml)Below Guidelines No. Samples
RVL-33 5 95% 22
Table 9 Summary of pH results for the deep point in Round Lake
4 A type of mean or average, which indicates the central tendency or typical value of a set of numbers by using the product of their values (as opposed to the arithmetic mean)5 No Ontario guideline for TKN is presently available; however, waters not influenced by excessive organic inputs typically range from 0.100 to 0.500 mg/l, EnvironmentCanada (1979) Water�Quality�Sourcebook,�A�Guide�to�Water�Quality�Parameters, Inland Waters Directorate, Water Quality Branch, Ottawa, Canada

Rideau Lakes Subwatershed Report 2014Big Rideau Lake – Rideau Ferry Catchment
13
At the Deep PointsAverage nutrient concentrations at the deep point are summarized in Table11 as well as the proportion of results that meet the guideline.
Around the Lake The average nutrient concentrations at monitored sites around the lakevary from year to year (Figures 28 and 29). Please note that site A ismonitored each year while site B and C are monitored every fifth year.
Total phosphorous concentrations were elevated at site A more than oneyear; data is only available from sites B and C in 2010. As site B is locatedat the outflow of some large wetlands, it may be expected to have highnutrient concentrations; site C is well below the guideline.
Table 11 Summary of nutrient results for Loon Lake, 2008-2013
Total Phosphorus 2008-2013
Site Average (mg/l) Below Guideline No. Samples
RVL-34 0.014 86% 21
Total Kjeldahl Nitrogen 2008-2013
Site Average (mg/l) Below Guideline No. Samples
RVL-34 0.014 57% 21
Figure 24 Total phosphorus sampling results at the deep point in Loon Lake, 2008-2013
Figure 25 Total Kjeldahl nitrogen sampling results at the deep point in Loon Lake, 2008-2013
Figure 26 26 Average total phosphorus at the deep point in Loon Lake, 2008-2013
Figure 27 Average total Kjeldahl nitrogen at the deep point in Loon Lake, 2008-2013
TP and TKN sampling results are presented in Figures 24 and 25. Eighty-sixpercent of samples analyzed for TP were less than the TP guideline and theaverage concentration was 0.014 mg/l (Table 11). TKN concentrations weremore frequently elevated; 57 percent of results were below the TKNguideline and the average concentration at 0.515 mg/l (Table 11). Averageyear to year concentrations have varied for both TP and TKN (Figure 26 and27). Overall, the data presented indicates moderate TP concentrations,while TKN often exceeds the guideline.

Rideau Lakes Subwatershed Report 2014
Big Rideau Lake – Rideau Ferry Catchment
14
Figure 28 Average total phosphorus concentration at shoreline monitoring sites on LoonLake, 2008-2013
TKN concentrations largely mirrored TP concentrations, although theywere more likely to exceed the TKN guideline. These results providefurther evidence that nutrient loading may be occurring at site A resultingin abundant plant or algal growth and low oxygen levels, particularly asboth TP and TKN are persistently elevated at this site on the lake.
Figure 29 Average total Kjeldahl nitrogen concentration at shoreline monitoring sites onLoon Lake, 2008-2013
SummaryWithin Loon Lake (RVL-34) nutrient concentrations generally meetguidelines. Sites with particularly high results are likely due to naturalinfluences given the limited development around this lake. Nutrientexceedances may be partially attributed to the natural aging of a lake andbasin characteristics; the lake is shallow and composed of portions ofdrowned land with rich organic soils that hold high levels of phosphorus.The shallow basin and organic rich soils make internal loading of nutrientslikely; likewise the surrounding wetlands that drain into the lake further actas nutrient sources. Aging of the lake can be slowed with the help of allcatchment users by reducing nutrient inputs through practices such asproper maintenance of septic systems, minimizing runoff, keepingshorelines natural and using phosphate free soaps and detergents.
Water ClarityWater clarity is measured using a Secchi disk during each deep pointsample. Table 12 summarizes the recorded depths and shows that allreadings have exceeded the minimum PWQO of 2 metres indicating goodwater clarity with an average Secchi depth of 4.9 metres. Figure 30 showsthat no individual reading has been below the guideline and measureddepths range from 3 metres to 7.5 metres. It should also be noted thatSecchi depths in many waterbodies have been influenced by thecolonization of zebra mussels resulting in clearer waters than may havebeen seen prior to the introduction of this species.
Secchi depth 2008-2013
Site Average (m) Above Guideline No. Samples
RVL-34 4.9 100% 22
Table 12 Summary of Secchi depths recorded at the deep point in Loon Lake, 2008-2013
Figure 30 Recorded Secchi depths at the deep point in Loon Lake, 2008-2013
SummaryThis data indicates that waters are clear and adequate sunlight is able topenetrate the water column to support aquatic life and provide sufficientvisibility for safe recreational use (i.e., boating, swimming).
Fish Habitat Two other factors, dissolved oxygen/temperature and pH were alsoassessed to provide an overall sense of the health of Loon Lake from afish habitat perspective.
Dissolved Oxygen and TemperatureThe red bars in Figure 31 show the depths where suitable conditions existfor warm water fish species (temperature less than 25°C and dissolvedoxygen greater than 4 mg/l) at the monitored deep points. The vertical axisrepresents the total lake depth at each site where the profile is taken.Suitable oxygen and temperatures exist to an average depth of 7 metres(Figure 32).
Mid-summer high temperatures in the upper portion of the water columnand limited oxygen availability in the deep water greatly limits the habitatavailable in some years; this is most pronounced in 2011, 2012 and 2013(Figure 31).

Rideau Lakes Subwatershed Report 2014Big Rideau Lake – Rideau Ferry Catchment
15
pHpH is a basic water quality parameter used to assess the acidity of water,an important factor for aquatic life. Figure 32 shows pH concentrations inLoon Lake and Figure 33 summarizes average concentrations by year.
Figure 31 Depths suitable for warm water fish species in Loon Lake, 2008-2013
Figure 32 pH concentrations at the deep point in Loon Lake, 2008-2013
Figure 33 Average pH concentrations at the deep point in Loon Lake, 2008-2013
Eighty-nine percent of samples (Table 13) were within guidelinesestablished by the PWQO which state that pH should be between 6.5 and8.5 to protect aquatic life and prevent irritation for anyone using the watersfor recreational purposes.
pH 2008-2013
Site Average (m) Within Guideline No. Samples
RVL-34 8.1 89% 19
Table 13 Summary of Secchi depths recorded at the deep point in Loon Lake, 2008-2013
In some areas of the Rideau Lakes subwatershed surface waters tend tobe a bit more alkaline (higher pH), which can generally be attributed togeology rather than anthropogenic activities; biological activities such asphotosynthesis may also affect pH. This appears to be the case in LoonLake as results tend to be more to the upper end of the guideline.
SummaryOverall the water chemistry data at the deep points describes generallysuitable conditions for warm water fish species such as pickerel, bass andpike. The data shows that the warming of the water column in summermonths limits the amount of habitat available and may cause stress tosome aquatic communities. pH conditions are typically within the rangerecommended for the protection of aquatic life, indicating a healthyenvironment for aquatic species.
E. coliE.�coli is sampled at monitored shoreline sites twice each samplingseason. E.�coli data was not used in the calculations of the WQI rating forthe lake due to differences in sampling frequency and site locations. Themajority of samples (93 percent) were below the E.�coli�guideline of 100colony forming units (CFU) per 100 ml set by the PWQO; across the lake,the count at the geometric mean6 was only 8 CFU/100ml (Table 14).Figure 34 summarizes the results from samples across all sites and showsthe geometric mean was well below the guideline.
E. coli 2008-2013
SiteGeometric mean
(CFU/100ml)Below Guideline No. Samples
RVL-34 8 93% 15
Table 14 Summary of E. coli results for Loon Lake, 2008-2013
SummaryThe results presented above provide evidence that bacterial contaminationis not a significant concern in Loon Lake and the water should be safe forrecreational use such as swimming and boating activities.
6 A type of mean or average, which indicates the central tendency or typical value of aset of numbers by using the product of their values (as opposed to the arithmeticmean which uses their sum). It is often used to summarize a variable that varies overseveral orders of magnitude, such as E.�coli�counts

Rideau Lakes Subwatershed Report 2014Big Rideau Lake – Rideau Ferry Catchment
16
Figure 34 Geometric mean of shoreline sites monitored on Loon Lake, 2008-2013
1) d. Long Lake Water Quality Surface water quality conditions in Long Lake (RVL-13) have beenmonitored by RVCA’s Watershed Watch Program since 2002. Data fromone deep point site has been used to calculate the WQI rating which wasdetermined to be “Poor” (Table 1). Occasional nutrient exceedances,generally good oxygen conditions for fish habitat, clear water andoccasionally elevated pH levels contributed to the rating. The followingdiscussion explains how each of the monitored water quality parameterscontributes to the lake’s water quality.
This report also considers data from 7 additional sites that are monitoredaround the lake. These sites have not been included in the calculation ofthe CCME WQI rating as they are not monitored with the same frequencyas deep point sites. However, they do provide important information onwater quality conditions in the near shore areas. For locations of shorelinesites please see Figure 1.
The 2002�Long�Lake�State�of�the�Lake�Environment�Report�(Rideau ValleyConservation Authority, 2003) noted that Long Lake had a moderateconcentration of nutrients and suitable fish habitat was available based onoxygen and temperature data. The data presented in this report indicatesthat this continues to be the case and that a proactive cautionary programof best management practices is important to ensure the protection of thelake environment.
NutrientsTotal phosphorus (TP) is used as a primary indicator of excessive nutrientloading and may contribute to abundant aquatic vegetation growth anddepleted dissolved oxygen levels. The Provincial Water Quality Objective(PWQO) is used as the TP Guideline and states that in lakes,concentrations greater than 0.020 mg/l indicate an excessive amount ofTP within the water column.
Total Kjeldahl nitrogen (TKN) is used as a secondary indicator of nutrientloading. RVCA uses a guideline of 0.500 mg/l to assess TKN7 withinsurface waters.
7 No Ontario guideline for TKN is presently available; however, waters not influencedby excessive organic inputs typically range from 0.100 to 0.500 mg/l, EnvironmentCanada (1979) Water�Quality�Sourcebook,�A�Guide�to�Water�Quality�Parameters,Inland Waters Directorate, Water Quality Branch, Ottawa, Canada
At the Deep PointOne deep point site is monitored on the lake. Average nutrientconcentrations at this site are summarized in Table 15 as well as theproportion of results that meet the guideline.
Table 15 Summary of nutrient results for Long Lake, 2008-2013
Total Phosphorus 2008-2013
Site Average (mg/l) Below Guideline No. Samples
RVL-13 0.015 81% 26
Total Kjeldahl Nitrogen 2008-2013
Site Average (mg/l) Below Guideline No. Samples
RVL-13 0.390 88% 26
TP and TKN sampling results are presented in Figures 35 and 36. Themajority (81 percent) of samples analyzed for TP were less than the TPguideline and the average concentration was 0.015 mg/l (Table 15). TKNconcentrations were fairly minimal; 88 percent of reported results werebelow the TKN guideline as was the average concentration at 0.390 mg/l(Table 15). Average year to year concentrations have varied for both TPand TKN (Figure 37 and 38) but do not indicate a general trend; allaverage results are below guidelines. Overall the data presented indicatesthat nutrient concentrations may be considered moderate in the mid-lake,deep water sites of Long Lake.
Figure 35 Total phosphorus sampling results at the deep point site in Long Lake, 2008-2013
Figure 36 Total Kjeldahl nitrogen sampling results at the deep point site in LongLake, 2008-2013

Rideau Lakes Subwatershed Report 2014Big Rideau Lake – Rideau Ferry Catchment
17
Figure 37 Average total phosphorus at the deep point site in Long Lake, 2008-2013
Figure 38 Average total Kjeldahl nitrogen at the deep point site in Long Lake, 2008-2013
Around the LakeThe average nutrient concentrations at monitored sites around the lakevary from year to year (Figures 39 and 40). Please note that sites A, E,and F are monitored each year while other sites (B, C, D, and G) aremonitored every fifth year.
Average total phosphorous concentrations are below the TP guideline atall sites (Figure 39), indicating nutrient enrichment does not appear to be aproblem in the monitored near shore areas.
Figure 39 Average total phosphorus concentration at additional monitoring sites onLong Lake, 2008-2013
SummaryWithin Long Lake nutrient concentrations generally meet guidelines.Average TP concentrations (Table 15) are comparable to the 2002�LongLake�State�of�the�Lake�Environment�Report (RVCA, 2003) which reportedTP concentrations of 0.014 mg/l (2002) and 0.012 mg/l (2003).
Efforts such as the diversion of runoff and enhanced shoreline buffers areimportant to continue to protect and enhance water quality, and reduce thefrequency of nutrient exceedances. Nutrient exceedances may be partiallyattributed to the natural aging of a lake and basin characteristics. The lakeis fairly shallow; the shallow basin and organic rich soils make internalloading of nutrients likely as oxygen becomes depleted from the deepwaters. All residents can help reduce their impact on the lake byminimizing nutrient inputs through practices such as proper maintenanceof septic systems, keeping shorelines natural and using phosphate freesoaps and detergents.
Water ClarityWater clarity is measured using a Secchi disk during each deep pointsample. Table 16 summarizes the recorded depths and shows that allreadings have exceeded the minimum PWQO of 2 metres indicating goodwater clarity, the average Secchi depth is 6.1 metres. Figure 41 shows thatno individual reading has been below the guideline and measured depthsrange from 3 metres to 10.5 metres. It should be noted that Secchi depthsin many waterbodies have been influenced by the colonization of zebramussels resulting in clearer waters than may have been seen prior to theintroduction of this species.
Secchi depth 2008-2013
Site Average (m) Above Guideline No. Samples
RVL-13 6.1 100% 25
Table 16 Summary of Secchi depths recorded at the deep poin site in Long Lake, 2008-2013
TKN concentrations were also below the guideline at all sites (Figure 40).These results provide further support that nutrient enrichment is limitedalong the shoreline.
Figure 40 Average total Kjeldahl nitrogen concentration at additional monitoring sites onLong Lake, 2008-2013

Rideau Lakes Subwatershed Report 2014Big Rideau Lake – Rideau Ferry Catchment
18
Figure 41 Recorded Secchi depths at the deep point site in Long Lake, 2008-2013
Figure 42 Depths suitable for warm water fish at the deep point in Long Lake, 2008-2013
SummaryThis data indicates that waters are very clear and sufficient sunlight is ableto penetrate the water column to support aquatic life and provide sufficientvisibility for safe recreational use (i.e., boating, swimming). The 2002�LongLake�State�of�the�Lake�Environment�Report�noted Secchi depths between3 and 4.9 metres; the increase in water clarity is likely attributed to zebramussels which are known to be in the lake.
Fish HabitatTwo other factors, dissolved oxygen/temperature and pH were alsoassessed to provide an overall sense of the health of Long Lake from afish habitat perspective.
Dissolved Oxygen and TemperatureThe red bars in Figure 42 show the depths where suitable conditions existfor warm water fish species (temperature less than 25°C and dissolvedoxygen greater than 4 mg/l) at the monitored deep point. The vertical axisrepresents the total lake depth at each site where the profile is taken.Suitable oxygen temperatures exist to an average depth of 9 metres.
There are typically good conditions for fish habitat, but as temperatures warmthroughout the summer, available habitat becomes very limited in some years(i.e., 2009, 2011 and 2012) and may put stress on sensitive species.
pHpH is a basic water quality parameter used to assess the acidity of water,an important factor for aquatic life. Figure 43 shows pH concentrations inLong Lake and Figure 44 summarizes average concentrations by year.
Figure 43 pH concentration at the deep point site in Long Lake, 2008-2013
Figure 44 Average pH concentration at the deep point site in Long Lake, 2008-2013
Seventy percent of samples (Table 17) were within guidelines establishedby the PWQO which state that pH should be between 6.5 and 8.5 toprotect aquatic life and prevent irritation for anyone using the waters forrecreational purposes. Average results border on the upper limit of theguideline indicating that elevated pH is a feature of this lake.
pH 2008-2013
Site Average Below Guideline No. Samples
RVL-13 8.4 70% 20
Table 17 Summary of pH results at the deep point site in Long Lake, 2008-2013
In some areas of the Rideau Lakes subwatershed, surface waters tend tobe a bit more alkaline (higher pH) which can generally be attributed togeology rather than anthropogenic activities; biological activities such asphotosynthesis may also affect pH.

1) e. Adam Lake Water QualitySurface water quality conditions in Adam Lake (RVL-32) have beenmonitored by RVCA’s Watershed Watch Program since 2005. Data fromone deep point site has been used to calculate the WQI rating for AdamLake, which was determined to be “Poor” (Table 1). Few nutrientexceedances, periods of limited oxygen conditions for fish habitat, clearwater and occasionally elevated pH levels contributed to the rating. Thefollowing discussion explains how each of the monitored water qualityparameters contributes to the lake’s water quality.
This report also considers data from 7 additional sites that are monitoredaround the lake. These sites have not been included in the calculation ofthe CCME WQI rating as they are not monitored with the same frequencyas deep point sites. However, they do provide important information onwater quality conditions in the near shore areas. For locations of shorelinesites please see Figure 1.
The 2005�Adam�Lake�State�of�the�Lake�Environment�Report (RVCA,2006) stated that Adam Lake had a moderate concentration of nutrientsand limited oxygen availability throughout the summer. The 2009�RideauLakes�Watershed�Plan (RVCA, 2009) stated that nutrient concentrationsdid not show a declining trend. The data presented in this report providesevidence that this continues to be the case and that a proactive cautionaryprogram of best management practices is important to ensure theprotection of the lake environment.
NutrientsTotal phosphorus (TP) is used as a primary indicator of excessive nutrientloading and may contribute to abundant aquatic vegetation growth anddepleted dissolved oxygen levels. The Provincial Water Quality Objective(PWQO) is used as the TP Guideline and states that in lakes,concentrations greater than 0.020 mg/l indicate an excessive amount ofTP within the water column.
Total Kjeldahl nitrogen (TKN) is used as a secondary indicator of nutrientloading. RVCA uses a guideline of 0.500 mg/l to assess TKN9 withinsurface waters.
At the Deep PointOne deep point site is monitored on the lake. The average nutrientconcentration at this site is summarized in Table 19 as well as theproportion of results that meet the guideline.
SummaryOverall the water chemistry data at the deep point describes suitable habitatconditions for warm water fish species. There is some evidence that thewarming of the water column in the mid-summer may limit the amount ofhabitat for some sensitive species. pH conditions are typically on the upperend of the range recommended for the protection of aquatic life. Overall, thedata indicates a healthy environment for aquatic species.
E. coliE.�coli�is sampled at monitored shoreline sites twice each samplingseason. E.�coli data was not used in the calculations of the WQI rating forthe lake due to differences in sampling frequency and site locations. Allsamples were below the E.�coli�guideline of 100 colony forming units(CFU) per 100 ml set by the PWQO; across the lake the count at thegeometric mean8 was only 3 CFU/100ml (Table 18). Figure 45 shows thatsamples across all sites were well below the guideline.
Rideau Lakes Subwatershed Report 2014Big Rideau Lake – Rideau Ferry Catchment
19
E. coli 2008-2013
SiteGeometric mean
(CFU/100ml)Below Guideline No. Samples
RVL-13 3 100% 41
Table 18 Summary of E. coli results for Long Lake, 2008-2013
SummaryThe results presented above provide evidence that bacterial contamination isnot a significant concern in Long Lake and the water should be safe forrecreational use such as swimming and boating activities.
8 A type of mean or average, which indicates the central tendency or typical value of a set of numbers by using the product of their values (as opposed to the arithmetic meanwhich uses their sum). It is often used to summarize a variable that varies over several orders of magnitude, such as E.�coli�counts
9 No Ontario guideline for TKN is presently available; however, waters not influenced by excessive organic inputs typically range from 0.100 to 0.500 mg/l, EnvironmentCanada (1979) Water�Quality�Sourcebook,�A�Guide�to�Water�Quality�Parameters, Inland Waters Directorate, Water Quality Branch, Ottawa, Canada
Figure 45 Geometric mean of shoreline sites monitored on Long Lake, 2008-2013
Table 19 Summary of nutrient results for Adam Lake, 2008-2013
Total Phosphorus 2008-2013
Site Average (mg/l) Below Guideline No. Samples
RVL-32 0.013 86% 22
Total Kjeldahl Nitrogen 2008-2013
Site Average (mg/l) Below Guideline No. Samples
RVL-32 0.381 95% 22

Rideau Lakes Subwatershed Report 2014Big Rideau Lake – Rideau Ferry Catchment
20
TP and TKN sampling results are presented in Figures 46 and 47. The majority(86 percent) of samples analyzed for TP were less than the TP guideline andthe average concentration was 0.013 mg/l (Table 19). TKN concentrationswere fairly minimal; 95 percent of reported results were below the TKNguideline as was the average concentration at 0.381 mg/l (Table 19). Averageyear to year concentrations have varied for both TP and TKN (Figure 48 and 49) but do not indicate a general trend; all average results are belowguidelines. Overall the data presented indicates that moderate nutrient levelscharacterize the mid-lake, deep water sites of Adam Lake.
Figure 46 Total phosphorus sampling results at the deep point site in Adam Lake, 2008-2013
Figure 47 Total Kjeldahl nitrogen sampling results at the deep point site in Adam Lake,2008-2013
Figure 48 Average total phosphorus at the deep point site in Adam Lake, 2008-2013
Figure 49 Average total Kjeldahl nitrogen at the deep point site in Adam Lake, 2008-2013
Around the Lake The average nutrient concentrations at monitored sites around the lake varyfrom year to year (Figures 50 and 51). Please note that sites A, C, and E aremonitored each year while other sites (B, D, E, F and G) are monitored everyfifth year.
Average total phosphorous concentrations are below the TP guideline at allsites (Figure 50), indicating nutrient enrichment does not appear to be aproblem in the monitored near shore areas.
Figure 50 Average total phosphorus concentration at additional monitoring sites onAdam Lake, 2008-2013
Figure 51 Average total Kjeldahl nitrogen concentration at additional monitoring siteson Adam Lake, 2008-2013

SummaryThis data indicates that waters are very clear and sufficient sunlight is able topenetrate the water column to support aquatic life and provide sufficientvisibility for safe recreational use (i.e., boating, swimming). There is evidenceof an increase in Secchi depth possibly due to zebra mussels which have beennoted in Adam Lake.
Fish HabitatTwo other factors, dissolved oxygen/temperature and pH were also assessed to provide an overall sense of the health of Adam Lake from a fish habitat perspective.
Dissolved Oxygen and TemperatureThe red bars in Figure 53 show the depths where suitable conditions exist forwarm water fish species (temperature less than 25°C and dissolved oxygengreater than 4 mg/l) at the monitored deep point. The vertical axis representsthe total lake depth at each site where the profile is taken. Suitable oxygentemperatures exist to an average depth of 8 metres.
There is typically very limited fish habitat available in the summer months;more suitable conditions are observed in the spring and fall.
TKN concentrations were also below the guideline at all sites (Figure 51).These results provide further support that nutrient enrichment is limited alongthe shoreline.
SummaryWithin Adam Lake nutrient concentrations generally meet guidelines. AverageTP concentrations (Table 19) are comparable to the 2005 results which rangedfrom 0.011 mg/l to 0.015 mg/l.
Efforts such as the diversion of runoff and enhanced shoreline buffers areimportant to continue to protect and enhance water quality. Nutrientconcentrations are also affected by the natural aging of a lake and basincharacteristics; the lake is shallow and composed of portions of drowned landwith rich organic soils that contain high levels of nutrients. The shallow basinand organic rich soils make loading of nutrients likely. All residents can helpreduce their impact on the lake by reducing nutrient inputs through practicessuch as proper maintenance of septic systems, keeping shorelines natural andusing phosphate free soaps and detergents.
Water ClarityWater clarity is measured using a Secchi disk during each deep point sample.Table 20 summarizes the recorded depths and shows that all readings haveexceeded the minimum PWQO of 2 metres indicating good water clarity; theaverage Secchi depth is 4.9 metres. Figure 52 shows that no individualreading has been below the guideline and measured depths range from 3.8metres to 6.0 metres. It should be noted that Secchi depths in manywaterbodies have been influenced by the colonization of zebra musselsresulting in clearer waters than may have been seen prior to the introduction ofthis species. The 2005�Adam�Lake�State�of�the�Lake�Environment�Reportreported the average Secchi depth to be 3.6 metres.
Rideau Lakes Subwatershed Report 2014Big Rideau Lake – Rideau Ferry Catchment
21
Secchi depth 2008-2013
Site Average Above Guideline No. Samples
RVL-32 4.9 100% 21
Table 20 Summary of Secchi depths recorded at deep point in Adam Lake, 2008-2013
Figure 52 Recorded Secchi depths at the deep point site in Adam Lake, 2008-2013
Figure 53 Depths suitable for warm water fish at the deep point in Adam Lake, 2008-2013

Rideau Lakes Subwatershed Report 2014Big Rideau Lake – Rideau Ferry Catchment
22
Figure 55 Average pH concentrations at the deep point site in Adam Lake, 2008-2013
Figure 54 pH concentration at the deep point site in Adam Lake, 2008-2013
pHpH is a basic water quality parameter used to assess the acidity of water, animportant factor for aquatic life. Figure 54 shows pH concentrations in AdamLake and Figure 55 summarizes average concentrations by year.
Sixty-five percent of samples (Table 21) were within guidelines established bythe PWQO which state that pH should be between 6.5 and 8.5 to protectaquatic life and prevent irritation for anyone using the waters for recreationalpurposes. Average results border on the upper limit of the guideline indicatingthat elevated pH is a feature of this lake.
pH 2008-2013
Site Average Within Guideline No. Samples
RVL-32 8.3 65% 17
Table 21 Summary of pH results for the deep point site in Adam Lake, 2008-2013
Table 22 Summary of E. coli results for Adam Lake, from 2008-2013
In some areas of the Rideau Lakes subwatershed, surface waters tend to be abit more alkaline (higher pH) which can generally be attributed to geologyrather than anthropogenic activities; biological activities such asphotosynthesis may also affect pH.
E. coli 2008-2013
SiteGeometric mean
(CFU/100ml)Below Guideline No. Samples
RVL-32 2 100% 39
SummaryOverall the water chemistry data at the deep point describes suitable habitatconditions for warm water fish species in the spring and fall. There is evidencethat the warming of the upper portion of the water column and oxygendepletion in the deep waters in the summer (2010, 2011 and 2012) may limitthe amount of habitat and put stress on sensitive species. pH conditions aretypically on the upper end of the range recommended for the protection ofaquatic life.
E. coliE.�coli�is sampled at monitored shoreline sites twice each sampling season. E.�coli�data was not used in the calculations of the WQI rating for the lake dueto differences in sampling frequency and site locations. All samples were belowthe E.�coli�guideline of 100 colony forming units (CFU) per 100 ml set by thePWQO; across the lake the count at the geometric mean10 was only 2 CFU/100ml (Table 22). Figure 56 shows that samples across all sites werewell below the guideline.
10 A type of mean or average, which indicates the central tendency or typical value of a set of numbers by using the product of their values (as opposed to the arithmetic meanwhich uses their sum). It is often used to summarize a variable that varies over several orders of magnitude, such as E.�coli�counts
Figure 56 Geometric mean of shoreline sites monitored on Adam Lake, 2008-2013
SummaryThe results presented above provide evidence that bacterial contamination isnot a significant concern in Adam Lake and the water should be safe forrecreational use such as swimming and boating activities.

Rideau Lakes Subwatershed Report 2014Big Rideau Lake – Rideau Ferry Catchment
23
Shoreline Buffer Land Cover EvalutationThe riparian or shoreline zone is that special area where the land meetsthe water. Well-vegetated shorelines are critically important in protectingwater quality and creating healthy aquatic habitats, lakes and rivers.Natural shorelines intercept sediments and contaminants that couldimpact water quality conditions and harm fish habitat in streams. Wellestablished buffers protect the banks against erosion, improve habitat forfish by shading and cooling the water and provide protection for birds andother wildlife that feed and rear young near water. A recommended target(from Environment Canada’s Guideline: How�Much�Habitat�is�Enough?) isto maintain a minimum 30 meter wide vegetated buffer along at least 75 percent of the length of both sides of rivers, creeks and streams.
Figure 57 shows the extent of the naturally vegetated riparian zone in thecatchment, 30 meters along the shoreline of waterbodies andwatercourses. This analysis from the RVCA’s Land Cover ClassificationProgram (derived from 2008 DRAPE imagery) shows that the riparianbuffer (30 metre wide strip) in the catchment is comprised of woodland (46 percent), wetland (34 percent), settlement areas (12 percent), cropand pastureland (six percent), and transportation routes (two percent)
Around Big�Rideau�Lake�itself (in the catchment), the shoreline buffer ismade up of woodland (46 percent), settlement areas (31 percent), wetland(21 percent), transportation routes (one percent) and crop and pastureland(one percent).
Around Adam�Lake, the shoreline buffer is made up of woodland (61 percent), settlement areas (26 percent), wetland (10 percent),transportation routes (two percent) and crop and pastureland (onepercent). Around Long�Lake, the shoreline buffer is made up of woodland(63 percent), wetland (20 percent) and settlement areas (17 percent).Around Round�Lake, the shoreline buffer is made up of woodland (83 percent), wetland (10 percent), settlement areas (four percent) andtransportation routes (three percent)
Along streams in the catchment, the riparian buffer is comprised of wetland(46 percent), woodland (38 percent), crop and pastureland (11 percent),transportation routes (three percent) and settlement areas (two percent).
Headwaters Drainage Features AssessmentThe RVCA Stream Characterization program assessed HeadwaterDrainage Features for the Rideau Lakes subwatershed in 2013. Thisprotocol measures zero, first and second order headwater drainagefeatures (HDF). It is a rapid assessment method characterizing theamount of water, sediment transport, and storage capacity withinheadwater drainage features (HDF). RVCA is working with TRCA and theMNR to implement the protocol with the goal of providing standarddatasets to support science development and monitoring on both theinterim guideline for headwater drainage features and existing mitigationstrategies. An HDF is a depression in the land that conveys surface flow.Additionally, this module provides a means of characterizing theconnectivity, form and unique features associated with each HDF (OSAPProtocol, 2013). An initiative is underway to evaluate how these data canhelp understand the cumulative contributions of individual headwaterdrainage features on the downstream watershed state (see Stanfield etal., 2013). In 2013 the program sampled 18 sites in the Big Rideau Lake-Rideau Ferry catchment area. Figure 58 shows the headwater drainagefeatures sampling locations in the catchment.
2. Riparian Conditions
Figure 57 Natural and other riparian land cover around Big Rideau Lake
LALLY RD
ELM G
ROVE RD
MAHON RD
RIDEAU LK RD
PORT E
LMSLEY R
D
0 21
Kilometres ²Riparian land cover
NaturalOther
Figure 58 Headwater drainage feature sampling locations around Big Rideau Lake
!
!
!
!!
!
!!
!
! !!
!
!
!! !
!
OL
D K
ING
STO
N R
D
LALLY RD
EL
M G
RO
VE
RD
MAHON RD
RIDEAU LK RD
PORT E
LMSLEY R
D
ELM G
ROVE RD
0 21
Kilometres ²
! Headwaters sample site
Stream Network
Open Water (Lake)

Rideau Lakes Subwatershed Report 2014Big Rideau Lake – Rideau Ferry Catchment
24
FisheriesThe Big Rideau Lake-Rideau Ferry catchment is comprised of a mixed fishcommunity of warm, cool and cold water species. A total of 27 species ofrecreational and baitfish support the Rideau Lakes fishery in thecatchment. The following is a list of known species in the catchment(Source: MNR/RVCA).
Two photos of Headwaters Assessments in the Big Rideau Lake-Rideau Ferry catchment
lake trout northern pike smallmouth basslargemouth basswalleye yellow perch rock bassblack crappie pumpkinseedbluegill brown bullheadyellow bullheadwhite sucker lake whitefish
lake herring fallfish shorthead redhorseblackchin shiner burbot brook silversidealewife bluntnose minnowbanded killifish golden shiner blacknose shiner fathead minnow Iowa darter Smallmouth Bass (Micropterus dolomieu)

Rideau Lakes Subwatershed Report 2014Big Rideau Lake – Rideau Ferry Catchment
25
3. Land Cover
Woodland is the dominant land cover type in the catchment along with water,as shown in Table 23 and displayed in the map on the front cover of the report.
Table 23 Catchment land cover type
Cover Type Area (ha) Area (% of Cover)Woodland* 2133 39Water 1415 26
Wetland** 825 15
Crop & Pasture 646 12
Settlement 81 5
Transportation 192 3
* Does not include treed swamps ** Includes treed swamps
Woodland CoverThe Big Rideau Lake-Rideau Ferry catchment contains 2132 hectares ofupland forest and 99 hectares of lowland forest (treed swamps) (Fig.59)that occupies 40 percent of the drainage area (versus the 44 percent ofwoodland cover in the Rideau Lakes subwatershed). This figure is greaterthan the 30 percent of woodland area required to sustain forest birds,according to Environment Canada’s Guideline: How�Much�Habitat�isEnough? When forest cover declines below 30 percent, forest birds tendto disappear as breeders across the landscape.
One hundred and twenty six (53 percent) of the 239 woodland patches in thecatchment are very small, being less than one hectare in size. Another 89 (37 percent) of the wooded patches ranging from one to less than 20 hectaresin size tend to be dominated by edge-tolerant bird species. The remaining 24 (10 percent of) woodland patches range between 21 and 397 hectares.Eighteen of these patches contain woodland between 20 and 100 hectaresand may support a few area-sensitive species and some edge intolerantspecies, but will be dominated by edge tolerant species.
Conversely, six (two percent) of the 239 woodland patches in the drainagearea exceed the 100 plus hectare size needed to support most forestdependent, area sensitive birds and are large enough to supportapproximately 60 percent of edge-intolerant species. One of these patchestops 200 hectares, which according to the Environment Canada Guidelinewill support 80 percent of edge-intolerant forest bird species (including mostarea sensitive species) that prefer interior forest habitat conditions.
Forest InteriorThe same 239 woodlands contain 88 forest interior patches (Fig.59) thatoccupy less than one percent (279 ha.) of the catchment land area(versus the five percent of interior forest in the Rideau Lakessubwatershed). This is below the ten percent figure referred to in theEnvironment Canada Guideline that is considered to be the minimumthreshold for supporting edge intolerant bird species and other forestdwelling species in the landscape.
Most patches (81) have less than 10 hectares of interior forest, 52 ofwhich have small areas of interior forest habitat less than one hectare insize. Another six patches contain between 10 and 30 hectares of interiorforest. Conversely, one patch has greater than 30 hectares of interiorforest (at 40 ha.).
Figure 59 Catchment woodland cover and forest interior
OL
D K
ING
STO
N R
D
LALLY RD
EL
M G
RO
VE
RD
MAHON RD
PORT ELMSLEY R
D
RIDEAU LK RD
ELM G
ROVE RD
0 21
Kilometres ²
Interior Treed Swamps
Interior Forest
Forest
Figure 60 Catchment wetland cover
OL
D K
ING
STO
N R
D
LALLY RD
ELM G
ROVE RD
MAHON RD
RIDEAU LK RD
MO
RAN RD
0 1.50.75
Kilometres ²
Wetland CoverPre-SettlementCurrent (2008)
Pre-Settlement data provided by: Ducks Unlimited Canada, 2010. Southern Ontario Wetland Conversion Analysis, http://www.ducks.ca/aboutduc/news/archives/prov2010/pdf/duc_ontariowca.pdf, (March 2010)
Wetland CoverFigure 60 shows pre-settlement versus current (2008) wetland cover in the catchment.

Rideau Lakes Subwatershed Report 2014Big Rideau Lake – Rideau Ferry Catchment
26
Figure 62 RVCA regulation limits
OL
D K
ING
STO
N R
D
LALLY RD
EL
M G
RO
VE
RD
MAHON RD
RIDEAU LK RD
PORT E
LMSLEY R
D
WINTO
N LANE
ELM G
ROVE RD
0 2.51.25
Kilometres ²
!. Municipal wellRegulation limitRegulated floodplainRegulated wetlandsUnregulated wetlands
McLeans BayWetland
Big Rideau - Bass LakeComplex
Coutts Bay Wetland
Tay Marsh
Shoreline Naturalization ProjectsWith the assistance of the RVCA’s Shoreline Naturalization Program, 280trees and shrubs were planted at two project locations from 2008 to 2013 tocreate a 152 metre long shoreline buffer at a total project value of $1.534.
Septic System Re-InspectionsFrom 2009 to 2014, the Mississippi Rideau Septic System Office performed47 septic system re-inspections (35 cottages, 11 houses and one business):21 on Adam Lake, 15 on Big Rideau Lake and 10 on Long Lake in TayValley Township within the Rideau Ferry catchment. Remedial/maintenancework (i.e. pump outs, baffle replacement, work that generally does notrequire a permit) was recommended for 26 (or 55 percent) of thoseproperties that were inspected, a septic system replacement at anotherproperty with more information provided to a further three landowners withidentified septic system concerns.
From 2008 to 2009, the Mississippi Rideau Septic System Office performed20 septic system re-inspections (11 cottages and 9 houses) on Big RideauLake in the Township of Rideau Lakes within the Rideau Ferry catchment.Remedial/maintenance work (i.e. pump outs, baffle replacement, work thatgenerally does not require a permit) was recommended for 10 (or 50percent) of those properties that were inspected along with a septic systemreplacement at another property.
The RVCA and its partners are working to protect and enhanceenvironmental conditions in the Rideau Lakes subwatershed.
Rural Clean Water ProjectsFigure 61 shows the location of all Rural Clean Water Projects in the BigRideau-Rideau Ferry drainage area. From 2008 to 2013, landownerscompleted 11 projects: five septic system repairs/replacements, twolivestock water restriction fencing projects, two well decommissionings,one erosion control project and one well replacement. RVCA contributed$13,484 in grant dollars towards the total project cost of $84,606.dollars.
4. Stewardship and Protection
Figure 61 RVCA stewardship program project locations
U
UUUUUUUUUUUUUU
U U
Ô
ÔÔÔ
Ô
ÔÔÔ
ÔÔ
Ô
ÔÔ
ÔÔÔÔ
U
UU
UU
UU
X
X
#
#
OL
D K
ING
STO
N R
D
ELM G
ROVE RD
MAHON RD
LAL
LY R
D
RIDEAU LK RD
PORT E
LMSLEY R
D
0 10.5
Kilometres ²
RVCA Stewardship Projects andConservation Lands:# Conservation Land
Ô Ont. Drinking Water
XShoreline Planting
U Tree Planting
Ô Clean Water
U Butternut Planting
MillPond
Prior to 2008, the RVCA completed five projects in the area consisting oftwo well upgrades, one erosion control project, one livestock waterrestriction fencing project and one chemical/fuel handling and storagefacility. In total, RVCA contributed $8,921 in grant dollars to projects valuedat $43,691.
Tree Planting ProjectsThe location of all tree planting projects is also shown in Figure 61. Prior to2008, landowners helped plant 53,850 trees, valued at $49,334, at sixproject sites, using the RVCA Tree Planting Program; fundraising dollarsaccounted for $29,257 of that amount. From 2008 to 2013, no trees wereplanted in the catchment (under the program).

Rideau Lakes Subwatershed Report 2014Big Rideau Lake – Rideau Ferry Catchment
27
Valley, Stream, Wetland and Hazard Land RegulationNine square kilometres or 16 percent of the catchment drainage area iswithin the regulation limit of Ontario Regulation 174/06 (Fig.62), givingprotection to wetland areas and river or stream valleys that are affected byflooding and erosion hazards.
Natural features within the regulation limit include 3.5 sq. km. of wetlands(representing 42 percent of all wetlands in the catchment) and 19.6kilometers of streams (representing 18 percent of all streams in thecatchment). Some of these regulated watercourses (14.5 km or 13 percentof all streams) flow through regulated wetlands.
Regulation limit mapping has been plotted along 5.1 km (or 26 percent) ofthe streams that are outside of wetlands. Plotting of the regulation limit onthe remaining 87.4 km (or 82 percent) of streams requires identification offlood and erosion hazards and valley systems.
Within the regulation limit, “development” and “site alteration” requireRVCA permission. The “alteration to waterways” provision of OntarioRegulation 174/06 applies to all watercourses.
Vulnerable Drinking Water AreasThe catchment area is considered to have a Highly Vulnerable Aquifer.This means that the nature of the overburden (thin soils, fracturedbedrock) does not provide a high level of protection for the underlyinggroundwater making the aquifer more vulnerable to contaminants releasedon the surface. The Mississippi-Rideau Source Protection Plan includespolicies that focus on the protection of groundwater region-wide due to thefact that most of the region, which encompasses the Mississippi andRideau watersheds, is considered Highly Vulnerable Aquifer.
The northeast portion of the catchment area (north of Adams Lake andwest of Otty Lake) is also considered a Significant Groundwater RechargeArea. This means that there is a volume of water moving from the surfaceinto the ground and groundwater serves either as a municipal drinkingwater source or supplies a cool/cold water stream. The Plan was notrequired to include policies to specifically address Significant GroundwaterRecharge Areas.
Basking turtles
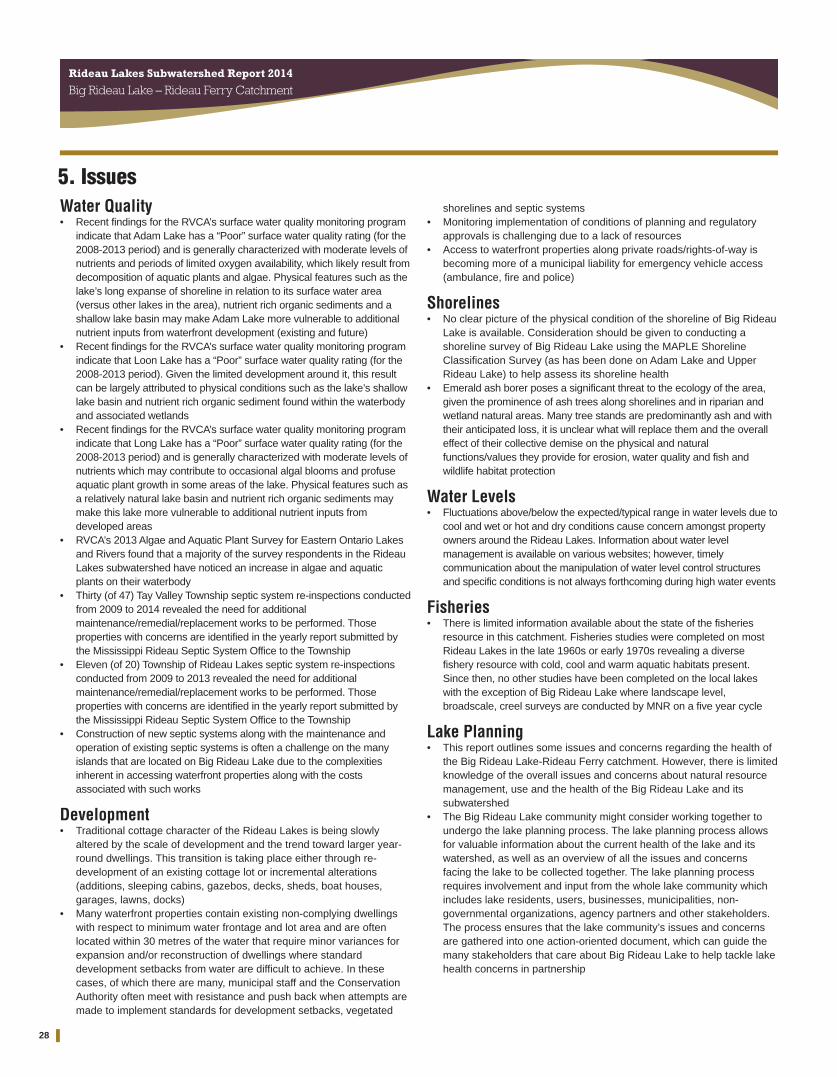
28
Rideau Lakes Subwatershed Report 2014
Big Rideau Lake – Rideau Ferry Catchment
5. IssuesWater Quality• Recent findings for the RVCA’s surface water quality monitoring program
indicate that Adam Lake has a “Poor” surface water quality rating (for the2008-2013 period) and is generally characterized with moderate levels ofnutrients and periods of limited oxygen availability, which likely result fromdecomposition of aquatic plants and algae. Physical features such as thelake’s long expanse of shoreline in relation to its surface water area(versus other lakes in the area), nutrient rich organic sediments and ashallow lake basin may make Adam Lake more vulnerable to additionalnutrient inputs from waterfront development (existing and future)
• Recent findings for the RVCA’s surface water quality monitoring programindicate that Loon Lake has a “Poor” surface water quality rating (for the2008-2013 period). Given the limited development around it, this resultcan be largely attributed to physical conditions such as the lake’s shallowlake basin and nutrient rich organic sediment found within the waterbodyand associated wetlands
• Recent findings for the RVCA’s surface water quality monitoring programindicate that Long Lake has a “Poor” surface water quality rating (for the2008-2013 period) and is generally characterized with moderate levels ofnutrients which may contribute to occasional algal blooms and profuseaquatic plant growth in some areas of the lake. Physical features such asa relatively natural lake basin and nutrient rich organic sediments maymake this lake more vulnerable to additional nutrient inputs fromdeveloped areas
• RVCA’s 2013 Algae and Aquatic Plant Survey for Eastern Ontario Lakesand Rivers found that a majority of the survey respondents in the RideauLakes subwatershed have noticed an increase in algae and aquaticplants on their waterbody
• Thirty (of 47) Tay Valley Township septic system re-inspections conductedfrom 2009 to 2014 revealed the need for additionalmaintenance/remedial/replacement works to be performed. Thoseproperties with concerns are identified in the yearly report submitted bythe Mississippi Rideau Septic System Office to the Township
• Eleven (of 20) Township of Rideau Lakes septic system re-inspectionsconducted from 2009 to 2013 revealed the need for additionalmaintenance/remedial/replacement works to be performed. Thoseproperties with concerns are identified in the yearly report submitted bythe Mississippi Rideau Septic System Office to the Township
• Construction of new septic systems along with the maintenance andoperation of existing septic systems is often a challenge on the manyislands that are located on Big Rideau Lake due to the complexitiesinherent in accessing waterfront properties along with the costsassociated with such works
Development• Traditional cottage character of the Rideau Lakes is being slowly
altered by the scale of development and the trend toward larger year-round dwellings. This transition is taking place either through re-development of an existing cottage lot or incremental alterations(additions, sleeping cabins, gazebos, decks, sheds, boat houses,garages, lawns, docks)
• Many waterfront properties contain existing non-complying dwellingswith respect to minimum water frontage and lot area and are oftenlocated within 30 metres of the water that require minor variances forexpansion and/or reconstruction of dwellings where standarddevelopment setbacks from water are difficult to achieve. In thesecases, of which there are many, municipal staff and the ConservationAuthority often meet with resistance and push back when attempts aremade to implement standards for development setbacks, vegetated
shorelines and septic systems• Monitoring implementation of conditions of planning and regulatory
approvals is challenging due to a lack of resources• Access to waterfront properties along private roads/rights-of-way is
becoming more of a municipal liability for emergency vehicle access(ambulance, fire and police)
Shorelines• No clear picture of the physical condition of the shoreline of Big Rideau
Lake is available. Consideration should be given to conducting ashoreline survey of Big Rideau Lake using the MAPLE ShorelineClassification Survey (as has been done on Adam Lake and UpperRideau Lake) to help assess its shoreline health
• Emerald ash borer poses a significant threat to the ecology of the area,given the prominence of ash trees along shorelines and in riparian andwetland natural areas. Many tree stands are predominantly ash and withtheir anticipated loss, it is unclear what will replace them and the overalleffect of their collective demise on the physical and naturalfunctions/values they provide for erosion, water quality and fish andwildlife habitat protection
Water Levels• Fluctuations above/below the expected/typical range in water levels due to
cool and wet or hot and dry conditions cause concern amongst propertyowners around the Rideau Lakes. Information about water levelmanagement is available on various websites; however, timelycommunication about the manipulation of water level control structuresand specific conditions is not always forthcoming during high water events
Fisheries• There is limited information available about the state of the fisheries
resource in this catchment. Fisheries studies were completed on mostRideau Lakes in the late 1960s or early 1970s revealing a diversefishery resource with cold, cool and warm aquatic habitats present.Since then, no other studies have been completed on the local lakeswith the exception of Big Rideau Lake where landscape level,broadscale, creel surveys are conducted by MNR on a five year cycle
Lake Planning• This report outlines some issues and concerns regarding the health of
the Big Rideau Lake-Rideau Ferry catchment. However, there is limitedknowledge of the overall issues and concerns about natural resourcemanagement, use and the health of the Big Rideau Lake and itssubwatershed
• The Big Rideau Lake community might consider working together toundergo the lake planning process. The lake planning process allowsfor valuable information about the current health of the lake and itswatershed, as well as an overview of all the issues and concernsfacing the lake to be collected together. The lake planning processrequires involvement and input from the whole lake community whichincludes lake residents, users, businesses, municipalities, non-governmental organizations, agency partners and other stakeholders.The process ensures that the lake community’s issues and concernsare gathered into one action-oriented document, which can guide themany stakeholders that care about Big Rideau Lake to help tackle lakehealth concerns in partnership

Rideau Lakes Subwatershed Report 2014Big Rideau Lake – Rideau Ferry Catchment
29
6. Opportunities
Water Quality• Reduce pollutant loadings to Big Rideau Lake, Adam Lake and Long
Lake through application of shoreline, stormwater and agricultural bestmanagement practices; also consider using low impact development(LID) methods to improve the quality and reduce the amount ofstormwater runoff reaching the lake ecosystem. This may beparticularly benificial in areas of high density development withextensive impervious surfaces (i.e., asphalt, concrete, buildings andseverely compacted soils) or on sensitive waterfront properties (withsteep slopes/banks, shallow/impermeable soils)
• Continue to promote the protection of the Rideau Lakes waterresources through implementation of municipal and agency land useand development policies and practices
• Continue to promote septic system re-inspections by the MississippiRideau Septic System Office to ensure that sewage disposal systems arefunctioning properly and advocate for the replacement of faulty septicsystems in accordance with current Ontario�Building�Code�standards
• Continue to offer septic repair/replacement project funding provided bythe Rideau Valley Rural Clean Water Program to waterfront landowners
• Encourage residents of Adam Lake to work on the 20 Action Itemslisted in the Adam�Lake�Stewardship�Plan (many of which have alreadybeen acted upon and/or are currently underway)
• Continue efforts to educate boaters about the need to properly disposeof on-board grey and black water and the availability ofenvironmentally conscious marinas with sewage pump-out facilitiesthat have been certified by the Clean Marinas Program
• Review RVCA monitoring of surface water quality in the Big RideauLake, along with other Rideau Lakes before the next round of theWatershed Watch monitoring cycle begins in 2016 to determine if thereis a need to “develop a more intensive and coordinated water qualitymonitoring program for all Rideau Lakes” (an identified action in the2009 Rideau�Lakes�Watershed�Plan)
Development• Collectively work with approval authorities (Tay Valley Township,
Township of Rideau Lakes, Conservation Authority, the Health Unit,and Mississippi-Rideau Septic System Office) to consistentlyimplement current land use planning and development policies forwater quality and shoreline protection adjacent to lakes and streams(e.g., a minimum 30 metre development setback from water)
• Explore ways and means to more effectively enforce and implementconditions of land-use planning and development approval to achievenet environmental gains (particularly with respect to rehabilitating orprotecting naturally vegetated shorelines and water quality)
• Encourage Committees of Adjustment to take advantage of technicaland environmental information and recommendations forthcoming fromplanning and environmental professionals
• Municipal and agency planners together with development proponentsare to continue using the Rideau�Lakes�Basin�Carrying�Capacity�Study(1992) and associated 2014 Site�Evaluation�Guidelines11 to informdecision-making about the application of development setbacks on lotswith shallow soils/bedrock, steep slopes and sparse vegetation coveralong with the use of the appropriate, development related, bestmanagement practices
• Utilize RVCA subwatershed and catchment reports to help
develop/revise official plan policies to protect surface water resourcesand the natural environment (including woodlands, wetlands andshoreline cover)
• New development around Big Rideau Lake should take into account afirst floor elevation of 124.81 metres (using the 124.51 metre 100 yearflood elevation plus 0.3 metre freeboard) above sea level so as toensure the safety and integrity of buildings and their contents; thisfigure should also be taken into account in the design and placementof septic systems and well heads so that they are not adverselyimpacted during flood events
Shorelines• RVCA and its partners (including the municipalities of Rideau Lakes
and Tay Valley and the Big Rideau Lake Association) are to continueeducating landowners about waterfront property best managementpractices with respect to shoreline use and development, septicsystem installation/maintenance and shoreline vegetation retention and enhancement
• Protect the riparian buffer along the shoreline of Big Rideau Lake andits tributaries during the development approvals process throughadherence to and enforcement of municipal land-use policies andzoning standards
• Consider a comprehensive assessment of shoreline conditions aroundBig Rideau Lake (using the MAPLE protocol) to monitor the effect offuture changes in the lake ecosystem
• RVCA and partners are to continue promoting the RVCA’s ShorelineNaturalization Program and other similar initiatives to enhancevegetation cover around Big Rideau Lake
• Continue to educate boaters about the effect of excessive speedingand ensuing boat wake on the shoreline and wildlife of Big RideauLake; also consider enforcement of speeding watercraft in closeproximity to the shoreline
• Target riparian/shoreline restoration at sites identified in this report(as show in Figure 57 as “Other” riparian cover)
Water Levels• Forge connections amongst water resources management agencies,
businesses, municipalities and lake residents to continually improvewater level management activities. This will include the pooling ofresources where possible and regular communications about how,when and why water levels are manipulated and what the impacts willbe on navigation, fisheries, recreation and flood attenuation
• In 2014, lake levels were higher than most years and more attention wasrequired from RVCA and municipal staff. Only general flood informationwas available for municipalities to address landowner concerns. Inresponse, a review of the RVCA Flood Forecasting and Warning Programin the Upper Rideau Valley is underway to address this need
Fisheries• Implement multiple objectives outlined in the Draft Fisheries
Management Zone 18 Bass and Walleye Management Plans
11 Hutchinson Environmental Sciences Ltd. 2014. Assessment�of�Municipal�Site�Evaluation�Guidelines�in�Eastern�Ontario’s�Lake�Country. Prepared for Mississippi ValleyConservation Authority, Rideau Valley Conservation Authority and Cataraqui Region Conservation Authority

Rideau Lakes Subwatershed Report 2014Big Rideau Lake – Rideau Ferry Catchment
30
Lake Planning
A Lake Plan:• Is an action plan developed by a lake community (which includes lake
residents, users, businesses, municipalities, non-governmentalorganizations, agency partners and other stakeholders) that identifiesand preserves the natural and social characteristics that are valued bythe lake community for future generations
• Helps to promote community discussion, education and action• Sets goals and objectives for the protection and enhancement of
the lake• Recommends land use policies/practices that influence development
on the lake• Promotes stewardship actions to improve the environmental conditions
of a lake so it can be enjoyed by future generations
Consider the need for a community-driven lake management plan for BigRideau Lake that can:• Bring the lake community together• Engage the community beyond the lake residents and lake association
members and develop partnerships• Identify and bring together common values and concerns• Provide a baseline of data on water quality, land-use activities,
shoreline development, fisheries management, etc., that can help toinform water resources management, land use planning andstewardship actions
• Range in complexity from a comprehensive living document to asimplified list of priorities that can be carried out by the lake communityto protect the lake environment
Rideau Ferry Yatch Club Conservation Area