rfor information only
TRANSCRIPT

Nepean Blue Mountains Local Health District Healthcare Services Plan
Data Reference Book 2012-2022
NBMLHD Healthcare Services Plan 2012-2022

NBMLHD Healthcare Services Plan 2012-2022
NBMLHD Healthcare Services Plan 2012-2022
Contents 1. Introduction ........................................................................................................................................ 3 2. Characteristics of the Population ........................................................................................................ 4 3. Drivers ................................................................................................................................................. 8 4. Services in Nepean Blue Mountains Local Health District ................................................................ 12
Bed Profile : NBMLHD Hospitals .............................................................................................. 12 Activity 2010-11: NBMLHD Hospitals ....................................................................................... 15 Overview of Activity in the NBMLHD ....................................................................................... 25 Mental Health Inpatient Acute Activity ................................................................................... 28 Perinatology and Qualified Neonates ...................................................................................... 29 Adult Sub-Acute Activity .......................................................................................................... 30 Outpatient Activity ................................................................................................................... 32 Private Hospital Services Provided for Residents of the NBMLHD .......................................... 33 Primary Care and Community Health ...................................................................................... 35 Mental Health Services ............................................................................................................ 36 Oral Health Services ................................................................................................................. 36 Medicare Local and General Practitioners ............................................................................... 37 Residential Aged Care Facilities ............................................................................................... 38
5. Inflows and Outflows ........................................................................................................................ 39 Inflows, Outflows and Netflows ............................................................................................... 39 Inflows of Patients from outside of Nepean Blue Mountains Local Health District ................ 40 Outflows of Residents of Nepean Blue Mountains Local Health District to Other Hospitals .. 48
6. Projected Health Care Activity to 2022 ............................................................................................. 61 Methodology ............................................................................................................................ 61 Projected Acute and Sub-Acute Activity .................................................................................. 62 Projected Acute Activity for All Ages ....................................................................................... 64 Projected Acute Activity by Hospital for All Ages .................................................................... 65 Projected Adult Acute Activity ................................................................................................. 66 Projected Acute Activity for Older People ............................................................................... 68 Projected Acute Obstetric Activity (All Ages) ........................................................................... 71 Projected Paediatric Acute Care (Age <16 years) .................................................................... 74 Perinatology and Qualified Neonates ...................................................................................... 77 Sub-Acute Inpatient Care Projections ...................................................................................... 78 Emergency Department Presentations .................................................................................... 84 Mental Health .......................................................................................................................... 85 Operating Theatres and Procedure Rooms ............................................................................. 86 Renal Dialysis ........................................................................................................................... 89 Acute Renal Medicine .............................................................................................................. 91 Cancer – Chemotherapy and Radiation Oncology ................................................................... 92

NBMLHD Healthcare Services Plan 2012-2022
Data Reference Book DRB.2
Table of Acronyms and Abbreviations
ABS Australian Bureau of Statistics aIM Acute inpatient modelling projection tool ALOS Average length of stay CWTU Cost weighted separations undiscounted DOHRS Department of Health Reporting System DRGs Diagnostic Related Groups DVA Department of Veterans’ Affairs ED Emergency Department ESRG Enhanced Service Related Group FlowInfo Admitted patient activity tool HDHS Hawkesbury District Health Service HIE Health Information Exchange LGA Local Government Area MH-CCP Mental Health Clinical Care and Prevention Model MOH Ministry of Health NBMLHD Nepean Blue Mountains Local Health District SAPHaRI Secure Analytics for Population Health Research and Intelligence SiAM Sub and non-acute projection tool SRG Service Related Group WSLHD Western Sydney Local Health District

NBMLHD Healthcare Services Plan 2012-2022
Data Reference Book DRB.3
1. Introduction
The objective of the NBMLHD Healthcare Services Plan Data Reference Book 2012-2022 is to provide
further details in terms of data for the NBMLHD Healthcare Services Plan 2012-2022.
The scope of NBMLHD Healthcare Services Plan 2012-2022 is to provide an insight of population characteristics of Local Health District , the hospitals and services available in the NBMLHD and their activity , patient inflows and outflows from NBMLHD to other hospitals and outlines projected service activity in the NBMLHD.
The data is presented in the same flow as the Nepean Blue Mountains Local Health District Healthcare Services Plan 2012-2022. The information used throughout the document has been sourced through various software and databases which includes Flowinfo v 11.2, aIM2012 v2.0, SiaM2012 v2.0, Australian Bureau of Statistics and others recommended by NSW Ministry of Health.
The audience for the NBMLHD Healthcare Services Plan Data Reference Book 2012-2022 includes the population of the NBMLHD, clinicians and managers working within the service and partner organisations working with NBMLHD services and facilities, Ministry of Health, NSW Health Minister and Premier and others interested in the data used to develop the Nepean Blue Mountains Local Health District Healthcare Services Plan 2012-2022.

NBMLHD Healthcare Services Plan 2012-2022
Data Reference Book DRB.4
2. Characteristics of the Population
Table 2.1. Population Statistics, Births and Fertility for NBMLHD and NSW, 1994 to 2010
Year NBMLHD NSW
Number of Live births
Population Crude birth rate per
1,000 population
Female population
of childbearing
age
Total fertility rate
Number of Live births
Population Crude birth rate
per 1,000 population
Total fertility rate
1994 5,378 313,862 17.1 125,874 2.1 86,848 6,060,190 14.3 1.9
1995 5,143 317,489 16.2 126,703 2.0 86,159 6,126,981 14.1 1.8
1996 5,082 322,077 15.8 127,954 2.0 85,192 6,204,728 13.7 1.8
1997 5,027 325,367 15.5 128,091 2.0 86,854 6,276,961 13.8 1.8
1998 5,055 327,963 15.4 127,877 2.0 85,062 6,339,071 13.4 1.8
1999 5,032 331,341 15.2 127,956 2.0 86,102 6,411,370 13.4 1.8
2000 5,101 334,547 15.2 127,944 2.0 86,715 6,486,213 13.4 1.8
2001 4,920 337,866 14.6 127,953 2.0 84,766 6,575,217 12.9 1.8
2002 4,796 338,943 14.1 126,919 1.9 84,921 6,628,951 12.8 1.8
2003 4,762 338,871 14.1 125,700 2.0 85,349 6,672,577 12.8 1.8
2004 4,533 336,823 13.5 124,124 1.9 84,477 6,707,189 12.6 1.8
2005 4,868 336,112 14.5 122,765 2.1 89,324 6,756,457 13.2 1.9
2006 4,819 335,939 14.3 121,738 2.1 91,506 6,816,087 13.4 1.9
2007 4,918 338,031 14.5 121,284 2.1 94,556 6,904,942 13.7 1.9
2008 4,815 342,500 14.1 121,992 2.0 94,887 7,014,887 13.5 1.9
2009 4,872 344,710 14.1 122,060 2.0 94,890 7,096,272 13.4 1.9
2010 4,811 345,160 13.9 121,602 2.0 94,987 7,154,122 13.3 1.9 Sources: NSW Perinatal Data Collection (SAPHaRI). Centre for Epidemiology and Evidence, NSW Ministry of Health. Notes: Includes births in NSW to NSW residents only. Total fertility rate (TFR) represents the number of children a female would bear during her lifetime if she experienced current age-specific fertility rates at each age of her reproductive life.

NBMLHD Healthcare Services Plan 2012-2022
Data Reference Book DRB.5
Table 2.2. Deaths from All Causes by Sex and Local Government Area, NBMLHD and NSW, 2003 to 2007 Combined
Area
Sex
Deaths
Deaths
per year
Crude death rate per 100,000
Directly age standardised death rate* Significance
per 100,000 Lower 99% CI Upper 99%
CI
Blue Mountains Males 1,283 257 686.7 705.4 655.4 758.2 =
Females 1,314 263 669.0 504.6 468.8 542.2 =
Persons 2,597 519 677.6 596.4 566.5 627.5 =
Hawkesbury Males 828 166 531.9 775.9 705.7 850.7 =
Females 751 150 480.2 526.4 477.6 578.6 =
Persons 1,579 316 506.0 640.3 599.2 683.5 =
Lithgow** Males 428 86 810.5 867.1 760.3 983.9 ↑
Females 383 77 761.9 564.6 492.3 644.2
Persons 811 162 786.8 694.5 633.0 760.2 ↑
Penrith Males 2,055 411 466.3 834.6 784.1 887.1 ↑
Females 1,927 385 431.4 555.8 523.3 589.6 ↑
Persons 3,982 796 448.7 670.4 642.6 699.0 ↑
NBMLHD Males 4,594 919 549.5 782.0 751.6 813.3 =
Females 4,375 875 514.8 537.3 516.4 558.8 ↑
Persons 8,969 1,794 532.0 644.2 626.7 662.1 ↑
NSW Males 116,260 23,252 692.9 750.1 744.4 755.8
Females 111,490 22,298 652.8 501.7 497.8 505.7
Persons 227,750 45,550 672.7 612.1 608.8 615.4 Sources: ABS mortality data and population estimates (SAPHaRI). Centre for Epidemiology and Evidence, NSW Ministry of Health. Notes: *Rates were age-adjusted using the Australian population as at 30 June 2001. ↑ denotes that NBMLHD or LGA rate was significantly above NSW rate.

NBMLHD Healthcare Services Plan 2012-2022
Data Reference Book DRB.6
Table 2.3 Premature Deaths, People Aged under 75 years, by Sex and Local Government Area, NBMLHD and NSW, 2003 to 2007 Combined
Area
Sex Total deaths in 2003-2007
Deaths per year
Crud death rate per 100,000
Directly age standardised death rate* Statistical Significance of
NBMLHD to NSW
Death rate per 100,000
Lower 99% CI Upper 99% CI
Blue Mountains Males 539 108 304.8 293.5 261.5 328.1
Females 354 71 194.6 172.1 149.3 197.3
Persons 893 179 248.9 230.6 211.0 251.5
Hawkesbury Males 403 81 267.9 307.5 268.7 350.1
Females 239 48 160.7 184.2 154.5 217.6
Persons 642 128 214.6 245.9 221.2 272.5
Lithgow** Males 194 39 386.8 345.6 284.2 415.7
Females 130 26 280.7 229.9 180.8 287.8
Persons 324 65 335.9 288.7 248.5 333.1
Penrith Males 1,119 224 260.5 333.6 307.5 361.2
Females 737 147 172.2 213.7 193.4 235.4 ↑
Persons 1,856 371 216.5 272.7 256.1 290.0 ↑
NBMLHD Males 2,255 451 279.4 317.8 300.5 335.8
Females 1,460 292 181.4 198.7 185.4 212.7 ↑
Persons 3,715 743 230.5 257.2 246.3 268.5
NSW Males 50,469 10,094 317.3 311.8 308.2 315.4
Females 30,158 6,032 191.1 180.7 178.1 183.4
Persons 80,627 16,125 254.5 245.2 243.0 247.5 Sources: ABS mortality data and population estimates (SAPHaRI). Centre for Epidemiology and Evidence, NSW Ministry of Health. Notes: *Rates were age-adjusted using the Australian population as at 30 June 2001. ↑ denotes that NBMLHD or LGA rate was significantly above NSW rate.

NBMLHD Healthcare Services Plan 2012-2022
Data Reference Book DRB.7
Table 2.4 Demographics of Residents in NBMLHD, 2011 and 2006
2011 Census % of total population
2006 Census
Area 2011 Census population by usual residence % Aged<5 years % Aged>=70 years
% Indigenous
% born overseas 2IRSD
Penrith 178,466 7.6% 6.2% 3.0% 20.9% 1,006
Hawkesbury 62,353 6.8% 7.6% 2.6% 12.6% 1,033
Blue Mountains 75,941 6.2% 10.4% 1.7% 16.5% 1,051
Lithgow 20,161 6.3% 12.1% 4.5% 9.0% 937
NBMLHD 336,920 7.1% 7.7% 2.7% 17.7%
NSW 6,917,660 6.6% 10.3% 2.5% 25.7% Not available
Source: 2011 Census, ABS data used with permission from the Australian Bureau of Statistics (http://www.abs.gov.au/). Table compiled form data from Epidemiology, Western Sydney Local Health District . Notes: Indigenous persons comprised of Aboriginal, Torres Strait Islanders and both Aboriginal and Torres Strait Islanders. IRSD= Index of Relative Socio-economic Disadvantage .

NBMLHD Healthcare Services Plan 2012-2022
Data Reference Book DRB.8
3. Drivers
Table 3.1 Population Projections for NBMLHD from 2011 to 2036, All Ages by LGA
Source: NSW Health Population Projection Series 1, 2009. Notes: AAGR: Average Annual Growth Rate.
Table 3.2 Population Projections for NBMLHD from 2011 to 2036, 0-14 Years
Source: NSW Health Population Projection Series 1, 2009. Notes: AAGR: Average Annual Growth Rate.
LGAs 2011 2016 2021 2026 2031 2036 Change %Change AAGR
Penrith 182,596 197,707 208,313 217,631 227,508 237,819 55,223 30.2% 1.1%
Hawkesbury 64,826 67,636 72,470 78,789 87,277 91,433 26,608 41.0% 1.4%
Blue Mountains 77,517 78,144 81,944 85,239 88,758 92,447 14,930 19.3% 0.7%
Lithgow 20,689 20,714 20,654 20,485 20,194 19,766 -923 -4.5% -0.2%
NBMLHD 345,628 364,200 383,381 402,144 423,736 441,465 95,837 27.7% 1.0%
LGAs 2011 2016 2021 2026 2031 2036 Change %Change AAGR
Lithgow 3,700 3,523 3,445 3,320 3,179 3,011 -689 -18.6% -0.8%
Blue Mountains 15,097 15,004 15,733 16,293 16,887 17,321 2,224 14.7% 0.6%
Penrith 40,176 43,393 45,972 47,013 47,881 48,649 8,473 21.1% 0.8%
Hawkesbury 14,092 14,377 15,540 16,671 18,188 18,443 4,351 30.9% 1.1%
NBMLHD 73,064 76,298 80,690 83,298 86,135 87,424 14,359 19.7% 0.7%

NBMLHD Healthcare Services Plan 2012-2022
Data Reference Book DRB.9
Table 3.3 Nepean Blue Mountains Local Health District Population Projections - 15-64 Years
Source: NSW Health Population Projection Series 1, 2009. Notes: AAGR: Average Annual Growth Rate.
Table 3.4 Nepean Blue Mountains Local Health District Population Projections - 65+ Years
Source: NSW Health Population Projection Series 1, 2009. Notes: AAGR: Average Annual Growth Rate.
Table 3.5 Nepean Blue Mountains Local Health District Population Projections - 70+ Years
Source: NSW Health Population Projection Series 1, 2009. Notes : AAGR: Average Annual Growth Rate.
LGAs 2011 2016 2021 2026 2031 2036 Change %Change AAGR
Lithgow 13,302 12,789 12,201 11,542 10,936 10,472 -2,830 -21.3% -1.0%
Blue Mountains 51,150 50,034 50,953 51,878 53,374 55,425 4,275 8.4% 0.3%
Penrith 125,674 132,437 136,177 140,490 146,334 153,130 27,456 21.8% 0.8%
Hawkesbury 43,593 44,432 46,310 49,320 53,799 55,996 12,403 28.5% 1.0%
NBMLHD 233,720 239,693 245,642 253,230 264,444 275,023 41,303 17.7% 0.7%
LGAs 2011 2016 2021 2026 2031 2036 Change %Change AAGR
Lithgow 3,687 4,402 5,007 5,622 6,079 6,283 2,596 70.4% 2.2%
Blue Mountains 11,271 13,106 15,258 17,068 18,497 19,702 8,431 74.8% 2.3%
Penrith 16,745 21,876 26,164 30,128 33,292 36,040 19,295 115.2% 3.1%
Hawkesbury 7,141 8,826 10,620 12,799 15,290 16,994 9,853 138.0% 3.5%
NBMLHD 38,844 48,210 57,049 65,616 73,158 79,019 40,175 103.4% 2.9%
LGAs 2011 2016 2021 2026 2031 2036 Change %Change AAGR
Lithgow 2,439 2,947 3,559 4,057 4,542 4,872 2,433 99.8% 2.8%
Blue Mountains 7,484 8,497 10,393 12,116 13,628 14,813 7,329 97.9% 2.8%
Penrith 10,844 13,647 17,671 21,152 24,420 27,017 16,173 149.1% 3.7%
Hawkesbury 4,744 5,818 7,432 9,164 11,332 12,932 8,188 172.6% 4.1%
NBMLHD 25,511 30,909 39,055 46,489 53,922 59,634 34,123 133.8% 3.5%

NBMLHD Healthcare Services Plan 2012-2022
Data Reference Book DRB.10
Table 3.6 Nepean Blue Mountains Local Health District Population Projections – 70-84 Years
LGAs 2011 2016 2021 2026 2031 2036 Change %Change AAGR
Lithgow 2,055 2,483 3,038 3,427 3,722 3,841 1,786 86.9% 2.5%
Blue Mountains 5,995 6,901 8,649 10,102 11,061 11,467 5,472 91.3% 2.6%
Penrith 8,915 11,318 15,026 17,925 20,149 21,156 12,241 137.3% 3.5%
Hawkesbury 3,813 4,638 6,041 7,361 8,829 9,573 5,761 151.1% 3.8%
NBMLHD 20,778 25,341 32,755 38,814 43,760 46,038 25,260 121.6% 3.2% Source: NSW Health Population Projection Series 1, 2009. Notes : AAGR: Average Annual Growth Rate.
Table 3.7 Nepean Blue Mountains Local Health District Population Projections - 85+ Years
LGAs 2011 2016 2021 2026 2031 2036 Change %Change AAGR
Lithgow 384 464 521 631 820 1,031 647 168.5% 4.0%
Blue Mountains 1,489 1,596 1,744 2,014 2,567 3,346 1,857 124.7% 3.3%
Penrith 1,929 2,329 2,645 3,227 4,271 5,860 3,932 203.8% 4.5%
Hawkesbury 931 1,180 1,391 1,803 2,504 3,359 2,428 260.8% 5.3%
NBMLHD 4,732 5,569 6,301 7,675 10,162 13,596 8,863 187.3% 4.3% Source: NSW Health Population Projection Series 1, 2009. Notes: AAGR: Average Annual Growth Rate.

NBMLHD Healthcare Services Plan 2012-2022
Data Reference Book DRB.11
Table 3.8 Prevalence of Diabetes among Local Government Areas based on National Diabetes Services Scheme registrants, 2000 to 2012
2000 2006 May 2012 2012 Prevalence
rating Local Government Area % of
population % of
population Number
with Diabetes
% of population
Penrith 2.6% 5.0% 10,403 6.0% Medium
Lithgow 4.0% 6.8% 1,405 7.1% High
Hawkesbury 1.8% 4.0% 2,841 4.7% Medium
Blue Mountains 2.3% 4.0% 3,419 4.6% Low Sources: The Diabetes in New South Wales Atlas 2008 Update. Notes 2000 and 2006 data compiled from people registered with diabetes and matched with Bureau of Statistics Census data from 2001 and 2006. The data contained in 2012 is derived from the National Diabetes Services Scheme (NDSS). Registrant database from September 2011 and shows people diagnosed with diabetes who are registered on the Scheme Notes: The NDSS is an initiative of the Australian Government administered by Diabetes Australia. The NDSS delivers subsidized testing strips for checking blood glucose, free insulin syringes and pen-needles, subsidized insulin pump consumables. Prevalence rating is based on percentage of residents in 2012 registered with diabetes compared with 5.7% registered for NSW.
NBMLHD Healthcare Services Plan 2012-2022
Data Reference Book DRB.12
4. Services in Nepean Blue Mountains Local Health District
Bed Profile: NBMLHD Hospitals
Nepean Hospital
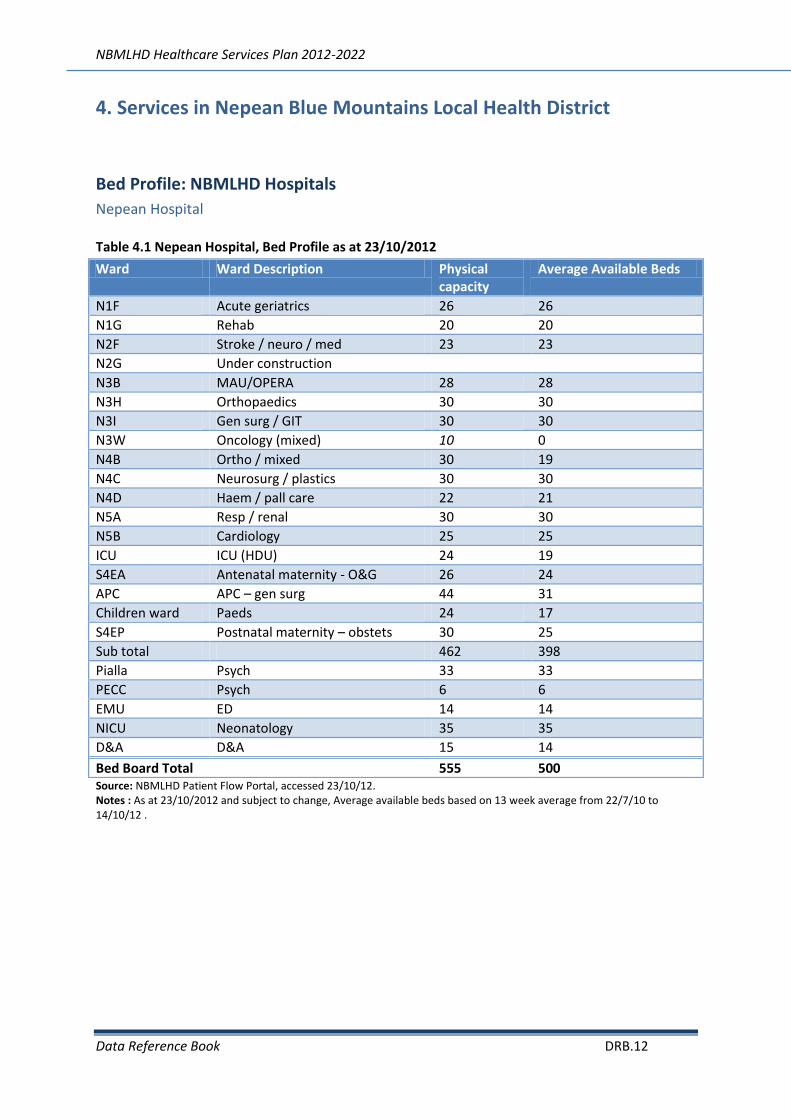
Table 4.1 Nepean Hospital, Bed Profile as at 23/10/2012
Source: NBMLHD Patient Flow Portal, accessed 23/10/12. Notes : As at 23/10/2012 and subject to change, Average available beds based on 13 week average from 22/7/10 to 14/10/12 .
Ward Ward Description Physical capacity
Average Available Beds
N1F Acute geriatrics 26 26
N1G Rehab 20 20
N2F Stroke / neuro / med 23 23
N2G Under construction
N3B MAU/OPERA 28 28
N3H Orthopaedics 30 30
N3I Gen surg / GIT 30 30
N3W Oncology (mixed) 10 0
N4B Ortho / mixed 30 19
N4C Neurosurg / plastics 30 30
N4D Haem / pall care 22 21
N5A Resp / renal 30 30
N5B Cardiology 25 25
ICU ICU (HDU) 24 19
S4EA Antenatal maternity - O&G 26 24
APC APC – gen surg 44 31
Children ward Paeds 24 17
S4EP Postnatal maternity – obstets 30 25
Sub total 462 398
Pialla Psych 33 33
PECC Psych 6 6
EMU ED 14 14
NICU Neonatology 35 35
D&A D&A 15 14
Bed Board Total 555 500

NBMLHD Healthcare Services Plan 2012-2022
Data Reference Book DRB.13
Table 4.2 Nepean Hospital - Other, Bed Profile as at 23/10/2012
Source: NBMLHD Patient Flow Portal, accessed 23/10/12. Notes : As at 23/10/2012 and subject to change, Average available beds based on 13 week average from 22/7/10 to 14/10/12.
Blue Mountains Hospital
Table 4.3 Blue Mountains Hospital, Bed Profile as at 23/10/2012
Source: NBMLHD Patient Flow Portal, accessed 23/10/12. Notes: As at 23/10/2012 and subject to change, Average available beds based on 13 week average from 22/7/10 to 14/10/12.
Ward/ Area Average Available Beds
ED spaces 37
Renal dialysis – IHU 8
Renal Dialysis – satellite 15
NCCC - Chemo 12
NCCC – linacs 2
Birthing suites 8
Operating theatres 12
Endoscopy rooms 2
Cath labs 2
Ward Ward Description Physical capacity Average Available beds
KBU Birthing unit 2 2
KCO Close Obs 4 4
KCW Children’s ward 8 4
KDO Day only 7 5
KBM East wing – gen medical 31 25
KES East wing – surgical 5 5
KMA Maternity 8 8
KMH Mental health 15 15
KPC Palliative care 2 2
KRH Rehab 22 22
KSS Extended short stay 5 5
Total 109 97
Other
ED spaces 11
Operating theatres 2
NBMLHD Healthcare Services Plan 2012-2022
Data Reference Book DRB.14
Lithgow Hospital
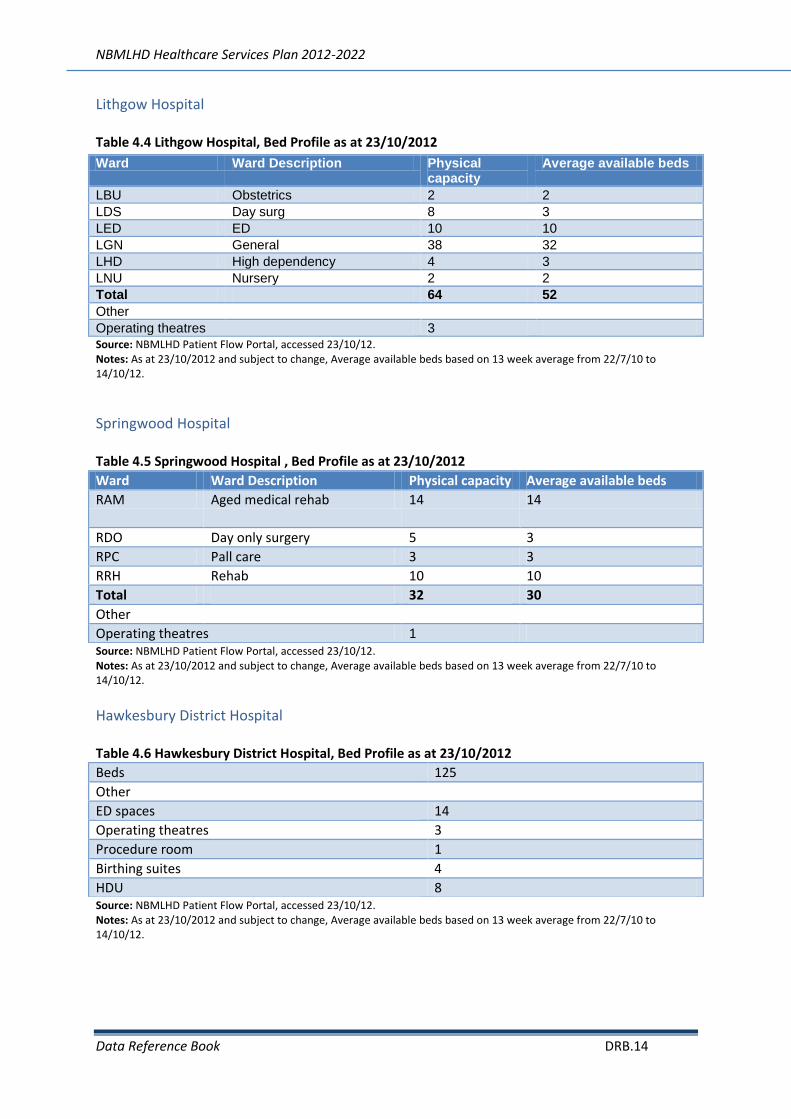
Table 4.4 Lithgow Hospital, Bed Profile as at 23/10/2012
Source: NBMLHD Patient Flow Portal, accessed 23/10/12. Notes: As at 23/10/2012 and subject to change, Average available beds based on 13 week average from 22/7/10 to 14/10/12.
Springwood Hospital
Table 4.5 Springwood Hospital , Bed Profile as at 23/10/2012
Source: NBMLHD Patient Flow Portal, accessed 23/10/12. Notes: As at 23/10/2012 and subject to change, Average available beds based on 13 week average from 22/7/10 to 14/10/12.
Hawkesbury District Hospital
Table 4.6 Hawkesbury District Hospital, Bed Profile as at 23/10/2012
Source: NBMLHD Patient Flow Portal, accessed 23/10/12. Notes: As at 23/10/2012 and subject to change, Average available beds based on 13 week average from 22/7/10 to 14/10/12.
Ward Ward Description Physical capacity
Average available beds
LBU Obstetrics 2 2
LDS Day surg 8 3
LED ED 10 10
LGN General 38 32
LHD High dependency 4 3
LNU Nursery 2 2
Total 64 52
Other
Operating theatres 3
Ward Ward Description Physical capacity Average available beds
RAM Aged medical rehab 14 14
RDO Day only surgery 5 3
RPC Pall care 3 3
RRH Rehab 10 10
Total 32 30
Other
Operating theatres 1
Beds 125
Other
ED spaces 14
Operating theatres 3
Procedure room 1
Birthing suites 4
HDU 8

NBMLHD Healthcare Services Plan 2012-2022
Data Reference Book DRB.15
Health Service Activity 2010-11: NBMLHD Hospitals
Nepean Hospital
Table 4.7 Nepean Hospital Activity, 2010/11
Source: Flowinfo v11.2, Health Information Exchange Web Nap, Bed Board. Notes: Acute and Sub-Acute inpatient activity, all ages. Excludes psychiatric (dedicated facility), renal dialysis, chemotherapy, admit and discharge from Emergency Department, unqualified neonates. Bed numbers as at October 2012. Occupancy rate as at 11/9/2012. Non-admitted patient occasions of service for 2010 calendar year. Same Day shown as percentage of total activity for same day. Overnight shown as percentage of total activity for overnight. Planned and Emergency shown as percentage of total activity within types of Adult medical, adult surgical, adult procedural, obstetrics/ babies and paediatrics <15 years. Medical, surgical, procedural activity excludes SRG Obstetrics (refer Obstetrics”). Obstetrics / babies = SRGs Obstetrics, Perinatology and Qualified neonates. Paediatrics excludes qualified and unqualified neonates and perinatology.
Average beds available 500 beds
Average occupancy rate 89.5% occupancy
Births 3,610 births
Emergency department presentations 52,360 presentations
Psychiatric dedicated facility separations 1,392 separations
Perinatology and qualified neonates 1,398 separations
Non-admitted patient services 789,623 NAPOOS
Total acute and subacute separations (all ages excluding emergency department presentations, dedicated psychiatric, renal dialysis and chemotherapy, unqualified neonates)
34,488 separations
Total cost weighted separations undiscounted 54,863 separations
Total overnight beddays 146,308 beddays
Average length of stay (overnight) 5.3 days
% Activity / Separations
Adult medical
Adult Surgical
Adult Procedural
Obstetrics/ Babies
Paediatrics <15 years
Total Separations
Same day 36% 33% 14% 12% 6% 6,880
Overnight 45% 22% 3% 22% 9% 27,608
Planned 19% 58% 57% 78% 19% 14,573
Emergency 81% 42% 43% 22% 81% 19,915

NBMLHD Healthcare Services Plan 2012-2022
Data Reference Book DRB.16
Table 4.8 Nepean Hospital: Service Related Group Activity, 2010/11
Source Flowinfo v11.2. Notes: Acute and Sub-Acute inpatient activity, all ages. Excludes psychiatric (dedicated facility), renal dialysis, chemotherapy, admit and discharge from Emergency Department, unqualified neonates. SRG “Psychiatry Acute” only includes acute separations in the main hospital and excludes separations in dedicated psychiatric facilities.
Service Related Group Activity
Obstetrics 5,422
Orthopaedics 2,587
Cardiology 2,147
Non Subspecialty Surgery 1,972
Gastroenterology 1,767
Respiratory Medicine 1,669
Non Subspecialty Medicine 1,491
Gynaecology 1,435
Urology 1,270
Neurology 1,158
Interventional Cardiology 952
Drug and Alcohol 798
Neurosurgery 794
Upper GIT Surgery 715
ENT & Head and Neck 639
Plastic and Reconstructive Surgery 617
Haematology 607
Diagnostic GI Endoscopy 562
Colorectal Surgery 422
Oncology 317
Vascular Surgery 317
Renal Medicine 307
Immunology and Infections 272
Pain Management 218
Endocrinology 208
Tracheostomy 145
Psychiatry - Acute 144
Breast Surgery 142
Rheumatology 132
Cardiothoracic Surgery 87
Dermatology 81
Dentistry 61
Unallocated 33
Ophthalmology 31
Extensive Burns 4
Grand Total 29,523
NBMLHD Healthcare Services Plan 2012-2022
Data Reference Book DRB.17
Blue Mountains District ANZAC Memorial Hospital: C2 District Group 2
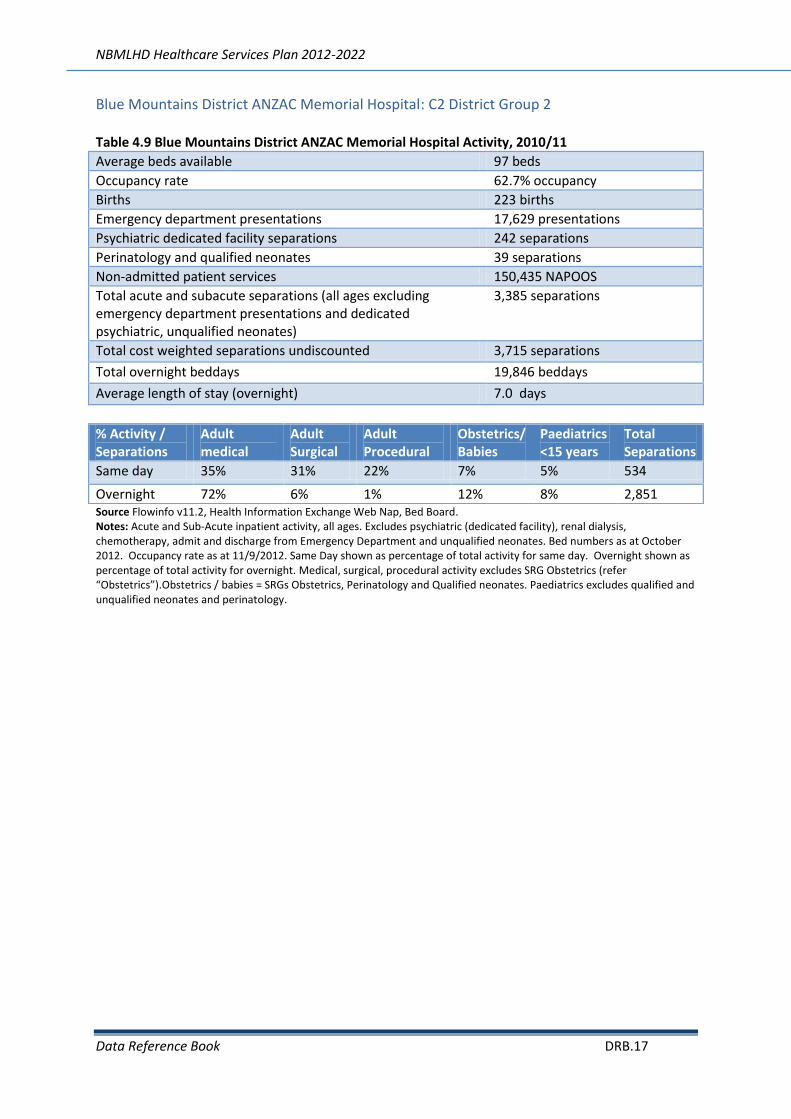
Table 4.9 Blue Mountains District ANZAC Memorial Hospital Activity, 2010/11
Average beds available 97 beds
Occupancy rate 62.7% occupancy
Births 223 births
Emergency department presentations 17,629 presentations
Psychiatric dedicated facility separations 242 separations
Perinatology and qualified neonates 39 separations
Non-admitted patient services 150,435 NAPOOS
Total acute and subacute separations (all ages excluding emergency department presentations and dedicated psychiatric, unqualified neonates)
3,385 separations
Total cost weighted separations undiscounted 3,715 separations
Total overnight beddays 19,846 beddays
Average length of stay (overnight) 7.0 days
Source Flowinfo v11.2, Health Information Exchange Web Nap, Bed Board. Notes: Acute and Sub-Acute inpatient activity, all ages. Excludes psychiatric (dedicated facility), renal dialysis, chemotherapy, admit and discharge from Emergency Department and unqualified neonates. Bed numbers as at October 2012. Occupancy rate as at 11/9/2012. Same Day shown as percentage of total activity for same day. Overnight shown as percentage of total activity for overnight. Medical, surgical, procedural activity excludes SRG Obstetrics (refer “Obstetrics”).Obstetrics / babies = SRGs Obstetrics, Perinatology and Qualified neonates. Paediatrics excludes qualified and unqualified neonates and perinatology.
% Activity / Separations
Adult medical
Adult Surgical
Adult Procedural
Obstetrics/ Babies
Paediatrics <15 years
Total Separations
Same day 35% 31% 22% 7% 5% 534
Overnight 72% 6% 1% 12% 8% 2,851

NBMLHD Healthcare Services Plan 2012-2022
Data Reference Book DRB.18
Table 4.10 Blue Mountains District ANZAC Memorial Hospital: Service Related Group Activity, 2010/11
Service Related Group Activity
Cardiology 403
Respiratory Medicine 394
Obstetrics 351
Non Subspecialty Medicine 286
Neurology 181
Gynaecology 153
Non Subspecialty Surgery 145
Gastroenterology 135
Dentistry 95
Orthopaedics 71
Upper GIT Surgery 58
Colorectal Surgery 41
Rheumatology 39
Drug and Alcohol 32
Endocrinology 31
Renal Medicine 30
Neurosurgery 28
ENT & Head and Neck 27
Vascular Surgery 26
Plastic and Reconstructive Surgery 26
Immunology and Infections 22
Oncology 22
Psychiatry - Acute 16
Haematology 15
Diagnostic GI Endoscopy 15
Urology 13
Dermatology 10
Pain Management 8
Interventional Cardiology 5
Ophthalmology 2
Breast Surgery 2
Grand Total 2,682
Source Flowinfo v11.2. Notes: Acute and Sub-Acute inpatient activity, all ages.Excludes psychiatric (dedicated facility), renal dialysis, chemotherapy, admit and discharge from Emergency Department, unqualified neonates. SRG “Psychiatry Acute” only includes acute separations in the main hospital and excludes separations in dedicated psychiatric facilities.

NBMLHD Healthcare Services Plan 2012-2022
Data Reference Book DRB.19
Springwood Hospital: D1a- Acute Community Surgery
Table 4.11 Springwood Hospital Activity, 2010/11
Average beds available 30 beds
Occupancy rate 93.7% occupancy
Total acute and subacute separations ( all ages excluding emergency department presentations, dedicated psychiatric, renal dialysis and chemotherapy)
1,352 separations
Total cost weighted separations undiscounted 697 separations
Total overnight beddays 8,885 beddays
Average length of stay (overnight) 20.5 days
Source Flowinfo v11.2, Health Information Exchange Web Nap, Bed Board. Notes: Acute and Sub-Acute inpatient activity, all ages. Excludes psychiatric (dedicated facility), renal dialysis, chemotherapy, admit and discharge from Emergency Department. Bed numbers as at October 2012. Occupancy rate as at 11/9/2012. Same Day shown as percentage of total activity for same day. Overnight shown as percentage of total activity for overnight. Medical, surgical, procedural activity excludes SRG Obstetrics (refer “Obstetrics”).Obstetrics / babies = SRGs Obstetrics, Perinatology and Qualified neonates. Paediatrics excludes qualified and unqualified neonates and perinatology.
% Activity / Separations
Adult medical
Adult Surgical
Adult Procedural
Obstetrics/ Babies
Paediatrics <15years
Total Separations
Same day 5% 82% 8% 0% 5% 918
Overnight 98% 2% 0% 0% 0% 434

NBMLHD Healthcare Services Plan 2012-2022
Data Reference Book DRB.20
Table 4.12 Springwood Hospital: Service Related Group Activity, 2010/11
Service Related Group Activity
Ophthalmology 457
Gynaecology 197
Urology 165
Breast Surgery 19
Non Subspecialty Surgery 12
ENT & Head and Neck 12
Non Subspecialty Medicine 11
Orthopaedics 9
Plastic and Reconstructive Surgery 6
Cardiology 4
Oncology 3
Neurosurgery 3
Neurology 3
Rheumatology 3
Respiratory Medicine 2
Renal Medicine 2
Psychiatry - Acute 2
Haematology 2
Vascular Surgery 2
Upper GIT Surgery 2
Gastroenterology 1
Colorectal Surgery 1
Unallocated 1
Dermatology 1
Drug and Alcohol 1
Grand Total 921
Source Flowinfo v11.2. Notes: Acute and Sub-Acute inpatient activity, all ages. Excludes psychiatric (dedicated facility), renal dialysis, chemotherapy, admit and discharge from Emergency Department, unqualified neonates. SRG “Psychiatry Acute” only includes acute separations in the main hospital and excludes separations in dedicated psychiatric facilities.

NBMLHD Healthcare Services Plan 2012-2022
Data Reference Book DRB.21
Lithgow Hospital: C2 District Group 2
Table 4.13 Lithgow Hospital Activity, 2010/11
Average beds available 42 beds
Occupancy rate 64.3% occupancy
Births 202 births
Emergency department presentations 13,476 presentations
Perinatology and qualified neonates 15 separations
Non-admitted patient services 61,254 NAPOOS
Total acute and subacute separations (all ages excluding emergency department presentations)
3,028 separations
Total cost weighted separations undiscounted 2,917 separations
Total overnight beddays 9,227 beddays
Average length of stay (overnight) 5.1 days
Source Flowinfo v11.2, Health Information Exchange Web Nap, Bed Board. Notes: Acute and Sub-Acute inpatient activity, all ages. Excludes psychiatric (dedicated facility), renal dialysis, chemotherapy, admit and discharge from Emergency Department, unqualified neonates. Bed numbers as at October 2012. Occupancy rate as at 11/9/2012. Same Day shown as percentage of total activity for same day. Overnight shown as percentage of total activity for overnight. Medical, surgical, procedural activity excludes SRG Obstetrics (refer “Obstetrics”). Obstetrics / babies = SRGs Obstetrics, Perinatology and Qualified neonates. Paediatrics excludes qualified and unqualified neonates and perinatology.
% Activity / Separations
Adult medical
Adult Surgical
Adult Procedural
Obstetrics/ Babies
Paediatrics <15 years
Total Separations
Same day 17% 36% 38% 5% 4% 1,218
Overnight 70% 7% 2% 15% 6% 1,810

NBMLHD Healthcare Services Plan 2012-2022
Data Reference Book DRB.22
Table 4.14 Lithgow Hospital Service Related Group Activity, 2010/11
Service Related Group Activity
Obstetrics 307
Diagnostic GI Endoscopy 289
Gastroenterology 287
Cardiology 241
Respiratory Medicine 236
Ophthalmology 159
Non Subspecialty Medicine 155
Gynaecology 148
Non Subspecialty Surgery 144
Urology 97
Neurology 92
Plastic and Reconstructive Surgery 84
Orthopaedics 79
ENT & Head and Neck 75
Upper GIT Surgery 50
Psychiatry - Acute 50
Drug and Alcohol 49
Neurosurgery 43
Colorectal Surgery 33
Endocrinology 29
Oncology 27
Haematology 25
Vascular Surgery 18
Rheumatology 15
Renal Medicine 12
Immunology and Infections 10
Dermatology 10
Pain Management 9
Dentistry 5
Unallocated 4
Interventional Cardiology 1
Breast Surgery 1
Extensive Burns 1
Grand Total 2,785
Source Flowinfo v11.2 Notes: Acute and Sub-Acute inpatient activity, all ages.Excludes psychiatric (dedicated facility), renal dialysis, chemotherapy, admit and discharge from Emergency Department, unqualified neonates. SRG “Psychiatry Acute” only includes acute separations in the main hospital and excludes separations in dedicated psychiatric facilities.

NBMLHD Healthcare Services Plan 2012-2022
Data Reference Book DRB.23
Hawkesbury Hospital: C1 District Group 1
Table 4.15 Hawkesbury Hospital Activity (Public), 2010/11
Average beds available 125 beds
Occupancy rate N/A
Births 748 births
Emergency department presentations 20,105 presentations
Perinatology and qualified neonates 46 separations
Total acute and subacute separations (all ages excluding emergency department presentations, unqualified neonates)
6,958 separations
Total cost weighted separations undiscounted 8,407 separations
Total overnight beddays 24,836 beddays
Average length of stay (Overnight) 4.8 days
Source Flowinfo v11.2. Notes: Acute and Sub-Acute inpatient activity, all ages. Excludes psychiatric (dedicated facility), renal dialysis, chemotherapy, admit and discharge from Emergency Department, unqualified neonates. Bed numbers as at October 2012. Same Day shown as percentage of total activity for same day. Overnight shown as percentage of total activity for overnight. Medical, surgical, procedural activity excludes SRG Obstetrics (refer “Obstetrics”). Obstetrics / babies = SRGs Obstetrics, Perinatology and Qualified neonates. Paediatrics excludes qualified and unqualified neonates and perinatology.
% Activity - Separations
Adult medical
Adult Surgical
Adult Procedural
Obstetrics/ Babies
Paediatrics <15 years
Total Separations
Same day 11% 31% 47% 7% 3% 1,766
Overnight 46% 19% 3% 19% 12% 5,192

NBMLHD Healthcare Services Plan 2012-2022
Data Reference Book DRB.24
Table 4.16 Hawkesbury Hospital (Public) Service Related Group Activity, 2010/11
Service Related Group Activity
Obstetrics 1,,065
Diagnostic GI Endoscopy 637
Gastroenterology 577
Orthopaedics 549
Respiratory Medicine 504
Non Subspecialty Surgery 433
Cardiology 408
Non Subspecialty Medicine 392
Gynaecology 348
Upper GIT Surgery 225
Colorectal Surgery 191
Urology 175
Neurology 169
Plastic and Reconstructive Surgery 104
ENT & Head and Neck 68
Oncology 48
Vascular Surgery 44
Renal Medicine 38
Endocrinology 36
Interventional Cardiology 33
Immunology and Infections 30
Neurosurgery 26
Ophthalmology 25
Rheumatology 24
Dermatology 18
Dentistry 18
Pain Management 11
Breast Surgery 11
Haematology 10
Drug and Alcohol 8
Psychiatry - Acute 6
Cardiothoracic Surgery 2
Extensive Burns 1
Grand Total 6,234
Source Flowinfo v11.2. Notes: Acute and Sub-Acute inpatient activity, all ages. Excludes psychiatric (dedicated facility), renal dialysis, chemotherapy, admit and discharge from Emergency Department, unqualified neonates. SRG “Psychiatry Acute” only includes acute separations in the main hospital and excludes separations in dedicated psychiatric facilities.

NBMLHD Healthcare Services Plan 2012-2022
Data Reference Book DRB.25
Overview of Activity in the NBMLHD
Inpatient Acute Activity, All Ages.
Table 4.17 NBMLHD Acute Hospital Supply Activity (all ages) 2006/07 - 2010/11
Source: Flowinfo v11.2. Notes: Excludes psychiatric dedicated facility, admitted and discharged within Emergency Department, chemotherapy, renal dialysis and unqualified neonates.
Hospital 2006/07 2007/08 2008/09 2009/10 2010/11
Nepean
Separations 32,072 31,993 32,383 32,613 33,731
Bed days 135,979 138,908 135,884 134,618 140,803
Cost Wt Seps Undiscounted 51,529 52,287 53,731 53,052 54,863
Hawkesbury
Separations 6,938 6,597 6,587 6,824 6,957
Bed days 27,468 25,136 25,960 24,910 26,599
Cost Wt Seps Undiscounted 8,617 7,717 7,919 7,949 8,407
Lithgow
Separations 3,797 3,741 3,385 3,010 2,962
Bed days 12,072 12,088 11,989 9,425 9,380
Cost Wt Seps Undiscounted 3,680 3,576 3,416 2,946 2,917
Blue Mountains
Separations 3,706 3,548 2,939 2,954 2,987
Bed days 13,954 13,535 12,775 12,984 13,067
Cost Wt Seps Undiscounted 4,292 4,083 3,526 3,742 3,715
Springwood
Separations 1,021 916 711 547 963
Bed days 3,749 3,207 1,913 1,439 1,678
Cost Wt Seps Undiscounted 977 879 599 477 697
Total Separations 47,534 46,795 46,005 45,948 47,600
Total Bed days 193,222 192,874 188,521 183,376 191,527
Total Cost Wt Seps Undiscounted 69,095 68,542 69,191 68,166 70,598

NBMLHD Healthcare Services Plan 2012-2022
Data Reference Book DRB.26
Adult Acute Activity (Aged 15+ Years)
Table 4.18 NBMLHD Adult Acute Separations (Age 15+ years), 2006/07 - 2010/11
Source: Flowinfo v11.2. Notes: Excludes Includes psychiatric dedicated facility, admitted and discharged within Emergency Department, chemotherapy, renal dialysis and unqualified neonates.
Paediatric Acute Activity (Aged <15 years)
Table 4.19 NBMLHD Acute Separations (Aged <15 years) 2006/07 - 2010/11
Hospital 2006/07 2007/08 2008/09 2009/10 2010/11
Nepean 4,337 4,394 4,258 4,171 4,208
Hawkesbury 867 827 688 669 723
Blue Mountains 506 463 368 293 305
Lithgow 254 300 255 198 177
Springwood 71 69 61 31 42
Total 6,035 6,053 5,630 5,362 5,455
Source: Flowinfo v11.2. Notes: Excludes psychiatric dedicated facility, admitted and discharged within Emergency Department, chemotherapy, renal dialysis and unqualified neonates.
Hospital 2006/07 2007/08 2008/09 2009/10 2010/11
Nepean 27,735 27,599 28,125 28,442 29,523
Hawkesbury 6,071 5,770 5,899 6,155 6,234
Lithgow 3,543 3,441 3,130 2,812 2,785
Blue Mountains 3,200 3,085 2,571 2,661 2,682
Springwood 950 847 650 516 921
Total 41,499 40,742 40,375 40,586 42,145

NBMLHD Healthcare Services Plan 2012-2022
Data Reference Book DRB.27
Cost Weighted Separations (Overnight, Acute, All Ages)
Table 4.20 Average Acute Overnight Cost Weighted Separations (Undiscounted) in NBMLHD Hospitals, 2006/07 to 2010/11
Source: Flowinfo v11.2.. Notes: Excludes psychiatric dedicated facility, admitted and discharged within Emergency Department, chemotherapy,
renal dialysis and unqualified neonates.
Hospital 2006/07 2007/08 2008/09 2009/10 2010/11
Nepean 1.9 1.9 2.0 1.9 1.9
Hawkesbury 1.5 1.4 1.5 1.4 1.5
Blue Mountains 1.3 1.3 1.3 1.4 1.4
Lithgow 1.3 1.3 1.3 1.3 1.3

NBMLHD Healthcare Services Plan 2012-2022
Data Reference Book DRB.28
Mental Health Inpatient Acute Activity Table 4.21 Mental Health Acute Inpatient Activity in Dedicated Mental Health Units, NBMLHD, 2006/07 to 2010/11
Source: Flowinfo v11.2. Notes : Excludes admit and discharge from ED, acute and Sub-Acute inpatient activity.
Hospital 2006/07 2007/08 2008/09 2009/10 2010/11
Nepean
Separations 1,102 1,506 1,364 1,196 1,392
Beddays 12,579 13,654 13,826 13,152 13,708
Blue Mountains
Separations 334 363 366 192 242
Beddays 4,910 5,052 4,984 4,032 4,475
Total Separations 1,436 1,869 1,730 1,388 1,634
Total Beddays 17,489 18,706 18,810 17,184 18,183

NBMLHD Healthcare Services Plan 2012-2022
Data Reference Book DRB.29
Perinatology and Qualified Neonates Table 4.22 NBMLHD Hospital Supply Activity for Perinatology and Qualified Neonate 2006/07 - 2010/11
Source: Flowinfo v11.2. Notes: Activity - acute, all ages for the service related groups of Perinatology and Qualified Neonates only. Excludes admit and discharge from Emergency Department, dedicated psychiatric facility.
Hospital 2006/07 2007/08 2008/09 2009/10 2010/11
Nepean
Separations 1,391 1,275 1,366 1,366 1,398
Bed days 12,912 11,922 12,010 11,770 11,321
Cost Wt Seps Undiscounted 3,817 4,010 4,387 4,280 3,893
Hawkesbury
Separations 41 46 42 40 46
Bed days 420 343 273 396 447
Cost Wt Seps Undiscounted 85 94 84 91 95
Blue Mountains
Separations 38 32 30 20 39
Bed days 290 198 141 112 257
Cost Wt Seps Undiscounted 59 48 50 29 60
Lithgow
Separations 16 24 16 12 15
Bed days 71 53 52 67 58
Cost Wt Seps Undiscounted 25 18 23 13 16
Total Separations 1,486 1,377 1,454 1,438 1,498
Total Bed days 13,693 12,516 12,476 12,345 12,083
Total Cost Wt Seps Undiscounted 3,987 4,170 4,544 4,413 4,064

NBMLHD Healthcare Services Plan 2012-2022
Data Reference Book DRB.30
Adult Sub-Acute Activity Table 4.23 Adult Sub-Acute Inpatient Activity in NBMLHD Facilities, 2006/07 to 2010/11
Source: Flowinfo v11.2. Notes: Includes psychiatric dedicated facility. Excludes admitted and discharged within Emergency Department, chemotherapy, renal dialysis and unqualified neonates.
Hospitals 2006/07 2007/08 2008/09 2009/10 2010/11
Nepean
Separations 708 641 839 794 757
Beddays 12,530 11,379 12,245 12,298 12,385
ALOS 17.7 17.8 14.6 15.5 16.4
Blue Mountains
Separations 451 474 414 303 398
Beddays 7,473 7,900 7,310 5,507 7,313
ALOS 16.6 16.7 17.7 18.2 18.4
Springwood
Separations 285 323 319 320 389
Beddays 5,963 7,001 7,538 7,857 8,125
ALOS 20.9 21.7 23.6 24.6 20.9
Lithgow
Separations 11 11 35 50 66
Beddays 130 269 594 714 1,065
ALOS 11.8 24.5 17 14.3 16.1
Hawkesbury
Separations 6 1 2 1 1
Beddays 126 14 13 15 3
ALOS 21 14 6.5 15 3
Total Separations 1,461 1,450 1,609 1,468 1,611
Total Beddays 26,222 26,563 27,700 26,391 28,891
ALOS 17.9 18.3 17.2 18 17.9
NBMLHD Healthcare Services Plan 2012-2022
Data Reference Book DRB.31
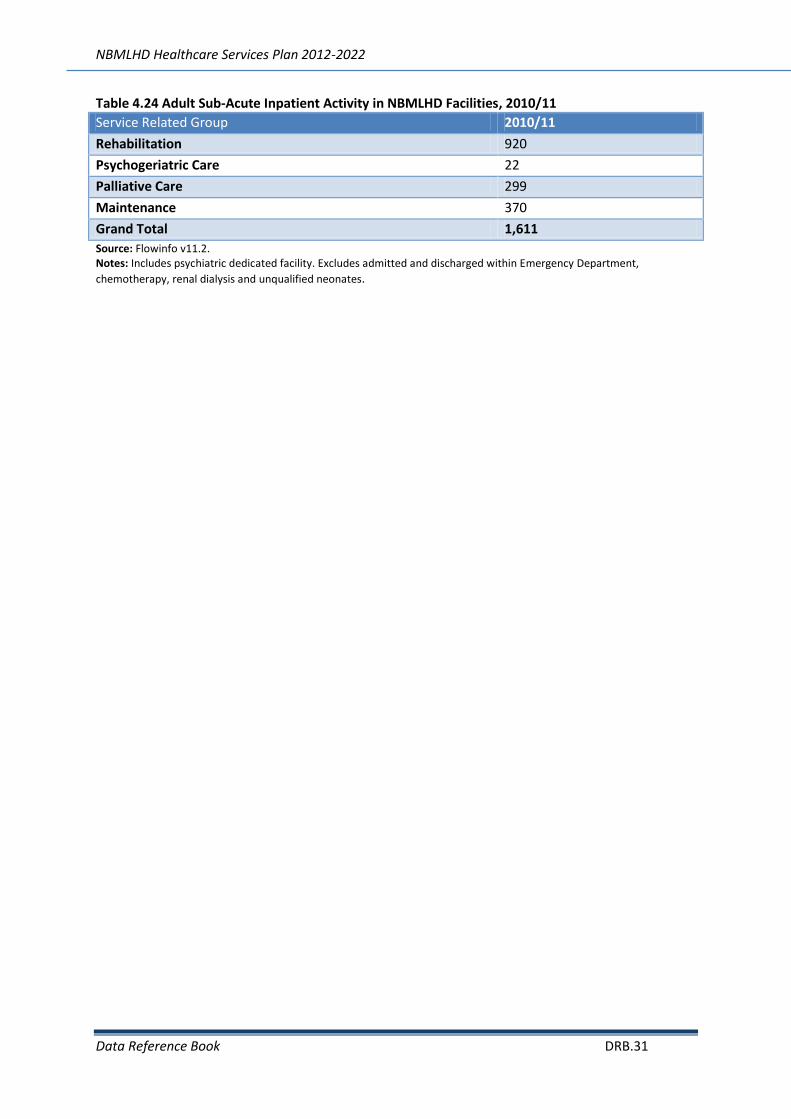
Table 4.24 Adult Sub-Acute Inpatient Activity in NBMLHD Facilities, 2010/11
Service Related Group 2010/11
Rehabilitation 920
Psychogeriatric Care 22
Palliative Care 299
Maintenance 370
Grand Total 1,611
Source: Flowinfo v11.2. Notes: Includes psychiatric dedicated facility. Excludes admitted and discharged within Emergency Department,
chemotherapy, renal dialysis and unqualified neonates.

NBMLHD Healthcare Services Plan 2012-2022
Data Reference Book DRB.32
Outpatient Activity
Table 4.25 Non-Admitted Patient Occasions of Service in NBMLHD, 2010/11
Source: Non-Admitted Patient Occasions of Service, NBMLHD, November 2012.
Hospital 2010 2011
Nepean Hospital 389,688 789,623
Blue Mountains Hospital 92,251 150,435
Lithgow Hospital 30,378 61,254
Total 512,317 1,001,312

NBMLHD Healthcare Services Plan 2012-2022
Data Reference Book DRB.33
Private Hospital Services Provided for Residents of the NBMLHD Table 4.26 NBMLHD Resident Demand by Public and Private Hospital 2006/07 - 2010/11 (all ages)
Hospital 2006/07 2007/08 2008/09 2009/10 2010/11
Public
Separations 50,618 50,373 49,565 49,464 50,890
Beddays 201,221 202,065 197,708 191,398 198,215
Cost Wt Seps Undisc 74,919 75,434 75,143 74,129 76,483
Private Hospitals
Separations 23,656 25,535 25,847 26,354 27,554
Beddays 57,191 58,621 57,868 58,220 61,399
Cost Wt Seps Undisc 28,545 30,024 30,564 31,267 32,404
Private Day Procedures
Separations 2,962 3,028 2,938 3,369 3,291
Beddays 2,962 3,028 2,938 3,369 3,295
Cost Wt Seps Undisc 2,366 2,452 2,329 2,678 2,759
Total Private activity
Separations 26,618 28,563 28,785 29,723 30,845
Beddays 60,153 61,649 60,806 61,589 64,694
Cost Wt Seps Undisc 30,911 32,477 32,894 33,945 35,163
Grand Total
Separations 77,236 78,936 78,350 79,187 81,735
Beddays 261,374 263,714 258,514 252,987 262,909
Cost Wt Seps Undisc 105,830 107,911 108,037 108,074 111,646
Source: Flowinfo v11.2. Notes : Excludes Admit and discharge from Emergency Department, renal dialysis, chemotherapy, unqualified neonates, dedicated psychiatric facility.

NBMLHD Healthcare Services Plan 2012-2022
Data Reference Book DRB.34
Table 4.27 Top Service Related Groups for NBMLHD Residents in Private Hospitals (acute, all ages) in 2010/11
Source: Flowinfo v11.2. Notes : Excludes Admit and discharge from Emergency Department, renal dialysis, chemotherapy, unqualified neonates, dedicated psychiatric facility.
Service Related Group Separations Beddays Cost Weighted Separations Undiscounted
Orthopaedics 4,529 10,738 7,653
Diagnostic GI Endoscopy 3,564 3,719 1,252
Gastroenterology 2,137 2,978 1,150
Non Subspecialty Surgery 1,626 3,363 1,966
ENT & Head and Neck 1,614 1,757 1,545
Urology 1,548 2,772 1,782
Gynaecology 1,538 2,707 1,632
Obstetrics 1,389 6,069 1,529
Plastic and Reconstructive Surgery 1,248 2,463 1,436
Ophthalmology 1,168 1,235 812
Dentistry 1,159 1,173 891
Other SRGs 6,034 22,425 10,757
Grand Total 27,554 61,399 32,404

NBMLHD Healthcare Services Plan 2012-2022
Data Reference Book DRB.35
Primary Care and Community Health Table 4.28 Primary Care and Community Health Activity in NBMLHD from 2007 to 2012
Source: Community Health Information Management Enterprise, November 2012.
2007 2008 2009 2010 2011 2012
Service contacts 15265 96849 112052 75785 130130 65441
Hours allocated 19,076.5 225,043.5 293,096.4 167,764.7 194,863.3 92,599.3

NBMLHD Healthcare Services Plan 2012-2022
Data Reference Book DRB.36
Mental Health Services Figure 4.29 Ambulatory Mental Health Service Activity in NBMLHD from 20007/08- 2011/12
Hospital 2007/08 2008/09 2009/10 2010/11 2011/12
Contacts 76,524 56,330 64,935 73,859 77,802
Hours 65,013 52,081 60,366 67,154 76,495
Source: Non-Admitted Patient Occasions of Service, NBMLHD, November 2012.
Oral Health Services Table 4.30 Oral Health Services in NBMLHD on 5 November 2012
*Average chairs operational at Nepean on 5 November, 2012. It is noted that up to 20 chairs are in operation, at least once per week, when students are placed at Nepean Oral Health Centre.
Facility Number of Chairs, 2012
Nepean 13* (capacity for 32)
Hawkesbury 5
Katoomba 4
Springwood 2
Lithgow 2
Total 26

NBMLHD Healthcare Services Plan 2012-2022
Data Reference Book DRB.37
Medicare Local and General Practitioners Table 4.31 Information on General Practitioners in the Nepean Blue Mountains
Sources: 1. http://www.abs.gov.au, 2. PHCRIS Benchmarking Tool) http://www.phcris.org.au .
LGA Penrith LGA Hawkesbury LGA Blue Mountains LGA
Lithgow LGA Total
Estimated resident population 20101
186,221 64,030 77,943 21,094 349,228
GP Numbers
Raw Number 186 65 68 23 342
FTE 135 40 (Estimate) 61 22 (Estimate) 258
Number of Practices 75 22 25 6 128
FWE GP to population ratio2
<1000 >1600 (Estimate) 1300 to 1449 1150 to 1299 N/A
Land area 407 km2 2,776 km2 1,432 km
2 4,551 km
2 9,190 km2
National Park N/A 1,960 km2 1,000 km
2 3,049 km
2 6,069 km2
% national park of total land area
70% of total land area
74% of total land area
67% of total land area
66% of total land area
Distance from Sydney GPO
35 – 55 km 50 – 100 kms 55-95 kms 140 kms 35 -140 kms
Geography Nepean River border with Blue Mountains LGA
Mountain border with Blue Mountains LGA
Mountain border with Hawkesbury and Lithgow LGA
Mountain border with Blue Mountains LGA
N/A
Remoteness Classification ASGS
Major Cities / Inner Regional
Major Cities / Inner Regional
Major Cities / Inner Regional
Inner Regional Major Cities / Inner Regional
Classification by Local City Council
Residential and rural municipality
Residential, and rural municipality
Residential, resort and rural municipality
Residential and rural area.
Regional and rural
Aboriginal Population
4,263 1,213 986 646 7,108

NBMLHD Healthcare Services Plan 2012-2022
Data Reference Book DRB.38
Residential Aged Care Facilities Table 4.32 Operational Nursing Home Places at 30 June 2011
Source: Nepean Blue Mountains Medicare Local Needs Assessment Report, p13.
LGA Service Name High Care
Low Care
Total Beds
Blue Mountains Anita Villa Care Facility 102 0
BCS Morven Gardens Centre 0 62 62
Bodington 68 52 120
Buckland 73 71 144
Endeavour Residential Aged Care Facility 68 0 68
Martyn Claver Nursing Home 46 0 46
The Ritz Nursing Home 148 0 148
Uniting Care Springwood Village 37 97 134
Blue Mountains Total 542 282 824
Hawkesbury Chesalon Care Richmond 60 0 60
Fitzgerald Memorial Aged Care Facility Limited 0 48 48
Kurrajong and District Community Nursing Home 30 0 30
Richmond Community and RSL Nursing Home 93 7 100
Uniting Care Hawkesbury Village 52 82 134
Hawkesbury Total 235 137 372
Lithgow Cooinda Aged People’s Home 0 47 47
Tabulam (Portland Tabulam Health Centre) 0 22 22
Tanderra Nursing Home 42 6 48
Three Tree lodge 0 54 54
Lithgow Total 42 129 171
Penrith East Emmaus Village 0 64 64
Kingswood Court Aged Care Facility 67 10 77
St Marys Gardens 92 28 261
Penrith East Total 159 102 261
Penrith West Edinglassie Lodge 0 65 65
Governor Phillip Manor 80 0 80
Henry Fulton Nursing Home 40 0 40
Jamison Gardens 55 40 95
Lemongrove gardens Hostel 0 46 46
Mountainview Nursing Home 99 0 99
Uniting Care Edinglassie Village 49 77 126
Penrith West Total 323 228 551
Grand Total 1,301 878 2,179

NBMLHD Healthcare Services Plan 2012-2022
Data Reference Book DRB.39
5. Inflows and Outflows
Inflows, Outflows and Netflows Table 5. 1 Inflow and Outflow Profile of NBMLHD from 2006/07 to 2010/11: Acute Inpatient Separations
Source: Flowinfo v11.2. Notes: Excludes admit and discharge from Emergency Department, renal dialysis, chemotherapy, dedicated psychiatric facility .
2006/07 2007/08 2008/09 2009/10 2010/11
Inflows Total 8,593 8,705 8,533 8,753 9,375
Outflows
To Childrens Hosp Westmead 2,066 2,226 2,252 2,667 2,450
To other LHD Hosps 9,597 10,038 9,834 9,589 10,210
Total 11,663 12,264 12,086 12,256 12,660
Netflows Total -3,070 -3,559 -3,553 -3,503 -3,285
Netflows Total excludes CHW -1,004 -1,333 -1,301 -836 -835
Private Total 26,618 28,563 28,785 29,723 30,845

NBMLHD Healthcare Services Plan 2012-2022
Data Reference Book DRB.40
Inflows of Patients from outside of Nepean Blue Mountains Local Health District
Acute care (all ages)
Table 5.2 Inflow Activity by Nepean Blue Mountains Local Health District Hospitals (Acute Inpatient Care), 2006/07 to 2010/11
Source: Flowinfo v11.2. Notes: Excludes admit and discharge from Emergency Department, renal dialysis, chemotherapy, dedicated psychiatric facility .
Hospitals 2006/07 2007/08 2008/09 2009/10 2010/11
Nepean
Separations 6,514 6,581 6,656 6,766 7,237
Bed days(LOS days) 29,022 30,607 29,347 30,836 32,059
Cost Wt Seps Undiscounted 11,697.05 12,134.73 12,168.52 12,551.82 13,088.75
Hawkesbury
Separations 1,364 1,336 1,261 1,409 1,555
Bed days(LOS days) 5,395 4,838 4,727 4,892 5,428
Cost Wt Seps Undiscounted 1,707.3 1,543.4 1,534.1 1,606.96 1,818.4
Lithgow
Separations 372 466 359 317 256
Bed days(LOS days) 763 780 674 553 428
Cost Wt Seps Undiscounted 305.9 360.3 305.9 273.9 205.6
Blue Mountains
Separations 221 163 148 151 169
Bed days(LOS days) 735 513 504 505 705
Cost Wt Seps Undiscounted 247.0 176.6 153 174.9 219.1
Springwood
Separations 122 159 109 109 158
Bed days(LOS days) 305 277 177 284 372
Cost Wt Seps Undiscounted 95.5 118 78.8 88.2 124.6
Total
Separations 8,593 8,705 8,533 8,752 9,375
Bed days(LOS days) 36,220 37,015 35,429 37,070 38,992
Cost Wt Seps Undiscounted 14,052.9 14,333.2 14,240.4 14,695.9 15,456.5

NBMLHD Healthcare Services Plan 2012-2022
Data Reference Book DRB.41
Table 5.3 Top Local Government Areas for Inflows to NBMLHD Hospitals, 2010/11 for Acute Inpatients
Source: Flowinfo v11.2. Notes: Excludes admit and discharge from Emergency Department, renal dialysis, chemotherapy, dedicated psychiatric facility .
LGA 2010/11
Blacktown 4,984
Wollondilly 547
Baulkham Hills 533
Liverpool 293
Bathurst 252
Mid-Western 189
Parramatta 183
Holroyd 143
Overseas 137
Blayney + Oberon 97
Other LGAs 2,017
Grand Total 9,375

NBMLHD Healthcare Services Plan 2012-2022
Data Reference Book DRB.42
Table 5.4 Service Related Group Inflows to NBMLHD Hospitals in 2010/11
Source: Flowinfo v11.2. Notes: Excludes admit and discharge from Emergency Department, renal dialysis, chemotherapy, dedicated psychiatric facility .
Service Related Group Separations Bed days Cost Wt Seps Undis.
Obstetrics 1,885 6,113 1,974
Orthopaedics 876 4,585 1,741
Non Subspecialty Surgery 507 1,741 698
Respiratory Medicine 491 2,595 787
Gastroenterology 469 1,338 470
Gynaecology 459 755 394
Drug and Alcohol 435 2,023 455
Cardiology 431 1,306 435
ENT & Head and Neck 399 536 325
Urology 395 787 451
Non Subspecialty Medicine 388 2,223 625
Qualified Neonate 324 1,349 373
Diagnostic GI Endoscopy 247 434 146
Neurology 228 1,096 370
Neurosurgery 221 1,432 665
Interventional Cardiology 215 719 403
Upper GIT Surgery 203 815 477
Perinatology 177 3,323 1,477
Plastic and Reconstructive Surgery 170 477 233
Colorectal Surgery 135 661 340
Haematology 87 433 158
Ophthalmology 87 104 59
Immunology and Infections 86 237 72
Oncology 67 521 112
Renal Medicine 56 454 116
Endocrinology 53 307 91
Vascular Surgery 53 333 154
Tracheostomy 51 1,531 1,547
Pain Management 51 126 34
Breast Surgery 25 34 27
Psychiatry - Acute 24 53 32
Cardiothoracic Surgery 24 188 114
Dentistry 17 26 14
Dermatology 16 37 14
Rheumatology 11 49 16
Unallocated 10 249 56
Extensive Burns 2 2 1
Grand Total 9,375 38,992 15,457

NBMLHD Healthcare Services Plan 2012-2022
Data Reference Book DRB.43
Perinatology and Qualified Neonates
Table 5.5 NBMLHD Hospital Acute Supply Activity for Perinatology and Qualified Neonates 2006/07 to 2010/11
Hospital 2006/07 2007/08 2008/09 2009/10 2010/11
Nepean
Separations 1,391 1,275 1,366 1,366 1,398
Bed days 12,912 11,922 12,010 11,770 11,321
Cost Wt Seps Undiscounted 3,817 4,010 4,387 4,280 3,893
Hawkesbury
Separations 41 46 42 40 46
Bed days 420 343 273 396 447
Cost Wt Seps Undiscounted 85 94 84 91 95
Blue Mountains
Separations 38 32 30 20 39
Bed days 290 198 141 112 257
Cost Wt Seps Undiscounted 59 48 50 29 60
Lithgow
Separations 16 24 16 12 15
Bed days 71 53 52 67 58
Cost Wt Seps Undiscounted 25 18 23 13 16
Total
Separations 1,486 1,377 1,454 1,438 1,498
Bed days 13,693 12,516 12,476 12,345 12,083
Cost Wt Seps Undiscounted 3,987 4,170 4,544 4,413 4,064
Source: Flowinfo v11.2. Notes: Excludes admit and discharge from Emergency Department, renal dialysis, chemotherapy, dedicated psychiatric facility .Activity - acute, all ages for the SRGs of Perinatology and Qualified Neonates only.

NBMLHD Healthcare Services Plan 2012-2022
Data Reference Book DRB.44
Table 5.6 Top Inflow LGAs to Nepean Hospital for Perinatology and Qualified Neonate Activity, 2006/07 to 2010/11
Source: Flowinfo v11.2. Notes: Excludes admit and discharge from Emergency Department, renal dialysis, chemotherapy, dedicated psychiatric facility. Activity - acute, all ages for the SRGs of Perinatology and Qualified Neonates only.
LGA 2006/07 2007/08 2008/09 2009/10 2010/11
Nepean Blue Mountains
Separations 959 838 921 926 906
Bed days 8,479 7,082 7,703 7,251 6,746
Cost Wt Seps Undiscounted 2,179.3 1,948.6 2,530.6 2,361.9 2,058.8
Western Sydney
Separations 287 285 307 306 341
Bed days 2,280 2,339 2,204 2,874 2,445
Cost Wt Seps Undiscounted 766.5 854.8 763.8 1,050.7 1,054.7
Western
Separations 43 56 44 58 50
Bed days 963 994 680 856 868
Cost Wt Seps Undiscounted 370.4 362.3 341.5 444.7 297.3
South Western Sydney
Separations 64 43 45 32 47
Bed days 652 495 380 308 386
Cost Wt Seps Undiscounted 206.2 256.7 152.2 158.9 140.1
Other LGAs
Separations 38 53 49 44 54
Bed days 538 1012 1043 481 876
Cost Wt Seps Undiscounted 294.6 587.3 599.1 263.5 342.3
Total Separations 1,391 1,275 1,366 1,366 1,398
Total Bed days 12,912 11,922 12,010 11,770 11,321
Total Cost Wt Seps Undiscounted 3,817.4 4,009.7 4,387.3 4,280.1 3,893.2

NBMLHD Healthcare Services Plan 2012-2022
Data Reference Book DRB.45
Mental Health Care
Table 5.7 NBMLHD Mental Health (Dedicated Psychiatric Facilities) Activity (all ages), 2006/07 to 2010/11
2006/07 2007/08 2008/09 2009/10 2010/11
NBMLHD LGAs
Separations 1,300 1,653 1,478 1,172 1,375
Beddays 15,856 16,418 16,526 15,133 15,941
Inflow LGAs
Separations 136 216 252 216 259
Beddays 1,633 2,288 2,284 2,051 2,242
Total Separations 1,436 1,869 1,730 1,388 1,634
Total Beddays 17,489 18,706 18,810 17,184 18,183
% inflows Separations 9% 12% 15% 16% 16%
Source: Flowinfo v11.2. Notes: Excludes admit and discharge from Emergency Department.

NBMLHD Healthcare Services Plan 2012-2022
Data Reference Book DRB.46
Sub-Acute Patient Care
Table 5.8 NBMLHD Hospital Supply for Sub-Acute Activity (all ages), 2006/07 - 2010/11
Hospital 2006/07 2007/08 2008/09 2009/10 2010/11
Nepean
Separations 708 641 839 794 757
Beddays 12,530 11,379 12,245 12,298 12,385
ALOS 17.7 17.8 14.6 15.5 16.4
Blue Mountains
Separations 451 474 414 303 398
Beddays 7,473 7,900 7,310 5,507 7,313
ALOS 16.6 16.7 17.7 18.2 18.4
Springwood
Separations 285 323 319 320 389
Beddays 5,963 7,001 7,538 7,857 8,125
ALOS 20.9 21.7 23.6 24.6 20.9
Lithgow
Separations 11 11 35 50 66
Beddays 130 269 594 714 1,065
ALOS 11.8 24.5 17.0 14.3 16.1
Hawkesbury
Separations 6 1 2 1 1
Beddays 126 14 13 15 3
ALOS 21.0 14.0 6.5 15.0 3.0
Total
Separations 1,461 1,450 1,609 1,468 1,611
Beddays 26,222 26,563 27,700 26,391 28,891
ALOS 17.9 18.3 17.2 18.0 17.9
Source: Flowinfo v11.2. Notes: Excludes admit and discharge from Emergency Department, renal dialysis, chemotherapy, dedicated psychiatric facility . ALOS = DO+ON beddays noting most activity is overnight.

NBMLHD Healthcare Services Plan 2012-2022
Data Reference Book DRB.47
Table 5.9 Top Inflow LGAs for Sub-Acute Activity in NBMLHD Hospitals 2006/07 to 2010/11
Inflow LGAs 2006/07 2007/08 2008/09 2009/10 2010/11
Western Sydney
Separations 53 63 80 94 98
Beddays 1,047 1,581 1,463 1,545 1,562
South Western Sydney
Separations 14 25 22 22 22
Beddays 346 389 291 318 434
Other LGAs
Separations 36 20 34 29 51
Beddays 628 365 1,006 774 808
Total Inflows
Separations 103 108 136 145 171
Beddays 2,021 2,335 2,760 2,637 2,804 Source: Flowinfo v11.2. Notes: Sub-Acute activity, all ages. Excludes admit and discharge from Emergency Department, renal dialysis, chemotherapy, dedicated psychiatric facility .

NBMLHD Healthcare Services Plan 2012-2022
Data Reference Book DRB.48
Outflows of Residents of Nepean Blue Mountains Local Health District to Other Hospitals
Adult Acute Inpatient Care (aged 15+ years)
Table 5.10 NBMLHD Adult Resident Demand for Acute Activity by Hospital, 2006/07 to 2010/11
Hospital 2006/07 2007/08 2008/09 2009/10 2010/11
Nepean
Separations 22,077 21,936 22,328 22,547 23,177
Bed days 93,790 96,108 94,159 92,091 97,520
Cost Wt Seps Undiscounted 35,398 35,823 36,813 36,041 37,569
Hawkesbury
Separations 4,829 4,590 4,761 4,858 4,805
Bed days 20,273 18,780 19,986 18,652 19,654
Cost Wt Seps Undiscounted 6,227 5,538 5,848 5,795 5,988
Lithgow
Separations 3,208 3,027 2,805 2,532 2,567
Bed days 10,880 10,876 10,951 8,575 8,688
Cost Wt Seps Undiscounted 3,186 3,015 2,922 2,539 2,600
Blue Mountains
Separations 3,000 2,943 2,439 2,528 2,528
Bed days 12,013 12,079 11,379 11,843 11,516
Cost Wt Seps Undiscounted 3,604 3,521 3,037 3,319 3,207
Springwood
Separations 842 703 555 414 773
Bed days 3,387 2,876 1,689 1,131 1,274
Cost Wt Seps Undiscounted 854 732 498 377 556
NBMLD total
Separations 33,956 33,199 32,888 32,879 33,850
Bed days 140,343 140,719 138,164 132,292 138,652
Cost Wt Seps Undiscounted 49,269 48,629 49,117 48,072 49,920
Other Hospitals (outflows)
Separations 9,026 9,362 9,136 9,017 9,384
Bed days 35,349 36,824 35,098 34,582 35,401
Cost Wt Seps Undiscounted 16,000 17,005 15,705 16,066 16,815
Total
Separations 42,982 42,561 42,024 41,896 43,234
Bed days 175,692 177,543 173,262 166,874 174,053
Cost Wt Seps Undiscounted 65,269 65,634 64,822 64,138 66,734
Source: Flowinfo v11.2. Notes: Excludes admit and discharge from Emergency Department, renal dialysis, chemotherapy, qualified and unqualified neonates, dedicated psychiatric facility.

NBMLHD Healthcare Services Plan 2012-2022
Data Reference Book DRB.49
Table 5.11 NBMLHD Adult Resident Public Demand from 2006/07 to 2010/11
Adult Demand 2006/07 2007/08 2008/09 2009/10 2010/11
NBMLHD Hospitals 33,956 33,199 32,888 32,879 33,850
Total Resident Demand 42,982 42,561 42,024 41,896 43,234
Self-sufficiency 79% 78% 78% 78% 78%
Source: Flowinfo v11.2. Notes: Excludes admit and discharge from Emergency Department, renal dialysis, chemotherapy, qualified and unqualified neonates, dedicated psychiatric facility.
Table 5.12 Outflow Separations for Adult Acute Inpatient Activity by LGA (Age >15 Years), 2006/07 to 2010/11
LGA 2006/07 2007/08 2008/09 2009/10 2010/11
Penrith 5,182 5,304 5,352 5,227 5,559
Hawkesbury 1,572 1,660 1,568 1,589 1,545
Blue Mountains 1,479 1,511 1,475 1,478 1,554
Lithgow 793 888 741 723 726
Total 9,026 9,363 9,136 9,017 9,384
Source: Flowinfo v11.2. Notes: Excludes admit and discharge from Emergency Department, renal dialysis, chemotherapy, qualified and unqualified neonates, dedicated psychiatric facility.
Table 5.13 Outflows by Service Related Group for Adult Acute Inpatient Activity (Aged > 15 years), 2006/07 to 2010/11
Service Related Group 2006/07 2007/08 2008/09 2009/10 2010/11
Orthopaedics 809 825 875 914 1,217
Non Subspecialty Surgery 637 660 662 672 701
Cardiology 571 611 489 600 586
Gastroenterology 477 459 430 460 441
Renal Medicine 452 424 523 390 374
Interventional Cardiology 412 568 400 396 346
Gynaecology 430 411 425 358 406
Obstetrics 436 422 426 316 318
Plastic and Reconstructive Surgery 323 367 385 393 435
Non Subspecialty Medicine 389 412 345 369 345
Diagnostic GI Endoscopy 318 422 393 372 353
Respiratory Medicine 302 363 364 334 352
Neurology 220 279 351 390 434
Ophthalmology 352 299 351 325 315
Urology 343 309 316 298 262
Vascular Surgery 265 254 250 235 269
Source: Flowinfo v11.2. Notes: Excludes admit and discharge from Emergency Department, renal dialysis, chemotherapy, qualified and unqualified neonates, dedicated psychiatric facility.

NBMLHD Healthcare Services Plan 2012-2022
Data Reference Book DRB.50
Private Demand (adults aged 15+ years)
Table 5.14 NBMLHD Adult Resident Demand for Public and Private Acute Activity, 2006/07 to 2010/11
NBMLHD Demand 2006/07 2007/08 2008/09 2009/10 2010/11
Public Demand
Separations 42,982 42,561 42,024 41,896 43,234
Bed days 175,692 177,543 173,262 166,874 174,053
Cost Wt Seps Undiscounted 65,269 65,634 64,822 64,138 66,734
Private Demand
Separations 25,367 27,102 27,399 28,411 29,227
Bed days 57,704 58,938 58,420 59,176 61,925
Cost Wt Seps Undiscounted 29,814 31,231 31,759 32,830 33,843
Total Public and Private Demand
Separations 68,349 69,663 69,423 70,307 72,461
Bed days 233,396 236,481 231,682 226,050 235,978
Cost Wt Seps Undiscounted 95,083 96,866 96,581 96,968 100,577
Source: Flowinfo v11.2. Notes: Excludes admit and discharge from Emergency Department, renal dialysis, chemotherapy, qualified and unqualified neonates, dedicated psychiatric facility.
Table 5.15 NBMLHD Adult Resident Demand by LGA for Public and Private Acute Activity, 2010/11
LGA Private Public
Penrith 12,998 23,220
Blue Mountains 7,324 9,009
Hawkesbury 6,682 7,286
Lithgow 2,223 3,722
Total 29227 43,237 Source: Flowinfo v11.2. Notes: Excludes admit and discharge from Emergency Department, renal dialysis, chemotherapy, qualified and unqualified neonates, dedicated psychiatric facility.

NBMLHD Healthcare Services Plan 2012-2022
Data Reference Book DRB.51
Paediatric Acute Inpatient Care (aged <15 years)
Table 5. 16 NBMLHD Paediatric Resident Demand by Hospital (Aged < 15 years), 2006/07 to 2010/11
Hospital 2006/07 2007/08 2008/09 2009/10 2010/11
Nepean
Separations 2,522 2,638 2,478 2,374 2,411
Bed days 4,688 5,111 4,675 4,440 4,478
Cost Wt Seps Undiscounted 2,254 2,381 2,219 2,097 2,146
Hawkesbury
Separations 706 634 531 522 559
Bed days 1,396 1,293 1,045 1,008 1,165
Cost Wt Seps Undiscounted 599 570 474 465 521
Blue Mountains
Separations 448 411 322 255 251
Bed days 919 748 751 524 589
Cost Wt Seps Undiscounted 384 338 286 219 229
Lithgow
Separations 203 225 205 149 125
Bed days 366 380 312 230 208
Cost Wt Seps Undiscounted 165 184 165 120 97
Springwood
Separations 57 54 47 24 32
Bed days 57 54 47 24 32
Cost Wt Seps Undiscounted 28 28 23 12 16
NBMLHD Sub-total
Total Separations 3,936 3,962 3,583 3,324 3,378
Total Bed days 7,426 7,586 6,830 6,226 6,472
Total Cost Wt Seps Undiscounted 3,430 3,500 3,168 2,912 3,009
Other Public Hospitals
Separations 662 716 721 700 868
Bed days 1,320 1,232 1,250 1,331 1,461
Cost Wt Seps Undiscounted 707 654 614 634 764
Children's Hospital Westmead
Total Separations 1,784 1,991 1,998 2,373 2,245
Total Bed days 5,455 6,045 5,628 7,476 6,826
Total Cost Wt Seps Undiscounted 2,446 2,676 2,636 3,288 2,923
Total Paed Demand
Total Separations 6,382 6,669 6,302 6,397 6,491
Total Bed days 14,201 14,863 13,708 15,033 14,759
Total Cost Wt Seps Undiscounted 6,583 6,830 6,418 6,834 6,695
Source: Flowinfo v11.2. Notes: Excludes admit and discharge from Emergency Department, renal dialysis, chemotherapy, qualified and unqualified neonates, dedicated psychiatric facility.
NBMLHD Healthcare Services Plan 2012-2022
Data Reference Book DRB.52
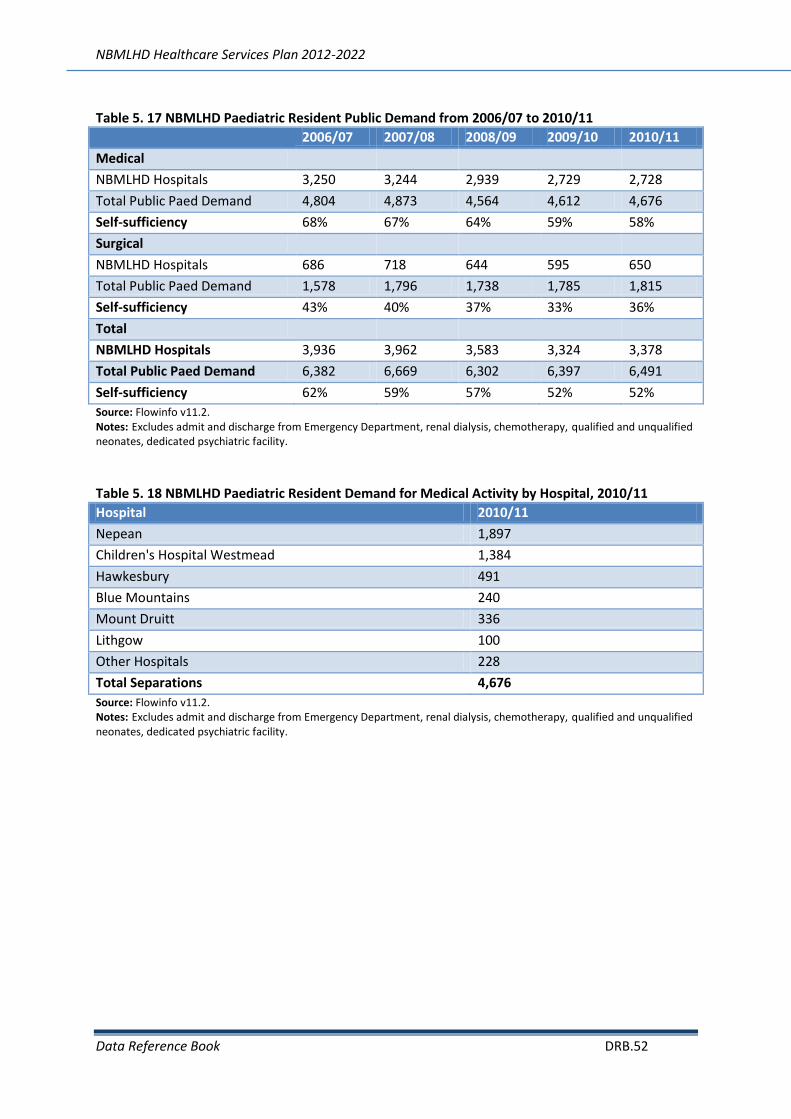
Table 5. 17 NBMLHD Paediatric Resident Public Demand from 2006/07 to 2010/11
2006/07 2007/08 2008/09 2009/10 2010/11
Medical
NBMLHD Hospitals 3,250 3,244 2,939 2,729 2,728
Total Public Paed Demand 4,804 4,873 4,564 4,612 4,676
Self-sufficiency 68% 67% 64% 59% 58%
Surgical
NBMLHD Hospitals 686 718 644 595 650
Total Public Paed Demand 1,578 1,796 1,738 1,785 1,815
Self-sufficiency 43% 40% 37% 33% 36%
Total
NBMLHD Hospitals 3,936 3,962 3,583 3,324 3,378
Total Public Paed Demand 6,382 6,669 6,302 6,397 6,491
Self-sufficiency 62% 59% 57% 52% 52%
Source: Flowinfo v11.2. Notes: Excludes admit and discharge from Emergency Department, renal dialysis, chemotherapy, qualified and unqualified neonates, dedicated psychiatric facility.
Table 5. 18 NBMLHD Paediatric Resident Demand for Medical Activity by Hospital, 2010/11
Hospital 2010/11
Nepean 1,897
Children's Hospital Westmead 1,384
Hawkesbury 491
Blue Mountains 240
Mount Druitt 336
Lithgow 100
Other Hospitals 228
Total Separations 4,676
Source: Flowinfo v11.2. Notes: Excludes admit and discharge from Emergency Department, renal dialysis, chemotherapy, qualified and unqualified neonates, dedicated psychiatric facility.

NBMLHD Healthcare Services Plan 2012-2022
Data Reference Book DRB.53
Table 5.19 NBMLHD Paediatric Resident Demand for Surgical/Procedural Activity by Hospital, 2010/11
Hospital 2010/11
Children's Hospital Westmead 861
Nepean 514
Westmead 151
Hawkesbury 68
Springwood 32
Lithgow 25
Sydney Children’s Hospital 29
Blue Mountains 11
Other Hospitals 124
Total Separations 1,815 Source: Flowinfo v11.2. Notes: Excludes admit and discharge from Emergency Department, renal dialysis, chemotherapy, qualified and unqualified neonates, dedicated psychiatric facility.
Table 5.20 Top 15 Medical Diagnostic Related Groups for NBMLHD Paediatric Resident Demand in 2010/11
Diagnostic Related Group Seps
Bronchitis and Asthma W/O CC 355
Whooping Cough and Acute Bronchiolitis W/O CC 351
Oesophagitis and Gastroenteritis W/O Cat/Sev CC 347
Otitis Media and URI 298
Viral Illness 256
Injury to Forearm, Wrist, Hand or Foot 224
Respiratory Infections/Inflammations W/O CC 219
Seizure W/O Catastrophic or Severe CC 123
Other Kidney and Urinary Tract Diagnoses W/O Catastrophic or Severe CC 121
Cellulitis W/O Catastrophic or Severe CC 108
Kidney and Urinary Tract Infections W/O Catastrophic or Severe CC 107
Other Digestive System Diagnoses W/O Catastrophic or Severe CC 106
Other Respiratory System Diagnosis W/O CC 83
Other Factors Influencing Health Status, Sameday 82
Laryngotracheitis and Epiglottitis 79
Subtotal 2,859
Other DRGs 1,817
Total Seps 4,676
Source: Flowinfo v11.2. Notes: Excludes admit and discharge from Emergency Department, renal dialysis, chemotherapy, qualified and unqualified neonates, dedicated psychiatric facility.
NBMLHD Healthcare Services Plan 2012-2022
Data Reference Book DRB.54
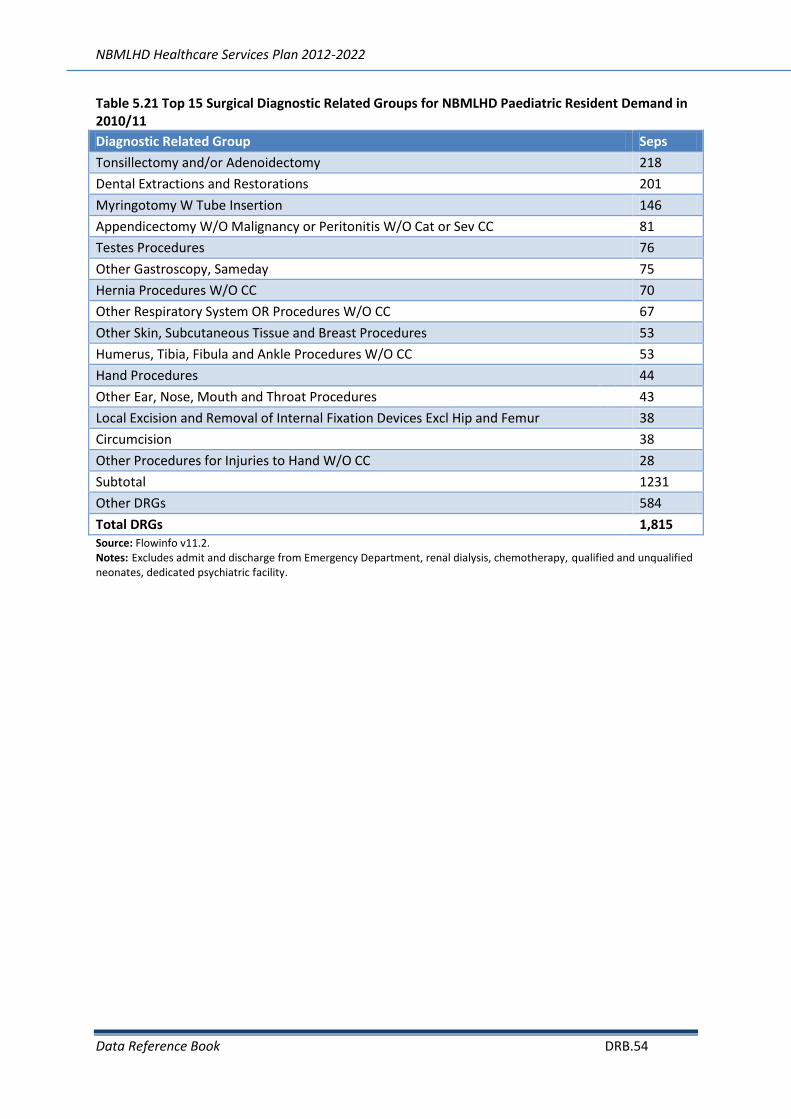
Table 5.21 Top 15 Surgical Diagnostic Related Groups for NBMLHD Paediatric Resident Demand in 2010/11
Diagnostic Related Group Seps
Tonsillectomy and/or Adenoidectomy 218
Dental Extractions and Restorations 201
Myringotomy W Tube Insertion 146
Appendicectomy W/O Malignancy or Peritonitis W/O Cat or Sev CC 81
Testes Procedures 76
Other Gastroscopy, Sameday 75
Hernia Procedures W/O CC 70
Other Respiratory System OR Procedures W/O CC 67
Other Skin, Subcutaneous Tissue and Breast Procedures 53
Humerus, Tibia, Fibula and Ankle Procedures W/O CC 53
Hand Procedures 44
Other Ear, Nose, Mouth and Throat Procedures
43
Local Excision and Removal of Internal Fixation Devices Excl Hip and Femur 38
Circumcision 38
Other Procedures for Injuries to Hand W/O CC 28
Subtotal 1231
Other DRGs 584
Total DRGs 1,815 Source: Flowinfo v11.2. Notes: Excludes admit and discharge from Emergency Department, renal dialysis, chemotherapy, qualified and unqualified neonates, dedicated psychiatric facility.

NBMLHD Healthcare Services Plan 2012-2022
Data Reference Book DRB.55
Private Paediatric Acute Inpatient Care
Table 5.22 NBMLHD Demand (Aged <15years) Public and Private Hospital Activity, 2006/07 to 2010/11
Hospital 2006/07 2007/08 2008/09 2009/10 2010/11 % Change
Private (excludes Designated Private Centres) Hospitals
Separations 998 1,149 1,101 1,025 1,309 31%
Bed days 1,567 1,613 1,325 1,258 1,585 1%
Cost Wt Seps Undiscounted 840 931 852 827 1,012 20%
Private Day Procedures
Separations 137 162 121 141 143 4%
Bed days 137 162 121 141 143 4%
Cost Wt Seps Undiscounted 100 116 88 106 106 6%
Total
Separations 1,135 1,311 1,222 1,166 1,452 28%
Bed days 1,704 1,775 1,446 1,399 1,728 1%
Cost Wt Seps Undiscounted 940 1,048 940 933 1,118 19%
Source: Flowinfo v11.2. Notes: Excludes admit and discharge from Emergency Department, renal dialysis, chemotherapy, qualified and unqualified neonates, dedicated psychiatric facility.

NBMLHD Healthcare Services Plan 2012-2022
Data Reference Book DRB.56
Perinatal and Qualified Neonates
Table 5.23 NBMLHD Acute Perinatology and Qualified Neonate Demand by Hospital, 2006/07 to 2010/11
Hospitals 2006/07 2007/08 2008/09 2009/10 2010/11 % change
Nepean
Separations 959 838 921 926 906 -6%
Bed days 8,479 7,082 7,703 7,251 6,746 -20%
Cost Wt Seps Undiscounted 2,179 1,949 2,531 2,362 2,059 -6%
Hawkesbury
Separations 39 37 34 35 38 -3%
Bed days 404 225 202 358 352 -13%
Cost Wt Seps Undiscounted 83 66 62 82 79 -4%
Blue Mountains
Separations 37 31 30 20 39 5%
Bed days 287 195 141 112 257 -10%
Cost Wt Seps Undiscounted 58 48 50 29 60 3%
Lithgow
Separations 14 23 16 12 14 0%
Bed days 63 52 52 67 56 -11%
Cost Wt Seps Undiscounted 24 17 23 13 15 -37%
NBMLHD Hospitals Subtotal
Separations 1,049 929 1,001 993 997 -3%
Bed days 9,233 7,554 8,098 7,788 7,411 -55%
Cost Wt Seps Undiscounted 2,344 2,079 2,666 2,486 2,213 -43%
Westmead
Separations 42 42 48 32 35 -17%
Bed days 249 347 504 353 453 82%
Cost Wt Seps Undiscounted 68 129 223 150 202 196%
Blacktown
Separations 33 41 49 26 29 -12%
Bed days 243 369 374 241 186 -23%
Cost Wt Seps Undiscounted 59 80 86 60 47 -20%
Other Hospitals
Separations 1,207 1,083 1,183 1,133 1,131 -6%
Bed days 10,604 9,092 10,253 9,127 8,926 -16%
Cost Wt Seps Undiscounted 2,960 2,858 3,804 3,077 2,982 1%
Total
Separations 1,240 1,124 1,232 1,159 1,160 -6%
Bed days 10,847 9,461 10,627 9,368 9,112 -16%
Cost Wt Seps Undiscounted 3,019 2,938 3,890 3,138 3,029 0%
Source: Flowinfo v11.2. Notes: Excludes admit and discharge from Emergency Department, renal dialysis, chemotherapy, dedicated psychiatric facility. Activity - acute, all ages for the SRGs of Perinatology and Qualified Neonates only.

NBMLHD Healthcare Services Plan 2012-2022
Data Reference Book DRB.57
Mental Health Acute Inpatient Care
Table 5.24 NBMLHD Resident Demand for Public Dedicated Psychiatric Facilities (all ages) by Hospitals, 2006/07 to 2010/11
Hospitals 2006/07 2007/08 2008/09 2009/10 2010/11
Nepean
Separations 987 1,317 1,159 1,002 1,151
Beddays 11,138 11,696 12,028 11,568 11,704
Westmead
Separations 707 573 768 734 704
Beddays 2787 2693 2382 2767 3539
Blue Mountains
Separations 313 336 319 170 224
Beddays 4,718 4,722 4,498 3,565 4,237
Cumberland
Separations 177 130 187 160 127
Beddays 3,666 3,129 6,287 4,742 3,141
Concord
Separations 2 10 130 197
Beddays 5 95 225 282
Blacktown
Separations 44 39 49 46 46
Beddays 354 210 325 344 488
St. Josephs Auburn
Separations 24 19 17 23 15
Beddays 1,235 1,294 911 1,143 868
Subtotal
Separations 2,252 2,416 2,509 2,265 2,464
Beddays 23,898 23,749 26,526 24,354 24,259
Other Hospitals
Separations 104 98 130 72 97
Beddays 1,408 1,804 2,071 1,053 1,352
Total
Separations 2,356 2,514 2,639 2,337 2,561
Bed days 25,306 25,553 28,597 25,407 25,611
Source: Flowinfo v11.2. Notes : Excludes admit and discharge from Emergency Department, acute and Sub-Acute inpatient activity.

NBMLHD Healthcare Services Plan 2012-2022
Data Reference Book DRB.58
Table 5.25 NBMLHD Resident Demand for Public Dedicated Psychiatric Facilities (all ages) by Service Related Groups, 2006/07 to 2010/11
Source: Flowinfo v11.2. Notes : Excludes admit and discharge from Emergency Department, acute and Sub-Acute inpatient activity.
Service Related Group 2006/07 2007/08 2008/09 2009/10 2010/11
Psychiatry - Acute
NBMLHD Hospitals
Separations 1,295 1,648 1,477 1,172 1,373
Beddays 15,693 16,013 16,466 15,133 15,901
Outflow Hospitals
Separations 1,010 823 1,118 1,132 1,154
Beddays 6,394 6,114 6,646 7,093 6,810
Psychiatry - Non Acute
NBMLHD Hospitals
Separations 5 4 1 - -
Beddays 163 403 60 - -
Outflow Hospitals
Separations 23 19 26 10 13
Beddays 1,885 1,727 4,156 2,038 1,747
Psychogeriatric Care
NBMLHD Hospitals
Separations - 1 - - 2
Beddays - 2 - - 40
Outflow Hospitals
Separations 23 19 17 23 19
Beddays 1,171 1,294 1,269 1,143 1,113
NBMLHD Hospitals
Total Separations 1,300 1,653 1,478 1,172 1,375
Total Bed days 15,856 16,418 16,526 15,133 15,941
Outflow Hospitals
Total Separations 1,056 861 1,161 1,165 1,186
Total Bed days 9,450 9,135 12,071 10,274 9,670
Total Public Demand
Separations 2,356 2,514 2,639 2,337 2,561
Bed days 25,306 25,553 28,597 25,407 25,611

NBMLHD Healthcare Services Plan 2012-2022
Data Reference Book DRB.59
Sub-Acute Inpatient Care
Table 5.26 NBMLHD Resident Demand for Public Sub-Acute Activity by Hospitals, 2006/07 to 2010/11
Source: Flowinfo v11.2. Notes : Excludes admit and discharge from Emergency Department, acute and Sub-Acute inpatient activity. ALOS = DO+ON beddays noting most activity is overnight.
Hospital 2006/07 2007/08 2008/09 2009/10 2010/11
Nepean
Separations 652 582 741 689 653
Beddays 11,357 10,283 10,764 10,610 10,686
ALOS 17.4 17.7 14.5 15.4 16.4
Blue Mountains
Separations 428 453 398 291 374
Beddays 7,061 7,397 6,621 5,151 6,974
ALOS 16.5 16.3 16.6 17.7 18.6
Springwood
Separations 262 296 298 292 351
Beddays 5,566 6,271 6,969 7,264 7,385
ALOS 21.2 21.2 23.4 24.9 21.0
Lithgow
Separations 11 10 34 50 62
Beddays 130 263 573 714 1,042
ALOS 11.8 26.3 16.9 14.3 16.8
Hawkesbury
Separations 5 1 2 1
Beddays 87 14 13 15
ALOS 17.4 14.0 6.5 15.0
NBMLHD Subtotal
Separations 1,358 1,342 1,473 1,323 1,440
Beddays 24,201 24,228 24,940 23,754 26,087
ALOS 17.8 18.1 16.9 18.0 18.1
Mount Druitt
Separations 44 91 72 75 103
Beddays 892 1,159 1,084 880 1,485
ALOS 20.3 12.7 15.1 11.7 14.4
Westmead
Separations 59 40 54 67 52
Beddays 2,054 1,183 961 1,320 1,029
ALOS 34.8 29.6 17.8 19.7 19.8
Other Hospitals
Separations 132 129 111 99 156
Beddays 2,932 2,866 2,292 1,646 2,511
ALOS 22.2 22.2 20.6 16.6 16.1
Total
Separations 1,593 1,602 1,710 1,564 1,751
Beddays 30,079 29,436 29,277 27,600 31,112
ALOS 18.9 18.4 17.1 17.6 17.8

NBMLHD Healthcare Services Plan 2012-2022
Data Reference Book DRB.60
Table 5.27 NBMLHD Resident Demand for Public Sub-Acute Activity by Service Related Groups, 2006/07 to 2010/11
Source: Flowinfo v11.2. Notes : Excludes admit and discharge from Emergency Department, acute and Sub-Acute inpatient activity. ALOS = DO+ON beddays noting most activity is overnight.
Service Related Group 2006/07 2007/08 2008/09 2009/10 2010/11
Rehabilitation
Separations 152 130 125 123 167
Beddays 4,240 3,535 2,974 2,578 3,396
ALOS 27.9 27.2 23.8 21.0 20.3
Psychogeriatric Care
Separations 4 1
Beddays 295 1
ALOS 73.8 1.0
Palliative Care
Separations 54 103 90 94 112
Beddays 673 966 977 940 1,223
ALOS 12.5 9.4 10.9 10.0 10.9
Maintenance
Separations 25 27 22 23 32
Beddays 670 707 386 327 406
ALOS 26.8 26.2 17.5 14.2 12.7
Total Separations 235 260 237 241 311
Total Beddays 5,878 5,208 4,337 3,846 5,025
ALOS 25.0 20.0 18.3 16.0 16.2

NBMLHD Healthcare Services Plan 2012-2022
Data Reference Book DRB.61
6 2022
Methodology Table 6.1 Methodology for Projected Healthcare Activity Requirements in the NBMLHD to 2021/22 and 2026/27
Type of Care
Inclusions and Exclusions Tool for Projections
Acute All acute inpatient hospital activity all ages excluding chemotherapy, renal dialysis, unqualified neonates, dedicated mental health facilities. Separate sections included for adult acute, paediatric acute, deliveries.
Acute Inpatient Modelling (aIM 2012)
Chemotherapy All chemotherapy activity in NBMLHD hospitals NSW Health Service Planning Guideline for Intravenous Chemotherapy Services, Utilisation
Radiation Oncology
Linear accelerators in the context of statewide planning for Nepean Hospital.
NSW Health Radiotherapy Services in NSW Strategic Plan to 2016
Renal dialysis All in-centre and satellite renal dialysis activity. Population projections, renal dialysis projections, Utilisation. Drawn from NSW Renal Strategic Plan
Deliveries All deliveries, as drawn from Service Related Group – Obstetrics.
Acute Inpatient Modelling (aIM 2012)
Unqualified neonates
Generally excluded from analyses. All inpatient unqualified neonates.
AIM 2012
Mental health All dedicated mental health facilities including units (Pialla and Psychiatric Emergency Care Centre [PECC]) at Nepean and Blue Mountains hospitals.
Mental Health Clinical Care and Prevention (MHCCP) tool
Operating theatres
Operating theatres and procedure rooms including endoscopy.
NSW Operating Theatre tool and utilisation modelling.
Emergency Department presentations
All presentations to Emergency Departments including those discharged and admitted to hospital.
Population projections and clinician judgement
Sub-Acute All sub-acute activity including rehabilitation, geriatric, palliative care and psychogeriatric care.
Sub-Acute Inpatient Modelling (SiAM 2012)

NBMLHD Healthcare Services Plan 2012-2022
Data Reference Book DRB.62
Projected Acute and Sub-Acute Activity Table 6.2 Historical and Projected Activity for NBMLHD for Acute and Sub-Acute Care by Age Group from 2010/11 to 2026/27
Historical Projected % change
Age Group 2011 2017 2022 2027 2011-22 2022-27
Adult Acute activity*
Day Only Seps 10,623 11,792 13,249 14,701 25% 11%
Day Only Bed Equiv 36 39 44 49 25% 11%
Overnight seps 31,322 34,607 38,259 42,026 22% 10%
Total Seps 41,945 46,399 51,509 56,727 23% 10%
Overnight Beddays 160,391 183,249 203,696 224,819 27% 10%
Overnight Bed Equiv 530 604 672 741 27% 10%
Total Beddays 171,014 195,041 216,945 239,520 27% 10%
Total Bed Equiv 566 644 716 790 27% 10%
Adult Sub-Acute activity
Subacute Seps 1,697 2,048 2,498 2,982 47% 19%
Subacute Beddays 29,042 33,617 39,353 45,317 36% 15%
Subacute Bed Equiv 88 102 120 138 36% 15%
Total acute + subacute seps 43,642 48,446 54,007 59,709 24% 11%
Total acute + Subacute beddays 200,056 228,658 256,298 284,837 28% 11%
Total acute + subacute bed equiv 654 746 836 928 28% 11%
Paediatric
Day Only Seps 621 778 841 891 35% 6%
Overnight seps 3,536 3,865 4,045 4,183 14% 3%
Total Seps 4,157 4,643 4,886 5,074 18% 4%
Overnight Beddays 7,239 8,342 8,623 8,829 19% 2%
Total Beddays 7,860 9,120 9,464 9,720 20% 3%
Paediatric total bed equiv 26 30 31 32 20% 3%
Neonates
Total Seps 1,498 1,585 1,673 1,743 12% 4%
Total Beddays 12,077 14,701 15,526 16,193 29% 4%
Neonates bed equiv 39 47 50 52 28% 4%
Grand Total Bed Equivalent - acute,
subacute all ages includes neonates 719 823 917 1,013 27% 10%
Source: Acute Inpatient Modelling (aIM2012), Sub-Acute Inpatient Modelling (SiAM2012). Notes: *Medical, surgical / procedural activity + obstetrics (all ages). Excludes admit and discharge from Emergency Department, renal dialysis, chemotherapy, dedicated psychiatric facilities. Bed Equivalents = beddays/365/hospital occupancy rate.

NBMLHD Healthcare Services Plan 2012-2022
Data Reference Book DRB.63
Table 6.3 Historical and Projected Activity for NBMLHD for Acute and Sub-Acute Care by Hospital from 2010/11 to 2026/27
Historical Projected % change
Hospital Type 2011 2017 2022 2027 2011-22 2022-27
Nepean Seps 34,528 38,520 42,587 46,614 23% 9%
Beddays 152,897 186,277 206,797 227,215 35% 10%
Bed Equiv 491 597 663 728 35% 10%
Hawkesbury Seps 6,958 7,763 8,661 9,698 24% 12%
Beddays 26,498 25,332 28,487 32,235 8% 13%
Bed Equiv 91 87 98 110 7% 13%
Lithgow Seps 3,029 3,453 3,697 3,911 22% 6%
Beddays 10,424 11,368 12,154 12,918 17% 6%
Bed Equiv 37 41 44 46 16% 6%
Blue Mountains Seps 3,407 3,655 4,080 4,496 20% 10%
Beddays 20,323 20,334 22,995 25,645 13% 12%
Bed Equiv 70 70 79 88 13% 11%
Springwood Seps 1,375 1,283 1,541 1,808 12% 17%
Beddays 9,851 9,167 10,854 12,736 10% 17%
Bed Equiv 31 29 34 40 10% 17%
Total Seps 49,297 54,674 60,566 66,526 23% 10%
Total Beddays 219,993 252,478 281,287 310,750 28% 10%
Total Acute & Subacute Bed Equivalents (all ages)
719 823 917 1,013 27% 10%
Source: Acute Inpatient Modelling (aIM2012), Sub-Acute Inpatient Modelling (SiAM2012). Notes: All ages, acute, public supply activity. Excludes admit and discharge from Emergency Department, Renal Dialysis, Chemotherapy, unqualified neonates (NB Includes perinatology and qualified neonates). Acute Bed equivalents = beddays/365/occupancy rate. Nepean hospital O/R = 85%, Hawkesbury hospital O/R = 80%, Lithgow, Blue Mountains, Springwood hospitals O/R = 75%. Sub-Acute Bed Equivalent = beddays/365/90% occupancy rate.

NBMLHD Healthcare Services Plan 2012-2022
Data Reference Book DRB.64
Projected Acute Activity for All Ages Table 6.4 Historical and Projected Acute Supply Activity at NBMLHD Hospitals from 2010/11 to 2026/27
Source: Acute Inpatient Modelling (aIM2012). Notes: Total acute public activity includes all ages . Excludes admit and discharge from Emergency Department, renal dialysis, chemotherapy and unqualified neonates.
Historical Projected % change
Type 2011 2017 2022 2027 2011-22 2022-27
Adult
Day Only Seps Medical 3,033 3,683 4,276 4,860 41% 14%
Surgical 6,566 6,920 7,711 8,494 17% 10%
BedEquiv 32 36 40 45 25% 11%
Overnight Seps Medical 16,888 19,382 21,834 24,409 29% 12%
Surgical 8,311 8,766 9,689 10,617 17% 10%
Overnight Beddays Medical 88,825 102,811 116,057 130,007 31% 12%
Surgical 51,622 58,955 65,704 72,426 27% 10%
BedEquiv 465 534 600 668 29% 11%
Obstetrics (all ages)
Dayonly Seps 1,024 1,188 1,263 1,347 23% 7%
Dayonly Bed Equiv 3 4 4 4 23% 7%
Overnight Seps 6,123 6,459 6,736 7,000 10% 4%
Overnight Beddays 19,944 21,484 21,934 22,387 10% 2%
Overnight Bed Equiv 66 71 72 74 10% 2%
Paediatric
Day Only Seps Medical 258 355 386 410 50% 6%
Surgical 363 423 455 481 25% 6%
Overnight Seps Medical 2,986 3,282 3,419 3,521 14% 3%
Surgical 550 582 626 662 14% 6%
Overnight Beddays Medical 6,179 7,117 7,328 7,482 19% 2%
Surgical 1,060 1,225 1,295 1,347 22% 4%
NEONATES
Total Seps 1,498 1,585 1,673 1,743 12% 4%
Total Beddays 12,077 14,701 15,526 16,193 29% 4%
Total Neonate Bed Equiv 39 47 50 52 28% 4%
ALL ACTIVITY
Total Seps 47,600 52,626 58,068 63,544 22% 9%
Total Beddays 190,951 218,861 241,935 265,433 27% 10%
Total Bed Equiv (acute) 631 721 797 875 26% 10%

NBMLHD Healthcare Services Plan 2012-2022
Data Reference Book DRB.65
Projected Acute Activity by Hospital for All Ages Table 6. 5 Historical and Projected Acute Inpatient Activity by NBMLHD Hospitals for All Ages from 2010/11 to 2026/27
Source: Acute Inpatient Modelling (aIM2012), Sub-Acute Inpatient Modelling (SiAM2012). Notes: All ages, acute, public supply activity. Excludes admit and discharge from Emergency Department, Renal Dialysis, Chemotherapy, unqualified neonates (NB Includes perinatology and qualified neonates). Acute Bed equivalents = beddays/365/occupancy rate. Nepean hospital O/R = 85%, Hawkesbury hospital O/R = 80%, Lithgow, Blue Mountains, Springwood hospitals O/R = 75%. Sub-Acute Bed Equivalent = beddays/365/90% occupancy rate.
Historical Projected % change
Hospital Type 2011 2017 2022 2027 2011-22 2022-27
Nepean Seps 33,731 37,450 41,270 45,032 22% 9%
Beddays 140,348 168,677 186,046 203,239 33% 9%
CWT Seps 54,863 61,486 68,383 75,173 25% 10%
Av CWT Seps 1.6 1.6 1.7 1.7 2% 1%
Bed equiv 452 544 600 655 33% 9%
Hawkesbury Seps 6,957 7,760 8,658 9,693 24% 12%
Beddays 26,495 25,274 28,424 32,164 7% 13%
CWT Seps 8,407 9,416 10,665 12,109 27% 14%
Av CWT Seps 1.2 1.2 1.2 1.2 2% 1%
Bed equiv 91 87 97 110 7% 13%
Lithgow Seps 2,987 3,227 3,578 3,919 20% 10%
Beddays 13,050 13,191 14,796 16,427 13% 11%
CWT Seps 3,715 4,016 4,518 5,018 22% 11%
Av CWT Seps 1.2 1.2 1.3 1.3 2% 1%
Bed equiv 48 48 54 60 13% 11%
Blue Mountains Seps 2,962 3,349 3,564 3,750 20% 5%
Beddays 9,380 10,211 10,858 11,487 16% 6%
CWT Seps 2,917 3,353 3,586 3,801 23% 6%
Av CWT Seps 1.0 1.0 1.0 1.0 2% 1%
Bed equiv 34 37 40 42 16% 6%
Springwood Seps 963 840 999 1,150 4% 15%
Beddays 1,678 1,509 1,811 2,116 8% 17%
CWT Seps 697 692 828 966 19% 17%
Av CWT Seps 0.7 0.8 0.8 0.8 15% 1%
Bed equiv 6 6 7 8 8% 17%
Total Seps 47,600 52,626 58,068 63,544 22% 9%
Total Beddays 190,951 218,861 241,935 265,433 27% 10%
Total CWT Seps 70,599 78,963 87,980 97,066 25% 10%
Total Acute Bed Equivalents 631 721 797 875 26% 10%

NBMLHD Healthcare Services Plan 2012-2022
Data Reference Book DRB.66
Projected Adult Acute Activity Table 6.6 Historical and Projected Adult Acute Projected Activity for NBMLHD Hospitals from 2010/11 to 2026/27
Source: Acute Inpatient Modelling (aIM2012). Notes: Total acute public activity includes all ages . Excludes admit and discharge from Emergency Department, renal dialysis, chemotherapy and unqualified neonates.
Historical Projected % change
Hospital Type 2011 2017 2022 2027 2011-22 2022-27
Nepean Seps 29,363 32,619 36,176 39,748 23% 10%
Beddays 123,515 147,524 163,836 180,222 33% 10%
CWTSeps U 48,283 54,087 60,577 67,053 25% 11%
Av CWT Seps 1.64 1.66 1.67 1.69 2% 1%
Bed Equiv 398 475 528 581 33% 10%
Hawkesbury Seps 6,209 6,966 7,810 8,789 26% 13%
Beddays 24,583 23,612 26,664 30,297 8% 14%
CWTSeps U 7,659 8,637 9,831 11,217 28% 14%
Av CWT Seps 1.23 1.24 1.26 1.28 2% 1%
Bed Equiv 84 81 91 104 8% 14%
Lithgow Seps 2,769 3,131 3,349 3,539 21% 6%
Beddays 9,047 9,852 10,511 11,151 16% 6%
CWTSeps U 2,762 3,174 3,409 3,628 23% 6%
Av CWT Seps 1.00 1.01 1.02 1.03 2% 1%
Bed Equiv 33 36 38 41 16% 6%
Blue Mountains Seps 2,670 2,880 3,216 3,545 20% 10%
Beddays 12,171 12,559 14,141 15,754 16% 11%
CWTSeps U 3,408 3,694 4,181 4,669 23% 12%
Av CWT Seps 1.28 1.28 1.30 1.32 2% 1%
Bed Equiv 44 46 52 58 16% 11%
Springwood Seps 921 792 947 1,095 3% 16%
Beddays 1,636 1,461 1,759 2,060 8% 17%
CWTSeps U 675 666 801 936 19% 17%
Av CWT Seps 0.73 0.84 0.85 0.86 15% 1%
Bed Equiv 6 5 6 8 8% 17%
Total Seps 41,932 46,389 51,498 56,716 23% 10%
Total Beddays 170,952 195,007 216,911 239,485 27% 10%
Total CWT Seps Undisc 62,786 70,258 78,799 87,503 26% 11%
Total Bed Equiv 566 644 716 790 27% 10%
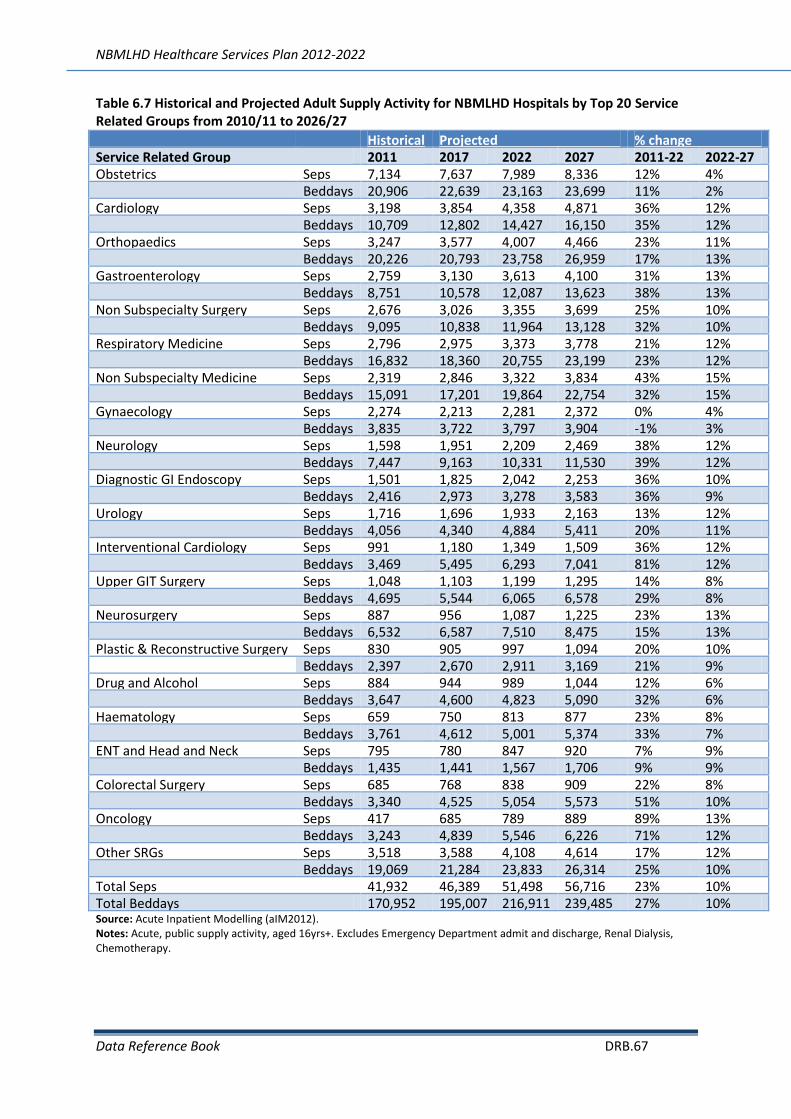
NBMLHD Healthcare Services Plan 2012-2022
Data Reference Book DRB.67
Table 6.7 Historical and Projected Adult Supply Activity for NBMLHD Hospitals by Top 20 Service Related Groups from 2010/11 to 2026/27
Historical Projected % change
Service Related Group 2011 2017 2022 2027 2011-22 2022-27 Obstetrics Seps 7,134 7,637 7,989 8,336 12% 4%
Beddays 20,906 22,639 23,163 23,699 11% 2%
Cardiology Seps 3,198 3,854 4,358 4,871 36% 12%
Beddays 10,709 12,802 14,427 16,150 35% 12%
Orthopaedics Seps 3,247 3,577 4,007 4,466 23% 11%
Beddays 20,226 20,793 23,758 26,959 17% 13%
Gastroenterology Seps 2,759 3,130 3,613 4,100 31% 13%
Beddays 8,751 10,578 12,087 13,623 38% 13%
Non Subspecialty Surgery Seps 2,676 3,026 3,355 3,699 25% 10%
Beddays 9,095 10,838 11,964 13,128 32% 10%
Respiratory Medicine Seps 2,796 2,975 3,373 3,778 21% 12%
Beddays 16,832 18,360 20,755 23,199 23% 12%
Non Subspecialty Medicine Seps 2,319 2,846 3,322 3,834 43% 15%
Beddays 15,091 17,201 19,864 22,754 32% 15%
Gynaecology Seps 2,274 2,213 2,281 2,372 0% 4%
Beddays 3,835 3,722 3,797 3,904 -1% 3%
Neurology Seps 1,598 1,951 2,209 2,469 38% 12%
Beddays 7,447 9,163 10,331 11,530 39% 12%
Diagnostic GI Endoscopy Seps 1,501 1,825 2,042 2,253 36% 10%
Beddays 2,416 2,973 3,278 3,583 36% 9%
Urology Seps 1,716 1,696 1,933 2,163 13% 12%
Beddays 4,056 4,340 4,884 5,411 20% 11%
Interventional Cardiology Seps 991 1,180 1,349 1,509 36% 12%
Beddays 3,469 5,495 6,293 7,041 81% 12%
Upper GIT Surgery Seps 1,048 1,103 1,199 1,295 14% 8%
Beddays 4,695 5,544 6,065 6,578 29% 8%
Neurosurgery Seps 887 956 1,087 1,225 23% 13%
Beddays 6,532 6,587 7,510 8,475 15% 13%
Plastic & Reconstructive Surgery Seps 830 905 997 1,094 20% 10%
Beddays 2,397 2,670 2,911 3,169 21% 9%
Drug and Alcohol Seps 884 944 989 1,044 12% 6%
Beddays 3,647 4,600 4,823 5,090 32% 6%
Haematology Seps 659 750 813 877 23% 8%
Beddays 3,761 4,612 5,001 5,374 33% 7%
ENT and Head and Neck Seps 795 780 847 920 7% 9%
Beddays 1,435 1,441 1,567 1,706 9% 9%
Colorectal Surgery Seps 685 768 838 909 22% 8%
Beddays 3,340 4,525 5,054 5,573 51% 10%
Oncology Seps 417 685 789 889 89% 13%
Beddays 3,243 4,839 5,546 6,226 71% 12%
Other SRGs Seps 3,518 3,588 4,108 4,614 17% 12%
Beddays 19,069 21,284 23,833 26,314 25% 10%
Total Seps 41,932 46,389 51,498 56,716 23% 10% Total Beddays 170,952 195,007 216,911 239,485 27% 10% Source: Acute Inpatient Modelling (aIM2012). Notes: Acute, public supply activity, aged 16yrs+. Excludes Emergency Department admit and discharge, Renal Dialysis, Chemotherapy.

NBMLHD Healthcare Services Plan 2012-2022
Data Reference Book DRB.68
Projected Acute Activity for Older People
Table 6.8 Historical and Projected Acute Activity for NBMLHD Residents aged 70+ years from 2010/11 to 2026/27
Type Age Group 2011 2017 2022 2027
Separations 70-84 years 8,563 10,598 13,688 16,331
85+ years 2,947 3,695 4,309 5,371
Beddays 70-84 years 50,928 61,080 76,631 89,502
85+ years 21,196 26,028 29,502 35,888
CWTU 70-84 years 16,181 20,227 25,821 30,585
85+ years 5,823 7,445 8,622 10,683
Beds equivalent 70-84 years 169 203 254 296
85+ years 71 87 98 120
Total Separations 11,510 14,293 17,997 21,701
Total Beddays 72,124 87,108 106,133 125,390
Total CWTO 22,004 27,672 34,443 41,268
Total Beds equivalent 240 289 352 416 Source: Acute Inpatient Modelling (aIM2012). Notes: Acute, public supply activity, aged 70+ years. Excludes Emergency Department admit and discharge, Renal Dialysis, Chemotherapy.
Table 6.9 Comparing Projected Acute Inpatient Activity Older People (aged 70+ years) with Adults (16+Years) for NBMLHD from 2010/11 to 2026/27
2011 2017 2022 2027
Separation
70+ Acute 11,510 14,293 17,997 21,701
All Adult Acute 41,932 46,389 51,498 56,716
Proportion 27% 31% 35% 38%
Beddays
70+ Acute 72,124 87,108 106,133 125,390
All Adult Acute 170,952 195,007 216,911 239,485
Proportion 42% 45% 49% 52%
Source: Acute Inpatient Modelling (aIM2012). Notes: Acute, public supply activity aged 70+ years. Excludes Emergency Department admit and discharge, Renal Dialysis, Chemotherapy.

NBMLHD Healthcare Services Plan 2012-2022
Data Reference Book DRB.69
Table 6. 10 Historical and Projected Acute Activity for NBMLHD Residents aged 70-84 years by Top 15 Service Related Groups from 2010/11 to 2026/27
Source: Acute Inpatient Modelling (aIM2012). Notes: Acute, public supply activity, aged 70-84 years. Excludes Emergency Department admit and discharge, Renal Dialysis, Chemotherapy.
Historical Projected % change
Service Related Group Type 2011 2017 2022 2027 2011-22 2022-27
Cardiology Seps 1,001 1,293 1,631 1,915 63% 17%
Beddays 4,076 5,330 6,550 7,522 61% 15%
Respiratory Medicine Seps 930 1,165 1,456 1,697 57% 17%
Beddays 7,048 8,084 9,899 11,364 40% 15%
Non Subspecialty Medicine Seps 739 959 1,265 1,530 71% 21%
Beddays 5,685 6,766 8,599 10,120 51% 18%
Gastroenterology Seps 706 897 1,187 1,440 68% 21%
Beddays 2,553 3,492 4,498 5,355 76% 19%
Orthopaedics Seps 715 845 1,093 1,314 53% 20%
Beddays 7,858 7,715 9,797 11,610 25% 18%
Non Subspecialty Surgery Seps 466 604 786 943 69% 20%
Beddays 2,367 2,902 3,650 4,271 54% 17%
Neurology Seps 448 583 741 874 65% 18%
Beddays 2,883 3,540 4,398 5,078 53% 15%
Urology Seps 446 514 687 834 54% 21%
Beddays 1,275 1,583 2,006 2,349 57% 17%
Diagnostic GI Endoscopy Seps 333 480 634 765 90% 21%
Beddays 647 861 1,088 1,275 68% 17%
Interventional Cardiology Seps 327 431 568 685 74% 21%
Beddays 1,377 2,390 3,078 3,651 124% 19%
Ophthalmology Seps 417 338 463 568 11% 23%
Beddays 451 390 528 644 17% 22%
Neurosurgery Seps 263 295 385 465 46% 21%
Beddays 2,405 2,498 3,216 3,840 34% 19%
Oncology Seps 140 250 329 395 135% 20%
Beddays 1,274 2,015 2,580 3,046 102% 18%
Haematology Seps 195 248 298 336 53% 13%
Beddays 889 1,384 1,663 1,882 87% 13%
Plastic and Recons. Surgery Seps 194 233 293 342 51% 17%
Beddays 618 809 969 1,099 57% 13%
Other SRGs Seps 1,243 1,464 1,875 2,227 51% 19%
Beddays 9,522 11,320 14,110 16,397 48% 16%
Total Seps 8,563 10,598 13,688 16,331 60% 19%
Total Beddays 50,928 61,080 76,631 89,502 50% 17%

NBMLHD Healthcare Services Plan 2012-2022
Data Reference Book DRB.70
Table 6.11 Historical and Projected Acute Activity for NBMLHD Residents aged 85+ years by Top 15 Service Related Groups from 2010/11 to 2026/27
Historical Projected % change
Service Related Group Type 2011 2017 2022 2027 2011-22 2022-27
Non Subspecialty Medicine Seps 402 581 681 852 69% 25%
Beddays 3,492 4,493 5,113 6,251 46% 22%
Cardiology Seps 427 543 625 768 46% 23%
Beddays 2,713 3,030 3,395 4,086 25% 20%
Respiratory Medicine Seps 404 435 505 626 25% 24%
Beddays 2,953 3,256 3,698 4,502 25% 22%
Orthopaedics Seps 281 351 406 505 45% 24%
Beddays 3,686 4,020 4,579 5,600 24% 22%
Gastroenterology Seps 235 309 363 458 55% 26%
Beddays 1,312 1,568 1,778 2,165 36% 22%
Non Subspecialty Surgery Seps 193 226 265 332 37% 25%
Beddays 1,050 1,155 1,303 1,574 24% 21%
Neurology Seps 174 226 260 320 49% 23%
Beddays 1,156 1,697 1,885 2,264 63% 20%
Neurosurgery Seps 81 103 123 156 51% 27%
Beddays 604 874 1,027 1,293 70% 26%
Plastic & Reconstructive Surgery Seps 84 97 113 140 34% 24%
Beddays 267 352 395 475 48% 20%
Haematology Seps 96 90 102 122 6% 20%
Beddays 200 385 427 501 113% 17%
Urology Seps 60 87 107 141 78% 32%
Beddays 364 404 470 590 29% 26%
Interventional Cardiology Seps 62 84 102 130 64% 28%
Beddays 238 527 617 768 159% 25%
Vascular Surgery Seps 55 71 84 106 53% 26%
Beddays 517 769 878 1,083 70% 23%
Diagnostic GI Endoscopy Seps 50 73 84 104 67% 24%
Beddays 244 283 307 359 26% 17%
Renal Medicine Seps 37 61 77 102 108% 33%
Beddays 203 360 432 554 113% 28%
Other SRGs Seps 306 357 412 507 35% 23%
Beddays 2,197 2,856 3,199 3,824 46% 20%
Total Seps 2,947 3,695 4,309 5,371 46% 25%
Total Beddays 21,196 26,028 29,502 35,888 39% 22%
Source: Acute Inpatient Modelling (aIM2012). Notes: Acute, public supply activity, aged 85+ years. Excludes Emergency Department admit and discharge, Renal Dialysis, Chemotherapy.
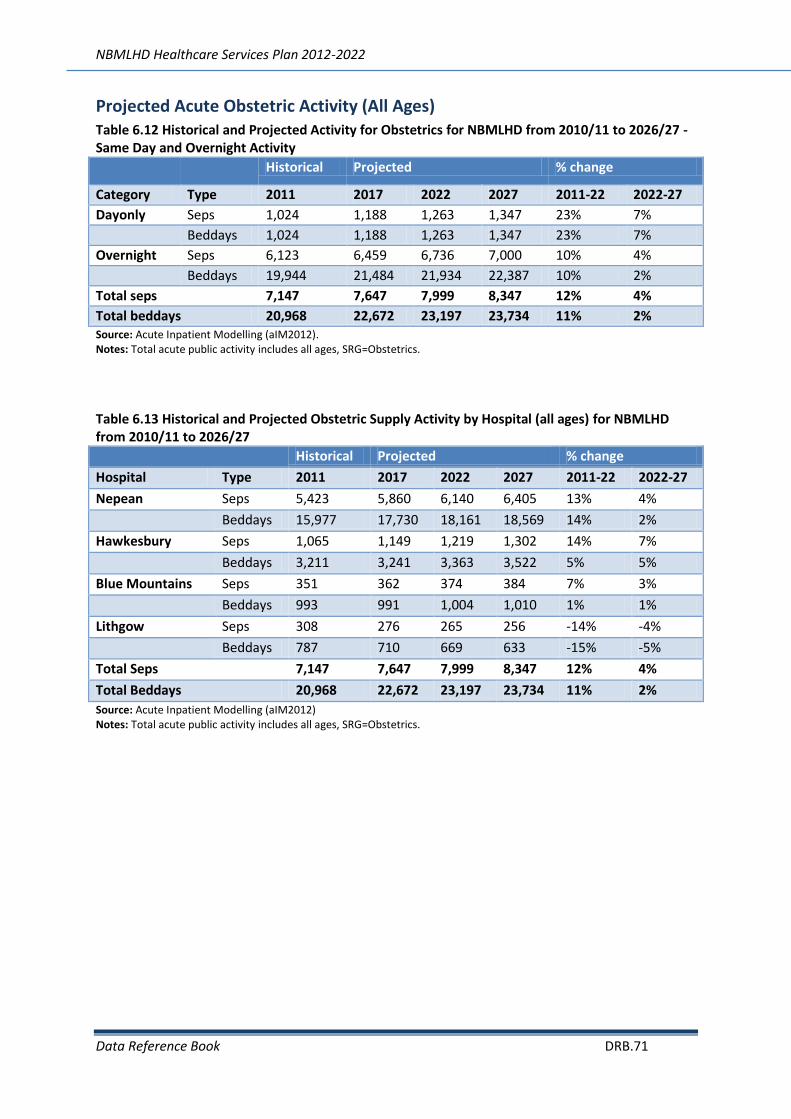
NBMLHD Healthcare Services Plan 2012-2022
Data Reference Book DRB.71
Projected Acute Obstetric Activity (All Ages) Table 6.12 Historical and Projected Activity for Obstetrics for NBMLHD from 2010/11 to 2026/27 - Same Day and Overnight Activity
Source: Acute Inpatient Modelling (aIM2012). Notes: Total acute public activity includes all ages, SRG=Obstetrics.
Table 6.13 Historical and Projected Obstetric Supply Activity by Hospital (all ages) for NBMLHD from 2010/11 to 2026/27
Historical Projected % change
Hospital Type 2011 2017 2022 2027 2011-22 2022-27
Nepean Seps 5,423 5,860 6,140 6,405 13% 4%
Beddays 15,977 17,730 18,161 18,569 14% 2%
Hawkesbury Seps 1,065 1,149 1,219 1,302 14% 7%
Beddays 3,211 3,241 3,363 3,522 5% 5%
Blue Mountains Seps 351 362 374 384 7% 3%
Beddays 993 991 1,004 1,010 1% 1%
Lithgow Seps 308 276 265 256 -14% -4%
Beddays 787 710 669 633 -15% -5%
Total Seps 7,147 7,647 7,999 8,347 12% 4%
Total Beddays 20,968 22,672 23,197 23,734 11% 2%
Source: Acute Inpatient Modelling (aIM2012) Notes: Total acute public activity includes all ages, SRG=Obstetrics.
Historical Projected % change
Category Type 2011 2017 2022 2027 2011-22 2022-27
Dayonly Seps 1,024 1,188 1,263 1,347 23% 7%
Beddays 1,024 1,188 1,263 1,347 23% 7%
Overnight Seps 6,123 6,459 6,736 7,000 10% 4%
Beddays 19,944 21,484 21,934 22,387 10% 2%
Total seps 7,147 7,647 7,999 8,347 12% 4%
Total beddays 20,968 22,672 23,197 23,734 11% 2%

NBMLHD Healthcare Services Plan 2012-2022
Data Reference Book DRB.72
Table 6.14 Historical and Projected Obstetric Activity for NBMLHD Hospitals by Enhanced Service Related Groups (all ages) from 2010/11 to 2026/27
Source: Acute Inpatient Modelling (aIM2012) Notes: Acute, public supply, all ages for SRG Obstetrics. Figures do not include impact of deliveries shifting to Lithgow
Hospital from change in role of overnight capacity at Lithgow Private Hospital.
Historical Projected % change
Hospital Enhanced Service Related Group
2011 2017 2022 2027 2011-22 2022-27
Nepean Vaginal Delivery Seps 2,443 2,713 2,863 2,989 17% 4%
Beddays 6,366 7,572 7,815 8,035 23% 3%
Ante-natal Admission Seps 1,666 1,764 1,830 1,912 10% 4%
Beddays 3,822 3,587 3,662 3,772 -4% 3%
Caesarean Delivery Seps 1,167 1,246 1,310 1,364 12% 4%
Beddays 5,418 6,199 6,321 6,399 17% 1%
Post-natal Admission Seps 147 138 138 141 -6% 2%
Beddays 371 373 364 363 -2% 0%
Hawkesbury Vaginal Delivery Seps 485 547 584 625 20% 7%
Beddays 1,486 1,615 1,690 1,778 14% 5%
Ante-natal Admission Seps 297 328 344 367 16% 7%
Beddays 410 500 517 545 26% 5%
Caesarean Delivery Seps 263 255 270 288 3% 6%
Beddays 1,266 1,080 1,111 1,153 -12% 4%
Post-natal Admission Seps 20 20 20 21 1% 6%
Beddays 49 45 44 46 -9% 4%
Blue Mountains Vaginal Delivery Seps 168 155 163 168 -3% 3%
Beddays 529 450 464 470 -12% 1%
Ante-natal Admission Seps 85 77 79 82 -7% 3%
Beddays 108 104 106 109 -2% 3%
Post-natal Admission Seps 55 65 67 69 22% 3%
Beddays 249 261 265 265 6% 0%
Caesarean Delivery Seps 43 65 65 65 50% 0%
Beddays 107 175 170 167 59% -2%
Lithgow Vaginal Delivery Seps 134 121 117 112 -13% -4%
Beddays 451 356 336 316 -26% -6%
Ante-natal Admission Seps 101 98 94 92 -7% -2%
Beddays 132 136 130 126 -2% -3%
Caesarean Delivery Seps 68 50 48 46 -29% -5%
Beddays 195 202 188 175 -3% -7%
Post-natal Admission Seps 5 7 6 6 27% -3%
Beddays 9 17 16 15 73% -5%
Total Seps 7,147 7,647 7,999 8,347 12% 4%
Total Beddays 20,968 22,672 23,197 23,734 11% 2%

NBMLHD Healthcare Services Plan 2012-2022
Data Reference Book DRB.73
Table 6.15 Historical and Projected Obstetric Activity by Enhanced Service Related Groups (all ages) for NBMLHD from 2010/11 to 2026/27
Historical Projected % change
ESRG Type 2011 2017 2022 2027 2011-22 2022-27
Vaginal Delivery Seps 3,230 3,537 3,727 3,894 15% 4%
Beddays 8,832 9,993 10,305 10,600 17% 3%
Ante-natal Admission Seps 2,149 2,266 2,347 2,453 9% 4%
Beddays 4,472 4,327 4,414 4,552 -1% 3%
Caesarean Delivery Seps 1,553 1,615 1,696 1,767 9% 4%
Beddays 7,128 7,743 7,885 7,991 11% 1%
Post-natal Admission Seps 215 229 229 233 7% 2%
Beddays 536 609 594 591 11% 0%
Total Seps 7,147 7,647 7,999 8,347 12% 4%
Total Beddays 20,968 22,672 23,197 23,734 11% 2%
Source: Acute Inpatient Modelling (aIM2012). Notes: Acute, public supply, all ages for SRG Obstetrics. Figures do not include impact of deliveries shifting to Lithgow Hospital from change in role of overnight capacity at Lithgow Private Hospital.

NBMLHD Healthcare Services Plan 2012-2022
Data Reference Book DRB.74
Projected Paediatric Acute Care (Aged <16 years) Table 6.16 Historical and Projected Activity for Paediatric Acute Care(Aged <16 years) for NBMLHD from 2010/11 to 2026/27 - Same Day and Overnight Activity
Historical Projected % change
Category Type 2011 2017 2022 2027 2011-2022 2022-2027
Day Only Seps Medical 258 355 386 410 50% 6%
Surgical 363 423 455 481 25% 6%
Overnight Seps Medical 2,986 3,282 3,419 3,521 14% 3%
Surgical 550 582 626 662 14% 6%
Overnight Beddays Medical 6,179 7,117 7,328 7,482 19% 2%
Surgical 1,060 1,225 1,295 1,347 22% 4%
Total Seps 4,157 4,643 4,886 5,074 18% 4%
Total DO+ON Beddays 7,860 9,120 9,464 9,720 20% 3%
Source: Acute Inpatient Modelling (aIM2012). Notes: Aged <16yrs, acute, public supply activity . Excludes Emergency Department only, qualified and unqualified neonates, perinatology.
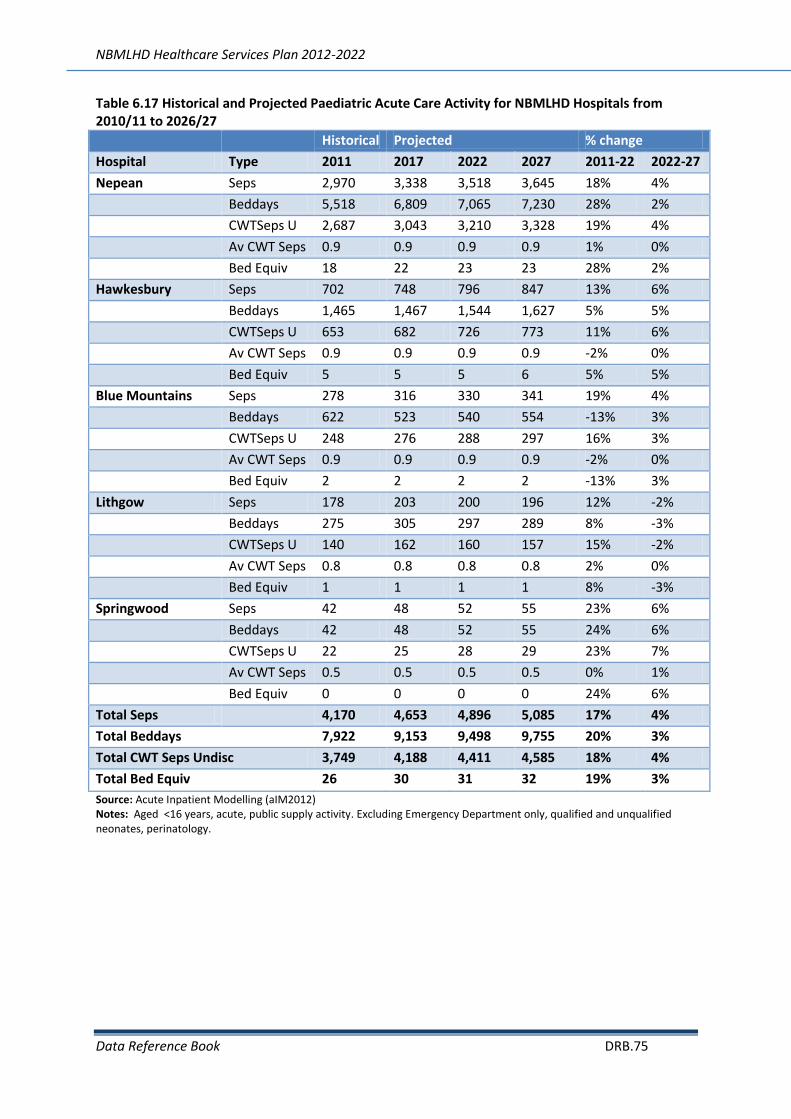
NBMLHD Healthcare Services Plan 2012-2022
Data Reference Book DRB.75
Table 6.17 Historical and Projected Paediatric Acute Care Activity for NBMLHD Hospitals from 2010/11 to 2026/27 Historical Projected % change
Hospital Type 2011 2017 2022 2027 2011-22 2022-27
Nepean Seps 2,970 3,338 3,518 3,645 18% 4%
Beddays 5,518 6,809 7,065 7,230 28% 2%
CWTSeps U 2,687 3,043 3,210 3,328 19% 4%
Av CWT Seps 0.9 0.9 0.9 0.9 1% 0%
Bed Equiv 18 22 23 23 28% 2%
Hawkesbury Seps 702 748 796 847 13% 6%
Beddays 1,465 1,467 1,544 1,627 5% 5%
CWTSeps U 653 682 726 773 11% 6%
Av CWT Seps 0.9 0.9 0.9 0.9 -2% 0%
Bed Equiv 5 5 5 6 5% 5%
Blue Mountains Seps 278 316 330 341 19% 4%
Beddays 622 523 540 554 -13% 3%
CWTSeps U 248 276 288 297 16% 3%
Av CWT Seps 0.9 0.9 0.9 0.9 -2% 0%
Bed Equiv 2 2 2 2 -13% 3%
Lithgow Seps 178 203 200 196 12% -2%
Beddays 275 305 297 289 8% -3%
CWTSeps U 140 162 160 157 15% -2%
Av CWT Seps 0.8 0.8 0.8 0.8 2% 0%
Bed Equiv 1 1 1 1 8% -3%
Springwood Seps 42 48 52 55 23% 6%
Beddays 42 48 52 55 24% 6%
CWTSeps U 22 25 28 29 23% 7%
Av CWT Seps 0.5 0.5 0.5 0.5 0% 1%
Bed Equiv 0 0 0 0 24% 6%
Total Seps 4,170 4,653 4,896 5,085 17% 4%
Total Beddays 7,922 9,153 9,498 9,755 20% 3%
Total CWT Seps Undisc 3,749 4,188 4,411 4,585 18% 4%
Total Bed Equiv 26 30 31 32 19% 3%
Source: Acute Inpatient Modelling (aIM2012) Notes: Aged <16 years, acute, public supply activity. Excluding Emergency Department only, qualified and unqualified neonates, perinatology.

NBMLHD Healthcare Services Plan 2012-2022
Data Reference Book DRB.76
Table 6.18 Historical and Projected Paediatric Activity for NBMLHD Hospitals by Top 15 Service Related Groups (Acute, Aged <16 years) from 2010/11 to 2026/27
Source: Acute Inpatient Modelling (aIM2012). Notes: Aged <16 years, acute, public supply activity. Excluding Emergency Department only, qualified and unqualified neonates, perinatology.
Historical Projected % change
Service Related Group Type 2011 2017 2022 2027 2011-22 2022-27
Respiratory Medicine Seps 1,039 1,154 1,226 1,283 18% 5%
Beddays 2,345 2,492 2,576 2,639 10% 2%
ENT and Head and Neck Seps 875 892 953 1,003 9% 5%
Beddays 1,224 1,189 1,259 1,314 3% 4%
Orthopaedics Seps 519 574 603 626 16% 4%
Beddays 881 1,073 1,102 1,126 25% 2%
Gastroenterology Seps 376 459 464 467 23% 1%
Beddays 681 895 909 917 33% 1%
Non Subspecialty Surgery Seps 319 358 375 389 18% 4%
Beddays 621 758 792 818 28% 3%
Non Subspecialty Medicine Seps 320 359 379 393 18% 4%
Beddays 747 925 973 1,010 30% 4%
Immunology and Infections Seps 239 301 312 319 30% 2%
Beddays 432 571 586 598 36% 2%
Neurology Seps 121 123 129 133 7% 3%
Beddays 288 278 289 296 0% 3%
Plastic and Reconst. Surgery Seps 41 51 53 54 29% 2%
Beddays 82 110 111 112 36% 1%
Dentistry Seps 25 47 51 53 102% 6%
Beddays 26 48 52 55 100% 6%
Dermatology Seps 44 49 52 55 19% 5%
Beddays 72 108 113 116 56% 3%
Neurosurgery Seps 42 37 39 40 -8% 3%
Beddays 56 75 78 80 39% 3%
Drug and Alcohol Seps 31 35 35 36 14% 1%
Beddays 41 53 54 54 32% 0%
Endocrinology Seps 30 40 43 46 44% 6%
Beddays 42 107 110 113 163% 2%
Cardiology Seps 23 28 30 31 30% 4%
Beddays 35 60 65 68 85% 5%
Other SRGs Seps 113 136 142 147 26% 3%
Beddays 287 378 393 405 37% 3%
Total Seps 4,157 4,643 4,886 5,074 18% 4%
Total Beddays 7,860 9,120 9,464 9,720 20% 3%
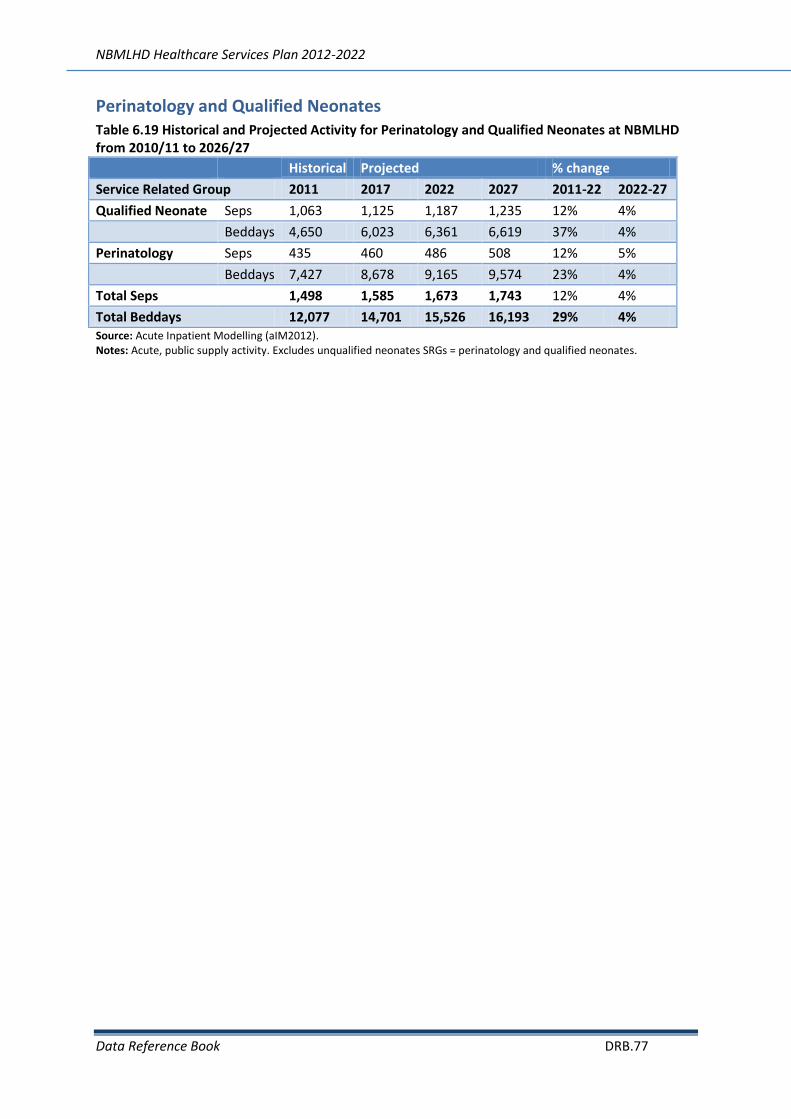
NBMLHD Healthcare Services Plan 2012-2022
Data Reference Book DRB.77
Perinatology and Qualified Neonates Table 6.19 Historical and Projected Activity for Perinatology and Qualified Neonates at NBMLHD from 2010/11 to 2026/27
Historical Projected % change
Service Related Group 2011 2017 2022 2027 2011-22 2022-27
Qualified Neonate Seps 1,063 1,125 1,187 1,235 12% 4%
Beddays 4,650 6,023 6,361 6,619 37% 4%
Perinatology Seps 435 460 486 508 12% 5%
Beddays 7,427 8,678 9,165 9,574 23% 4%
Total Seps
1,498 1,585 1,673 1,743 12% 4%
Total Beddays 12,077 14,701 15,526 16,193 29% 4% Source: Acute Inpatient Modelling (aIM2012). Notes: Acute, public supply activity. Excludes unqualified neonates SRGs = perinatology and qualified neonates.

NBMLHD Healthcare Services Plan 2012-2022
Data Reference Book DRB.78
Sub-Acute Inpatient Care Projections Table 6.20 NBMLHD Hospital Sub-Acute Care Activity Projections by Hospital from 2010/11 to 2026/27
Historical Projected % change
Hospital Type 2011 2017 2022 2027 2011-22 2022-27
Nepean Seps 797 1,070 1,317 1,581 65% 20%
Beddays 12,549 17,600 20,752 23,976 65% 16%
Bed Equiv 38 54 63 73 65% 16%
Blue Mountains Seps 420 428 502 576 20% 15%
Beddays 7,273 7,144 8,199 9,218 13% 12%
Bed Equiv 22 22 25 28 13% 12%
Springwood Seps 412 443 542 658 32% 21%
Beddays 8,173 7,657 9,043 10,621 11% 17%
Bed Equiv 25 23 28 32 11% 17%
Lithgow Seps 67 103 133 162 98% 22%
Beddays 1,044 1,158 1,296 1,431 24% 10%
Bed Equiv 3 4 4 4 24% 10%
Hawkesbury Seps 1 3 4 4
Beddays 3 58 63 71
Bed Equiv 0 0 0 0
Total Seps 1,697 2,048 2,498 2,982 47% 19%
Total Beddays 29,042 33,617 39,353 45,317 36% 15%
Total Subacute Bed Equiv 88 102 120 138 36% 15%
Source: Sub-Acute Inpatient Modelling (SiAM2012). Notes: All ages, sub and non-acute activity. Excludes admit and discharge from Emergency Department.

NBMLHD Healthcare Services Plan 2012-2022
Data Reference Book DRB.79
Table 6.21 NBMLHD Hospital Sub-Acute Care Activity Projections by Care Type from 2010/11 to 2026/27
Source: Sub-Acute Inpatient Modelling (SiAM2012). Notes: All ages, sub and non-acute activity. Excludes admit and discharge from Emergency Department.
Historical Projected % change
Service Related Group Data 2011 2017 2022 2027 2011-2022 2022-2027
Rehabilitation Seps 984 1,261 1,563 1,884 59% 21%
Beddays 19,711 20,694 24,738 29,034 26% 17%
Bed Equiv 60 63 75 88 26% 17%
Psychogeriatric Care Seps 24 22 27 32 14% 18%
Beddays 352 571 675 768 92% 14%
Bed Equiv 1 2 2 2 92% 14%
Palliative Care Seps 309 408 476 547 54% 15%
Beddays 3,087 5,078 5,868 6,665 90% 14%
Bed Equiv 9 15 18 20 90% 14%
Maintenance Seps 380 357 432 518 14% 20%
Beddays 5,892 7,274 8,071 8,849 37% 10%
Bed Equiv 18 22 25 27 37% 10%
Total Seps 1,697 2,048 2,498 2,982 47% 19%
Total Beddays 29,042 33,617 39,353 45,317 36% 15%
Total Bed Equiv 88 102 120 138 36% 15%

NBMLHD Healthcare Services Plan 2012-2022
Data Reference Book DRB.80
Table 6.22 NBMLHD Hospital Sub-Acute Care Activity Projections by Care Type and from 2010/11 to 2026/27
Historical Projected %change
Hospital Service Related Group
Type 2011 2017 2022 2027 2011-22 2022-27
Nepean Rehabilitation Seps 456 631 787 953 73% 21%
Beddays 9,265 10,497 12,576 14,757 36% 17%
Bed Equiv 28 32 38 45 36% 17%
Psychogeriatric Care Seps 23 22 27 32 19% 18%
Beddays 340 570 674 768 98% 14%
Bed Equiv 1 2 2 2 98% 14%
Palliative Care Seps 145 245 289 337 100% 16%
Beddays 1,252 3,045 3,551 4,072 184% 15%
Bed Equiv 4 9 11 12 184% 15%
Maintenance Seps 173 173 214 259 24% 21%
Beddays 1,692 3,488 3,950 4,379 133% 11%
Bed Equiv 5 11 12 13 133% 11%
Blue Mountains
Rehabilitation Seps 267 296 352 407 32% 16%
Beddays 5,111 5,117 5,975 6,827 17% 14%
Bed Equiv 16 16 18 21 17% 14%
Psychogeriatric Care Seps 1 0 0 0 -91% 0%
Beddays 12 1 1 1 -93% -1%
Bed Equiv 0 0 0 0
Palliative Care Seps 83 78 88 97 6% 11%
Beddays 768 942 1,054 1,159 37% 10%
Bed Equiv 2 3 3 4 37% 10%
Maintenance Seps 69 54 63 72 -8% 15%
Beddays 1,382 1,084 1,170 1,231 -15% 5%
Bed Equiv 4 3 4 4 -15% 5%
Springwood Rehabilitation Seps 252 290 360 440 43% 22%
Beddays 5,227 4,851 5,905 7,115 13% 20%
Bed Equiv 16 15 18 22 13% 20%
Palliative Care Seps 47 50 59 68 25% 16%
Beddays 644 651 766 886 19% 16%
Bed Equiv 2 2 2 3 19% 16%
Maintenance Seps 113 103 124 150 9% 21%
Beddays 2,302 2,156 2,371 2,620 3% 10%
Bed Equiv 7 7 7 8 3% 10%
Lithgow Rehabilitation Seps 9 44 65 84 618% 30%
Beddays 108 230 282 335 161% 19%
Bed Equiv 0 1 1 1 161% 19%
Palliative Care Seps 34 34 39 44 15% 12%
Beddays 423 425 481 531 14% 10%

NBMLHD Healthcare Services Plan 2012-2022
Data Reference Book DRB.81
Historical Projected %change
Hospital Service Related Group
Type 2011 2017 2022 2027 2011-22 2022-27
Bed Equiv 1 1 1 2 14% 10%
Maintenance Seps 24 25 29 34 21% 16%
Beddays 513 502 532 565 4% 6%
Bed Equiv 2 2 2 2 4% 6%
Hawkesbury Palliative Care Seps 0 1 1 1 7%
Beddays 0 15 16 17 8%
Bed Equiv 0 0 0 0 8%
Maintenance Seps 1 2 2 3 127% 25%
Beddays 3 43 48 54 1486% 14%
Bed Equiv 0 0 0 0
Total Seps 1,697 2,048 2,498 2,982 47% 19%
Total Beddays 29,042 33,617 39,353 45,317 36% 15%
Total Bed Equiv 88 102 120 138 36% 15%
Source: Sub-Acute Inpatient Modelling (SiAM2012). Notes: All ages, sub and non-acute activity. Excludes admit and discharge from Emergency Department.

NBMLHD Healthcare Services Plan 2012-2022
Data Reference Book DRB.82
Table 6.23 NBMLHD Hospital Sub-Acute Care Provision by LGA of Residence in 2010/11
Hospital LGA Data 2011
Nepean Penrith Seps 513
Beddays 8,163
Other NSW Seps 104
Beddays 1,774
Blue Mountains Seps 119
Beddays 1,576
Hawkesbury Seps 48
Beddays 944
Lithgow Seps 8
Beddays 64
Interstate/Other Seps 5
Beddays 28
Nepean Total Seps 797
Nepean Total Beddays 12,549
Blue Mountains Blue Mountains Seps 309
Beddays 5,359
Lithgow Seps 24
Beddays 478
Penrith Seps 51
Beddays 776
Other NSW Seps 21
Beddays 301
Hawkesbury Seps 9
Beddays 273
Interstate/Other Seps 6
Beddays 86
Blue Mountains Total Seps 420
Blue Mountains Total Beddays 7,273
Springwood Penrith Seps 215
Beddays 4,542
Blue Mountains Seps 149
Beddays 2,752
Other NSW Seps 35
Beddays 611
Hawkesbury Seps 9
Beddays 198
Interstate/Other Seps 4
Beddays 70
Lithgow Seps
Beddays

NBMLHD Healthcare Services Plan 2012-2022
Data Reference Book DRB.83
Hospital LGA Data 2011
Springwood Total Seps 412
Springwood Total Beddays 8,173
Lithgow Lithgow Seps 62
Beddays 1,008
Other NSW Seps 3
Beddays 22
Interstate/Other Seps 1
Beddays 1
Blue Mountains Seps 1
Beddays 13
Lithgow Total Seps 67
Lithgow Total Beddays 1,044
Hawkesbury Hawkesbury Seps 0
Beddays
Other NSW Seps 1
Beddays 3
Hawkesbury Total Seps 1
Hawkesbury Total Beddays 3
Total Seps 1,697
Total Beddays 29,042
Source: Sub-Acute Inpatient Modelling (SiAM2012). Notes: All ages, sub and non-acute activity. Excludes admit and discharge from Emergency Department.

NBMLHD Healthcare Services Plan 2012-2022
Data Reference Book DRB.84
Emergency Department Presentations Table 6.24 Projections for Emergency Department Presentations to NBMLHD Hospitals from 2001/02 to 2020/21
Hospitals 2001/02 2006/07 2010/11 2015/16 2020/21
Nepean 39,772 50,995 52,360 65,156 80-85,000
Hawkesbury 17,198 18,292 20,103 22,028 24,658
Blue Mountains 15,500 16,786 17,629 18,134 19,717
Lithgow 18,045 15,037 13,490 14,450 14,485
NBMLHD 73,317 101,110 103,582 119,768 143,860 Source: Heath Information Exchange. *For 2002/03 year
Methodology for Projecting Emergency Department Presentations
Two methods were used to project Emergency Department presentations to Nepean Hospital:
1) Extrapolating the historical Emergency Department presentations from 2001/02 to 2010/11, resulting in 63,158 presentations in 2015/16 and 71,989 presentations in 2020/21.
2) In this approach the 4 LGAs of the NBMLHD were considered for the catchment of Nepean Hospital Emergency Department presentations – Penrith (65%), Blue Mountains (14%), Blacktown (7%) and Hawkesbury (4%), with approximately 10% from other LGAs. The rate of Emergency Department presentations for a population of 1,000 was calculated as follows for each of the LGAs: a) LGA rate = LGA Emergency Department presentations / LGA estimated resident population *
1,000 b) The four NBMLHD LGA rates were projected to 2020/21 by extrapolating past trends from
2001/02 to 2010/11 c) The four projected NBMLHD LGA rates were multiplied by future population estimates to
obtain the projected Emergency Department presentations for each LGA d) For other LGAs, the historical Emergency Department presentations were calculated as
follows: (a) LGA Emergency Department presentations = Total Nepean Hospital Emergency
Department presentations – Sum of 4 LGA Emergency Department presentations
(b) Historical trends of other LGAs were extrapolated to project future Emergency Department presentations
e) Total projected Nepean Hospital Emergency Department presentations were calculated by adding projected Emergency Department presentations from the 4 NBM LHD LGAs and other LGAs.
f) This resulted in 66,488 presentations in 2015/16 and 79,068 presentations in 2020/21. 3) Discussions were then held with clinicians from each of the respective hospitals in the NBMLHD.
Generally there was agreement with the extrapolated figures. Adjustments were made to the Nepean Hospital Emergency Department presentations, linked to expected increases in presentations generated by the National Emergency Access Target.

NBMLHD Healthcare Services Plan 2012-2022
Data Reference Book DRB.85
Mental Health Table 6.25 Projected Mental Health Inpatient Beds, Acute and Non-Acute, NBMLHD by LGA and Age Group to 2016 and 2021 at 80% of Mental Health Clinical Care and Prevention Tool
Projected Year 2016 2021
Local Government Area
Age Group
Acute inpatient beds
Non-acute beds
Inpatient Beds
Acute inpatient beds
Non acute beds
Inpatient Beds
Blue Mountains 0-17 0.7 0.6 1.39 0.8 0.7 1.5
18-64 11.6 7.1 18.67 11.8 7.2 19
65+ 3.1 2.9 5.94 3.6 3.3 6.9
Blue Mountains All Ages 15.4 10.6 26.01 16.2 11.2 27.4
Hawkesbury 0-17 0.7 0.6 1.33 0.8 0.7 1.4
18-64 10.3 6.2 16.5 10.8 6.5 17.3
65+ 2.1 1.9 4 2.5 2.3 4.8
Hawkesbury All Ages 13.1 8.8 21.84 14 9.5 23.5
Penrith 0-17 2.1 1.8 3.99 2.2 1.9 4.2
18-64 30.7 18.6 49.29 31.6 19.2 50.8
65+ 5.1 4.8 9.92 6.1 5.7 11.9
Penrith All Ages 37.9 25.3 63.21 40 26.9 66.8
Lithgow 0-17 0.2 0.1 0.32 0.2 0.1 0.3
18-64 3 1.8 4.81 2.9 1.7 4.6
65+ 1 1 2 1.2 1.1 2.3
Lithgow All Ages 4.2 2.9 7.13 4.2 3 7.2
Total LHD 0-17 3.8 3.2 7.04 3.9 3.4 7.4
18-64 55.6 33.8 89.28 57.1 34.7 91.7
65+ 11.3 10.6 21.87 13.4 12.5 25.9
Total LHD All Ages 70.6 47.6 118.19 74.4 50.6 124.9
Source: MH-CCP v2. Notes: Inpatient beds include Acute, Non-Acute and Very Long Stay (for 18-64 years and 65+ years only). Program places are excluded. NSW Health Population Projections Series 1.2009, Department of Planning and Statewide Services Development Branch, NSW Health, March 2009.

NBMLHD Healthcare Services Plan 2012-2022
Data Reference Book DRB.86
Table 6.26 Projected Mental Health Community and Inpatient FTEs and Inpatient beds by LHD, LGA and age group for NBMLHD to 2021
Source: MH-CCP v2 , NSW Health Population Projection Series 1.2009 Department of Planning and Statewide Services Development Branch, NSW Health March 2009. Notes: Inpatient FTEs excludes 'Place Based Clinical Staff', Inpatient beds include Acute, Non-acute and Very Long stay (VLS for 18-64 and 65+ only), Program places are excluded.
LGA Population 2021
Community FTE (100% MHCCP)
80% community
Inpatient FTE (100% MHCCP)
Inpatient FTE (80% MHCCP)
Inpatient Beds (100% MHCCP)
Acute inpatient beds (100%)
Non acute beds
Inpatient Beds (100% MHCCP)
Blue Mountains (C) 0-17 18,849 15.6 12.5 3.9 3.1 1.8 1.0 0.8 1.8
18-64 47,837 36.7 29.3 42.5 34.0 23.8 14.8 9.0 23.8
65+ 15,258 8.9 7.1 14.6 11.7 8.7 4.5 4.2 8.7
Blue Mountains (C) All Ages 81,944 61.2 49.0 60.9 48.7 34.2 20.2 14.0 34.2
Hawkesbury 0-17 18,412 15.3 12.2 3.8 3.0 1.8 0.9 0.8 1.8
18-64 43,438 33.3 26.6 38.6 30.9 21.6 13.4 8.2 21.6
65+ 10,620 6.2 5.0 10.2 8.1 6.0 3.1 2.9 6.0
Hawkesbury All Ages 72,470 54.8 43.8 52.5 42.0 29.4 17.5 11.9 29.4
Penrith 0-17 54,428 45.2 36.1 11.2 8.9 5.2 2.8 2.4 5.2
18-64 127,721 97.9 78.3 113.4 90.7 63.5 39.5 24.0 63.5
65+ 26,164 15.3 12.2 25.0 20.0 14.8 7.7 7.2 14.8
Penrith All Ages 208,313 158.3 126.7 149.6 119.7 83.5 50.0 33.6 83.5
Lithgow 0-17 4,059 3.4 2.7 0.8 0.7 0.4 0.2 0.2 0.4
18-64 11,587 8.9 7.1 10.3 8.2 5.8 3.6 2.2 5.8
65+ 5,007 2.9 2.3 4.8 3.8 2.8 1.5 1.4 2.8
Lithgow All Ages 20,654 15.2 12.1 15.9 12.7 9.0 5.3 3.7 9.0
Total LHD 0-17 95747 79.5 63.6 19.6 15.7 9.2 4.9 4.3 9.2
18-64 230584 176.8 141.4 204.8 163.8 114.6 71.3 43.3 114.6
65+ 57049 33.3 26.6 54.5 43.6 32.3 16.7 15.6 32.3
Total LHD All Ages 383381 289.5 231.6 278.9 223.1 156.2 93.0 63.2 156.2

NBMLHD Healthcare Services Plan 2012-2022
Data Reference Book DRB.87
Table 6.27 Projected Mental Health, Community and Inpatient FTEs and Inpatient beds by groups for NBMLHD to 2021
Source: MH-CCP v2, NSW Health Population Projection Series 1.2009 Department of Planning and Statewide Services Development Branch, NSW Health March 2009. Notes: MHCCP predicts clinical staff FTEs. Often total FTE counts reported at LHD level include administrative, support and management positions. * Includes 3FTE Mental Health Telephone Access Line (1800).
2012 (actual) 2012 - 100% 2012 - 80% 2016 - 100% 2016 - 80% 2021 - 100% 2021 - 80%
Ambulatory Care Clinical FTEs Full Time Employees
Ambulatory Care only (+/- CBOS), (+/- Aged Care) 94.71 186.2 149.0 191.8 153.4 200.1 160.0
Ambulatory Care around Inpatient episodes 27.04 * 67.8 54.2 70.2 56.1 73.4 58.7
Ambulatory Support for Program Places 12.1 9.7 13.5 10.8 15.2 12.1
Total Ambulatory Care Clinical FTEs 121.75 266.1 212.9 275.5 220.4 288.6 230.9
All Inpatient Care FTEs Full Time Employees
Inpatient Clinical Staff 252.0 201.6 263.5 210.8 278.1 222.5
Place Based Clinical Staff 9.0 7.2 9.3 7.4 9.5 7.6
Total Inpatient Care FTEs 261.1 208.9 272.8 218.2 287.6 230.1
Bed and Program Places Beds
A Acute IP Beds 54 84.7 67.8 88.4 70.7 93.1 74.5
B Non-Acute IP Beds 0 22.0 17.6 23.3 18.7 25.2 20.1
C VLS beds 0 34.4 27.5 36.0 28.8 37.8 30.3
D CAMHS 0 0.7 0.6 0.7 0.6 0.8 0.6
E Supported Living in the Community (SLC) 0 7.5 6.0 7.7 6.2 7.9 6.3
54 149.3 119.4 156.1 124.9 164.8 131.8

NBMLHD Healthcare Services Plan 2012-2022
Data Reference Book DRB.88
Operating Theatres and Procedure Rooms Table 6.28 Projected Operating Theatres and Procedural Rooms in NBMLHD Facilities from 2012 to 2022
Facility Number of Operating Theatres
2012 2022
Nepean Hospital 14 16-20
Hawkesbury Hospital 4 4
Blue Mountains Hospital 2 2
Springwood Hospital 1 1
Lithgow Hospital 4 4
Total 25 27-30

NBMLHD Healthcare Services Plan 2012-2022
Data Reference Book DRB.89
Renal Dialysis Table 6.29 Proposed Development of Facility-Based Dialysis Capacity (spaces) across the Western Renal Service to 2021
LHD Type Facility Current Projected
2011 2013 2016 2021
WSLHD Satellite Blacktown Regional Dialysis Centre
22 22 22 22
Auburn Community Dialysis Centre
15 15 15 15
Hospital Westmead 15 15 15 15
Blacktown (Note 2) 4 8 12
Total 52 56 60 64
NBMLHD Satellite Penrith Community Dialysis Centre
15 15 22 22
Blue Mountain Community Dialysis Centre
6 6 12
Hospital Nepean (Note 3) 2 5 5 12
Total 17 29 36 46
Both Satellite Potential Locations : Rouse Hill, Mount Druitt, and/or Windsor (Note 4)
12 22
Total Western Renal Service 69 85 108 132
Projected patient numbers* (as per table 4) 23 311 420 542
Space requirements (1:4 patients) (Note 5) 60 78 105 136
Space requirements (1:3.2 patients) (Note 5) 74 97 131 169
Private Dialysis
Satellite Norwest private Hospital
Patients (Note 6) 15 30 45 60
Chair Capacity (Note 7) 15 15 15 15
Public and private chair capacity 84 100 123 147
Patient Numbers excluding private dialysis capacity(Note 8)
223 281 375 482
Space requirements (1:4 patients) 56 70 94 121
Space requirements (1:3.2 patients) 70 88 117 151
NB. Shaded cells highlight services/locations for growth * Estimated number patients with chronic kidney disease living in Western Renal Service LGAs who will require facility based dialysis care. Excludes patients who require acute dialysis treatment as part of an acute inpatient episode of care. Notes 1. Location of Auburn CDC (in Auburn Hospital) is interim. A suitable alternative location will need to be identified and
timeframe will be reviewed by WS LHD (potentially not before 2016 but by 2021). 2. Blacktown Mount Druitt Hospital Expansion Stage 1 includes 4 spaces with expansion to 8. Projections identify potential
expansion to 12 spaces by 2021. Estimated completion for Stage 1 is 2015/16, meaning a shortfall in in-centre capacity..

NBMLHD Healthcare Services Plan 2012-2022
Data Reference Book DRB.90
3. Potential for further expansion of the unit to 12 spaces has been factored into planning for the current expansion from 2 to 8 spaces (part of the Nepean Hospital Stage 3 development) ie. the location of the unit provides the potential to expand into an adjacent area but would require relocation of the incumbent service/occupants)
4. Need to establish new centre(s) to cater for these areas is anticipated. Requirements will be reviewed annually. 5. Number of spaces required is shown based on 1 space per 4 patients (operating 6 days per week, 2 shifts per day; this
represents maximum utilisation) and 1 space per 3.2 patients noting the following:
NSW average use is 2.5 patients per space. Projections are based on 1: 4 may underestimate future requirements.
Current average across Western Renal Service is 1: 3.2. A more realistic estimate of throughput and allows capacity to manage peaks in demand ie. to manage the variability in acute dialysis activity.
Level of throughput may vary at centres eg. establishing a service in Blue Mountains will improve local access but may operate at a lower throughput level dependent on patient numbers.
Throughput of 2 shifts per day is a compromise between efficiency (staff and capital) to provide dialysis at socially acceptable times. Operating a third evening shift would be more efficient but not patient focused.
6. Assumes a steady increase in patients accessing private haemodialysis treatment at Norwest Private Hospital. 7. Assumes no increase in private dialysis capacity within the WRS region to 2021.

NBMLHD Healthcare Services Plan 2012-2022
Data Reference Book DRB.91
Acute Renal Medicine Table 6.30 Current and Projected Activity for Acute Renal Medicine* from 2008/09 to 2021/22
Local health District Actual Projected Activity
2009 2017 2022
Seps Beddays Seps Beddays Seps Beddays
Western Sydney 1,009 4,605 1,132 4,924 1,330 5,734
Nepean Blue Mountains 313 2,719 335 2,669 392 3,119 Source: Flowinfo v11.2. Notes: Includes Day only and Overnight. Excludes ED admit and discharge.* Service Related Group: Renal Medicine.

NBMLHD Healthcare Services Plan 2012-2022
Data Reference Book DRB.92
Cancer – Chemotherapy and Radiation Oncology Table 6.31 Projected Chemotherapy Requirements in the NBMLHD to 2021
Scenario Chairs Additional chair requirement from current (15 NCCC, 2 Lithgow)
2011 2016 2021 2011 2016 2021
Scenario 1 ( Chemo + non-Chemo Chairs at 1.2 treatments per day)
37 43 49 20 26 32
Scenario 2 ( Chemo + non-Chemo Chairs at 2.1 treatments per day)
21 24 28 4 7 11
Notes: NCCC= Nepean Comprehensive Cancer Centre.
Table 6.32 Projected Cancer Incidence in NBMLHD, 2011-2021
Cancer Type 2011 2016 2021
Head and Neck 38 40 42
Upper GI 119 136 156
Colon 125 145 168
Rectum 83 96 110
Lung 136 153 173
Melanoma 154 179 209
Breast 202 218 233
Cervix 9 8 9
Ovarian 18 19 20
Prostate 298 374 439
Brain 23 25 29
Thyroid and other endocrine 39 48 58
Non Hodgkins lymphoma 62 72 81
Leukaemia 39 44 49
Unknown primary 58 62 66
Myelodysplasia 30 33 38
Other 236 267 300
All cancer 1,669 1,920 2,179 Source: Tracey E. Central Cancer Registry 2008 data, 2009, version 2, Health Related Population projections, March 2011.