revolutionize the customer experience with motorola mobile retail
TRANSCRIPT

Authorizing SLAM-ER Use From The P-3C With CFD
E. Ray* Naval Air Systems Command, Patuxent River, MD 20670
The process of determining safe separation flight envelopes for release of the SLAM-ER missile from the P-3C platform is presented. Extensive use of Computational Fluid Dynamics (CFD) was employed in lieu of wind tunnel testing. CFD solutions for the aircraft/store mutual interference flowfield were placed into a database for use by Six-Degree of Freedom (6-DOF) trajectory simulation software. Simulated trajectories were used to predict the minimum miss distance between the SLAM-ER and P-3C. Predictions compared favorably with flight test results.
Nomenclature Store trajectories are defined in the Aircraft Axis System, which has its origin at the store center of gravity at release. The origin is fixed with respect to the aircraft and thus translates along the current flight path at the freestream velocity. The axes rotate to maintain constant angular orientation with respect to the current flight path direction. ψ = PSI = Store yaw angle, positive nose right as seen by the pilot, deg. θ = THETA = Store pitch angle, positive nose up, deg. φ = PHI = Store roll angle, positive right wing down, deg. X = Store CG location relative to carriage, positive forward, parallel to aircraft centerline, ft. Y = Store CG location relative to carriage, positive right, as seen by the pilot, ft. Z = Store CG location relative to carriage, positive down, perpendicular to aircraft centerline, ft. CN = CN = Normal force coefficient, positive up, perpendicular to the store axis. CY = CY = Side force coefficient, positive right, looking forward along store centerline. CA = CA = Axial force coefficient, positive rearward, along store centerline. Cl = CLL = Rolling moment coefficient, positive right wing down. Cm = CLM = Pitching moment coefficient, positive nose up. Cn = CLN = Yawing moment coefficient, positive nose right. αAIRCRAFT = Aircraft Angle of Attack, deg. αS = Store Angle of Attack (without induced upwash), positive nose up, as seen by the pilot, deg. 6-DOF = Six-Degree of Freedom. CAD = Computer Aided Design. CFD = Computational Fluid Dynamics. CG = Center of Gravity. CTS = Captive Trajectory System. HPC = High Performance Computing facilities (http://www.hpcmo.hpc.mil). NAVSEP = Navy generalized Six-Degree of Freedom separation simulation software. SLAM-ER = Standoff Land Attack Missile - Expanded Response.
I. Introduction
T HE U.S. Navy is extending the capabilities of traditional anti-submarine and support aircraft to ground-attack roles. In order to permit these new stores to be released from aircraft, an integrated process of simulation and
testing is used. Wind tunnel testing, computer simulation analysis, and flight tests each play integral roles.1 However, when new stores are added to older platforms, the costs and lead times for wind tunnel testing can be prohibitive. Recently, the Navy has been replacing the role of the wind tunnel with Computational Fluid Dynamics (CFD). Using CFD, the capabilities of the S-3B Viking were expanded with the SLAM-ER (AGM-84H/K), an extended-range version of the Standoff Land Attack Missile (SLAM).2 The SLAM-ER differs from the SLAM by * Aerospace Engineer. Store Separation Branch, Building 2187 Unit 5 Suite 1390A. AIAA Member.
American Institute of Aeronautics and Astronautics
1

the addition of complex asymmetric folding wings. Using a similar approach, CFD was used to clear the SLAM-ER from the P-3C Orion maritime patrol aircraft. The P-3C is a low-wing aircraft designed for patrol and anti-submarine warfare, and is powered by four T56-A-14 turboprop engines. A sample CFD solution is shown in Fig. 1.
Incorporating the SLAM-ER on the P-3C was more complicated than with the S-3B. It was unknown if propeller effects needed to be modeled for store separation. The SLAM-ER was to be placed on several of the ten possible external pylons, sometimes with adjacent stores, leading to many more loading configurations than the S-3B. The pylons on the P-3C lack an ejector mechanism, relying solely on gravity for release. Another complication is the potential effect of the open bomb bay on the SLAM-ER at some stations.
Figure 1. Typical P-3C steady-state CFD solution (colored by pressure coefficient) of SLAM-ER (released from Station 14) and data link pod (Station 15).
II. Methodology Rather than using CFD to create a few time-
accurate trajectories similar to those of Captive Trajectory System (CTS) testing3, it was decided to create an aircraft/store grid database of quasi-static solutions in order to “fly” the SLAM-ER through the flowfield. This would allow the simulation of virtually unlimited trajectories off-line, including parametric studies, with merely a 6-DOF code.
For the project time frame, the number of quality CFD solutions would be much smaller than the number of data points available in a typical wind tunnel grid program, so it was necessary to make the most use out of the least number of CFD runs. The S-3B/SLAM-ER program obtained adequate results with a matrix of about 17 store attitude/displacement data points per Mach number, compared with an order of magnitude more for a typical wind tunnel test. Therefore, a similar matrix was used in the P-3C/SLAM-ER program. In order to eliminate Aircraft Angle of Attack as an independent variable, every CFD solution was performed at an appropriate P-3C αAIRCRAFT for a typical loading at the given flight condition. Force and moment coefficients from each CFD solution were placed in an aircraft/store database where they could be interpolated at any desired flight condition. Because some pylon stations were close to the aircraft plane of symmetry, a full-span CFD model was used to eliminate reflection errors. To save run-time, different configurations were sometimes run on opposite sides of the aircraft concurrently.
The structured overset grid or “chimera” technique, introduced by Steger et al.4 and Benek et al.5, was the ideal method for rapid grid generation for the store in several positions under the parent aircraft. The isolated SLAM-ER CFD model, generated directly from Computer Aided Design (CAD) geometry, was already validated with wind tunnel data, as presented in Ref. 1. An existing overset model of the P-3C was used with minor modifications. The preprocessing or “hole cutting” of grids was performed using the PEGSUS software.6 Due to its relatively fast
American Institute of Aeronautics and Astronautics
2

performance, OVERFLOW was the employed flow solver.7 OVERFLOW solves the compressible Navier-Stokes equations using finite differences in space and implicit time-stepping. Because Euler methods would not capture the important effects adequately, all CFD was performed fully viscous. The 1-equation Spalart-Allmaras RT turbulence model was chosen.8 Once a CFD solution was obtained, force and moment coefficients for the SLAM-ER were calculated with the FOMOCO utility.9
A typical composite grid with the P-3C and stores was composed of approximately 16 million grid points. Processes were run on either IBM SP2 or SGI Origin 2000 supercomputers at various High Performance Computing (HPC) centers. Approximately 150 solutions were obtained, each of which converged between 3,300 and 4,300 iterations. Using 13 processors, a typical solution took about 1300 CPU hours, which corresponds to about 120 wall clock hours.
Trajectory simulations were run with NAVSEP, the Navy generalized 6-DOF code. NAVSEP requires both the aircraft/store mutual interference “grid” database as well as the store freestream properties. Extensive freestream data were leveraged from previous SLAM-ER wind tunnel testing. Before each flight was conducted, 6-DOF simulations were performed for a range of parametric conditions including a wide variation of store mass properties and aerodynamic loads, resulting in a family of possible trajectories. These trajectories, along with geometry models of the store and aircraft, were used to determine the minimum miss distances between the SLAM-ER and P-3C. After each flight, a nominal trajectory could be simulated at the exact measured flight condition and compared with flight test data to determine whether the model was simulating adequately. A demonstration of a safe release and a good correlation was required to continue testing the matrix, and ultimately to provide the final flight clearance.
III. Flight Test Results Six release events were conducted. The first three flights were each conducted in the center of the expected
release envelope for three different aircraft loadings. The fourth release was intended to expand the envelope to a higher speed. The fifth and sixth flights were to test emergency jettison capability slower than the launch envelope. The sixth flight also included opening the bomb bay doors. Because the P-3C is not equipped with a digital flight control system, the aircraft Angle of Attack had to be estimated from a P-3C lift-curve slope.
A. Release Event 1 The first flight test point was conducted at a Mach number of 0.512 and 7000 ft. altitude. The SLAM-ER was
released from Station 11, which is outboard on the port wing. Simulated store attitudes and displacements are compared with photogrammetric and telemetry data in Fig. 2. While yaw, roll, and Y-displacement were not in the predicted direction, the small magnitude of these values was not significant and results were bounded within the parametric tolerances, which are not plotted for clarity. Data were obtained at a higher resolution than is plotted.
Longitudinal Displacement
-3
-2.5
-2
-1.5
-1
-0.5
0
0.5
1
0 0.1 0.2 0.3 0.4 0.5 0.6 0.7
Time (sec)
X -
Coo
rdin
ate
(feet
)
SimulationPhotoTelem
Yaw Attitude
-10
-5
0
5
10
0 0.1 0.2 0.3 0.4 0.5 0.6 0.7
Time (sec)
PSI -
Atti
tude
(deg
)
SimulationPhotoTelem
Lateral Displacement
-2
-1.5
-1
-0.5
0
0.5
1
1.5
2
0 0.1 0.2 0.3 0.4 0.5 0.6 0.7
Time (sec)
Y -
Coo
rdin
ate
(feet
)
SimulationPhotoTelem
Pitch Attitude
-15
-10
-5
0
5
0 0.2 0.4 0.6
Time (sec)
THET
A -
Att
itude
(deg
)
SimulationPhotoTelem
Vertical Displacement
0123456789
10
0 0.1 0.2 0.3 0.4 0.5 0.6 0.7Time (sec)
Z -
Coo
rdin
ate
(feet
) SimulationPhotoTelem
Roll Attitude
-40
-30
-20
-10
0
10
20
30
40
0 0.2 0.4 0.6
Time (sec)
PHI -
Att
itude
(deg
)
SimulationPhotoTelem
Figure 2. Event 1 Trajectory, Mach = 0. 513, Altitude = 7,000 ft, αAIRCRAFT ≈ -1.0º, αS ≈ 1.7º
American Institute of Aeronautics and Astronautics
3
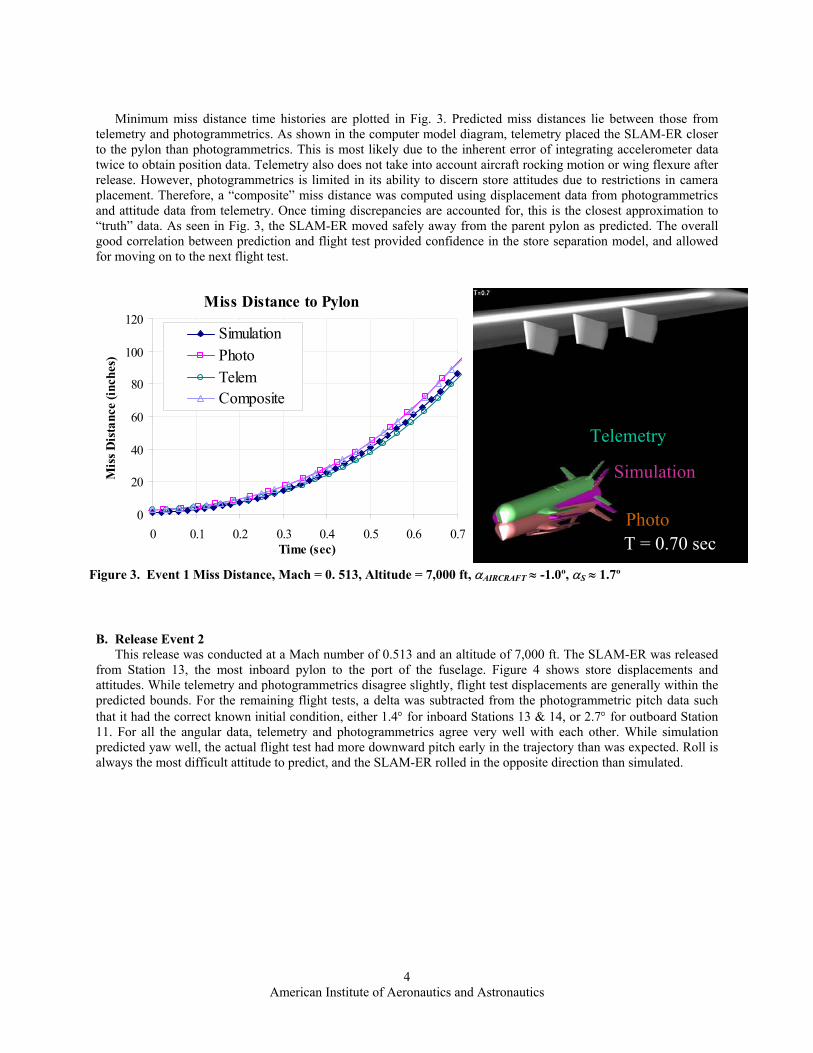
Minimum miss distance time histories are plotted in Fig. 3. Predicted miss distances lie between those from
telemetry and photogrammetrics. As shown in the computer model diagram, telemetry placed the SLAM-ER closer to the pylon than photogrammetrics. This is most likely due to the inherent error of integrating accelerometer data twice to obtain position data. Telemetry also does not take into account aircraft rocking motion or wing flexure after release. However, photogrammetrics is limited in its ability to discern store attitudes due to restrictions in camera placement. Therefore, a “composite” miss distance was computed using displacement data from photogrammetrics and attitude data from telemetry. Once timing discrepancies are accounted for, this is the closest approximation to “truth” data. As seen in Fig. 3, the SLAM-ER moved safely away from the parent pylon as predicted. The overall good correlation between prediction and flight test provided confidence in the store separation model, and allowed for moving on to the next flight test.
Telemetry
Simulation
Miss Distance to Pylon
0
20
40
60
80
100
120
0 0.1 0.2 0.3 0.4 0.5 0.6 0.7Time (sec)
Mis
s Dis
tanc
e (in
ches
)
SimulationPhotoTelemComposite
Figure 3. Event 1 Miss Distance, Mach = 0. 513, Altitude = 7,000 ft, αAIRCRAFT ≈ -1.0º, αS ≈ 1.7º
Photo T = 0.70 sec
B. Release Event 2 This release was conducted at a Mach number of 0.513 and an altitude of 7,000 ft. The SLAM-ER was released
from Station 13, the most inboard pylon to the port of the fuselage. Figure 4 shows store displacements and attitudes. While telemetry and photogrammetrics disagree slightly, flight test displacements are generally within the predicted bounds. For the remaining flight tests, a delta was subtracted from the photogrammetric pitch data such that it had the correct known initial condition, either 1.4° for inboard Stations 13 & 14, or 2.7° for outboard Station 11. For all the angular data, telemetry and photogrammetrics agree very well with each other. While simulation predicted yaw well, the actual flight test had more downward pitch early in the trajectory than was expected. Roll is always the most difficult attitude to predict, and the SLAM-ER rolled in the opposite direction than simulated.
American Institute of Aeronautics and Astronautics
4

Longitudinal Displacement
-3
-2.5
-2
-1.5
-1
-0.5
0
0.5
1
0 0.1 0.2 0.3 0.4 0.5 0.6 0.7
Time (sec)
X -
Coo
rdin
ate
(feet
)
SimulationPhotoTelem
Yaw Attitude
-10
-5
0
5
10
0 0.1 0.2 0.3 0.4 0.5 0.6 0.7
Time (sec)
PSI -
Atti
tude
(deg
)
SimulationPhotoTelem
Lateral Displacement
-1
-0.5
0
0.5
1
1.5
2
2.5
3
0 0.1 0.2 0.3 0.4 0.5 0.6 0.7
Time (sec)
Y -
Coo
rdin
ate
(feet
)
SimulationPhotoTelem
Pitch Attitude
-15
-10
-5
0
5
0 0.2 0.4 0.6
Time (sec)
THET
A -
Att
itude
(deg
)
SimulationPhotoTelem
Vertical Displacement
0123456789
10
0 0.1 0.2 0.3 0.4 0.5 0.6 0.7Time (sec)
Z -
Coo
rdin
ate
(feet
) SimulationPhotoTelem
Roll Attitude
-40
-20
0
20
40
60
80
0 0.2 0.4 0.6
Time (sec)
PHI -
Att
itude
(deg
) SimulationPhotoTelem
Figure 4. Event 2 Trajectory, Mach = 0.513, Altitude = 7,000 ft, αAIRCRAFT ≈ -1.0º, αS ≈ 0.4º
Minimum miss distances between the SLAM-ER and P-3C pylon are compared in Fig. 5. Despite discrepancies between predicted and actual store attitudes, the miss distance agrees very well with flight test, lying in between photogrammetrics and telemetry, again showing that CFD methods can effectively predict subsonic store separation.
Miss Distance to Pylon
0
20
40
60
80
100
120
0 0.1 0.2 0.3 0.4 0.5 0.6 0.7Time (sec)
Mis
s Dis
tanc
e (in
ches
)
SimulationPhotoTelemComposite
Figure 5. Event 2 Miss Distance, Mach = 0.513, Altitude = 7,000 ft, αAIRCRAFT ≈ -1.0º, αS ≈ 0.4º
Telemetry
Simulation Photo
T = 0.61 sec
C. Release Event 3 This event was first release from Station 14 while in proximity to the AWW-13 data link pod, on Station 15.
Therefore, the effects of configuration differences on the SLAM-ER were examined with CFD. Figure 6 shows aerodynamic force and moment coefficients as a function of Z-displacement away from carriage. Note that these plots are for a different Mach number and Angle of Attack than flight test, because they were only intended to show general trends. Horizontal lines representing freestream aerodynamic coefficients at the appropriate store attitude and Mach number are also plotted to demonstrate that loads tend to approach freestream values as the SLAM-ER
American Institute of Aeronautics and Astronautics
5
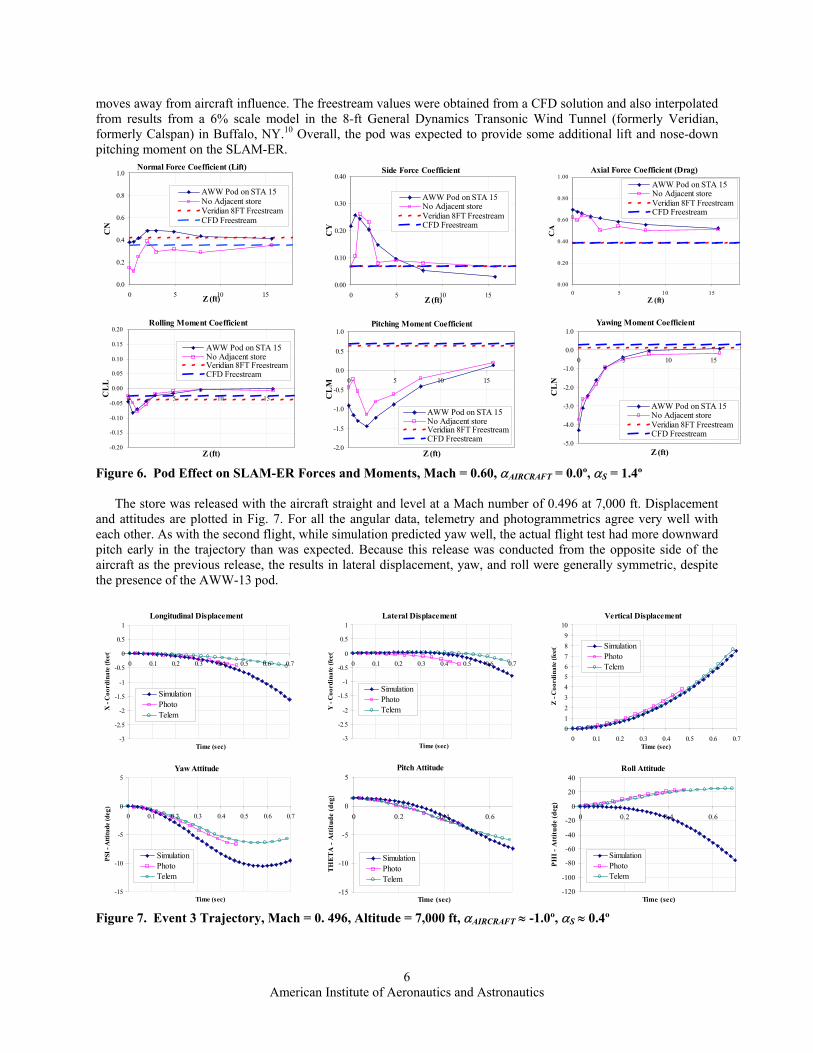
moves away from aircraft influence. The freestream values were obtained from a CFD solution and also interpolated from results from a 6% scale model in the 8-ft General Dynamics Transonic Wind Tunnel (formerly Veridian, formerly Calspan) in Buffalo, NY.10 Overall, the pod was expected to provide some additional lift and nose-down pitching moment on the SLAM-ER.
Normal Force Coefficient (Lift)
0.0
0.2
0.4
0.6
0.8
1.0
0 5 10 15Z (ft)
CN
AWW Pod on STA 15No Adjacent storeVeridian 8FT FreestreamCFD Freestream
Rolling Moment Coefficient
-0.20
-0.15
-0.10
-0.05
0.00
0.05
0.10
0.15
0.20
0 5 10 15
Z (ft)
CL
L
AWW Pod on STA 15No Adjacent storeVeridian 8FT FreestreamCFD Freestream
Side Force Coefficient
0.00
0.10
0.20
0.30
0.40
0 5 10 15Z (ft)
CY
AWW Pod on STA 15No Adjacent storeVeridian 8FT FreestreamCFD Freestream
Pitching Moment Coefficient
-2.0
-1.5
-1.0
-0.5
0.0
0.5
1.0
0 5 10 15
Z (ft)
CL
M
AWW Pod on STA 15No Adjacent storeVeridian 8FT FreestreamCFD Freestream
Axial Force Coefficient (Drag)
0.00
0.20
0.40
0.60
0.80
1.00
0 5 10 15Z (ft)
CA
AWW Pod on STA 15No Adjacent storeVeridian 8FT FreestreamCFD Freestream
Yawing Moment Coefficient
-5.0
-4.0
-3.0
-2.0
-1.0
0.0
1.0
0 5 10 15
Z (ft)
CL
N
AWW Pod on STA 15No Adjacent storeVeridian 8FT FreestreamCFD Freestream
Figure 6. Pod Effect on SLAM-ER Forces and Moments, Mach = 0.60, αAIRCRAFT = 0.0º, αS = 1.4º
The store was released with the aircraft straight and level at a Mach number of 0.496 at 7,000 ft. Displacement and attitudes are plotted in Fig. 7. For all the angular data, telemetry and photogrammetrics agree very well with each other. As with the second flight, while simulation predicted yaw well, the actual flight test had more downward pitch early in the trajectory than was expected. Because this release was conducted from the opposite side of the aircraft as the previous release, the results in lateral displacement, yaw, and roll were generally symmetric, despite the presence of the AWW-13 pod.
Longitudinal Displacement
-3
-2.5
-2
-1.5
-1
-0.5
0
0.5
1
0 0.1 0.2 0.3 0.4 0.5 0.6 0.7
Time (sec)
X -
Coo
rdin
ate
(feet
)
SimulationPhotoTelem
Yaw Attitude
-15
-10
-5
0
5
0 0.1 0.2 0.3 0.4 0.5 0.6 0.
Time (sec)
PSI -
Atti
tude
(deg
)
7
SimulationPhotoTelem
Lateral Displacement
-3
-2.5
-2
-1.5
-1
-0.5
0
0.5
1
0 0.1 0.2 0.3 0.4 0.5 0.6 0.7
Time (sec)
Y -
Coo
rdin
ate
(feet
)
SimulationPhotoTelem
Pitch Attitude
-15
-10
-5
0
5
0 0.2 0.4 0.6
Time (sec)
THET
A -
Att
itude
(deg
)
SimulationPhotoTelem
Vertical Displacement
0123456789
10
0 0.1 0.2 0.3 0.4 0.5 0.6 0.Time (sec)
Z -
Coo
rdin
ate
(feet
7
) SimulationPhotoTelem
Roll Attitude
-120
-100
-80
-60
-40
-20
0
20
40
0 0.2 0.4 0.6
Time (sec)
PHI -
Att
itude
(deg
)
SimulationPhotoTelem
Figure 7. Event 3 Trajectory, Mach = 0. 496, Altitude = 7,000 ft, αAIRCRAFT ≈ -1.0º, αS ≈ 0.4º
American Institute of Aeronautics and Astronautics
6

Both this and the previous flight simulations predicted the SLAM-ER to roll inboard, yet tests showed the SLAM-ER rolling outboard. The most obvious explanation for this would be the lack of modeling of the P-3C propellers. However, this is not an entirely satisfactory explanation, because all four propellers rotate in the same direction (counterclockwise as seen from the front). Therefore, cross flow effects must dominate over propeller swirl effects. The Lockheed Martin Aeronautics Company has had success incorporating propeller actuator disks into CFD models of the P-3C and KC-130J.11, 12 Future store separation analysis would probably benefit from such an addition.
Given store trajectories, minimum miss distances are computed using geometry models of the SLAM-ER, P-3C pylon, and AWW-13 data link pod, which are compared in Fig. 8. Despite discrepancies between predicted and actual store attitudes, the miss distance again agrees very well with flight test, lying in between photogrammetrics and telemetry.
Miss Distance to Pylon & AWW-13 Pod
0
20
40
60
80
100
120
0 0.1 0.2 0.3 0.4 0.5 0.6 0.7Time (sec)
Mis
s Dis
tanc
e (in
ches
)
SimulationPhotoTelemComposite
Figure 8. Event 3 Miss Distance, Mach = 0. 496, Altitude = 7,000 ft, αAIRCRAFT ≈ -1.0º, αS ≈ 0.4º
T = 0.49 sec
Photo
Telemetry
Simulation
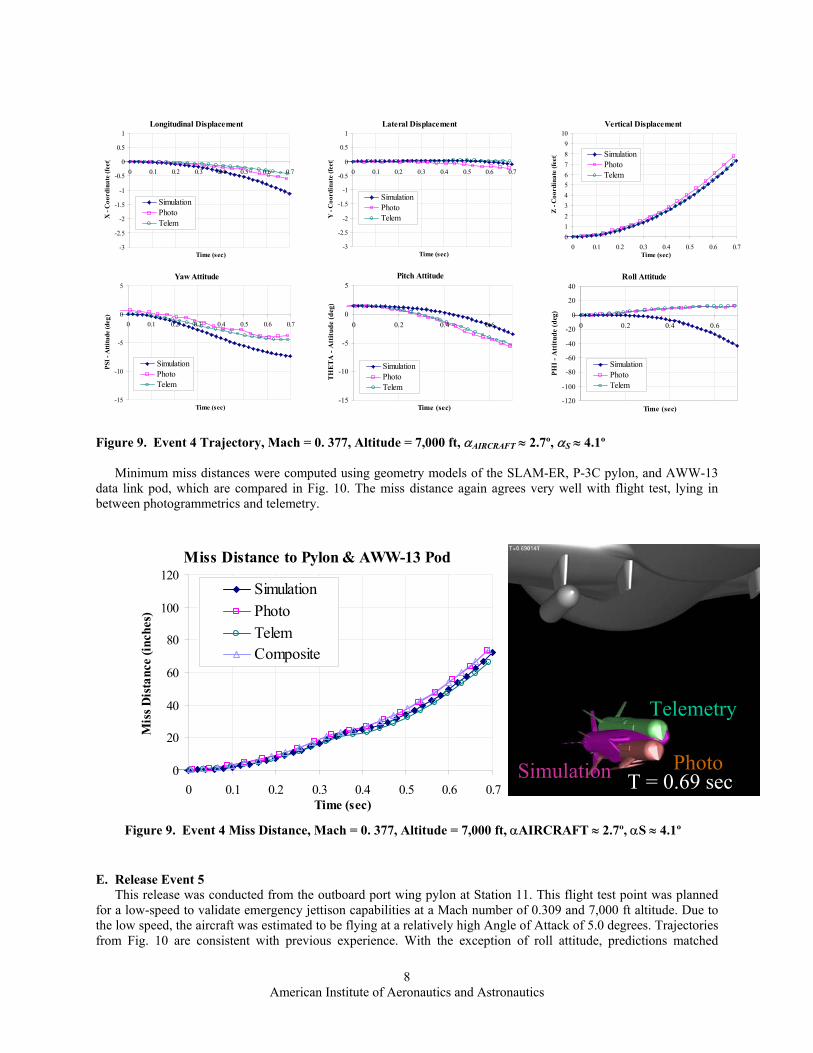
D. Release Event 4 This release was at a Mach number of 0.377 and 7,000 ft altitude. The aircraft Angle of Attack was estimated
from P-3C lift curve slope charts to be at approximately 2.7 degrees. The configuration was the same as event 3. The store displacement and attitudes are plotted in Fig. 9. For all the angular data, telemetry and photogrammetrics agree very well with each other. As with earlier flights, while simulation predicted yaw well, the actual flight test had more downward pitch early in the trajectory than was expected. Again, the SLAM-ER rolled in the opposite direction than simulated.
American Institute of Aeronautics and Astronautics
7
Longitudinal Displacement
-3
-2.5
-2
-1.5
-1
-0.5
0
0.5
1
0 0.1 0.2 0.3 0.4 0.5 0.6 0.7
Time (sec)
X -
Coo
rdin
ate
(feet
)
SimulationPhotoTelem
Yaw Attitude
-15
-10
-5
0
5
0 0.1 0.2 0.3 0.4 0.5 0.6 0.7
Time (sec)
PSI -
Atti
tude
(deg
)
SimulationPhotoTelem
Lateral Displacement
-3
-2.5
-2
-1.5
-1
-0.5
0
0.5
1
0 0.1 0.2 0.3 0.4 0.5 0.6 0.7
Time (sec)
Y -
Coo
rdin
ate
(feet
)
SimulationPhotoTelem
Pitch Attitude
-15
-10
-5
0
5
0 0.2 0.4 0.6
Time (sec)
THET
A -
Att
itude
(deg
)
SimulationPhotoTelem
Vertical Displacement
0123456789
10
0 0.1 0.2 0.3 0.4 0.5 0.6 0.Time (sec)
Z -
Coo
rdin
ate
(feet
7
) SimulationPhotoTelem
Roll Attitude
-120
-100
-80
-60
-40
-20
0
20
40
0 0.2 0.4 0.6
Time (sec)
PHI -
Att
itude
(deg
)
SimulationPhotoTelem
Figure 9. Event 4 Trajectory, Mach = 0. 377, Altitude = 7,000 ft, αAIRCRAFT ≈ 2.7º, αS ≈ 4.1º Minimum miss distances were computed using geometry models of the SLAM-ER, P-3C pylon, and AWW-13
data link pod, which are compared in Fig. 10. The miss distance again agrees very well with flight test, lying in between photogrammetrics and telemetry.
Astronautics
Miss Distance to Pylon & AWW-13 Pod
0
20
40
60
80
100
120
0 0.1 0.2 0.3 0.4 0.5 0.6 0.7Time (sec)
Mis
s Dis
tanc
e (in
ches
)
SimulationPhotoTelemComposite
Figure 9. Event 4 Miss Distance, Mach = 0. 377, Altitude = 7,000 ft, αAIRCRAFT ≈ 2.7º, αS ≈ 4.1º
Telemetry
Photo Simulation T = 0.69 sec
E. Release Event 5 This release was conducted from the outboard port wing pylon at Station 11. This flight test point was planned
for a low-speed to validate emergency jettison capabilities at a Mach number of 0.309 and 7,000 ft altitude. Due to the low speed, the aircraft was estimated to be flying at a relatively high Angle of Attack of 5.0 degrees. Trajectories from Fig. 10 are consistent with previous experience. With the exception of roll attitude, predictions matched
American Institute of Aeronautics and
8

reasonably well with results. The miss distances and diagram in Fig. 11 indicate that this was a benign and safe release.
Longitudinal Displacement
-3
-2.5
-2
-1.5
-1
-0.5
0
0.5
1
0 0.1 0.2 0.3 0.4 0.5 0.6 0.7
Time (sec)
X -
Coo
rdin
ate
(feet
)
SimulationPhotoTelem
Yaw Attitude
-10
-5
0
5
10
0 0.1 0.2 0.3 0.4 0.5 0.6 0.
Time (sec)
PSI -
Atti
tude
(deg
)
7
SimulationPhotoTelem
Lateral Displacement
-2
-1.5
-1
-0.5
0
0.5
1
1.5
2
0 0.1 0.2 0.3 0.4 0.5 0.6 0.7
Time (sec)
Y -
Coo
rdin
ate
(feet
)
SimulationPhotoTelem
Pitch Attitude
-15
-10
-5
0
5
0 0.2 0.4 0.6
Time (sec)
THET
A -
Att
itude
(deg
)
SimulationPhotoTelem
Vertical Displacement
0123456789
10
0 0.1 0.2 0.3 0.4 0.5 0.6 0.7Time (sec)
Z -
Coo
rdin
ate
(feet
) SimulationPhotoTelem
Roll Attitude
-40
-30
-20
-10
0
10
20
30
40
0 0.2 0.4 0.6
Time (sec)
PHI -
Att
itude
(deg
)
SimulationPhotoTelem
Figure 10. Event 5 Trajectory, Mach = 0. 309, Altitude = 7,000 ft, αAIRCRAFT ≈ 5.0º, αS ≈ 7.7º
Miss Distance to Pylon
0
20
40
60
80
100
120
0 0.1 0.2 0.3 0.4 0.5 0.6 0.7Time (sec)
Mis
s Dis
tanc
e (in
ches
)
SimulationPhotoTelemComposite
Figure 11. Event 5 Miss Distance, Mach = 0. 309, Altitude = 7,000 ft, αAIRCRAFT ≈ 5.0º, αS ≈ 7.7º
Telemetry Simulation
Photo T = 0.67 sec
American Institute of Aeronautics and Astronautics
9

F. Release Event 6 This release was conducted from
inboard Station 14 with the data link pod on Station 15. The flight conditions at release were the same as the previous flight. ~16.6”
Figure 12. AP-3C Fit Check of SLAM-ER on Station 13
The unique case of this release was that it included the bomb bay doors in the open position, an event that might occur in an emergency. The close proximity of the rear of the doors to the SLAM-ER can be seen on an Australian AP-3C in Fig. 12.
An approximation of the bay doors (from drawings) was incorporated into the CFD model, as shown in the solution in Fig. 13. Because cavity flows are unsteady by their nature, the actual bomb bay cavity was not modeled.
d Figure 13. CFD solution with of bomb bay doors modele
A comparison of the force and moment coefficients on the SLAM-ER as a function of vertical displacement
from carriage is shown in Fig. 14. Despite some differences from the bay doors, a safe separation was predicted. Freestream values from CFD are plotted as horizontal lines (no wind tunnel data are available at this Mach number).
American Institute of Aeronautics and Astronautics
10

Normal Force Coefficient (Lift)
-0.5
0.0
0.5
1.0
1.5
2.0
0 5 10 15
Z (ft)
CN
Bay Doors ClosedBay Doors OpenCFD Freestream
Rolling Moment Coefficient
-0.3
-0.2
-0.1
0.0
0.1
0.2
0.3
0 5 10 15
Z (ft)
CL
L
Bay Doors ClosedBay Doors OpenCFD Freestream
Side Force Coefficient
-0.8
-0.6
-0.4
-0.2
0.0
0.2
0.4
0.6
0.8
0 5 10 15
Z (ft)
CY
Bay Doors ClosedBay Doors OpenCFD Freestream
Pitching Moment Coefficient
-1.5
-1.0
-0.5
0.0
0.5
1.0
0 5 10 15
Z (ft)
CL
M
Bay Doors ClosedBay Doors OpenCFD Freestream
Axial Force Coefficient (Drag)
0.0
0.2
0.4
0.6
0.8
1.0
0 5 10 15Z (ft)
CA
Bay Doors ClosedBay Doors OpenCFD Freestream
Yawing Moment Coefficient
-5.0
-4.0
-3.0
-2.0
-1.0
0.0
1.0
2.0
0 5 10 15
Z (ft)
CL
N
Bay Doors ClosedBay Doors OpenCFD Freestream
Figure 14. Bay Door Effect on SLAM-ER Forces and Moments, Mach = 0.309, αAIRCRAFT = 5.0º, αS = 6.4º
Figure 15 indicates that the trajectory experienced during flight was more benign than predicted. Figure 16 demonstrates that the SLAM-ER moved safely away from the parent pylon, adjacent data link pod, and bomb bay door as predicted.
Longitudinal Displacement
-3
-2.5
-2
-1.5
-1
-0.5
0
0.5
1
0 0.1 0.2 0.3 0.4 0.5 0.6 0.7
Time (sec)
X -
Coo
rdin
ate
(feet
)
SimulationPhotoTelem
Yaw Attitude
-15
-10
-5
0
5
0 0.1 0.2 0.3 0.4 0.5 0.6 0.
Time (sec)
PSI -
Atti
tude
(deg
)
7
SimulationPhotoTelem
Lateral Displacement
-3
-2.5
-2
-1.5
-1
-0.5
0
0.5
1
0 0.1 0.2 0.3 0.4 0.5 0.6 0.7
Time (sec)
Y -
Coo
rdin
ate
(feet
)
SimulationPhotoTelem
Pitch Attitude
-15
-10
-5
0
5
0 0.2 0.4 0.6
Time (sec)
THET
A -
Att
itude
(deg
)
SimulationPhotoTelem
Vertical Displacement
0123456789
10
0 0.1 0.2 0.3 0.4 0.5 0.6 0.Time (sec)
Z -
Coo
rdin
ate
(feet
7
) SimulationPhotoTelem
Roll Attitude
-120
-100
-80
-60
-40
-20
0
20
40
0 0.2 0.4 0.6
Time (sec)
PHI -
Att
itude
(deg
)
SimulationPhotoTelem
Figure 15. Event 6 Trajectory, Mach = 0. 309, Altitude = 7,000 ft, αAIRCRAFT ≈ 5.0º, αS ≈ 6.4º
American Institute of Aeronautics and Astronautics
11

Miss Distance to Pylon, Pod, & Bay Door
0
20
40
60
80
100
120
0 0.1 0.2 0.3 0.4 0.5 0.6 0.Time (sec)
Mis
s Dis
tanc
e (in
ches
)
SimulationPhotoTelemComposite
Figure 16. Event 6 Miss Distance, Mach = 0. 309, Altitude = 7,000 ft, αAIRCRAFT ≈ 5.0º, αS ≈ 6.4º
7
Photo Telemetry
SimulationT = 0.695 sec
IV. Conclusion The U.S. Navy was able to determine the launch limits for safe separation of the SLAM-ER from the P-3C Orion
with CFD and flight testing, avoiding the cost of wind tunnel testing. This process allowed the Store Separation Branch to authorize releases of the SLAM-ER from general Fleet P-3C aircraft. Using a process similar to the S-3B Viking/SLAM-ER program, CFD was used to create a database of quasi-static forces and moments of the mutual interference between the aircraft and store. This database is similar to the wind tunnel grid method, although only the minimum required data were used. These data then allowed off-line 6-DOF predictions, including parametric studies. Predictions tended to compare favorably with flight test results. Undoubtedly, the largest discrepancy was the lack of modeling propellers. Flight test data itself had uncertainty, with noticeable differences between photogrammetrics and telemetry. Ultimately, safe separation depends on minimum miss distances between the store and aircraft. Excellent miss distance correlations were obtained between simulation and “composite” flight test data.
References 1 Taverna, F. P., Cenko, A., “Navy Integrated T&E Approach to Store Separation,” Paper 13, RTO Symposium on Aircraft
Weapon System Compatibility and Integration, Chester, UK, October 1998. 2 Ray, E., “CFD Applied To Separation Of SLAM-ER From The S-3B,” AIAA Paper 2003-4226, June 2003. 3 Sickles, W. L., Denny, A.G., Nichols, R. H., “Time-Accurate CFD Predictions of the JDAM Separation from an F-18C
Aircraft,” AIAA Paper 2000-0796, January 2000. 4 Steger, J. L., Dougherty, F. C., Benek, J. A., “A Chimera Grid Scheme,” ASME Mini-Symposium on Advances in Grid
Generation, 1982. 5 Benek, J. A., Buning, P. G., Steger, J. L., “A 3-D Chimera Grid Embedding Technique,” AIAA Paper 85-1523, July 1985. 6 Suhs, N. E., Tramel, R.W., “PEGSUS 4.0 User’s Manual,” AEDC-TR-91-8, November 1991. 7 Buning, P.G., “OVERFLOW User’s Manual,” February 1999. 8 Spalart, P. R., Allmaras, S. R., “A One Equation Turbulence Model for Aerodynamic Flows,” AIAA Paper 92-0439,
January 1992. 9 Chan, W. M., Buning, P. G., “User’s Guide for FOMOCO Utilities – Force and Moment Computation Tools for Overset
Grids,” NASA TM 110408, July 1996. 10 Felder, B., et al. “Upgrading the Weapons Integration Testing Capabilities at Calspan’s Transonic Wind Tunnel Facility,”
Prepared for 89th Semi-Annual Meeting of the Supersonic Tunnel Association International, April 1998. 11 Goble, B. D., Hooker, J. R. “Validation of an Unstructured Grid Euler/Navier-Stokes Code on a Full Aircraft with
Propellers,” AIAA Paper 01-1003, January 2001. 12 Hooker, J. R. “Aerodynamic Development of a Refueling Pod for Tanker Aircraft,” AIAA Paper 2002-2805, June 2002.
American Institute of Aeronautics and Astronautics
12