revisions to the state implementation plan (sip) for … · revisions to the state implementation...
TRANSCRIPT

REVISIONS TO THE STATE IMPLEMENTATION PLAN (SIP)FOR THE CONTROL OF OZONE AIR POLLUTION
FIX-UPS TO THE
15% RATE-OF-PROGRESS SIPFOR DALLAS/FORT WORTH, EL PASO,
BEAUMONT/PORT ARTHUR, and HOUSTON/GALVESTONOZONE NONATTAINMENT AREAS
EMPLOYER TRIP REDUCTION PROGRAM SIP
EL PASO SECTION 818ATTAINMENT DEMONSTRATION
POST-1996 RATE-OF-PROGRESS SIPFOR BEAUMONT/PORT ARTHUR AND HOUSTON/GALVESTON
OZONE NONATTAINMENT AREAS
SUMMARY OF THE REVISED 1990 BASE YEAR OZONE NONATTAINMENTAREA STATE IMPLEMENTATION PLAN EMISSION INVENTORY FOR
ALL TEXAS NONATTAINMENT AREAS
TEXAS NATURAL RESOURCE CONSERVATION COMMISSIONP.O. BOX 13087
AUSTIN, TEXAS 78711-3087
RULE LOG NUMBERS 96109, 96110, 96111, 96112, 96113-SIP-AI
July 24, 1996

i
TABLE OF CONTENTS
SECTION VI: CONTROL STRATEGY
A. INTRODUCTION
B. OZONE CONTROL STRATEGY
1. POLICY AND PURPOSE (No change.)
a. Primary Purpose of Plan (No change.)b. Attainment of Ozone Standard (No change.)c. Scope of Plan (No change.)d. Deletion of Nonessential Requirements (No change.)
2. SUMMARY OF THE PRINCIPAL ELEMENTS ADDRESSED WITHIN THIS PLAN (No change.)
a. Definition of Attainment and Nonattainment Areas (No change.)b. Responsibilities for Plan Development (No change.)c. Establishing Baseline Air Quality (No change.)d. Required Emission Reductions (No change.)e. Sources of Emission Reductions (No change.)
3. OZONE CONTROL PLAN FOR 1979 SIP REVISION (No change.)
a. General (No change.)b. Ozone Nonattainment Area Designations in Texas (No change.)c. Planning Procedures and Consultation (No change.)d. Degree of Nonattainment - Selection of Air Quality Baseline (No change.)e. Relationship Between Air Quality Baseline (Design Value) and Emission Reductions
Required to Attain Ambient Air Quality Standard (No change.)f. Identification of Emission Changes (No change.)
4. CONTROL STRATEGY FOR 1979 SIP REVISION (No change.)
a. General (No change.)b. Estimated Emission Reductions (No change.)c. New Source Review (No change.)
5. 1982 HARRIS COUNTY SIP REVISION (No change.)
a. Ozone Control Plan (No change.)b. Control Strategy (No change.)

ii
CONTENTS (Cont.)
6. SIP REVISIONS FOR POST-1982 URBAN NONATTAINMENT AREAS(No change.)
a. Ozone Control Plan (No change.)b. Dallas County Ozone Control Strategy (No change.)c. Tarrant County Ozone Control Strategy (No change.)d. El Paso County Ozone Control Strategy (No change.)
7. SIP REVISIONS FOR 1993 RATE-OF-PROGRESS (Revised.)
a. Ozone Control Plan (Revised.)b. Dallas/Fort Worth Ozone Control Strategy (Revised.)c. El Paso Ozone Control Strategy (Revised.)d. Beaumont/Port Arthur Ozone Control Strategy (Revised.)e. Houston/Galveston Ozone Control Strategy (Revised.)
8. SIP REVISIONS FOR MOBILE SOURCES (Revised.)
a. Vehicle Inspection/Maintenance (I/M) Program (No change.)b. Vehicle Miles Traveled Offset (No change.)c. Employer Trip Reduction Program (Repealed.)
9. SIP REVISIONS FOR THE ATTAINMENT DEMONSTRATION (Revised.)
a. El Paso §818 Attainment Demonstration (Revised.)b. Dallas/Ft Worth Attainment Demonstration (No change.)
10. SIP REVISIONS FOR THE REDESIGNATION AND MAINTENANCE PLANS (No change.)
a. Victoria Redesignation and Maintenance Plan (No change.)
11. SIP REVISIONS FOR THE POST-96 RATE-OF-PROGRESS (Revised.)
a. Ozone Control Plan (Revised.)b. Beaumont/Port Arthur Ozone Control Strategy (Revised.)c. Houston/Galveston Ozone Control Strategy (Revised.)

iii
CONTENTS (Cont.)
12. SOCIAL AND ECONOMIC CONSIDERATIONS OF THE PLAN (No change.)
a. Health Effects (No change.)b. Social and Public Welfare Effects (No change.)c. Economic Effects (No change.)d. Effects on Energy Consumption (No change.)e. Evaluation of the 1982 SIP for Harris County (No change.)f. Evaluation of the Post-1982 SIP for Urban Nonattainment Areas (No change.)g. Evaluation of the 1993 SIP Revisions (No change.)
13. FISCAL AND MANPOWER RESOURCES (No change.)
14. HEARING REQUIREMENTS (Revised.)
a. Requirements (No change.)b. Notification (No change.)c. Public Hearings for 1979 SIP Revisions (No change.)d. Public Hearings for 1982 SIP Revisions (No change.)e. Public Hearings for Post-1982 SIP Revisions (No change.)f. Public Hearings for 1993 SIP Revisions (No change.)g. Public Hearings for the Consolidated SIP Package (Revised.)

iv
15% RATE-OF-PROGRESS PLANLIST OF TABLES
TABLE # TABLE NAME PAGE #
1 Classification of Ozone Nonattainment Areas in Texas N/C
2 Local Health Departments in Texas Nonattainment Areas N/C
3 Regional Planning Organizations in Texas Nonattainment Areas N/C
4 Example--Final Base Year Inventory N/C
5 Example--Rate-Of-Progress (ROP) Base Year Inventory N/C
6 Example--Adjusted Base Year Inventory N/C
7 Example--Calculation of Total Reductions By 1996 N/C
8 Source Categories with Changes to the 1990 Adjusted Base Year EI 17
9 Volatile Organic Compounds (VOC) Emission Reduction Calculations Dallas/Fort Worth Ozone Nonattainment Area 29
10 VOC Emission Reduction Calculations El Paso Ozone Nonattainment Area 30
11 VOC Emission Reduction Calculations Beaumont/Port Arthur Ozone Nonattainment Area 31
12 VOC Emission Reduction Calculations Houston/Galveston Ozone Nonattainment Area 32
13 Banking Offset Ratios in Texas Nonattainment Areas N/C
14 Reductions Due to Rule Effectiveness (RE) Improvements--Area Sources 39
15 Reductions Due to RE Improvements--Point Sources 40
16 Anthropogenic Emissions in the Dallas/Fort Worth Area 55
17 Reductions Due to RE and Reasonably Available Control Technology (RACT), for Point and Area Sources--Dallas/Fort Worth 57

v
LIST OF TABLES (cont.)
TABLE # TABLE NAME PAGE #
18 Estimates Towards ROP State Implementation Plan (SIP), Dallas/Fort Worth 61
19 Anthropogenic Emissions in the El Paso Area 65
20 Reductions Due to RE and RACT for Point and Area Sources--El Paso 66
21 Estimates Towards ROP SIP, El Paso 69
22 Anthropogenic Emissions in the Beaumont/Port Arthur Area 75
23 Reductions Due to RE and RACT for Point and Area Sources-- Beaumont/Port Arthur 77
24 Estimates Towards ROP SIP, Beaumont/Port Arthur 81
25 Anthropogenic Emissions in the Houston/Galveston Area 83
26 Reductions Due to RE and RACT for Point and Area Sources-- Houston/Galveston 85
27 Estimates Towards ROP SIP, Houston/Galveston 89
28 Growth Estimates for the Texas Natural Resource Conservation Commission (TNRCC) Office of Air Quality N/C
29 Public Hearings for the Phase I ROP SIP N/C
30 Public Hearings for the Phase II ROP SIP N/C

vi
EL PASO SECTION 818 ATTAINMENT DEMONSTRATION
LIST OF TABLES
TABLE # TABLE NAME PAGE #
1 Selected Ozone Episodes in the El Paso Ozone Nonattainment Area 98
2 UAM VOC Emissions Inventory Development for 1996 El Paso Attainment Demonstration 99
3 UAM NO Emissions Inventory Development for 1996 El Paso x
Attainment Demonstration 100
4 Rate of Progress VOC Emission Reductions for El Paso 101
5 Attainment Demonstration for El Paso 102

vii
9% POST-96 FIX-UP SIPLIST OF TABLES
TABLE # TABLE NAME PAGE #
1 Classification of Ozone Nonattainment Areas in Texas N/C
2 Local Health Departments in Houston and Galveston N/C
3 Regional Planning Organizations in Houston/Galveston N/C
4 COAST Task Schedule N/C
5 Example: Final Base Year Inventory N/C
6 Example: ROP Base Year Inventory N/C
7 Example: Adjusted Base Year Inventory Relative to 1999 N/C
8 Example: RVP and Fleet Turnover Correction Term N/C
9 Example: Calculation of Total Expected Reductions by 1999(Excluding Growth) N/C
10 Example: Creditable Reductions to Date N/C
11 1999 ROP Required VOC Emissions Target Calculations 106
12 Source Categories with Changes in 1990 Adjusted Base Year EI 109
13 Anthropogenic Emissions in the Houston/Galveston Area 124
14 Estimated Reductions for 1994 ROP SIP: Houston/Galveston 125
15 Projected Growth of TNRCC Office of Air Quality Budget/Staffing N/Cfrom 1994 to 1998
16 Public Hearings for the 9% ROP SIP N/C
17 Public Hearings for the 9% ROP Fix-up SIP (No change.) N/C
18 Public Hearings for the SuperSIP 130

viii
15% RATE-OF-PROGRESS SIPLIST OF APPENDICES
(Appendices that have not changed from the previous submittal are listed as N/C and notincluded in this SIP package.)
APPENDIX # APPENDIX NAME PAGE #
7-A State Implementation Plan (SIP) Revision Victoria Ozone Nonattainment Area Commitment To Petition For Redesignation After Successful Completion of Attainment Monitoring Period N/C
7-B Texas Air Control Board (TACB) Rule Effectiveness Determination N/C
7-C Reasonably Available Control Technology (RACT) Fix-ups N/C
7-D RACT Catch-ups D-1
7- E Discussion of the Control Measure Catalog N/C
7-F SIP Revisions for the Stage II Vapor Recovery Program N/C
7-G Summary of Reductions from Benzene National Emissions Standards for Hazardous Air Pollutants (NESHAPS) N/C
7-H SIP Revision Rate-of-Progress Phase II Commitment/Contingency Measures N/C
7-I Formulas and Calculations of Creditable Emission Reductions I-1
7- J SIP Revision Dallas/Fort Worth Ozone Nonattainment Area -- Commitment To Use Urban Airshed Modeling For Attainment Demonstration N/C

ix
15% RATE-OF-PROGRESS PLANLIST OF APPENDICES (Cont.)
(Appendices that have not changed from the Phase I submittal are listed as N/C and are notincluded in this SIP package.)
APPENDIX # APPENDIX NAME PAGE #
7-K Summary of Transportation Control Measures for Dallas/Fort Worth, El Paso, and Houston/Galveston Ozone Nonattainment Areas K-1
7-L Mobile 5a Documentation for Mobile Source Reductions Credits (Adjusted Base Year) L-1
7-M Mobile 5a Documentation for I/M Corrections N/C
7-N Support Documentation for Shutdown Credits N/C
7-O Mobil 5a Documentation for Mobile Source Reductions Credits (Projected) O-1
7-P Innovative Products Listing for Consumer Products P-1
Appendices are on file with the Texas Natural Resource Conservation Commission and are availableupon request by calling Elizabeth Johnson at (512) 239-1967.

x
9% ROP POST-96 FIX-UP SIPLIST OF APPENDICES
APPENDIX # APPENDIX NAME PAGE #
11-A Alternate Methods of Control N/C
11-B Control Measure Catalog N/C
11-C Creditable Reductions for Houston/Galveston C-1
11-D Mobile5 Runs for Houston/Galveston D-1
11-E UAM Modeling Reports for Beaumont/Port Arthur and Houston/Galveston N/C
11-F Texas' Phased Attainment Demonstration F-1
11-G Transportation Control Measures G-1
11-H RACT Catch-Ups Creditable Reductions H-1
11-I Evaluation of RACT I-1
Appendices are on file with the Texas Natural Resource Conservation Commission and are availableupon request by calling Elizabeth Johnson at (512) 239-1967.

1
VI: Ozone Control Strategy
A. INTRODUCTION
Requirements for State Implementation Plans (SIP) specified in 40 Code of Federal Regulations (CFR)
Part 51.12 provide that "...in any region where existing (measured or estimated) ambient levels of
pollutant exceed the levels specified by an applicable national standard," the plan shall set forth a
control strategy which shall provide for the degree of emission reduction necessary for attainment and
maintenance of such national standard. Ambient levels of sulfur dioxide and oxides of nitrogen (NO ),x
as measured from 1975 through 1977, did not exceed the national standards set for these pollutants
anywhere in Texas. Therefore, no control strategies for these pollutants were included in revisions to
the Texas SIP submitted on April 13, 1979. Control strategies were submitted and approved for
inclusion in the SIP for areas in which measured concentrations of ozone, total suspended particulate
(TSP), or carbon monoxide (CO) exceeded a National Ambient Air Quality Standard (NAAQS) during
the period from 1975 to 1977. On October 5, 1978, the Administrator of the U.S. Environmental
Protection Agency (EPA) promulgated a lead ambient air quality standard. The Federal Clean Air Act
(FCAA) Amendments of 1977 required that each state submit an implementation plan for the control of
any new criteria pollutant. A SIP revision for lead was submitted in March of 1981.
The control strategies submitted in 1979 provided by December 31, 1982 the amount of emission
reductions required by EPA policy to demonstrate attainment of the primary NAAQS, except for ozone
in the Harris County nonattainment area. For that area, an extension to December 31, 1987 was
requested, as provided for in the FCAA Amendments of 1977.

2
Supplemental material, including emission inventories for volatile organic compounds (VOC) and TSP
submitted with the 1979 SIP revisions, is included in Appendices H and O of the 1979 SIP submittal.
Proposals to revise the Texas SIP to comply with the requirements of the FCAA Amendments of 1977
were submitted to EPA on April 13, November 2, and November 21, 1979. On December 18, 1979 (44
FR 75830-74832), EPA approved the proposed revision to the Texas SIP relating to vehicle inspection
and maintenance and extended the deadline for attainment of the NAAQS for ozone in Harris County
until December 31, 1987. (See Appendix Q of the 1979 SIP submittal for the full text of the extension
request and the approval notice.) On March 25, 1980 (45 FR 19231-19245), EPA approved and
incorporated into the Texas SIP many of the remaining provisions included in the proposals submitted
by the state in April and November 1979. The March 25, 1980 Federal Register notice also included
conditional approval of a number of the proposed SIP revisions submitted by the state.
Additional proposed SIP revisions were submitted to EPA by the state on July 25, 1980 and July 20,
1981 to comply with the requirements of the March 25, 1980 conditional approvals. By May 31, 1982,
all of the proposed revisions to the Texas SIP submitted to EPA in April and November 1979, July
1980, and July 1981, with the exception of provisions relating to the definition of major modification
used in new source review (NSR) and certain portions of the control strategy for TSP in Harris County,
had been fully approved or addressed in a Federal Register notice proposing final approval. The NSR
provisions were approved on August 13, 1984.
The FCAA Amendments of 1977 required SIPs to be revised by December 31, 1982 to provide
additional emission reductions for those areas for which EPA approved extensions of the deadline for
attainment of the NAAQS for ozone or CO. Paragraph B.5. of this section of the SIP contains the

3
revision to the Texas SIP submitted to comply with the FCAA Amendments of 1977 and EPA rules for
1982 SIP revisions. Supplementary emissions inventory data and supporting documentation for the
revision are included in Appendices Q through Z of the 1982 SIP submittal.
The only area in Texas receiving an extension of the attainment deadline to December 31, 1987 was
Harris County for ozone. Proposals to revise the Texas SIP for Harris County were submitted to EPA
on December 9, 1982. On February 3, 1983, EPA proposed to approve all portions of the plan except
for the Vehicle Parameter Inspection/Maintenance (I/M) Program. On April 30, 1983, the EPA
Administrator proposed sanctions for failure to submit or implement an approvable I/M program in
Harris County. Senate Bill 1205 was passed on May 25, 1983 by the Texas Legislature to provide the
Texas Department of Public Safety (DPS) with the authority to implement enhanced vehicle inspection
requirements and enforcement procedures. On August 3, 1984, EPA proposed approval of the Texas
SIP pending receipt of revisions incorporating these enhanced inspection procedures and measures
ensuring enforceability of the program. These additional proposed SIP revisions were adopted by the
state on November 9, 1984. Final approval by EPA was published on June 26, 1985.
Although the control strategies approved by EPA in the 1979 SIP revisions were implemented in
accordance with the provisions of the plan, several areas in Texas did not attain the primary NAAQS by
December 31, 1982. On February 23, 1983, EPA published a Federal Register notice identifying those
areas and expressing the intent to impose economic and growth sanctions provided in the FCAA.
However, EPA reversed that policy in the November 2, 1983 Federal Register, deciding instead to call
for supplemental SIP revisions to include sufficient additional control requirements to demonstrate
attainment by December 31, 1987.

4
On February 24, 1984, the EPA Region 6 Administrator notified the Governor of Texas that such
supplemental SIP revisions would be required within one year for ozone in Dallas, Tarrant, and El Paso
Counties and CO in El Paso County. The Texas Air Control Board (TACB) requested a six-month
extension of the deadline (to August 31, 1985) on October 19, 1984. EPA approved this request on
November 16, 1984.
Proposals to revise the Texas SIP for Dallas, Tarrant, and El Paso Counties were submitted to EPA on
September 30, 1985. However, the revisions for Dallas and Tarrant Counties did not provide sufficient
reductions to demonstrate attainment of the ozone standard and on July 14, 1987, EPA published intent
to invoke sanctions. Public officials in the two counties expressed a strong desire to provide additional
control measures sufficient to satisfy requirements for an attainment demonstration.
A program of supplemental controls was taken to public hearings in late October 1987. As a result of
testimony received at the hearings, a number of the controls were modified and several were deleted,
but sufficient reductions were retained to demonstrate attainment by December 31, 1991. These
controls were adopted by the TACB on December 18, 1987 and were submitted to EPA as proposed
revisions to the SIP. Supplemental data and supporting documentation are included in Appendices AA
through AO of the 1987 SIP submittal.
The FCAA Amendments of 1990 authorized EPA to designate areas failing to meet the NAAQS for
ozone as nonattainment and to classify them according to severity. The four areas in Texas and their
respective classifications include: Houston/Galveston (severe), Beaumont/Port Arthur (serious),
El Paso (serious), and Dallas/Fort Worth (moderate).

5
The FCAA Amendments required a SIP revision to be submitted for all ozone nonattainment areas
classified as moderate and above by November 15, 1993 which described in part how an area intends to
decrease VOC emissions by 15%, net of growth, by November 15, 1996. The amendments also
required all nonattainment areas classified as serious and above to submit a revision to the SIP by
November 15, 1994 which described how each area would achieve further reductions of VOC and/or
NO in the amount of 3.0% per year averaged over three years and which includes a demonstration ofx
attainment based on modeling results using the Urban Airshed Model (UAM). In addition to the 15%
reduction, states were also required to prepare contingency rules that will result in an additional 3.0%
reduction of either NO or VOC, of which up to 2.7% may be reductions in NO . Underlying thisx x
substitution provision is the recognition that NO controls may effectively reduce ozone in many areasx
and that the design of strategies is more efficient when the characteristic properties responsible for
ozone formation and control are evaluated for each area. The primary condition to use NO controls asx
contingency measures is a demonstration through UAM modeling that these controls will be beneficial
toward the reduction of ozone. These VOC and/or NO contingency measures would be implementedx
immediately should any area fall short of the 15% goal.
Texas submitted rules to meet the Rate-of-Progress (ROP) reduction in two phases. Phase I consisted
of a core set of rules comprising a significant portion of the required reductions. This phase was
submitted by the original deadline of November 15, 1993. Phase II consisted of any remaining
percentage toward the 15% net of growth reductions, as well as additional contingency measures to
obtain an additional 3.0% of reductions. Phase II was submitted by May 15, 1994. The complete list of
contingency measures was submitted by November 15, 1994. The appropriate compliance date was to
be incorporated into each control measure to ensure that the required reductions will be achieved by the
November 15, 1996 deadline. A commitment listing the potential rules from which the additional

6
percentages and contingency measures were selected was submitted in conjunction with the Phase I SIP
on November 15, 1993. That list of Phase II rules was intended to rank options available to the state
and to identify potential rules available to meet 100% of the targeted reductions and contingencies.
Only those portions of the Phase II rules needed to provide reasonable assurance of achieving the
targeted reduction requirements were adopted by the commission.
The Dallas/Fort Worth (DFW) and El Paso (ELP) areas achieved sufficient reductions with the 15%
ROP SIP to demonstrate attainment by 1996. Attainment Demonstration SIP Revisions for these two
areas were submitted on September 14, 1994.
The FCAA Amendments of 1990 classified the Beaumont/Port Arthur (BPA) area as a serious
nonattainment area. The BPA nonattainment area includes Hardin, Jefferson, and Orange Counties.
The BPA nonattainment area has an ozone design value of 0.16 ppm, which places the area in the
serious classification.
The FCAA Amendments of 1990 require a Post-96 ROP SIP revision and accompanying rules to be
submitted by November 15, 1994. According to the FCAA Amendments, this submittal had to contain
an Attainment Demonstration based on UAM. Additionally, the revision had to demonstrate how the
HGA and BPA nonattainment areas intend to achieve a 3% per year reduction of VOC and/or NO untilx
the year 2007, and additional reductions as needed to demonstrate modeled attainment. The plan was
also required to carry an additional 3% of contingency measures to be implemented if the
nonattainment area fails to meet a deadline. To use NO reductions for all or part of the Post-96x
controls or the contingency measures required a demonstration using UAM showing that NO controlsx
would be beneficial in reducing ozone.

7
On November 9, 1994, the state submitted a SIP revision designed to meet the 3% per year ROP
requirements for the years 1997-1999. This Post-96 ROP SIP revision detailed how the BPA and HGA
nonattainment areas intend to achieve these three years' reductions of VOC (or 9% net-of-growth).
Most of this amount was achieved by quantifying additional reductions due to existing rules and
reductions due to federally-mandated rules. Rules to achieve the further reductions needed to meet the
ROP SIP goal were submitted to EPA on January 11, 1995. This submittal included modeling
demonstrating progress toward attainment, using a 1999 future year emissions inventory.
On August 14, 1994, the state submitted preliminary UAM modeling results for the BPA and HGA
nonattainment areas that showed the relationship between emission levels of VOC and NO , and ozonex
concentrations. This modeling was conducted with a 1999 future year emissions inventory. Based on
the results of this preliminary modeling, which show a disbenefit to NO reductions, on April 12, 1995x
the state received a temporary Section 182(f) exemption from all NO requirements includingx
reasonably available control technology (RACT), I/M, NO NSR, and transportation conformityx
requirements. Permanent §182(f) exemptions from all NO requirements were granted for DFW andx
ELP, and temporary exemptions until December 31, 1996 for HGA and BPA. The commission has
subsequently requested that EPA extend this date until December 31, 1997.
On March 2, 1995, Mary Nichols, EPA Assistant Administrator for Air and Radiation, issued a memo
which gave states some flexibility to design a phased Attainment Demonstration. It provided for an
initial phase which was intended to continue progress in reducing levels of VOC and/or NO whilex
giving states an opportunity to address scientific issues such as modeling and transport. The second
phase was designed to draw upon the results of the scientific effort and design a plan to bring the area

8
into attainment. To constitute Phase I under this approach, the EPA guidance required that states
submit the following SIP elements by December 31, 1995:
Control strategies to achieve reductions of ozone precursors in the amount of 3% per year from the
1990 baseline emissions inventory (EI) for the years 1997, 1998, and 1999.
UAM modeling out through the year 1999, showing the effect of previously-adopted control
strategies which were designed to achieve a 15% reduction in VOCs from 1990 through 1996.
A demonstration that the state has met the VOC RACT requirements of the FCAA Amendments.
A detailed schedule and plan for the "Phase II" portion of the attainment demonstration which will
show how the nonattainment areas can attain the ozone standard by the required dates.
An enforceable commitment to:
Participate in a consultative process to address regional transport,
Adopt additional control measures as necessary to attain the ozone NAAQS, meet ROP
requirements, and eliminate significant contribution to nonattainment downwind, and
Identify any reductions that are needed from upwind areas to meet the NAAQS.

9
Texas submitted the first two of these required sections in November 1994. The remaining three, a
VOC RACT demonstration, the required commitments, and a Phase II plan and schedule, were
submitted on January 10, 1996 to EPA.
ROP SIP modeling is being developed for the HGA nonattainment area in two phases using the UAM.
The first phase of ROP modeling was the modeling submitted in January, 1995, as described above.
The second phase of the ROP modeling is being conducted using data obtained primarily from the
Coastal Oxidant Assessment for Southeast Texas (COAST) project, an intensive 1993 field study. The
COAST modeling for HGA and the associated SIP are projected to be completed by December, 1996
for submittal in May of 1997. Control strategies developed in this second phase will be based on a
more robust data base, providing a higher degree of confidence that the strategies will result in
attainment of the ozone NAAQS or target ozone value. A discussion of the schedule for the UAM
modeling for the Phase II Attainment Demonstration can be found in Appendix 11-F. Modeling for the
BPA attainment demonstration is underway as well, and is planned to be submitted to EPA along with
HGA’s in May of 1997.
On January 29, 1996, the EPA proposed a limited approval/limited disapproval for the Texas 15% ROP
SIP revision. The EPA proposed a limited approval because the SIP revision will result in significant
emission reductions from the 1990 baseline, and will, therefore, improve air quality. Simultaneously,
the EPA proposed a limited disapproval because they believe that the plan fails to demonstrate
sufficient reductions to meet the 15% ROP requirements. They also proposed a limited
approval/disapproval of the contingency plans (designed to achieve an additional 3% of reductions if
needed because a milestone is missed) along the same lines as the 15% action. The EPA stated that
some of the control measures submitted along with the SIP revision did not meet all of the requirements

10
of the FCAA Amendments of 1990, and, therefore, cannot be approved. The EPA further stated that
they were not making a determination at this time whether the state has met its requirements regarding
RACT, or any other underlying FCAA Amendments of 1990 requirements. Finally, the EPA proposed
approval of the Alternate Means of Control portion of the November 9, 1994 Post-96 SIP submittal, but
did not propose action on any other portion of that submittal.
Additionally, on November 29, 1995, the President signed the National Highway Systems Designation
Act, which, among other things, prohibited EPA from discounting the creditable emissions from a
decentralized vehicle I/M testing program if an approvable conditional I/M SIP revision was submitted
to EPA within 120 days of the bill’s signature. EPA’s Office of Mobile Sources issued guidance
stating that they will accept an interim I/M SIP proposal and Governor's letter 120 days after signature
of the bill in lieu of an adopted SIP revision. The SIP proposal and letter was submitted to the EPA
prior to the March 27, 1996 deadline to meet the 120 day timeframe, and EPA would then parallel
process the results of the state and federal public comments to determine whether the SIP revision is
approvable.
Part of EPA’s determination that the new I/M SIP is approvable is dependant on the program’s ability
to achieve sufficient creditable VOC reductions so that the 15% ROP can still be achieved. The
commission has designed this revised I/M program to fit in with the other elements of the 15% SIP to
achieve the full amount of creditable reductions required. The I/M program also achieves creditable
reductions for the Post-96 ROP SIP.
Changes to the I/M program have had an impact on the El Paso §818 Attainment Demonstration as
well. This demonstration was predicated on the assumption that the I/M program would be

11
implemented as adopted for the 15% SIP. An addendum to the §818 Demonstration is being proposed
showing that the basic underlying assumptions of the modeling still pertain despite the revisions to the
I/M program.
The ETR program revision to the SIP and ETR rule were adopted in October 1992 by the Texas Air
Control Board to meet the mandate established in the FCAA Amendments of 1990 (§182 (d) (1) (B)).
This section of the FCAA required states with severe or extreme ozone nonattainment areas to develop
and implement ETR programs in those areas. For Texas, the only area affected was the HGA area.
The ETR program required large employers (those with 100 or more employees) to implement trip
reduction programs that would increase the average passenger occupancy rate of vehicles arriving at the
workplace during the peak travel period by 25% above the average for the area.
Congress amended the FCAA in December of 1995 by passing House Rule 325. This amendment
allows the state to require an ETR program at its discretion. It also allows a state to “remove such
provisions (ETR program) from the implementation plan...if the state notifies the Administrator, in
writing, that the state has undertaken, or will undertake, one or more alternative methods that will
achieve emission reductions (1.81 tons/day) equivalent to those achieved by the removed...provisions.”
As such, large employers will no longer be mandated to implement trip reduction programs. The HGA
ozone nonattainment area will, however, through the coordination of the Houston-Galveston Area
Council, implement a voluntary regional initiative to reduce vehicle trips.
The 1990 Adjusted Base Year EI was submitted on November 12, 1993. It is the official inventory of
all emission sources (point, area, on-road and off-road mobile) in the four nonattainment areas. There
have been several changes to the EI due to changes in assumptions for certain area and non-road

12
mobile source categories. Changes to the baseline EI have affected the target calculations and
creditable assumptions made in the 15% and 9% SIPs.
In December of 1990, then-Texas Governor William Clements requested that the BPA area be
reclassified as a "moderate" ozone nonattainment area in accordance with Section 181(a)(4) of the
FCAA Amendments of 1990. That request was denied on February 13, 1991. A recent review of the
original request and supporting documentation has revealed that this denial was made in error. As
provided by Section 110(k)(6) of the Act, the EPA Administrator of the has the authority to reverse a
decision regarding original designation if it is discovered that an error had been made.
Monitoring data from a privately-funded, special purpose monitoring network which was not included
in the Aerometric Information Retrieval System database was improperly used to deny this request.
Furthermore, subsequent air quality trends demonstrate that BPA is more properly classified as a
moderate nonattainment area, and should attain the standard by the required date for moderate areas of
November 15, 1996. Therefore, Governor Bush sent a letter and technical support to EPA on July 20,
1995, requesting that the BPA area be reclassified to moderate nonattainment status. BPA plans to
demonstrate attainment one of the following ways:
Monitored values showing attainment of the standard at state-operated monitors for the years
1994-1996, which is the timeline the FCAA Amendments of 1990 specifies for moderate areas.
UAM modeling showing attainment of the standard but for transport of ozone and/or precursors.

13
EPA Region VI verified the data submitted in support of this request, and concurred that it is valid. On
June 3, 1996, the reclassification of the BPA area became effective. Because the area was classified as
serious, it was following the SIP submittal and permitting requirements of a serious area, which
included the requirements for a Post-96 SIP. With this consolidated SIP submittal, the commission has
removed the BPA area from the Post-96 SIPs, which became applicable to the HGA nonattainment
area only.
B. OZONE CONTROL STRATEGY
1. POLICY AND PURPOSE (No change.)
2. SUMMARY OF THE PRINCIPAL ELEMENTS ADDRESSED WITHIN THIS PLAN
(No change.)
3. OZONE CONTROL PLAN FOR 1979 SIP REVISION (No change.)
4. CONTROL STRATEGY FOR 1979 SIP REVISION (No change.)
5. 1982 HARRIS COUNTY SIP REVISION (No change.)
6. SIP REVISIONS FOR POST-1982 URBAN NONATTAINMENT AREAS (No change.)
7. SIP REVISIONS FOR 1993 RATE-OF-PROGRESS (Revised.)

14
a. Ozone Control Plan
1) - 3) (No Change.)
4) Identification of Emission Changes
a) Emissions Inventory
The FCAA Amendments of 1990 required that EIs be prepared for ozone nonattainment areas. Since
ozone is photochemically produced in the atmosphere when VOCs are mixed with NO and CO in thex
presence of sunlight, it is important that the planning agency compile information on the sources of
these precursor pollutants. The EI identifies the source types present in an area, the amount of each
pollutant emitted, and the types of processes and control devices employed at each plant or source
category. The EI provides data for a variety of air quality planning tasks, including establishing
baseline emission levels, calculating the 15% and Post-96 reduction targets, developing control
strategies for achieving the required emissions reductions, developing inputs to air quality simulation
models, and tracking actual emissions reductions against the established emissions growth and control
budget.
Compiling the EI is an ongoing, dynamic and continually improving process. While federal mandates
and other requirements may demand the presentation of a certain set of emissions numbers to be used
as a benchmark, the emissions inventory is subject to changes. These changes may be necessitated by a
variety of circumstances such as new and improved models for estimating emissions, improved
emission factors for estimating emissions from sources, better information about activity levels of

15
emission sources, improved methodologies developed in interim periods between reports, more
up-to-date, accurate forecasts of population and economic growth, and improved models for growth
projection of inventories. The revisions to the 1990 Base Year EI are described below.
(1) - (7) (No change.)
(8) Changes to the Emissions Inventory as a result of the COAST Study
(a) Changes in Area Source and Non-road Mobile Source Categories
COAST field study was an intensive, multi-phased, and multifaceted study of the HGA and BPA ozone
nonattainment areas, and adjacent offshore waters. The project was undertaken in conjunction with the
Minerals Management Service and represents an effort to obtain the regional information necessary to
develop cost-efficient, effective ozone control strategies. While the major thrust of the study has
focused on regional monitoring and modeling of the 1993 ozone season, the COAST project had many
other components. One such project was the Bottom-up Emissions Inventory Project.
A traditional emissions inventory of area sources utilizes so-called top-down methodologies in order to
estimate the county-wide emissions required for SIP inventory reporting. This approach involves using
such statistics (national or state level) as are available on the level of activity (e.g., gallons of gasoline
sold, widgets produced, and so on) of the particular area source category being investigated. The
activity level is then adjusted, or allocated, to the county level based on some known surrogate such as
population or Standard Industrial Classification Code (SIC) employment (e.g., the population of X
County is 15% of the state population so 15% of the state level activity is taking place at the county

16
level). The available alternative, a bottom-up inventory, is not usually performed because it is costly.
The COAST project provided an opportunity to conduct a bottom-up inventory.
A bottom-up inventory entails collecting as much local, category specific activity level information as
is possible. In the specific case of the Bottom-up Emissions Inventory Project, the approach was to
have a contractor take a random, stratified sample, or survey, to determine the activity levels of the
following area source and non-road mobile source categories: Dry Cleaners, Gasoline Stations, Lawn
Mower usage, Recreational Marine usage, Generators <50 HP usage, Surface Coatings, and Surface
Cleaning. The contractor then used this activity level information with known, or to be developed,
emission factors to estimate emissions.
The work done for the Bottom-up Emissions Inventory also included follow-up work involving a host
of organizations and people including the commission, City of Houston Bureau of Air Quality staff, the
Non-road Mobile Source Working Group of the Houston-Galveston Area Council, and the sponsorship
of the Houston Regional Monitoring Network organization in hiring Radian Corporation to review
specific categories of the 1990 Base Year EI. The combined efforts of these organizations to conduct
telephone surveys, telephone interviews, purchase proprietary information, contract for services,
provide comments and input, and review existing inventory work resulted in the changes that have
occurred in the emissions inventories for the 1990 base year inventory.
The categories in which changes have occurred may be seen in Table 8 below. A brief explanation of
why the changes occurred in each area source and non-road category affected will follow after the
table.

17
TABLE 8
Categories with Changes in 1990 Base Year Inventory Emissions Estimates
Category Ozone Nonattainment Areas
Houston/Galveston Beaumont/Port Arthur Dallas/Fort Worth El Paso
Other Product Coatings Y Y Y Y
High Performance Maintenance Y Y Y Y
Marine Vessel Loading Losses Y Y N N
Surface Cleaning Y Y Y Y
Architectural Coatings Y Y Y Y
Auto Refinishing Y Y Y Y
Sheet, Strip and Coil Y Y Y Y
Vessels with Outboards Y Y N N
Commercial Vessels Y N N N
Generators <50 HP Y Y N N
Residential Lawnmowers Y Y N N
Military Aircraft YN N N

18
Other Product Coatings, High Performance Maintenance, and Other Special Product Coatings
These Area Source categories are all surface coatings categories that were estimated for the 1990
inventory using per capita emission factors of .6, .7 and .8 lbs./yr./person, respectively. Per capita and
per employee emission factors provided by EPA are typically national level estimates of usage of a
product divided by population or number of employees. Early in the process of reviewing the
inventory, agency staff requested that EPA either provide more information about what activities
(specific coatings usage) the factors were related to, or that the agency be allowed to drop the emissions
estimates from these categories, if no information could be provided. EPA staff was eventually able to
locate the source document for the original emissions estimates. In the interim, the agency staff review
of the categories resulted in better estimation of the point source emissions to be subtracted from the
areas source estimate. That increased subtraction applies only to the categories Other Product Coatings
and High Performance Maintenance.
Examples of Other Product Coatings are coatings used on concrete products, photographic equipment,
toys and sporting goods, and so on. Examples of High Performance Maintenance coatings are coatings
used in oil and gas extraction operations (e.g., pipe coatings), food processing, metals production,
mining, and so on. Lastly, examples of Other Special Purpose Coatings are roof coatings, marine shelf
goods, and metallic paints.
Marine Vessel Loading Losses
The emission estimate in this area source category is based on the amounts of petroleum and volatile
chemical cargoes loaded to marine vessels in Texas ports. Since most of the emissions due to loading

19
may be attributed to point sources of emissions, a part of the process of estimating is to subtract the
point sources of emission estimates, which are self-reported through the Emissions Inventory
Questionnaire, from the estimate of area source emissions. It was discovered that the point source
emissions had been underestimated in the 1990 inventory. When the point source emission numbers
were recompiled and the subtraction performed, the area source emissions went from 15.94 tons per
day in HGA to zero and the emissions in BPA went down by about 0.3 of a ton per day.
Surface Cleaning
This category of emissions was estimated in the 1990 inventory using a per capita emission factor of
4.3 lbs./yr./person. The agency hired a contractor to do an inventory of surface cleaning facilities in the
HGA and BPA areas, but the results were inconclusive and the contractor recommended follow-up
survey work. To that end, agency staff conducted 41 site visits, in addition to the survey work done by
the contractor. The total number of facilities surveyed was 124; the number of facilities that reported
not using VOC solvents was 83; the number of facilities that provided information about usage was 41;
the sample standard deviation was .0704 and the relative error was estimated at 16.66%. There are
about 10,607 facilities in 15 SIC codes in the HGA and BPA areas that are potentially involved in
surface cleaning/degreasing activities. Given the relative error associated with the survey sample, and
the fact that the sites selected were chosen using a random number generator, it is thought that these
results hold for other areas as well. This has been reinforced by a discussion with SafetyKleen, a major
supplier of degreasing solvents. A per capita emission factor has been developed based on the agency
survey results and emissions, based on population, have been estimated for DFW and ELP
nonattainment areas.

20
Architectural Coatings
Architectural coatings, also known as trade paints, are used primarily by homeowners and painting
contractors. Architectural coatings include interior and exterior house and building paints as well as
coatings for other surfaces, such as curbs and signs. The coatings are applied by spray, brush or roller
and dry or cure at ambient conditions. Oil-based paints and coatings account for about 29 percent of
architectural coatings by volume. These typically have volatile solvent contents of about 54 percent.
Water-borne paints, which make up the balance of architectural coatings, have substantially lower
solvent contents, typically about 8 percent. Paints are also classified by the environment the surface is
exposed to, either interior or exterior.
Average annual VOC air emissions from architectural painting activities is dependent on the
following:
1) amount of VOCs contained in the various types of paints,
2) amount of the various types of paints used,
3) amount of VOCs in the material to “thin” the paints (when thinner is used),
4) amount of VOCs in the “cleanup” solvents (when used), and
5) amount of thinning and cleanup solvents used.
A per capita emission factor of 4.6 lbs./year per person was used to estimate emissions from this
category for the original 1990 inventory. Information obtained from the National Paint and Coatings
Association, combined with information collected by agency staff about thinner usage, has been used to
improve the emissions estimate and to develop a new emission factor. The factor of 3.49 lbs./per

21
capita/per year has been used to calculate the emissions that replace the original 1990 base year
estimate.
Automobile Refinishing
Automobile refinishing coatings (referred to as paints), paint thinners, reducers, hardeners, catalysts
and cleanup solvents used during their application, contain VOCs which are precursors to ground level
ozone formation. Some of these painting compounds create hazardous air pollutants (HAPs), which are
toxic. The evaporation of the VOCs from the paints, thinners, reducers, hardeners, catalysts and
cleanup solvent create "area source" VOC air emissions.
Auto refinishing is the repainting of worn or damaged automobiles, light trucks and other vehicles.
Coating of new cars is not included in the category but falls under industrial coatings. Auto refinishes
are classified by industry as a “Special Purpose Coating” while the coatings used for new vehicles are
classified as original equipment manufacture (OEM) coatings.
For this analysis, the materials used to refinish “autos” were divided into four categories; “coatings,”
the “thinners and reducers,” the “hardeners and catalysts” and the “cleanup solvents.” The “coatings”
include the primers, surfacers, base coats, topcoats and clear coats. The “thinners” are material to thin
the coatings. The “reducers” reduce the viscosity of the coating and act as a “thinner.”
In the fall of 1995, agency staff conducted two surveys. The first survey was to collect usage
information from paint and body shops (the places where most of the activity takes place) on the
thinners, reducers, hardeners, catalysts and “cleanup” solvents. The second survey was to collect

22
information from auto refinishes manufacturers on the “average” physical properties of auto refinishes
and the other materials identified above.
It is estimated that VOC air emissions from auto refinishing activities in Texas nonattainment counties
decreased about 47% from 1990 through 1993. This is attributed to the following:
1) the quantity of paint used and/or quality of OEM new auto coating applications in the 1980's,
sales of auto refinishes peaked in 1990,
2) the trend since 1990 has been for applicators to switch from air atomized painting equipment
to high volume/low pressure equipment which has about a 40% better transfer rate (and
produces less waste because there are no paint in lines),
3) improved coating formulations require less paint to do the same job, and
4) the average size of cars decreased.
Average annual VOC air emissions from automobile refinishing activities is dependent on the
following:
1) amount of VOCs contained in the coatings,
2) amount of VOCs in the material to “thin”or “reduce” the coatings,
3) amount of VOCs in the hardener/catalyst used,
4) amount of VOCs in the “cleanup” solvents used,
5) amount of the coatings used,
6) amount of hardener/catalyst used, and
7) amount of cleanup solvents used.

23
Information collected from the surveys enabled staff to calculate 1990 and 1993 U.S. VOC emission
factors for auto refinishing activities, then allocate those emissions to the nonattainment areas. The
factor used for 1990 is 3.92 lbs./per capita/per year. For 1993 the factor is estimated to be 1.939
lbs./per capita/per year and estimated at 1.52 lbs./per capita/per year in 1996. The VOC emissions for a
region are assumed to be equal to the emission factor times the population of the region.
Sheet, Strip, and Coil
Metal coil coating is a linear process whereby protective or decorative organic coatings are applied to
flat metal sheet or strip packaged in rolls or coils. The solvents most often used include xylene,
toluene, methyl ethyl ketone, butanol, diacetone alcohol, isoprene, butyl carbonyl, mineral spirits,
ethanol, nitropropane, tetrahydrofuran, methyl isobutyl ketone, isopropanol, diisoamyl ketone, and
several trademarked solvents. Emissions are created at several stages of the coating operations,
including coating application, curing, and quenching.
This category was estimated for the 1990 inventory using a per employee emission factor of
approximately 1.5 tons/year per employee. The number of employees in the SIC Code related to this
industry (3479) was obtained from a Bureau of the Census publication, County Business Patterns,
Texas.
SIC 3479 includes many types of businesses not engaged in coil coating operations therefore using a
per employee emission factor inflated the emissions above the levels being actually emitted by the
companies involved in the specific activity. A list of companies in Texas involved in coil coating
operations was obtained from the National Coil Coaters Association that enabled agency staff to

24
determine that either all of the coil coating companies in the nonattainment areas were reporting their
emissions to the agency both in 1990 and in 1993 or they did not actually have coil coatings facilities at
their locations. Instead of doing it themselves they subcontracted the work out. Therefore, there are no
area source emissions, as all emissions have been accounted for in the point source inventory and
inclusion in the inventory of an area source estimate would result in double-counting of emissions.
Vessels with Outboards
A contractor conducted a telephone survey of registered pleasure craft owners in the HGA and BPA
areas that yielded more than 800 respondents. Perhaps the most significant finding, apart from the
improvement in information about spatial allocation (where used, and on which body of water), was the
discovery that 62.3% of boat usage takes place on the weekend. Since, by EPA definition, an ozone
emissions inventory is a weekday (Monday through Friday) inventory this finding resulted in a
tremendous reduction in estimated emissions (from approximately 60 tons per day to 20 tons per day in
HGA, for example). This method of reducing the total inventory estimate after accounting for weekend
usage has been accepted by EPA Region VI (Dallas). Region VI allowed such a reduction in response
to a survey done by the North Central Texas Council of Governments (NCTCOG) in the DFW area.
Commercial Vessels
This category of non-road mobile source emissions consists of the emissions from fuel combustion by
oceangoing vessels, harbor vessels, and the fishing fleet. Emissions were estimated for the 1990
inventory from information collected by the Army Corps of Engineers, Waterborne Commerce
Statistics Center on freight traffic at harbors and by allocating national fuel usage to Texas. The
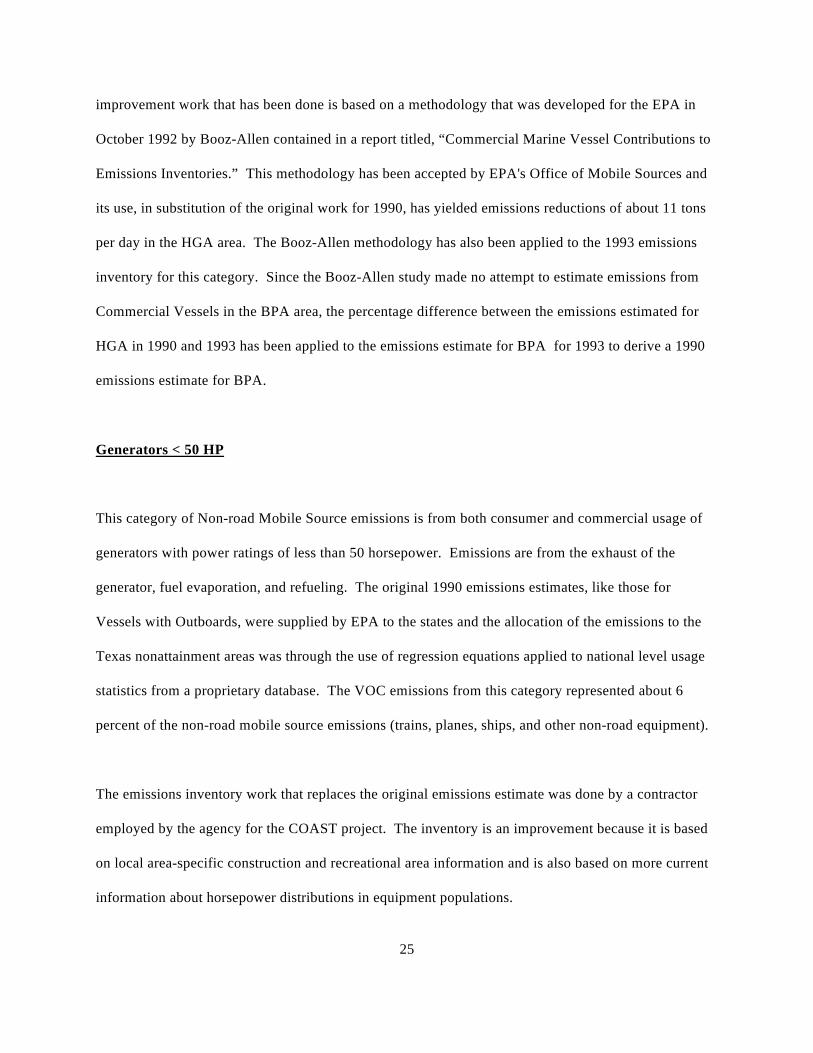
25
improvement work that has been done is based on a methodology that was developed for the EPA in
October 1992 by Booz-Allen contained in a report titled, “Commercial Marine Vessel Contributions to
Emissions Inventories.” This methodology has been accepted by EPA's Office of Mobile Sources and
its use, in substitution of the original work for 1990, has yielded emissions reductions of about 11 tons
per day in the HGA area. The Booz-Allen methodology has also been applied to the 1993 emissions
inventory for this category. Since the Booz-Allen study made no attempt to estimate emissions from
Commercial Vessels in the BPA area, the percentage difference between the emissions estimated for
HGA in 1990 and 1993 has been applied to the emissions estimate for BPA for 1993 to derive a 1990
emissions estimate for BPA.
Generators < 50 HP
This category of Non-road Mobile Source emissions is from both consumer and commercial usage of
generators with power ratings of less than 50 horsepower. Emissions are from the exhaust of the
generator, fuel evaporation, and refueling. The original 1990 emissions estimates, like those for
Vessels with Outboards, were supplied by EPA to the states and the allocation of the emissions to the
Texas nonattainment areas was through the use of regression equations applied to national level usage
statistics from a proprietary database. The VOC emissions from this category represented about 6
percent of the non-road mobile source emissions (trains, planes, ships, and other non-road equipment).
The emissions inventory work that replaces the original emissions estimate was done by a contractor
employed by the agency for the COAST project. The inventory is an improvement because it is based
on local area-specific construction and recreational area information and is also based on more current
information about horsepower distributions in equipment populations.

26
Residential Lawnmowers
Emissions from lawn and garden equipment are also classified as Non-road Mobile Sources. The
original 1990 inventory included emissions estimates for approximately 80 different types of non-road
mobile equipment in a catchall category called, "Other Small Engines." The EPA hired a contractor to
perform the inventory, which is described in a document called the Non-road Engine and Vehicle
Emissions Study--Report, November 1991. The change in emissions that the agency has made to the
original estimate is an adjustment to reflect differences in usage by residential sources. By definition,
the 1990 Base Year EI was to be an inventory of emissions that occurred through the week (i.e.,
Monday through Friday). In making a temporal adjustment to the residential portion of lawnmower
emissions only (since commercial usage patterns are unknown) the agency has reduced the overall
residential emissions by the amount of the emissions reported for weekend usage. The justification for
the adjustment is drawn from a survey conducted by agency staff of 1434 randomly selected residences
in the HGA and BPA areas which had a 21% response rate. Survey statistics are: 59% of lawns were
mown by the resident or by a friend or neighbor, 8% of lawns were mown by commercial services, and
33% reported that they had no lawns to mow. Of the 160 applicable residential lawnmowers, 59%
reported that they mowed their lawns on Saturday or Sunday. The residential emissions have been
adjusted accordingly, while the commercial portion is unchanged.
Military Aircraft
This category of non-road mobile source emissions has only been reworked for the DFW ozone
nonattainment area. This adjustment accounts for the reduced levels of activity at Carswell Air Force
Base, Texas due to closure and realignment. In 1992 when information for the 1990 inventory was

27
being collected, Carswell’s base commander was contacted by the NCTCOG. Given the information
supplied by the Air Force, the emissions were estimated by NCTCOG at .6356 tons per day.
Subsequently, the Air Force has self-reported, in a draft environmental impact statement on the closure
of Carswell, that 1990 VOC emissions were 8.48 tons per day. This adjustment and backcast of the
1990 inventory corrects that discrepancy, while still including an estimate of the military aircraft
activity at the base after the realignment.
(b) Changes to On-road Mobile Source Emissions Estimates
The major change that has occurred in the estimation of On-road Mobile Source emissions included in
the original 15% SIP submission for the 1996 projection inventory is the substitution of a revised I/M
Program for automobiles in all ozone nonattainment areas. The I/M Program that was to have been
effective beginning January 1, 1995 was not implemented due to action by the Texas Legislature.
Senate Bill 178 canceled the centralized vehicle emissions testing program, reinstated the previous
testing program, and authorized the Governor to negotiate a more convenient, less costly program. I/M
Program changes may be found in other sections of this document that deal specifically with the revised
I/M Program. The commission, assisted by the local Council of Governments, Metropolitan Planning
Organizations (MPOs), the Texas Transportation Institute, and the Texas Department of
Transportation, modeled the impact of changes in the I/M program on the 1996 inventory and
individual control program reductions.
In addition, the 1990 base year inventories and 1996 projection inventories for BPA and ELP were
updated to reflect a change in inventory methodology. The new methodology is a bottom-up, link-
based inventory rather than a top-down, facility-type inventory. A link-based inventory is one

28
developed using specific information about vehicle miles traveled (VMT) and vehicle speeds associated
with each link in the transportation network for a given county. A facility-based analysis, or road-type-
based inventory, is a less detailed inventory, which aggregates the links into facility types (e.g., 12 road
types: arterial, collector, highway, etc.) and uses average speeds. These updates are being done in order
to obtain consistency with other FCAA Amendments inventory-based requirements (i.e., conformity
analysis and conformity budgets).

TABLE 9 Final 1996 ROP Required VOC Emissions Reductions Calculations Dallas-Fort Worth Ozone Nonattainment Area Ozone Season VOC Tons Per Day
June 12, 1996
Total Mobile StationaryEmissions BasisStepNon-roadOn-roadAreaPoint
651.08105.19306.60174.0265.271990 ROP Nonattainment Area Base Year EI1548.83105.19204.35174.0265.271990 Adjusted Base Year EI2
102.25RVP and FMVCP Reductions [On-road mobile:steps(1-2)]382.3215% of Adjusted Base Year EI (0.15*step 2)40.990.000.000.99RACT Fix-Up and I/M Corrections Reductions5
103.241990 to 1996 Noncreditable Reductions Without Growth [steps(3+5)]6185.56Total ROP Required Reductions Without Growth [steps(3+4+5)]7465.521996 Target Level Emissions [steps(1-7)]8583.07107.92241.89162.6270.641996 Emissions Forecast (Growth and Pre-90 Controls)9117.55Total ROP Required Reductions with Growth [steps(9-8)]10
Base year on-road mobile emissions calculated with MOBILE5 for an ozone season weekday Adjusted base year on road mobile emissions and 1996 forecast on-road mobile emissions calculated with MOBILE5A for an ozone season weekday All on-road MOBILE5A forecasts are interpolated to November 15, 1996

TABLE 10 Final 1996 ROP Required VOC Emissions Reductions Calculations El Paso Ozone Nonattainment Area Ozone Season VOC Tons Per Day
June 27,1996
Total Mobile StationaryEmissions BasisStepNon-roadInt'l BridgesOn-roadAreaPoint
83.6510.991.4036.8724.949.451990 ROP Nonattainment Area Base Year EI169.4010.990.8423.1824.949.451990 Adjusted Base Year EI214.250.5613.69RVP and FMVCP Reductions [steps(1-2)]310.4115% of Adjusted Base Year EI (0.15*step 2)41.570.000.001.530.04RACT Fix-Up and I/M Corrections Reductions5
15.82Noncreditable Reductions w/o Growth [steps(3+5)]626.23Total ROP Required Reductions w/o Growth [steps(3+4+5)]757.421996 Target Level Emissions [steps(1-7)]873.6111.641.0128.3423.309.321996 Emissions Forecast (Growth and Pre-90 Controls)916.19Total ROP Required Reductions with Growth [steps(9-8)]10
Base year on-road mobile emissions calculated with MOBILE5 for an ozone season weekday Adjusted base year on road mobile emissions and 1996 forecast on-road mobile emissions calculated with MOBILE5A for an ozone season weekday All on-road MOBILE5A forecasts are interpolated to November 15, 1996
Source: TNRCC Emissions Inventory Section

Table 11 Final 1996 ROP Required VOC Emissions Reductions Calculations Beaumont-Port Arthur Ozone Nonattainment Area Ozone Season VOC Tons Per Day
June 18, 1996
Total Mobile StationaryEmissions BasisStepNon-roadOn-roadAreaPoint
323.7718.4429.3530.63245.351990 ROP Nonattainment Area Base Year EI1313.5318.4419.1130.63245.351990 Adjusted Base Year EI2
10.24RVP and FMVCP Reductions [On-road mobile:steps(1-2)]347.0315% of Adjusted Base Year EI (0.15*step 2)44.280.001.902.38RACT Fix-Up and I/M Corrections Reductions514.521990 to 1996 Noncreditable Reductions Without Growth [steps(3+5)]661.55Total ROP Required Reductions Without Growth [steps(3+4+5)]7262.221996 Target Level Emissions [steps(1-7)]8320.0118.4721.8728.71250.961996 Emissions Forecast (Growth and Pre-90 Controls)957.79Total ROP Required Reductions with Growth [steps(9-8)]10
Base year on-road mobile emissions calculated with MOBILE5 for an ozone season weekday Adjusted base year on road mobile emissions and 1996 forecast on-road mobile emissions calculated with MOBILE5A for an ozone season weekday All on-road MOBILE5A forecasts are interpolated to November 15, 1996

TABLE 12 Final 1996 ROP Required VOC Emissions Reductions Calculations Houston-Galveston Ozone Nonattainment Area Ozone Season VOC Tons Per Day
June 12, 1996
Total Mobile StationaryEmissions BasisStepNon-roadOn-roadAreaPoint
1063.72129.98251.72200.07481.951990 ROP Nonattainment Area Base Year EI1975.39129.98163.39200.07481.951990 Adjusted Base Year EI2
88.33RVP and FMVCP Reductions [On-road mobile:steps(1-2)]3146.3115% of Adjusted Base Year EI (0.15*step 2)416.3110.772.043.50RACT Fix-Up and I/M Corrections Reductions5104.641990 to 1996 Noncreditable Reductions Without Growth [steps(3+5)]6250.95Total ROP Required Reductions Without Growth [steps(3+4+5)]7812.771996 Target Level Emissions [steps(1-7)]81026.04138.37192.89189.85504.931996 Emissions Forecast (Growth and Pre-90 Controls)9213.27Total ROP Required Reductions with Growth [steps(9-8)]10
Base year on-road mobile emissions calculated with MOBILE5 for an ozone season weekday Adjusted base year on road mobile emissions and 1996 forecast on-road mobile emissions calculated with MOBILE5A for an ozone season weekday All on-road MOBILE5A forecasts are interpolated to November 15, 1996

33
b) Factors Affecting Magnitude of VOC Emissions
(1) Changes in Stationary, Area, and Non-Road Mobile Source Emissions
Regulations
(a) - (b) (No change.)
(c) Proposed New VOC Control Measures
(i) New or Modified Point Source Controls
This section will discuss control measures implemented to control VOC emissions from point sources.
Later sections will discuss estimated reductions expected from these rules for each specific nonattain-
ment area. The following rules deal mainly with point sources. The Control Measure Catalog (CMC),
as discussed in Appendix E, ranks the various control measures based on a variety of criteria. This
ranking will be especially useful in determining rules to be used as contingency measures.
Values for rule effectiveness (RE), rule penetration, and control efficiency can be found for the rules in
the discussion of each nonattainment area.

34
Synthetic Organic Chemical Manufacturing Industry (SOCMI) Reactor Processes and Distillation
Operations (§§115.121-115.129).
This rule applies to all nonattainment areas, but reductions are quantified for the HGA nonattainment
area only.
These rules control VOC by revising the vent gas rule to include more stringent limits on VOC
emissions from SOCMI reactor processes and distillation units. New control requirements specify that
emission control equipment for SOCMI reactor processes and SOCMI distillation operations must have
a destruction efficiency of at least 98% or control the vent gas stream to a VOC emission rate of no
more than 20 parts per million by volume (ppmv).
Industrial Wastewater (§§115.140-115.149).
This rule applies to ELP, DFW, and HGA.
These rules require control of industrial wastewater in specific source categories (organic chemicals,
plastics, and synthetic fibers manufacturing; pesticides manufacturing; petroleum refining;
pharmaceutical manufacturing; and hazardous waste treatment, storage, and disposal facilities).
Industrial wastewater operations are required to cover wastewater treatment areas and route the vapors
through a control device.

35
Marine and Other Vessel Loading (§§115.211-115.219).
Marine vessel loading applies to HGA. Marine terminals with 100 TPY or more of VOC emissions are
required to install controls.
Loading requirements for land-based transport vessels apply to all areas. Gasoline terminals in all non-
attainment areas are required to reduce emissions from the vapor recovery system vent to no more than
10.8 mg/liter of gasoline transferred. The rule also requires gasoline terminals in DFW, ELP, and
HGA to implement a fugitive emissions monitoring program and automatic shutdown of the loading
system during vapor control device malfunctions. Effective March 7, 1996, the commission removed
the requirement for vacuum-assisted vapor collection systems at gasoline terminals in DFW, ELP, and
HGA. This action is consistent with Maximum Achievable Control Technology (MACT) standards for
gasoline terminals promulgated by EPA on December 14, 1994.
Fugitive Emissions--Natural Gas Processing, Petroleum Refinery, and SOCMI (§§115.352-115.359).
This rule applies to all four nonattainment areas.
These rules apply a more stringent fugitive monitoring program to all natural gas processing, petroleum
refinery, and SOCMI facilities.

36
Acetone Replacement (§§115.412-115.419).
Effective March 7, 1996, the commission excluded acetone from the definition of VOC, and
concurrently deleted the rule requirements concerning acetone usage at polyester resin operations
(cultured marble and fiber-reinforced plastic manufacturing). This action followed the EPA June 16,
1995 rulemaking exemption of acetone from the federal definition of VOC. The rule was previously
expected to generate 0.289 TPD reduction in DFW and 1.434 TPD reduction in HGA. The commission
agrees that these reductions are no longer creditable. No reduction was expected in ELP. The rule did
not apply in BPA.
Offset Lithography Printing (§§115.440-115.449).
This rule applies to ELP and is a contingency rule in HGA and DFW.
The rules requires process changes for offset lithographic printing operations such as those used in the
printing of newspapers and advertisements. The rule specifies control requirements for several types of
offset printing. In some cases, add-on controls are required.
Marine and Other Vessel Cleaning (§§115.541-115.549).
This rule applies to BPA and HGA, and is a contingency rule for DFW and ELP.

37
In the past, the VOC emissions from cleaning or repair of storage tanks, tank trucks, rail cars, barges,
and ships have been vented directly to the atmosphere without control. This rule changes that practice
by requiring the emissions to be routed to a control device.
Benzene National Emissions Standards for Hazardous Air Pollutants (NESHAPS) Reductions.
VOC emission reductions associated with benzene NESHAPS apply to the HGA nonattainment area
and are described in Appendix 7-G.
Rule Effectiveness Improvements.
RE improvements are applicable to all nonattainment areas.
Credits can be obtained with real emission reductions resulting from the specific implementation
program improvements through better or clearer rules, more frequent inspections, more inspectors,
improved recordkeeping requirements, more stringent penalties for non-compliance, or more strict
control requirements. The RE National Protocol provides guidance to the states and local agencies for
conducting rule effectiveness studies that conform to standards set by the Stationary Source
Compliance Division (SSCD). SSCD protocol studies, as they are called, are a detailed source-by-
source checklist to determine RE and were initiated in 1988 as a compliance tool. The agency has
developed its own methodology pursuant to the Addendum of the EPA guidance document, Guidelines
for Estimating and Applying Rule Effectiveness for Ozone/CO State Implementation Plan Base Year
Inventories. This methodology has been approved for use by EPA, but must be confirmed in 1996 by a
commitment to perform an SSCD study to verify that the reductions taken are accurate.

38
Rather than perform a costly and time-consuming SSCD protocol study, the agency is committing to
use the following approach, which it believes more accurately determines the actual RE of each control
measure.
1. As a result of a planned realignment of agency resources, there will be significant increases in
regional office compliance and enforcement staff. These additional field office resources will enable
inspectors to precisely determine in-use control efficiency as part of each annual inspection. This
determination will identify three elements: the SIC code, the process unit, and the control equipment.
This determination will be based on data from continuous emissions monitors, parametric emission
monitoring programs, stack sampling, records of equipment performance vendor data, and other
applicable information. The results of this determination will be reported in conjunction with the
annual EI submission.
2. The upset/maintenance rule will be revised to require more detailed recordkeeping. Information on
the exact amount of the emissions released in excess of the in-use control efficiency will be required.
These two pieces of information taken together will allow the staff to determine an exact actual annual
emission rate for each emission point. The results of an SSCD protocol study, on the other hand,
provide only an industry average that may or may not accurately reflect the conditions at any given site
or for a specific piece of control equipment. The sources for further study will be prioritized based on
the amount of reductions obtainable--those industries with the largest reductions will receive top
priority. Tables 14 and 15 are lists of prioritized source categories with creditable RE improvements.

39
TABLE 14
Reductions Due to Rule Effectiveness Improvements--Area Sources
(tons per ozone day)
CATEGORY DFW ELP BPA HGA
Tank Truck Unloading 1.245 0.170 0.421 1.640
Surface Cleaning 0.290 0.606 0.000 0.280
Sheet Strip Coil 0.023 0.000 0.000 0.179
Architectural Coatings 0.184 0.000 0.000 0.000
Metal Containers 0.083 0.000 0.000 0.110
Machinery/Equipment 0.049 0.010 0.000 0.049
Other Trans Equipment 0.066 0.000 0.000 0.000
Factory Finished Wood 0.020 0.005 0.000 0.037
Auto New-Misc Metal 0.058 0.000 0.000 0.000
Tank Trucks in Transit 0.015 0.002 0.008 0.021
Cutback Asphalt 0.022 0.000 0.006 0.011
Electrical Insulation 0.012 0.002 0.000 0.000
Appliances 0.013 0.000 0.000 0.000
TOTAL 2.080 0.795 0.435 2.327

40
TABLE 15
Reductions Due to Rule Effectiveness Improvements--Point Sources(tons per ozone day)
CATEGORY DFW ELP BPA HGA
Gasoline Terminals 1.301 0.776 0.286 0.000
Roof Tanks-Ext Float 0.018 0.063 1.868 1.950
Resins-Polyethylene 0.000 0.000 1.582 2.065
Gasoline Plants 0.151 0.043 0.000 0.590
Pet Ref: Vac Prod 0.000 0.032 0.199 0.973
Storage Tanks-Fixed 0.045 0.001 0.286 1.617
Air Oxidation-SOCMI 0.000 0.000 0.000 0.123
Graphic Arts 0.555 0.000 0.000 0.049
Resins-Polypropylene 0.000 0.000 0.000 0.590
Auto New-Misc Metal 0.241 0.000 0.000 0.007
Resins-Polystyrene 0.141 0.000 0.013 0.660
Surf Coat Misc Met 0.111 0.014 0.001 0.069
Surface Cleaning 0.077 0.000 0.002 0.042
Cans 0.032 0.000 0.000 0.032
Metal Coils 0.028 0.000 0.000 0.020
Paper Products 0.033 0.000 0.000 0.000
Factory Finished Wood 0.026 0.000 0.000 0.000
Metal Furniture 0.013 0.000 0.000 0.000
Appliances 0.004 0.000 0.000 0.000
VOC/Water Separators 0.000 0.000 0.367 1.418
Fabrics 0.004 0.005 0.000 0.000
TOTAL 2.780 0.934 4.604 10.205

41
(ii) New or Modified Area Source Controls
The following rules apply mainly to area sources of VOC emissions.
Commercial Bakeries (§§115.121-115.129).
This rule applies to major source bakeries in DFW, and HGA, and is a contingency rule for ELP and
minor source bakeries in DFW.
This rule requires VOC emission reductions of at least 30% overall from 1990 base year emissions.
Bakeries with total oven emissions less than 25 TPY of VOC are exempt.
Municipal Landfills (§§115.152-115.159).
This rule applies to DFW and ELP, and is a contingency rule for HGA.
EPA has proposed New Source Performance Standards rules which use a gas extraction system to
reduce VOC emissions from sanitary landfills. The state is permitted to implement these rules early
and claim credit for VOC reductions.
Auto Body Shops (§§115.421-115.429).
This rule applies to ELP, DFW, and HGA.

42
This rule establishes VOC emission limitations for coatings and solvents used in vehicle refinishing.
The rule also specifies the procedures that vehicle refinishing operations must use to minimize VOC
emissions during equipment cleanup, and requires vehicle refinishing operations to utilize coating
application equipment with a transfer efficiency of at least 65%.
Architectural Coatings (§§115.421-115.429).
This rule applies to architectural coatings in all nonattainment areas. This rule regulates nine categories
of architectural coatings. EPA is developing a national architectural coatings rule which will specify
VOC emission limitations for approximately 30 categories of architectural coatings. In a memo dated
March 22, 1995, EPA stated that the national rule will reduce VOC emissions from the 1990 baseline
by 20% by 1996. A March 7, 1996 EPA memo states that despite delays in the rule proposal and final
compliance date “...the overall reduction estimate for the rule remains at 20 percent” and that “...States
may still claim credit for the 20 percent reduction from the rules in their 15 Percent Rate-of-Progress
Plans.” The commission may decide to repeal the state rule when EPA has adopted the national
architectural coating rule.
Petroleum Dry Cleaning (§§115.552-115.559).
This rule is a contingency rule for ELP, DFW, and HGA.
This rule adds control requirements for dry cleaning operations which use VOCs such as naphtha or
Stoddard solvent as the cleaning solvent. Dry cleaners which use perchloroethylene, which EPA has
reclassified as a non-VOC, are not included.

43
Consumer/Commercial Products (§§115.610-115.619).
This rule is applicable statewide to maximize the amount of creditable reductions in the nonattainment
areas due to enhanced rule effectiveness.
This rule controls the amount of VOC used in a variety of products such as air fresheners, bathroom
and tile cleaners, automotive cleaners, floor polishes and waxes, general purpose cleaning supplies,
toiletries, and laundry detergents. The rule includes a procedure for exemption of an innovative
consumer product from the table of standards emissions limits. The manufacturer must show to the
satisfaction of the agency that use of the product will result in equal or less VOC emissions as a result
of some characteristic of the product formulation, design or delivery system. Appendix 7-P lists the
innovative products which have been approved by the agency’s executive director under the case-by-
case premarket review procedure of section 115.614.
(iii) New or Modified Non-Road Mobile Source Controls
The FCAA Amendments of 1990 do not specifically mandate controls for non-road mobile sources.
However, this category of VOC emissions represents a substantial source of emissions in many Texas
nonattainment areas, particularly DFW. Therefore, implementing controls on non-road mobile sources
is important to the overall reduction of ozone. Included in the non-road mobile category are
construction and farm vehicles, marine vessels, locomotives, airplanes, utility engines, off-road
motorcycles, and off-highway vehicles.

44
Small Utility Engines (§§115.621-115.625).
Effective February 1, 1996, the commission repealed this rule which had established emission limits for
small gasoline powered and diesel utility engines with power ratings of 25 horsepower and less. This
action followed EPA's promulgation of a national small utility engine rule in May, 1995. Emission
reduction credit is being taken for the national rule.
Gasoline Volatility (Reid Vapor Pressure) Controls (§§115.252-115.259).
Representatives of local government and the Chevron refinery in El Paso approached the agency about
the possibility of lowering Reid Vapor Pressure (RVP) in summer gasoline instead of using
reformulated gasoline (RFG) to minimize the cost of refinery modifications, resulting in lower cost at
the pump for consumers. Chevron submitted results from the EPA complex model for predicting fuel
effects. The results show VOC reductions that are substantially equivalent to those from the use of
RFG when RVP is lowered to 7.0 pounds per square inch (psi).
Due to the substantially equivalent VOC reductions obtainable from low-RVP gasoline and the
overwhelming support for the low-RVP program by local government and industry, the agency will
implement a low-RVP gasoline program in El Paso. RVP gasoline has benefits for both on-road and
non-road mobile sources. Additionally, it will be possible to sell the low-RVP gasoline in Ciudad
Juarez, obtaining more widespread benefits for the air basin.
Current estimates indicate low-RVP gasoline resulting in a one-cent-per-gallon increase at the pump as
opposed to a predicted four to ten-cents-per-gallon increase for RFG.

45
Commercial Airport Rules.
Large commercial airports can be a significant source of VOC and NO emissions which are producedx
by a wide variety of sources. These sources include, but are not limited to, aircraft take-offs and
landings, aircraft taxi and queuing activities, aircraft refueling operations, aircraft gate support and
servicing operations, aircraft maintenance and painting operations, fuel farm operations and fuel tank
fugitives, fire training facility operations, automobile VMT emissions from service and passenger
vehicles, evaporative emissions from parked vehicles, and increased congestion from airport vicinity
traffic.
The agency is not currently proposing specific airport rules. However, creditable reductions are being
claimed from the federal aircraft noise control rules which phase in "Stage 3" aircraft. These rules will
provide emissions reductions because the "Stage 3" engines are more fuel efficient in addition to being
less noisy.
Stage II Vapor Recovery (§§115.241-115.249).
This rule applies to all public and private motor vehicle refueling facilities dispensing 10,000 gallons or
more of gasoline per month. Independent small business marketers of gasoline whose facilities have a
throughput of less than 50,000 gallons per month may request an extended compliance schedule. They
will then be required to install Stage II systems when their storage tanks are replaced or equipped with
corrosion protection, but no later than December 22, 1998.
A full description of the Stage II program is included in Appendix 7-F.

46
Stage I Vapor Recovery (§§115.221-115.229)
Rules concerning the filling of gasoline storage tanks for motor vehicle fuel dispensing facilities (Stage
I vapor recovery) were adopted in the late 1970's and early 1980's for some of the nonattainment
counties, and in 1992 for perimeter nonattainment counties. Amendments to these rules were adopted
in November 1993 to bring the Stage I program into alignment with the Stage II vapor recovery
requirements and improve enforceability.
Accelerated Vehicle Retirement Program (§114.29)
The agency has developed a vehicle scrappage program, titled "Accelerated Vehicle Retirement
Program", as §114.29 in Regulation IV. This program will not generate any SIP reduction credits as
currently designed, but may produce some milestone credits if the scrappage is used in lieu of a
monetary penalty.
The purpose of this program is to reduce mobile source emissions and provide additional flexibility for
stationary sources in the nonattainment areas: HGA, DFW, ELP, and BPA. A scrappage program
reduces VOC, NO , and CO emissions from mobile sources, such as automobiles and light duty trucks,x
by permanently removing high-emitting vehicles from the area-wide fleet. With this rule, stationary
sources will have the opportunity to select the most cost effective approach to complying with federal
and state regulations for ozone reduction.
(2) Changes in Mobile Source Emissions

47
(a) - (b) (No change.)
(c) Transportation Planning
Much of the responsibility for the planning and implementation of Transportation Control Measures
(TCMs) has been delegated to the applicable MPOs. TCMs are designed to either reduce the number
of vehicle miles traveled, reduce or eliminate vehicle trips, or improve the flow of traffic. There are a
variety of TCMs being considered (see list below), and each nonattainment area will choose from
among them. Title 30 of the Texas Administrative Code (TAC) §114.23, concerning Transportation
Control Measures, has been adopted to provide enforceability to the TCM strategy and related
categories of TCMs selected for each area. This rule contains TCM-specific definitions; designations
of affected MPOs responsible for TCM development, funding, and implementation; requirements that
MPOs submit specific information provided by agencies or entities responsible for TCM implemen-
tation and a quantification of the emission reduction benefits; requirements that MPOs maintain and
provide specific information to the agency regarding TCM implementation status; requirements that the
MPOs modify the transportation improvement program for the area, as necessary, to correct
implementation deficiencies; and prescribed enforcement actions to be taken if deficiencies remain
unresolved or if knowing violations of TCM commitments occur. A TCM summary for DFW, ELP,
and the HGA ozone nonattainment areas is located in Appendix 7-K. Those listed below are examples
of TCMs which may be adopted. Those specific TCM projects not needed will be deleted as long as
the TCM categories in the approved SIP are not deleted and the emission reduction totals remain the
same, and others may be added as they become available or identified. TCMs under consideration
include the following:

48
-- Restriction of certain roads or lanes to passenger buses or high-occupancy vehicles
(HOVs), and programs for the provision of all forms of high-occupancy, shared-ride
services.
-- Trip-reduction initiatives.
-- Traffic flow improvement programs that reduce emissions. Included are signal timing
improvements and computer controlled signal coordination/progression that permits
vehicles traveling in the direction of the major traffic flow to receive a green light
whenever possible, thereby reducing idling time. Intersections can also be modified to
improve traffic flow and reduce emissions.
-- Programs to limit or restrict vehicle use in the downtown area or other areas of high
emission concentration, particularly during periods of peak use.
-- Programs to limit portions of road surfaces or certain sections of the metropolitan area to
bicycle or pedestrian use, and to construct new roads or paths for this purpose. Also
programs for secure bicycle storage facilities and other facilities, including bicycle lanes,
for the protection and convenience of bicyclists, in both public and private areas.
-- Programs to reduce emissions due to extended idling of vehicles and extreme cold start
conditions.
-- Programs and ordinances to facilitate non-automobile travel, to facilitate provision and
utilization of mass transit, and to generally reduce the need for single-occupant vehicle
travel, as part of transportation planning and development efforts of a locality, including
programs and ordinances applicable to new shopping centers, special events, and other
centers of vehicle activity. Programs for improved public transit routes, service, frequency,
and route modifications are also included. Other programs include reduced transit fare and
municipal car pool/van pool programs.

49
-- Programs to encourage the voluntary removal from the marketplace and from use of pre-
1980 model year light-duty vehicles and trucks.
-- Programs and ordinances for parking incentives and disincentives to promote use of multi-
occupancy vehicles or mass transit.
-- Programs and ordinances to promote use of alternatively fueled vehicles.
(d) Vehicle I/M Program
The FCAA Amendments of 1990 mandate vehicle emissions inspection and maintenance programs in
areas that do not meet the NAAQS for ozone. Congress also set minimum performance standards for
these programs such as centralized testing, annual testing of some vehicles, minimum expenditure
amounts in “enhanced” I/M program areas, and registration enforcement.
EPA has promulgated federal rules that include specific performance standards for I/M programs.
These rules, based on the direction provided in the FCAA Amendments, state what is expected by EPA.
"Basic" programs are required for nonattainment areas with moderate ozone classifications.
"Enhanced" programs are required for those areas with a 1980 population of 200,000 or more, which
are classified as having serious, severe, or extreme ozone pollution levels. The HGA and ELP
nonattainment areas fall into this category and are required to have enhanced I/M programs. The BPA
nonattainment area is a moderate nonattainment area, and its 1980 population of less than 200,000 in an
urbanized area qualifies it for a basic program. The DFW area is a moderate ozone nonattainment area
and requires at least a basic program.

50
The EPA issued a rule on November 5, 1992 that outlined very specific requirements for vehicle
emissions testing. A vehicle emissions testing program was designed and implemented on January 1,
1995 that met all EPA requirements. The Texas Legislature suspended the program and authorized
Governor Bush to negotiate a new vehicle emissions testing program. On September 19, 1995, EPA
issued a rule allowing states to implement less stringent vehicle emissions testing programs. This rule
also raised the population requirements for I/M programs, thus allowing the BPA area to develop a
pollution control strategy that does not include I/M. On November 10, 1995, Governor Bush
announced the Texas Motorist’s Choice Vehicle Emissions Testing Program.
The emissions testing program will include the following:
o Scheduled testing will be required in Dallas, Tarrant, El Paso and Harris counties.
o Annual testing will be conducted in conjunction with the safety inspection.
o Motorists will choose a facility to perform tests, such as:
o Annual, two-speed idle tests at test-and-repair facilities,
o Annual, two-speed idle tests at test-only facilities,
o Biennial, loaded or transient tests at test-only or test-and-repair facilities.
o Two-speed idle test fees are set at test-and-repair sites, test fees for an annual two-speed idle
program are $13.00 and test fees for a biennial test are $26.00. Test fees for loaded mode
equipment have not been set.
o Vehicles registered in Denton, Collin, Brazoria, Galveston, Chambers, Liberty, Waller,
Montgomery, and Fort Bend counties will be subject to a vehicle emissions test if detected as a
“grossly polluting vehicle” as a result of remote sensing.

51
o Vehicles 2 to 24 years old will be tested annually. Vehicles 0 to 2 years old will be subject to
remote sensing inspection scans. Vehicles failing a remote sensing screening will be required to
have an emissions test.
o Vehicles six to 24 years old registered in Dallas, Tarrant or Harris counties must be tested at a
test-only facility prior to transferring title after resale if legislative authority is granted.
o Waivers must be performed by a recognized repair technician in order to qualify for a waiver.
o Low Income Time Extensions will be available.
o All inspection facilities will participate in a central database via a dial-up modem.
The emission control device inspection in all I/M program areas will consist of two components: a
visual test to verify presence (if applicable) of the catalytic convertor, exhaust gas recirculation system,
positive crankcase ventilation system, evaporative system, thermostatic air cleaner and air injection
system, and an automated inspection procedure for testing tail pipe emissions and the integrity of the
gas cap.
Inspection of the emissions control devices is performed through direct observation or through indirect
observation using a mirror, video camera, or other visual aid. Also referred to as an "anti-tampering
inspection," it shall include a determination as to whether each device is present and properly connected
and whether it is the correct type for the certified vehicle configuration. Aftermarket parts, as well as
the original equipment manufactured parts, may be considered correct if they are of the proper design
and fit for the certified vehicle configuration.
EPA proposes to approve I/M SIP submissions which are consistent with the following standards and
approved methods of testing for vehicle emissions.

52
(i) Emission Standards
Emission standards are limits for hydrocarbon (HC) and CO emissions. In transient testing, units of
measure are expressed as grams per mile (g.p.m.), while in idle and steady state testing, units of
measure are expressed in ppm or as a percentage. These standards will apply to all vehicles subject to
the program. Failure of any standard will necessitate appropriate repairs.
(ii) Evaporative System Integrity Test Procedure
This test procedure consists of a series of steps to measure an unacceptable drop in pressure, which
indicates deterioration of the gas cap. This portion of the test may be failed if the gas cap is missing or
is damaged or is no longer working properly.
(iii) Loaded-Mode, Two-Speed Test
This test will be conducted using an analyzer and a dynamometer. The dynamometer can range from a
simple chassis dynamometer to a more sophisticated variable inertial weight dynamometer. Tail pipe
emissions are sampled from the vehicle at a simulated speed of approximately 30 miles per hour and at
idle. Some motorists may choose this test-only option and will receive an emissions test that is valid
for two years. Equipment specifications and cut-points have not been developed.

53
(iv) Preconditioned Two-Speed Idle Test
This test is conducted using a BAR90-type analyzer without a dynamometer. The test sequence
consists of a high-speed mode at approximately 2,500 revolutions per minute followed immediately by
an idle mode. Additional preconditioning followed by an identical second-chance test is performed
only if the vehicle fails the first test cycle. Dedicated four-wheel drive and heavy-duty vehicles must
be tested using this test type. Motorists may elect this type of test and will receive an emissions test
that is valid for one year.
On November 29, 1995, President Clinton signed the National Highway System Designation Act of
1995. Section 348 of the legislation prohibits EPA from applying a default 50% penalty to a
decentralized vehicle I/M program if a SIP revision was submitted to EPA within 120 days of the bill’s
signature. Texas met this requirement, thus gaining additional credit for the vehicle emissions testing
program.
(e) Gasoline Volatility (Reid Vapor Pressure) Controls
Representatives of local government and the Chevron refinery in El Paso approached the agency about
the possibility of lowering RVP in summer gasoline instead of using RFG to minimize the cost of
refinery modifications resulting in lower costs at the pump for consumers. Chevron submitted results
from the EPA complex model for predicting fuel effects. The results show VOC reductions that are
substantially equivalent to those from the use of reformulated fuel when RVP is lowered to 7.0 psi.

54
Due to the substantially equivalent VOC reductions obtainable from low-RVP gasoline and the
overwhelming support for the low-RVP program by local government and industry, the commission
will implement a low-RVP gasoline program. RVP gasoline has benefits for both on-road and non-
road mobile sources. Additionally, it will be possible to sell the RVP gasoline in Cuidad Juarez,
obtaining more widespread benefits for the air basin.
Current estimates indicate RVP gasoline resulting in a one cent per gallon increase at the pump as
opposed to a predicted three to five cents per gallon increase for reformulated gasoline.
(f) Accelerated Vehicle Retirement Program
The agency has developed a vehicle scrappage program, the Accelerated Vehicle Retirement Program
(30 TAC §114.29). This program will not generate any SIP reduction credits as currently designed, but
may produce some milestone credits if the scrappage credits are donated to the state or generated
through state funding.
The purpose of this program is to reduce mobile source emissions and provide additional flexibility for
stationary sources in the nonattainment areas: HGA, DFW, ELP, and BPA. A scrappage program
reduces VOC, NO , and CO emissions from mobile sources, such as automobiles and light duty trucks,x
by permanently removing high-emitting vehicles from the area-wide fleet. With this rule, stationary
sources will have the opportunity to select the most cost effective approach for complying with federal
and state regulations for ozone reduction.
c) - e) (No change.)

55
b. Dallas/Fort Worth Ozone Control Strategy
1) General
As a result of the FCAA Amendments of 1990, Collin, Dallas, Denton, and Tarrant Counties were
classified as a moderate nonattainment areas. The DFW nonattainment area has an ozone design value
of 0.14 ppm, which places the area at the lower end of the moderate classification boundary.
2) Estimated Emission Reductions
Table 16 summarizes the breakdown of anthropogenic emissions in the DFW area by emission
categories.
TABLE 16
Anthropogenic VOC Emissions in the
Dallas/Fort Worth Area
CATEGORY AMOUNT IN TPD PERCENTAGE
Point 65.27 12
Area 174.02 32
Non-Road Mobile 105.19 19
On-Road Mobile 204.35 37
a) 15% Targeted Reductions (No change.)
56
b) Stationary and Area Source Controls Toward 15% Reduction
Stationary or point sources in the DFW nonattainment area account for only 12% of the total
anthropogenic emissions while area sources account for a much larger fraction, estimated to be 32%.
There are several federally mandated programs that will be creditable towards the 1993 ROP SIP, but
additional measures will be needed in order for the DFW area to meet its goal.
The DFW nonattainment area will receive creditable reductions from RACT catch-ups and leveling the
playing field. Table 17 identifies reductions due to RACT catch-ups and RE improvements for both
point and area sources. Reductions for leveling the playing field are included under RACT catch-ups.
For an explanation of the formulas used to calculate the reductions, see Appendix 7-I. For an
explanation of the catch-up rules, see Appendix 7-D.

Table 17
POINT SOURCES
RECatch-upDallas/Fort Worth -Reductions Due to RACT Catch-ups 3/8/96ReductionReduction Permitted Non-Permitted
New199690-961990RE-96RE-90RE-96RE-90CE-96CE-90PermitsEI 1996EI 1990Group Category(TPD)(TPD)(TPD)(TPD)(TPD)
0.0000.0000.00099.0%96.0%99.0%96.0%55.2%0.0%0.000.000.00CansA0.0000.0000.00095.0%90.0%75.0%70.0%55.9%0.0%0.000.000.00Metal CoilsB0.0280.0020.00090.0%85.0%85.0%80.0%55.6%0.0%0.030.030.02Paper ProductsC0.0000.0000.00090.0%85.0%85.0%80.0%55.6%0.0%0.000.000.00FabricsD0.0000.0000.00095.0%90.0%75.0%70.0%55.6%0.0%0.000.000.00Auto New-misc. metalE0.0000.0000.00095.0%90.0%75.0%70.0%55.6%0.0%0.000.000.00Metal FurnitureF0.0000.0000.00095.0%90.0%75.0%70.0%55.6%0.0%0.000.000.00AppliancesH0.0000.0000.00095.0%90.0%85.0%80.0%77.0%0.0%0.000.000.00Gasoline PlantsI0.0000.0000.00095.0%90.0%85.0%80.0%61.9%0.0%0.000.000.00Storage Tanks-FixedJ0.0000.0000.00095.0%90.0%85.0%80.0%100.0%0.0%0.000.000.00Pet.Ref.:Vacuum Producing Sys.K0.0000.0000.00090.0%85.0%65.0%60.0%95.0%0.0%0.000.000.00 VOC/Water SeparatorsK 0.0000.0000.00098.0%98.0%95.0%95.0%98.0%0.0%0.000.000.00 Process Unit TurnaroundsK0.0000.0000.0000.0%0.0%90.0%87.5%93.3%0.0%0.000.000.00Gasoline Terminals M0.0760.0040.00095.0%90.0%75.0%70.0%55.7%0.0%0.080.080.08Surface CleaningO0.0000.0000.00095.0%90.0%75.0%70.0%55.6%0.0%0.000.000.00Surface Coating Misc.MetalsP0.2250.0120.06290.0%85.0%85.0%80.0%55.6%0.0%0.160.300.24Factory Fin. WoodQ0.3850.0230.17290.0%85.0%75.0%70.0%60.0%0.0%0.170.580.49Graphic ArtsR0.0000.0000.00098.0%98.0%95.0%95.0%75.0%0.0%0.000.000.00Petroleum Refinery EquipS0.0000.0000.00095.0%93.0%90.0%88.0%61.9%0.0%0.000.000.00Roof Tanks-Ext.FloatT0.0000.0000.00090.0%85.0%85.0%80.0%98.0%0.0%0.000.000.00Resins-PolyethyleneZ0.0000.0000.00090.0%85.0%85.0%80.0%98.0%0.0%0.000.000.00 PolypropyleneZ0.0000.000-0.00190.0%85.0%85.0%80.0%98.0%0.0%0.000.000.00 PolystyreneZ0.0060.0000.01498.0%98.0%95.0%95.0%75.0%0.0%0.000.020.02Natural Gas Processing PlantsAA0.0000.0000.00098.0%98.0%95.0%95.0%75.0%0.0%0.000.000.00SOCMIAB0.0000.0000.00090.0%85.0%85.0%80.0%98.0%0.0%0.000.000.00Air Oxidation SOCMIAC
0.7210.0410.2481.010.85TOTALS

Table 17 (Continued)
POINT SOURCES
RECatch-upDallas/Fort Worth -RE Improvements Only 3/8/96ReductionReduction Permitted Non-Permitted
New199690-961990RE-96RE-90RE-96RE-90CE-96CE-90PermitsEI 1996EI 1990Group Category(TPD)(TPD)(TPD)(TPD)(TPD)
0.8680.0320.00099.0%96.0%99.0%96.0%55.2%55.2%0.360.900.90CansA0.5920.0280.00095.0%90.0%75.0%70.0%55.9%55.9%0.000.620.49Metal CoilsB0.5790.0310.00090.0%85.0%85.0%80.0%55.6%55.6%0.180.610.55Paper ProductsC0.0660.0040.00090.0%85.0%85.0%80.0%55.6%55.6%0.000.070.06FabricsD4.7590.2410.00095.0%90.0%75.0%70.0%55.6%55.6%1.285.002.63Auto New-misc. metalE0.2270.0130.00095.0%90.0%75.0%70.0%55.6%55.6%0.170.240.20Metal FurnitureF0.0860.0040.00095.0%90.0%75.0%70.0%55.6%55.6%0.000.090.09AppliancesH1.3190.1510.00095.0%90.0%85.0%80.0%77.0%77.0%0.161.470.72Gasoline PlantsI0.6650.0450.00095.0%90.0%85.0%80.0%61.9%61.9%0.220.710.46Storage Tanks-FixedJ0.0000.0000.00095.0%90.0%85.0%80.0%100.0%100.0%0.000.000.00Pet.Ref.:Vacuum Producing Sys.K0.0000.0000.00090.0%85.0%65.0%60.0%95.0%95.0%0.000.000.00 VOC/Water SeparatorsK 0.0000.0000.00098.0%98.0%95.0%95.0%98.0%98.0%0.000.000.00 Process Unit TurnaroundsK8.5291.3010.00094.0%91.5%90.0%87.5%93.3%93.3%1.609.832.91Gasoline Terminals M1.4370.0730.00095.0%90.0%75.0%70.0%55.7%55.7%0.381.511.18Surface CleaningO2.1390.1110.00095.0%90.0%75.0%70.0%55.6%55.6%0.862.251.76Surface Coating Misc.MetalsP0.2560.0140.00090.0%85.0%85.0%80.0%55.6%55.6%0.010.270.23Factory Fin. WoodQ8.6280.5320.00090.0%85.0%75.0%70.0%60.0%60.0%6.179.164.95Graphic ArtsR0.0000.0000.00098.0%98.0%95.0%95.0%75.0%75.0%0.000.000.00Petroleum Refinery EquipS0.6320.0180.00095.0%93.0%90.0%88.0%61.9%61.9%0.150.650.23Roof Tanks-Ext.FloatT0.0000.0000.00090.0%85.0%85.0%80.0%98.0%98.0%0.000.000.00Resins-PolyethyleneZ0.0000.0000.00090.0%85.0%85.0%80.0%98.0%98.0%0.000.000.00 PolypropyleneZ0.3390.1410.00090.0%85.0%85.0%80.0%98.0%98.0%0.480.480.43 PolystyreneZ0.0200.0000.00098.0%98.0%95.0%95.0%75.0%75.0%0.000.020.02Natural Gas Processing PlantsAA0.1000.0000.00098.0%98.0%95.0%95.0%75.0%75.0%0.010.100.08SOCMIAB0.0000.0000.00090.0%85.0%85.0%80.0%98.0%98.0%0.000.000.00Air Oxidation SOCMIAC
31.2422.7380.00033.9817.89TOTALS

Table 17 (Continued)
Area Sources
-Reductions Due to RACT Catch-ups Revised 6/12/96DALLASGrowth2
CR 90-96RP-96RP-90RE-96RE-90CE-96CE-90EI 1990FactorGroup Category(TPD)
0.00075.0%0.0%99.0%96.0%55.2%55.2%0.00001.0832Metal Containers-Collin,DentonA0.00075.0%0.0%75.0%70.0%55.9%55.9%0.00001.0832Sheet Strip Coil-Collin,DentonB0.08575.0%75.0%75.0%70.0%55.6%55.6%2.67211.0832Auto New-Collin,DentonE0.00075.0%0.0%75.0%70.0%55.6%55.6%0.00001.0832Appliances-Collin,DentonH0.05080.0%0.0%85.0%80.0%65.0%65.0%0.11361.0002Cutback Asphalt-Collin,DentonL2.43995.0%0.0%85.0%80.0%95.0%95.0%2.64721.2011Tank Truck Unloading-Collin,DentonN0.992100.0%0.0%75.0%70.0%55.7%55.7%2.19301.0832Surface Cleaning-Collin,DentonO0.07175.0%0.0%75.0%70.0%55.6%55.6%0.20911.0832Electrical Insulation-Collin,DentonP0.01175.0%0.0%75.0%70.0%55.6%55.6%0.03251.0832Other Trans Equip-Collin, DentonP0.08575.0%0.0%75.0%70.0%55.6%55.6%0.25011.0832Machinery/Equip-Collin,DentonP0.01675.0%0.0%85.0%80.0%55.6%55.6%0.04081.1058Factory Fin. Wood-Collin,DentonQ0.031100.0%0.0%85.0%80.0%95.0%95.0%0.03901.0002Tank Trucks in Transit-Collin,DentonV
3.7818.1974TOTALS
RE Improvement onlyGrowth
CR 90-96RP-96RP-90RE-96RE-90CE-96CE-90EI 1990FactorGroup Category(TPD)
0.08375.0%75.0%99.0%96.0%55.2%55.2%3.72131.0832Metal Containers-Dallas,TarrantA0.05875.0%75.0%75.0%70.0%55.6%55.6%1.81781.0832Auto New-misc. metal-Dallas,TarrantE0.01375.0%75.0%75.0%70.0%55.6%55.6%0.41341.0832Appliances-Dallas,TarrantH0.02280.0%80.0%85.0%80.0%65.0%65.0%0.48661.0002Cutback Asphalt-Dallas,TarrantL1.24595.0%95.0%85.0%80.0%95.0%95.0%6.38361.2011Tank Truck Unloading-Dallas,TarrantN0.290100.0%100.0%75.0%70.0%55.7%55.7%5.85881.0832Surface Cleaning-Dallas,TarrantO0.01275.0%75.0%75.0%70.0%55.6%55.6%0.36531.0832Electrical Insulation-Dallas,TarrantP0.06675.0%75.0%75.0%70.0%55.6%55.6%2.07921.0832Other Trans Equip-Dallas,TarrantP0.04975.0%75.0%75.0%70.0%55.6%55.6%1.52661.0832Machinery/Equip-Dallas,TarrantP0.02075.0%75.0%85.0%80.0%55.6%55.6%0.57701.1058Factory Fin. Wood-Dallas,TarrantQ0.015100.0%100.0%85.0%80.0%95.0%95.0%0.07681.0002Tank Trucks in Transit-Dallas,TarrantV0.18475.0%75.0%100.0%50.0%3.0%3.0%15.00711.0757Arch.-Coatings-Dallas,Tarrant*
2.05638.3135TOTALS

60
Stage II Vapor Recovery will be implemented in the DFW nonattainment area. This program will
control gasoline vapors escaping during the refueling of motor vehicles. The estimated reduction in
VOC emissions in the DFW area is identified in Table 18.
The CMC in Appendix 7-E includes a listing of control measures designed specifically for the DFW
nonattainment area ranked in priority order based on a variety of criteria. Most, if not all, of the
measures will need to be implemented in the area to achieve a 15% net of growth and the 3.0%
contingency emission reductions of VOCs by the 1996 milestone. The primary condition to use NOx
controls as contingency measures is a demonstration through UAM modeling that these controls will be
beneficial toward the reduction of ozone. Contingency measures in the DFW area will be selected after
consultation with local government organizations.
Proposed rules will be included in the General Rules and Regulations IV and V (30 TAC Chapters 101,
114, and 115). The explanation of and formula for creating the CMC is located in Appendix 7-E.
Table 18 identifies the estimated reductions toward the 1993 ROP goal that are available for each
control measure, both mandated and optional. This information, combined with the CMC, has been
used to formulate a ranking of the most effective and cost efficient rules for a particular nonattainment
area. This table is intended to identify options available to the state and is not intended to specify
reduction targets for each category.

Table 18 - Revised 6/12/96
ESTIMATES TOWARDS 15% ROP SIP - Dallas/Fort Worth
Percent 1996 GrowthPercent 1990EMISSIONS INVENTORY27.9%162.62-6.6%31.7%174.02Area Sources12.1%70.648.2%11.9%65.27Point Sources41.5%241.8918.4%37.2%204.35On-road Mobile Sources18.5%107.922.6%19.2%105.19Off-road Mobile Sources
583.076.2%548.83TOTALS
ESTIMATED REDUCTIONS
Cumulative %% of requirementReduction96 Projected TPDMANDATED RULES
3.43%3.43%4.03 10.11Catchups 18.90%15.47%18.19 22.39Vehicle Refueling (Stage II)19.41%0.51%0.605.40Aircraft Stage 319.45%0.04%0.050.06Other VOC Storage, tra19.56%0.10%0.120.41Major Source Bakeries78.65%59.09%69.46241.89** I/M, Tier I, RFG
78.65%92.45Subtot 15% RULES
78.65%8.99%10.5726.43 *** Auto Refinishing78.70%0.06%0.070.11Fugitives82.84%4.13%4.8675.39RE Improvements89.44%6.60%7.7665.21Gas Utility Engines95.34%5.90%6.94241.89TCMs99.40%4.06%4.7723.84Architectural Coatings102.88%3.48%4.09 20.46Consumer/Comm Products105.85%2.97%3.496.36Municipal Landfills107.69%1.85%2.179.83Bulk Gasoline Terminals108.17%0.47%0.562.79Trafic Markings108.98%0.82%0.964.80High Perform. Maintenance109.99%1.00%1.185.89Other Special Purpose111.14%1.15%1.3510.38Wood Furniture112.16%1.02%1.201.20CAFB Fire Training Pit115.76%3.60%4.23107.92Reform Gas (off-road)
37.11%43.62Subtot
Contingency Rules
115.91%0.15%0.180.25Vessel Cleaning116.64%0.73%0.851.92Offset Printing116.76%0.13%0.150.50Commercial Bakeries118.65%1.89%2.224.39Naptha Dry Cleaners120.38%1.73%2.03241.89TCMs122.54%2.16%2.54241.89I/M & FMVCP 1997123.15%0.62%0.7366.2996-97 Utility Engine
7.40%8.70Subtot
21.4%100.00%117.55Target Improvement115.76%136.0715% Rules + Mandated Rules15.76%18.52Excess (Shortfall)
3.0%16.46Required Contingency24.4%100.0%134.01Target + Contingency
108.0%144.77Total Reductions8.0%10.75Excess (Shortfall)
** Total credits from reform gas, FMVCP Tier I, and a preliminary I/M reduction based on an EPA approved factor based analysis*** Credits from this category are not counted

62
c) Mobile Source Controls
(1) Transportation Control Measures
TCMs will be implemented in the DFW nonattainment area as necessary. Those that will be
considered include: high occupancy vehicle lanes, intersection improvements, travel demand incen-
tives, bikeways, incident detection and response programs, park-and-ride lots, signal
timing/progression, grade separations, enhanced travel demand management, commuter rail, light rail,
new and widened roadways, discount transit fare, accelerated retirement of older vehicles, and trip
reduction initiatives. A full description of the TCMs for the DFW area is included in Appendix 7-K.
NCTCOG has specifically committed to those measures identified in Appendix 7-K.
(2) Vehicle Inspection/Maintenance Program
The Texas Motorist’s Choice Vehicle Emission Testing Program in the DFW nonattainment area will
subject gasoline powered light-duty cars and trucks and heavy-duty trucks registered in Dallas and
Tarrant Counties to emission testing. Exhaust gas testing for HC, CO, and carbon dioxide (CO ) is2
required. A hybrid program will allow the motorist to choose an annual two-speed idle test at test-and-
repair or test-only facilities or a biennial loaded or transient test at a test-only facility. Vehicles
registered in Denton and Collin Counties will be subject to a vehicle emissions test if detected as a
“grossly polluting vehicle” as a result of remote sensing.
Of the registered vehicles in Dallas and Tarrant Counties, vehicles 0 to 24 years old will be tested
annually. If legislative authority is granted, vehicles 6 to 24 years old will be required to be tested at a

63
test-only facility prior to transferring title after resale, and vehicles 0-24 years will be subject to remote
sensing scans. In addition to the emissions test, there will be an emission control device inspection
which will consist of a visual test to verify presence (if applicable) of the catalytic convertor, exhaust
gas recirculation system, positive crankcase ventilation system, evaporative system, thermostatic air
cleaner and air injection system and an automated inspection procedure for testing the integrity of the
gas cap.
Dedicated four-wheel drive vehicles, meaning any constant four-wheel drive vehicle which cannot be
converted to two-wheel drive except by removing one of the vehicle's drive shafts, shall be subject to a
preconditioned two-speed idle test.
(3) Reformulated Gasoline
On January 1, 1995, the DFW non-attainment area began using reformulated gasoline. This type of
fuel has significant air quality benefits for both on-road and non-road engines.
3) Demonstration of Attainment
The commission submitted a modeled demonstration of attainment for the DFW nonattainment area
using the UAM on September 14, 1994. The DFW nonattainment area will be required to demonstrate
monitored attainment of the NAAQS on November 15, 1996. Demonstration of attainment will be
based on monitoring data from 1994, 1995, and 1996.
4) Contingency Plan (No change.)

64
c. El Paso Ozone Control Strategy
1) General
The FCAA Amendments of 1990 classified El Paso as a serious nonattainment area. El Paso County is
the only county included in the nonattainment area designation. The El Paso nonattainment area has a
design value of 0.17.
El Paso is in a unique situation because of its proximity to Cuidad Juarez, Mexico. All nonattainment
areas in Texas are required to implement the 1993 ROP SIP reduction and additional reductions as
mandated by the FCAA. However, in recognition of El Paso's close proximity to Juarez, a computer
model demonstration of attainment was allowed using United States emissions alone. Because the
computer simulation showed ELP in compliance with the NAAQS, it will not have to implement
additional controls. Therefore, under §818 of the FCAA Amendments, El Paso will not be required to
be redesignated to a higher nonattainment classification with corresponding more stringent controls
should ambient air monitoring still show ozone levels in excess of the NAAQS in 1999.
2) Estimated Emission Reduction
Table 19 summarizes the breakdown of emissions in the El Paso area by emission categories.

65
TABLE 19
Anthropogenic VOC Emissions in the El Paso Area
CATEGORY AMOUNT IN TPD PERCENTAGE
Point 9.45 13
Area 24.94 35
Non-Road Mobile 10.99 15
On-Road Mobile 24.02 37
a) 15% Targeted Reductions (No change.)
b) Stationary and Area Source Controls Toward 15%
Stationary or point sources in the El Paso area account for 13% of the total anthropogenic emissions.
Area sources account for another 35%. There are several federally mandated programs which will be
creditable towards the 1993 ROP SIP, but additional measures will be needed in order for the El Paso
area to meet its goal.
The El Paso nonattainment area will receive creditable reductions from RACT catch-ups and leveling
the playing field. Table 20 identifies reductions due to RACT catch-ups and rule effectiveness
improvements for both point and area sources. Reductions for leveling the playing field are included
under RACT catch-ups. For an explanation of the formulas used to calculate the reductions, see
Appendix 7-I. For an explanation of the catch-up rules, see Appendix 7-D.
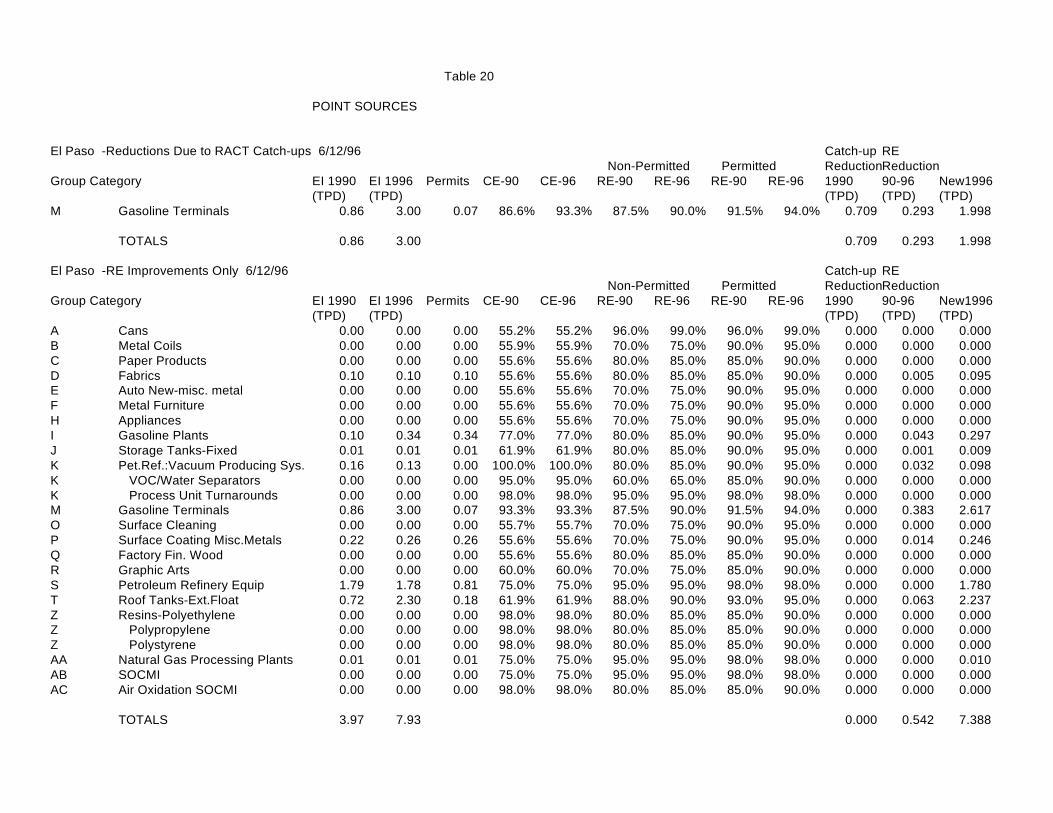
Table 20
POINT SOURCES
RECatch-upEl Paso -Reductions Due to RACT Catch-ups 6/12/96ReductionReduction Permitted Non-Permitted
New199690-961990RE-96RE-90RE-96RE-90CE-96CE-90PermitsEI 1996EI 1990Group Category(TPD)(TPD)(TPD)(TPD)(TPD)
1.9980.2930.70994.0%91.5%90.0%87.5%93.3%86.6%0.073.000.86Gasoline Terminals M
1.9980.2930.7093.000.86TOTALS
RECatch-upEl Paso -RE Improvements Only 6/12/96ReductionReduction Permitted Non-Permitted
New199690-961990RE-96RE-90RE-96RE-90CE-96CE-90PermitsEI 1996EI 1990Group Category(TPD)(TPD)(TPD)(TPD)(TPD)
0.0000.0000.00099.0%96.0%99.0%96.0%55.2%55.2%0.000.000.00CansA0.0000.0000.00095.0%90.0%75.0%70.0%55.9%55.9%0.000.000.00Metal CoilsB0.0000.0000.00090.0%85.0%85.0%80.0%55.6%55.6%0.000.000.00Paper ProductsC0.0950.0050.00090.0%85.0%85.0%80.0%55.6%55.6%0.100.100.10FabricsD0.0000.0000.00095.0%90.0%75.0%70.0%55.6%55.6%0.000.000.00Auto New-misc. metalE0.0000.0000.00095.0%90.0%75.0%70.0%55.6%55.6%0.000.000.00Metal FurnitureF0.0000.0000.00095.0%90.0%75.0%70.0%55.6%55.6%0.000.000.00AppliancesH0.2970.0430.00095.0%90.0%85.0%80.0%77.0%77.0%0.340.340.10Gasoline PlantsI0.0090.0010.00095.0%90.0%85.0%80.0%61.9%61.9%0.010.010.01Storage Tanks-FixedJ0.0980.0320.00095.0%90.0%85.0%80.0%100.0%100.0%0.000.130.16Pet.Ref.:Vacuum Producing Sys.K0.0000.0000.00090.0%85.0%65.0%60.0%95.0%95.0%0.000.000.00 VOC/Water SeparatorsK 0.0000.0000.00098.0%98.0%95.0%95.0%98.0%98.0%0.000.000.00 Process Unit TurnaroundsK2.6170.3830.00094.0%91.5%90.0%87.5%93.3%93.3%0.073.000.86Gasoline Terminals M0.0000.0000.00095.0%90.0%75.0%70.0%55.7%55.7%0.000.000.00Surface CleaningO0.2460.0140.00095.0%90.0%75.0%70.0%55.6%55.6%0.260.260.22Surface Coating Misc.MetalsP0.0000.0000.00090.0%85.0%85.0%80.0%55.6%55.6%0.000.000.00Factory Fin. WoodQ0.0000.0000.00090.0%85.0%75.0%70.0%60.0%60.0%0.000.000.00Graphic ArtsR1.7800.0000.00098.0%98.0%95.0%95.0%75.0%75.0%0.811.781.79Petroleum Refinery EquipS2.2370.0630.00095.0%93.0%90.0%88.0%61.9%61.9%0.182.300.72Roof Tanks-Ext.FloatT0.0000.0000.00090.0%85.0%85.0%80.0%98.0%98.0%0.000.000.00Resins-PolyethyleneZ0.0000.0000.00090.0%85.0%85.0%80.0%98.0%98.0%0.000.000.00 PolypropyleneZ0.0000.0000.00090.0%85.0%85.0%80.0%98.0%98.0%0.000.000.00 PolystyreneZ0.0100.0000.00098.0%98.0%95.0%95.0%75.0%75.0%0.010.010.01Natural Gas Processing PlantsAA0.0000.0000.00098.0%98.0%95.0%95.0%75.0%75.0%0.000.000.00SOCMIAB0.0000.0000.00090.0%85.0%85.0%80.0%98.0%98.0%0.000.000.00Air Oxidation SOCMIAC
7.3880.5420.0007.933.97TOTALS

Table 20 (Continued)
-Reductions Due to RE Improvements Revised 2/5/96EL PASO Growth
CR 90-96RP-96RP-90RE-96RE-90CE-96CE-90EI 1990FactorGroup Category(TPD)
0.00075.0%75.0%99.0%96.0%55.2%55.2%0.00001.0832Metal ContainersA0.00075.0%75.0%75.0%70.0%55.9%55.9%0.00001.0832Sheet Strip CoilB0.00075.0%75.0%75.0%70.0%55.6%55.6%0.00001.0832Auto NewE0.00075.0%75.0%75.0%70.0%55.6%55.6%0.00001.0832AppliancesH0.00080.0%80.0%85.0%80.0%65.0%65.0%0.00001.0002Cutback AsphaltL0.17095.0%95.0%85.0%80.0%95.0%95.0%0.84781.2358Tank Truck UnloadingN0.606100.0%0.0%75.0%70.0%55.7%55.7%1.34001.0832Surface CleaningO0.00275.0%75.0%75.0%70.0%55.6%55.6%0.06911.0832Electrical InsulationP0.00075.0%75.0%75.0%70.0%55.6%55.6%0.01511.0832Other Trans EquipP0.01075.0%75.0%75.0%70.0%55.6%55.6%0.29821.0832Machinery/EquipP0.00575.0%75.0%85.0%80.0%55.6%55.6%0.14661.1058Factory Fin. WoodQ0.002100.0%100.0%85.0%80.0%95.0%95.0%0.01021.0002Tank Trucks in TransitV
0.7962.7270TOTALS

68
Stage II Vapor Recovery will be implemented in the El Paso nonattainment area. This program will
control gasoline vapors escaping during the refueling of motor vehicles. The estimated reduction in
VOC emissions in the El Paso area is identified in Table 21.
The CMC in Appendix 7-E includes a listing of control measures designed specifically for the El Paso
nonattainment area ranked in priority order based on a variety of criteria. Most, if not all, of the
measures will need to be implemented in the area to achieve a 15% net of growth and the 3.0%
contingency emission reductions of VOCs by the 1996 milestone. The primary condition to use NOx
controls as contingency measures is a demonstration through UAM modeling that these controls will be
beneficial toward the reduction of ozone.
Proposed rules will be included in the General Rules and Regulations IV and V (30 TAC Chapters 101,
114, and 115). The explanation of and formula for creating the CMC is located in Appendix 7-E.
Table 21 identifies the estimated reductions toward the 1993 ROP goal that are available for each
control measure, both mandated and optional. This information, combined with the CMC, has been
used to formulate a ranking of the most effective and cost efficient rules for a particular nonattainment
area. This table is intended to identify options available to the state and is not intended to specify
reduction targets for each category.

Table 21 - Revised 7/12/96
ESTIMATES TOWARDS 15% ROP SIP - EL PASO
Percent 1996 GrowthPercent 1990EMISSIONS INVENTORY31.7%23.30-6.6%35.9%24.94Area Sources12.7%9.32-1.4%13.6%9.45Point Sources39.9%29.3522.2%34.6%24.02On-road Mobile Sources15.8%11.645.9%15.8%10.99Off-road Mobile Sources
73.616.1%69.40TOTALS
ESTIMATED REDUCTIONS
Cumulative %% of requirementReduction96 Projected TPDMANDATED RULES
4.39%4.39%0.71 3.00Catchups 15.92%11.53%1.87 2.30Vehicle Refueling (Stage II)16.04%0.12%0.020.29Aircraft Stage 361.56%45.52%7.3728.34** I/M , Tier I, RVP
61.56%9.97Subtot 15% RULES
61.56%10.84%1.764.39 ***Auto Refinishing65.02%3.45%0.561.27Offset Printing66.99%1.98%0.320.40Vessel Loading73.97%6.98%1.131.79Fugitives84.04%10.07%1.6310.66RE Improvements89.50%5.46%0.887.55Gas Utility Engines91.66%2.16%0.3528.34TCMs96.58%4.92%0.803.99Architectural Coatings100.93%4.35%0.70 3.52Consumer/Comm Products102.21%1.28%0.210.39Municipal Landfills103.88%1.67%0.270.37Industrial Wastewater108.65%4.77%0.773.00Bulk Gasoline Terminals111.12%2.47%0.400.84Outdoor Burning111.66%0.54%0.090.44Trafic Markings112.37%0.71%0.120.57High Perform. Maintenance112.59%0.22%0.040.29Wood Furniture113.15%0.56%0.0911.64RVP (off-road)
51.59%8.35Subtot
Contingency Rules
113.71%0.56%0.090.13Vessel Cleaning114.11%0.40%0.070.22Commercial Bakeries115.95%1.85%0.300.59Naptha Dry Cleaners119.23%3.27%0.5328.34TCMs122.29%3.06%0.5028.34I/M & Tier 1 1997122.80%0.51%0.087.5596-97 Utility Engine
9.65%1.56Subtot
23.3%100.00%16.19Target Improvement113.15%18.3215% Rules + Mandated Rules13.15%2.13Excess (Shortfall)
3.0%2.08Required Contingency26.3%100.0%18.27Target + Contingency
108.8%19.88Total Reductions8.8%1.61Excess (Shortfall)
** Total credits from FMVCP Tier I, and a preliminary I/M reduction based on an EPA approved factor based analysis*** Credits from this category are not counted

70
The agency has relied upon the provisions of §818 of the FCAA concerning International Border Areas
to formulate a strategy for dealing with El Paso's unique shared airshed. This section provides
nonattainment areas on an international border a mechanism to avoid being "bumped up" to the next
higher classification if it fails to attain by the attainment deadline. ELP can elect to show via a
technical analysis that it would have attained by the mandatory deadline "but for" emissions emanating
from Mexico.
Texas elected to take advantage of this provision and performed §818 modeling exercises which were
submitted to EPA on September 14, 1994, in lieu of an attainment demonstration as required for other
serious ozone nonattainment areas. This analysis included only emissions for the ELP side of the
border as comparable data is not yet available for Juarez, Mexico. This provision does not provide for
any relaxation of current or future controls, nor does it signify that ELP will not continue to strive to
reach attainment of the NAAQS. It merely states that ELP will not be subject to increasingly stringent
federally mandated control measures if the air quality problem is not solely generated in El Paso. This
approach has the support of local government and civic leaders. In addition, the citizens of ELP can
institute local programs, like improved TCMs, if they desire.
There have been several important programs to improve coordination and air quality between the
United States and Mexico. For example, basin-wide air quality modeling is required by the 1983 La
Paz Agreement between the United States and Mexico. The agency is working with EPA and the
Mexican national, state, and city governments to establish an air quality monitoring network, develop a
basin-wide CO control strategy, and complete an emissions inventory for Juarez.
c) Mobile Source Controls

71
(1) Transportation Control Measures
A variety of TCMs will be implemented in the El Paso nonattainment area. The ELP MPO has
specifically committed to those measures identified in Appendix 7-K. Several additional TCMs are
being considered for implementation in this area, and these measures may include, but are not limited
to: land use densification, mixed land use development, pedestrian improvements, traffic signal timing
improvements, college traffic management, K-12 school traffic management, employee transit pass
subsidy, non-metro service area transit, fixed commuter rail, bicycle improvements, trip reduction
initiatives, ridesharing, parking management, telecommuting, flexible work hours, compressed work
week, gasoline tax increase, emission pricing, roadway pricing, motorist information system, incident
management and response, special events management, and control of truck movements. A full
description of TCM categories to be implemented in the ELP area is included in Appendix 7-K.
(2) Vehicle I/M Program
The Texas Motorist’s Choice Vehicle Emission Testing Program in the ELP nonattainment area will
subject gasoline powered light-duty cars and trucks and heavy-duty trucks registered in El Paso County
to emission testing. The vehicle emissions testing program will allow the motorist to choose an annual
two-speed idle test at test-and-repair or test-only facilities. In addition, vehicles registered in El Paso
County will be subject to a vehicle emissions test if detected as a “grossly polluting vehicle” as a result
of remote sensing.
Of the registered vehicles in El Paso County, vehicles 0 to 24 years old will be tested. In addition to the
emissions test, there will be an emission control device inspection which will consist of a visual test to

72
verify presence (if applicable) of the catalytic convertor, exhaust gas recirculation system, positive
crankcase ventilation system, evaporative system, thermostatic air cleaner and air injection system and
an automated inspection procedure for testing the integrity of the gas cap.
Dedicated four-wheel drive vehicles, meaning any constant four-wheel drive vehicle which cannot be
converted to two-wheel drive except by removing one of the vehicle's drive shafts, shall be subject to a
preconditioned two-speed idle test.
(3) Reformulated Gasoline, Lower Reid Vapor Pressure Gasoline, and
Clean Fuel Vehicle Program
Representatives of local government and the Chevron refinery in ELP approached the agency about the
possibility of lowering the RVP in summer gasoline instead of using RFG to minimize the cost of
refinery modifications resulting in lower costs at the pump for consumers. Chevron submitted results
from the EPA complex model for predicting fuel effects. The results show VOC reductions that are
approximately equivalent to those from the use of reformulated fuel when RVP is lowered to 7.0 psi.
Due to the approximately similar reductions of VOCs obtainable from low RVP gasoline and the
overwhelming support of the low RVP program by local government and industry, the commission is
implementing a low RVP gasoline program in ELP. Low RVP gasoline has benefits for both on-road
and non-road mobile sources. Additionally, it may be possible to sell low RVP gasoline in Ciudad
Juarez, obtaining more widespread benefits for the air basin.

73
Current estimates indicate low RVP gasoline results in a one cent per gallon increase at the pump as
opposed to a predicted three to five cents per gallon increase for RFG.
The use of vehicles certified to a minimum of the low-emission vehicle (LEV) standards is mandated
by statute for certain privately owned and local government fleets by 1998 and thereafter. Agency rules
that implement this requirement will constitute a separate revision to the SIP as a substitute for the
Federal Clean Fuel Fleet (FCFF) program that is mandated for serious, severe, or extreme
nonattainment areas. The agency will work with local MPOs to determine the number of LEVs and the
amount of emission reductions generated by them.
3) Demonstration of Attainment
ELP has elected to demonsttrate attainment under §818 of the FCAA Amendments of 1990 by
performing UAM modeling which indicates that the area would attain the standard “but for” emissions
from Juarez, Mexico.
4) Contingency Plan (No change.)
d. Beaumont/Port Arthur Ozone Control Strategy
1) General

74
The FCAA Amendments of 1990 classified the BPA area as a serious nonattainment area. The BPA
nonattainment area includes Hardin, Jefferson, and Orange Counties. The BPA nonattainment area has
an ozone design value of 0.16 ppm, which places the area in the serious classification.
In December of 1990, then-Texas Governor William Clements requested that the BPA area be
reclassified as a "moderate" ozone nonattainment area in accordance with Section 181(a)(4) of the
FCAA Amendments of 1990. That request was denied on February 13, 1991. A recent review of the
original request and supporting documentation has revealed that this denial was made in error. As
provided by Section 110(k)(6) of the Act, the EPA Administrator of the has the authority to reverse a
decision regarding original designation if it is discovered that an error had been made.
Monitoring data from a privately-funded, special purpose monitoring network which was not included
in the Aerometric Information Retrieval System database was improperly used to deny this request.
Furthermore, subsequent air quality trends demonstrate that BPA is more properly classified as a
moderate nonattainment area, and should attain the standard by the required date for moderate areas of
November 15, 1996. Therefore, Governor Bush sent a letter and technical support to EPA on July 20,
1995, requesting that the BPA area be reclassified to moderate nonattainment status. BPA plans to
demonstrate attainment one of the following ways:
Monitored values showing attainment of the standard at state-operated monitors for the years 1994-
1996, which is the timeline the FCAA Amendments of 1990 specifies for moderate areas.
UAM modeling showing attainment of the standard but for transport of ozone and/or precursors.

75
EPA Region VI verified the data submitted in support of this request, and concurred that it is valid. On
June 3, 1996, the reclassification of the BPA area became effective.
2) Estimated Emission Reductions
Table 22 summarizes the breakdown of emissions in the BPA area by emission categories.
TABLE 22
Anthropogenic VOC Emissions in the
Beaumont/Port Arthur Area
CATEGORY AMOUNT IN TPD PERCENTAGE
Point 245.35 78
Area 30.63 10
Non-Road Mobile 18.44 6
On-Road Mobile 19.11 6
a) 15% Targeted Reductions (No Change.)
b) Stationary and Area Source Controls Toward 15% Reduction
Stationary or point sources in the BPA nonattainment area account for 78% of the total anthropogenic
emissions, the overwhelming majority of emissions. Area sources account for a further 10%. There

76
are several federally mandated programs that will be creditable towards the 1993 ROP SIP, but
additional measures will be needed in order for the BPA area to meet its goal.
The BPA nonattainment area will receive creditable reductions from RACT catch-ups and leveling the
playing field. Table 23 identifies reductions due to RACT catch-ups and improvements for both point
and area sources. Reductions for leveling the playing field are included under RACT catch-ups. For an
explanation of the formulas used to calculate the figures in these spreadsheets, see Appendix 7-I. For
an explanation of the catch-up rules themselves, see Appendix 7-D.

Table 23
POINT SOURCES
RECatch-up -Reductions Due to RACT Catch-ups 3/9/96BEAUMONT ReductionReduction Permitted Non-Permitted
New199690-961990RE-96RE-90RE-96RE-90CE-96CE-90PermitsEI 1996EI 1990Group Category(TPD)(TPD)(TPD)(TPD)(TPD)
0.0000.0000.00099.0%96.0%99.0%96.0%55.2%0.0%0.000.000.00CansA0.0000.0000.00095.0%90.0%75.0%70.0%55.9%0.0%0.000.000.00Metal CoilsB0.0000.0000.00090.0%85.0%85.0%80.0%55.6%0.0%0.000.000.00Paper ProductsC0.0000.0000.00090.0%85.0%85.0%80.0%55.6%0.0%0.000.000.00FabricsD0.0000.0000.00095.0%90.0%75.0%70.0%55.6%0.0%0.000.000.00Auto New-misc. metalE0.0000.0000.00095.0%90.0%75.0%70.0%55.6%0.0%0.000.000.00Metal FurnitureF0.0000.0000.00095.0%90.0%75.0%70.0%55.6%0.0%0.000.000.00AppliancesH0.0000.0000.00095.0%90.0%85.0%80.0%77.0%0.0%0.000.000.00Gasoline PlantsI0.0000.0000.00095.0%90.0%85.0%80.0%61.9%0.0%0.000.000.00Storage Tanks-FixedJ0.0000.0000.00095.0%90.0%85.0%80.0%100.0%0.0%0.000.000.00Pet.Ref.:Vacuum Producing Sys.K0.0000.0000.00090.0%85.0%65.0%60.0%95.0%0.0%0.000.000.00 VOC/Water SeparatorsK 0.0000.0000.00098.0%98.0%95.0%95.0%98.0%0.0%0.000.000.00 Process Unit TurnaroundsK1.9410.2860.68294.0%91.5%90.0%87.5%93.3%86.6%0.092.911.90Gasoline Terminals - Jeff & OrangeM0.0000.0000.0000.0%0.0%90.0%87.5%93.3%0.0%0.000.000.00Gasoline Terminals - HardinM0.0370.0020.02595.0%90.0%75.0%70.0%55.7%0.0%0.000.060.06Surface CleaningO0.0150.0010.01095.0%90.0%75.0%70.0%55.6%0.0%0.000.030.01Surface Coating Misc.MetalsP0.3350.0000.00098.0%98.0%95.0%95.0%75.0%0.0%0.340.340.34Petroleum Refinery EquipS0.0000.0000.00095.0%93.0%90.0%88.0%61.9%0.0%0.000.000.00Roof Tanks-Ext.FloatT4.0541.5823.90090.0%85.0%85.0%80.0%98.0%0.0%4.569.546.99Resins-PolyethyleneZ0.0000.0000.00090.0%85.0%85.0%80.0%98.0%0.0%0.000.000.00 PolypropyleneZ0.0430.0130.19890.0%85.0%85.0%80.0%98.0%0.0%0.000.250.23 PolystyreneZ0.3690.0000.55998.0%98.0%95.0%95.0%75.0%0.0%0.140.930.99Natural Gas Processing PlantsAA7.6040.0003.88198.0%98.0%95.0%95.0%75.0%0.0%6.0411.4910.52SOCMIAB0.0000.0000.00090.0%85.0%85.0%80.0%98.0%0.0%0.000.000.00Air Oxidation SOCMIAC
14.3981.8839.25625.5421.03TOTALS

Table 23 (Continued)RECatch-upRE Improvement only 3/9/96BEAUMONTReductionReduction Permitted Non-Permitted
New199690-961990RE-96RE-90RE-96RE-90CE-96CE-90PermitsEI 1996EI 1990Group Category(TPD)(TPD)(TPD)(TPD)(TPD)
0.0000.0000.00099.0%96.0%99.0%96.0%55.2%55.2%0.000.000.00CansA0.0000.0000.00095.0%90.0%75.0%70.0%55.9%55.9%0.000.000.00Metal CoilsB0.0000.0000.00090.0%85.0%85.0%80.0%55.6%55.6%0.000.000.00Paper ProductsC0.0000.0000.00090.0%85.0%85.0%80.0%55.6%55.6%0.000.000.00FabricsD0.0000.0000.00095.0%90.0%75.0%70.0%55.6%55.6%0.000.000.00Auto New-misc. metalE0.0000.0000.00095.0%90.0%75.0%70.0%55.6%55.6%0.000.000.00Metal FurnitureF0.0000.0000.00095.0%90.0%75.0%70.0%55.6%55.6%0.000.000.00Appliances80.0000.0000.00095.0%90.0%85.0%80.0%77.0%77.0%0.000.000.00Gasoline PlantsI4.3070.2860.00095.0%90.0%85.0%80.0%61.9%61.9%0.554.594.17Storage Tanks-FixedJ0.5930.1990.00095.0%90.0%85.0%80.0%100.0%100.0%0.010.790.96Pet.Ref.:Vacuum Producing Sys.K2.8830.3670.00090.0%85.0%65.0%60.0%95.0%95.0%0.063.253.93 VOC/Water SeparatorsK 0.0000.0000.00098.0%98.0%95.0%95.0%98.0%98.0%0.000.000.00 Process Unit TurnaroundsK0.0000.0000.00095.0%90.0%75.0%70.0%55.7%55.7%0.000.000.00Surface CleaningO0.0000.0000.00095.0%90.0%75.0%70.0%55.6%55.6%0.000.000.00Surface Coating Misc.MetalsP
19.7970.0000.00098.0%98.0%95.0%95.0%75.0%75.0%3.9419.8017.51Petroleum Refinery EquipS65.8521.8680.00095.0%93.0%90.0%88.0%61.9%61.9%13.3267.7221.77Roof Tanks-Ext.FloatT
93.4312.7200.000121.6969.36TOTALS

Area Sources
-Reductions Due to RACT Catch-ups Revised 6/12/96BEAUMONT Growth
CR 90-99RP-99RP-90RE-99RE-90CE-99CE-90EI 1990FactorGroup Category(TPD)
0.00075.0%0.0%99.0%96.0%55.2%55.2%0.00001.0395Metal ContainersA0.00075.0%0.0%75.0%70.0%55.9%55.9%0.00001.0395Sheet Strip CoilB0.00075.0%0.0%75.0%70.0%55.9%55.9%0.00001.0395Auto New-misc. metalE0.00075.0%0.0%75.0%70.0%55.6%55.6%0.00001.0395AppliancesH0.00080.0%0.0%85.0%80.0%65.0%65.0%0.00001.0111Cutback Asphalt-Hardin onlyL0.23095.0%0.0%85.0%80.0%95.0%95.0%0.29671.0111Tank Truck Unloading-Hardin onlyN0.352100.0%0.0%75.0%70.0%55.7%55.7%0.81001.0395Surface CleaningO0.00075.0%0.0%75.0%70.0%55.6%55.6%0.00001.0395Electrical InsulationP0.00775.0%0.0%75.0%70.0%55.6%55.6%0.02031.0395Other Trans EquipP0.02375.0%0.0%75.0%70.0%55.6%55.6%0.06991.0395Machinery/EquipP0.00075.0%0.0%85.0%80.0%55.6%55.6%0.00001.1601Factory Fin. WoodQ0.004100.0%0.0%85.0%80.0%95.0%95.0%0.00441.0111Tank Trucks in Transit-Hardin onlyV
0.6151.2013TOTALS
Beaumont - RE Improvement only - Jefferson, OrangeGrowth
CR 90-99RP-99RP-90RE-99RE-90CE-99CE-90EI 1990FactorGroup Category
0.00680.0%80.0%85.0%80.0%65.0%65.0%0.14161.0111Cutback AsphaltL0.42595.0%95.0%85.0%80.0%95.0%95.0%2.59011.0111Tank Truck UnloadingN0.008100.0%100.0%85.0%80.0%95.0%95.0%0.03811.0111Tank Trucks in TransitV
0.43912.7698TOTALS

80
Stage II Vapor Recovery will be implemented in the BPA nonattainment area. This program will
control gasoline vapors escaping during the refueling of motor vehicles. The estimated reduction in
VOC emissions in the BPA area is identified in Table 24.
The CMC in Appendix 7-E includes a listing of control measures designed specifically for the BPA
nonattainment area ranked in priority order based on a variety of criteria. Most, if not all, of the
measures will need to be implemented in the area to achieve a 15% net of growth and the 3.0%
contingency emission reduction of VOCs by the 1996 milestone. The primary condition to use NOx
controls as contingency measures is a demonstration through UAM modeling that these controls will be
beneficial toward the reduction of ozone.
Proposed rules will be included in the General Rules and Regulations IV and V (30 TAC Chapters 101,
114, and 115). The explanation of and formula for creating the CMC is located in Appendix 7-E.
Table 24 identifies the estimated reductions toward the 1993 ROP goal that are available for each
control measure, both mandated and optional. This information, combined with the CMC, has been
used to formulate a ranking of the most effective and cost efficient rules for a particular nonattainment
area. This table is intended to identify options available to the state and is not intended to specify
reduction targets for each category.

Table 24 - Revised 6/27/96 ESTIMATES TOWARDS ROP SIP - BEAUMONT/PORT ARTHUR
Percent 1996 GrowthPercent 1990EMISSIONS INVENTORY
9.0%28.71-6.3%9.8%30.63Area Sources78.4%250.962.3%78.3%245.35Point Sources6.8%21.8714.4%6.1%19.11On-road Mobile Sources5.8%18.470.2%5.9%18.44Off-road Mobile Sources
320.012.1%313.53TOTALS
ESTIMATED REDUCTIONS
Cumulative %% of requirementReduction96 Projected TPDMANDATED RULES
17.09%17.09%9.88 26.74Catchups 17.10%0.01%0.010.01TSDF20.49%3.40%1.96 2.39Vehicle Refueling (Stage II)40.82%20.33%11.7568.70General Vent Gas41.31%0.48%0.280.30Benzene NESHAPS41.67%0.36%0.2121.87FMVCP Tier I
41.67%24.08Subtot 15% RULES
131.01%1.86%1.082.69*** Auto Refinishing41.70%0.03%0.020.02Vessel Cleaning71.91%30.21%17.4628.11Fugitives116.25%44.33%25.6267.72** RE Floating Roof Tank124.96%8.72%5.0498.92RE Improvements126.61%1.65%0.958.00Gas Utility Engines129.19%2.59%1.492.92Stage I129.97%0.77%0.452.23Architectural Coatings130.63%0.66%0.38 1.91Consumer/Comm Products130.72%0.09%0.050.27Trafic Markings130.80%0.08%0.050.23High Perform. Maintenance131.01%0.21%0.120.60Other Special Purpose
89.34%51.63Subtot
Contingency Rules
132.20%1.19%0.6921.87I/M & FMVCP 1997132.34%0.14%0.088.1096-97 Utility Engine
1.34%0.77Subtot
18.4%100.00%57.79Target Improvement131.01%75.7115% Rules + Mandated Rules31.01%17.92Excess (Shortfall)
3.0%9.41Required Contingency21.4%100.0%67.20Target + Contingency
113.8%76.48Total Reductions13.8%9.29Excess (Shortfall)
** RE credits claimed from this category under "RE Improvements" are subtracted out to avoid double counting*** Credits from this category are not counted

82
c) Mobile Source Controls
(1) Vehicle I/M Program
The BPA nonattainment area is not required to have an I/M program per the EPA’s I/M Flexibility
Amendments promulgated September 18, 1995, because the 1990 urbanized area population for the
area is less than 200,000. Please see section B.7.a.4)b)(2)(d) of this document for more details
regarding the state’s Motorist’s Choice Vehicle Emission Testing Program.
(2) Reformulated Gasoline
RFG is not being considered in the BPA nonattainment area, although RFG has air quality benefits for
both on-road and non-road gasoline engines. Mobile source emissions are only a small portion of the
BPA area and the required reductions can be met without RFG.
3) Demonstration of Attainment
The BPA nonattainment area will be required to demonstrate attainment of the NAAQS on
November 15, 1996. Demonstration of attainment will be based on monitoring data from 1994, 1995,
and 1996, or on a UAM demonstration showing the influence of transported emissions or ozone on the
area’s airshed.
4) Contingency Plan (No change.)

83
e. Houston/Galveston Ozone Control Strategy
1) General
The FCAA Amendments of 1990 classified the HGA area as a Severe II nonattainment area. The
HGA nonattainment area includes the counties of Brazoria, Chambers, Fort Bend, Galveston, Harris,
Liberty, Montgomery, and Waller. The HGA nonattainment area has an ozone design value of 0.22
ppm, which places the area in the Severe II classification.
2) Estimated Emission Reductions
Table 25 summarizes the breakdown of emissions in the HGA area by emission categories.
TABLE 25
Anthropogenic VOC Emissions in theHouston/Galveston Area
CATEGORY AMOUNT IN TPD PERCENTAGE
Point 481.95 50
Area 200.07 20
Non-Road Mobile 129.98 13
On-Road Mobile 163.39 17
a) 15% Targeted Reductions (No change.)

84
b) Stationary and Area Source Controls Toward 15% Reduction
Stationary or point sources in the HGA nonattainment area account for 50% of the total anthropogenic
emissions. Area sources account for 20%. There are several federally mandated programs that will be
creditable towards the 1993 ROP SIP, but additional measures will be needed in order for the HGA
area to meet its goal.
The HGA nonattainment area will receive creditable reductions from RACT catch-ups and leveling the
playing field. Table 26 identifies reductions due to RACT catch-ups and rule effectiveness
improvements for both point and area sources. Reductions for leveling the playing field are included
under RACT catch-ups. For an explanation of the formulas used to calculate reductions, see Appendix
7-I. For an explanation of the catch-up rules, see Appendix 7-D.

Table 26
POINT SOURCES
RECatch-up-Reductions Due to RACT Catch-ups 3/9/96HOUSTONReductionReduction Permitted Non-Permitted
New199690-961990RE-96RE-90RE-96RE-90CE-96CE-90PermitsEI 1996EI 1990Group Category(TPD)(TPD)(TPD)(TPD)(TPD)
2.0170.0740.00099.0%96.0%99.0%96.0%55.2%0.0%2.092.091.93CansA0.0590.0030.00095.0%90.0%75.0%70.0%55.9%0.0%0.060.060.04Metal CoilsB0.0000.0000.00090.0%85.0%85.0%80.0%55.6%0.0%0.000.000.00Paper ProductsC0.0000.0000.00090.0%85.0%85.0%80.0%55.6%0.0%0.000.000.00FabricsD0.0000.0000.00095.0%90.0%75.0%70.0%55.6%0.0%0.000.000.00Auto New-misc. metalE0.0000.0000.00095.0%90.0%75.0%70.0%55.6%0.0%0.000.000.00Metal FurnitureF0.1240.0070.03295.0%90.0%75.0%70.0%55.6%0.0%0.080.160.16AppliancesH0.0000.0000.00095.0%90.0%85.0%80.0%77.0%0.0%0.000.000.00Gasoline PlantsI1.5440.1021.44095.0%90.0%85.0%80.0%61.9%0.0%0.183.093.01Storage Tanks-FixedJ0.0000.0000.00095.0%90.0%85.0%80.0%100.0%0.0%0.000.000.00Pet.Ref.:Vacuum Producing Sys.K0.0000.0000.00090.0%85.0%65.0%60.0%95.0%0.0%0.000.000.00 VOC/Water SeparatorsK 0.0000.0000.00098.0%98.0%95.0%95.0%98.0%0.0%0.000.000.00 Process Unit TurnaroundsK0.4570.0860.06494.0%91.5%90.0%87.5%93.3%0.0%0.530.610.48Gasoline Terminals - Cham, Ft Bend, Lib, Mont, WallM1.8930.2910.56094.0%91.5%90.0%87.5%93.3%86.6%0.432.741.65Gasoline Terminals - Braz, Galv, HarrM1.0300.1515.06094.0%91.5%90.0%87.5%93.3%0.0%0.046.245.22Gasoline Terminals-HarrisM0.0960.0050.06595.0%90.0%75.0%70.0%55.7%0.0%0.000.170.15Surface CleaningO0.1490.0070.09795.0%90.0%75.0%70.0%55.6%0.0%0.000.250.21Surface Coating Misc.MetalsP0.0000.0000.00090.0%85.0%85.0%80.0%55.6%0.0%0.000.000.00Factory Fin. WoodQ0.1880.0220.00090.0%85.0%75.0%70.0%75.0%0.0%0.210.210.09Graphic ArtsR1.4090.0002.13598.0%98.0%95.0%95.0%75.0%0.0%0.553.543.42Petroleum Refinery EquipS0.3340.0100.00195.0%93.0%90.0%88.0%61.9%0.0%0.340.340.13Roof Tanks-Ext.FloatT0.3600.1141.34590.0%85.0%85.0%80.0%98.0%0.0%0.101.820.91Resins-PolyethyleneZ0.0000.0000.00090.0%85.0%85.0%80.0%98.0%0.0%0.000.000.00 PolypropyleneZ0.0000.0000.00090.0%85.0%85.0%80.0%98.0%0.0%0.000.000.00 PolystyreneZ4.0040.0009.89598.0%98.0%95.0%95.0%75.0%0.0%0.0113.9014.65Natural Gas Processing PlantsAA0.6940.0001.29798.0%98.0%95.0%95.0%75.0%0.0%0.171.991.58SOCMIAB0.0000.0000.00090.0%85.0%85.0%80.0%98.0%0.0%0.000.000.00Air Oxidation SOCMIAC
14.3560.87321.99037.2233.63TOTALS

RECatch-upRE Improvement only 3/9/96HOUSTONReductionReduction Permitted Non-Permitted
New199990-991990RE-99RE-90RE-99RE-90CE-99CE-90PermitsEI 1999EI 1990Group Category(TPD)(TPD)(TPD)(TPD)(TPD)
0.9140.0330.00099.0%96.0%99.0%96.0%55.2%55.2%0.200.950.85CansA0.4480.0230.00095.0%90.0%75.0%70.0%55.9%55.9%0.120.470.30Metal CoilsB0.0000.0000.00090.0%85.0%85.0%80.0%55.6%55.6%0.000.000.00Paper ProductsC0.0000.0000.00090.0%85.0%85.0%80.0%55.6%55.6%0.000.000.00FabricsD0.1290.0070.00095.0%90.0%75.0%70.0%55.6%55.6%0.060.140.14Auto New-misc. metalE0.0000.0000.00095.0%90.0%75.0%70.0%55.6%55.6%0.000.000.00Metal FurnitureF0.0010.0000.00095.0%90.0%75.0%70.0%55.6%55.6%0.000.000.00AppliancesH0.0000.0000.00095.0%90.0%85.0%80.0%77.0%77.0%0.000.000.00Gasoline PlantsI
24.4601.6460.00095.0%90.0%85.0%80.0%61.9%61.9%5.2526.1119.95Storage Tanks-FixedJ2.6600.9210.00095.0%90.0%85.0%80.0%100.0%100.0%0.103.583.40Pet.Ref.:Vacuum Producing Sys.K8.7541.3420.00090.0%85.0%65.0%60.0%95.0%95.0%1.6610.1011.90 VOC/Water SeparatorsK 0.0000.0000.00098.0%98.0%95.0%95.0%98.0%98.0%0.000.000.00 Process Unit TurnaroundsK0.0000.0000.00094.0%91.5%90.0%87.5%93.3%93.3%0.000.000.00Gasoline TerminalsM0.8740.0430.00095.0%90.0%75.0%70.0%55.7%55.7%0.130.920.83Surface CleaningO1.5160.0780.00095.0%90.0%75.0%70.0%55.6%55.6%0.501.591.15Surface Coating Misc.MetalsP0.0000.0000.00090.0%85.0%85.0%80.0%55.6%55.6%0.000.000.00Factory Fin. WoodQ0.9670.0530.00090.0%85.0%75.0%70.0%60.0%60.0%0.001.020.80Graphic ArtsR
25.5760.0000.00098.0%98.0%95.0%95.0%75.0%75.0%5.5425.5824.80Petroleum Refinery EquipS68.6271.9620.00095.0%93.0%90.0%88.0%61.9%61.9%21.5870.5924.18Roof Tanks-Ext.FloatT6.0392.2350.00090.0%85.0%85.0%80.0%98.0%98.0%5.388.276.18Resins-PolyethyleneZ1.6030.6390.00090.0%85.0%85.0%80.0%98.0%98.0%1.962.241.49 PolypropyleneZ1.9990.7110.00090.0%85.0%85.0%80.0%98.0%98.0%1.452.712.06 PolystyreneZ2.9340.0000.00098.0%98.0%95.0%95.0%75.0%75.0%0.162.932.90Natural Gas Processing PlantsAA
41.0260.0000.00098.0%98.0%95.0%95.0%75.0%75.0%19.5841.0334.32SOCMIAB0.4300.1260.00090.0%85.0%85.0%80.0%98.0%98.0%0.000.560.07Air Oxidation SOCMIAC
188.9579.8200.000198.78135.32TOTALS

Area Sources
-Reductions Due to RACT Catch-ups Revised 6/12/96HOUSTONGrowth
CR 90-99RP-99RP-90RE-99RE-90CE-99CE-90EI 1990FactorGroup Category(TPD)
0.51875.0%0.0%99.0%96.0%55.2%55.2%1.12311.1262Metal Containers-Not HarrisA0.00075.0%0.0%75.0%70.0%55.6%55.6%0.00001.1262Auto New-misc. metal-Not HarrisE0.00075.0%0.0%75.0%70.0%55.6%55.6%0.00001.1262Appliances-Not HarrisH0.11680.0%0.0%85.0%80.0%65.0%65.0%0.25861.0111Cutback AsphaltL2.94495.0%0.0%85.0%80.0%95.0%95.0%3.79531.0111Tank Truck Unloading-Not Harris,Gal,Braz.N1.367100.0%0.0%75.0%70.0%55.7%55.7%2.69101.2162Surface Cleaning-Not HarrisO0.00075.0%0.0%75.0%70.0%55.6%55.6%0.00001.2162Electrical Insulation-Not HarrisP0.02175.0%0.0%75.0%70.0%55.6%55.6%0.05631.2162Other Trans Equip-Not HarrisP0.07775.0%0.0%75.0%70.0%55.6%55.6%0.20291.2162Machinery/Equip-Not HarrisP0.03975.0%0.0%85.0%80.0%55.6%55.6%0.09441.1601Factory Fin. Wood-Not HarrisQ0.365100.0%0.0%85.0%80.0%95.0%95.0%0.44671.0111Tank Trucks in Transit-Not Harris,GalvestonV
5.4478.6683TOTALS
RE Improvement only
GrowthCR 90-99RP-99RP-90RE-99RE-90CE-99CE-90EI 1990FactorGroup Category
(TPD)0.11675.0%75.0%99.0%96.0%55.2%55.2%4.98431.1262Metal Containers-HarrisA0.01180.0%80.0%85.0%80.0%65.0%65.0%0.24821.0111Cutback Asphalt-Harris,Gal,BrazoriaL1.38495.0%95.0%85.0%80.0%95.0%95.0%8.43121.0111Tank Truck Unloading-Harris,Gal,BrazN0.319100.0%100.0%75.0%70.0%55.7%55.7%5.75101.2162Surface Cleaning-HarrisO0.00075.0%75.0%75.0%70.0%55.6%55.6%0.00001.2162Electrical Insulation-HarrisP0.00075.0%75.0%75.0%70.0%55.6%55.6%0.00001.2162Other Trans Equip-HarrisP0.05575.0%75.0%75.0%70.0%55.6%55.6%1.54081.2162Machinery/Equip-HarrisP0.03975.0%75.0%85.0%80.0%55.6%55.6%1.07091.1601Factory Fin. Wood-HarrisQ0.021100.0%100.0%85.0%80.0%95.0%95.0%0.10501.0111Tank Trucks in Transit-Harris,Gal,BrazV
1.94522.1314TOTALS

88
Stage II Vapor Recovery will be implemented in the HGA nonattainment area. This program will
control gasoline vapors escaping during the refueling of motor vehicles. The estimated reduction in
VOC emissions in the HGA area is identified in Table 27.
The CMC in Appendix 7-E includes a listing of control measures specifically for the HGA
nonattainment area ranked in priority order based on a variety of criteria. Most, if not all, of the
measures will need to be implemented in the area to achieve a 15% net of growth and the 3.0%
contingency reduction in emissions of VOC by the 1996 milestone.
Proposed rules will be included in the General Rules and Regulations IV and V (30 TAC Chapters 101,
114, and 115). The explanation of and formula for creating the CMC is located in Appendix 7-E.
Table 27 shows the estimated reductions toward the 1993 ROP goal that are available for each control
measure, both mandated and optional. This information, combined with the CMC, can be used to
formulate a ranking of the most effective and cost efficient rules for a particular nonattainment area.

Table 27 - Revised 7/12/96
ESTIMATES TOWARDS 15% ROP SIP - HOUSTON/GALVESTON
Percent 1996 GrowthPercent 1990EMISSIONS INVENTORY18.5%189.85-5.1%20.5%200.07Area Sources49.2%504.934.8%49.4%481.95Point Sources18.8%192.8918.1%16.8%163.39On-road Mobile Sources13.5%138.376.5%13.3%129.98Off-road Mobile Sources
1026.045.2%975.39TOTALS
ESTIMATED REDUCTIONS
Cumulative %% of requirementReduction96 Projected TPDMANDATED RULES
13.04%13.04%27.81 46.75Catchups 19.36%6.32%13.4814.48TSDF27.28%7.92%16.89 20.83Vehicle Refueling (Stage II)33.83%6.55%13.9778.65General Vent Gas36.31%2.49%5.30150.46Reform Gas (off road)55.26%18.95%40.41192.89** I/M, Tier I, RFG
55.26%117.86Subtot 15% RULES
55.26%5.19%11.0827.57*** Auto Refinishing56.67%1.41%3.014.14Vessel Cleaning59.61%2.94%6.2612.23Stage I60.40%0.79%1.684.61SOCMI Reactor/Distillation67.77%7.37%15.7331.57 Marine Vessel Loading89.36%21.58%46.0374.36Fugitives95.37%6.01%12.82186.44RE Improvements99.34%3.97%8.4771.15Gas Utility Engines99.51%0.17%0.36192.89TCMs101.87%2.36%5.0325.16Architectural Coatings103.95%2.08%4.44 22.21Consumer/Comm Products107.97%4.02%8.5611.71Industrial Wastewater109.54%1.57%3.366.46Bulk Gasoline Terminals109.64%0.10%0.220.75Major Source Bakeries109.91%0.26%0.562.79Trafic Markings110.37%0.46%0.994.94High Perform. Maintenance110.95%0.58%1.246.22Other Special Purpose111.13%0.17%0.372.90Wood Furniture
55.86%119.14Subtot
Contingency Rules
113.00%1.87%3.997.27Municipal Landfills114.03%1.03%2.205.00Offset Printing114.91%0.88%1.883.72Naptha Dry Cleaners118.63%3.72%7.94192.89I/M & FMVCP 1997118.99%0.35%0.7671.1596-97 Utility Engine
7.86%16.77Subtot
21.9%100.00%213.27Target Improvement111.13%237.0015% Rules + Mandated Rules11.13%23.73Excess (Shortfall)
3.0%29.26Required Contingency24.9%100.0%242.53Target + Contingency
104.6%253.77Total Reductions4.6%11.24Excess (Shortfall)
** Total credits from reform gas, FMVCP Tier I, and a preliminary I/M reduction based on an EPA approved factor based analysis. For a detailed explanation and breakdown, refer to Appendix L.*** Credits from this category are not counted

90
c) Mobile Source Controls
(1) Transportation Control Measures
A TCM program is mandated for the HGA nonattainment area. Several additional TCMs are being
considered for implementation in the area. These measures may include, but are not limited to: land
use densification, mixed land use development, pedestrian improvements, traffic signal timing
improvements, college traffic management, K-12 school traffic management, employee transit pass
subsidy, non-metro service area transit, fixed commuter rail, bicycle improvements, trip reduction
initiatives, ridesharing, parking management, telecommuting, flexible work hours, compressed work
week, gasoline tax increase, emission pricing, roadway pricing, motorist information system, incident
management and response, special events management, control of truck movements. TCMs scheduled
to be implemented include: high occupancy vehicle lanes, arterial traffic flow improvements, park-
and-ride lots, transit improvements, area-wide rideshare, and intelligent transportation systems
(formerly known as intelligent vehicle highway systems). A TCM summary is included in Appendix 7-
K. The Houston-Galveston Area Council has specifically committed to those measures identified in
Appendix 7-K.
(2) Vehicle Inspection/Maintenance Program
The Texas Motorist’s Choice Vehicle Emission Testing Program in the HGA nonattainment area will
subject gasoline powered light-duty cars and trucks and heavy-duty trucks registered in Harris County
to emission testing. Exhaust gas testing for HC, CO, and CO is required. A hybrid program will allow2
the motorist to choose an annual two-speed idle test at test-and-repair or test-only facilities or a biennial

91
loaded or transient test at a test-only facility. Vehicles registered in Brazoria, Galveston, Montgomery,
Chambers, Liberty, Waller, and Fort Bend Counties will be subject to a vehicle emissions test if
detected as a “grossly polluting vehicle” as a result of remote sensing.
Of the registered vehicles in Harris County, vehicles 0 to 24 years old will be tested. Vehicles 6 to 24
years old will be required to be tested prior to transferring title after resale, pending legislative
authority. In addition to the emissions test, there will be an emission control device inspection which
will consist of a visual test to verify presence (if applicable) of the catalytic convertor, exhaust gas
recirculation system, positive crankcase ventilation system, evaporative system, thermostatic air cleaner
and air injection system and an automated inspection procedure for testing the integrity of the gas cap.
Dedicated four-wheel drive vehicles, meaning any constant four-wheel drive vehicle which cannot be
converted to two-wheel drive except by removing one of the vehicle's drive shafts, shall be subject to a
preconditioned two-speed idle test.
(3) Reformulated Gasoline and Clean Fuel Vehicle Program
Beginning on January 1, 1995, reformulated gasoline was introduced in the HGA nonattainment area.
This type of fuel has significant air quality benefits for both on-road and non-road gasoline engines.
The use of vehicles certified to a minimum of the LEV standards is mandated by statute for certain
privately owned and local government fleets by 1998 and thereafter. Agency rules that implement this
requirement will constitute a separate revision to the SIP as a substitute for the FCFF program that is

92
mandated for serious, severe, or extreme nonattainment areas. The agency will work with local MPOs
to determine the number of LEVs and the amount of emission reductions generated by them.
3) Demonstration of Attainment (No change.)
4) Contingency Plan (No change.)
8. SIP REVISIONS FOR MOBILE SOURCES (Revised.)
a. Vehicle Inspection/Maintenance (I/M) Program (No change.)
b. Vehicle Miles Traveled Offset (No change.)
c. Employer Trip Reduction Program. (Repealed.)
9. SIP REVISIONS FOR THE ATTAINMENT DEMONSTRATION (Revised.)
a. ELP §818 Attainment Demonstration (Revised--Addendum.)

93
EL PASO §818 ATTAINMENT DEMONSTRATION
Addendum: Technical Support Document
Introduction
In November 1993, the commission submitted a revision to the SIP for the control of ozone in El Paso.
The purpose of this revision was to achieve a 15% reduction in emissions of VOCS below 1990 levels
by November 15, 1996. The largest reductions were to be achieved through the implementation of a
vehicle I/M program. On February 1, 1995, the Legislature suspended the I/M program in all Texas
nonattainment counties, and authorized Governor Bush to negotiate a new program that is more
convenient to the public. This action resulted in a one-year delay in the implementation of the I/M
program, now scheduled to begin in January 1997.
The commission submitted an attainment demonstration for the ELP ozone nonattainment area in
November 1994 under the conditions of §818 of the FCAA Amendments of 1990. This section allows
the commission to demonstrate that ELP would be in compliance with the NAAQS for ozone “but for
emissions emanating from outside the United States”. The demonstration used the emission reductions
expected from the I/M program to project that ELP would be in compliance with the NAAQS by
November 15, 1996. The purpose of the following discussion is to demonstrate that the I/M delay will
have no significant effect on the validity of the attainment demonstration.

94
Technical Discussion
The agency used version IV of the UAM, an EPA-approved photochemical grid model, to perform the
modeling for the ELP ozone nonattainment area. All modeling activities were performed as outlined in
the UAM modeling protocol, and in accordance with EPA's "Guideline for Regulatory Application of
the Urban Airshed Model" (ref. 1). The UAM modeling protocol for the ELP area was approved by the
EPA on February 9, 1994. The modeling attainment demonstration SIP for the ELP ozone
nonattainment area was submitted to the EPA on September 14, 1994.
The first step in the photochemical modeling effort was to select historical "base case" ozone episodes
for the ELP area. Selected episodes were characterized by high monitored ozone concentrations and
meteorological conditions which are typically conducive to the development of high ozone levels.
A meteorological model was employed to simulate weather patterns and develop the necessary
meteorological input files (e.g., wind fields) for each ozone episode. Concurrently, emissions input
files were developed for each ozone episode using the Emissions Processing System, which spatially
and temporally models emissions of VOC, NO , and CO for point, area, and mobile source categories. x
These modeling emissions input files were based upon data collected for the 1990 Base Year EI.
The modeling emissions used for the ELP nonattainment area were limited to United States sources
only, as per provisions of §818 of the FCAA Amendments of 1990. Although a VOC and NOx
emissions inventory for Juarez, Mexico is being developed, it was not available at the time the ozone
SIP for El Paso was due (i.e., November 15, 1994), and is still not complete.

95
The UAM modeling for each of the base case ozone episodes, conducted with the episode-specific
emissions derived from the 1990 Base Year EI, predicted ozone concentrations that were notably lower
than monitored levels. Table 1 compares measured and modeled ozone concentrations for two episodes
for which the modeling performance was deemed acceptable (ref. 2). The local air monitors with
exceedances of the ozone NAAQS are highlighted. The difference between measured and modeled
ozone is primarily attributable to the omission of emission sources from Juarez in the modeling.
A future case modeling EI was developed by projecting the 1990 base case emissions to the year 1996.
Demographic and econometric forecasting methods were employed to develop the future inventory,
which also included the 15% net-of-growth VOC reductions mandated by the FCAA Amendments of
1990. Table 2 summarizes the source category VOC emissions data for the 1990 modeling base year
and the projected 1996 attainment year. The projected inventory is based on the originally submitted
15% net-of-growth VOC reductions. The data in the table projects a VOC reduction between 1990 and
1996 of 38.70 tons per day. A portion of this reduction is attributable to the Federal Motor Vehicles
Control Program and RVP requirements that predate the FCAA Amendments of 1990. Biogenic VOC
emissions were not included in the modeling since such emissions in the ELP area have a negligible
contribution to ozone formation.
Similarly, Table 3 summarizes source category NO emissions data for the 1990 modeling base yearx
and the projected 1996 attainment year. This data projects a NO increase between 1990 and 1996 ofx
6.5 tons per day.
Table 4 lists the various VOC emission source categories and the corresponding portion of the
originally submitted 15% ROP net-of-growth reductions for the ELP nonattainment area. The data

96
shows that the I/M program, as originally conceived, contributed 6.32 tons per day of VOC reduction in
the 1996 inventory.
Table 5 compares the results of UAM modeling with the projected 1996 modeling emissions inventory
to the results from the 1990 base year modeling inventory. For each of the two episodes, the predicted
domain-wide maximum ozone concentrations using the projected 1996 inventory are not only well
below the ozone NAAQS of 120 parts per billion, but they are also below the domain-wide maximum
ozone concentration using the modeling base year inventory. Thus even though the projected 1996
modeling emissions inventory includes a NO increase of 6.5 tons per day, the 38.7 tons per dayx
decrease in VOC for 1996 resulted in a notable decrease in the predicted domain-wide maximum ozone
concentration. Most importantly, the 6.32 tons per day VOC decrease attributed to the original I/M
program is well within the 38.7 tons per day VOC decrease which resulted in modeled 1996 ozone
levels which were below the 1990 modeled concentrations. This means that, even if there were no
reductions attributable to an I/M program, the modeled ozone levels for 1996 would be below those
levels modeled for 1990.
Conclusion
The UAM modeling based on United States emissions alone indicated that ELP would meet the ozone
NAAQS with the 1990 emissions were it not for emissions emanating from Juarez, Mexico. In
addition, UAM modeling with the reduced level of VOC's projected in the 1996 emissions predicted
even lower ozone levels. Thus, even without the original I/M program's VOC reductions (i.e., 6.32 tons
per day), the projected 1996 VOC emissions inventory would have been less than the 1990 base year
inventory, and modeled concentrations for 1996 would have been lower than those for 1990. Thus,

97
remodeling with the UAM is not needed to demonstrate that, with an I/M program having lower
emissions reductions than the original program, ELP would be in compliance with the ozone NAAQS
in 1996.
Aside from the change in the I/M program, other changes to the 1990 base year EI occurred in the SIP
revision. These changes will result in a reduction to the 1990 VOCs, which will then result in a
reduction to the 1996 projected emissions. Since these changes reduce VOCs, remodeling with the
UAM is not needed to demonstrate that ELP would be in compliance with the ozone NAAQS in 1996.

98
TABLE 1. Selected Ozone Episodes in theELP Ozone Nonattainment Area
Exceedanc Ozonee Date Site Ozone (ppb) Time (ppb) Time NO VOC
Maximum Ozone Concentration (ppb) Maximum ModeledPrecursor
Concentration (ppb)Measured Modeled
x
2/10/87 C12 *170 1400 34 1500 — —
6/24/87 C06 190 1100 62 1500C12 200 1100 63 1500C30 170 1000 74 1500 143 1181
7/02/87 C30 130 1100 85 1400 199 16447/03/87 C30 180 900 60 1200 282 1548
10/12/89 C06 60 1000 48 1400C12 70 1400 48 1400C30 130 1100 57 1300 — —
10/14/89 C06 260 1100 3 1200C12 200 1100 3 1200C30 120 1000 3 1300 — —
*Figures in bold indicate measured ozone values in excess of the NAAQS of 120 ppb.

99
TABLE 2. UAM VOC Emissions Inventory Development for 1996 ELP Attainment Demonstration
Emission Source Category (Tons/Day)
Point Area Mobile MobileOff-Road On-Road
Base 1990 Inventory 9.02 27.60 11.90 67.33RACT Fixups -0.00 -1.52 -0.00 —
Adjusted 1990 Inventory 9.02 26.07 11.90 —Projected Growth +0.24 +2.03 +1.36 —
Projected 1996 Inventory 9.26 28.10 13.26 —ROP Reductions -3.73 -6.86 -0.94 —
1996 Modeled Projected 5.53 21.25 12.33 38.04 Emissions

100
TABLE 3. UAM NO Emissions Inventory Development for 1996 x
ELP Attainment Demonstration
Emission Source Category (Tons/Day)
Point Area Mobile MobileOff-Road On-Road
Base 1990 Inventory 37.40 2.4 15.00 38.90RACT Fixups - - - —
Adjusted 1990 Inventory 37.40 2.4 15.00 38.9Projected Growth +3.6 +0.3 +1.9 +0.7
Projected 1996 Inventory 41.0 2.7 16.9 39.6ROP Reductions - - - —
1996 Modeled Projected 41.0 2.7 16.9 39.6Emissions

101
TABLE 4. Rate-of-Progress VOC Emission Reductions for ELP
Source Category (Tons/Day) (Tons/Day)
1996 Projected ModeledEmissions Reduction
Mandated Rules
Catchups 2.00 0.71
Vehicle Refueling (Stage II) 2.30 2.03
Aircraft Stage 3 0.29 0.02
FMVCP Tier I 31.18 0.25
Enhanced I/M 31.18 6.32
SUBTOTAL N/A 9.33
Phase I Rules
Auto Refinishing 2.84 1.13
Offset Printing 0.85 0.56
Vessel Loading 0.40 0.32
Fugitives 1.79 1.13
Rule Effectiveness Improvements 12.07 0.61
Gasoline Utility Engines 7.57 0.84
Transportation Control Measures 31.18 0.30
SUBTOTAL N/A 4.89
Phase II Rules
Architectural Coatings 5.25 1.42
Consumer/Commercial Products 5.69 0.61
Municipal Landfills 0.38 0.21
Industrial Wastewater 0.37 0.27
Bulk Gasoline Terminals 0.86 0.82
Outdoor Burning 0.81 0.40
Other Coatings 1.48 0.30
Wood Furniture Coating 0.29 0.04
Reform Gasoline (on-road) 31.18 2.61
Reform Gasoline (off-road) 12.58 0.40
SUBTOTAL N/A 7.08
TOTAL N/A 21.30

102
TABLE 5. Attainment Demonstration for ELP
Episod Base Year Attainment Yeare Date (1987) (1996) NO VOC
Maximum Predicted Ozone PrecursorConcentration, ppb Concentration, ppb
Maximum Predicted
x
6/24/87 114 87 165 524
7/02/87 98 80 179 681
7/03/87 78 68 457 666

103
REFERENCES
U. S. EPA. 1991. Guideline for Regulatory Application of the Urban Airshed Model. U.S. EPA (EPA-450/4-91-013)
TNRCC. 1994. ELP Ozone Nonattainment Area Section 818 Demonstration Report. TNRCC, Office ofAir Quality, Air Quality Planning Division.

104
b. Dallas/Fort Worth Attainment Demonstration (No change.)
10. SIP REVISIONS FOR THE REDESIGNATION AND MAINTENANCE PLANS (No
change.)
11. SIP REVISIONS FOR POST-96 RATE-OF-PROGRESS (Revised.)
a. Ozone Control Plan
1) General (No change.)
a) Requirement For Reductions (No change.)
2) Ozone Nonattainment Area Designations in Texas (No change.)
3) Local Consultation (No change.)
4) Identification of Emission Changes
a) Urban Airshed Modeling (UAM)
ROP SIP modeling is being developed for the HGA and BPA nonattainment areas in two phases using
the UAM. The first phase of ROP modeling was based on historical ozone episodes. This modeling
was submitted to EPA on January 11, 1995. The second phase of the ROP modeling is being conducted

105
using data obtained primarily from the COAST project, an intensive 1993 field study. The COAST
modeling for HGA and associated SIP are projected to be completed by December, 1996 for submittal
in May of 1997. Control strategies developed in this second phase will be based on a more robust data
base, providing a higher degree of confidence that the strategies will result in attainment of the ozone
NAAQS or target ozone value. A discussion of the schedule for the UAM modeling for the Phase II
Attainment Demonstration can be found in Appendix 11-F.
b) Emissions Inventory
(1) - (6) (No change.)
(7) Inventory Summaries
The progression from the 1990 ROP Base Year Inventory to the emission reductions needed to meet the
1999 target level for each of the nonattainment areas is shown in Table 11.

TABLE 11 Final 1999 ROP Required VOC Emissions Reductions Calculations Houston/Galveston Ozone Nonattainment Area Ozone Season VOC Tons Per Day
July 12, 1996
Total Mobile StationaryEmissions BasisStepNon-roadOn-roadAreaPoint
1063.52129.98251.52200.07481.951990 ROP Nonattainment Area Base Year EI1975.39129.98163.39200.07481.951990 Adjusted Base Year EI relative to 19962963.65129.98153.01198.71481.951990 Adjusted Base Year EI relative to 1999386.739% of Adjusted Base Year EI relative to 1999 (0.09*step 3)411.7410.381.36RVP and Fleet turnover correction:steps(2-3)5804.831996 Target Level Emissions6706.361999 Target Level Emissions [steps(6-5-4)]71029.18142.87172.68196.68516.951999 Emissions Forecast (Growth and Pre-90 Controls)8322.82Total Reductions Required by 1999 with Growth (steps 8-7)9242.30Creditable Reductions to Date1080.52Shortfall11
Base year on-road mobile emissions calculated with MOBILE5 for an ozone season weekday Adjusted base year on road mobile emissions and 1996 forecast on-road mobile emissions calculated with MOBILE5A for an ozone season weekday All on-road MOBILE5A forecasts are interpolated to November 15, 1996

107
(8) Changes to the Emissions Inventory as a result of the COAST Study
(a) Changes in Area Source and Non-road Mobile Source
Categories
The COAST field study was an intensive, multi-phased, and multifaceted study of the HGA and BPA
ozone nonattainment areas, and adjacent offshore waters. The project was undertaken in conjunction
with the Minerals Management Service and represents an effort to obtain the regional information
necessary to develop cost-efficient, effective ozone control strategies. While the major thrust of the
study has focused on regional monitoring and modeling of the 1993 ozone season, the COAST project
had many other components. One such project was the Bottom-up Emissions Inventory Project.
A traditional emissions inventory of area sources utilizes so-called top-down methodologies in order to
estimate the county-wide emissions required for SIP inventory reporting. This approach involves using
such statistics (national or state level) as are available on the level of activity (e.g., gallons of gasoline
sold, widgets produced, and so on) of the particular area source category being investigated. The
activity level is then adjusted, or allocated, to the county level based on some known surrogate such as
population or SIC Code employment (e.g., the population of X County is 15% of the state population so
15% of the state level activity is taking place at the county level). The available alternative, a bottom-
up inventory, is not usually performed because it is costly. The COAST project provided an
opportunity to conduct a bottom-up inventory.
A bottom-up inventory entails collecting as much local, category specific activity level information as
is possible. In the specific case of the Bottom-up Emissions Inventory Project, the approach was to

108
have a contractor take a random, stratified sample, or survey, to determine the activity levels of the
following area source and non-road mobile source categories: Dry Cleaners, Gasoline Stations, Lawn
Mower usage, Recreational Marine usage, Generators <50 HP usage, Surface Coatings, and Surface
Cleaning. The contractor then used this activity level information with emission factors to estimate
emissions.
The work done for the Bottom-up Emissions Inventory also included follow-up work involving a host
of organizations and people including the commission, the City of Houston Bureau of Air Quality, the
Non-road Mobile Source Working Group of the Houston-Galveston Area Council, and the sponsorship
of the Houston Regional Monitoring Network organization in hiring Radian Corporation to review
specific categories of the 1990 Base Year EI. The combined efforts of these organizations to conduct
telephone surveys, telephone interviews, purchase proprietary information, contract for services,
provide comments and input, and review existing inventory work resulted in the changes that have
occurred in the emissions inventories for the 1990 base year inventory.
The categories in which changes have occurred may be seen in Table 12 below. An explanation of the
changes which occurred can be found in the revision to the 1990 Adjusted Base Year EI which is being
proposed as part of this SuperSIP package.

109
TABLE 12
Categories with Changes in 1990 Base Year Inventory Emissions Estimates
Category Ozone Nonattainment Areas
HGA BPA DFW ELP
Other Product Coatings Y Y Y Y
High Performance Maintenance Y Y Y Y
Marine Vessel Loading Losses Y Y N N
Surface Cleaning Y Y Y Y
Architectural Coatings Y Y Y Y
Auto Refinishing Y Y Y Y
Sheet, Strip and Coil Y Y Y Y
Vessels with Outboards Y Y N N
Commercial Vessels Y N N N
Generators <50 HP Y Y N N
Residential Lawnmowers Y Y N N
Military Aircraft YN N N

110
c) Factors Affecting Magnitude of VOC Emissions
(1) Changes in Stationary and Area Source Emissions Regulations
(a) Additional Control Techniques Guidelines (CTGs), Federal
Rules, and Other Federal and State Programs
Section 182(b)(2) of the FCAA Amendments of 1990 requires implementation of RACT for ozone
nonattainment areas classified as moderate and above for: (A) each category of VOC sources covered
by a CTG document issued between November 15, 1990 and the date of attainment; (B) all VOC
sources covered by any CTG document issued prior to November 15, 1990; and (C) all other major
stationary sources of VOC. A detailed discussion of the state’s demonstration that existing state or
proposed federal rules/programs represent a reasonable level of control and thus fulfill RACT
requirements is found in Appendix 11-I.
(i) Federal Rules and Other Federal and State Programs
According to §108(b)(1) of the FCAA Amendments of 1990, the EPA Administrator shall issue to the
states and appropriate air pollution control agencies information on air pollution control. Sections
182(b)(1)(C) and (D) of the FCAA Amendments of 1990 specify in general terms which emissions
reductions are creditable toward the ROP reduction requirements and which are not. Section
182(b)(1)(D) does not specifically limit the creditability of emissions reductions associated with the
programs discussed in this section toward the ROP requirements; therefore, emissions reductions
associated with the programs listed below are generally creditable. However, some additional

111
limitations do exist to the extent that emissions reductions associated with the programs listed below
must be quantifiable, real, enforceable, replicable, accountable, and occur between November 15, 1990
and November 15, 1999. The federal programs listed below are generally creditable, provided they
meet these limitations. Additionally, some state programs may be creditable provided they meet these
limitations.
--Control Technique Guidelines
--Benzene National Emissions Standards for Hazardous Air Pollutants
--Treatment, Storage, and Disposal Facilities
--Hazardous Air Pollutant Standards
--New Source Performance Standards
--Controls required for mobile sources
In general, in order to take ROP SIP emission reduction credit, emission limits must be established by
rule before the SIP submittal deadline. The EPA has allowed states to claim ROP credit on a limited
basis without preemptive rulemaking. The commission is pursuing this approach for the MACT
standards and for the national engine rules. The FCAA Amendments of 1990 preclude states from
separate rulemaking for the engine categories. The following are federal programs for which the state
has taken credit in either the 15% or the current SIP.
--Clean Fuel Vehicle Program (Substitute for Federal Clean Fuel Fleet)
--Aircraft Engines (Federal Aviation Administration Rule)
--Architectural Coatings
--Hazardous Organic National Emission Standards for Hazardous Air Pollutants

112
--Landfills subject to New Source Performance Standards
--Pulp and Paper Manufacture (MACT)
--Recreational Marine Vessels
--Waste Treatment, Storage, and Disposal Facilities (MACT)
The FCAA Amendments of 1990 significantly changed the permitting process for new sources or
modifications of existing sources. The most important changes are with respect to the application of
rules requiring emissions offsets in nonattainment areas. The definition of "major source" also changed
for certain nonattainment areas. In Texas, the major source definition is 25 TPY in the HGA area. An
additional impact of lowering the definition of major source in the nonattainment areas is the lower
trigger for implementing the Lowest Achievable Emissions Rate for new major sources or major
modifications in accordance with the state construction permit rules in §116.150. Any reductions
which do occur as a result of the FCAA Amendments’ of 1990 major source definition and offset
requirements will be creditable towards the Post-96 reduction.
The offset requirement is managed by an "emissions banking" regulation. This allows industries to
bank emissions they have made voluntarily (beyond those required by other rules or their agency
permit) if those reductions can be verified. New or expanding industries which would not otherwise
have been permitted to operate can take advantage of these banked emissions. Nonattainment areas
can, therefore, still attract new or expanding industry while obtaining subsequent emissions decreases
through the required offsets.
Under the banking system, industries which are capable of demonstrating a verifiable voluntary
reduction in emissions may sell these banked emissions to new or expanding industries. The

113
purchasing industry must prove a greater than one-to-one offset ratio. These offset ratios vary between
nonattainment areas. For HGA, the offset ratio is 1.3 to 1, yielding a 30% net reduction.
Nonattainment areas may also take credit for permanent shutdowns of stationary sources within their
airshed. The credits may not be double-counted as part of NSR, banking, or any other offset program.
The shutdowns must occur between 1990 and 1999. Within this framework, an area may take credit for
the entire emissions from the closed facility or operations.
Certain rules or programs included as part of the 15% ROP SIP continue to gain creditable emission
reductions either through equipment turnover or phasing in of more stringent requirements between
1997 and 1999. These reductions are being quantified, and include categories such as the following:
--Small Utility Engines
--Automobile Inspection/Maintenance
--Federal Motor Vehicle Control Program
--Federal Reid Vapor Pressure Control
--Underground Storage Tank Remediation
--Stage II Gasoline Vapor Recovery
(b) Extended Compliance Schedule (No change.)
(c) Alternate Methods of Control (AMOC) (No change.)
(d) Proposed New VOC Control Measures

114
(i) New or Modified Point Source Controls
The following rules were developed and submitted to EPA on January 11, 1995 to meet the 9% ROP
requirements for the HGA nonattainment area.
Storage of Volatile Organic Compounds (§§115.112-115.119)
The revisions add recordkeeping requirements for external floating roof storage tanks for all four ozone
nonattainment areas. The purpose of the recordkeeping changes is to improve recordkeeping
requirements for secondary seal gap exceedances and the associated emissions in order to improve rule
effectiveness, resulting in additional emission reduction credits.
(ii) New or Modified Area Source Controls
No area source controls were modified or proposed to meet the requirements of this SIP.
(2) Changes in Mobile Source Emissions
(a) Federal Motor Vehicle Control Program (No change.)
(b) Federal Gasoline Volatility (Reid Vapor Pressure) Control
Program (No change.)

115
(c) Transportation Planning
Much of the responsibility for the planning and implementation of TCMs has been delegated to the
nonattainment areas' local governments and MPOs. TCMs are designed to reduce the number of
vehicle miles traveled, reduce or eliminate vehicle trips, or improve the flow of traffic. There are a
variety of TCMs being considered, and each nonattainment area will choose from among them. 30
TAC §114.23, concerning Transportation Control Measures, has been adopted to provide enforceability
to the TCM strategy selected for each area. This rule contains TCM-specific definitions; designations
of affected MPOs responsible for TCM development, funding, and implementation; requirements that
MPOs submit specific information provided by agencies or entities responsible for TCM implemen-
tation and a quantification of the emission reduction benefits; requirements that MPOs maintain and
provide specific information regarding TCM implementation status; requirements that the MPOs
modify the transportation improvement program and the metropolitan transportation plan for the area,
as necessary, to correct implementation deficiencies; and prescribed enforcement actions to be taken if
deficiencies remain unresolved or if knowing violations of TCM commitments occur. A TCM table for
the HGA ozone nonattainment area is located in Appendix 11-G. The TCMs listed below are examples
of those which may be adopted. Those not needed and/or adopted will be deleted, and others may be
added as they become available or identified. TCMs under consideration include the following:
--HOV Lanes. Restrict certain roads or lanes for passenger buses or high-occupancy vehicles, and
programs for the provision of all forms of high-occupancy, shared-ride services;
--Trip-reduction initiatives;
--Traffic flow improvement programs that reduce emissions;

116
--Signal timing improvements and computer controlled signal coordination/progression permit vehicles
traveling in the direction of the major traffic flow to receive a green light whenever possible, thereby
reducing idling time. Intersections can also be modified to improve traffic flow and reduce emissions;
--Programs to limit or restrict vehicle use in the downtown area or other areas of high emission
concentration, particularly during periods of peak use;
--Programs to limit portions of road surfaces or certain sections of the metropolitan area to bicycle or
pedestrian use, and to construct new roads or paths for this purpose. Also programs for secure bicycle
storage facilities and other facilities; including bicycle lanes, for the protection and convenience of
bicyclists, in both public and private areas;
--Programs to reduce emissions due to extended idling of vehicles and extreme cold start conditions;
--Programs and ordinances to facilitate non-automobile travel, to facilitate provision and utilization of
mass transit, and to generally reduce the need for single-occupant vehicle travel, as part of trans-
portation planning and development efforts of a locality, including programs and ordinances applicable
to new shopping centers, special events centers, and other centers of vehicle activity;
--Programs for improved public transit routes, service, frequency, and route modifications. Other pro-
grams include reduced transit fare and municipal car pool/van pool programs;
--Programs to encourage the voluntary removal from use and the marketplace of pre-1980 model year
light-duty vehicles and trucks;
--Programs and ordinances for parking incentives and disincentives to promote use of multi-occupancy
vehicles or mass transit;
--Programs and ordinances to promote the use of alternatively fueled vehicles.

117
(d) Vehicle I/M Program
The FCAA Amendments of 1990 mandate vehicle emissions inspection and maintenance programs in
areas that do not meet the NAAQS for ozone. Congress also set minimum performance standards for
these programs such as centralized testing and registration enforcement.
EPA has promulgated federal rules that include specific performance standards for I/M programs.
These rules, based on the direction provided in the FCAA Amendments, state what is expected by EPA.
"Basic" programs are required for nonattainment areas with moderate ozone classifications.
"Enhanced" programs are required for those areas with a 1980 population of 200,000 or more, which
are classified as having serious, severe, or extreme ozone pollution levels. The HGA and ELP
nonattainment areas fall into this category and are required to have enhanced I/M programs. The BPA
nonattainment area is a moderate nonattainment area, and its 1980 population of less than 200,000 in an
urbanized area means it is not required to implement an I/M program. The DFW area is a moderate
ozone nonattainment area and requires at least a basic program.
EPA issued a rule on November 5, 1992 that outlined very specific requirements for vehicle emissions
testing. A vehicle emissions testing program was designed and implemented on January 1, 1995 that
met all EPA requirements. The Texas Legislature passed Senate Bill 178 in response to the concerns of
numerous citizens which suspended the centralized program, reinstated the previous vehicle emissions
testing program in Dallas, Tarrant, and El Paso counties, and authorized Governor Bush to negotiate a
new vehicle emissions testing program. On September 19, 1995, EPA issued a rule allowing states to
implement less stringent vehicle emissions testing programs. This rule also raised the population
requirements for I/M programs, thus allowing the BPA area to develop a pollution control strategy that

118
does not include I/M. On November 10, 1995, Governor Bush announced the Texas Motorist’s Choice
Vehicle Emissions Testing Program.
The emissions testing program will include the following:
o Scheduled testing will be required in Dallas, Tarrant, El Paso and Harris counties.
o Annual testing will be conducted in conjunction with the safety inspection.
o Motorists will choose a facility to perform tests, such as:
o Annual, two-speed idle tests at test-and-repair facilities,
o Annual, two-speed idle tests at test-only facilities,
o Biennial, loaded or transient tests at test-only or test-and-repair facilities.
o Two-speed idle test fees are set at test-and-repair sites, test fees for an annual two-speed idle
program are $13.00 and test fees for a biennial test are $26.00. Test fees for loaded mode
equipment have not been set.
o Vehicles registered in Denton, Collin, Brazoria, Galveston, Chambers, Liberty, Waller,
Montgomery, and Fort Bend counties will be subject to a vehicle emissions test if detected as a
“grossly polluting vehicle” as a result of remote sensing.
o Vehicles 2 to 24 years old will be tested annually. Vehicles 0 to 2 years old will be subject to
remote sensing inspection scans. Vehicles failing a remote sensing screening will be required to
have an emissions test.
o Vehicles six to 24 years old registered in Dallas, Tarrant, El Paso, or Harris counties must be
tested at a test-only facility prior to transferring title after resale if legislative authority is granted.
o Waivers must be performed by a recognized repair technician in order to qualify for a waiver.

119
o Low Income Time Extensions will be available.
o All inspection facilities will participate in a central database via a dial-up modem.
The emission control device inspection in all nonattainment areas will consist of two components: a
visual test to verify presence (if applicable) of the catalytic convertor, exhaust gas recirculation system,
positive crankcase ventilation system, evaporative system, thermostatic air cleaner and air injection
system and an automated inspection procedure for testing tail pipe emissions and the integrity of the
gas cap.
Inspection of the emissions control devices is performed through direct observation or through indirect
observation using a mirror, video camera, or other visual aid. Also referred to as an "anti-tampering
inspection," it shall include a determination as to whether each device is present and properly connected
and whether it is the correct type for the certified vehicle configuration. Aftermarket parts, as well as
the original equipment manufactured parts, may be considered correct if they are of the proper design
and fit for the certified vehicle configuration.
EPA proposes to approve I/M SIP submissions which are consistent with the following standards and
approved methods of testing for vehicle emissions.
(i) Emission Standards
Emission standards are limits for HC and CO emissions. In transient testing, units of measure are
expressed as g.p.m., while in idle and steady state testing, units of measure are expressed in ppm or as a

120
percentage. These standards will apply to all vehicles subject to the program. Failure of any standard
will necessitate appropriate repairs.
(ii) Evaporative System Integrity Test Procedure
This test procedure consists of a series of steps to measure an unacceptable drop in pressure, which
indicates deterioration of the gas cap. This portion of the test may be failed if the gas cap is missing or
is damaged or is no longer working properly.
(iii) Loaded-Mode, Two-Speed Test
This test is conducted using a BAR90 type analyzer and a dynamometer. The dynamometer can range
from a simple chassis dynamometer to a more sophisticated variable inertial weight dynamometer. Tail
pipe emissions are sampled from the vehicle at a simulated speed of approximately 30 miles per hour
and at idle. Some motorists may choose this test-only option and will receive an emissions test that is
valid for two years.
(iv) Preconditioned Two-Speed Idle Test
This test is conducted using a BAR90-type analyzer without a dynamometer. The test sequence
consists of a high-speed mode at approximately 2,500 revolutions per minute followed immediately by
an idle mode. Additional preconditioning followed by an identical second-chance test is performed
only if the vehicle fails the first test cycle. Dedicated four-wheel drive and heavy-duty vehicles must

121
be tested using this test type. Motorists may elect this type of test and will receive an emissions test
that is valid for one year.
(v) Transient Emission Test
This test results in a mass emission measurement using a constant volume sampling system while the
vehicle is driving through a computer monitored driving cycle on a dynamometer with inertial weight
settings appropriate for the weight of the vehicle. The driving cycle includes acceleration, deceleration,
and idle operating modes in a test sequence that must be approved by the EPA.
These test features exceed EPA’s low enhanced performance standards.
On November 28, 1995, President Clinton signed the National Highway System Designation Act of
1995. Section 348 of the legislation allows States to submit to EPA by March 27, 1996, I/M Program
SIPs that reflect good faith estimates for implementing a test-and-repair program without EPA’s default
of 50%. Texas will meet this requirement, thus gaining additional credit for the vehicle emissions
testing program.
(e) Accelerated Vehicle Retirement Rule
The agency has developed a vehicle scrappage program, titled "Accelerated Vehicle Retirement
Program". It will be included in §114.29 in Regulation IV. This program will not generate any SIP
reduction credits as currently designed, but may produce some milestone credits if the scrappage credits
are donated to the state or generated through state funding.

122
The purpose of this program is to reduce mobile source emissions and provide additional flexibility for
stationary sources in the nonattainment areas: HGA, DFW, ELP, and BPA. A scrappage program
reduces VOC, NO , and CO emissions from mobile sources, such as automobiles and light duty trucks,x
by permanently removing high-emitting vehicles from the area-wide fleet. With this rule, stationary
sources will have the opportunity to select the most cost effective approach to complying with federal
and state regulations for ozone reduction.
d) Emissions Tracking (No change.)
e) Contingency Plan Requirements (No change.)
f) Control Measure Catalog (No change.)
g) Committment to Consultative Process (No change.)
b. Beaumont/Port Arthur Ozone Control Strategy
1) General
In December of 1990, then-Texas Governor William Clements requested that the BPA area be
reclassified as a "moderate" ozone nonattainment area in accordance with Section 181(a)(4) of the
FCAA Amendments of 1990. That request was denied on February 13, 1991. A recent review of the
original request and supporting documentation has revealed that this denial was made in error. As

123
provided by Section 110(k)(6) of the Act, the EPA Administrator of the has the authority to reverse a
decision regarding original designation if it is discovered that an error had been made.
Monitoring data from a privately-funded, special purpose monitoring network which was not included
in the Aerometric Information Retrieval System database was improperly used to deny this request.
Furthermore, subsequent air quality trends demonstrate that BPA is more properly classified as a
moderate nonattainment area, and should attain the standard by the required date for moderate areas of
November 15, 1996. Therefore, Governor Bush sent a letter and technical support to EPA on July 20,
1995, requesting that the BPA area be reclassified to moderate nonattainment status. BPA plans to
demonstrate attainment one of the following ways:
Monitored values showing attainment of the standard at state-operated monitors for the years 1994-
1996, which is the timeline the FCAA Amendments of 1990 specifies for moderate areas.
UAM modeling showing attainment of the standard but for transport of ozone and/or precursors.
EPA Region VI verified the data submitted in support of this request, and concurred that it is valid. On
June 3, 1996, the reclassification of the BPA area became effective. Because the area was classified as
serious, it was following the SIP submittal and permitting requirements of a serious area, which
included the requirements for a Post-96 SIP. With this consolidated SIP submittal, the commission has
removed the BPA area from the Post-96 SIPs, which became applicable to HGA only.
c. Houston/Galveston Ozone Control Strategy

124
1) General
The FCAA Amendments of 1990 classified the HGA area as a Severe II nonattainment area. The
HGA nonattainment area includes the counties of Brazoria, Fort Bend, Galveston, Harris, Liberty,
Montgomery, Waller, and Chambers. The HGA nonattainment area has an ozone design value of 0.22
ppm, which places the area in the Severe II classification.
2) Estimated Emission Reductions
a) 9% Targeted Reductions
Table 13 summarizes the breakdown of emissions in the HGA area by emission categories. Table 14
summarizes the estimated emission reductions for the 9% reduction requirement, and associated 3%
contingency measures. More information on these reductions can be found in Appendix 11-C.
TABLE 13
Anthropogenic VOC Emissions in the
Houston/Galveston Area
CATEGORY AMOUNT IN TPD PERCENTAGE
Point 481.95 49
Area 200.07 21
Non-Road Mobile 129.98 14
On-Road Mobile 153.01 16

Table 14 - Revised 7/12/96
ESTIMATES TOWARDS 9% ROP SIP - HOUSTON/GALVESTON
Percent 1999 GrowthPercent 1990EMISSIONS INVENTORY19.1%196.68-1.7%20.7%200.07Area Sources50.2%516.957.3%49.9%481.95Point Sources16.8%172.6812.9%15.9%153.01On-road Mobile Sources13.9%142.879.9%13.5%129.98Off-road Mobile Sources
1029.186.6%965.01TOTALS
ESTIMATED REDUCTIONS
Cumulative %% of requirementReduction99 Projected TPDMANDATED RULES
0.58%0.58%0.470.53HON39.08%38.50%31.00Enhanced Monitoring40.29%1.20%0.972.43Aircraft Engines50.55%10.26%8.269.18Pulp & Paper MACT50.65%0.10%0.08172.68Tx Alternative Fuel Fleet50.73%0.08%0.0627.30Recreational Marine
50.73%40.85Subtot Existing Rules
58.56%7.84%6.3165.67Utility engine 1997-199961.11%2.55%2.052.05UST Remediation61.73%0.62%0.50172.68TCMs66.54%5.43%4.37172.68** Tier I, I/M, RFG71.58%5.05%4.067.40MSW Landfills NSPS & EG74.63%3.04%2.45N/ARFG - Tanks79.30%4.67%3.76N/ARFG - Loading Racks112.66%33.36%26.8670.96*** RE Floating Tanks
62.55%50.37Subtot
Contingency Rules
113.04%0.38%0.3176.18Rec. Marine Vess. (2000)132.29%19.25%15.50Enhanced Monitoring (2000)113.25%0.22%0.17172.68Tx Alternative Fuel Fleet116.16%2.91%2.345.32Offset Printing118.60%2.44%1.973.88Naptha Dry Cleaners120.48%1.88%1.5165.67Utility Engine 1999-2000
27.07%21.80Subtot
8.3%100.00%80.52Target Improvement113.28%91.2115% Rules + Mandated Rules13.28%10.69Excess (Shortfall)
3.0%28.95Required Contingency11.3%100.0%109.47Target + Contingency
103.2%113.01Total Reductions3.2%3.54Excess (Shortfall)
** Total credits from reform gas, FMVCP Tier I, and a preliminary I/M reduction based on an EPA approved factor based analysis*** RE credits claimed from this category under "RE Improvements" are subtracted out to avoid double counting.

126
b) Stationary and Area Source Controls (No Change.)
c) Mobile Source Controls
(1) Transportation Control Measures
A TCM program is mandated for the HGA nonattainment area. Several additional TCMs are being
considered for implementation in the area, including: land use densification, mixed land use
development, pedestrian improvements, traffic signal timing improvements, college traffic
management, K-12 school traffic management, employee transit pass subsidy, non-metro service area
transit, fixed commuter rail, bicycle improvements, trip reduction initiatives, ridesharing, parking
management, telecommuting, flexible work hours, compressed work week, gasoline tax/cost increase,
emission pricing, roadway pricing, motorist information system, incident management and response,
special events management, and control of truck movements. TCMs scheduled to be implemented in
the SIP revision include: HOV lanes, arterial traffic flow improvements, park-and-ride lots, transit
service improvements, area-wide rideshare initiatives, and intelligent transportation systems (formerly
known as intelligent vehicle highway systems). The Houston-Galveston Area Council has specifically
committed to the Post-1996 TCM commitments identified in Appendix 11-G. These are in addition to
the TCM commitments identified for the 15% ROP SIP.

127
(2) Vehicle Inspection/Maintenance Program
The Texas Motorist’s Choice Vehicle Emission Testing Program in the HGA nonattainment area will
subject gasoline powered light-duty cars and trucks and heavy-duty trucks registered in Harris County
to emission testing. Exhaust gas testing for HC, CO, and CO is required. A hybrid program will allow2
the motorist to choose an annual two-speed idle test at test-and-repair or test-only facilities or a biennial
loaded or transient test at a test-only facility. Vehicles registered in Brazoria, Galveston, Montgomery,
Chambers, Liberty, Waller, and Fort Bend Counties will be subject to a vehicle emissions test if
detected as a “grossly polluting vehicle” as a result of remote sensing.
Of the registered vehicles in Harris County, vehicles 0 to 24 years old will be tested. Vehicles 6 to 24
years old will be required to be tested prior to transferring title after resale, pending legislative
authority. In addition to the emissions test, there will be an emission control device inspection which
will consist of a visual test to verify presence (if applicable) of the catalytic convertor, exhaust gas
recirculation system, positive crankcase ventilation system, evaporative system, thermostatic air cleaner
and air injection system and an automated inspection procedure for testing the integrity of the gas cap.
Dedicated four-wheel drive vehicles, meaning any constant four-wheel drive vehicle which cannot be
converted to two-wheel drive except by removing one of the vehicle's drive shafts, shall be subject to a
preconditioned two-speed idle test.

128
(3) Reformulated Gasoline and Clean Fuel Vehicle Program
Beginning on January 1, 1995, only reformulated gasoline will be marketed in the HGA nonattainment
area. This type of fuel has significant air quality benefits for both on-road and non-road gasoline
engines.
The FCAA Amendments of 1990 mandated a clean fuel fleet program, commonly referred to as the
Federal Clean Fuel Fleet (FCFF) program. Contained within the FCFF program was the option for
states to opt-out of the federal program and implement a substitute program of their own. A committal
SIP adopted by the former Air Control Board in November 1992 officially opted Texas out of the FCFF
program. An initial substitute program was adopted by the commission in July of 1994.
The 1995 Legislature gave the commission further direction for crafting an opt-out program through
passage of Senate Bill 200. Senate Bill 200 defined alternative fuels to mean any specific vehicle/fuel
combination that is certified to, at a minimum, the federal LEV standards. Agency rules will cover
certain private and local goverment fleets in the serious and above ozone and CO nonattainment areas
of the state. These rules will constitute the state’s substitute program.
Agency staff are working with members of the regulated community, state and federal agencies, local
governments, fuel providers, vehicle manufacturers, major stakeholders, and bill sponsors to implement
a federal opt-out program. The program will have equivalent emission reductions to the FCFF
program.
3) Evidence of Attainment (No Change.)

129
4) Contingency Plan (No Change.)
12. SOCIAL AND ECONOMIC CONSIDERATIONS OF THE PLAN (No change.)
13. FISCAL AND MANPOWER RESOURCES (No change.)
14. HEARING REQUIREMENTS
a. - g. (No change.)
h. Public Hearings for the Consolidated SIP Package
Table 18 lists the public hearings that were conducted in each of the nonattainment areas regarding the
consolidated SIP package.

130
TABLE 18
Public Hearings for the Consolidated SIP Package
Nonattainment Date Time Location
Area
Beaumont/
Port Arthur
May 6, 1996 7:00pm John Gray
Institute
Houston/
Galveston
May 7, 1996 2:00pm and Houston/
7:00pm Galveston
Area Council
El Paso May 8, 1996 6:00pm City Council
Chambers
Dallas/
Ft Worth
May 9, 1996 1:00pm Irving Public
Library

SUMMARY OF THE REVISED 1990 BASE YEAR OZONE NONATTAINMENT AREA
STATE IMPLEMENTATION PLAN EMISSION INVENTORY FOR
ALL TEXAS NONATTAINMENT AREAS
July 1996
Texas Natural Resource Conservation Commission
P.O. Box 13087
Austin, Texas 78711-3087

i
TABLE OF CONTENTS
Introduction . . . . . . . . . . . . . . . . . . . . . . . . . . . . . . . . . . . . . . . . . . . . . . . . . . . . . . . . . . . . . . . . . . . . . 1
Background Information about the Original 1990 SIP Emissions Inventory . . . . . . . . . . . . . . . . . . . . . 1Point Sources . . . . . . . . . . . . . . . . . . . . . . . . . . . . . . . . . . . . . . . . . . . . . . . . . . . . . . . . . . . . . . . . 2Minor and Area Sources . . . . . . . . . . . . . . . . . . . . . . . . . . . . . . . . . . . . . . . . . . . . . . . . . . . . . . . 3On-Road Mobile Sources . . . . . . . . . . . . . . . . . . . . . . . . . . . . . . . . . . . . . . . . . . . . . . . . . . . . . . 4Non-Road Mobile Sources . . . . . . . . . . . . . . . . . . . . . . . . . . . . . . . . . . . . . . . . . . . . . . . . . . . . . 5Biogenic Sources . . . . . . . . . . . . . . . . . . . . . . . . . . . . . . . . . . . . . . . . . . . . . . . . . . . . . . . . . . . . . 6
1990 Base Year Emissions Inventory Changes . . . . . . . . . . . . . . . . . . . . . . . . . . . . . . . . . . . . . . . . . . . 7
Changes to the Emissions Inventory as a Result of the Coastal Oxidant Assessment for Southeast Texas (COAST) Study . . . . . . . . . . . . . . . . . . . . . . . . . . . . . . . . . . . . . . . . . . . . . . . . 7
Changes in Area and Non-road Mobile Source Categories . . . . . . . . . . . . . . . . . . . . . . . . . . . . . . . . . 13Other Product Coatings, High Performance Maintenance, and Other Special Purpose Coatings . . . . . . . . . . . . . . . . . . . . . . . . . . . . . . . . . . . . . . . . . . . . . . . . . . . . . . . . . . . . 13Marine Vessel Loading Losses . . . . . . . . . . . . . . . . . . . . . . . . . . . . . . . . . . . . . . . . . . . . . . . . . 14Surface Cleaning . . . . . . . . . . . . . . . . . . . . . . . . . . . . . . . . . . . . . . . . . . . . . . . . . . . . . . . . . . . . 14Architectural Coatings . . . . . . . . . . . . . . . . . . . . . . . . . . . . . . . . . . . . . . . . . . . . . . . . . . . . . . . . 15Automobile Refinishing . . . . . . . . . . . . . . . . . . . . . . . . . . . . . . . . . . . . . . . . . . . . . . . . . . . . . . 16Sheet, Strip, and Coil . . . . . . . . . . . . . . . . . . . . . . . . . . . . . . . . . . . . . . . . . . . . . . . . . . . . . . . . . 18Vessels with Outboards . . . . . . . . . . . . . . . . . . . . . . . . . . . . . . . . . . . . . . . . . . . . . . . . . . . . . . . 19Commercial Vessels . . . . . . . . . . . . . . . . . . . . . . . . . . . . . . . . . . . . . . . . . . . . . . . . . . . . . . . . . 20Generators < 50 HP . . . . . . . . . . . . . . . . . . . . . . . . . . . . . . . . . . . . . . . . . . . . . . . . . . . . . . . . . . 20Residential Lawnmowers . . . . . . . . . . . . . . . . . . . . . . . . . . . . . . . . . . . . . . . . . . . . . . . . . . . . . 21Military Aircraft . . . . . . . . . . . . . . . . . . . . . . . . . . . . . . . . . . . . . . . . . . . . . . . . . . . . . . . . . . . . 22
Changes to On-road Mobile Source Emissions Estimates . . . . . . . . . . . . . . . . . . . . . . . . . . . . . . . . . . 22General Discussion . . . . . . . . . . . . . . . . . . . . . . . . . . . . . . . . . . . . . . . . . . . . . . . . . . . . . . . . . . 23Texas Inspection and Maintenance Program Changes . . . . . . . . . . . . . . . . . . . . . . . . . . . . . . . . 23Transportation Network Updates . . . . . . . . . . . . . . . . . . . . . . . . . . . . . . . . . . . . . . . . . . . . . . . . 24BPA and ELP SIP Inventory Methodology Updates . . . . . . . . . . . . . . . . . . . . . . . . . . . . . . . . . 24Methodology for Interim Update . . . . . . . . . . . . . . . . . . . . . . . . . . . . . . . . . . . . . . . . . . . . . . . . 25Methodology for Final Update Submittal . . . . . . . . . . . . . . . . . . . . . . . . . . . . . . . . . . . . . . . . . 26

ii
TABLES
Table 1ACategories with Changes in 1990 Base Year Inventory Emissions Estimates . . . . . . . . . . . . . . 10
Table 1BChanges in 1990 State Implementation Plan Emissions Inventories . . . . . . . . . . . . . . . . . . . . . 11
Table 2ASummary of VOC Emissions in the Beaumont/Port Arthur Nonattainment Areaby Source Type . . . . . . . . . . . . . . . . . . . . . . . . . . . . . . . . . . . . . . . . . . . . . . . . . . . . . . . . . . . . . 28
Table 2BSummary of NO Emissions in the Beaumont/Port Arthur Worth Nonattainment x
Area by Source Type . . . . . . . . . . . . . . . . . . . . . . . . . . . . . . . . . . . . . . . . . . . . . . . . . . . . . . . . . 29
Table 2CSummary of CO Emissions in the Beaumont/Port Arthur Nonattainment Areaby Source Type . . . . . . . . . . . . . . . . . . . . . . . . . . . . . . . . . . . . . . . . . . . . . . . . . . . . . . . . . . . . . 30
Table 3 Summary of 1990 Emissions from Area Sources for Beaumont/Port Arthur (Revised) . . . . . . . 36
Table 4Summary of Emissions from Non-Road Mobile Sources for Beaumont/Port Arthur . . . . . . . . . 38
Table 5Summary of 1990 Emissions from Small Engine Sources for the Beaumont/Port Arthur Nonattainment Area . . . . . . . . . . . . . . . . . . . . . . . . . . . . . . . . . . . . . . . . . . . . . . . 40
Table 6ASummary of VOC Emissions in the Dallas/Fort Worth Nonattainment Areaby Source Type . . . . . . . . . . . . . . . . . . . . . . . . . . . . . . . . . . . . . . . . . . . . . . . . . . . . . . . . . . . . . 44
Table 6BSummary of NO Emissions in the Dallas/Fort Worth Nonattainment Areax
by Source Type . . . . . . . . . . . . . . . . . . . . . . . . . . . . . . . . . . . . . . . . . . . . . . . . . . . . . . . . . . . . . 45
Table 6CSummary of CO Emissions in the Dallas/Fort Worth Nonattainment Areaby Source Type . . . . . . . . . . . . . . . . . . . . . . . . . . . . . . . . . . . . . . . . . . . . . . . . . . . . . . . . . . . . . 46
Table 7Summary of 1990 Emissions from Area Sources for Dallas/Fort Worth (Revised) . . . . . . . . . . 52
Table 8Summary of Emissions from Non-Road Mobile Sources for Dallas/Ft. Worth . . . . . . . . . . . . . 55

iii
TABLES (cont.)
Table 9ASummary of VOC Emissions in the El Paso Nonattainment Area by Source Type . . . . . . . . . . 56
Table 9BSummary of NO Emissions in the El Paso Nonattainment Area by Source Type . . . . . . . . . . . 57x
Table 9CSummary of CO Emissions in the El Paso Nonattainment Area by Source Type . . . . . . . . . . . 58
Table 10 Summary of 1990 Emissions from Area Sources for El Paso County (Revised) . . . . . . . . . . . . 63
Table 11Summary of Emissions from Non-Road Mobile Sources for El Paso . . . . . . . . . . . . . . . . . . . . 66
Table 12Summary of 1990 Emissions from Small Engine Sources for the El Paso Nonattainment Area . . . . . . . . . . . . . . . . . . . . . . . . . . . . . . . . . . . . . . . . . . . . . . . . . . . . . . . . . 67
Table 13ASummary of VOC Emissions in the Houston/Galveston Nonattainment Area by Source Type . . . . . . . . . . . . . . . . . . . . . . . . . . . . . . . . . . . . . . . . . . . . . . . . . . . . . . . . . 71
Table 13BSummary of NO Emissions in the Houston/Galveston Nonattainment x
Area by Source Type . . . . . . . . . . . . . . . . . . . . . . . . . . . . . . . . . . . . . . . . . . . . . . . . . . . . . . . . . 72
Table 13CSummary of CO Emissions in the Houston/Galveston Nonattainment Area by Source Type . . . . . . . . . . . . . . . . . . . . . . . . . . . . . . . . . . . . . . . . . . . . . . . . . . . . . . . . . . . . . 73
Table 14Summary of 1990 Emissions from Area Sources for Houston/Galveston (Revised) . . . . . . . . . 79
Table 15Summary of Emissions from Non-Road Mobile Sources for Houston/Galveston . . . . . . . . . . . 82
Table 16Summary of 1990 Emissions from Small Engine Sources for the Houston/Galveston Area Nonattainment Area . . . . . . . . . . . . . . . . . . . . . . . . . . . . . . . . . . . . . . . . . . . . . . . . . . . . 83

iv
FIGURES
Figure 1Beaumont/Port Arthur Ozone Nonattainment Area 1990 Emissions by Major Category . . . . . . 31
Figure 2Emissions Inventory Changes, Beaumont/Port Arthur VOC Emissions from All Sources . . . . 32
Figure 3Emissions Inventory Changes, Beaumont/Port Arthur VOC Area Sources . . . . . . . . . . . . . . . . 33
Figure 4Emissions Inventory Changes, Beaumont/Port Arthur VOC Area Sources (cont.) . . . . . . . . . . 34
Figure 5 Emissions Inventory Changes, Beaumont/Port Arthur VOC Non-road Mobile Sources . . . . . . 35
Figure 6Dallas/Fort Worth Ozone Nonattainment Area 1990 Emissions by Major Category . . . . . . . . . 47
Figure 7Emissions Inventory Changes, Dallas/Ft. Worth VOC Emissions from All Sources . . . . . . . . . 48
Figure 8Emissions Inventory Changes, Dallas/Ft. Worth VOC Area Sources . . . . . . . . . . . . . . . . . . . . 49
Figure 9Emissions Inventory Changes, Dallas/Ft. Worth VOC Area Sources (cont.) . . . . . . . . . . . . . . . 50
Figure 10Emissions Inventory Changes, Dallas/Ft. Worth VOC Non-road Mobile Sources . . . . . . . . . . . 51
Figure 11El Paso Ozone Nonattainment Area 1990 Emissions by Major Category . . . . . . . . . . . . . . . . . 59
Figure 12Emissions Inventory Changes, El Paso VOC Emissions from All Sources . . . . . . . . . . . . . . . . 60
Figure 13Emissions Inventory Changes, El Paso VOC Area Sources . . . . . . . . . . . . . . . . . . . . . . . . . . . . 61
Figure 14Emissions Inventory Changes, El Paso VOC Non-road Mobiles Sources . . . . . . . . . . . . . . . . . 62
Figure 15Houston/Galveston Ozone Nonattainment Area 1990 Emissions by Major Category . . . . . . . . 74
v
FIGURES (cont.)
Figure 16Emissions Inventory Changes, Houston/Galveston VOC Emissions from All Sources . . . . . . . 75
Figure 17Emissions Inventory Changes, Houston/Galveston VOC Area Sources . . . . . . . . . . . . . . . . . . . 76
Figure 18Emissions Inventory Changes, Houston/Galveston VOC Area Sources (cont.) . . . . . . . . . . . . . 77
Figure 19Emissions Inventory Changes, Houston/Galveston VOC Non-road Mobile Sources . . . . . . . . . 78

1
Introduction
The purpose of this summary document is twofold. First, it briefly describes the elements of the 1990
Base Year Ozone Nonattainment State Implementation Plan (SIP) Emissions Inventory (EI). Second, it
describes the changes in the inventory that have been made in response to improved information
gathered from a number of studies about the area source and non-road categories. Emissions from
point source facilities have been changed to reflect adjustments made as a result of additional efforts to
place emissions in the appropriate source category and United States Environmental Protection Agency
(EPA) action to delist acetone from the volatile organic compound (VOC) classification.
Background Information about the Original 1990 SIP Emissions Inventory
The Federal Clean Air Act (FCAA) Amendments of 1990 required that 1990 base year emissions
inventories (BYEI) be prepared for each ozone nonattainment area in the state. Because ozone is
photochemically produced in the atmosphere when VOCs are mixed with oxides of nitrogen (NO ) andx
carbon monoxide (CO) in the presence of sunlight, it is important that the agency compile information
on the important sources of these ozone precursor pollutants. It is the role of the EI to identify the
source types present in an area, the amount of each pollutant emitted and the types of processes and
control devices employed at each plant or source category. The 1990 BYEI provides data for a variety
of air quality planning tasks directed toward development of SIPs to meet FCAA Amendments
planning requirements for achieving and maintaining compliance with the ozone ambient air quality
standard. These tasks include establishing baseline emission levels for an area, calculating the 15%
emissions reduction target for the rate of progress (ROP) SIP, identification of sources for application
of control strategies to achieve the required emissions reductions, providing emissions data inputs into

2
air quality simulation models, and establishing the emissions budget for an area to use in tracking actual
emissions reductions against the projected emissions growth and controls. The total inventory of
emissions for an area is summarized from the estimates developed for five general categories of
emissions sources; stationary point, area, on-road mobile, non-road mobile, and biogenic sources.
The commission has developed extensive documentation, in accordance with EPA guidance, on the
methodology followed in the preparation of each nonattainment area's BYEI. This comprehensive
documentation was submitted to EPA in November 1992 as required by the FCAA Amendments, and
has recently been resubmitted to EPA for additional review after a number of changes were made to
address EPA comments. Procedures used to develop emissions data are in many cases estimates of
emissions with a degree of uncertainty inherent in the process.
Figure 1.0 shows the percentage of emissions by source category for the nonattainment area and Tables
2A, 2B, 2C, 6A, 6B, 6C, 9A, 9B, 9C, 13A, 13B, and 13C list VOC, NO , and CO emissions by sourcex
category for each ozone nonattainment area.
1) Point Sources
Stationary point sources are defined for inventory purposes in the nonattainment areas for the 1990
BYEI as industrial, commercial, or institutional plants/operations responsible for generating annual
VOC emissions of 10 tons per year (TPY) or greater and/or 100 TPY or greater of NO or COx
emissions (this was changed in 1993 to 10 TPY, 25 TPY, and 100 TPY, respectively). For counties
outside of the core nonattainment area, but included in the nonattainment modeling domain, point
sources emitting 100 TPY or greater VOC, NO , or CO are required to report EI data. To collectx

3
emissions and industrial process operating data for these plants, the agency sends out EI questionnaires
(EIQ) to all sources identified as having the potential to generate emissions triggering EI reporting
requirements. Companies are asked to report not only emissions data for all emissions generating units
and emission points, but also the type and amount of materials used in each process which may result in
emissions, such as painting and degreasing materials, storage tank materials, or fuels combusted.
Information is also requested in the EIQ on process equipment descriptions, emissions control devices
currently in use, and on emissions point parameters, such as stack location, height, and exhaust gas flow
rate. All data submitted via the EIQ is then subjected to rigorous quality assurance procedures by the
commission before entry into the agency's point source data base (PSDB). To accomplish tasks
requiring the use of EI data for SIP development, the data is extracted from PSDB in a tons per day
(TPD) report format and then adjusted for rule effectiveness (RE), where appropriate, based on
algorithms derived by commission staff for specific process/control equipment types. The RE
adjustment to actual reported VOC emissions was made following EPA guidance assuming less than
100% of rated control efficiency for controls installed pursuant to regulatory requirements. The
original point source estimates have been adjusted, where appropriate, to account for the delisting by
EPA of acetone and for the shift of marine vessel loading loss emissions from area sources.
2) Minor and Area Sources
To capture information about sources of emissions that fall below the point source reporting levels and
are too numerous or too small to identify individually, calculations have been performed to estimate
emissions from these sources on a source category or group basis. Minor and area sources are
commercial, small-scale industrial, and residential categories of sources which use materials or operate
processes which can generate emissions. Area sources can be divided into two groups characterized by

4
the emission mechanism: evaporative emissions or fuel combustion emissions. Examples of
evaporative losses include: printing, industrial coatings, degreasing solvents, house paints, leaking
underground storage tanks and gasoline service station underground tank filling, and vehicle refueling
operations.
Fuel combustion sources include stationary source fossil fuel combustion at residences and businesses,
as well as outdoor burning, structural and forest fires. These emissions, with some exceptions, may be
calculated by multiplication of an established emission factor (emissions per unit of activity) times the
appropriate activity or activity surrogate responsible for generating emissions. Amount of population is
the activity most commonly used for many area source categories while other activity data include
amount of gasoline sold in an area, employment by industry type, and harvested acres of cropland. For
the ozone SIP inventory, area source emissions are estimated and reported for an ozone season
weekday and adjusted, where appropriate, for the impact of RE. The area source emissions, by
category, may be seen in Tables 3, 7, 10 and 14.
3) On-Road Mobile Sources
On-road mobile sources consist of automobiles, trucks, motorcycles, and other internal combustion
engine powered vehicles traveling on roadways in the nonattainment area. Combustion-related
emissions are estimated for vehicle engine exhaust and evaporative emissions are estimated for the fuel
tank and other evaporative mechanisms on the vehicle. Emission factors have been developed using the
most current version of the EPA's mobile emissions factor model. Various inputs are provided to the
model to simulate the vehicle fleet driving in each particular nonattainment area. These inputs include
such parameters as vehicle speeds by roadway type, vehicle registration by vehicle type and age,

5
percentage of vehicles in cold start mode, percentage of miles traveled by vehicle type, type of
inspection/maintenance (I/M) program in place, and gasoline vapor pressure. All of these inputs have
an impact on the emission factor calculated by the MOBILE program, and every effort is made to input
parameters reflecting local conditions where possible. To complete the emissions estimate, the
emission factors calculated by the MOBILE model must then be multiplied by the level of vehicle
activity, vehicle miles traveled (VMT). The level of vehicle travel activity is developed from travel
demand models run by the Texas Department of Transportation or the local municipal planning
organizations. The travel demand models have been validated against actual ground counts of traffic
passing over counters placed in various locations throughout each county. Estimates of VMT have
been provided for the Beaumont and El Paso (ELP) areas based on outputs of the federal Highway
Performance Monitoring System (HPMS), which is a United States Department of Transportation
model using vehicle count data from a number of traffic counters located on specific roadway types in
each area. Mobile Source emissions may be found in the summary Tables 2A, 2B, 2C, 6A, 6B, 6C,
9A, 9B, 9C, 13A, 13B, and 13C.
4) Non-Road Mobile Sources
This source category includes military, commercial and general aircraft, marine vessels, recreational
boats, railroad locomotives, and a very broad category that includes everything from the engines on
construction equipment and tractors to lawn mowers and chainsaws. Calculation methods for emissions
from non-road engine sources vary considerably because of the differences in usage patterns, but, in
general, are based on manufacturer supplied information about engine horsepower, load factor,
emission factors, usage, and equipment sales and distribution.

6
Emissions estimates for all sources in the non-road category, except aircraft, locomotives, and
commercial vessels, were developed by a contractor to EPA's Office of Mobile Sources (OMS).
Engine population and type information was assembled by the contractor from national sales data and
patterns of equipment usage were derived by the contractor from several regional surveys. Aircraft
emissions were estimated with landings and takeoff data for airports in each area multiplied by
EPA-developed emission factors for aircraft operations. Tables 4, 8, 11 and 15 are summary tables of
all non-road categories for the entire nonattainment area. A more detailed listing, by category, of the
Other Non-Road Engines (Small Engine Sources) follows each overall non-road table [except in the
Dallas/Fort Worth (DFW) nonattainment area, which had no changes in the Other Non-road Engine
categories (e.g., vessels with outboards)].
5) Biogenic Sources
Biogenic sources are essentially all types of plant life in the biosphere; forests, crops, lawn grass, and
other vegetation. Plants are sources of VOCs such as isoprene, monoterpene, and alpha-pinene. Tools
for estimating emissions include satellite imaging for mapping of vegetative types and computer
modeling of emissions estimates based on emission factors by plant species. Emissions from biogenic
sources are subtracted from the inventory prior to determining any required reductions for the 15%
ROP SIP. However, the biogenic emissions are important in determining the overall emissions profile
of an area and are included in the modeling of strategies for reaching attainment of the ozone air quality
standard. There has been no change in the original biogenic emissions estimate from that made in the
original BYEI submission. Although biogenic emissions are estimated in order to obtain a complete
emissions profile for an area, they are deducted from the inventory for control strategy and planning
purposes and, therefore, are not a part of the emissions reductions goal or target.

7
1990 Base Year Emissions Inventory Changes
The commission has continued to make changes to the inventory since the inventory was submitted to
EPA in November 1992. All of these modifications have been in response to events such as new and
improved models for estimating emissions, improved emission factors for estimating emissions from
sources, better information about activity levels of emission sources, improved inventory
methodologies, more up-to-date, accurate forecasts of population and economic growth, improved
models for growth projection of inventories, comments and input from outside peer reviewers of the
inventory (e.g., private industry, local agencies, councils of government committees), and so on. These
factors motivated the commission to seek modifications in a variety of Area Source and Non-road
Mobile Source categories and in the On-road Mobile Source inventory, as the individual circumstances
indicated and as better information came to light. The focus of these modifications has been on the
1990 base year inventory. However, given their relationship, changes made in the 1990 inventory have
affected both the 1996 and 1999 projection inventories (and their related 15% and 9% SIPs). A more
complete discussion of these modifications, including the specific categories changed, may be found in
the 15% and 9% SIP documents.
Changes to the Emissions Inventory as a Result of the Coastal Oxidant Assessment for Southeast
Texas (COAST) Study
The COAST field study was an intensive study of the Houston/Galveston (HGA) and Beaumont/
Port Arthur (BPA) ozone nonattainment areas, and adjunctive offshore waters, in southeast Texas. The
project was undertaken in conjunction with the Minerals Management Service and represents an effort

8
to obtain the regional information necessary to develop cost-efficient, effective ozone control strategies.
One project from the COAST study was the Bottom-up EI Project.
A traditional EI of area sources utilizes top-down methodologies in order to estimate the county-wide
emissions required for SIP inventory reporting. This approach involves using such statistics (national
or state level) on the level of activity (e.g., gallons of gasoline sold) of the particular area source
category being investigated. The activity level is then adjusted, or allocated, to the county level based
on some known surrogate such as population or Standard Industrial Classification (SIC) Code
employment (e.g., the population of X County is 15% of the state population so 15% of the state level
activity is taking place at the county level). The alternative, a bottom-up inventory, is not usually
performed because it is expensive. The COAST project provided an opportunity to conduct a bottom-
up inventory.
A bottom-up inventory entails collecting local, category-specific activity level information. In the
specific case of the Bottom-up EI Project, the approach was to have a contractor take a random,
stratified sample, or survey, to determine the activity levels of the following area source and non-road
mobile source categories: Dry Cleaners, Gasoline Stations, Lawn Mower usage, Recreational Marine
usage, Generators <50 HP usage, Surface Coatings, and Surface Cleaning. The contractor then used
this activity level information with emission factors to estimate emissions. A variety of follow-up work
was performed to verify and complete the study. The results of this study resulted in the changes to the
EI for the 1990 BYEI which, in turn, affect the projected 1996 and 1999 EIs.

9
The categories in which changes have occurred may be seen in the following table. A brief
explanation of why the changes occurred in each area source and non-road category affected will
follow after the table. The actual number changes in emissions levels may be seen in the graphics,
which display the changes from the original 1990 levels of emissions to the revised 1990 estimates.

10
Table 1A
Categories with Changes in 1990 Base Year Inventory Emissions Estimates
Category Ozone Nonattainment Areas
Houston/Galveston Beaumont/Port Dallas/Fort Worth El Paso
Arthur
Other Product Coatings Y Y Y Y
High Performance Maintenance Y Y Y Y
Marine Vessel Loading Losses Y Y N N
Surface Cleaning Y Y Y Y
Architectural Coatings Y Y Y Y
Auto Refinishing Y Y Y Y
Sheet, Strip and Coil Y Y Y Y
Vessels with Outboards Y Y N N
Commercial Vessels Y N N N
Generators <50 HP Y Y N N
Residential Lawnmowers Y Y N N
Military Aircraft YN N N

11
Table 1B
Changes in 1990 State Implementation Plan Emissions Inventories
Houston/GalvestonOld 1990 TPD Rev. 1990 TPD
Area Source Categories Other Product Coatings 0.61 0.91 High Performance Maintenance 5.74 4.56 Other Special Purpose Coatings 5.39 5.74 Marine Vessel Loading Losses 15.94 0.00 Surface Cleaning 16.43 8.44 Architectural Coatings 31.2 23.23 Auto Refinishing 16.5 25.57 Sheet, Strip and Coil 5.58 0.00 Totals 229.01 200.07
Non-road Mobile Source Categories Vessels with Outboards 61.39 20.48 Commercial Vessels 14.81 3.81 Generators 11.96 9.22 Lawnmowers 33.43 22.95 Totals 195.11 129.99
Beaumont/Port ArthurOld 1990 TPD Rev. 1990 TPD
Area Source Categories Other Product Coatings 0.15 0.38 High Performance Maintenance 0.56 0.21 Other Special Purpose Coatings 0.56 0.56 Marine Vessel Loading Losses 7.72 7.47 Surface Cleaning 2.47 0.81 Architectural Coatings 2.96 2.25 Auto Refinishing 1.60 2.48 Sheet, Strip and Coil 0.00 0.00 Totals 32.48 30.63
Non-road Mobile Source Categories Vessels with Outboards 10.28 3.02 Generators 0.5 0.53 Lawnmowers 4.11 2.83 Commercial Vessels 6.4 0.89 Totals 32.46 18.45
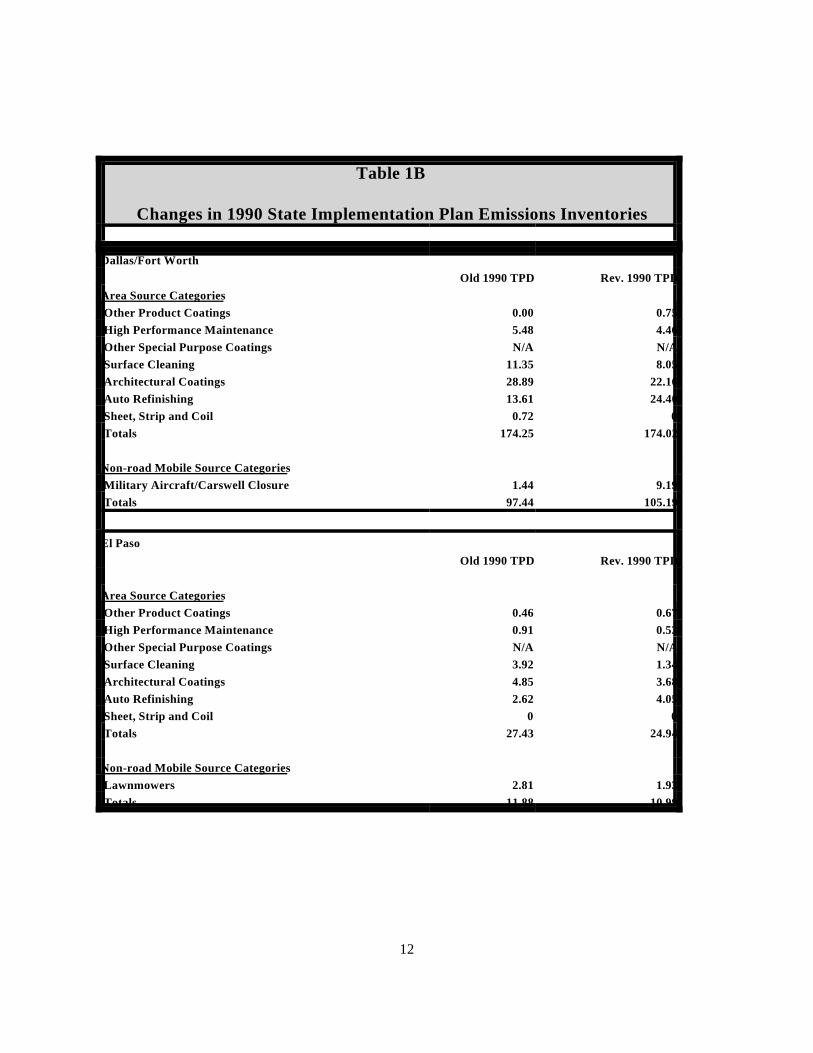
12
Table 1B
Changes in 1990 State Implementation Plan Emissions Inventories
Dallas/Fort WorthOld 1990 TPD Rev. 1990 TPD
Area Source Categories Other Product Coatings 0.00 0.75 High Performance Maintenance 5.48 4.46 Other Special Purpose Coatings N/A N/A Surface Cleaning 11.35 8.05 Architectural Coatings 28.89 22.16 Auto Refinishing 13.61 24.40 Sheet, Strip and Coil 0.72 0 Totals 174.25 174.02
Non-road Mobile Source Categories Military Aircraft/Carswell Closure 1.44 9.19 Totals 97.44 105.19
El PasoOld 1990 TPD Rev. 1990 TPD
Area Source Categories Other Product Coatings 0.46 0.67 High Performance Maintenance 0.91 0.53 Other Special Purpose Coatings N/A N/A Surface Cleaning 3.92 1.34 Architectural Coatings 4.85 3.68 Auto Refinishing 2.62 4.05 Sheet, Strip and Coil 0 0 Totals 27.43 24.94
Non-road Mobile Source Categories Lawnmowers 2.81 1.93 Totals 11.88 10.99

13
Changes in Area and Non-road Mobile Source Categories
Other Product Coatings, High Performance Maintenance, and Other Special Purpose Coatings
These Area Source categories are all surface coatings categories that were estimated for the 1990
inventory using per capita emission factors of .6, .8 and .8 lbs./yr./person, respectively. Per capita and
per employee emission factors provided by EPA are typically national level estimates of usage of a
product divided by population or number of employees. Early in the process of reviewing the
inventory, the commission requested that EPA provide more information about what activities (specific
coatings usage) the factors were related to or that the commission be allowed to drop the emissions
estimates from these categories, if no information could be provided. The EPA staff was eventually
able to locate the source document for the original emissions estimates. In the interim, the commission
review of the categories resulted in better estimation of the point source emissions to be subtracted
from the areas source estimate. That increased subtraction applies only to the categories Other Product
Coatings and High Performance Maintenance.
For the sake of clarification, examples of Other Product Coatings are coatings used on concrete
products, photographic equipment, toys and sporting goods, and so on. Examples of High Performance
Maintenance coatings are coatings used in oil and gas extraction operations (e.g., pipe coatings), food
processing, metals production, mining, and so on. Lastly, examples of Other Special Purpose Coatings
are roof coatings, marine shelf goods, and metallic paints.

14
Marine Vessel Loading Losses
The emission estimate in this area source category is based on the amounts of petroleum and volatile
chemical cargoes loaded to marine vessels in Texas ports. Since most of the emissions due to loading
are controlled and may be attributed to point sources of emission, a part of the process of estimating is
to subtract the point sources of emission estimates, which are self-reported through the EIQ, from the
estimate of area source emissions. It was discovered that the point source emissions had been
underestimated in the 1990 inventory. When the point source emission numbers were recompiled and
the subtraction performed, the area source emissions went from 15.94 TPD in HGA to zero and the
emissions in BPA went down by about 1/3 TPD.
Surface Cleaning
This category of emissions was estimated in the 1990 inventory using a per capita emission factor of
4.3 lbs./yr./person. The commission hired a contractor to do an inventory of surface cleaning facilities
in the HGA and BPA areas, but the results were inconclusive and the contractor recommended follow-
up survey work. To that end, the commission conducted 41 site visits, in addition to the survey work
done by the contractor. The total number of facilities surveyed was 124; the number of facilities that
reported not using VOC solvents was 83; the number of facilities that provided information about usage
was 41; the sample standard deviation was .0704 and the relative error was estimated at 16.66%. There
are about 10,607 facilities in 15 SIC codes in the HGA and Beaumont areas that are potentially
involved in surface cleaning/degreasing activities. Given the relative error associated with the survey
sample, and the fact that the sites selected were chosen using a random number generator, it is thought
that these results hold for other areas as well. This has been reinforced by a discussion with

15
SafetyKleen, a major supplier of degreasing solvents. A per capita emission factor has been developed
based on the commission survey results and emissions, based on population, have been estimated for
DFW and HGA nonattainment areas.
Architectural Coatings
Architectural coatings, also known as trade paints, are used primarily by homeowners and painting
contractors. Architectural coatings include interior and exterior house and building paints as well as
coatings for other surfaces, such as curbs and signs. The coatings are applied by spray, brush, or roller
and dry or cure at ambient conditions. In 1990, oil-based paints and coatings account for about 24% of
architectural coatings by volume. These typically have volatile solvent contents of about 59%. Water-
borne paints, which make up the balance of architectural coatings, have substantially lower solvent
contents, typically about 6%. Paints are also classified by the environment the surface is exposed to,
either interior or exterior.
Average annual VOCs air emissions from architectural painting activities is dependent on the
following:
1) amount of VOCs contained in the various types of paints,
2) amount of the various types of paints used,
3) amount of VOCs in the material to “thin” the paints (when thinner is used),
4) amount of VOCs in the “cleanup” solvents (when used), and
5) amount of thinning and cleanup solvents used.

16
A per capita emission factor of 4.6 lbs./yr/person was used to estimate emissions from this category for
the original 1990 inventory. Information obtained from the National Paint and Coatings Association,
combined with information collected by commission staff about thinner usage, has been used to
improve the emissions estimate and to develop a new emission factor. The factor of 3.49 lbs./ per
capita/per year has been used to calculate the emissions that replace the original 1990 base year
estimate.
Automobile Refinishing
Automobile refinishing coatings (referred to as paints), paint thinners, reducers, hardeners, catalysts,
and cleanup solvents used during their application, contain VOCs which are precursors to ground level
ozone formation. Some of these painting compounds create hazardous air pollutants which are toxic.
The evaporation of the VOCs from the paints, thinners, reducers, hardeners, catalysts and cleanup
solvent create "area source" VOC air emissions.
Auto refinishing is the repainting of worn or damaged automobiles, light trucks, and other vehicles.
Coating of new cars is not included in the category but falls under industrial coatings. Auto refinishes
are classified by industry as a “Special Purpose Coating” while the coatings used for new vehicles are
classified as original equipment manufacture (OEM) coatings.
For this analysis, the materials used to refinish “autos” were divided into four categories; “coatings,”
the “thinners and reducers,” the “hardeners and catalysts,” and the “cleanup solvents.” The “coatings”
include the primers, surfacers, base coats, topcoats, and clear coats. The “thinners” are material to thin
the coatings. The “reducers” reduce the viscosity of the coating and act as a “thinner.”

17
In the fall of 1995, the commission conducted two surveys. The first survey was to collect usage
information from paint and body shops (the places where most of the activity takes place) on the
thinners, reducers, hardeners, catalysts, and “cleanup” solvents. The second survey was to collect
information from auto refinishes manufactures on the “average” physical properties of auto refinishes
and the other materials identified above.
It is estimated that VOC air emissions from auto refinishing activities in Texas nonattainment counties
decreased about 47% from 1990 through 1993. This is attributed to the following:
1) due to the quantity of paint used and/or quality of OEM new auto coating applications in
the 1980's, sales of auto refinishes peaked in 1990,
2) the trend since 1990 has been for applicators to switch from air atomized painting
equipment to high volume/low pressure equipment which has about a 40% better transfer
rate (and produces less waste because there is no paint in lines),
3) improved coating formulations require less paint to do the same job, and
4) the average size of cars decreased.
Average annual VOCs air emissions from automobile refinishing activities is dependent on the
following:
1) amount of VOCs contained in the coatings,
2) amount of VOCs in the material to “thin”or “reduce” the coatings,
3) amount of VOCs in the hardener/catalyst used,
4) amount of VOCs in the “cleanup” solvents used,
18
5) amount of the coatings used,
6) amount of hardener/catalyst used, and
7) amount of thinners, reducers and cleanup solvents used.
Information collected from the surveys enabled staff to calculate 1990 and 1993 United States VOC
emission factors for auto refinishing activities, then allocate those emissions to the nonattainment areas.
The factor used for 1990 is 3.92 lbs./per capita/per year. For 1993 the factor is estimated to be 1.94
lbs./per capita/per year and estimated at 1.52 lbs./per capita/per year in 1996. The VOC emissions for a
region are assumed to be equal to the emission factor times the population of the region.
Sheet, Strip, and Coil
"Metal coil coating is a linear process whereby protective or decorative organic coatings are applied to
flat metal sheet or strip packaged in rolls or coils ... The solvents most often used include xylene,
toluene, methyl ethyl ketone, butanol, diacetone alcohol, isoprene, butyl carbonyl, mineral spirits,
ethanol, nitropropane, tetrahydrofuran, methyl isobutyl ketone, isopropanol, diisoamyl ketone, and
several trademarked solvents." Emissions are created at several stages of the coating operations,
including coating application, curing, and quenching.
This category was estimated for the 1990 inventory using a per employee emission factor of 2,877
lbs./year per employee. The number of employees in the SIC Code related to this industry (3479) was
obtained from a Bureau of the Census publication, County Business Patterns, Texas.

19
SIC 3479 includes many types of businesses not engaged in coil coating operations; therefore, using a
per employee emission factor inflated the emissions above the levels being actually emitted by the
companies involved in the specific activity. A list of companies in Texas involved in coil coating
operations was obtained from the National Coil Coaters Association that enabled commission staff to
determine that either all of the coil coating companies in the nonattainment areas were reporting their
emissions to the commission both in 1990 and in 1993 or they did not actually have coil coatings
facilities at their locations. Instead of doing it themselves they subcontracted the work out. Therefore,
there are no area source emissions, as all emissions have been accounted for in the Point Source
inventory and inclusion in the inventory of an area source estimate would result in double-counting of
emissions.
Vessels with Outboards
A contractor conducted a telephone survey of registered pleasure craft owners in the HGA and BPA
areas that yielded more than 800 respondents. Perhaps the most significant finding, apart from the
improvement in information about spatial allocation (where used, which body of water), was the
discovery that 62.3% of boat usage takes place on the weekend. Since, by EPA definition, an ozone EI
is a weekday (Monday through Friday) inventory this finding resulted in a tremendous reduction in
estimated emissions (from approximately 60 TPD to 20 TPD in HGA, for example). This method of
reducing the total inventory estimate after accounting for weekend usage has been accepted by EPA
Region 6 (Dallas). Region 6 allowed such a reduction in response to a survey done by the North
Central Texas Council of Governments (NCTCOG) in the DFW area.

20
Commercial Vessels
This category of non-road mobile source emissions consists of the emissions from fuel combustion by
oceangoing vessels, harbor vessels, and the fishing fleet. Emissions were estimated for the 1990
inventory by recourse to information collected by the Army Corps of Engineers, Waterborne
Commerce Statistics Center on freight traffic at harbors, and by allocating national fuel usage to Texas.
The improvement work that has been done is based on a methodology that was developed for the EPA
in October 1992 by Booz-Allen contained in a report titled, “Commercial Marine Vessel Contributions
to Emissions Inventories.” This methodology has been accepted by EPA's OMS and its use, in
substitution of the original work for 1990, has yielded emissions reductions of about 11 tons per day in
the HGA area. The Booz-Allen methodology has also been applied to the 1993 emissions inventory for
this category. Since the Booz-Allen study made no attempt to estimate emissions from Commercial
Vessels in the BPA area, the percentage difference between the emissions estimated for HGA in 1990
and 1993 has been applied to the emissions estimate for BPA for 1993 to derive a 1990 emissions
estimate for BPA.
Generators < 50 HP
This category of Non-road Mobile Source emissions is from both consumer and commercial usage of
generators with power ratings of less than 50 horsepower. Emissions are from the exhaust of the
generator, fuel evaporation, and refueling. The original 1990 emissions estimates, like those for
Vessels with Outboards, were supplied by EPA to the states and the allocation of the emissions to the
Texas nonattainment areas was through the use of regression equations applied to national level usage
statistics from a proprietary database. The VOC emissions from this category represented about 6% of

21
the non-road mobile source emissions (trains, planes, ships, and other non-road equipment) of 195.11
TPD.
The EI work that replaces the original emissions estimate was done by a contractor employed by the
commission using COAST funding. The staff feels that the inventory is an improvement because it is
based on local area-specific construction and recreational area information and is also based on more
current information about horsepower distributions in equipment populations.
Residential Lawnmowers
Emissions from lawn and garden equipment are also classified as Non-road Mobile Sources. The
original 1990 inventory included emissions estimates for approximately 80 different types of non-road
mobile equipment in a catchall category called "Other Small Engines." The EPA hired a contractor to
perform the inventory, which is described in a document called the Non-road Engine and Vehicle
Emissions Study--Report, November 1991. The change in emissions that the commission has made to
the original estimate is an adjustment to reflect differences in usage by residential sources. By
definition, the 1990 BYEI was to be an inventory of emissions that occurred through the week (i.e.,
Monday through Friday). In making a temporal adjustment to the residential portion of lawnmower
emissions only (since nothing is known about commercial usage) the commission has reduced the
overall residential emissions by the amount of the emissions reported for weekend usage. The
justification for the adjustment is drawn from a survey conducted by commission staff of 1434
randomly selected residences in the HGA and BPA areas which had a 21% response rate. Survey
statistics are: 59% of lawns were mown by the resident or by a friend or neighbor, 8% of lawns were
mown by commercial services, and 33% reported that they had no lawns to mow. Of the 160

22
applicable residential lawnmowers, 59% reported that they mowed their lawns on Saturday or Sunday.
The emissions have been adjusted accordingly, while, again, leaving the commercial portion as is.
Military Aircraft
This category of non-road mobile source emissions has only been reworked for the DFW ozone
nonattainment area. This is an attempt to account for the reduced levels of activity at Carswell Air
Force Base, Texas due to closure and realignment. In 1992 when information for the 1990 inventory
was being collected, the emissions were estimated by NCTCOG at .6356 TPD. Subsequently, the Air
Force has self-reported, in a draft environmental impact statement on the closure of Carswell, that 1990
VOC emissions were 8.48 tons per day. This adjustment and backcast of the 1990 inventory is an
attempt to correct that discrepancy, while still including an estimate of the military aircraft activity at
the base after the realignment.
Changes to On-road Mobile Source Emissions Estimates
This section summarizes the procedures used for the interim updates and anticipated final updates to the
on-road mobile source inventories and control strategy reductions for the four Texas nonattainmnet
areas. Control strategy emission reduction estimates include effects of the federal Tier 1 exhaust
emissions standards, the new Texas motor vehicle I/M program and the reformulated gasoline program
for November 15, 1996.

23
General Discussion
Updates to the on-road mobile source emission and reduction estimations are 1) required in order to
reflect changes in the Texas inspection and maintenance program for motor vehicles in the Texas
nonattainment areas, 2) required in order to reflect updates in demographics, speed limits, and other
data sets affecting transportation networks and travel characteristics, and 3) desired in order to make
the BPA and ELP SIP inventory and reduction estimation procedure consistent with the methodology
required for the BPA and ELP conformity analysis.
Texas Inspection and Maintenance Program Changes
The original 15% SIP submission included estimation of emission reductions due to enhanced I/M in
DFW, ELP and HGA and a basic I/M in BPA as required by FCAA Amendments of 1990. The EPA
I/M flexibility policy provided the commission with the opportunity to reevaluate the I/M programs for
all four nonattainment areas. The details of the new I/M programs are documented in the I/M section
of the 15% SIP. In DFW, ELP and HGA major I/M program changes include change in the test type
from I/M 240 to a combination of two speed idle and acceleration simulation mode testing, changes in
the counties covered by I/M, emissions tests required upon resale, inclusion of technician training and
certification, and incorporation of remote sensing technology. In BPA the basic I/M program was
canceled with no replacement program planned. Due to the time required to analyze new I/M program
options and develop appropriate specifications and rules, the I/M program start was delayed from
beginning January 1, 1995, to beginning July 1, 1996, in DFW and January 1, 1997, in ELP and HGA.

24
In order to meet the deadline for submittal of good faith estimates of emissions changes due to the I/M
program changes a factor based approach (FBA) was developed. A similar approach was used to
determine control program reductions for November 15 as part of the HGA and DFW 15% SIP. The
methodology involves using ratios of MOBILE5_H (the latest EPA mobile emission factor model)
composite emission factors to estimate changes in the current control emission inventory (CCEI), the
control strategy emissions inventory (CSEI) and individual control program reductions. For the final
submittal in June 1996 detailed link based/time-of-day analysis will be used to refine the FBA
estimates.
Transportation Network Updates
Transportation networks need to be updated as input data sets undergo change. Major changes to
transportation networks since the 1993 SIP submittal include: demographic updates, speed limit
changes, and changes to networks in order to meet conformity requirements. Also, demographic
changes have been incorporated and all other network updates since the 1993 submittal have been
incorporated into the emission estimates.
BPA and ELP SIP Inventory Methodology Updates
For the inventory update for BPA and ELP, in addition to the I/M program change assessment, a
change in the emissions estimation methodology, from the HPMS facility type/24 hour analysis to a
link based/time-of-day analysis was performed. The primary reason for investing resources in
changing the inventory methodology is to bring the BPA and ELP SIP inventory and reduction
estimation procedure into consistency with the methodology required for the BPA and ELP conformity

25
analysis. Since the emissions calculation procedure is changing, the update will require recalculation of
the 1990 Base Year Inventory and the 1990 Adjusted Base Year Relative to 1996, in addition to the
1996 Projected CCEI and CSEI updates.
Previous inventory development methodology for BPA and ELP 1) used VMT and speeds aggregated
into the 12 HPMS facility types, and 2) used MOBILE5A inputs averaged over a 24-hour period. A
link based methodology incorporates VMT and speed estimates at the road link level into the emission
calculations, and aggregates the emissions into facility types after emissions are calculated. A time-of-
day analysis incorporates VMT, speed, and time-of-day sensitive MOBILE5A inputs, for four time-of-
day periods into emission calculations, rather than 24-hour averages.
A link based/time-of-day analysis incorporates both road link data and time-of-day data into the
emissions estimation procedure. The link speeds are used in the MOBILE5A emission factor model to
obtain emission factors for each link for each time of day. The link emission factor is multiplied by the
link VMT to determine link emissions. Each link is classified as an HPMS facility type. Total
emissions and emissions for each facility type are determined by summing the appropriate link
emissions.
Methodology for Interim Update
For the interim emission and reduction estimation updates, methodology was based upon time available
to meet the interim submittal deadline and the requirement to make a good faith estimate of the impacts
of I/M program changes on the 15% SIP. Highlights of the interim submittal updates for each area
include:

26
Beaumont/Port Arthur
Methodology consistent with 1993 SIP submittal
I/M program removed from CSEI
El Paso
1996 inventory methodology updated to link based/time-of-day analysis
I/M program updated to reflect new Texas I/M program
Dallas/Fort Worth and Houston/Galveston
CCEI and CSEI updated using FBA
Individual control program reduction estimates updated using FBA
Methodology for Final Update Submittal
For the inventory update final submittal the emissions estimation methodology for BPA and ELP was
updated from the HPMS facility type/24 hour analysis to a link based/time-of-day analysis, HGA and
DFW updated the interim estimates based upon results from link based analysis, transportation
networks were updated and speed limit change impacts were assessed.
Beaumont/Port Arthur
Methodology updated to link based/time-of-day from facility type/24 hour
I/M program removed from CSEI
1990 Base Year Inventory updated

27
El Paso
Methodology updated to link based/time-of-day from facility type/24 hour
I/M program updated to reflect new Texas I/M program
1990 Base Year Inventory updated
Dallas/Fort Worth and Houston/Galveston
CCEI and CSEI updated using original SIP methodology(link based/time-of-day)
Individual control program reduction estimates updated
Transportation networks updated

28
Table 2A
Summary of VOC Emissions in the Beaumont/Port Arthur Nonattainment Area
by Source Type
BPA Point Sources Area Sources Non-Road Mobile Sources
TPY TPD TPY TPD TPY TPD
86195.94 245.54 10614.58 30.63 5711.22 18.44
On-Road Mobile Sources Biogenic Sources Total Sources
TPY TPD TPY TPD TPY TPD
NA 31.61 NA 91.95 NA 418.17
Notes: Biogenic emissions are calculated through use of an Environmental Protection Agency software package called PC-BEIS which yields results in U. S. short tons per day;
no annual totals are calculated. Annual totals are not required in the On-Road Mobile Sources category per E.P.A. guidelines.

29
Table 2B
Summary of NO Emissions in the Beaumont/Port Arthur Worth Nonattainment AreaX
by Source Type
BPA Point Sources Area Sources Non-Road Mobile Sources
TPY TPD TPY TPD TPY TPD
77335.00 221.01 709.90 1.44 10447.31 33.32
On-Road Mobile Sources Biogenic Sources Total Sources
TPY TPD TPY TPD TPY TPD
NA 41.09 NA NA NA 296.86
Notes: Biogenic emissions are calculated through use of an Environmental Protection Agency software package called PC-BEIS which yields results in U. S. short tons per day;
no annual totals are calculated. Annual totals are not required in the On-Road Mobile Sources category per E.P.A. guidelines.

30
Table 2C
Summary of CO Emissions in the Beaumont/Port Arthur Nonattainment Area
by Source Type
BPA Point Sources Area Sources Non-Road Mobile Sources
TPY TPD TPY TPD TPY TPD
42399.00 117.16 6249.00 16.08 50710.02 152.55
On-Road Mobile Sources Biogenic Sources Total Sources
TPY TPD TPY TPD TPY TPD
NA 282.69 NA NA NA 568.48
Notes: Biogenic emissions are calculated through use of an Environmental Protection Agency software package called PC-BEIS which yields results in U. S. short tons per day;
no annual totals are calculated. Annual totals are not required in the On-Road Mobile Sources category per E.P.A. guidelines.

31

32
FIGURE 2

33
FIGURE 3

34
FIGURE 4

35
FIGURE 5

36
TABLE 3
SUMMARY OF 1990 EMISSIONS FROM AREA SOURCES FOR BEAUMONT/PORT ARTHUR (REVISED)VOC VOC NOX NOX CO CO
CATEGORY TPY TPD TPY TPD TPY TPD
OIL & GAS PRODUCTION 943.08 2.7994
OIL & GAS PRODUCTION - OFF SHORE 4.10 0.0112 99.63 0.2730 12.60 0.0345
SERVICE STATIONS - VEHICLE REFUELING 735.03 2.3899
SERVICE STATIONS - TANK TRUCK UNLOADING 900.68 2.8868
SERVICE STATIONS - TANK TRUCKS IN TRANSIT 15.53 0.0425
SERVICE STATIONS - TANK BREATHING LOSSES 103.53 0.2836
SERVICE STATIONS - OTHER 72.47 0.1985
AIRCRAFT REFUELING 0.31 0.0008
MARINE VESSEL LOADING LOSSES 2799.11 7.4675
SYNTHETIC ORGANIC CHEMICAL STORAGE TANKS 0.00 0.0000
LEAKING UNDERGROUND TANKS 592.76 0.3360
ARCHITECTURAL COATINGS 631.73 2.2500
AUTO REFINISHING 708.00 2.4800
TRAFFIC MARKINGS 90.31 0.2474
FURNITURE & FIXTURES 0.00 0.0000
METAL CONTAINERS 0.00 0.0000
AUTOMOBILES (NEW) 0.00 0.0000
MACHINERY & EQUIPMENT 18.17 0.0699
APPLIANCES 0.00 0.0000
OTHER TRANSPORTATION EQUIP. 5.29 0.0203
SHEET, STRIP, & COIL 0.00 0.0000
FACTORY FINISHED WOOD 0.00 0.0000

37
TABLE 3SUMMARY OF 1990 EMISSIONS FROM AREA SOURCES FOR BEAUMONT/PORT ARTHUR (REVISED)
VOC VOC NOX NOX CO CO
CATEGORY TPY TPD TPY TPD TPY TPD
ELECTRICAL INSULATION 0.00 0.0000
OTHER PRODUCT COATINGS 99.37 0.3822
HIGH-PERFORMANCE MAINT. 54.49 0.2096
MARINE COATINGS 26.95 0.1037
OTHER SPEC. PURPOSE COATINGS 144.49 0.5557
BARGE,TANK,TANK TRUCK,RAIL CAR,DRUM CLEAN. 0.00 0.0000
BREWERIES 0.00 0.0000
WINERIES 0.00 0.0000
DISTILLERIES 0.00 0.0000
CATASTROPHIC/ACCIDENTAL RELEASES 6.89 0.0189
SURFACE CLEANING 231.44 0.8070
DRY CLEANING 85.34 0.3282
GRAPHIC ARTS 234.80 0.9031
CUTBACK ASPHALT 51.67 0.1416
EMULSIFIED ASPHALT 27.70 0.1065
CONSUMER/COMMERCIAL SOLVENT USE 1137.86 3.1174
PESTICIDE APPLICATION 119.00 0.4958
MUNICIPAL WASTE LANDFILLS 240.16 0.6580
MUNICIPAL WASTEWATER TREATMENT (POTW) 5.02 0.0138
INDUSTRIAL WASTEWATER TREATMENT 2.05 0.0056
WASTEWATER PACKAGE PLANTS 0.00 0.0000
COMMERCIAL BAKERIES 0.00 0.0000

38
TABLE 3SUMMARY OF 1990 EMISSIONS FROM AREA SOURCES FOR BEAUMONT/PORT ARTHUR (REVISED)
VOC VOC NOX NOX CO CO
CATEGORY TPY TPD TPY TPD TPY TPD
STATIONARY SOURCE FUEL COMBUSTION: 0.00 0.00
FUEL OIL-RESIDENTIAL 0.00 0.0000 0.02 0.0000 0.00 0.0000
FUEL OIL-COMMERCIAL/DISTILLATE 0.08 0.0002 6.20 0.0119 1.55 0.0030
FUEL OIL-COMMERCIAL/RESIDUAL 0.00 0.0000 0.36 0.0007 0.02 0.0000
FUEL OIL-INDUSTRIAL/DISTILLATE 1.79 0.0057 126.41 0.4052 44.87 0.1438
FUEL OIL-INDUSTRIAL/RESIDUAL 0.12 0.0004 24.46 0.0784 2.22 0.0071
COAL-RESIDENTIAL 0.00 0.0000 0.00 0.0000 0.00 0.0000
COAL-COMMERCIAL 0.00 0.0000 0.00 0.0000 0.00 0.0000
COAL-INDUSTRIAL 0.00 0.0000 0.00 0.0000 0.00 0.0000
NATURAL GAS-RESIDENTIAL 13.93 0.0114 263.02 0.2162 52.60 0.0432
NATURAL GAS-COMMERCIAL 3.16 0.0061 51.00 0.0981 10.20 0.0196
NATURAL GAS-INDUSTRIAL 0.87 0.0028 43.18 0.1384 10.80 0.0346
LPG-RESIDENTIAL 1.10 0.0009 20.79 0.0171 4.19 0.0034
LPG-COMMERCIAL 0.07 0.0001 1.47 0.0028 0.29 0.0006
LPG-INDUSTRIAL 0.26 0.0008 13.42 0.0430 3.36 0.0108
WOOD-RESIDENTIAL 41.99 0.0000 4.19 0.0000 346.16 0.0000
STRUCTURE FIRES 0.08 0.0001 0.01 0.0000 0.44 0.0011
FOREST FIRES 334.50 0.9164 55.75 0.1527 1962.42 5.3765
PRESCRIBED BURNING 29.44 0.0807 0.00 0.0000 864.64 2.3689
SLASH BURNING 99.88 0.2736 0.00 0.0000 2932.65 8.0347
OPEN BURNING 0.00 0.0000 0.00 0.0000 0.00 0.0000
ORCHARD HEATERS 0.00 0.0000 0.00 0.0000 0.00 0.0000
AGRICULTURAL BURNING 0.00 0.0000 0.00 0.0000 0.00 0.0000
TOTAL 10614.59 30.6303 709.90 1.4374 6249.00 16.0819

39
Table 4
Summary of Emissions from Non-Road Mobile Sources for Beaumont/Port Arthur
Category VOC VOC NO NO CO CO
TPY TPD TPY TPD TPY TPD
X X
Railroad 102.76 .28 1914.05 5.24 260.79 .71
Locomotives
Commercial 5.77 .02 1.31 .00 115.75 .32
Aircraft
Military Aircraft 8.06 .02 3.45 .01 4.71 .01
General Aircraft 9.71 .02 1.60 .00 296.05 .81
Vessels 323.18 .89 2643.74 7.24 17544.75 32.81
Other Non-Road 5261.74 17.22 5883.16 20.83 32487.96 117.89
Engines
Total 5711.22 18.45 10447.3 33.32 50710.01 152.55

40
TABLE 5
SUMMARY OF 1990 EMISSIONS FROM SMALL ENGINE SOURCES FOR THE BEAUMONT-PORT ARTHUR NONATTAINMENT AREA
ALL ENGINES (2-CYCLE + 4-CYCLE + DIESEL) VOC VOC NOX NOX CO COClass EQUIPMENT TYPES TPY TPD TPY TPD TPY TPD
1 Trimmers/Edgers/Brush Cutters 191.20 0.71 0.34 0.00 522.25 1.94 1 Lawn Mowers 755.64 2.83 4.26 0.01 1224.19 17.51 1 Leaf Blowers/Vacuums 50.69 0.19 0.11 0.00 148.13 0.55 1 Rear Engine Riding Mowers 8.29 0.03 0.27 0.00 204.33 0.76 1 Front Mowers 2.92 0.01 0.07 0.00 53.51 0.20 1 Chainsaws <4 HP 282.36 0.77 0.42 0.00 563.39 1.54 1 Shredders <5 HP 0.35 0.00 0.00 0.00 1.43 0.00 1 Tillers <5 HP 40.77 0.15 0.34 0.00 340.86 1.26 1 Lawn & Garden Tractors 140.04 0.52 15.16 0.05 3597.59 13.40 1 Wood Splitters 5.19 0.02 0.04 0.00 45.78 0.18 1 Snowblowers 0.00 0.00 0.00 0.00 0.00 0.00 1 Chippers/Stump Grinders 32.08 0.12 6.52 0.02 258.21 0.95 1 Commercial Turf Equipment 128.57 0.48 27.52 0.09 3894.84 14.51 1 Other Lawn & Garden Equipment 4.11 0.02 0.01 0.00 17.56 0.05
Subtotal 1642.21 5.83 55.06 0.17 10872.07 52.85
2 Aircraft Support Equipment 0.00 0.00 0.00 0.00 0.00 0.00 2 Terminal Tractors 0.00 0.00 0.00 0.00 0.00 0.00
Subtotal 0.00 0.00 0.00 0.00 0.00 0.00
3 All Terrain Vehicles (ATVs) 198.07 0.96 1.77 0.01 950.24 3.86 3 Minibikes 2.45 0.01 0.03 0.00 17.39 0.07 3 Off-Road Motorcycles 77.58 0.32 0.31 0.00 116.48 0.47 3 Golf Carts 200.39 0.90 1.29 0.00 734.61 2.98 3 Snowmobiles 0.00 0.00 0.00 0.00 0.00 0.00 3 Specialty Vehicles Carts 63.50 0.26 0.18 0.00 106.77 0.43
Subtotal 541.99 2.46 3.58 0.01 1925.49 7.81 TABLE 5

41
SUMMARY OF 1990 EMISSIONS FROM SMALL ENGINE SOURCES FOR THE BEAUMONT-PORT ARTHUR NONATTAINMENT AREA
ALL ENGINES (2-CYCLE + 4-CYCLE + DIESEL) VOC VOC NOX NOX CO COClass EQUIPMENT TYPES TPY TPD TPY TPD TPY TPD
4 Vessels w/Inboard Engines 84.51 0.44 30.11 0.14 539.51 2.84 4 Vessels w/Outboard Engines 1444.94 3.02 16.93 0.04 2516.88 5.27 4 Vessels w/Sterndrive Engines 177.37 0.93 58.36 0.31 2011.43 10.59 4 Sailboat Auxiliary Inboard Engines 0.32 0.00 0.33 0.00 0.94 0.00 4 Sailboat Auxiliary Outboard Engines 1.58 0.00 0.01 0.00 2.97 0.01
Subtotal 1708.72 4.40 105.74 0.49 5071.73 18.71
5 Generator Sets <50 HP 160.87 0.54 20.76 0.06 3732.04 4.05 5 Pumps <50 HP 49.59 0.13 10.56 0.02 1077.61 2.95 5 Air Compressors <50 HP 27.88 0.07 5.34 0.01 711.77 1.96 5 Gas Compressors <50 HP 1.32 0.00 1.19 0.00 24.77 0.07 5 Welders <50 HP 46.72 0.13 21.55 0.06 1187.14 3.25 5 Pressure Washers <50 HP 14.44 0.04 0.47 0.00 331.34 0.91
Subtotal 300.82 0.91 59.87 0.15 7064.67 13.19
6 Aerial Lifts 5.97 0.01 6.00 0.01 99.32 0.27 6 Forklifts 104.77 0.27 252.78 0.70 1618.02 4.42 6 Sweepers/Scrubbers 21.94 0.05 111.94 0.30 222.42 0.60 6 Other General Industrial Equipment 22.72 0.06 36.25 0.10 156.62 0.43 6 Other Material Handling Equipment 1.33 0.00 5.88 0.01 15.52 0.04
Subtotal 156.73 0.40 412.85 1.12 2111.90 5.76

42
TABLE 5 SUMMARY OF 1990 EMISSIONS FROM SMALL ENGINE SOURCES FOR
THE BEAUMONT-PORT ARTHUR NONATTAINMENT AREA ALL ENGINES (2-CYCLE + 4-CYCLE + DIESEL) VOC VOC NOX NOX CO CO
Class EQUIPMENT TYPES TPY TPD TPY TPD TPY TPD7 Asphalt Pavers 2.99 0.01 30.22 0.10 32.70 0.12 7 Tampers/Rammers 16.25 0.06 0.01 0.00 34.41 0.11 7 Plate Compactors 63.53 0.23 1.17 0.00 299.02 1.08 7 Concrete Pavers 1.79 0.01 15.84 0.06 7.22 0.02 7 Rollers 25.52 0.09 135.54 0.49 265.07 0.95 7 Scrapers 27.98 0.10 338.53 1.22 194.56 0.70 7 Paving Equipment 39.38 0.14 73.09 0.25 338.61 1.21 7 Surfacing Equipment 5.01 0.02 0.48 0.00 92.46 0.34 7 Signal Boards 0.71 0.00 3.07 0.01 6.29 0.02 7 Trenchers 19.91 0.07 62.71 0.21 270.40 0.98 7 Bore/Drill Rigs 7.55 0.02 30.14 0.10 71.81 0.27 7 Excavators 16.48 0.06 246.48 0.89 119.23 0.43 7 Concrete/Industrial Saws 16.79 0.06 1.78 0.01 349.46 1.26 7 Cement and Mortar Mixers 7.63 0.03 1.00 0.00 132.98 0.49 7 Cranes 35.81 0.13 271.92 0.98 138.33 0.51 7 Graders 38.57 0.14 233.37 0.85 92.37 0.34 7 Off-Highway Trucks 29.51 0.10 325.55 1.18 94.96 0.35 7 Crushing/Proc. Equipment 5.29 0.01 35.26 0.13 42.02 0.15 7 Rough Terrain Forklifts 18.95 0.07 74.68 0.27 152.76 0.56 7 Rubber Tired Loaders 57.83 0.20 647.55 2.34 361.81 1.31 7 Rubber Tired Dozers 5.83 0.02 64.34 0.23 18.77 0.07 7 Tractors/Loaders/Backhoes 86.36 0.31 591.04 2.14 435.89 1.59 7 Crawler Tractors 143.01 0.51 1129.65 4.09 526.44 1.91 7 Skid Steer Loaders 34.09 0.12 116.01 0.42 280.70 1.01 7 Off-Highway Tractors 53.96 0.19 253.56 0.91 312.54 1.13 7 Dumpers/Tenders 1.13 0.00 0.16 0.00 20.48 0.07 7 Other Construction Equipment 5.55 0.01 32.96 0.11 50.59 0.17
Subtotal 767.41 2.71 4716.11 16.99 4741.88 17.15 TABLE 5
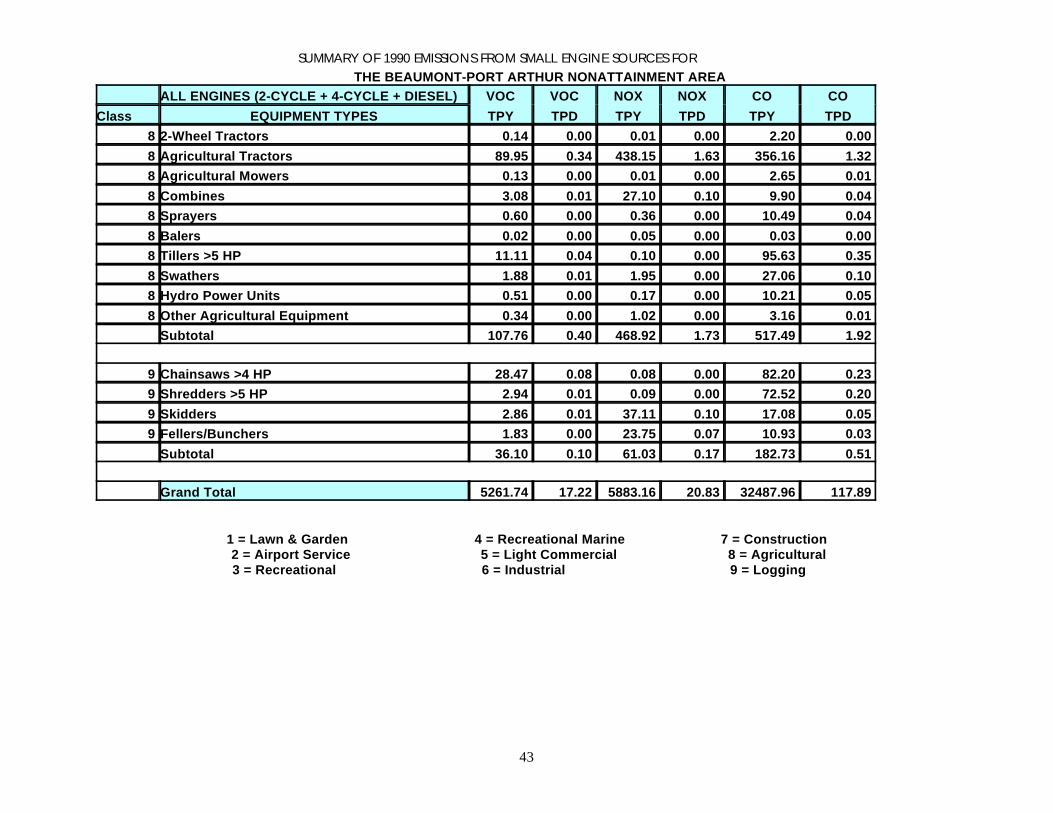
43
SUMMARY OF 1990 EMISSIONS FROM SMALL ENGINE SOURCES FOR THE BEAUMONT-PORT ARTHUR NONATTAINMENT AREA
ALL ENGINES (2-CYCLE + 4-CYCLE + DIESEL) VOC VOC NOX NOX CO COClass EQUIPMENT TYPES TPY TPD TPY TPD TPY TPD
8 2-Wheel Tractors 0.14 0.00 0.01 0.00 2.20 0.00 8 Agricultural Tractors 89.95 0.34 438.15 1.63 356.16 1.32 8 Agricultural Mowers 0.13 0.00 0.01 0.00 2.65 0.01 8 Combines 3.08 0.01 27.10 0.10 9.90 0.04 8 Sprayers 0.60 0.00 0.36 0.00 10.49 0.04 8 Balers 0.02 0.00 0.05 0.00 0.03 0.00 8 Tillers >5 HP 11.11 0.04 0.10 0.00 95.63 0.35 8 Swathers 1.88 0.01 1.95 0.00 27.06 0.10 8 Hydro Power Units 0.51 0.00 0.17 0.00 10.21 0.05 8 Other Agricultural Equipment 0.34 0.00 1.02 0.00 3.16 0.01
Subtotal 107.76 0.40 468.92 1.73 517.49 1.92
9 Chainsaws >4 HP 28.47 0.08 0.08 0.00 82.20 0.23 9 Shredders >5 HP 2.94 0.01 0.09 0.00 72.52 0.20 9 Skidders 2.86 0.01 37.11 0.10 17.08 0.05 9 Fellers/Bunchers 1.83 0.00 23.75 0.07 10.93 0.03
Subtotal 36.10 0.10 61.03 0.17 182.73 0.51
Grand Total 5261.74 17.22 5883.16 20.83 32487.96 117.89
1 = Lawn & Garden 4 = Recreational Marine 7 = Construction 2 = Airport Service 5 = Light Commercial 8 = Agricultural3 = Recreational 6 = Industrial 9 = Logging

44
Table 6A
Summary of VOC Emissions in the Dallas/Fort Worth Nonattainment Area by Source Type
DFW Point Sources Area Sources Non-Road Mobile Sources
TPY TPD TPY TPD TPY TPD
19642.37 65.27 54697.53 174.02 36713.28 105.19
On-Road Mobile Sources Biogenic Sources Total Sources
TPY TPD TPY TPD TPY TPD
NA 306.60 NA 126.09 NA 777.17
Notes: Biogenic emissions are calculated through use of an Environmental Protection Agency software package called PC-BEIS which yields results in U. S. short tons per day; no annual totals are calculated. Annual totals are not required in the On-Road Mobile Sources category per E.P.A. guidelines.

45
Table 6B
Summary of NO Emissions in the Dallas/Fort Worth Nonattainment AreaX
by Source Type
DFW Point Sources Area Sources Non-Road Mobile Sources
TPY TPD TPY TPD TPY TPD
28378.00 108.86 9664.06 19.99 53294.10 174.53
On-Road Mobile Sources Biogenic Sources Total Sources
TPY TPD TPY TPD TPY TPD
NA 293.03 NA NA NA 596.41
Notes: Biogenic emissions are calculated through use of an Environmental Protection Agency software package called PC-BEIS which yields results in U. S. short tons per day; no annual totals are calculated. Annual totals are not required in the On-Road Mobile Sources category per E.P.A. guidelines.

46
Table 6C
Summary of CO Emissions in the Dallas/Fort Worth Nonattainment Area by Source Type
DFW Point Sources Area Sources Non-Road Mobile Sources
TPY TPD TPY TPD TPY TPD
3096.00 13.33 2961.52 4.47 345966.60 1126.98
On-Road Mobile Sources Biogenic Sources Total Sources
TPY TPD TPY TPD TPY TPD
NA 2837.88 NA NA NA 3982.66
Notes: Biogenic emissions are calculated through use of an Environmental Protection Agency software package called PC-BEIS which yields results in U. S. short tons per day; no annual totals are calculated. Annual totals are not required in the On-Road Mobile Sources category per E.P.A. guidelines.
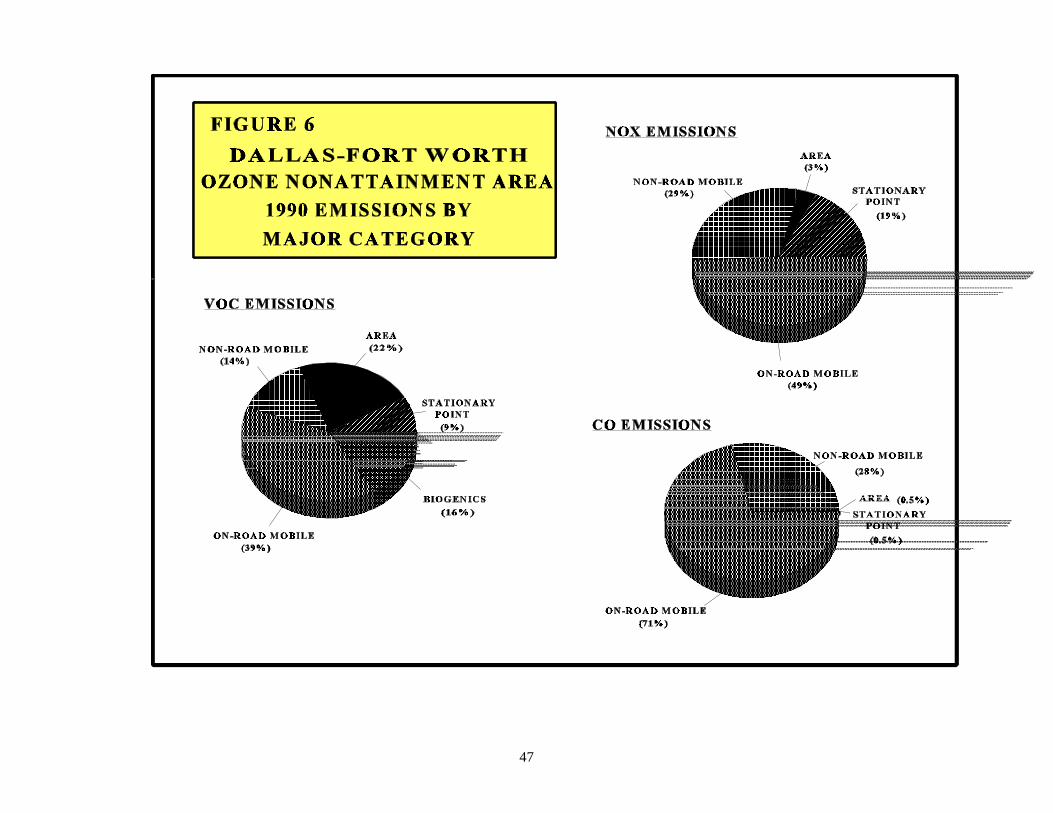
47

48
FIGURE 7
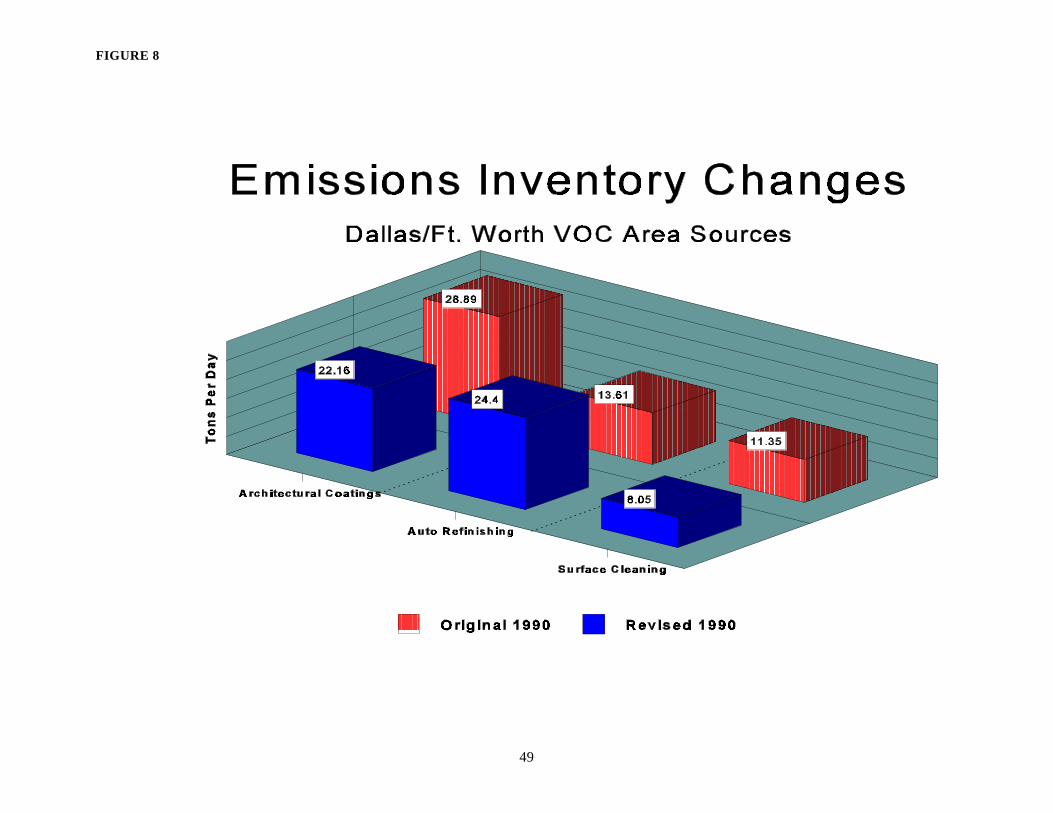
49
FIGURE 8

50
FIGURE 9
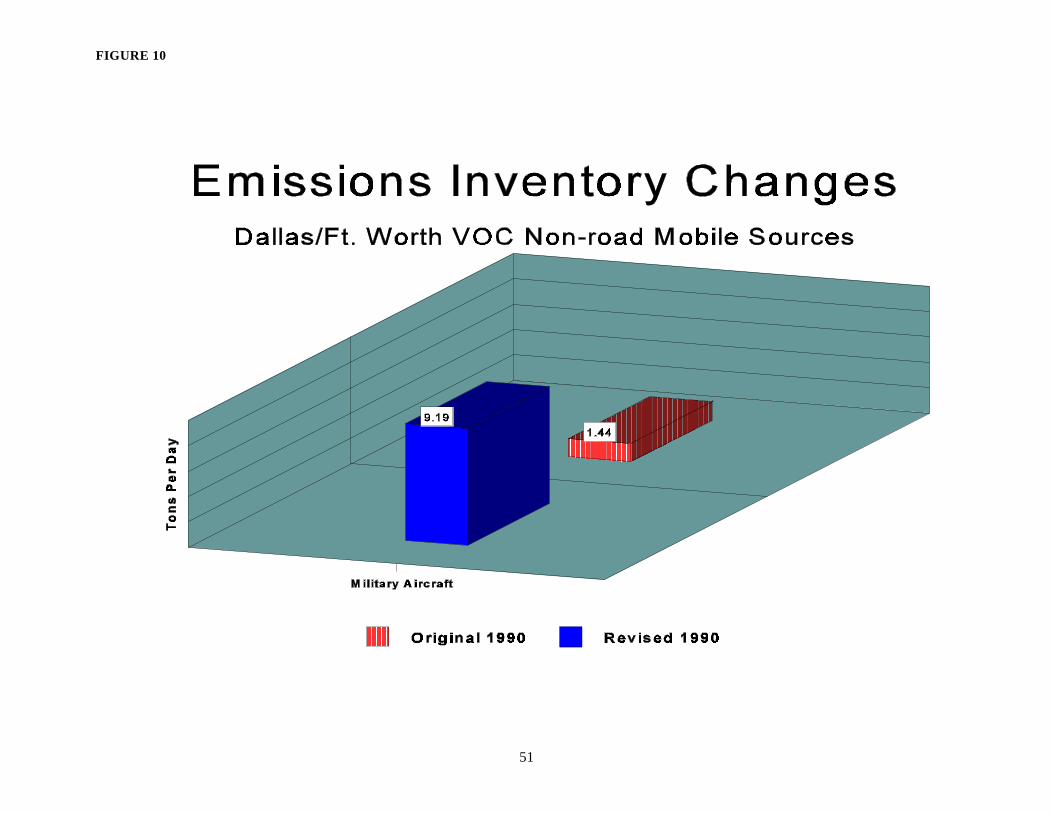
51
FIGURE 10

52
TABLE 7
SUMMARY OF 1990 EMISSIONS FROM AREA SOURCES FOR DALLAS/FT. WORTH (REVISED)VOC VOC NOX NOX CO CO
CATEGORY TPY TPD TPY TPD TPY TPD
OIL & GAS PRODUCTION 38.88 0.11
OIL & GAS PRODUCTION - OFF SHORE 0.00 0.00
SERVICE STATIONS - VEHICLE REFUELING 6204.97 22.3871
SERVICE STATIONS - TANK TRUCK UNLOADING 2818.31 9.0308
SERVICE STATIONS - TANK TRUCKS IN TRANSIT 42.28 0.1158
SERVICE STATIONS - TANK BREATHING LOSSES 873.94 2.3944
SERVICE STATIONS - OTHER 611.76 1.6760
AIRCRAFT REFUELING 138.58 0.3797
MARINE VESSEL LOADING LOSSES 0.00 0.00
SYNTHETIC ORGANIC CHEMICAL STORAGE TANKS 0.00 0.0000
LEAKING UNDERGROUND TANKS 2386.37 1.6100
ARCHITECTURAL COATINGS 6216.22 22.1600
AUTO REFINISHING 6977.00 24.4000
TRAFFIC MARKINGS 890.12 2.4387
FURNITURE & FIXTURES 2311.12 8.8721
METAL CONTAINERS 959.93 3.7213
AUTOMOBILES (NEW) 1203.10 4.4899
MACHINERY & EQUIPMENT 461.93 1.7767
APPLIANCES 107.49 0.4134
OTHER TRANSPORTATION EQUIP. 507.57 2.1117
SHEET, STRIP, & COIL 0.00 0.0000
FACTORY FINISHED WOOD 145.63 0.6178

53
TABLE 7SUMMARY OF 1990 EMISSIONS FROM AREA SOURCES FOR DALLAS/FT. WORTH (REVISED)
VOC VOC NOX NOX CO CO
CATEGORY TPY TPD TPY TPD TPY TPD
ELECTRICAL INSULATION 149.34 0.5744
OTHER PRODUCT COATINGS 195.09 0.7504
HIGH-PERFORMANCE MAINT. 1159.18 4.4584
MARINE COATINGS 9.09 0.0349
OTHER SPEC. PURPOSE COATINGS 1424.19 5.4777
BARGE,TANK,TANK TRUCK,RAIL CAR,DRUM CLEAN. 0.00 0.0000
BREWERIES 0.01 0.0000
WINERIES 0.00 0.0000
DISTILLERIES 0.00 0.0000
CATASTROPHIC/ACCIDENTAL RELEASES 9.80 0.0268
SURFACE CLEANING 2308.46 8.0498
DRY CLEANING 841.16 3.2352
GRAPHIC ARTS 633.85 0.8972
CUTBACK ASPHALT 219.08 0.6002
EMULSIFIED ASPHALT 164.10 0.6312
CONSUMER/COMMERCIAL SOLVENT USE 10884.49 29.8205
PESTICIDE APPLICATION 724.50 3.0188
MUNICIPAL WASTE LANDFILLS 2235.79 6.1255
MUNICIPAL WASTEWATER TREATMENT (POTW) 59.56 0.1632
INDUSTRIAL WASTEWATER TREATMENT 13.03 0.0357
WASTEWATER PACKAGE PLANTS 0.00 0.0000
COMMERCIAL BAKERIES 317.90 0.8709

54
TABLE 7SUMMARY OF 1990 EMISSIONS FROM AREA SOURCES FOR DALLAS/FT. WORTH (REVISED)
VOC VOC NOX NOX CO CO
CATEGORY TPY TPD TPY TPD TPY TPD
STATIONARY SOURCE FUEL COMBUSTION: 0.00 0.00
FUEL OIL-RESIDENTIAL 0.00 0.0000 0.02 0.0000 0.01 0.0000
FUEL OIL-COMMERCIAL/DISTILLATE 6.75 0.0130 396.74 0.7630 99.21 0.1908
FUEL OIL-COMMERCIAL/RESIDUAL 0.49 0.0009 23.66 0.0455 2.14 0.0041
FUEL OIL-INDUSTRIAL/DISTILLATE 23.62 0.0757 2366.35 7.5845 591.57 1.8961
FUEL OIL-INDUSTRIAL/RESIDUAL 0.70 0.0022 315.92 1.0126 27.94 0.0896
COAL-RESIDENTIAL 2.83 0.0000 0.85 0.0000 25.45 0.0000
COAL-COMMERCIAL 0.00 0.0000 0.00 0.0000 0.00 0.0000
COAL-INDUSTRIAL 0.00 0.0000 0.00 0.0000 0.00 0.0000
NATURAL GAS-RESIDENTIAL 156.53 0.1287 2944.75 2.4203 588.96 0.4841
NATURAL GAS-COMMERCIAL 131.66 0.2532 2455.88 4.7228 490.91 0.9441
NATURAL GAS-INDUSTRIAL 16.84 0.0540 842.05 2.6989 210.51 0.6747
LPG-RESIDENTIAL 3.67 0.0030 69.02 0.0567 13.94 0.0115
LPG-COMMERCIAL 3.28 0.0063 61.48 0.1182 12.42 0.0239
LPG-INDUSTRIAL 3.47 0.0111 176.94 0.5671 44.24 0.1418
WOOD-RESIDENTIAL 103.09 0.0000 10.30 0.0000 849.86 0.0000
STRUCTURE FIRES 0.80 0.0023 0.10 0.0001 4.35 0.0118
FOREST FIRES 0.00 0.0000 0.00 0.0000 0.00 0.0000
PRESCRIBED BURNING 0.00 0.0000 0.00 0.0000 0.00 0.0000
SLASH BURNING 0.00 0.0000 0.00 0.0000 0.00 0.0000
OPEN BURNING 0.00 0.0000 0.00 0.0000 0.00 0.0000
ORCHARD HEATERS 0.00 0.0000 0.00 0.0000 0.00 0.0000
AGRICULTURAL BURNING 0.00 0.0000 0.00 0.0000 0.00 0.0000
TOTAL 54697.53 174.0230 9664.06 19.9897 2961.52 4.4723

55
Table 8
Summary of Emissions from Non-Road Mobile Sources for Dallas/Ft. Worth
Category VOC VOC NO NO CO COTPY TPD TPY TPD TPY TPD
X X
Railroad 368.53 1.01 6359.88 17.42 890.07 2.44Locomotives
Commercial 1907.35 5.40 4434.49 12.15 11221.12 30.74Aircraft
Military Aircraft 3354.89 9.19 3234.06 8.86 4292.12 11.76
General Aircraft 178.48 .49 32.98 .09 5661.23 15.51
Vessels .00 .00 .00 .00 .00 .00
Other Non-Road 30904.03 89.10 39232.69 135.29 323902.02 1065.93Engines
Total 36713.28 105.19 53294.1 173.81 345966.56 1126.38

56
Table 9A
Summary of VOC Emissions in the El Paso Nonattainment Area by Source Type
County Point Sources Area Sources Non-Road Mobile Sources
TPY TPD TPY TPD TPY TPD
El Paso 2466.70 9.45 8526.88 24.94 3227.34 10.99
On-Road Mobile Sources Biogenic Sources Total Sources
TPY TPD TPY TPD TPY TPD
NA 39.00 NA 12.62 NA 97.00
Notes: Biogenic emissions are calculated through use of an Environmental Protection Agency software package called PC-BEIS which yields results in U. S. short tons per day; no annual totals are calculated. Annual totals are not required in the On-Road Mobile Sources category per E.P.A. guidelines.

57
Table 9B
Summary of NO Emissions in the El Paso Nonattainment AreaX
by Source Type
County Point Sources Area Sources Non-Road Mobile Sources
TPY TPD TPY TPD TPY TPD
El Paso 7092.00 33.43 1422.14 2.43 4612.67 15.02
On-Road Mobile Sources Biogenic Sources Total Sources
TPY TPD TPY TPD TPY TPD
NA 36.90 NA NA NA 87.78
Notes: Biogenic emissions are calculated through use of an Environmental Protection Agency software package called PC-BEIS which yields results in U. S. short tons per day; no annual totals are calculated. Annual totals are not required in the On-Road Mobile Sources category per E.P.A. guidelines.

58
Table 9C
Summary of CO Emissions in the El Paso Nonattainment Area by Source Type
County Point Sources Area Sources Non-Road Mobile Sources
TPY TPD TPY TPD TPY TPD
El Paso 2634.00 7.41 1201.97 2.64 33499.69 106.69
On-Road Mobile Sources Biogenic Sources Total Sources
TPY TPD TPY TPD TPY TPD
NA 327.10 NA NA NA 443.84
Notes: Biogenic emissions are calculated through use of an Environmental Protection Agency software package called PC-BEIS which yields results in U. S. short tons per day; no annual totals are calculated. Annual totals are not required in the On-Road Mobile Sources category per E.P.A. guidelines.

59

60
FIGURE 12

61
FIGURE 13

62
FIGURE 14

63
TABLE 10SUMMARY OF 1990 EMISSIONS FROM AREA SOURCES FOR EL PASO COUNTY (REVISED)
VOC VOC NOX NOX CO CO CATEGORY TPY TPD TPY TPD TPY TPD
OIL & GAS PRODUCTION 0.00 0.0000 SERVICE STATIONS - VEHICLE REFUELING 1137.68 2.2987 SERVICE STATIONS - TANK TRUCK UNLOADING 264.52 0.8478 SERVICE STATIONS - TANK TRUCKS IN TRANSIT 3.72 0.0102 SERVICE STATIONS - TANK BREATHING LOSSES 103.43 0.2834 SERVICE STATIONS - OTHER 72.40 0.1984 AIRCRAFT REFUELING 0.58 0.0016 SYNTHETIC ORGANIC CHEMICAL STORAGE TANKS 0.00 0.0000 LEAKING UNDERGROUND TANKS 413.91 0.0140 ARCHITECTURAL COATINGS 1033.23 3.6800 AUTO REFINISHING 1159.00 4.0500 TRAFFIC MARKINGS 147.90 0.4052 FURNITURE & FIXTURES 68.44 0.2632 METAL CONTAINERS 0.00 0.0000 AUTOMOBILES (NEW) 0.00 0.0000 MACHINERY & EQUIPMENT 77.52 0.2982 APPLIANCES 0.00 0.0000 OTHER TRANSPORTATION EQUIP. 3.92 0.0151 SHEET, STRIP, & COIL 0.00 0.0000 FACTORY FINISHED WOOD 38.12 0.1466

64
TABLE 10SUMMARY OF 1990 EMISSIONS FROM AREA SOURCES FOR EL PASO COUNTY (REVISED)
VOC VOC NOX NOX CO CO CATEGORY TPY TPD TPY TPD TPY TPD
ELECTRICAL INSULATION 17.97 0.0691 OTHER PRODUCT COATINGS 173.48 0.6672 HIGH-PERFORMANCE MAINT. 136.64 0.5256 MARINE COATINGS 0.00 0.0000 OTHER SPEC. PURPOSE COATINGS 236.64 0.9102 BARGE,TANK,TANK TRUCK,RAIL CAR,DRUM CLEAN. 0.00 0.0000 BREWERIES 0.00 0.0000 WINERIES 0.03 0.0001 DISTILLERIES 0.00 0.0000 CATASTROPHIC/ACCIDENTAL RELEASES 0.00 0.0000 SURFACE CLEANING 383.57 1.3376 DRY CLEANING 139.77 0.5376 GRAPHIC ARTS 384.55 1.4790 CUTBACK ASPHALT 0.00 0.0000 EMULSIFIED ASPHALT 1863.57 5.1057 CONSUMER/COMMERCIAL SOLVENT USE 22.00 0.0603 PESTICIDE APPLICATION 77.00 0.3208 MUNICIPAL WASTE LANDFILLS 132.38 0.3627 MUNICIPAL WASTEWATER TREATMENT (POTW) 5.76 0.0158 INDUSTRIAL WASTEWATER TREATMENT 0.99 0.0027 WASTEWATER PACKAGE PLANTS 0.00 0.0000 COMMERCIAL BAKERIES 76.99 0.2109

65
TABLE 10SUMMARY OF 1990 EMISSIONS FROM AREA SOURCES FOR EL PASO COUNTY (REVISED)
VOC VOC NOX NOX CO CO CATEGORY TPY TPD TPY TPD TPY TPD
STATIONARY SOURCE FUEL COMBUSTION: FUEL OIL-RESIDENTIAL 0.00 0.0000 0.00 0.0000 0.00 0.0000 FUEL OIL-COMMERCIAL/DISTILLATE 0.02 0.0000 1.22 0.0023 0.30 0.0006 FUEL OIL-COMMERCIAL/RESIDUAL 0.00 0.0000 0.07 0.0001 0.00 0.0000 FUEL OIL-INDUSTRIAL/DISTILLATE 1.09 0.0035 262.36 0.8409 65.59 0.2102 FUEL OIL-INDUSTRIAL/RESIDUAL 0.18 0.0006 35.75 0.1146 3.25 0.0104 COAL-RESIDENTIAL 0.00 0.0000 0.00 0.0000 0.00 0.0000 COAL-COMMERCIAL 0.00 0.0000 0.00 0.0000 0.00 0.0000 COAL-INDUSTRIAL 0.00 0.0000 0.00 0.0000 0.00 0.0000 NATURAL GAS-RESIDENTIAL 39.08 0.0321 737.42 0.6061 78.47 0.0645 NATURAL GAS-COMMERCIAL 1.93 0.0037 218.76 0.4207 40.97 0.0788 NATURAL GAS-INDUSTRIAL 1.26 0.0040 63.12 0.2023 15.78 0.0506 LPG-RESIDENTIAL 1.02 0.0008 19.21 0.0158 3.88 0.0032 LPG-COMMERCIAL 0.30 0.0006 5.68 0.0109 1.15 0.0022 LPG-INDUSTRIAL 0.39 0.0013 19.61 0.0629 4.90 0.0157 WOOD-RESIDENTIAL 22.28 0.0000 2.22 0.0000 183.71 0.0000 STRUCTURE FIRES 0.13 0.0003 0.02 0.0000 0.72 0.0020 FOREST FIRES 0.00 0.0000 0.00 0.0000 0.00 0.0000 PRESCRIBED BURNING 0.00 0.0000 0.00 0.0000 0.00 0.0000 SLASH BURNING 0.00 0.0000 0.00 0.0000 0.00 0.0000 OPEN BURNING 283.50 0.7767 56.70 0.1553 803.25 2.2007 ORCHARD HEATERS 0.00 0.0000 0.00 0.0000 0.00 0.0000 AGRICULTURAL BURNING 0.00 0.0000 0.00 0.0000 0.00 0.0000
TOTAL 8526.88 24.9411 1422.14 2.4320 1201.97 2.6389

66
Table 11
Summary of Emissions from Non-Road Mobile Sources for El Paso
Category VOC VOC NO NO CO COTPY TPD TPY TPD TPY TPD
X X
Railroad 18.84 .05 410.27 1.12 53.13 .15Locomotives
Commercial 105.92 .29 225.06 .62 454.28 1.24Aircraft
Military Aircraft 53.25 .14 22.82 .06 31.10 .09
General Aircraft 18.37 .05 3.03 .01 560.13 1.53
Vessels .00 .00 .00 .00 .00 .00
Other Non-Road 3030.96 10.46 3951.49 13.21 32401.05 103.68Engines
Total 3227.34 10.99 4612.67 15.02 33499.69 106.69

67
TABLE 12 SUMMARY OF 1990 EMISSIONS FROM SMALL ENGINE SOURCES FOR
THE EL PASO NONATTAINMENT AREA ALL ENGINES (2-CYCLE + 4-CYCLE + DIESEL) VOC VOC NOX NOX CO CO
Class EQUIPMENT TYPES TPY TPD TPY TPD TPY TPD1 Trimmers/Edgers/Brush Cutters 129.00 0.48 0.00 0.00 353.00 1.31 1 Lawn Mowers 505.96 1.93 5.49 0.01 3127.05 11.66 1 Leaf Blowers/Vacuums 28.00 0.10 0.00 0.00 83.00 0.31 1 Rear Engine Riding Mowers 15.00 0.06 0.00 0.00 377.00 1.41 1 Front Mowers 5.00 0.02 0.00 0.00 104.00 0.39 1 Chainsaws <4 HP 89.00 0.25 0.00 0.00 178.00 0.49 1 Shredders <5 HP 1.00 0.01 0.00 0.00 7.00 0.03 1 Tillers <5 HP 32.00 0.12 0.00 0.00 267.00 1.00 1 Lawn & Garden Tractors 95.00 0.37 9.00 0.03 2411.00 8.98 1 Wood Splitters 4.00 0.02 0.00 0.00 38.00 0.14 1 Snowblowers 0.00 0.00 0.00 0.00 0.00 0.00 1 Chippers/Stump Grinders 28.00 0.11 6.00 0.02 226.00 0.84 1 Commercial Turf Equipment 116.00 0.45 5.00 0.02 3603.00 13.43 1 Other Lawn & Garden Equipment 3.00 0.01 0.00 0.00 14.00 0.06
Subtotal 1050.96 3.93 25.49 0.08 10788.05 40.05
2 Aircraft Support Equipment 7.00 0.02 34.00 0.09 73.00 0.20 2 Terminal Tractors 69.00 0.19 436.00 1.19 610.00 1.68
Subtotal 76.00 0.21 470.00 1.28 683.00 1.88
3 All Terrain Vehicles (ATVs) 121.00 0.50 1.00 0.00 561.00 2.27 3 Minibikes 2.00 0.01 0.00 0.00 11.00 0.04 3 Off-Road Motorcycles 53.00 0.22 0.00 0.00 79.00 0.32 3 Golf Carts 208.00 0.86 1.00 0.00 761.00 3.08 3 Snowmobiles 0.00 0.00 0.00 0.00 0.00 0.00 3 Specialty Vehicles Carts 57.00 0.24 0.00 0.00 96.00 0.39
Subtotal 441.00 1.83 2.00 0.00 1508.00 6.10

68
TABLE 12 SUMMARY OF 1990 EMISSIONS FROM SMALL ENGINE SOURCES FOR
THE EL PASO NONATTAINMENT AREA ALL ENGINES (2-CYCLE + 4-CYCLE + DIESEL) VOC VOC NOX NOX CO CO
Class EQUIPMENT TYPES TPY TPD TPY TPD TPY TPD4 Vessels w/Inboard Engines 0.00 0.00 0.00 0.00 0.00 0.00 4 Vessels w/Outboard Engines 0.00 0.00 0.00 0.00 0.00 0.00 4 Vessels w/Sterndrive Engines 0.00 0.00 0.00 0.00 0.00 0.00 4 Sailboat Auxiliary Inboard Engines 0.00 0.00 0.00 0.00 0.00 0.00 4 Sailboat Auxiliary Outboard Engines 0.00 0.00 0.00 0.00 0.00 0.00
Subtotal 0.00 0.00 0.00 0.00 0.00 0.00
5 Generator Sets <50 HP 470.00 1.32 42.00 0.11 6830.00 18.71 5 Pumps <50 HP 82.00 0.24 17.00 0.05 1789.00 4.90 5 Air Compressors <50 HP 46.00 0.13 8.00 0.02 1180.00 3.23 5 Gas Compressors <50 HP 2.00 0.00 1.00 0.00 29.00 0.08 5 Welders <50 HP 77.00 0.22 35.00 0.10 1970.00 5.40 5 Pressure Washers <50 HP 24.00 0.07 1.00 0.00 549.00 1.50
Subtotal 701.00 1.98 104.00 0.28 12347.00 33.82
6 Aerial Lifts 26.00 0.09 27.00 0.07 468.00 1.28 6 Forklifts 205.00 0.59 412.00 1.13 3203.00 8.77 6 Sweepers/Scrubbers 31.00 0.09 164.00 0.44 331.00 0.91 6 Other General Industrial Equipment 34.00 0.10 54.00 0.15 231.00 0.63 6 Other Material Handling Equipment 2.00 0.00 7.00 0.02 23.00 0.06
Subtotal 298.00 0.87 664.00 1.81 4256.00 11.65

69
TABLE 12 SUMMARY OF 1990 EMISSIONS FROM SMALL ENGINE SOURCES FOR
THE EL PASO NONATTAINMENT AREA ALL ENGINES (2-CYCLE + 4-CYCLE + DIESEL) VOC VOC NOX NOX CO CO
Class EQUIPMENT TYPES TPY TPD TPY TPD TPY TPD7 Asphalt Pavers 1.00 0.00 13.00 0.04 13.00 0.04 7 Tampers/Rammers 12.00 0.04 0.00 0.00 24.00 0.09 7 Plate Compactors 24.00 0.09 0.00 0.00 115.00 0.41 7 Concrete Pavers 1.00 0.00 7.00 0.03 3.00 0.01 7 Rollers 8.00 0.03 30.00 0.11 90.00 0.33 7 Scrapers 12.00 0.04 143.00 0.52 82.00 0.30 7 Paving Equipment 29.00 0.11 53.00 0.19 246.00 0.90 7 Surfacing Equipment 4.00 0.01 0.00 0.00 67.00 0.24 7 Signal Boards 0.00 0.00 2.00 0.01 4.00 0.02 7 Trenchers 8.00 0.02 26.00 0.10 102.00 0.37 7 Bore/Drill Rigs 6.00 0.02 22.00 0.08 53.00 0.19 7 Excavators 7.00 0.03 106.00 0.39 51.00 0.19 7 Concrete/Industrial Saws 12.00 0.05 1.00 0.00 256.00 0.93 7 Cement and Mortar Mixers 6.00 0.02 0.00 0.00 97.00 0.35 7 Cranes 26.00 0.09 198.00 0.72 102.00 0.37 7 Graders 25.00 0.09 149.00 0.54 59.00 0.21 7 Off-Highway Trucks 24.00 0.08 260.00 0.94 76.00 0.27 7 Crushing/Proc. Equipment 5.00 0.01 26.00 0.10 34.00 0.12 7 Rough Terrain Forklifts 11.00 0.04 45.00 0.16 79.00 0.28 7 Rubber Tired Loaders 36.00 0.13 412.00 1.48 215.00 0.77 7 Rubber Tired Dozers 4.00 0.02 46.00 0.17 13.00 0.05 7 Tractors/Loaders/Backhoes 35.00 0.12 238.00 0.86 175.00 0.64 7 Crawler Tractors 58.00 0.21 459.00 1.66 214.00 0.77 7 Skid Steer Loaders 15.00 0.05 53.00 0.19 113.00 0.41 7 Off-Highway Tractors 39.00 0.14 183.00 0.67 226.00 0.82 7 Dumpers/Tenders 1.00 0.00 0.00 0.00 15.00 0.05 7 Other Construction Equipment 4.00 0.01 23.00 0.08 43.00 0.15
Subtotal 413.00 1.45 2495.00 9.04 2567.00 9.28

70
TABLE 12 SUMMARY OF 1990 EMISSIONS FROM SMALL ENGINE SOURCES FOR
THE EL PASO NONATTAINMENT AREA ALL ENGINES (2-CYCLE + 4-CYCLE + DIESEL) VOC VOC NOX NOX CO CO
Class EQUIPMENT TYPES TPY TPD TPY TPD TPY TPD8 2-Wheel Tractors 0.00 0.00 0.00 0.00 1.00 0.00 8 Agricultural Tractors 34.00 0.13 167.00 0.62 139.00 0.52 8 Agricultural Mowers 0.00 0.00 0.00 0.00 1.00 0.00 8 Combines 1.00 0.00 10.00 0.04 4.00 0.01 8 Sprayers 0.00 0.00 0.00 0.00 4.00 0.01 8 Balers 0.00 0.00 0.00 0.00 0.00 0.00 8 Tillers >5 HP 3.00 0.01 0.00 0.00 22.00 0.08 8 Swathers 4.00 0.02 4.00 0.02 52.00 0.19 8 Hydro Power Units 0.00 0.00 0.00 0.00 4.00 0.01 8 Other Agricultural Equipment 2.00 0.01 10.00 0.04 5.00 0.03
Subtotal 44.00 0.17 191.00 0.72 232.00 0.85
9 Chainsaws >4 HP 7.00 0.02 0.00 0.00 20.00 0.05 9 Shredders >5 HP 0.00 0.00 0.00 0.00 0.00 0.00 9 Skidders 0.00 0.00 0.00 0.00 0.00 0.00 9 Fellers/Bunchers 0.00 0.00 0.00 0.00 0.00 0.00
Subtotal 7.00 0.02 0.00 0.00 20.00 0.05
Grand Total 3030.96 10.46 3951.49 13.21 32401.05 103.68
1 = Lawn & Garden 4 = Recreational Marine 7 = Construction 2 = Airport Service 5 = Light Commercial 8 = Agricultural3 = Recreational 6 = Industrial 9 = Logging

71
Table 13A
Summary of VOC Emissions in the Houston/Galveston Nonattainment Area by Source Type
HGA Point Sources Area Sources Non-Road Mobile Sources
TPY TPD TPY TPD TPY TPD
165969.34 483.38 63809.96 200.07 47218.33 129.99
On-Road Mobile Sources Biogenic Sources Total Sources
TPY TPD TPY TPD TPY TPD
NA 251.72 NA 335.47 NA 1400.63
Notes: Biogenic emissions are calculated through use of an Environmental Protection Agency software package called PC-BEIS which yields results in U. S. short tons per day; no annual totals are calculated. Annual totals are not required in the On-Road Mobile Sources category per E.P.A. guidelines.

72
Table 13B
Summary of NO Emissions in the Houston/Galveston Nonattainment AreaX
by Source Type
HGA Point Sources Area Sources Non-Road Mobile Sources
TPY TPD TPY TPD TPY TPD
267491.00 780.65 7407.49 14.37 61838.58 198.52
On-Road Mobile Sources Biogenic Sources Total Sources
TPY TPD TPY TPD TPY TPD
NA 337.03 NA NA NA 1330.57
Notes: Biogenic emissions are calculated through use of an Environmental Protection Agency software package called PC-BEIS which yields results in U. S. short tons per day; no annual totals are calculated. Annual totals are not required in the On-Road Mobile Sources category per E.P.A. guidelines.

73
Table 13C
Summary of CO Emissions in the Houston/Galveston Nonattainment Area by Source Type
HGA Point Sources Area Sources Non-Road Mobile Sources
TPY TPD TPY TPD TPY TPD
119864.00 334.38 11809.11 28.03 344988.76 1150.32
On-Road Mobile Sources Biogenic Sources Total Sources
TPY TPD TPY TPD TPY TPD
NA 2412.68 NA NA NA 3925.41
Notes: Biogenic emissions are calculated through use of an Environmental Protection Agency software package called PC-BEIS which yields results in U. S. short tons per day; no annual totals are calculated. Annual totals are not required in the On-Road Mobile Sources category per E.P.A. guidelines.

74

75
FIGURE 16

76
FIGURE 17

77
FIGURE 18

78
FIGURE 19

79
TABLE 14SUMMARY OF 1990 EMISSIONS FROM AREA SOURCES FOR HOUSTON/GALVESTON (REVISED)
VOC VOC NOX NOX CO CO
CATEGORY TPY TPD TPY TPD TPY TPD
OIL & GAS PRODUCTION 1947.30 5.1242
OIL & GAS PRODUCTION - OFF SHORE 113.51 0.2620 591.20 1.6197 74.65 0.2045
SERVICE STATIONS - VEHICLE REFUELING 6580.94 20.7928
SERVICE STATIONS - TANK TRUCK UNLOADING 3813.18 12.2265
SERVICE STATIONS - TANK TRUCKS IN TRANSIT 56.85 0.5517
SERVICE STATIONS - TANK BREATHING LOSSES 901.50 2.4699
SERVICE STATIONS - OTHER 631.05 1.7289
AIRCRAFT REFUELING 10.38 0.0284
MARINE VESSEL LOADING LOSSES 0.00 0.0000
SYNTHETIC ORGANIC CHEMICAL STORAGE TANKS 0.00 0.0000
LEAKING UNDERGROUND TANKS 2166.64 1.8200
ARCHITECTURAL COATINGS 6519.47 23.2300
AUTO REFINISHING 7312.00 25.5655
TRAFFIC MARKINGS 932.78 2.5556
FURNITURE & FIXTURES 697.14 2.6813
METAL CONTAINERS 1355.21 6.1074
AUTOMOBILES (NEW) 0.00 0.0000
MACHINERY & EQUIPMENT 453.36 1.7437
APPLIANCES 0.00 0.0000
OTHER TRANSPORTATION EQUIP. 14.63 0.0563
SHEET, STRIP, & COIL 0.00 0.0000
FACTORY FINISHED WOOD 51.21 1.1653

80
TABLE 14SUMMARY OF 1990 EMISSIONS FROM AREA SOURCES FOR HOUSTON/GALVESTON (REVISED)
VOC VOC NOX NOX CO CO
CATEGORY TPY TPD TPY TPD TPY TPD
ELECTRICAL INSULATION 0.00 0.0000
OTHER PRODUCT COATINGS 236.88 0.9110
HIGH-PERFORMANCE MAINT. 1186.36 4.5630
MARINE COATINGS 244.09 0.9388
OTHER SPEC. PURPOSE COATINGS 1492.45 5.7400
BARGE,TANK,TANK TRUCK,RAIL CAR,DRUM CLEAN. 0.00 0.0000
BREWERIES 0.00 0.0000
WINERIES 0.00 0.0000
DISTILLERIES 0.00 0.0000
CATASTROPHIC/ACCIDENTAL RELEASES 160.24 0.4390
SURFACE CLEANING 2419.10 8.4400
DRY CLEANING 881.48 3.3903
GRAPHIC ARTS 2356.97 8.7314
CUTBACK ASPHALT 184.94 0.5067
EMULSIFIED ASPHALT 80.40 0.3092
CONSUMER/COMMERCIAL SOLVENT USE 11753.06 32.2002
PESTICIDE APPLICATION 826.00 3.4417
MUNICIPAL WASTE LANDFILLS 2555.74 7.0020
MUNICIPAL WASTEWATER TREATMENT (POTW) 13.10 0.0374
INDUSTRIAL WASTEWATER TREATMENT 4857.24 13.3075
WASTEWATER PACKAGE PLANTS 0.00 0.0000
COMMERCIAL BAKERIES 260.16 0.7128

81
TABLE 14SUMMARY OF 1990 EMISSIONS FROM AREA SOURCES FOR HOUSTON/GALVESTON (REVISED)
VOC VOC NOX NOX CO CO
CATEGORY TPY TPD TPY TPD TPY TPD
STATIONARY SOURCE FUEL COMBUSTION: 0.00 0.00
FUEL OIL-RESIDENTIAL 0.00 0.0000 0.08 0.0001 0.00 0.0000
FUEL OIL-COMMERCIAL/DISTILLATE 5.87 0.0113 345.98 0.6653 86.46 0.1663
FUEL OIL-COMMERCIAL/RESIDUAL 0.42 0.0008 20.61 0.0396 1.89 0.0036
FUEL OIL-INDUSTRIAL/DISTILLATE 1.08 0.0035 1430.70 4.5856 357.67 1.1464
FUEL OIL-INDUSTRIAL/RESIDUAL 0.98 0.0031 194.97 0.6249 17.69 0.0567
COAL-RESIDENTIAL 2.53 0.0021 0.76 0.0000 22.72 0.0000
COAL-COMMERCIAL 0.00 0.0000 0.00 0.0000 0.00 0.0000
COAL-INDUSTRIAL 0.00 0.0000 0.00 0.0000 0.00 0.0000
NATURAL GAS-RESIDENTIAL 137.89 0.1133 2602.17 2.1388 520.40 0.4277
NATURAL GAS-COMMERCIAL 114.66 0.2205 1563.65 3.0070 372.98 0.7173
NATURAL GAS-INDUSTRIAL 6.89 0.0221 344.21 1.1032 86.05 0.2758
LPG-RESIDENTIAL 6.59 0.0054 124.29 0.1022 25.10 0.0206
LPG-COMMERCIAL 2.83 0.0054 53.71 0.1033 10.83 0.0208
LPG-INDUSTRIAL 2.11 0.0068 107.02 0.3430 26.75 0.0857
WOOD-RESIDENTIAL 135.18 0.0000 13.49 0.0000 1114.55 0.0000
STRUCTURE FIRES 0.79 0.0020 0.12 0.0002 4.56 0.0123
FOREST FIRES 79.89 0.2189 13.32 0.0365 468.71 1.2841
PRESCRIBED BURNING 54.83 0.1502 0.00 0.0000 1958.43 5.3655
SLASH BURNING 185.98 0.5095 0.00 0.0000 6642.45 18.1985
OPEN BURNING 6.08 0.0166 1.22 0.0033 17.21 0.0472
ORCHARD HEATERS 0.00 0.0000 0.00 0.0000 0.00 0.0000
AGRICULTURAL BURNING 0.00 0.0000 0.00 0.0000 0.00 0.0000
TOTAL 63809.96 200.07 7407.49 14.37 11809.09 28.03

82
Table 15
Summary of Emissions from Non-Road Mobile Sources for Houston/Galveston
Category VOC VOC NO NO CO COTPY TPD TPY TPD TPY TPD
X X
Railroad 406.78 1.11 6438.43 17.64 930.37 2.55Locomotives
Commercial 664.95 1.82 1692.32 4.63 2840.93 7.78Aircraft
Military Aircraft 412.03 1.13 176.58 .48 240.76 .66
General Aircraft 181.74 .50 29.98 .08 5541.78 15.18
Vessels 1391.00 3.81 14977.00 41.03 2131.00 5.84
Other Non-Road 44161.61 121.62 38524.27 134.65 333303.92 1118.32Engines
Total 47218.11 129.99 61838.58 198.51 344988.76 1150.33

83
TABLE 16 SUMMARY OF 1990 EMISSIONS FROM SMALL ENGINE SOURCES FOR
THE HOUSTON-GALVESTON NONATTAINMENT AREA ALL ENGINES (2-CYCLE + 4-CYCLE + DIESEL) VOC VOC NOX NOX CO CO
Class EQUIPMENT TYPES TPY TPD TPY TPD TPY TPD1 Trimmers/Edgers/Brush Cutters 1431.19 5.35 2.58 0.01 3918.28 14.60 1 Lawn Mowers 9481.59 22.95 32.28 0.93 37185.69 138.56 1 Leaf Blowers/Vacuums 477.35 1.79 0.99 0.00 1397.97 5.21 1 Rear Engine Riding Mowers 145.42 0.58 4.69 0.01 3593.78 13.39 1 Front Mowers 52.31 0.22 1.17 0.00 979.22 3.65 1 Chainsaws <4 HP 1956.08 5.37 2.81 0.00 3908.38 10.71 1 Shredders <5 HP 12.21 0.04 0.08 0.00 94.30 0.34 1 Tillers <5 HP 199.80 0.76 1.65 0.00 1673.93 6.20 1 Lawn & Garden Tractors 817.03 3.22 75.82 0.27 20754.53 77.32 1 Wood Splitters 53.76 0.22 0.49 0.00 474.50 1.78 1 Snowblowers 0.00 0.00 0.00 0.00 3.53 0.00 1 Chippers/Stump Grinders 347.77 1.32 67.68 0.25 2801.25 10.45 1 Commercial Turf Equipment 1441.42 5.58 56.34 0.21 44628.79 166.28 1 Other Lawn & Garden Equipment 42.56 0.14 0.16 0.00 182.00 0.68
Subtotal 16458.49 47.54 246.74 1.68 121596.15 449.17
2 Aircraft Support Equipment 39.73 0.11 201.49 0.55 426.74 1.17 2 Terminal Tractors 404.65 1.11 2541.86 6.96 3523.27 9.65
Subtotal 444.38 1.22 2743.35 7.51 3950.01 10.82
3 All Terrain Vehicles (ATVs) 389.39 1.61 3.20 0.00 1724.51 7.00 3 Minibikes 50.22 0.21 0.64 0.00 325.19 1.31 3 Off-Road Motorcycles 191.00 0.78 0.68 0.00 275.35 1.12 3 Golf Carts 703.40 2.88 4.20 0.00 2402.22 9.74 3 Snowmobiles 45.48 0.19 0.67 0.00 346.65 1.41 3 Specialty Vehicles Carts 206.08 0.84 0.57 0.00 330.96 1.34
Subtotal 1585.57 6.51 9.96 0.00 5404.88 21.92

84
TABLE 16 SUMMARY OF 1990 EMISSIONS FROM SMALL ENGINE SOURCES FOR
THE HOUSTON-GALVESTON NONATTAINMENT AREA ALL ENGINES (2-CYCLE + 4-CYCLE + DIESEL) VOC VOC NOX NOX CO CO
Class EQUIPMENT TYPES TPY TPD TPY TPD TPY TPD4 Vessels w/Inboard Engines 412.88 2.00 107.34 0.57 2675.00 14.06 4 Vessels w/Outboard Engines 12426.69 20.48 104.57 0.20 20033.59 39.05 4 Vessels w/Sterndrive Engines 922.32 4.79 286.84 1.52 9886.74 52.04 4 Sailboat Auxiliary Inboard Engines 1.28 0.01 1.49 0.01 2.78 0.01 4 Sailboat Auxiliary Outboard Engines 5.86 0.02 0.05 0.00 11.00 0.05
Subtotal 13769.03 27.30 500.29 2.30 32609.11 105.21
5 Generator Sets <50 HP 2778.08 9.22 360.57 1.20 64824.08 214.98 5 Pumps <50 HP 744.79 2.10 158.35 0.42 16186.85 44.36 5 Air Compressors <50 HP 417.93 1.19 80.06 0.19 10673.37 29.22 5 Gas Compressors <50 HP 15.48 0.04 13.92 0.04 290.40 0.80 5 Welders <50 HP 701.35 2.02 324.25 0.88 17822.86 48.81 5 Pressure Washers <50 HP 216.49 0.63 7.08 0.02 4969.11 13.61
Subtotal 4874.12 15.20 944.23 2.75 114766.67 351.78
6 Aerial Lifts 130.61 0.37 139.10 0.36 2419.14 6.61 6 Forklifts 1056.51 3.03 2086.08 5.72 16469.40 45.12 6 Sweepers/Scrubbers 153.59 0.41 777.50 2.12 1567.72 4.28 6 Other General Industrial Equipment 160.08 0.43 259.63 0.69 1101.65 2.99 6 Other Material Handling Equipment 9.18 0.02 37.20 0.10 110.73 0.30
Subtotal 1509.97 4.26 3299.51 8.99 21668.64 59.30

85
TABLE 16 SUMMARY OF 1990 EMISSIONS FROM SMALL ENGINE SOURCES FOR
THE HOUSTON-GALVESTON NONATTAINMENT AREA ALL ENGINES (2-CYCLE + 4-CYCLE + DIESEL) VOC VOC NOX NOX CO CO
Class EQUIPMENT TYPES TPY TPD TPY TPD TPY TPD7 Asphalt Pavers 14.10 0.05 143.61 0.52 152.97 0.54 7 Tampers/Rammers 138.40 0.50 0.11 0.00 292.77 1.06 7 Plate Compactors 288.84 1.04 6.04 0.03 1359.16 4.91 7 Concrete Pavers 8.85 0.03 78.39 0.30 35.75 0.12 7 Rollers 85.73 0.30 311.30 1.12 1053.87 3.83 7 Scrapers 94.50 0.34 1142.11 4.13 656.39 2.39 7 Paving Equipment 337.39 1.23 626.77 2.25 2900.85 10.48 7 Surfacing Equipment 42.63 0.15 4.01 0.01 787.22 2.83 7 Signal Boards 6.04 0.02 26.72 0.10 51.53 0.17 7 Trenchers 93.13 0.32 312.78 1.11 1199.63 4.32 7 Bore/Drill Rigs 64.81 0.22 256.24 0.92 617.85 2.24 7 Excavators 102.96 0.37 1536.84 5.57 743.39 2.67 7 Concrete/Industrial Saws 145.16 0.54 16.60 0.05 3018.32 10.91 7 Cement and Mortar Mixers 65.25 0.24 8.60 0.03 1137.73 4.11 7 Cranes 306.32 1.09 2329.15 8.43 1186.01 4.27 7 Graders 218.54 0.79 1322.43 4.79 523.47 1.89 7 Off-Highway Trucks 174.59 0.61 1927.93 6.97 562.31 2.03 7 Crushing/Proc. Equipment 47.64 0.16 310.62 1.13 391.21 1.44 7 Rough Terrain Forklifts 129.09 0.46 537.30 1.94 920.32 3.32 7 Rubber Tired Loaders 340.53 1.21 3873.91 14.00 2067.93 7.47 7 Rubber Tired Dozers 49.46 0.18 546.66 1.98 159.45 0.57 7 Tractors/Loaders/Backhoes 410.79 1.48 2820.10 10.20 2054.32 7.42 7 Crawler Tractors 765.09 2.74 6048.30 21.87 2818.62 10.19 7 Skid Steer Loaders 162.50 0.57 569.65 2.05 1273.08 4.59 7 Off-Highway Tractors 459.89 1.65 2159.97 7.82 2662.34 9.63 7 Dumpers/Tenders 9.59 0.03 1.25 0.00 175.29 0.62 7 Other Construction Equipment 50.50 0.16 279.69 1.02 494.29 1.81
Subtotal 4612.32 16.48 27197.08 98.34 29296.07 105.83

86
TABLE 16 SUMMARY OF 1990 EMISSIONS FROM SMALL ENGINE SOURCES FOR
THE HOUSTON-GALVESTON NONATTAINMENT AREA ALL ENGINES (2-CYCLE + 4-CYCLE + DIESEL) VOC VOC NOX NOX CO CO
Class EQUIPMENT TYPES TPY TPD TPY TPD TPY TPD8 2-Wheel Tractors 0.98 0.00 0.15 0.00 15.84 0.05 8 Agricultural Tractors 631.57 2.31 3060.94 11.38 2546.77 9.51 8 Agricultural Mowers 0.95 0.00 0.10 0.00 19.00 0.06 8 Combines 22.51 0.07 189.08 0.69 89.00 0.35 8 Sprayers 4.11 0.00 2.50 0.00 72.24 0.27 8 Balers 0.33 0.00 1.13 0.00 0.57 0.00 8 Tillers >5 HP 40.03 0.16 0.32 0.00 343.37 1.29 8 Swathers 18.78 0.06 72.43 0.27 101.56 0.37 8 Hydro Power Units 3.25 0.00 1.06 0.00 66.66 0.24 8 Other Agricultural Equipment 7.01 0.00 33.25 0.13 36.51 0.16
Subtotal 729.52 2.60 3360.96 12.47 3291.52 12.30
9 Chainsaws >4 HP 154.02 0.43 0.43 0.00 444.75 1.23 9 Shredders >5 HP 7.15 0.03 0.21 0.00 174.19 0.47 9 Skidders 9.58 0.03 124.52 0.34 57.30 0.16 9 Fellers/Bunchers 7.45 0.02 96.99 0.26 44.64 0.12
Subtotal 178.20 0.51 222.15 0.60 720.88 1.98
Grand Total 44161.61 121.62 38524.27 134.65 333303.92 1118.32
1 = Lawn & Garden 4 = Recreational Marine 7 = Construction 2 = Airport Service 5 = Light Commercial 8 = Agricultural
3 = Recreational 6 = Industrial 9 = Logging