revised supporting information
TRANSCRIPT

S-1
Supporting Information Electrochemical Size Measurement and Characterization of
Electrodeposited Platinum Nanoparticles at Nanometer Resolution with Scanning Electrochemical Microscopy
Wei Maa, Keke Hub, QianJin Chena, Min Zhoua, Michael V. Mirkinb, Allen J. Barda*
aCenter for Electrochemistry, Department of Chemistry, The University of Texas at
Austin, Austin, Texas 78712, United States bDepartment of Chemistry and Biochemistry, Queens College, City University of
New York, Flushing, New York 11367, United States
Table of Contents
1. EXPERIMENTAL SECTION ------------------------------------------------2
Chemicals and Materials -----------------------------------------------------2
Pt UME Fabrication -----------------------------------------------------------2
C UME Fabrication -----------------------------------------------------------2
FIB-milled UME Characterization ------------------------------------------3
Deposition of a PtNP or cluster on C UME --------------------------------3
SECM Measurement --------------------------------------------------------- 4
2. FIGURES---------------------------------------------------------------------------6
Figure S1-----------------------------------------------------------------------6
Figure S2-----------------------------------------------------------------------7
Figure S3 ----------------------------------------------------------------------8
Figure S4----------------------------------------------------------------------10
Figure S5----------------------------------------------------------------------11
Figure S6 ---------------------------------------------------------------------12

S-2
EXPERIMENTAL SECTION
Chemicals and Materials. Hexachloroplatinic acid (H2PtCl6), perchloric acid (HClO4)
and sodium perchlorate (NaClO4) were purchased from Sigma-Aldrich and used as
received. Ferrocenemethanol (FcMeOH, 97%, Acros Organics, NJ) were used after
recrystallization. Hydrogen peroxide (H2O2), potassium nitrate (KNO3) and sulfuric
acid (H2SO4) were obtained from Fisher Scientific and used as received. A Milli-Q
Integral system (EDM Millipore, Berllerica, MA) was equipped to obtain ultrapure
water with total organic carbon (TOC) level at <3 ppb as measured by an internally
equipped TOC monitor as well as the resistivity 18.3 MΩ/cm. All the solutions for
electrochemical measurements were prepared with ultrapure water and filtrated by
syringe filter with 0.1 µm diameter pore (Millex-Syringe driven filter unit, PVDF-0.1
µm, Merck Millipore Ltd.) except the acidic solution. All the glassware and the
SECM cell made of Teflon and glass were extensively cleaned with piranha solution
(3:1 ratio of H2SO4:H2O2) followed by thorough washing with ultrapure water before
use.
Pt UME Fabrication. A Pt UME was fabricated by using a CO2-laser puller, a
microforge, and a focused ion beam (FIB) instrument. Briefly, a 25 µm diameter Pt
wire (Goodfellow, annealed) inserted in the borosilicate capillary (I.D. 0.2 mm, O.D.
1 mm) was pulled together with CO2 laser puller (P-2000, Sutter). Continuously, Pt
UME was further annealed by Micro Forge (MF-900, Narishige, Tokyo, Japan) to
decrease RG (a ratio between glass sheath and Pt radii) as well as a better sealing. A
sharp tip with desirable inner and outer radii was obtained by FIB milling (SEM/FIB
FEI Strata DB235 SEM/FIB with Zyvex S100).
C UME Fabrication. A cone-shaped nanopipette was pulled from a quartz capillary
(O.D.1.0 mm and I.D. 0.7 mm, Sutter Instrument, Novato, CA) and deposited with
carbon by the chemical vapor deposition method. Briefly, a nanopipette with a tip
diameter from 10 to 100 nm was fabricated by using a CO2 laser puller (P-2000,
Sutter Instrument) based on a program of HEAT = 800, FIL = 4, VEL = 22, DEL =
128, PUL = 110 and HEAT = 830, FIL = 3, VEL = 17, DEL = 130, PUL = 255. A

S-3
nanopipette was nearly completely filled with carbon deposited using methane as the
carbon source and argon as the protector for 1 hour at 900 ºC. We used a copper
nickel wire (0.13 mm diameter, Alfa Aesar, Ward Hill, PA) to establish a connection
with a carbon nanotip for electrochemical measurements as well as its grounding to a
sample stage in SEM, and FIB experiments and for protections from electrostatic
damage. A C UME tip with a desirable radius was milled by using an FIB instrument
to yield a flat tip.
FIB-milled UME Characterization. Electrochemical characterization of the
obtained UMEs was performed by means of CV using a three-electrode configuration,
where UME, silver/silver chloride electrode (Ag/AgCl), and Pt wire electrode are
working, reference, and counter electrodes, respectively. Assuming a non-recessed,
disk-shaped sub-micrometer electrode, estimation of the electrode radius can be done
based on the steady-state current from CV at a scan rate of 100 mV·s−1 in 0.5 mM
FcMeOH aqueous solution containing 0.1 M KNO3 as supporting electrolyte, as
shown in Supporting Information, Figure S2. The radius for the FIB-milled UME was
calculated based on the following formula:
𝑖!"# = 4xnFDca
where 𝑖!"# is the steady-state current, x is a coe�cient for the RG value, n is the
number of electrons (n =1 for FcMeOH oxidation), F is the Faraday constant (96485
C·mol−1), D is the diffusion coefficient (7.6 × 10⁻⁶ cm2·s−1 for FcMeOH in 0.1 M
KNO3 solution), c is the concentration of FcMeOH (0.5 mM), and a is the radius of
the UME. This result was also further confirmed with an SEM image of the
FIB-milled tip (Figure S2).
Deposition of a PtNP or cluster on C UME. A CHI760E bipotentiostat (CH
Instrument, Austin, TX) was used for the electrodeposition of PtNP. To deposit a
PtNP or cluster on the C UME, we used multiple potential step techniques in different
concentration H2PtCl6 (100 µM; 30 µM; 10 µM) containing 10 mM H2SO4 solution,
jumping the potential from a value (+0.45 V vs Ag/AgCl) where no reaction occurred

S-4
to driving potentials 0 V vs Ag/AgCl for different intervals for PtNP deposition (3-10
s) and then back to + 0.45 V vs Ag/AgCl. For this potential control, “return to the
initial potential after run” function were used.
Nano-SECM Measurement. SECM experiments were carried out using a home-built
instrument composed of a CHI760E bipotentiostat (CH Instrument) and a stage
equipped with piezoelectric actuators (PI instruments) with a LabVIEW software.
Notably, the positioning of the piezo and the electrochemistry are carried out
independently using two different circuits. For the electrochemistry, a four electrode
cell configuration was used in SECM experiments: a FIB-milled Pt UME or C UME
with small RG served as the tip, which was mounted facing downward to a = 12.5 µm
radius Pt UME substrate electrode. A Pt wire was used as a counter electrode and an
Ag/AgCl electrode acted as a reference electrode, respectively. Particularly, to avoid
electrochemical damage of nanometer-sized PtNP and electrode during
electrochemical measurements, all relay switches in CHI760E bipotentiostat were
physically removed following manufacturer’s instruction. Moreover, we handled both
tip and substrate with protection tools as well as “cell on between runs” function by
CHI software during the entire experiments. To suppress a thermal drift, all
measurements were performed in an isothermal chamber with a faraday cage and a
vibration isolation table. All of the metal parts in the vibration isolation table and the
electronic equipment are grounded to prevent the electrochemical damage of the tip.
Combined with CCD camera microscopy (Infinity2-1, Caltex lens VZ-400, Ontario,
Canada), an UME used as SECM tip was aligned to 12.5 µm radius Pt substrate with a
typical SECM imaging of substrate generation/tip collection (SG/TC) model. The tip
was then brought closer to the Pt substrate with the SECM approach curve technique
until the positive feedback current was observed in 0.5 mM FcMeOH solution
containing 0.1 M KNO3. Then, the tip could be positioned ca. 20 µm above the
substrate after 2−3 times of SECM approach with manipulating lockable di�erential
micro-positioner in the z-axes, where the z-piezoelectric actuator has enough room to
expand. After confirming a stable tip current level at the constant approached height,

S-5
thus forming a stable nanogap with a drift level <0.5 nm/min, UME tip was
withdrawn to the initial position “0” of PIMikroMove (PI) to eliminate drift from
piezo in the next electrochemical deposition experiment.
Figure S1. CVs of a = 12.5 µm Pt substrate (a) and a = 1.0 µm Pt tip (b) in 20 mM
HClO4 containing 0.1 M NaClO4 as supporting electrolyte at a scan rate of 100
mV·s−1.
A steady-state current was obtained for radius 12.5 µm Pt substrate at potentials
more negative than −0.5 V vs Ag/AgCl (Figure S1a), indicating a diffusion-controlled
current produced by proton reduction. However, a clear reduction features was
observed for radius 1.0 µm Pt tip, relating to H+ reduction to H2, with a significant
hysteresis corresponding to a Pt deactivation process on the reverse sweep (Figure
S1b).

S-6
Figure S2. Left, CV of FIB-milled Pt tip (a); C UME tip (b); Pt substrate (c) in 0.5
mM FcMeOH solution containing 0.1 M KNO3; the radius of the Pt microelectrodes
are 0.97 µm, 0.26 µm and 11.8 µm based on steady-state current, respectively. Right,
SEM image of FIB-milled Pt tip (d); C UME tip (e); Pt substrate (f) indicate the
radii of the electrodes are 0.98 µm, 0.26 µm and 12.1 um with very thin insulating
sheath, respectively.

S-7
Figure S3. Voltammetric characterization of single PtNP size in 20 mM HClO4
solution. (a) Current−time transients of the electrodeposition of a single PtNP on C
UME for 5 sec in 100 µM H2PtCl6 solution containing 10 mM H2SO4 at 0 V vs
Ag/AgCl. (b) Cyclic voltammograms of a PtNP deposited C UME in 20 mM HClO4
solution. (c-d) SEM image of C UME before and after deposition of a PtNP on C
UME.
Voltammetric characterization of single PtNP size. We electrodeposited single
PtNP at C UME by applying a pulsed potentiostat method.1,2 As displayed, the C
UME surface was anodically protected at +450 mV vs Ag/AgCl during immersion in
100 µM H2PtCl6 solution and prior to the application of a 0 V vs Ag/AgCl plating
pulse to avoid the spontaneous deposition. After electrodeposition, the applied
potential of the C UME was returned to the initial potential, +450 mV, for several
seconds to completely stop the deposition process. A current−time transients for the
electrodeposition of a single PtNP on C UME for 5 sec in 100 µM H2PtCl6 solution
containing 10 mM H2SO4 at 0 V vs Ag/AgCl was shown in Figure S3a. Typically, a
falling current occurs at the beginning of the transients followed by a period over

S-8
which the current maintains a very low value and then current increase gradually,
corresponding to H2PtCl6 diffusion to C UME surface and then the nucleation and the
growth of a stable single PtNP.3 Assuming a spherical geometry and 100% deposition
e�ciency, we can estimate the size of deposited PtNP (rNP) from the integrated
charges through the equation below:
𝑟!" =3𝑄𝑉!4𝜋𝑛𝑞
!
where 𝑟!" is the radius of a PtNP, Q is the integrated charge from experimental
current transient, Va is the atomic volume of Pt (2.32 × 10⁻²⁹ m3), n is the number of
electrons transferred per Pt atom (n=4), and q is the elementary charge. FIB-milled C
UME o�ers a smooth and flat surface with a uniform conductivity across its surface.4
Additionally, our C UME tips with very small electroactive radii simplify the study of
the nucleation and growth mechanism makes it possible to form only one single
growth center and to allow that center to grow independently. Single Pt NP of ca. 64
nm radius on CUME was observed with nearly spherical geometry by SEM (Figure
S3d). Notably, the observed dimension is close to the estimated size from the
integrated charge of electrodeposition, 65 nm, indicating that most of transient
currents could be attributed to the formation and growth of a PtNP (Figure S3a).
We further electrochemically characterized PtNP at C UME by steady-state
voltammetry of HER in 20 mM HClO4 containing 0.1 M NaClO4. A steady-state
current with a significant hysteresis was obtained at potentials more negative than
−0.6 V vs Ag/AgCl (Figure S3b), corresponding to a diffusion-controlled current
produced by proton reduction. The radius of deposited Pt NP, 𝑟!", on the C UME
surface was estimated from the steady-state current obtained voltammograms in
HClO4 solution assuming a single Pt NP with a spherical geometry on a planar surface,
𝑖!"# = 4𝜋 𝑙𝑛2 𝑛𝐹𝐷𝐶𝑟!", where ilim is a steady-state current, n is the electron transfer
number (=1 for proton reduction), F is the Faraday constant (96485 C/mol), D is the
diffusion coefficient of H+ (8×10⁻⁵ cm2/s), and c is the concentration of proton (20
mM ). In this case, the steady-state current of H+ reduction at -1.0 V vs Ag/AgCl was
8.7 nA, and the radius of PtNP was calculated to be 63 nm. Notably, the estimated

S-9
size is in good agreement with both the integrated charge and the SEM result,
indicating the validity of determined PtNP size by a steady-state current of HER.
Figure S4. Generation and removal of H2 bubble on C UME after electrodeposition of
a single PtNP for (a) 5 sec and (b) 3 sec in 100 µM H2PtCl6 solution containing 10
mM H2SO4 at 0 V vs Ag/AgCl at different distances in an oxygen free 200 mM
HClO4 solution using the SG/TC mode of SECM. For SG/TC mode of SECM, the ET
is scanned from 0 to −1.0 V vs Ag/AgCl at a scan rate of 100 mV·s−1, while ES is
fixed at +0.1 V vs Ag/AgCl. Curves with black color and red color are the tip and
substrate voltammograms, respectively.

S-10
Figure S5. SEM image of C UME after deposition of single Pt NPs for (a) 5 sec and
(b) 3 sec in 100 µM H2PtCl6 solution containing 10 mM H2SO4 at 0 V vs Ag/AgCl.

S-11
Figure S6. Generation and removal of H2 bubble on C UME after electrodeposition of
a single PtNP for 10 sec in (a-c) 30 µM (d) 10 µM H2PtCl6 solution containing 10 mM
H2SO4 at 0 V vs Ag/AgCl at different distances in an oxygen free 500 mM HClO4
solution using the SG/TC mode of SECM. For SG/TC mode of SECM, the ET is
scanned from 0 to −1.1 V vs Ag/AgCl at a scan rate of 100 mV·s−1, while ES is fixed
d

S-12
at +0.1 V vs Ag/AgCl. Curves with black color and red color are the tip and substrate
voltammograms, respectively.
Figure S7. Geometry of the simulation space and parameters defining the diffusion
problem for a sphere-shaped SECM tip approaching an inlaid disk substrate.
The steady-state diffusion problem for the tip generation and substrate collection
(TG-SC) mode of the SECM operation is formulated for the diffusion-controlled
reduction of proton ions (species 1) at the sphere-shaped tip and oxidation of
hydrogen products (species 2) at the inlaid disk substrate, as shown in Figure S6. For
simplicity, the “½H2” is taken as “species 2” in the electrode reaction and the
involved formulation.
H! + e! → 1/2H! (1.1)
In this case, it must be aware that the real concentration of H2 should be ½ of the
simulated value of “species 2”.
Then, the above diffusion problem can write in cylindrical coordinates as:
2 21 1 12 2
1 0c c cr r r z∂ ∂ ∂
+ + =∂ ∂ ∂
(1.2)
2 22 2 22 2
1 0c c cr r r z
∂ ∂ ∂+ + =
∂ ∂ ∂ (1.3)
tip
substrate
lt
ls
rs
rNP
as
rgs
d
rgt
r
z
solution

S-13
where r and z are the spatial coordinates and ci (r, z) is the concentration of the
solution species.
The dimensionless variables are introduced as:
NP/R r r= (1.4)
NP/Z z r= (1.5)
b( , ) ( , ) /C R Z c r z c= (1.6)
NP/AS as r= (1.7)
NP/RGT rgt r= (1.8)
NP/RGS rgs r= (1.9)
NP/L d r= (1.10)
NP/LT lt r= (1.11)
NP/LS ls r= (1.12)
where 𝑟!" is the radius of the sphere-shaped tip, 𝐶! is the bulk concentration, as is
the radius of the inlaid disk substrate, rgt and rgs are the tip and substrate insulator
radiuses, rs is the simulation space limit in the radial direction, lt and ls are the
z-coordinates of the lower and upper simulation space limits, and d is the vertical
distance from the sphere top to the substrate.
The dimensionless parameters are used as described in the formulation for the
following diffusion problem:
2 2
1 1 12 2
1 0; 0 , 2C C C R RS LT L LSR R R Z
∂ ∂ ∂+ + = ≤ < − < Ζ < + +
∂ ∂ ∂ (1.13)
2 2
2 2 22 2
1 0; 0 , 2C C C R RS LT L LSR R R Z
∂ ∂ ∂+ + = ≤ < − < Ζ < + +
∂ ∂ ∂ (1.14)
S-14
1 2
1 1 2
2
( , ) ( , )0, 0;
0 R 1, 1 1
C R Z C R ZC D Dn n
Z R
∂ ∂= + =
∂ ∂
≤ ≤ = ± −
(tip surface) (1.15)
1 2
2 1 2( , ) ( , )0, 0;
0 , 2
C R Z C R ZC D Dn n
R AS Z L
∂ ∂= + =
∂ ∂≤ ≤ = +
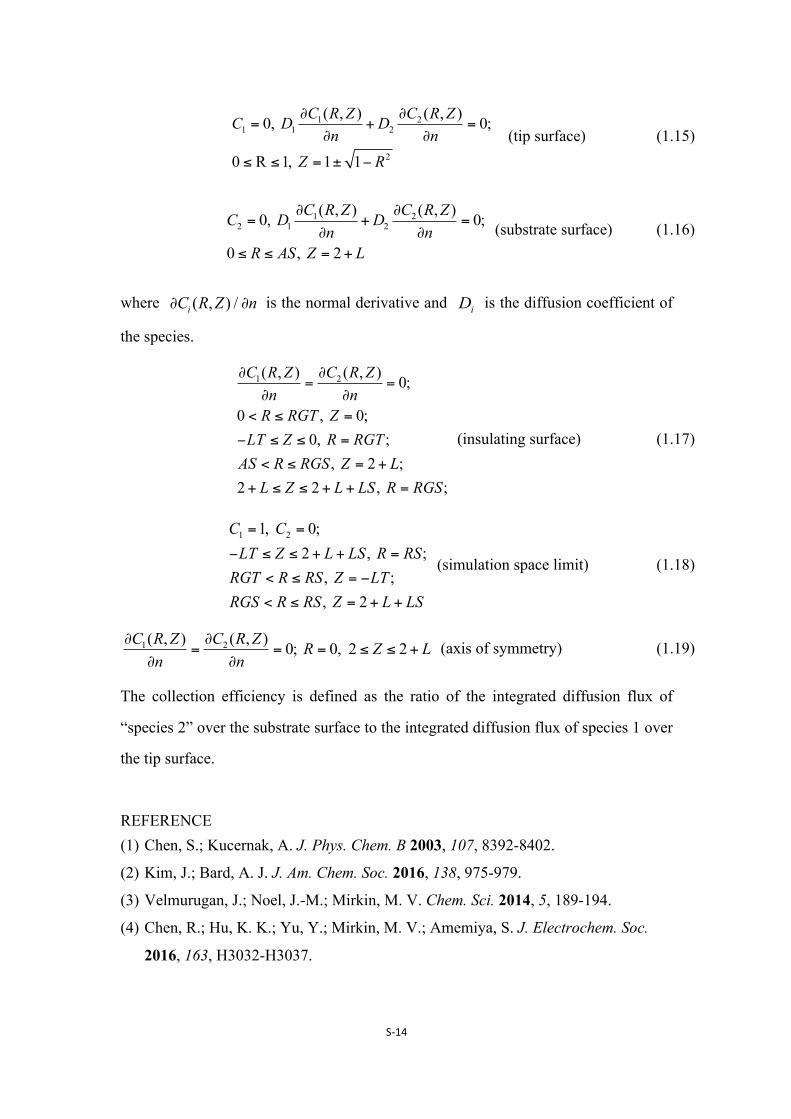
(substrate surface) (1.16)
where ( , ) /iC R Z n∂ ∂ is the normal derivative and iD is the diffusion coefficient of
the species.
1 2( , ) ( , ) 0;
0 , 0;0, ;
, 2 ;2 2 , ;
C R Z C R Zn nR RGT Z
LT Z R RGTAS R RGS Z LL Z L LS R RGS
∂ ∂= =
∂ ∂< ≤ =
− ≤ ≤ =
< ≤ = +
+ ≤ ≤ + + =
(insulating surface) (1.17)
1 21, 0; 2 , ;
, ; , 2
C CLT Z L LS R RSRGT R RS Z LTRGS R RS Z L LS
= =
− ≤ ≤ + + =
< ≤ = −
< ≤ = + +
(simulation space limit) (1.18)
1 2( , ) ( , ) 0; 0, 2 2C R Z C R Z R Z Ln n
∂ ∂= = = ≤ ≤ +
∂ ∂ (axis of symmetry) (1.19)
The collection efficiency is defined as the ratio of the integrated diffusion flux of
“species 2” over the substrate surface to the integrated diffusion flux of species 1 over
the tip surface.
REFERENCE (1) Chen, S.; Kucernak, A. J. Phys. Chem. B 2003, 107, 8392-8402.
(2) Kim, J.; Bard, A. J. J. Am. Chem. Soc. 2016, 138, 975-979.
(3) Velmurugan, J.; Noel, J.-M.; Mirkin, M. V. Chem. Sci. 2014, 5, 189-194.
(4) Chen, R.; Hu, K. K.; Yu, Y.; Mirkin, M. V.; Amemiya, S. J. Electrochem. Soc.
2016, 163, H3032-H3037.