revised gcse and equivalent results in england, 2014 to 2015 · pdf filerevised gcse and...
TRANSCRIPT
Contact: Email: [email protected] Press office: 020 7783 8300 Public enquiries: 0370 000 2288
Revised GCSE and equivalent results in
England, 2014 to 2015
SFR 01/2016, 21 January 2016
Attainment in the headline 5+ A*-C including English and maths measure is stable in 2015
Percentage of pupils achieving the headline measure
All schools
State-funded schools
2015 53.8 57.1
2014 53.4 56.6
2015 vs. 2014 0.4 0.5
Source: Key stage 4 attainment data
Attainment of the headline measure increased by
0.4 percentage points to 53.8% in all schools
compared to 2014, and 0.5 percentage points to
57.1% in state-funded schools. A time series
showing performance in this measure since 1996,
with explanations of policy changes, is shown on
page 4.
Entry to EBacc science and humanities has increased, and entry to EBacc languages has decreased slightly
Percentage of pupils entered for components of the EBacc
England, state-funded schools, 2010-2015
Source: Key stage 4 attainment data
The percentage of pupils
entering English and maths
has remained stable in state-
funded schools since 2010. It
is compulsory for pupils to
study these subjects at key
stage 4 in state-funded
schools.
The percentage entering
EBacc science rose
significantly between 2014
and 2015, with a small
increase in EBacc humanities
and a small decrease in
EBacc languages. Overall,
EBacc entry and achievement
remain stable.
The number of schools below the secondary floor standard is stable compared to 2014
Percentage of schools below the floor standards by region
Source: Key stage 4 attainment data
329 schools are below the secondary school
floor standard in 2015. This represents
11.0% of state-funded mainstream schools
included in the floor calculations, and is
stable compared to the number of schools
below the floor in 2014.
London has the lowest proportion of schools
below the floor, with 3.8%, and East
Midlands the highest, with 18.3%.

Contact: Email: [email protected] Press office: 020 7783 8300 Public enquiries: 0370 000 2288
Contents
Introduction .................................................................................................... 3 1.
Pupils achieving 5+ A*-C including English and maths .................................. 3 2.
The English Baccalaureate ............................................................................ 5 3.
The English Baccalaureate subjects .............................................................. 6 4.
Other subjects ............................................................................................. 10 5.
Attainment by school type ............................................................................ 10 6.
Entry patterns .............................................................................................. 14 7.
Local authority achievement ........................................................................ 15 8.
Attainment 8 and Progress 8 ....................................................................... 16 9.
Floor standards ............................................................................................ 17 10.
Pupil characteristics ..................................................................................... 18 11.
Accompanying tables ................................................................................... 25 12.
Further information ...................................................................................... 28 13.
National Statistics ........................................................................................ 28 14.
Technical information ................................................................................... 29 15.
Get in touch ................................................................................................. 29 16.
About this release
This statistical first release provides the revised GCSE and equivalent results of pupils at the end of key stage 4 in England, including attainment by pupil characteristics. Figures are provided at national, regional and local authority level for the 2014/15 academic year. The data covers pupils at the end of KS4, typically those starting the academic year aged 15.
This release provides an update to the provisional figures released in October 2015 in SFR 37/2015.
In this publication
The following tables are included in the SFR:
• National tables • Characteristics national tables
• Attainment 8 tables • Local authority tables
• Subject tables • Subject time series table
• AP/PRU tables • Pupil residency and school location tables
• Other breakdowns tables
The accompanying quality and methodology information document provides information on the data sources, their coverage and quality and explains the methodology used in producing the data.
Feedback
We are changing how our releases look and welcome feedback on any aspect of this document at [email protected].

3
Introduction 1.
The Department for Education receives examination results data from awarding organisations, which are
collected for the 2015 secondary school performance tables. This release provides an update to the
provisional figures released in October 2015 in SFR 37/2015. A number of figures have changed between
the two releases; this is expected and occurs every year, because the revised data take account of accepted
amendment requests made by schools to remove pupils and the addition of late results and re-marks1. These
changes have been highlighted where relevant. To improve the presentation of these statistics, our October
release compared provisional data to the equivalent provisional data from the previous year, to give a fair
reflection of the change between years; this publication compares revised 2015 figures to final 2014 data.
The performance measures contained within this publication are based on the same rules used to produce the
measures shown in the secondary school performance tables. The number of pupils in the cohort has
decreased by 7,356 pupils in all schools and 4,963 in state-funded schools, a 1% decrease in both groups
compared to 2014. This should be taken into account when comparing figures based on numbers of entries.
Comparisons to earlier years
Comparisons between 2014 and earlier years were affected by major reforms. In 2014 two major reforms
were introduced; Professor Alison Wolf’s Review of Vocational Education recommendations2 and an early
entry policy to only count a pupil’s first attempt at a qualification in the performance tables in English
Baccalaureate subjects. More information on the reforms to how these statistics are calculated can be found
in the 2013/14 GCSE and equivalent results SFR.
The early entry policy was extended to non-EBacc subjects in 2015. Analysis of entry patterns in 2014
showed that only 3% of qualifications which do not count towards the English Baccalaureate were attempted
more than once. The expansion of early entry policy to all subjects in 2015 is therefore not expected to have
a significant impact on national figures.
Pupils achieving 5+ A*-C including English and maths 2.
The headline attainment measure in 2015 is the
percentage of pupils achieving 5+ A*-C GCSEs (or
equivalent) including English and maths GCSEs3. In 2015,
53.8% of pupils achieved this measure in all schools, and
57.1% in state-funded schools. These figures are
increases of 0.4 and 0.5 percentage points respectively
compared to 2014.
Compared to the 2015 provisional data, the revised results
are an increase of 1.0 percentage point for both all
schools and state-funded schools. An increase in this
measure between provisional and revised figures is
expected and occurs every year.
Table 1: Percentage of pupils achieving 5+ A*-C including English and maths
England, 2010-2015
All schools State-funded schools
2015 53.8 57.1
2014 53.4 56.6
2013 59.2 60.6
2012 59.4 58.8
2011 59.0 58.2
2010 53.5 55.1
Source: Key stage 4 attainment data
Gender
Girls continue to outperform boys in this measure, although the gap has
narrowed by 0.8 percentage points in all schools since 2014, as shown
in Table 2. This is because boys’ attainment in this indicator has
increased to a greater extent than it has for girls since 2014, for whom
attainment has remained broadly stable. The 0.4 percentage point rise
in the proportion of pupils achieving 5+ A*-C including English and
maths in 2015 has been driven by a 0.8 percentage point increase in
boys’ attainment compared to no change in girls. The gap between girls
Table 2: Percentage achieving 5+ A*-C including English and maths by gender England, all schools, 2014-2015
Girls Boys Gap
2015 58.9 49.0 9.9
2014 58.9 48.2 10.7
Source: Key stage 4 attainment data
1 Information on Enquiries about results for GCSE and A Level: summer 2015 exam series is published by Ofqual
2 This restricted the qualifications counted, prevented any qualification from counting as larger than one GCSE, and capped the
number of non-GCSEs included in performance measures at two per pupil 3 In October 2013, the department announced that a new secondary school accountability system would be implemented from 2016.
Schools had the option to adopt the new performance measures a year early. 327 schools chose to opt-in; for these schools the headline attainment measure is Attainment 8. More information can be found in Section 9.
4
and boys is smaller in state-funded schools, at 9.4 percentage points, and decreased from 10.1 percentage points in 2014.
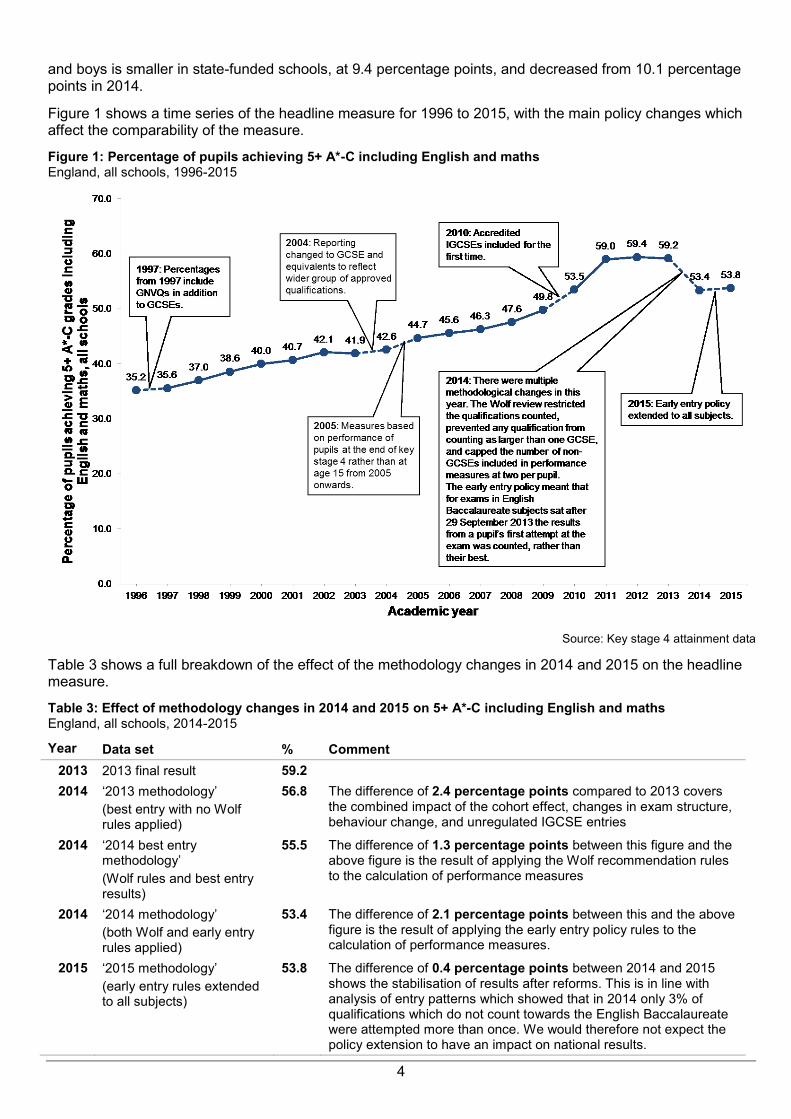
Figure 1 shows a time series of the headline measure for 1996 to 2015, with the main policy changes which affect the comparability of the measure.
Figure 1: Percentage of pupils achieving 5+ A*-C including English and maths England, all schools, 1996-2015
Source: Key stage 4 attainment data
Table 3 shows a full breakdown of the effect of the methodology changes in 2014 and 2015 on the headline measure.
Table 3: Effect of methodology changes in 2014 and 2015 on 5+ A*-C including English and maths England, all schools, 2014-2015
Year Data set % Comment
2013 2013 final result 59.2
2014 ‘2013 methodology’
(best entry with no Wolf rules applied)
56.8 The difference of 2.4 percentage points compared to 2013 covers the combined impact of the cohort effect, changes in exam structure, behaviour change, and unregulated IGCSE entries
2014 ‘2014 best entry methodology’
(Wolf rules and best entry results)
55.5 The difference of 1.3 percentage points between this figure and the above figure is the result of applying the Wolf recommendation rules to the calculation of performance measures
2014 ‘2014 methodology’
(both Wolf and early entry rules applied)
53.4 The difference of 2.1 percentage points between this and the above figure is the result of applying the early entry policy rules to the calculation of performance measures.
2015 ‘2015 methodology’
(early entry rules extended to all subjects)
53.8 The difference of 0.4 percentage points between 2014 and 2015 shows the stabilisation of results after reforms. This is in line with analysis of entry patterns which showed that in 2014 only 3% of qualifications which do not count towards the English Baccalaureate were attempted more than once. We would therefore not expect the policy extension to have an impact on national results.

5
The English Baccalaureate 3.
The English Baccalaureate
The English Baccalaureate (EBacc) was first introduced into the performance tables in 2009/10. It allows people to see how many pupils get a grade C or above in the core academic subjects at key stage 4. The EBacc is made up of English, maths, science, a language, and history or geography. To count in the EBacc, qualifications must be on the English Baccalaureate list of qualifications 2015.
Entry
In 2015, 36.2% of pupils in all
schools and 38.7% of pupils in
state-funded schools entered
the EBacc. Entry is stable when
compared to 2014 (with a 0.1
percentage point decrease for
all schools, and no change for
state-funded schools). Entry
increased from 22.0% (all
schools) and 21.8% (state-
funded schools) in 2010 when
the EBacc was introduced.
The EBacc is less affected by
methodological and
examination changes than other
measures in this SFR. As such,
comparisons between years for
EBacc entries and
achievements are more suitable
here than for other measures.
Figure 2: Percentage of pupils entering the EBacc England, 2010-2015
Source: Key stage 4 attainment data
The difference between the all schools and state-funded schools figures is related to the impact of
unregulated IGCSEs taken in independent schools. This lowers the 2015 result for all schools, as it did in
2014. More information on the use of unregulated IGCSEs is given in the section on independent schools in
Section 6.
Achievement
Figure 3: Percentage of pupils achieving the EBacc England, 2010-2015
Source: Key stage 4 attainment data
In 2015, 22.9% of pupils in
all schools and 24.3% of
pupils in state-funded
schools achieved the EBacc.
These figures are stable
when compared to 2014,
and increased from 15.6%
and 15.1% respectively in
2010 when the EBacc was
introduced.
EBacc achievement figures
were revised upwards by 0.4
percentage points for all
schools and 0.3 percentage
points for state-funded
schools compared to the
2015 provisional data.

6
Gender
The proportion of boys entering the EBacc
has fallen slightly to 31.6% in all schools
since 2014, (a drop of 0.3 percentage
points4) and boys’ achievement of the EBacc
has remained stable at 18.2%. For girls,
entry and achievement of the EBacc has
remained the same. This means that the
gender gap has increased for entry into the
EBacc, but decreased slightly for
achievement of the EBacc4.
In state-funded schools, the gender gap in
both EBacc entry and achievement increased
slightly, as shown in Table 4.
Table 4: Percentage of pupils entering and achieving the EBacc by gender England, 2014-2015
Entering the EBacc Achieving the EBacc
All schools Girls Boys Gap Girls Boys Gap
2015 41.0 31.6 9.4 27.8 18.2 9.6
2014 41.0 31.8 9.1 27.8 18.2 9.7
State-funded schools
Girls Boys Gap Girls Boys Gap
2015 43.4 34.1 9.3 29.3 19.5 9.8
2014 43.2 34.4 8.9 29.1 19.5 9.6
Source: Key stage 4 attainment data
The English Baccalaureate subjects 4.
It is compulsory for pupils to study English and maths, and the proportions of pupils entering these have remained stable. Since 2014, in state-funded schools, entries have increased by 5.7 percentage points in EBacc science, and 0.9 percentage points in EBacc humanities, and decreased by 1.2 percentage points in EBacc languages. Entries to all three of these EBacc subject areas have increased significantly since 2010 when the EBacc was introduced, as shown in Figure 4. More information on each subject area is given in the following sections.
Figure 4: Percentage of pupils entered for components of the EBacc England, state-funded schools, 2010-2015
Source: Key stage 4 attainment data
4 All gaps and changes are calculated from unrounded figures.

7
English
To pass the English element of the EBacc, pupils must achieve either:
– A*-C in combined English5 GCSE or approved equivalents; or
– A*-C in English language and any grade in English literature
The percentage of pupils with entries to EBacc English has remained stable in 2015, as shown in Figure 4.
The stability of the EBacc English measure since 2010 is due to the fact that it is compulsory for pupils to
study English at key stage 4 in state-funded schools. Achievement of EBacc English is also stable, with an
increase of 0.3 percentage points for pupils in all schools, and state-funded schools compared to 2014.
The total number of English entries is lower in 2015 compared to 2014. In 2014, there was a shift from
combined English towards the separate language and literature qualifications6. Compared to 2014, there
were drops in both combined English (72,279 fewer entries, to 70,360 entries in total) and English language
(49,343 fewer entries, to 530,385), and an increase in entries for English literature (44,303 additional entries,
to 518,999). This may suggest that pupils are continuing to shift from combined English to separate language
and literature qualifications, but also that pupils may only be entering one of the two sets of qualifications
whereas before they entered both.
There has also been a change in qualification
types taken. As shown in Table 5, the number
of pupils with entries to English GCSE (English
language or the combined English
qualification) fell between 2014 and 2015,
continuing the decrease seen between 2013
and 2014.
Table 5: English entries by qualification type England, all schools, 2013-2015
2013 2014 2015
GCSE 550,801 464,077 363,238
Regulated IGCSEs 41,084 105,416 190,039
Source: Key stage 4 attainment data
However, in parallel, there was an increase in the number of entries to Cambridge International Certificate
and Edexcel Level1/2 Certificate (regulated IGCSEs) in English language, continuing the increase since
2013. As shown by the stability of EBacc English entry, this change in pattern does not mean that fewer
pupils are entering English, just that they are being entered for different types of qualifications.
Maths
To pass the maths element of the EBacc, pupils must achieve either:
– A*-C in maths GCSE or approved equivalents; or – A*-C in at least one element of GCSE maths linked pairs (‘applications of mathematics’ and ‘methods in
mathematics’). Where this option is chosen, both elements of linked pairs must be taken for a pupil to have entered EBacc maths.
Entries to EBacc maths have remained stable in 2015, as shown in Figure 4. The stability of the EBacc
maths measure since 2010 is due to the fact that it is compulsory for pupils to study maths at key stage 4 in
state-funded schools. Achievement of EBacc maths is also stable, with an increase of 0.5 percentage points
for pupils in all schools and 0.6 percentage points in state-funded schools since 2014.
However, the total number of entries to maths qualifications (all entries by pupils at the end of key stage 4 in
2015, including multiple entries) has fallen by 240,813 – a decrease of 27.1% compared to 2014. This is
linked to behaviour changes relating to early entry, meaning pupils are less likely to be entered for their
maths exam in year 10 and instead wait until year 11. This is evidenced by the large fall in maths entries by
this year’s cohort when they were in year 10. Only 4.4% of the maths entries made by this year’s cohort were
undertaken in year 10, compared to 20.9% of the entries made by the previous cohort. As shown by the
stability of entries to EBacc maths, this does not mean that fewer pupils are taking maths, just that the total
number of exam entries per pupil is lower.
5 Combined English covers both a literature and language element within a single course of study
6 See section 7 of the Revised GCSE and equivalents results in England, 2013 to 2014 SFR.
8
Science
It is compulsory for state-funded schools to teach science at key stage 4. For EBacc science, a pupil must enter:
– three individual sciences (three out of biology, chemistry, physics, and computer science); or – core and additional science
7; or
– double science
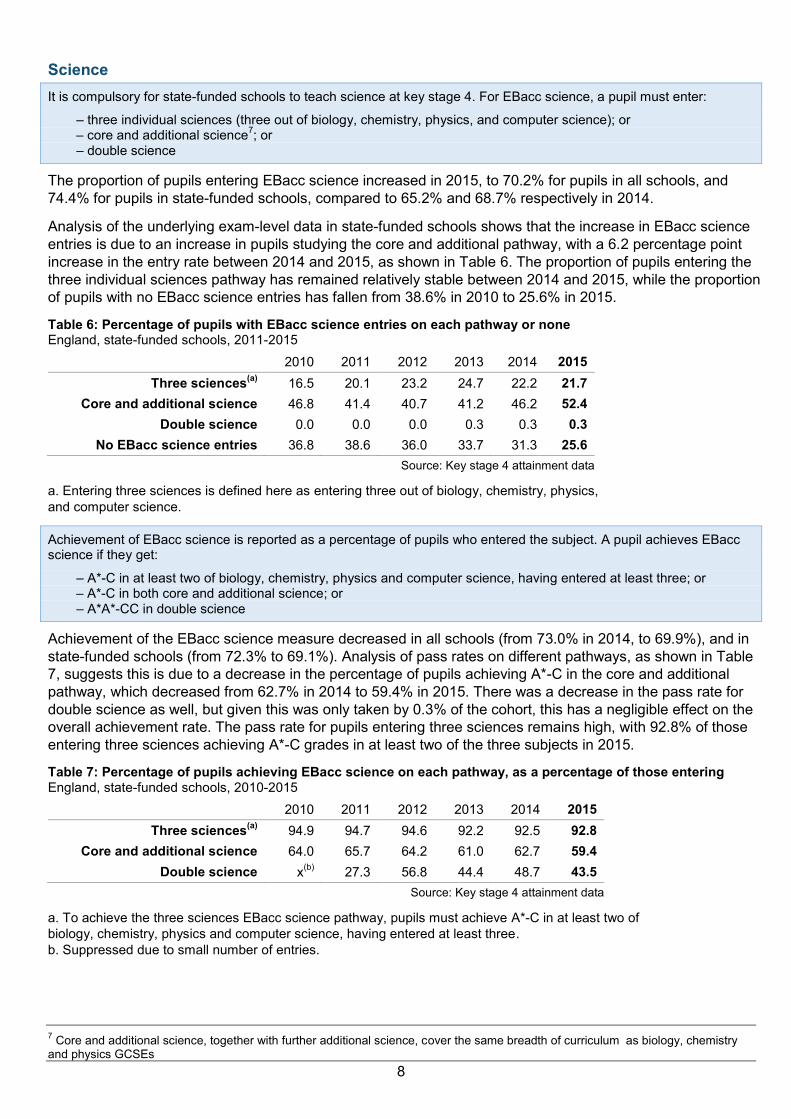
The proportion of pupils entering EBacc science increased in 2015, to 70.2% for pupils in all schools, and
74.4% for pupils in state-funded schools, compared to 65.2% and 68.7% respectively in 2014.
Analysis of the underlying exam-level data in state-funded schools shows that the increase in EBacc science
entries is due to an increase in pupils studying the core and additional pathway, with a 6.2 percentage point
increase in the entry rate between 2014 and 2015, as shown in Table 6. The proportion of pupils entering the
three individual sciences pathway has remained relatively stable between 2014 and 2015, while the proportion
of pupils with no EBacc science entries has fallen from 38.6% in 2010 to 25.6% in 2015.
Table 6: Percentage of pupils with EBacc science entries on each pathway or none England, state-funded schools, 2011-2015
2010 2011 2012 2013 2014 2015
Three sciences(a)
16.5 20.1 23.2 24.7 22.2 21.7
Core and additional science 46.8 41.4 40.7 41.2 46.2 52.4
Double science 0.0 0.0 0.0 0.3 0.3 0.3
No EBacc science entries 36.8 38.6 36.0 33.7 31.3 25.6
Source: Key stage 4 attainment data
a. Entering three sciences is defined here as entering three out of biology, chemistry, physics,
and computer science.
Achievement of EBacc science is reported as a percentage of pupils who entered the subject. A pupil achieves EBacc science if they get:
– A*-C in at least two of biology, chemistry, physics and computer science, having entered at least three; or – A*-C in both core and additional science; or – A*A*-CC in double science
Achievement of the EBacc science measure decreased in all schools (from 73.0% in 2014, to 69.9%), and in
state-funded schools (from 72.3% to 69.1%). Analysis of pass rates on different pathways, as shown in Table
7, suggests this is due to a decrease in the percentage of pupils achieving A*-C in the core and additional
pathway, which decreased from 62.7% in 2014 to 59.4% in 2015. There was a decrease in the pass rate for
double science as well, but given this was only taken by 0.3% of the cohort, this has a negligible effect on the
overall achievement rate. The pass rate for pupils entering three sciences remains high, with 92.8% of those
entering three sciences achieving A*-C grades in at least two of the three subjects in 2015.
Table 7: Percentage of pupils achieving EBacc science on each pathway, as a percentage of those entering England, state-funded schools, 2010-2015
2010 2011 2012 2013 2014 2015
Three sciences(a)
94.9 94.7 94.6 92.2 92.5 92.8
Core and additional science 64.0 65.7 64.2 61.0 62.7 59.4
Double science x(b)
27.3 56.8 44.4 48.7 43.5
Source: Key stage 4 attainment data
a. To achieve the three sciences EBacc science pathway, pupils must achieve A*-C in at least two of
biology, chemistry, physics and computer science, having entered at least three.
b. Suppressed due to small number of entries.
7 Core and additional science, together with further additional science, cover the same breadth of curriculum as biology, chemistry
and physics GCSEs
9
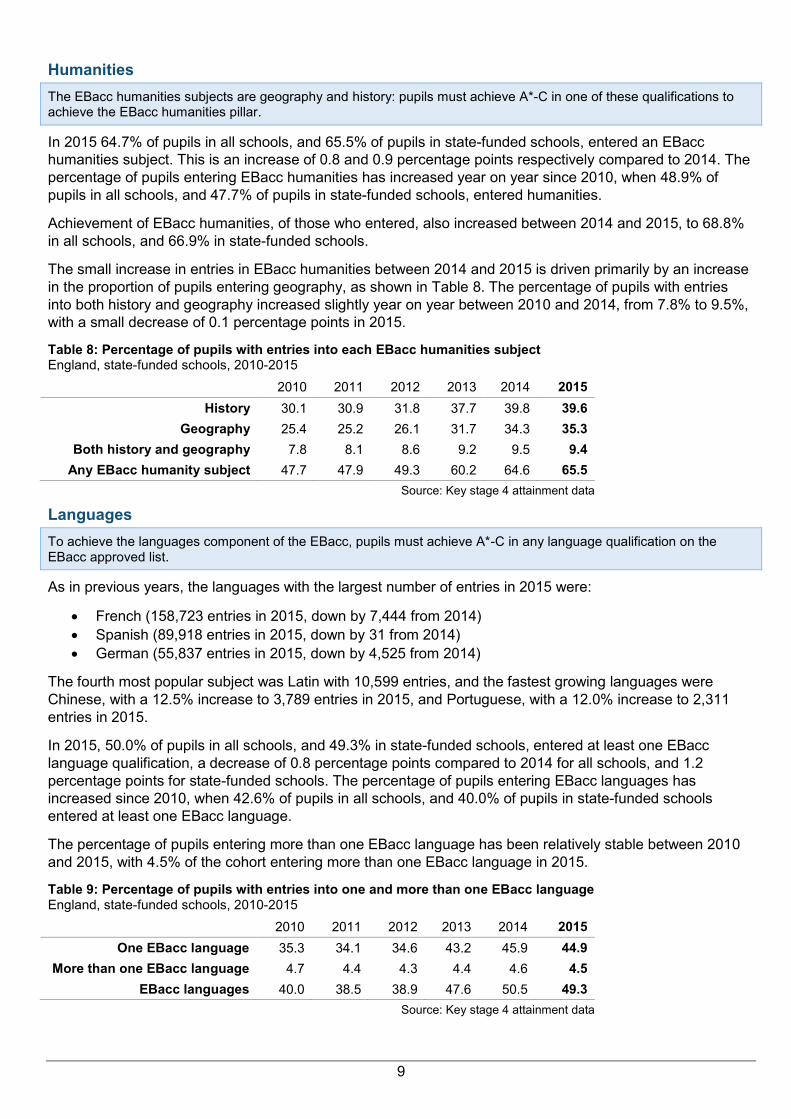
Humanities
The EBacc humanities subjects are geography and history: pupils must achieve A*-C in one of these qualifications to achieve the EBacc humanities pillar.
In 2015 64.7% of pupils in all schools, and 65.5% of pupils in state-funded schools, entered an EBacc
humanities subject. This is an increase of 0.8 and 0.9 percentage points respectively compared to 2014. The
percentage of pupils entering EBacc humanities has increased year on year since 2010, when 48.9% of
pupils in all schools, and 47.7% of pupils in state-funded schools, entered humanities.
Achievement of EBacc humanities, of those who entered, also increased between 2014 and 2015, to 68.8%
in all schools, and 66.9% in state-funded schools.
The small increase in entries in EBacc humanities between 2014 and 2015 is driven primarily by an increase
in the proportion of pupils entering geography, as shown in Table 8. The percentage of pupils with entries
into both history and geography increased slightly year on year between 2010 and 2014, from 7.8% to 9.5%,
with a small decrease of 0.1 percentage points in 2015.
Table 8: Percentage of pupils with entries into each EBacc humanities subject England, state-funded schools, 2010-2015
2010 2011 2012 2013 2014 2015
History 30.1 30.9 31.8 37.7 39.8 39.6
Geography 25.4 25.2 26.1 31.7 34.3 35.3
Both history and geography 7.8 8.1 8.6 9.2 9.5 9.4
Any EBacc humanity subject 47.7 47.9 49.3 60.2 64.6 65.5
Source: Key stage 4 attainment data
Languages
To achieve the languages component of the EBacc, pupils must achieve A*-C in any language qualification on the EBacc approved list.
As in previous years, the languages with the largest number of entries in 2015 were:
French (158,723 entries in 2015, down by 7,444 from 2014)
Spanish (89,918 entries in 2015, down by 31 from 2014)
German (55,837 entries in 2015, down by 4,525 from 2014)
The fourth most popular subject was Latin with 10,599 entries, and the fastest growing languages were
Chinese, with a 12.5% increase to 3,789 entries in 2015, and Portuguese, with a 12.0% increase to 2,311
entries in 2015.
In 2015, 50.0% of pupils in all schools, and 49.3% in state-funded schools, entered at least one EBacc
language qualification, a decrease of 0.8 percentage points compared to 2014 for all schools, and 1.2
percentage points for state-funded schools. The percentage of pupils entering EBacc languages has
increased since 2010, when 42.6% of pupils in all schools, and 40.0% of pupils in state-funded schools
entered at least one EBacc language.
The percentage of pupils entering more than one EBacc language has been relatively stable between 2010
and 2015, with 4.5% of the cohort entering more than one EBacc language in 2015.
Table 9: Percentage of pupils with entries into one and more than one EBacc language England, state-funded schools, 2010-2015
2010 2011 2012 2013 2014 2015
One EBacc language 35.3 34.1 34.6 43.2 45.9 44.9
More than one EBacc language 4.7 4.4 4.3 4.4 4.6 4.5
EBacc languages 40.0 38.5 38.9 47.6 50.5 49.3
Source: Key stage 4 attainment data

10
Achievement of EBacc languages, of those who entered, increased between 2014 and 2015, from 71.1% to
72.7% in all schools, and 68.9% to 70.5% in state-funded schools.
Other subjects 5.
Arts
The number of pupils with GCSE entries into art and design, music, media/film/TV, dance, and performing
arts increased in 2015 compared to 2014, despite the slight fall in the number of pupils in the cohort. The
number of pupils with entries into drama and applied art and design fell slightly.
The number of pupils with entries into art and design has increased year on year since 2012, up to 176,064
in 2015, following a small fall between 2011 and 2012.
Table 10: Number of pupils with entries into GCSE arts subjects England, all schools, 2011-2015
8
2011 2012 2013 2014 2015
Applied Art & Design 1,476 1,171 1,051 855 823
Art & Design 162,342 159,012 164,510 170,872 176,064
Drama 74,755 70,371 69,754 70,909 70,803
Media/Film/TV 51,783 49,478 48,698 51,295 51,570
Music 43,157 40,761 41,256 42,404 43,654
Dance 13,177 11,942 11,540 11,916 11,981
Performing Arts 2,648 2,270 3,079 4,502 5,997
Source: Key stage 4 attainment data
Religious studies
Entries to full course GCSE religious studies increased year on year between 2011 and 2015, with 269,107
pupils entering in 2015.
Table 11: Number of pupils with entries into religious studies England, all schools, 2011-2015
8
2011 2012 2013 2014 2015
Religious studies 195,109 210,602 229,009 258,745 269,107
Source: Key stage 4 attainment data
Attainment by school type 6.
Schools in England can be divided into state-funded and independent schools. Independent schools are
funded by fees paid by attendees. State-funded and independent schools are considered separately in this
section, because the department holds state-funded schools accountable for their performance. Independent
schools are not held to account by the department and also follow different qualification entry patterns.
State-funded mainstream schools
Schools can be split into groups according to their governance. Further information on the different school
types can be found in the quality and methodology document accompanying this SFR.
The proportion of pupils achieving 5+ A*-C grades including English and maths GCSEs by school type is
shown in Table 12.
8 Discounting has been applied where pupils have taken the same subject more than once and only one entry is counted in these
circumstances. Prior to 2011 no discounting was applied and all entries and achievements were included, therefore figures here are shown only for 2011 onwards.
11
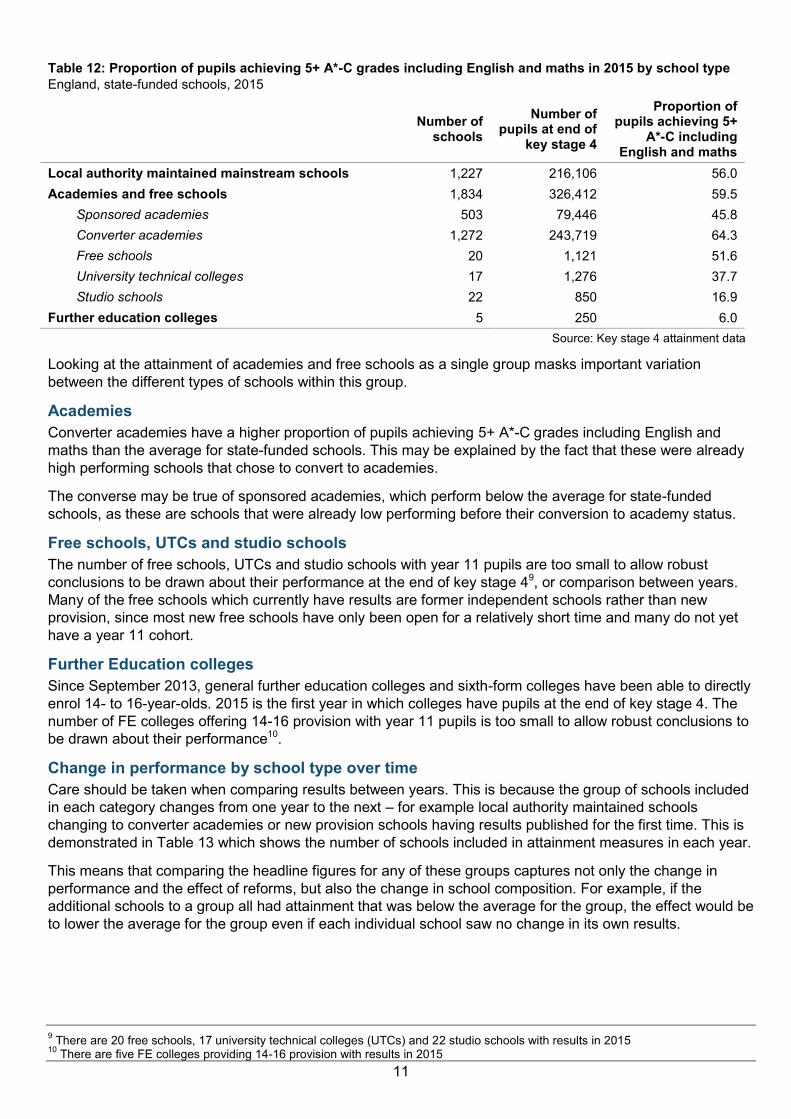
Table 12: Proportion of pupils achieving 5+ A*-C grades including English and maths in 2015 by school type
England, state-funded schools, 2015
Number of schools
Number of pupils at end of
key stage 4
Proportion of pupils achieving 5+
A*-C including English and maths
Local authority maintained mainstream schools 1,227 216,106 56.0
Academies and free schools 1,834 326,412 59.5
Sponsored academies 503 79,446 45.8
Converter academies 1,272 243,719 64.3
Free schools 20 1,121 51.6
University technical colleges 17 1,276 37.7
Studio schools 22 850 16.9
Further education colleges 5 250 6.0
Source: Key stage 4 attainment data
Looking at the attainment of academies and free schools as a single group masks important variation
between the different types of schools within this group.
Academies
Converter academies have a higher proportion of pupils achieving 5+ A*-C grades including English and
maths than the average for state-funded schools. This may be explained by the fact that these were already
high performing schools that chose to convert to academies.
The converse may be true of sponsored academies, which perform below the average for state-funded
schools, as these are schools that were already low performing before their conversion to academy status.
Free schools, UTCs and studio schools
The number of free schools, UTCs and studio schools with year 11 pupils are too small to allow robust
conclusions to be drawn about their performance at the end of key stage 49, or comparison between years.
Many of the free schools which currently have results are former independent schools rather than new
provision, since most new free schools have only been open for a relatively short time and many do not yet
have a year 11 cohort.
Further Education colleges
Since September 2013, general further education colleges and sixth-form colleges have been able to directly
enrol 14- to 16-year-olds. 2015 is the first year in which colleges have pupils at the end of key stage 4. The
number of FE colleges offering 14-16 provision with year 11 pupils is too small to allow robust conclusions to
be drawn about their performance10.
Change in performance by school type over time
Care should be taken when comparing results between years. This is because the group of schools included
in each category changes from one year to the next – for example local authority maintained schools
changing to converter academies or new provision schools having results published for the first time. This is
demonstrated in Table 13 which shows the number of schools included in attainment measures in each year.
This means that comparing the headline figures for any of these groups captures not only the change in
performance and the effect of reforms, but also the change in school composition. For example, if the
additional schools to a group all had attainment that was below the average for the group, the effect would be
to lower the average for the group even if each individual school saw no change in its own results.
9 There are 20 free schools, 17 university technical colleges (UTCs) and 22 studio schools with results in 2015
10 There are five FE colleges providing 14-16 provision with results in 2015

12
Table 13: Number of LA maintained schools and academies with results, by school type England, 2014-2015
School type Number of schools with results in 2014
Number of schools with results in 2015
Local authority maintained mainstream schools 1,362 1,227
Sponsored academies 441 503
Converter academies 1,201 1,272
Total number of academies and LA maintained schools
3,004 3,002
Source: Key stage 4 attainment data
To better understand the performance of academies, performance data can be used to calculate a five year
time series to show how results have changed since opening. Table 14 shows results in each year by length
of time open and is read from left to right, row by row, for comparison. The shaded cell in a series represents
the performance of the predecessor schools in that year. The local authority maintained mainstream line only
includes schools who had maintained status in all years shown. Due to the reforms introduced in September
2013, results from 2014 and 2015 cannot be directly compared with the earlier parts of the time series.
Table 14: Percentage of pupils achieving 5+ A*-C including English and maths in academies and LA maintained schools by length of time open England, 2011-2015
Number of schools
with results
Percentage of pupils achieving 5+ A*-C grades including English and maths
2011 2012 2013 2014 2015
Sponsored academies
Open for 1 academic year 59 45.0 45.8
Open for 2 academic years 77 46.2 41.5 43.8
Open for 3 academic years 59 46.0 48.1 41.7 43.0
Open for 4 academic years 47 44.0 45.8 48.7 44.7 45.0
Open for 5 or more academic years 261 46.9 50.1 52.5 47.6 47.1
All sponsored academies 503 44.6 46.8 49.8 45.4 45.8
Converter academies
Open for 1 academic year 67 61.6 60.2
Open for 2 academic years 160 63.0 56.9 58.0
Open for 3 academic years 366 63.3 65.2 61.3 61.5
Open for 4 academic years 654 68.5 68.2 69.8 66.3 67.4
Open for 5 or more academic years 25 76.3 75.3 73.5 71.6 72.2
All converter academies 1,272 65.9 66.0 67.5 63.6 64.3
All local authority maintained schools 1,227 57.6 58.1 59.9 55.6 56.0
Source: Key stage 4 attainment data
1. Includes academies and LA maintained schools that were open before 12 September 2014 (which is the cut-off date for inclusion in performance tables). 2. For this table one academic year is between 12 September 2013 and 11 September 2014. 3. The ‘All sponsored academies’ and ‘All converter academies’ figures include data for all schools which were academies on 12 September 2014 irrespective of their type in previous years. 4. The figures for ‘Number of schools with results’ are based on those with results in 2015. 5. Shaded cells contain information for the predecessor school for sponsored academies and for the school prior conversion for converter academies. 6. In 2015, early entry policy, under which only a pupil’s first attempt at a qualification is counted in performance measures, is extended to all subjects. 7. It is not possible to make direct comparisons between 2014 and earlier years due to changes in methodology, examinations and behaviour.
13
Table 14 shows increases in attainment in both sponsored academies and LA maintained schools between
2014 and 2015, with a rise in attainment of 0.4 percentage points for both, to 45.8% and 56.0% respectively.
Over the same period, attainment in converter academies increased from 63.6 to 64.3% (an increase of 0.7
percentage points).
Measuring improvement over time is important. It can show whether underperforming schools or groups of
schools (for example, schools that have become sponsored academies) are catching up with higher
performing schools. However, when interpreting such measures it should be noted that the extent to which a
school improves is related to a range of factors, which makes it difficult to fully reflect the effect of any
individual factor. Schools with the lowest previous outcomes tend to see the largest improvements but simply
controlling for starting points does nothing to account for the very different circumstances which may exist in
two schools. For example, in two schools with the same outcomes, pupils might be far exceeding
expectations given prior attainment in one while, in the other, pupils might be making less progress than
expected. This will affect the relative ability to demonstrate improvement. For further discussion and analysis
of these issues, see Attainment by pupils in academies 2012 and Measuring the performance of schools
within academy chains and local authorities.
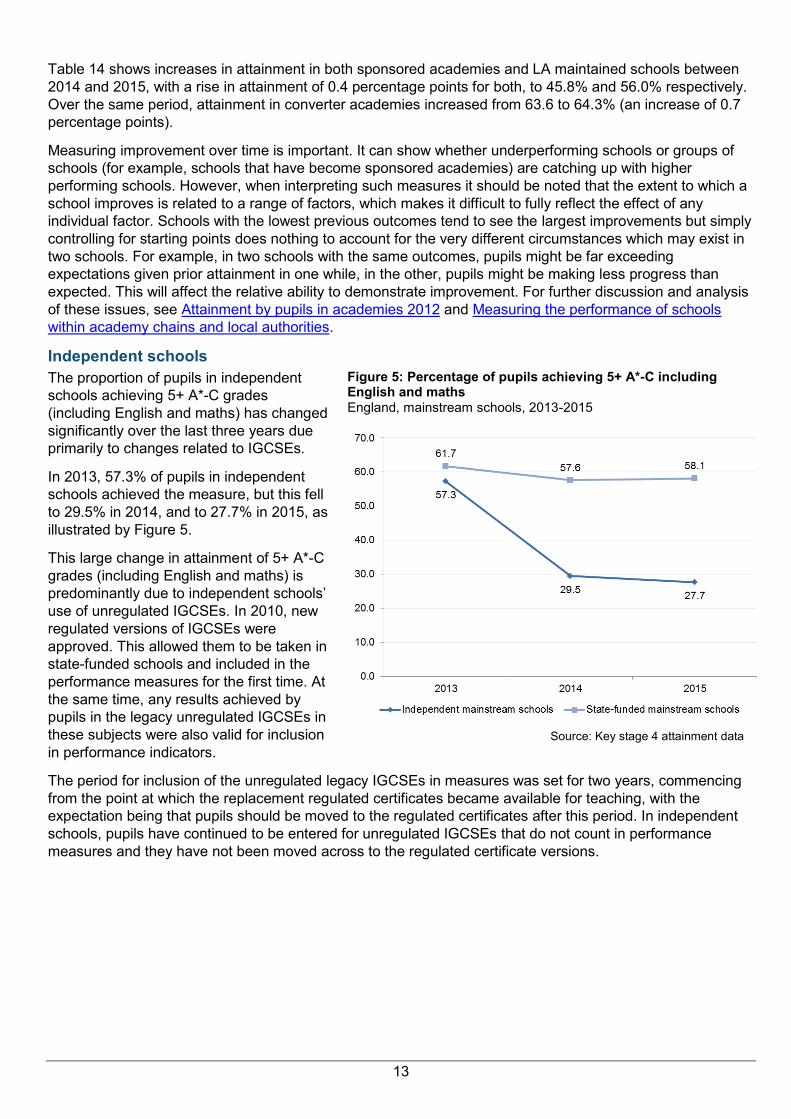
Independent schools
The proportion of pupils in independent
schools achieving 5+ A*-C grades
(including English and maths) has changed
significantly over the last three years due
primarily to changes related to IGCSEs.
In 2013, 57.3% of pupils in independent
schools achieved the measure, but this fell
to 29.5% in 2014, and to 27.7% in 2015, as
illustrated by Figure 5.
This large change in attainment of 5+ A*-C
grades (including English and maths) is
predominantly due to independent schools’
use of unregulated IGCSEs. In 2010, new
regulated versions of IGCSEs were
approved. This allowed them to be taken in
state-funded schools and included in the
performance measures for the first time. At
the same time, any results achieved by
pupils in the legacy unregulated IGCSEs in
these subjects were also valid for inclusion
in performance indicators.
Figure 5: Percentage of pupils achieving 5+ A*-C including English and maths England, mainstream schools, 2013-2015
Source: Key stage 4 attainment data
The period for inclusion of the unregulated legacy IGCSEs in measures was set for two years, commencing
from the point at which the replacement regulated certificates became available for teaching, with the
expectation being that pupils should be moved to the regulated certificates after this period. In independent
schools, pupils have continued to be entered for unregulated IGCSEs that do not count in performance
measures and they have not been moved across to the regulated certificate versions.

14
Entry patterns 7.
In September 2013, the department announced that only the first result a pupil achieved would count in performance measures from 2013/14 onwards. The new rule only applied to EBacc subjects in 2013/14 and has been expanded to apply to all subjects in 2014/15.
EBacc subjects
Figures for 2015 show that there has been a large
decrease in the proportion of EBacc qualifications
attempted more than once in comparison to 2014:
in 2015 3.1% of EBacc qualifications were
attempted more than once, compared to 12.1% in
2014. Furthermore, the proportion of EBacc
subjects attempted three or more times is now
negligible.
Table 15: Multiple entry into EBacc subjects England, all schools, 2014-2015
2014 2015
Number of qualifications attempted
3,554,820 3,593,975
Percentage attempted:
Once 87.9 96.9
Twice 10.5 2.8
Three or more times 1.6 0.3
Source: Key stage 4 attainment data
This suggests that early entry policy has changed school behaviour and discourages schools from entering
pupils into EBacc subjects multiple times.
Non-EBacc subjects
Table 16: Multiple entry into non-EBacc subjects England, all schools, 2014-2015
2014 2015
Number of qualifications attempted
1,892,052 1,855,697
Percentage attempted:
Once 96.9 96.9
Twice 3.0 3.0
Three or more times 0.1 0.1
Source: Key stage 4 attainment data
Multiple entries in non-EBacc subjects remain very low in 2015: almost 97% of non-EBacc subjects were attempted once, and only 0.1% attempted three times or more. These figures have not changed since 2014 and suggest that entry patterns for non-EBacc subjects have not been affected by the expansion of early entry policy to all subjects. This is expected because early and multiple entry had been shown to have a greater impact in EBacc subjects than non-EBacc subjects11. This supports the decision not to publish an additional methodology where the effects of the expansion of early entry policy have been removed.
11 See https://www.gov.uk/government/publications/early-entry-to-gcse-examinations
15
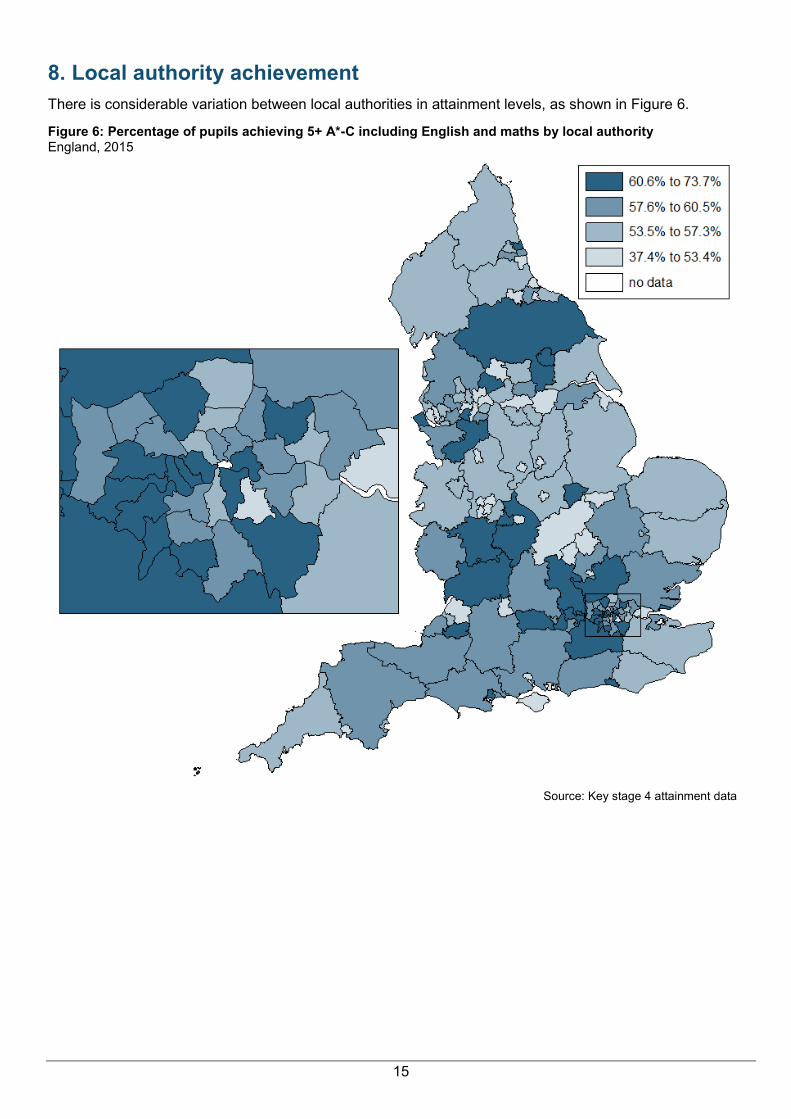
Local authority achievement 8.
There is considerable variation between local authorities in attainment levels, as shown in Figure 6.
Figure 6: Percentage of pupils achieving 5+ A*-C including English and maths by local authority England, 2015
Source: Key stage 4 attainment data
16
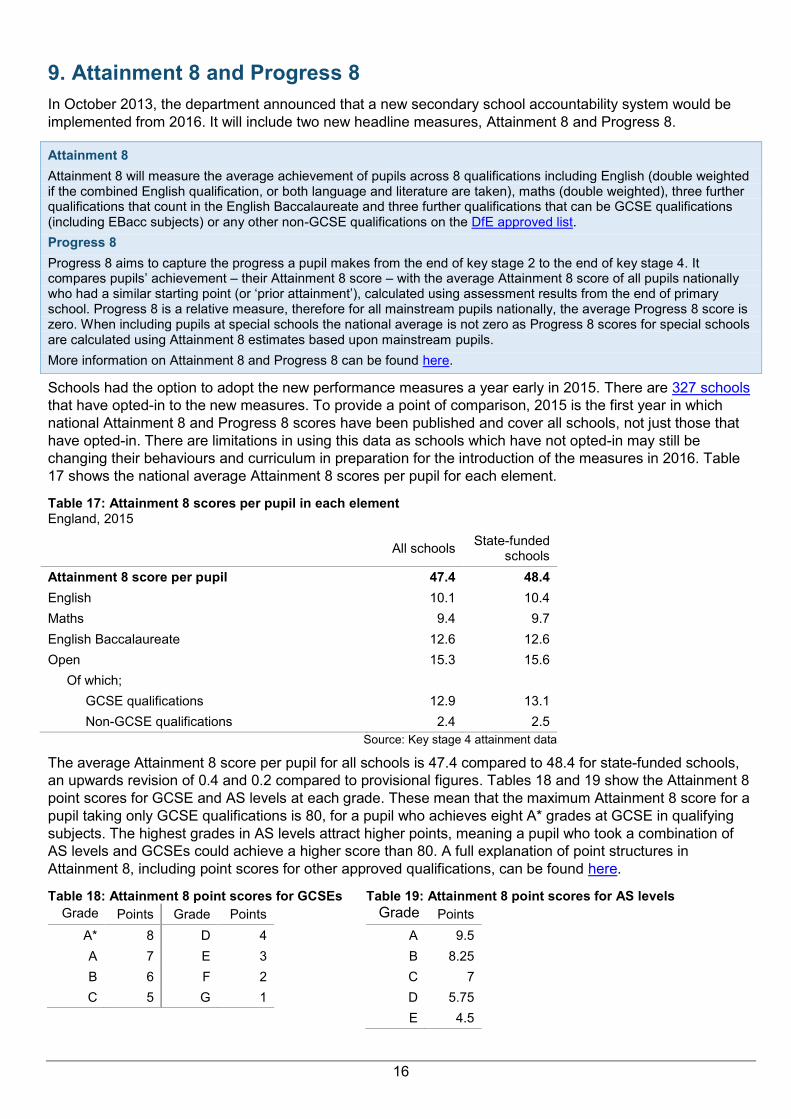
Attainment 8 and Progress 8 9.
In October 2013, the department announced that a new secondary school accountability system would be
implemented from 2016. It will include two new headline measures, Attainment 8 and Progress 8.
Attainment 8
Attainment 8 will measure the average achievement of pupils across 8 qualifications including English (double weighted if the combined English qualification, or both language and literature are taken), maths (double weighted), three further qualifications that count in the English Baccalaureate and three further qualifications that can be GCSE qualifications (including EBacc subjects) or any other non-GCSE qualifications on the DfE approved list.
Progress 8
Progress 8 aims to capture the progress a pupil makes from the end of key stage 2 to the end of key stage 4. It compares pupils’ achievement – their Attainment 8 score – with the average Attainment 8 score of all pupils nationally who had a similar starting point (or ‘prior attainment’), calculated using assessment results from the end of primary school. Progress 8 is a relative measure, therefore for all mainstream pupils nationally, the average Progress 8 score is zero. When including pupils at special schools the national average is not zero as Progress 8 scores for special schools are calculated using Attainment 8 estimates based upon mainstream pupils.
More information on Attainment 8 and Progress 8 can be found here.
Schools had the option to adopt the new performance measures a year early in 2015. There are 327 schools
that have opted-in to the new measures. To provide a point of comparison, 2015 is the first year in which
national Attainment 8 and Progress 8 scores have been published and cover all schools, not just those that
have opted-in. There are limitations in using this data as schools which have not opted-in may still be
changing their behaviours and curriculum in preparation for the introduction of the measures in 2016. Table
17 shows the national average Attainment 8 scores per pupil for each element.
Table 17: Attainment 8 scores per pupil in each element England, 2015
All schools
State-funded schools
Attainment 8 score per pupil 47.4 48.4
English 10.1 10.4
Maths 9.4 9.7
English Baccalaureate 12.6 12.6
Open 15.3 15.6
Of which;
GCSE qualifications 12.9 13.1
Non-GCSE qualifications 2.4 2.5
Source: Key stage 4 attainment data
The average Attainment 8 score per pupil for all schools is 47.4 compared to 48.4 for state-funded schools,
an upwards revision of 0.4 and 0.2 compared to provisional figures. Tables 18 and 19 show the Attainment 8
point scores for GCSE and AS levels at each grade. These mean that the maximum Attainment 8 score for a
pupil taking only GCSE qualifications is 80, for a pupil who achieves eight A* grades at GCSE in qualifying
subjects. The highest grades in AS levels attract higher points, meaning a pupil who took a combination of
AS levels and GCSEs could achieve a higher score than 80. A full explanation of point structures in
Attainment 8, including point scores for other approved qualifications, can be found here.
Table 18: Attainment 8 point scores for GCSEs
Grade Points Grade Points
A* 8 D 4
A 7 E 3
B 6 F 2
C 5 G 1
Table 19: Attainment 8 point scores for AS levels
Grade Points
A 9.5
B 8.25
C 7
D 5.75
E 4.5
17
The difference between the all schools and state-funded schools figures is related to the impact of
unregulated IGCSEs taken in independent schools. More information on the use of unregulated IGCSEs is
given in the section on independent schools in Section 6.
The open element shows the highest Attainment 8 score at 15.3 for all schools and 15.6 for state-funded
schools. Up to three GCSE or non-GCSE qualifications can count in the open element. This score will
therefore reflect a wide range of subjects and qualifications.
Pupils in state-funded schools have an average score of 13.1 from the GCSE qualifications, compared to 2.5
from non-GCSE qualifications. However it should be noted that this is an average, and for some pupils the
points contributed by non-GCSE qualifications will be higher. When there is a tie on points between a GCSE
and non-GCSE qualification, the methodology prioritises the GCSE qualification.
Attainment 8 and Progress 8 by disadvantage
Attainment 8 and Progress 8 figures are also published for state-funded schools for disadvantaged pupils
and all other pupils. The average Attainment 8 score per disadvantaged pupil is 39.0 compared to 52.0 for
other pupils, a gap of 13.0 points. On Progress 8, disadvantaged pupils have a score of -0.40, compared to
other pupils’ score of 0.12.
Other pupils outperform disadvantaged pupils across all elements of Attainment 8. The smallest difference is
for the English element, with disadvantaged pupils achieving 8.9 points and other pupils achieving 11.0, a
gap of 2.1 points. The difference is greatest in the EBacc element of Attainment 8, with disadvantaged pupils
achieving 9.0 points compared to 14.0 for other pupils, a gap of 5.0 points. This may be due to subject
choices by disadvantaged pupils, who are less likely to enter the EBacc. More information on attainment of
disadvantaged pupils is given in Section 11 on pupil characteristics.
Floor standards 10.
In 2015 schools were assessed against one of two floor standards. All schools had the opportunity to opt in
to the Progress 8 measure this year and 327 chose to do so, with two of these schools closing after opting in.
These schools were assessed against the Progress 8 floor standard. The remainder of schools were
assessed against the 5+ A*-C and expected progress floor standard (see below), which is the same floor
standard as in 2013 and 2014. Floor standards only apply to state-funded mainstream schools and not to
special schools, independent schools, pupil referral units, alternative provision or hospital schools. More
information on Progress 8 is given in Section 9.
Floor standards
• 5+ A*-C and expected progress floor standard
A school is below this floor standard if:
1. less than 40% of pupils achieve 5 or more A*-C GCSEs (or equivalent) including English and maths; and 2. the percentage of pupils making expected progress between key stage 2 and key stage 4 in English and maths is less than the national median for all state-funded mainstream schools
12
Schools are only included in the 5+ A*-C and expected progress floor standard calculation if they have more than 10 pupils at the end of key stage 4, they have published results in all of the measures above, and have not opted in to Progress 8.
• Progress 8 floor standard
A school below the Progress 8 floor standard if:
1. its Progress 8 score is below -0.5; and 2. the upper band of the 95% confidence interval is below zero
Schools are only included in the Progress 8 floor standard calculation if they have opted in to Progress 8, have more than 5 pupils at the end of key stage 4 and more than 50% of pupils have key stage 2 assessments that can be used as prior attainment in the calculations of Progress 8.
In 2015 the median percentage of pupils making expected progress between key stage 2 and key stage 4
was 73% in English and 68% maths.
12 Schools are ranked in terms of their expected progress from lowest to highest and the median is the resulting middle number
18
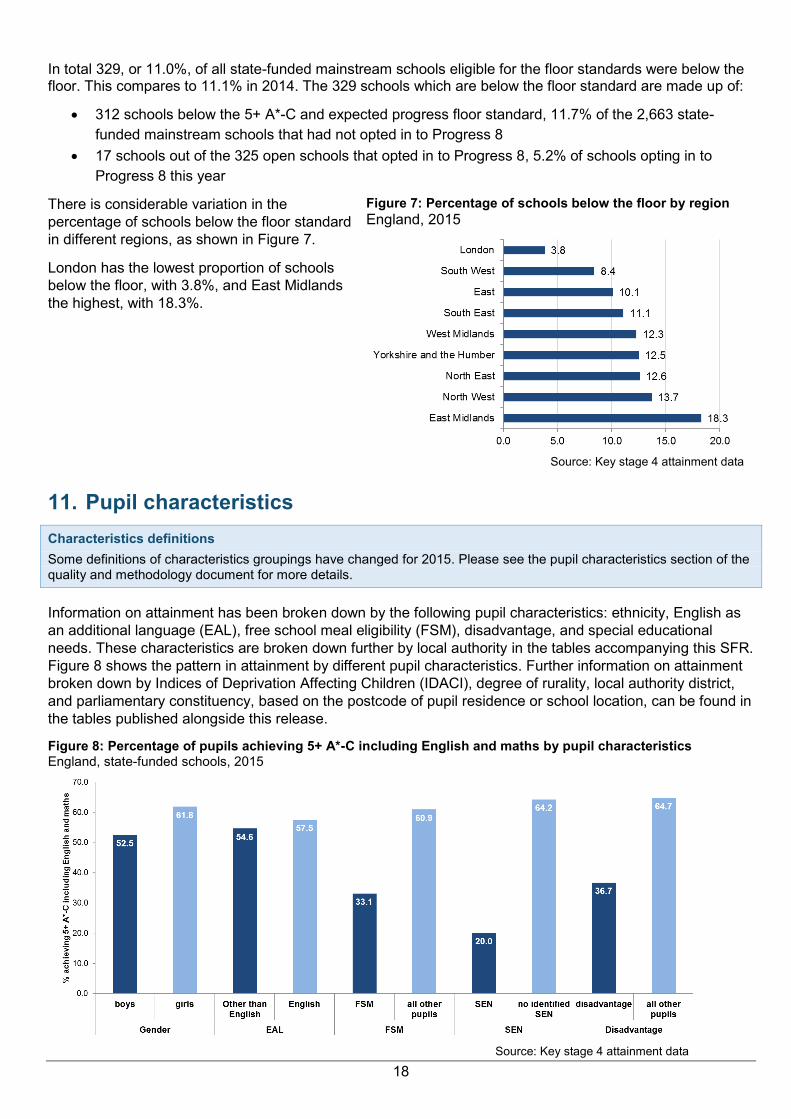
In total 329, or 11.0%, of all state-funded mainstream schools eligible for the floor standards were below the floor. This compares to 11.1% in 2014. The 329 schools which are below the floor standard are made up of:
312 schools below the 5+ A*-C and expected progress floor standard, 11.7% of the 2,663 state-
funded mainstream schools that had not opted in to Progress 8
17 schools out of the 325 open schools that opted in to Progress 8, 5.2% of schools opting in to
Progress 8 this year
There is considerable variation in the
percentage of schools below the floor standard
in different regions, as shown in Figure 7.
London has the lowest proportion of schools
below the floor, with 3.8%, and East Midlands
the highest, with 18.3%.
Figure 7: Percentage of schools below the floor by region
England, 2015
Source: Key stage 4 attainment data
Pupil characteristics 11.
Characteristics definitions
Some definitions of characteristics groupings have changed for 2015. Please see the pupil characteristics section of the quality and methodology document for more details.
Information on attainment has been broken down by the following pupil characteristics: ethnicity, English as
an additional language (EAL), free school meal eligibility (FSM), disadvantage, and special educational
needs. These characteristics are broken down further by local authority in the tables accompanying this SFR.
Figure 8 shows the pattern in attainment by different pupil characteristics. Further information on attainment
broken down by Indices of Deprivation Affecting Children (IDACI), degree of rurality, local authority district,
and parliamentary constituency, based on the postcode of pupil residence or school location, can be found in
the tables published alongside this release.
Figure 8: Percentage of pupils achieving 5+ A*-C including English and maths by pupil characteristics England, state-funded schools, 2015
Source: Key stage 4 attainment data

19
Disadvantage: Gap Index
Experimental Statistics
Last year we consulted on a new measure of the gap in attainment between disadvantaged pupils and others which provides greater comparability between years. 'Calculating the index' summarises how the measure is applied; and more details of the methodology and consultation were published in SFR 40/2014.
Disadvantage
Pupils are defined as disadvantaged if they are known to have been eligible for free school meals in the past six years (from year 6 to year 11), if they are recorded as having been looked after for at least one day or if they are recorded as having been adopted from care.
In 2015, 27.3% of pupils at the end of key stage 4 were disadvantaged.
Attainment is lower for disadvantaged pupils compared to all other pupils across all headline measures in
2015, as seen in previous years. We recommend that the new gap index is used to look at the difference in
attainment between disadvantaged and other pupils.
Calculating the Index
Pupils are ordered by average grade in English and maths GCSEs.
The average rank of disadvantaged pupils was 0.36, meaning the average pupil was just over a third of the way up the distribution, while that of other pupils was 0.55, more than halfway up the distribution (see Figure 9).
The disadvantaged pupils’ attainment gap index multiplies the difference between these by 20:
(0.552 – 0.362) x 20 = 3.80
The gap is measured on a scale of 0 to 10 (or minus 10 if disadvantaged pupils achieved higher)
The gap between disadvantaged pupils and
others, measured using the new index,
decreased in three of the last four years,
narrowing by 6.6% overall since 2011. In the
latest year it showed a small increase of 1.6%,
as shown in Table 20. This shows that the
average position of disadvantaged pupils in the
distribution compared to others remains similar
to that in 2013.
Table 20: Trend in the disadvantaged pupils’ attainment gap index England, state-funded schools, 2011-2015
2011 2012 2013 2014 2015
Gap index 4.07 3.89 3.81 3.74 3.80
Source: National pupil database and key stage 4 attainment data
The definition of “disadvantaged pupils” changed this year, to include pupils looked after for one day or more
(instead of those looked after for at least six months), and pupils who have left care through adoption,
special guardianship, child arrangement or residence orders, who were not previously included. The
expansion of the definition has had a small impact on overall numbers, adding around 1,000 pupils at end of
year 11 or less than 1% of the disadvantaged group. However, the impact on attainment is larger due to the
presence of some of the lowest performing pupil groups. On the old definition, the gap index would be slightly
smaller, at 3.77.
Figure 9 shows the distribution of pupils’ results in English and maths GCSEs in 2015, from lowest
attainment on the left to the highest attainment on the right. Dark blue lines represent disadvantaged pupils,
while light blue lines represent others. Although there were some disadvantaged pupils among the highest
attainers, they were more likely to be clustered at the lower attaining end. The gap index measures the
distance between the average position of disadvantaged and other pupils in the distribution (shown by
arrows); if disadvantage were not associated with differences in attainment, pupils would be evenly spaced
and the gap would be zero, but currently the average position of disadvantaged pupils is lower than others.
The average positions have become closer together since 2011 but moved apart in the latest year.

20
Figure 9: The distribution of pupil attainment, disadvantaged pupils and others England, 2015
13
Dark blue lines represent disadvantaged pupils, while light blue lines represent others.
Source: Key stage 4 attainment data
To understand more about differences between the two groups we can look at illustrative points in the
distribution and compare how likely pupils are to be particularly high or low achievers.
For example, 93% who were not disadvantaged achieved an average grade of E or above in English and
maths. Disadvantaged pupils are more likely to be low achieving, and 77% of disadvantaged pupils achieved
E or above.
Disadvantaged pupils are also under-represented at the high achieving end. The top 15% of non-
disadvantaged pupils achieved an A or above (achieving either A/A*s in both assessments, or one B and one
A*); however, only 4% of disadvantaged pupils reached this standard.
Table 21: Attainment of disadvantaged pupils and others across the distribution England, 2015
English and
maths average
grade at or
above:
Percentage of disadvantaged
pupils achieving
Percentage of other pupils achieving
Percentage of all pupils achieving
Percentage point gap
Odds ratio: disadvantaged compared to
others
G 91.8 98.0 96.3 6.1 4.3
F 86.0 96.3 93.4 10.2 4.2
E 77.4 92.8 88.6 15.4 3.8
D 65.7 86.9 81.1 21.1 3.4
C 42.6 70.1 62.6 27.5 3.2
B 15.8 38.3 32.2 22.5 3.3
A 3.9 14.7 11.7 10.8 4.2
A* 0.3 2.1 1.6 1.8 6.3
Source: Key stage 4 attainment data
Odds ratios are used to compare pupils’ chances of achieving different outcomes14. When an outcome is
achieved by almost all, or very few, pupils there might be a small difference in the proportions achieving it,
but a large difference in the likelihood of achieving (or the risk of not achieving) that outcome.
13 The diagram shows the position of every 1000
th disadvantaged pupil and every 1000
th other pupil at the end of key stage 4 in 2015,
in order of their average grade across English and mathematics. The average position for each group is indicated. 14
Odds ratios compare different pupils’ chances of achieving or missing out on a measure. The odds against pupils in each group achieving a standard are calculated: for example, if 25% of disadvantaged pupils achieved B or above, the odds against them achieving would be 3 to 1 (i.e. 75% vs. 25%). For each disadvantaged pupil who achieves, 3 others do not. The odds ratio compares the odds for disadvantaged pupils with the odds for the other group. If the odds against disadvantaged pupils achieving are higher the ratio will be greater than 1, suggesting that disadvantaged pupils are less likely to achieve. A higher ratio indicates a greater disparity in pupils’ chances. Odds ratios have been calculated on unrounded data.
mean rank of disadvantaged pupils = 0.36
mean rank of other pupils = 0.55
high attainerslow attainers

21
The odds against disadvantaged pupils achieving at least a C average in English and maths are around
three times as high as for other pupils. The odds ratios for English and maths attainment at GCSE increases
at both higher and lower attainment thresholds, with the odds against achieving at least an A average being
over four times as high for disadvantaged pupils as others, and over six times as high for achieving A* in
both English and maths. These higher odds ratios indicate the difficulty of achieving top marks at key stage 4
for disadvantaged pupils. Odds ratios also rise above 4 for the achievement of basic passes at F and G
grades. Disadvantaged pupils are many times more likely to miss out on achieving these benchmarks, as
shown in Table 21.
Disadvantage: threshold measures
This section is included for transparency, however we recommend that the new gap index (see page 19) is
used in preference to threshold measures for analysing the difference in attainment between disadvantaged
and other pupils.
Attainment is lower for both disadvantaged
and FSM eligible pupils compared to all
other pupils across all headline measures in
2015.
Attainment for disadvantaged pupils
increased across 5+ A*-C including English
and maths, and the percentage entering
and achieving the EBacc, as shown in
Table 22.
Table 22: Percentage of disadvantaged and all other pupils achieving the main attainment indicators England, state-funded schools, 2014-2015
Source: Key stage 4 attainment data
5+ A*-C inc. English and
maths
Entering the EBacc
Achieving the EBacc
2014 2015 2014 2015 2014 2015
Disadvantaged 36.5 36.7 22.9 23.3 10.9 11.2
All other pupils 64.0 64.7 44.5 44.5 29.1 29.2
Gap 27.4 28.0 21.7 21.1 18.1 18.1
The disadvantaged gap for 5+ A*-C including English and maths in 2015 has increased by 0.6 percentage
points since 2014. This is because, although the proportion of disadvantaged pupils achieving 5+ A*-C
including English and maths increased slightly, by 0.2 percentage points to 36.7%, the proportion of all other
pupils achieving this measure increased by 0.8 percentage points to 64.7%15. Conversely, the gap for entry
to the EBacc has narrowed by 0.5 percentage points15. This is because the proportion of disadvantaged
pupils entering the EBacc in 2015 has increased slightly since last year, while the proportion of all other
pupils entering has either decreased or remained the same. The EBacc achievement gap has remained the
same.
Free school meals
Free school meals
Free school meal (FSM) eligibility states whether a pupil's family have claimed eligibility for free school meals in the School Census.
In 2015, 13.8% of pupils at the end of key stage 4 were eligible for free school meals.
The pattern in performance of FSM eligible
pupils in 2015 is broadly similar to that of
disadvantaged pupils. FSM eligible pupils
have lower attainment than that of other
pupils for all of the main indicators at key
stage 4.
Attainment for FSM eligible pupils also
increased for entry and achievement of the
EBacc, and decreased slightly for 5+ A*-C
including English and maths.
Table 23: Percentage of FSM eligible and all other pupils achieving the main attainment indicators England, state-funded schools, 2014-2015
Source: Key stage 4 attainment data
5+ A*-C inc. English and
maths
Entering the EBacc
Achieving the EBacc
2014 2015 2014 2015 2014 2015
FSM 33.5 33.1 21.0 21.2 9.7 9.9
All other pupils 60.5 60.9 41.7 41.5 26.6 26.6
Gap 27.0 27.8 20.7 20.3 16.9 16.6
15 All gaps and changes are calculated on unrounded data.
22
English as an additional language (EAL)
“First Language” is the language to which a child was initially exposed during early development and continues to be exposed to in the home or in the community. It does not mean that pupils are necessarily fluent in a language other than English or cannot speak English.
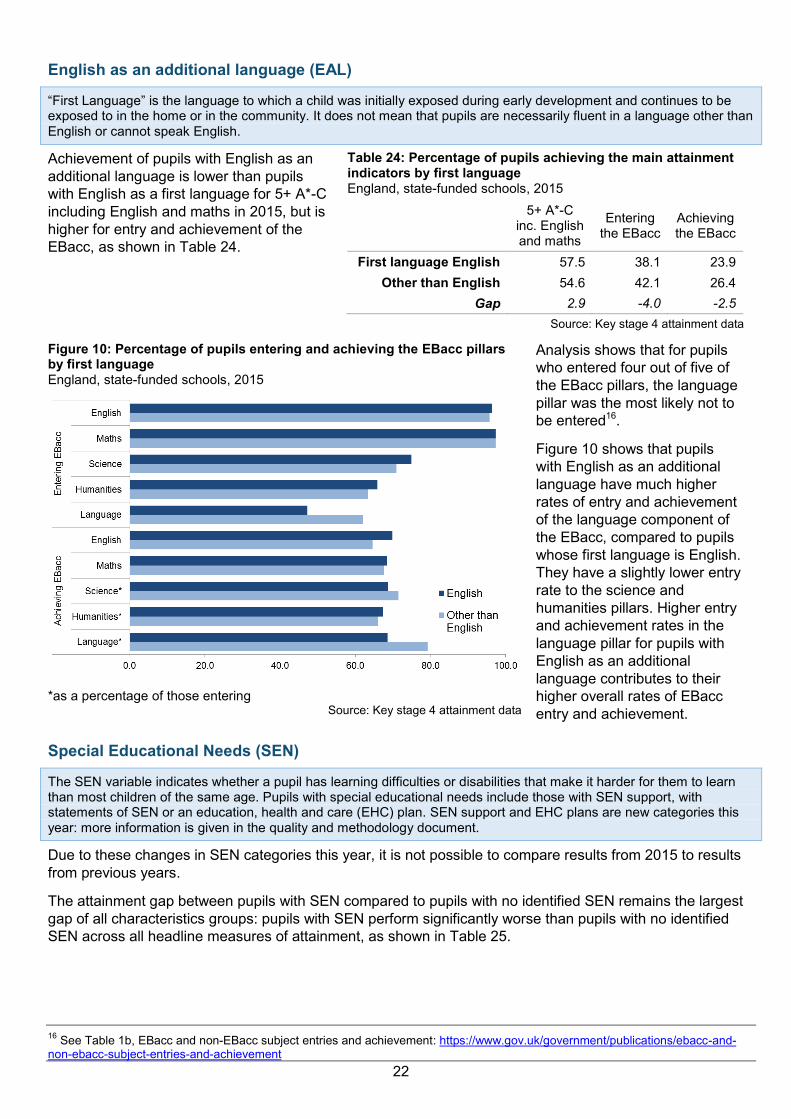
Achievement of pupils with English as an
additional language is lower than pupils
with English as a first language for 5+ A*-C
including English and maths in 2015, but is
higher for entry and achievement of the
EBacc, as shown in Table 24.
Table 24: Percentage of pupils achieving the main attainment indicators by first language England, state-funded schools, 2015
5+ A*-C inc. English and maths
Entering the EBacc
Achieving the EBacc
First language English 57.5 38.1 23.9
Other than English 54.6 42.1 26.4
Gap 2.9 -4.0 -2.5
Source: Key stage 4 attainment data
Figure 10: Percentage of pupils entering and achieving the EBacc pillars by first language England, state-funded schools, 2015
*as a percentage of those entering Source: Key stage 4 attainment data
Analysis shows that for pupils
who entered four out of five of
the EBacc pillars, the language
pillar was the most likely not to
be entered16.
Figure 10 shows that pupils
with English as an additional
language have much higher
rates of entry and achievement
of the language component of
the EBacc, compared to pupils
whose first language is English.
They have a slightly lower entry
rate to the science and
humanities pillars. Higher entry
and achievement rates in the
language pillar for pupils with
English as an additional
language contributes to their
higher overall rates of EBacc
entry and achievement.
Special Educational Needs (SEN)
The SEN variable indicates whether a pupil has learning difficulties or disabilities that make it harder for them to learn than most children of the same age. Pupils with special educational needs include those with SEN support, with statements of SEN or an education, health and care (EHC) plan. SEN support and EHC plans are new categories this year: more information is given in the quality and methodology document.
Due to these changes in SEN categories this year, it is not possible to compare results from 2015 to results
from previous years.
The attainment gap between pupils with SEN compared to pupils with no identified SEN remains the largest
gap of all characteristics groups: pupils with SEN perform significantly worse than pupils with no identified
SEN across all headline measures of attainment, as shown in Table 25.
16 See Table 1b, EBacc and non-EBacc subject entries and achievement: https://www.gov.uk/government/publications/ebacc-and-
non-ebacc-subject-entries-and-achievement

23
Table 25: Percentage of pupils achieving the main attainment indicators by special educational need (SEN) England, state-funded schools, 2015
5+ A*-C GCSEs inc. English and
maths
Entering the EBacc
Achieving the EBacc
No identified SEN 64.2 44.0 28.0
All SEN pupils 20.0 11.0 4.8
Gap 44.2 33.0 23.2
Source: Key stage 4 attainment data
Ethnicity
Ethnicity is broken down into two main variables: a minor grouping variable and a major groupings variable. Those pupils who have been classified according to their ethnic group and are other than white British are defined as minority ethnic.
The pattern in attainment
when split by ethnic group
remains broadly similar to
2014: attainment of Asian,
mixed and Chinese pupils
continues to be above the
national average for 5+ A*-C
including English and maths
and for entry and
achievement of the EBacc,
while attainment of white and
black pupils remains below
the national average for 5+
A*-C including English and
maths, and EBacc
achievement, as shown in
Figure 11. White pupils are
also below the average for
EBacc entry, but black pupils
are slightly above.
Figure 11: Percentage of pupils achieving the main attainment indicators by major ethnic group England, state-funded schools, 2015
Source: Key stage 4 attainment data
Pupil attainment by ethnicity is more varied when figures are broken down further by minor ethnic group and
FSM eligibility, as shown in Figure 12. For example, within the Asian major group, Indian and Bangladeshi
pupils have above-average levels of achievement in 5+ A*-C including English and maths and in the EBacc,
whereas Pakistani pupils have below-average levels of achievement in both of these indicators. Pakistani
pupils who are eligible for FSM fall even further behind the national average. The performance of Indian and
Bangladeshi FSM pupils, however, is only slightly behind the national average for achievement of 5+ A*-C
including English and maths and achievement of the EBacc.
Similar patterns can be seen in minor breakdowns of other major ethnic groups. Achievement of black
African pupils in 5+ A*-C including English and maths is 1.3 percentage points below the national average
and is 0.4 percentage points above the average for achievement of the EBacc. Black Caribbean pupils are
11.1 and 8.1 percentage points below the average in these indicators respectively.
24
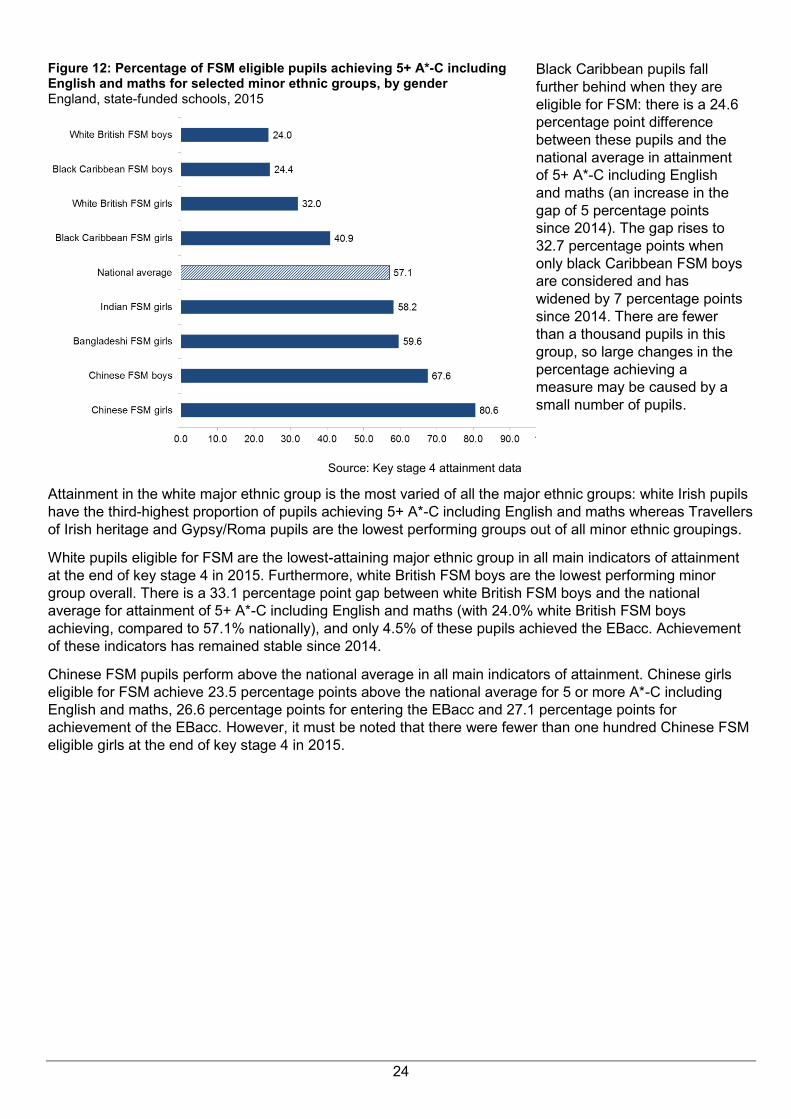
Figure 12: Percentage of FSM eligible pupils achieving 5+ A*-C including English and maths for selected minor ethnic groups, by gender England, state-funded schools, 2015
Source: Key stage 4 attainment data
Black Caribbean pupils fall
further behind when they are
eligible for FSM: there is a 24.6
percentage point difference
between these pupils and the
national average in attainment
of 5+ A*-C including English
and maths (an increase in the
gap of 5 percentage points
since 2014). The gap rises to
32.7 percentage points when
only black Caribbean FSM boys
are considered and has
widened by 7 percentage points
since 2014. There are fewer
than a thousand pupils in this
group, so large changes in the
percentage achieving a
measure may be caused by a
small number of pupils.
Attainment in the white major ethnic group is the most varied of all the major ethnic groups: white Irish pupils
have the third-highest proportion of pupils achieving 5+ A*-C including English and maths whereas Travellers
of Irish heritage and Gypsy/Roma pupils are the lowest performing groups out of all minor ethnic groupings.
White pupils eligible for FSM are the lowest-attaining major ethnic group in all main indicators of attainment
at the end of key stage 4 in 2015. Furthermore, white British FSM boys are the lowest performing minor
group overall. There is a 33.1 percentage point gap between white British FSM boys and the national
average for attainment of 5+ A*-C including English and maths (with 24.0% white British FSM boys
achieving, compared to 57.1% nationally), and only 4.5% of these pupils achieved the EBacc. Achievement
of these indicators has remained stable since 2014.
Chinese FSM pupils perform above the national average in all main indicators of attainment. Chinese girls
eligible for FSM achieve 23.5 percentage points above the national average for 5 or more A*-C including
English and maths, 26.6 percentage points for entering the EBacc and 27.1 percentage points for
achievement of the EBacc. However, it must be noted that there were fewer than one hundred Chinese FSM
eligible girls at the end of key stage 4 in 2015.

25
Accompanying tables 12.
The following tables are available in Excel format on the department’s statistics website:
National tables
1a Time series of GCSE and equivalent entries and
achievements
1b The English Baccalaureate
1c Percentage of pupils making expected progress in
English and in mathematics between key stage 2 and key
stage 4 by gender
1d Percentage of pupils making expected progress in
English and in mathematics between key stage 2 and key
stage 4 by key stage 2 attainment level and key stage 4
outcome
2 Performance of pupils attaining levels 1 and 2 (including
English and mathematics) for pupils in all schools at the
end of key stage 4
3a GCSE and equivalent entries and achievements of
pupils at the end of key stage 4 by type of school and
gender
3b GCSE and equivalent entries and achievements of
pupils at the end of key stage 4 by school admission basis
and gender
3c GCSE and equivalent entries and achievements of
pupils at the end of key stage 4 in sponsored academies
by length of time open
3d GCSE and equivalent entries and achievements of
pupils at the end of key stage 4 in converter academies by
length of time open
3e GCSE and equivalent entries and achievements of
pupils at the end of key stage 4 in academies and LA
maintained schools by length of time open
4a Average point scores and achievement of GCSE
English and mathematics at grades A* to C by pupils at
the end of key stage 4 by type of school and gender
4b Average point scores and achievement of GCSE
English and mathematics at grades A* to C by pupils at
the end of key stage 4 by school admission basis and
gender
5a Percentage of pupils achieving level 2 at the end of
key stage 4 by qualification families, by type of school and
gender
5b Percentage of pupils achieving level 2 at the end of
key stage 4 by qualification families, school admission
basis and gender
6a Attainment of pupils at the end of key stage 4 by prior
attainment band, type of school and gender
6b Attainment of pupils at the end of key stage 4 by prior
attainment band, school admission basis and gender
7a Number of schools showing the percentage of pupils at
the end of key stage 4 achieving the English
Baccalaureate by type of school
7b Number of schools showing the percentage of pupils at
the end of key stage 4 achieving the English
Baccalaureate by school admission basis
8a Number of schools achieving the floor standard
8b Progress 8 opt in schools achieving the floor standard
Characteristics national tables
Summary GCSE and equivalent entries and
achievements of pupils at the end of key stage 4 by pupil
characteristics
CH1 GCSE and equivalent entries and achievements of
pupils at the end of key stage 4 by pupil characteristics
CH 2a GCSE and equivalent entries and achievements of
pupils at the end of key stage 4 by ethnicity, free school
meal eligibility and gender
CH 2b GCSE and equivalent entries and achievements of
pupils at the end of key stage 4 by SEN provision, free
school meal eligibility and gender
CH 2c GCSE and equivalent entries and achievements of
pupils at the end of key stage 4 by SEN provision,
ethnicity and gender
CH 3a Time series of the disadvantaged pupils attainment
gap index at key stage 4 (Experimental statistics)
CH 3b Average English and maths GCSE grade
breakdown of pupils eligible for the pupil premium and
others (Experimental statistics)
Impact indicator 3.8: Attainment gap at age 16 between
free school meal pupils and the rest
Impact indicator 5.18: Attainment gap between schools
with the greatest and the least proportions of
disadvantaged pupils
Attainment 8 and Progress 8 tables
A1 Attainment 8 scores of pupils at the end of key stage 4
A2 Attainment 8 scores of pupils at the end of key stage 4
by disadvantage
A3 Progress 8 achievement of pupils at the end of key
stage 4 by disadvantage
LA tables
LA1 GCSE and equivalent entries and achievements of
pupils at the end of key stage 4 by gender for each local
authority and region

26
LA2 GCSE and equivalent entries and achievements of
pupils at the end of key stage 4 for each local authority
and region
LA3 The English Baccalaureate by local authority and
region
LA4 Percentage of pupils in state-funded mainstream
schools making expected progress in English and in
mathematics between key stage 2 and key stage 4, by
local authority and region
LA5 Percentage of pupils in state-funded schools making
expected progress in English and in mathematics
between key stage 2 and key stage 4, by local authority
and region
LA6 GCSE and equivalent entries and achievements of
pupils at the end of key stage 4 by ethnicity for each local
authority and region
LA7 GCSE and equivalent entries and achievements of
pupils at the end of key stage 4 by English as a first
language for each local authority and region
LA8 GCSE and equivalent entries and achievements of
pupils at the end of key stage 4 by free school meal
eligibility for each local authority and region
LA9 GCSE and equivalent entries and achievements of
pupils at the end of key stage 4 by disadvantage for each
local authority and region
LA10 GCSE and equivalent entries and achievements of
pupils at the end of key stage 4 by SEN provision for each
local authority and region
LA11 Number of schools below the floor standard for each
local authority and region
Subject tables
S1 GCSE entries and achievements in selected subjects
of pupils at the end of key stage 4 in all schools (number)
S2 GCSE entries and achievements in selected subjects
of pupils at the end of key stage 4 in all schools
(percentage of pupils attempting the subject)
S3 GCSE entries and achievements in selected subjects
of pupils at the end of key stage 4 in all schools
(percentage of all pupils)
S4a GCSE entries in selected subjects of pupils at the
end of key stage 4 by school type (percentage)
S4b GCSE entries in selected subjects of pupils at the
end of key stage 4 by school admission basis
(percentage)
S5 GCSE Full Course results of pupils at the end of key
stage 4 in all schools, by subject and grade
S6 Cambridge International Certificate and Edexcel
Level1/2 Certificate results of pupils at the end of key
stage 4 in all schools, by subject and grade
S7 Results of GCSEs in applied subjects of pupils at the
end of key stage 4 in all schools, by subject and grade
S8 Other qualification results of pupils at the end of key
stage 4 in all schools, by type of qualification
S9 Non-discounted examination entries in English
Baccalaureate and non-English-Baccalaureate subjects of
pupils at the end of key stage 4
Subject time series
Time series of GCSE and equivalent entries of pupils at
the end of key stage 4 in schools, by subject, grade and
gender
AP PRU tables
P1 GCSE and equivalent entries and achievements of
pupils at the end of key stage 4 in alternative provision
including pupil referral units for each local authority and
region
P2 GCSE and equivalent entries and achievements of
pupils at the end of key stage 4 in alternative provision
including pupil referral units, by subject and grade
P3 Other Qualifications entries of pupils at the end of key
stage 4 in alternative provision including pupil referral
units, by type of qualification
Pupil residency and school location tables
PR1 GCSE and equivalent entries and achievements of
pupils at the end of key stage 4 by IDACI decile of pupil
residence
PR 2 GCSE and equivalent entries and achievements of
pupils at the end of key stage 4 by degree of rurality of
pupil residence
PR 3 GCSE and equivalent entries and achievements of
pupils at the end of key stage 4 by local authority district
and region of pupil residence
PR 4 GCSE and equivalent entries and achievements of
pupils at the end of key stage 4 by IDACI decile and
degree of rurality of pupil residence
SL1 GCSE and equivalent entries and achievements of
pupils at the end of key stage 4 by degree of rurality of
school location
SL 2 GCSE and equivalent entries and achievements of
pupils at the end of key stage 4 by local authority district
and region of school location
PC1 GCSE and equivalent entries and achievements of
pupils at the end of key stage 4 by parliamentary
constituency of school location
Other breakdowns
O1 Time series of entries in GCSE art subjects
O2 Pupils with one or more entries in GCSE art subjects

27
When reviewing the tables, please note that:
We preserve confidentiality The Code of Practice for Official Statistics requires us to take reasonable
steps to ensure that our published or disseminated statistics protect
confidentiality.
We suppress some figures Values of 1 or 2, or a percentage based on 1 or 2 pupils who achieved; or
0, 1 or 2 pupils who did not achieve a particular level are suppressed in
circumstances where non-suppression would lead to disclosure of pupils.
Some additional figures have been suppressed to prevent the possibility
of a suppressed figure being revealed.
This suppression is consistent with our Statistical policy statement on
confidentiality.
We adopt symbols to help
identify suppression
Symbols are used in the tables as follows:
0 zero
. Not available
x Publication of that figure would be disclosive
We round figures Percentages in this SFR are given to one decimal place.
Coverage of the data The statistics in this first release cover the data collated for the 2015
secondary school performance tables. From 2005 the performance tables
reported results based on pupils at the end of key stage 4, rather than
those aged 15.
The coverage of the local authority (LA) and regional statistics is state-
funded schools only in England. This includes city technology colleges
and academies but excludes hospital schools, pupil referral units and
alternative provision.
28
Further information 13.
School level figures School level data are published in the performance tables.
Characteristics breakdowns Characteristics breakdowns are included in this SFR.
Provisional data Provisional figures for 2015 were published on 15 October 2015 in
SFR37/2015
Previously published figures SFR02/2015: Revised GCSE and equivalent results in England: 2013 to
2014
Attainment for other key
stages
Data on other key stages can be found at the following links:
Early years foundation stage profile
Key stage 1
Key stage 2
16-19 Attainment
School Performance Tables
Pupil numbers SFR15/2015: Schools, pupils and their characteristics: January 2015
Attainment in Wales,
Scotland and Northern
Ireland
Information on educational attainment for secondary schools in Wales is
available from the Welsh Government website.
Information on educational attainment for secondary schools in Scotland
is available from the Scottish Government website.
Information on educational attainment for secondary schools in Northern
Ireland is available from the Department for Education Northern Ireland
(DENI) website.
National Statistics 14.
The United Kingdom Statistics Authority has designated these statistics as National Statistics, in accordance
with the Statistics and Registration Service Act 2007 and signifying compliance with the Code of Practice for
Official Statistics.
Designation can be broadly interpreted to mean that the statistics:
meet identified user needs;
are well explained and readily accessible;
are produced according to sound methods, and
are managed impartially and objectively in the public interest.
Once statistics have been designated as National Statistics it is a statutory requirement that the Code of
Practice shall continue to be observed.
The Department has a set of statistical policies in line with the Code of Practice for Official Statistics.
29
Technical information 15.
A quality and methodology information document accompanies this SFR. This provides further information on
the data sources, their coverage and quality and explains the methodology used in producing the data,
including how it is validated and processed.
Get in touch 16.
Media enquiries
Press Office News Desk, Department for Education, Sanctuary Buildings, Great Smith Street, London,
SW1P 3BT
Tel: 020 7783 8300
Other enquiries/feedback
Ali Pareas, Education Data Division, Department for Education, Sanctuary Buildings, Great Smith Street,
London, SW1P 3BT
Tel: 020 7340 7490 Email: [email protected]

© Crown copyright 2016
This publication (not including logos) is licensed under the terms of the
Open Government Licence v3.0 except where otherwise stated. Where
we have identified any third party copyright information you will need to
obtain permission from the copyright holders concerned.
To view this licence:
visit www.nationalarchives.gov.uk/doc/open-government-licence/version/3
email [email protected]
write to Information Policy Team, The National Archives, Kew, London, TW9 4DU
About this publication:
enquiries Ali Pareas, Education Data Division, Department for Education,
Sanctuary Buildings, Great Smith Street, London, SW1P 3BT
Tel: 020 7340 7490 Email: [email protected]
download Statistics: GCSEs (key stage 4)
Reference: SFR 01/2016
Follow us on Twitter: @educationgovuk
Like us on Facebook: facebook.com/educationgovuk