revised equations for calculating co2 production from ...goranlab.com/pdf/16.pdf · revised...
TRANSCRIPT

Revised equations for calculating CO2 production from doubly labeled water in humans
JOHN R. SPEAKMAN, K. SREEKUMARAN NAIR, AND MICHAEL I. GORAN The Department of Zoology, University of Aberdeen, Aberdeen AB9 2TN, United Kingdom; and, Division of Endocrinology, Metabolism and Nutrition, Department of Medicine, University of Vermont, Burlington, Vermont 05405
Speakman, John R., K. Sreekumaran Nair, and Michael I. Goran. Revised equations for calculating CO, pro- duction from doubly labeled water in humans. Am. J. Physiol. 264 (Endocrinol. Metab. 27): E912-E917, 1993.-The Schoeller model for calculating rate of CO, production (rcO ) from doubly labeled water (DLW) relies on the assumption that deuterium and oxygen-18 overestimate body water by 4 and l%, respec- tively. However, the deuterium-to-oxygen-18 dilution space ra- tio (DSR) varies considerably, and it is unknown whether this is due to analytical or biological sources. From 161 published values in adult humans, we derived a mean DSR of 1.0427 t 0.0218. Propagation of error suggests that analytical uncer- tainty accounts for 20-50% of the observed variation in the DSR, whereas reliability testing in vivo and in vitro demon- strate that 70-100% of observed interindividual variation in the DSR can be attributed to analytical uncertainty. The discrep- ancy between propagated error and experimental reliability sug- gest that it is unwise to rely on propagation of error when evaluating sources of error in DLW. The new constant of 1.0427 was used to revise existing equations for calculating rcc, from DLW. Compared with the existing equation, the revised equa- tion improved the accuracy (-0.38 vs. +10.3%) and the preci- sion (9.3 vs 10.7%) of r,, calculations in previously published validation studies. We conclude that 1) variation in the oxygen- 18-to-deuterium DSR is primarily influenced by analytical noise and warrants use of a fixed ratio, 2) existing equations should be revised because the original DSR may have been underestimated, and 3) the modified equations improve the accuracy and precision of rcO
2 calculated from DLW.
energy expenditure; stable isotopes
THE DOUBLY LABELED WATER (DLW) technique is a powerful noninvasive method for measuring the total energy expenditure of free-living subjects. The method was originally conceptualized in the 1950s by Lifson et al. (11) and applied mainly to small mammals in the 1960s and 1970s. It was first applied to humans in 1982 by Schoeller and van Santen (18). Throughout the 198Os, in the human nutrition arena, the use of DLW remained a specialized technique, applied by relatively few groups who had detailed knowledge of its fundamen- tal principles. The underlying theory of the technique was extensively debated during this phase, and some of these issues remain unresolved. At present therefore there are a range of options available for both the method of data collection and for data analysis.
As the technique moves from being in the hands of a few specialists who have intimate knowledge of the ap- proach to a wider group for whom the technique is only a tool to reach further goals, it is clearly desirable that a standard and easily applied methodology be adopted. In 1988 a group of investigators met in Cambridge, United Kingdom, and produced a document toward these ends (13). In practice, however, these recommendations have not been widely adopted. Instead, the scientific commu-
nity has generally adopted Eq. A6 from the seminal hu- man validation paper of Schoeller et al. (17), which ap- pears in modified form (16) as follows
N rco, = 2078 x (l.OlK, - l.O4K,)
1 - 0.0246rGf (I) . J
where N is body water pool = [(N&.01) + (ND/ 1.04)]/2; No and ND are oxygen-18 and deuterium dilu- tion spaces (moles); Ko and KD are turnover rates of oxygen-18 and deuterium (days-l). rof is the rate of water loss that occurs via routes subject to isotopic frac- tionation and is estimated to be 1.05 x N (l.OlKo - 1.04KD).
An important aspect of this equation is that it as- sumes that the ratio of deuterium to oxygen-18 pool sizes is universally fixed at 1.03 (i.e., 1.04:l.O1), rather than using the observed ratio derived from the measured individual pool sizes. The choice between using the mea- sured individual ratios or a fixed ratio is not trivial. For example, if a ratio of 1.08 for the two dilution spaces was observed, the use of Eq. I (i.e., the fixed ratio) would estimate energy expenditure to be 23% higher than cal- culations based on the actual observed pool sizes. With an observed ratio of 1.01, energy expenditure will be 12% lower with Eq. 1 compared with calculations using the observed pool sizes. Clearly, Eq. 1 may obscure signifi- cant differences in energy expenditure if the observed variation in the dilution space ratio has a biological basis. Conversely, using the actual dilution space ratio may generate spurious variation in energy expenditure if the observed variation in the ratio is mostly analytical.
Since the derivation of Eq. I (l7), many more human validation studies of the DLW technique have been per- formed, and many more measurements of the dilution space ratio have been published. These new data thus provide the opportunity to reevaluate whether the fixed ratio approach used in Eq. I is appropriate. The purpose of this communication is to therefore use published data, along with an experimental and theoretical analy- sis, to evaluate whether a fixed dilution space ratio is appropriate, and, if so, what the most suitable correction factors are for the extent to which deuterium and oxy- gen- 18 overestimate total body water.
Is the Observed Variation in the Deuterium-to-Oxygen-18 Pool Size Ratio Analytical or Biological?
The extent of variability in the deuterium-to-oxy- gen-18 pool size ratio is well recognized and has been discussed previously by Prentice (13). We examined 161 individual measurements of the deuterium-to-oxygen-18 pool size ratio collated from published studies in subjects
E912 019%1849/93 $2.00 Copyright 0 1993 the American Physiological Society

REVISED EQUATIONS FOR Rco, E913
of varying age, race, sex, and state of obesity (3, 7-9, 14, 17, 19) (Table 1). In addition, we examined the SD of published group mean data in cases where individual data were not presented. The SD from 161 individual pub- lished ratios was 0.0218, and the mean SD reported in 20 homogeneous groups ranging from 4 to 20 subjects was 0.01898 (Table 1).
How much of this observed variation in the dilution space ratio is analytical and how much is biological? Es- timation of the expected variation in the pool size ratio arising from analytical precision requires evaluation of analytical precision of isotope analyses for both isotopes. This may be affected by the gas preparation technique, analysis machine, and analytical laboratory (21). How- ever, the average reported precision (SD) for oxygen-18 analysis at typical initial isotope enrichment levels using large sample equilibration is 0.6 delta [ - 1.2 parts/million (ppm)] and for deuterium using zinc reduction is 4.5 delta (-0.7 ppm). These precisions do not differ from the re- ported precisions of analysis at background abundance levels (23).
Evaluation of the analytical error in the final dilution space estimate is complicated by the fact that estimates of isotope abundance enter into the equation for evalua- tion of dilution space at four different points, and there are other sources of error (e.g., dose weighing and admin- istration). We have estimated the effect of analytical un- certainty on measurement of the pool size ratio using three approaches involving both theoretical propagation of error analysis and experimental data.
Approach 1: propagation of error analysis. In the first series of calculations we assumed that dose handling is
Table 1. Dilution space ratios of 19 homogenous groups
Reference Ratio n
Goldberg et al. (7) 1.03618t0.0079 10 1.04119t0.0269 10 1.03304~0.0104 10 1.02944~0.0097 10 1.04643kO.0107 9*
Seale et al. (20) 1.0055kO.0128 4 Casper et al. (2) 1.032kO.0244 6
1.027kO.049 6 Bandini et al. (1) 1.035*0.033 4 Goran et al. (8) 1.039t0.038 13 Ravussin et al. (14) 1.049~0.009 12 Schoeller et al. (17) 1.038_tO.O20 6
1.045t0.0119 6 1.033t0.015 18
Schoeller et al. (19) 1.03 13t0.0257 8 Goran et al. (10) 1.051~0.015 18
1.050t0.011 13 1.050t0.022 11 1.047*0.009 12
Cochran et al. (3) 1.04820.018 20
Weighted group mean 1.0408 .01898 (n = 206)
Individual mean value 1.0427 0.0218 (n = 161)
Values for dilution space ratio are means t SD. * Original study contained a value of 0.77 for dilution space ratio, which we rejected as an outlier based on a z score of 13.38, equivalent to a statistical occur- rence of greater than one in one million. n, no. of subjects.
not a source of error and propagated the error in the calculation of dilution space using a Monte Carlo type simulation. Ten random numbers were generated (using the random number generating function from a standard statistical package, MINITAB) from each of four normal distributions, two centered on the level of natural abun- dance (2,005 ppm for oxygen-18 and 155 ppm for deute- rium) and two at the initial postdose enrichment level (assumed to be 2,200 ppm for oxygen-18 and 330 ppm for deuterium), using the precision estimates above to define the standard deviations of these distributions. The ran- dom numbers were then completely permutated in the calculation of dilution space using the equation derived by Coward et al. (4).
For each isotope we substituted into the equation of Coward et al. (4) the 10 random values of enrichment for 1) diluted dose standard; 2) postdosing body enrichment; 3) water used to make the standard; and 4) predosing body enrichment. The resultant distribution of dilution space estimates (n = 104) was used to generate an esti- mate for the propagated variance resulting from analyti- cal error in the isotope abundance estimates. The ex- pected variances in the determinations for both isotopes were then combined by subsampling, at random, 100 es- timates from each dilution space distribution and permu- tating these exhaustively to establish the expected vari- ation due to analytical error in the dilution space ratio. Using this approach we estimated that the analytical un- certainty (coefficient of variation = SD/mean) in the estimate of oxygen-18 and deuterium pool sizes in a typ- ical study in adults is -0.86 and -O.55%, respectively (assuming duplicate sample analysis, see Table 2). As the replicate sample size for analysis (n) increases, the error (% error = SD/mean) in the estimates of pool size decline as a function of the reciprocal of root n. Table 2 summa- rizes the anticipated propagated error in dilution space across all techniques and the pooled variance anticipated due to these errors in the dilution space ratio.
For duplicate analyses of both isotopes, which is the most common protocol, the expected variation in dilu- tion space ratio due to analytical error was 0.00956 (Ta- ble 2) compared with the previously described observed experimental variation across 161 subjects of 0.0218. Hence this propagation of error analysis suggests that only 19.2% of the observed variability in the dilution space ratio is accounted for by analytical imprecision in isotopic analysis. This prediction, however, is only
Table 2. Propagated error in dilution spaces of oxygen-18 and deuterium and dilution space ratio as a function of technique and sample size
Error in Error in Error in Technique n 180 space, 2H space, 2H/‘80
% % Ratio
Plateau 1 1.128 0.818 0.01455 2 0.862 0.547 0.00956 3 0.669 0.457 0.00866 4 0.514 0.322 0.00647
Intercept 1.075 1.322 0.01581 n, No. of replicate isotope analyses; error is expressed as coefficient
of variation. Refer to text for details of intercept technique.

E914 REVISED EQUATIONS FOR Rco,
appropriate for estimates using the plateau approach for evaluating dilution space because only when employing this latter technique is the actual initial isotope enrich- ment factored into the equation.
When employing the intercept approach, postdose en- richment is evaluated as the time 0 enrichment from back extrapolation of the log converted isotope disappearance curves to the point of isotope administration. The error in postdose enrichment is, therefore, equal to the SE in the intercept estimate and not the precision of isotope analysis. The SE in this value will vary with many fac- tors, including the number of data used to generate the curve and the precise timing of the sample collection, particularly the early time points. Moreover, because the fitted curve is performed on log-transformed data the intercept is log-normally distributed and this leads to some skewness in the dilution space estimate during an- tilog conversion. Rather than model these factors we de- rived the SEs in the estimates of intercepts empirically from a study of nine obese patients. These estimates were derived from back extrapolation of a curve constructed for six points across 14 days, with the first sample col- lected at 24 h postisotope administration. The log of the mean and SE of the time 0 enrichments for nine individ- uals was 4.5817 t 0.00851 delta per mil for oxygen-18, and 6.5495 t 0.01275 delta per mil for deuterium. We propa- gated this error in a similar simulation as performed above for the plateau technique, only this time we gener- ated a normal distribution for estimates of log postdose enrichment and converted these postdose enrichment by antilogging prior to calculation (and using the estimated errors for duplicate analyses for each of the other terms). This analysis resulted in a precision error (% error = SE/mean) of 1.075% for the dilution space of oxygen-18 and 1.322% for deuterium, which, in combination, gave an expected error in the dilution space ratio due to ana- lytical precision of 0.0158. This estimate is clearly spe- cific to this particular study, and different protocols may result in different errors. Nevertheless this calcula- tion indicates that when using the intercept rather than the plateau method, the analytical error amounts to ~52.5% of the total observed variation in the dilution space ratio.
Approach 2; in uiuo reliability data. To further evaluate the analytical error involved in estimating dilution spaces, we present data from repeated measures of dilu- tion space in the same individuals. Nine obese subjects were studied over two discrete 14-day studies, separated by 4 days, while subjects were living in a clinical research center (Vermont). Time 0 dilution spaces for both oxy- gen-18 and deuterium were obtained in both studies after repeat doses, based on multipoint analysis (6 samples) and duplicate sample analysis at each point. The average within subject SD for the dilution space ratio was 0.0163 compared with an average between individual SD of 0.0195 (Table 3). Although it is possible that the pool size ratio would vary biologically within the time interval of our measurement, it seems more likely that the observed intraindividual variation is a measure of the analytical variation in vivo. Hence, in this experiment, ~70% of the observed interindividual variance may be attributed to
Table 3. Repeatability of 2H-to-180 dilution space ratio measurements in 9 subjects under controlled living conditions made 14 days apart
Ratio 1 Ratio 2 Mean SD
Average SD
1.0281 1.0571 1.0426 1.0452 1.0570 1.0511 1.0565 1.0291 1.0428 1.0659 1.0612 1.0636 1.0567 1.0488 1.0528 1.0722 1.0343 1.0532 1.0563 1.0603 1.0583 1.0428 1.0080 1.0254 1.0256 0.9756 1.0006 1.0499 1.0368 1.0434 0.0159 0.0291 0.0195
0.0205 0.0083 0.0194 0.0033 0.0056 0.0268 0.0028 0.0247 0.0353 0.0163
analytical errors. Approach 3: in vitro reliability data. Last, we measured
the analytical precision of measuring the dilution space ratio in vitro. This was performed by preparing a set of eight identical 1:400 gravimetric dilutions of mixed iso- tope [O.l ml of mixed oxygen-18, 10% atom percent ex- cess (APE), and deuterium, 5% APE in 40 ml of tap water] with tap water. Enrichments of oxygen-18 and deuterium were determined in both the water used for dilution and in each of the dilutions. We estimated the dilution space in each sample using a randomly selected sample from the eight dilutions as the reference dilution and then compared this with the actual weighed amount of water (see Table 4). The average precision (coefficient of variation) for estimating pool size was 1.65% when using oxygen-18 and 1.78% when using deuterium. In combination, these data imply a pooled SD of 0.0234 in the dilution space ratio compared with the aforemen- tioned value of 0.0218 for the SD of 161 in vivo observa- tions. This in vitro experiment thus indicates that all of the observed intersubject variability in dilution space ra- tio is analytical.
The statistical propagation of error analysis and the experimental evidence yielded conflicting information for evaluating the contribution of analytical error to the ob- served variation in the dilution space ratio. On the one hand, calculations using error propagation (approach 1) suggest that only a small component (19.52%) of varia- tion in dilution space ratio is attributable to analytical uncertainty, whereas the in vivo repeatability measures
Table 4. Estimates of error in dilution spaces in vitro
Actual Predicted Pool S ze Predicted/Actual Pool Size
Pool Size, g From l80 From 2H From ‘80 From 2H
48.4053 48.4584 48.1: 96 1.0011 0.9943 42.5288 42.9265 41.4' 190 1.0094 0.9758 42.3838 42.1745 41.9115 0.9951 0.9889 40.7716 39.2778 38.4116 0.9634 0.9421 40.2981 40.7215 39.4708 1.0105 0.9795 36.5974 36.8140 36.3410 1.0059 0.9930 41.5308 41.4840 40.5434 0.9989 0.9762
Mean 41.6058 41.5234 40.8297 0.9977 0.9785 SD 3.3126 3.3758 3.4451 0.0162 0.0178

REVISED EQUATIONS FOR Rco, E915
(approach 2) and the experimental in vitro evidence (ap- proach 3) suggest a much greater contribution (70-100%) from analytical sources. We may have underestimated the analytical error in our propagation because there may be other factors that affect analytical precision other than analytical precision of isotope analysis. It is unlikely that weighing errors were important since the results of our in vitro experiment would imply that we made errors in this term of ~0.6 g when using a four-decimal-point balance (Mettler). In vivo other complicating factors not ac- counted for include possible individual variability in the rates at which the isotopes spread into the body pools relative to the timing of the plateau sample, although the data of Schoeller et al. (19) suggest this is not a concern. In addition, it has recently been shown that the dilution space ratio is influenced by sex but not age or body com- position (10). However, biological variation would not be an integral component of the in vitro experiment, yet error propagation analysis significantly underestimated the error in this experiment as well. The discrepancy between theoretical propagated error and experimental data strongly suggests that it is unwise to rely heavily on propagation of error analyses when evaluating potential sources of error in the DLW technique because these necessarily focus on only a single component of the error and are hence minimal estimates.
If the experimental data presented here are considered alone then this study indicates the use of a fixed ratio for the dilution spaces is justified. It should be borne in mind, however, that consideration of the dilution space ratio in isolation from other factors may be problematic. For ex- ample, there is potential for complex covariances between dilution spaces and turnover rates. These covariances and their consequences have been considered fully elsewhere (4, 22).
Reevaluation of the Fixed Parameters in Eq. 1 When Eq. 1 (Schoeller’s Eq. A6) was derived, fewer
than 20 dilution space ratios in humans had been pub- lished, and these data indicated a mean deuterium-to- oxygen-18 dilution space ratio of 1.034, which was rounded to 1.03. The constant of 1.01 in Eq. 1 was derived from a theoretical estimate of the excess exchangeable oxygen amounting to ~0.7% of water oxygen, which was also rounded to 1%. The constant of 1.04 in Eq. 1 was derived from these two estimates (1.01 x 1.03). The ra- tional for rounding of the original figures is unclear be- cause four significant figures are used for the fraction- ation factors in Eq. I, and the impact of using four rather than three significant figures in the fractionation factors is relatively trivial when compared with the effect of us- ing four vs. three significant figures in the dilution space ratio. Moreover, a comparison of theoretical exchange- able deuterium with that observed suggests that not all the theoretical excess hydrogen exchanges (5,6), indicat- ing the 0.7% evaluation for excess oxygen space may be too high and rounding it up takes it to a physiologically unrealistic value. However, as will be discussed, the actual choice of the value for No relative to N is not very im- portant. The critical issue is the value for NH/No.
We have summarized the mean estimates of the deu- terium-to-oxygen-18 dilution space ratio in 20 homoge-
neous groups of humans spread over 11 publications since 1982 (Table l), including the original data published by Schoeller et al. (17, 18). The weighted mean of these means was 1.0408 (SE = 0.0027). Using 161 published individual ratios we obtained a mean of 1.04273 (SE = 0.0017). This new value significantly exceeds the original ratio of 1.03 used in Eq. I [t = 7.4, degrees of freedom (df) = 160, P < O.OOOl] but is not significantly difXerent from the weighted group mean value for n = 206 (t = 1.12, df = 160, P = 0.26).
There are two ways in which the new ratio of 1.0427 can be employed. First, we can assume a value of 1.01 for No/N, yielding the following revision of Eq. I
r N 1
rco2 = 1 2-& X (l.OlK, - l.O531K,) 1
- 0.0246rG. (2)
where N is body water pool = [(No/l.Ol) + (N&.0531)]/ 2; No and ND are oxygen-18 and deuterium dilution spaces moles; Ko and KD are turnover rates of oxygen-18 and deuterium (days-‘). rof is the rate of water loss that occurs via routes subject to isotopic fractionation and is estimated to be 1.05 x N (l.OlKo - 1.0531KD). Eq. 2 can be condensed to the following
r,, = (N/2.196) X (l.OlK, - l.O531K,)
where N = ‘[(No/lW) + (N&.0531)1/2. Alternatively, we can reevaluate the ratio No/N. The
mean ratio of ND/N using deuterium dilution for ND compared with N estimated by desiccation in 17 animal studies averaged 1.0432 (12). This value is not signifi- cantly different from the value of 1.04273 derived for ND/No in humans in the present analysis (t = -0.28, P = 0.78, df = 160), implying a value of 1.000 for No/N in humans. Hence, we could also revise Eq. I as follows
rco2 = [(N/2.078) X (K, - l.O427K,)] - 0.0246rGf (4)
where N is body water pool = [(No) + (N&.0427)1/2; No and ND are oxygen-18 and deuterium dilution spaces (moles); Ko and Kn are turnover rates of oxygen-18 and deuterium (days-l). rof is the rate of water loss that oc- curs via routes subject to isotopic fractionation and is estimated to be 1.05 X N (Ko - 1.0427Kn). Equation 4 can be condensed to the following
rco2 = (N/2.196) X (K, - l.O427K,)
where N = [(No) + (N&.0427)1/2.
(5)
To illustrate the impact of the revised equations (Eqs. 3 and 5), we performed calculations assuming N = 2,500 moles, Ko = 0.1 days-‘, and allowing Kn to vary from 0.085 to 0.07 days-l, covering the range of expected turn- over ratios typical for adults. Equation 3 yielded values between 3 and 9% lower than Eq. I (Table 5) and Eq. 5 yielded values between 4 and 10% lower than Eq. I. There is a systematic difference of only 1% between the two revised equations (Eqs. 3 and 5). Clearly use of Eq. 3 or 5 instead of Eq. I may have profound effects on the inter- pretations made in studies of energy expenditure.
To test the performance of the new equations we have recalculated data from published validation studies in which the entire data was available In = 6 from Schoeller
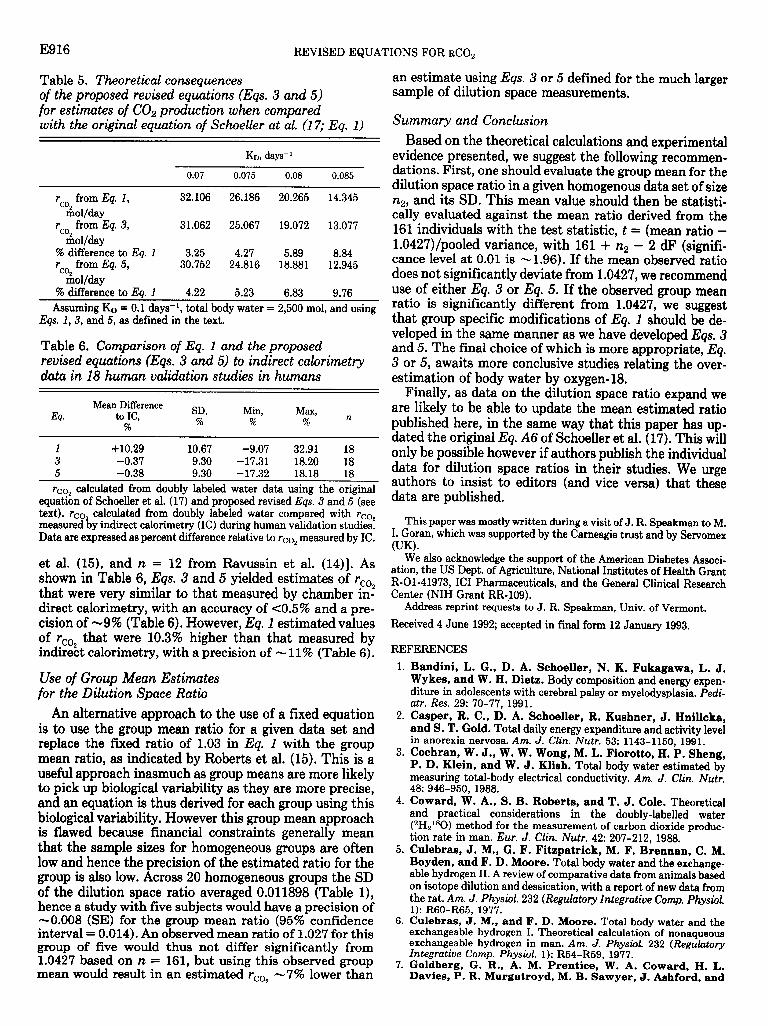
E916 REVISED EQUATIONS FOR Rco,
Table 5. Theoretical consequences of the proposed revised equations (Eqs. 3 and 5) for estimates of CO, production when compared with the original equation of Schoeller at al. (17; Eq. 1)
KD, days-l
0.07 0.075 0.08 0.085
r,, from Eq. 1, 32.106 26.186 20.265 14.345
&0l/day
rco from Eq. 3, 31.062 25.067 19.072 13.077
mol/day % difference to Eq. 1 3.25 4.27 5.89 8.84 rcO from Eq. 5, 30.752 24.816 18.881 12.945
Inol/day % difference to Eq. 1 4.22 5.23 6.83 9.76
Assuming Ko = 0.1 days-l, total body water = 2,500 mol, and using Eqs. 1,3, and 5, as defined in the text.
Table 6. Comparison of Eq. 1 and the proposed revised equations (Eqs. 3 and 5) to indirect calorimetry data in 18 human validation studies in humans
Mean Difference Eq* to IC, SD, Min, Max, n
% % % %
1 + 10.29 10.67 -9.07 32.91 18 3 -0.37 9.30 -17.31 18.20 18 5 -0.38 9.30 -17.32 18.18 18
rco2 calculated from doubly labeled water data using the original equation of Schoeller et al. (17) and proposed revised Eqs. 3 and 5 (see text). rco measured L
calculated from doubly labeled water compared with rCOp y indirect calorimetry (IC) during human validation studies.
Data are expressed as percent difference relative to rCop measured by IC.
et al. (15), and n = 12 from Ravussin et al. (14)]. As shown in Table 6, Eqs. 3 and 5 yielded estimates of r,, that were very similar to that measured by chamber in: direct calorimetry, with an accuracy of ~0.5% and a pre- cision of -9% (Table 6). However, Eq. 1 estimated values Of rco that were 10.3% higher than that measured by indirect calorimetry, with a precision of - 11% (Table 6).
Use of Group Mean Estimates for the Dilution Space Ratio
An alternative approach to the use of a fixed equation is to use the group mean ratio for a given data set and replace the fixed ratio of 1.03 in Eq. 1 with the group mean ratio, as indicated by Roberts et al. (15). This is a useful approach inasmuch as group means are more likely to pick up biological variability as they are more precise, and an equation is thus derived for each group using this biological variability. However this group mean approach is flawed because financial constraints generally mean that the sample sizes for homogeneous groups are often low and hence the precision of the estimated ratio for the group is also low. Across 20 homogeneous groups the SD of the dilution space ratio averaged 0.011898 (Table l), hence a study with five subjects would have a precision of -0.008 (SE) for the group mean ratio (95% confidence interval = 0.014). An observed mean ratio of 1.027 for this group of five would thus not differ significantly from 1.0427 based on n = 161, but using this observed group mean would result in an estimated r,, -7% lower than
2
an estimate using Eqs. 3 or 5 defined for the much larger sample of dilution space measurements.
Summary and Conclusion Based on the theoretical calculations and experimental
evidence presented, we suggest the following recommen- dations. First, one should evaluate the group mean for the dilution space ratio in a given homogenous data set of size n2, and its SD. This mean value should then be statisti- cally evaluated against the mean ratio derived from the 161 individuals with the test statistic, t = (mean ratio - LO427)/pooled variance, with 161 + n2 - 2 dF’ (signifi- cance level at 0.01 is - 1.96). If the mean observed ratio does not significantly deviate from 1.0427, we recommend use of either Eq. 3 or Eq. 5. If the observed group mean ratio is significantly different from 1.0427, we suggest that group specific modifications of Eq. 1 should be de- veloped in the same manner as we have developed Eqs. 3 and 5. The final choice of which is more appropriate, Eq. 3 or 5, awaits more conclusive studies relating the over- estimation of body water by oxygen-18
Finally, as data on the dilution space ratio expand we are likely to be able to update the mean estimated ratio published here, in the same way that this paper has up- dated the original Eq. A6 of Schoeller et al. (17). This will only be possible however if authors publish the individual data for dilution space ratios in their studies. We urge authors to insist to editors (and vice versa) that these data are published.
This paper was mostly written during a visit of J. R. Speakman to M. I. Goran, which was supported by the Carneagie trust and by Servomex (UK).
We also acknowledge the support of the American Diabetes Associ- ation, the US Dept. of Agriculture, National Institutes of Health Grant R-01-41973, ICI Pharmaceuticals, and the General Clinical Research Center (NIH Grant RR-109).
Address reprint requests to J. R. Speakman, Univ. of Vermont. Received 4 June 1992; accepted in final form 12 January 1993.
REFERENCES 1.
2.
3.
4.
5.
6.
7.
Bandini, L. G., D. A. Schoeller, N. K. Fukagawa, L. J. Wykes, and W. H. Dietz. Body composition and energy expen- diture in adolescents with cerebral palsy or myelodysplasia. Pedi- atr. Res. 29: 70-77, 1991. Casper, R. C., D. A. Schoeller, R. Kushner, J. Hnilicka, and S. T. Gold. Total daily energy expenditure and activity level in anorexia nervosa. Am. J. Clin. Nutr. 53: 1143-1150, 1991. Cochran, W. J., W. W. Wong, M. L. Fiorotto, H. P. Sheng, P. D. Klein, and W. J. Klish. Total body water estimated by measuring total-body electrical conductivity. Am. J. Clin. Nutr. 48: 946-950, 1988. Coward, W. A., S. B. Roberts, and T. J. Cole. Theoretical and practical considerations in the doubly-labelled water (2H2180) method for the measurement of carbon dioxide produc- tion rate in man. Eur. J. Clin. Nutr. 42: 207-212, 1988. Culebras, J. M., G. F. Fitzpatrick, M. F. Brennan, C. M. Boyden, and F. D. Moore. Total body water and the exchange- able hydrogen II. A review of comparative data from animals based on isotope dilution and dessication, with a report of new data from the rat. Am. J. Physiol. 232 (Regulatory Integrative Comp. Physiol. 1): R60-R65, 1977. Culebras, J. M., and F. D. Moore. Total body water and the exchangeable hydrogen I. Theoretical calculation of nonaqueous exchangeable hydrogen in man. Am. J. Physiol. 232 (Regulatory Integrative Comp. Physiol. 1): R54-R59, 1977. Goldberg, G. R., A. M. Prentice, W. A. Coward, H. L. Davies, P. R. Murgatroyd, M. B. Sawyer, J. Ashford, and

REVISED EQUATIONS FOR Rco, E917
A. E. Black. Longitudinal assessment of the components of en- ergy balance in well-nourished lactating women. Am. J. Clin. Nutr. 54: 788-798, 1991.
8. Goran, M. I., E. J. Peters, D. N. Herndon, and R. R. Wolfe. Total energy expenditure in burned children using the doubly labeled water technique. Am. J. Physiol. 259 (Endocrinol. Metab. 22): E576-E585, 1990.
9. Goran, M. I., and E. T. Poehlman. Total energy expenditure and energy requirements in healthy elderly persons. Metub. Clin. Exp. 41: 744-753, 1992.
10. Goran, M. I., E. T. Poehlman, K. S. Nair, and E. Danforth, Jr. Effect of gender, body composition, and equilibration time on the 2H-to-r80 dilution space ratio. Am. J. Physiol. 263 (Endo- crinol. Metab. 26): E1119-E1124, 1992.
11. Lifson, N., G. B. Gordon, and R. McClintock. Measurement of total carbon dioxide production by means of D2180. J. Appl. Physiol. 7: 704-710, 1955.
12. Nagy, K. A. CO2 production in animals: analysis of potential errors in the doubly labeled water method. Am. J. Physiol. 238 (Regulatory Integrative Comp. Physiol. 7): R466-R473, 1980.
13. Prentice, A. M. (Editor) The Doubly-Lubeled Water Method for Measuring Energy Expenditure: Technical Recommendations for Use in Humans. A Consensus Report by the IDECG Working Group. Vienna: International Atomic Energy Agency, 1990.
14. Ravussin, E., I. Harper, R. Rising, and C. Bogardus. En- ergy expenditure by doubly labeled water: validation in lean and obese subjects. Am. J. Physiol. 261 (Endocrinol. Metab. 24): E402- E409, 1991.
15. Roberts, S. B., V. R. Young, P. Fuss, M. A. Fiatarone, B. Richard, H. Rasmussen, D. Wagner, L. Joseph, E. Hole- house, and W. J. Evans. Energy expenditure and subsequent nutrient intakes in overfed young men. Am. J. Physiol. 259 (Reg-
ulatory Integrative Comp. Physiol. 28): R461-R469, 1990. 16. Schoeller, D. A. Measurement of energy expenditure in free-
living humans by using doubly labeled water. J. Nutr. 118: 1278- 1289, 1988.
1% Schoeller, D. A., E. Ravussin, Y. Schutz, K. J. Acheson, P. Baertschi, and E. Jequier. Energy expenditure by doubly la- beled water: validation in humans and proposed calculation. Am. J. Physiol. 250 (Regulatory Integrative Comp. Physiol. 19): R823- R830, 1986.
18. Schoeller, D. A., and E. Van Santen. Measurement of energy expenditure in humans by doubly labeled water method. J. Appl. Physiol. 53: 955-959, 1982.
19. Schoeller, D. A., E. Van Santen, D. W. Peterson, W. H. Dietz, J. Jaspan, and P. D. Klein. Total body water measure- ment in humans with 180 and 2H labeled water. Am. J. Clin. Nutr. 33: 2686-2693, 1980.
20. Seale, J. L., W. V. Rumpler, J. M. Conway, and C. W. Miles. Comparison of doubly labeled water, intake-balance, and direct- and indirect-calorimetry methods for measuring energy expenditure in adult men. Am. J. Clin. Nutr. 52: 66-71, 1990.
21. Speakman, J. R., K. A. Nagy, D. Masman, W. G. Mook, S. D. Poppitt, G. E. Strathearn, and P. A. Racey. Interlabora- tory comparison of different analytical techniques for the deter- mination of oxygen-18 abundance. Anal. Chem. 62: 703-708,199O.
22. Speakman, J. R., and P. A. Racey. Doubly labelled water: errors in the evaluation of oxygen isotope turnover due to tempo- ral variation in CO2 production do not always covary with dilution space estimate. J. Theor. Biol. 141: 547-556, 1989.
23. Wong, W. W., and P. D. Klein. A review of techniques for the preparation of biological samples for mass-spectrometric measure- ments of hydrogen-2/hydrogen-1 and oxygen-18/oxygen-16 iso- tope ratios. Mass Spectrom. Rev. 5: 313-342, 1986.