review of the buffalo city metropolitan municipality integrated
TRANSCRIPT

KWAZULU-NATAL: Fairway Green, 3 Abrey Road, Kloof, DURBAN | PO Box 2221, Everton 3625
Tel: +27 31 764 6449 | Fax: +27 31 764 4907
65/67 Davenport Centre, 89 Helen Joseph Rd, Glenwood, DURBAN
Tel: +27 31 827 6426
WESTERN CAPE : The Southern Right, Streenbras Street, Brenton on Sea, KNYSNA | PO Box 2984, Knysna 6570
Tel: +27 44 381 0712 | Fax: +27 86 569 5554
SOUTH AFRICA
[email protected] | www.futureworks.co.za
Review of the Buffalo City
Metropolitan Municipality Integrated Environmental Management Plan and
Coastal Zone Management Plan
Draft State of the Environment
Report
30 April 2014

2
Table of Contents Acronyms ................................................................................................................................................................................................ 4
1. Introduction .................................................................................................................................................................................. 6
1.1 Purpose of this Report .......................................................................................................................................................... 6
1.2 What are IEMPs and CZMPs and why are they needed? ............................................................................................... 6
1.2.1 Integrated Environmental Management Plan ....................................................................................................... 6
1.2.2 Coastal Zone Management Programme ................................................................................................................. 7
1.3 How this report was developed .......................................................................................................................................... 8
3. Relationship with other Policies and Plans ............................................................................................................................. 8
3.1 Overview ................................................................................................................................................................................. 8
3.2 National and Regional Environmental / Coastal Policies and Plans ............................................................................. 9
3.2 Local Policies and Plans ...................................................................................................................................................... 10
4. Overview of the Buffalo City Metropolitan Municipality ................................................................................................... 11
4.1 Location ................................................................................................................................................................................. 11
4.2 Climate................................................................................................................................................................................... 12
4.3 Geology ................................................................................................................................................................................. 12
4.4 Patterns of Land Use ........................................................................................................................................................... 12
4.5 Population and Households............................................................................................................................................... 14
4.6 Socio-economic Status........................................................................................................................................................ 16
4.5 Levels of Servicing ............................................................................................................................................................... 19
4.6 Water, Wastewater and Solid Waste Infrastructure..................................................................................................... 22
4.6.1 Water Supply & Treatment ..................................................................................................................................... 22
4.6.2 Wastewater Treatment ........................................................................................................................................... 23
4.6.3 Solid Waste ................................................................................................................................................................ 23
4.7 Natural Environment .......................................................................................................................................................... 23
4.7.1 Biomes and Ecosystem Types ................................................................................................................................. 23
4.7.2 Protected Areas in the BCMMA ............................................................................................................................. 25
4.7.3 National Protected Area Expansion Strategy (NPAES) areas in the BCMMA ................................................. 26
4.7.4 Subtropical Thicket Ecosystem Project (STEP) areas in the BCMMA............................................................... 26
4.7.5 Eastern Cape Biodiversity Conservation Plan areas in the BCMMA ................................................................ 29
4.7.6 Rivers and Estuaries.................................................................................................................................................. 32
4.7.8 The Coast .................................................................................................................................................................... 33
4.8 Land Capability..................................................................................................................................................................... 33
4.9 Eco-tourism........................................................................................................................................................................... 35
5. IEMP and CZMP Implementation Status................................................................................................................................ 36
6. Key Environmental and Coastal Management Issues, Opportunities and Constraints................................................. 36
7. State of Environment ................................................................................................................................................................ 40
7.1 Air Quality ............................................................................................................................................................................. 40
7.2 Noise Pollution ..................................................................................................................................................................... 42
7.2.1 Pressures .................................................................................................................................................................... 43
7.2.2 State ............................................................................................................................................................................ 43

3
7.2.3 Impacts ....................................................................................................................................................................... 43
7.2.4 Response .................................................................................................................................................................... 43
7.3 Climate Change .................................................................................................................................................................... 43
7.3.1 Pressures .................................................................................................................................................................... 45
7.3.2 State ............................................................................................................................................................................ 46
7.3.3 Impacts ....................................................................................................................................................................... 47
7.3.3 Response .................................................................................................................................................................... 47
7.4 Freshwater Resources ........................................................................................................................................................ 47
7.4.1 Quality of Freshwater Ecosystems and Resources ............................................................................................. 47
7.4.2 Freshwater Resource Quantities and Environmental Water ............................................................................ 52
7.5 Coastal Zone ......................................................................................................................................................................... 55
7.5.1 Issues and Pressures................................................................................................................................................. 56
7.5.2 State ............................................................................................................................................................................ 57
7.5.3 Response .................................................................................................................................................................... 58
7.6 Agricultural Land Uses ........................................................................................................................................................ 59
7.6.1 Pressures .................................................................................................................................................................... 59
7.6.2 State ............................................................................................................................................................................ 60
7.6.3 Impacts ....................................................................................................................................................................... 60
7.6.4 Response .................................................................................................................................................................... 60
7.7 Biodiversity and Ecosystems ............................................................................................................................................. 60
7.7.1 Pressures .................................................................................................................................................................... 61
7.7.2 State ............................................................................................................................................................................ 62
7.7.3 Impacts ....................................................................................................................................................................... 63
7.7.4 Response .................................................................................................................................................................... 63
7.7 Energy .................................................................................................................................................................................... 63
7.7.1 Pressures .................................................................................................................................................................... 64
7.7.2 State ............................................................................................................................................................................ 64
7.7.3 Impacts ....................................................................................................................................................................... 65
7.7.4 Response .................................................................................................................................................................... 65
7.8 Integrated Waste Management........................................................................................................................................ 66
7.8.1 Pressures .................................................................................................................................................................... 67
7.8.2 State ............................................................................................................................................................................ 67
7.8.3 Impacts ....................................................................................................................................................................... 68
7.8.4 Response .................................................................................................................................................................... 68
8. References................................................................................................................................................................................... 69

4
Table of Figures Figure 1: Simplified schematic diagram of the hierarchy of municipal plans ............................................................................. 9 Figure 2: Buffalo City Metropolitan Municipality Locality Map .................................................................................................. 11 Figure 3: Major River Catchments in the Buffalo City Metropolitan Area ................................................................................ 12 Figure 4: Percentage Cover of Different Land use Types ............................................................................................................. 13 Figure 5: Land Cover Map .................................................................................................................................................................. 14 Figure 6: Distribution of Households in the Buffalo City Metropolitan Municipal Area......................................................... 15 Figure 7: Population and total number of households in the Buffalo City Metropolitan Municipal Area as per 1996, 2001 and 2011 census results (Stats SA, 2011).............................................................................................................................. 15 Figure 8: Trend in relative proportion of Formal, Informal and Traditional Households in the Buffalo City Metropolitan Municipal Area over time (Stats SA, 2011). .................................................................................................................................... 16 Figure 9: Percentage contribution of key sectors to BCMM's economy (adapted from: Buffalo City Metropolitan Municipality, 2011). ............................................................................................................................................................................ 17 Figure 10: GDP Growth Rate of Buffalo City Metropolitan Municipality (extracted from DEDEAT, 2013). ........................ 17 Figure 11: Comparison of Rate of Unemployment in BCMM, Eastern Cape and South Africa in 1996, 2001 and 2011 (Stats SA, 2011) .................................................................................................................................................................................... 18 Figure 12: Percentage distribution of average monthly household income in BCMM in 2011 (adapted from Stats SA, 2011). ..................................................................................................................................................................................................... 18 Figure 13: Percentage households using different types of energy for cooking, heating and lighting (adapted from Stats SA, 2011). .............................................................................................................................................................................................. 19 Figure 14: Change in Types of Potable Water Access from 1996 to 2011 (StatsSA, 2011). ................................................... 19 Figure 15: Percentage of households in the Buffalo City Metropolitan Municipality using different sources of water as their main supply source (adapted from Stats SA, 2011)............................................................................................................. 20 Figure 16: Percentage of households in 2011 in the Buffalo City Metropolitan Municipal Area with flush/chemical toilets and no sanitation services (Stats SA, 2011)........................................................................................................................ 20 Figure 17: Percentage of households in 2011 in the Buffalo City Metropolitan Municipal Area reported to be using different types of sanitation facil ities (adapted from Stats SA, 2011)....................................................................................... 21 Figure 18: Percentage of households in the BCMM with different levels of Solid Waste Management Servicing in 1996, 2001 and 2011 (Stats SA, 2011). ....................................................................................................................................................... 21 Figure 19: Percentage of households in BCMM in 2011 using different types of refuse disposal (adapted from Stats SA, 2011). ..................................................................................................................................................................................................... 22 Figure 20: Coverage of Vegetation Biomes and Protected Areas in the BCMMA ................................................................... 24 Figure 21: Coverage of Vegetation Types in the BCMMA ............................................................................................................ 25 Figure 22: Coverage of Conservation Protected Areas by Management Agency in the BCMMA......................................... 25 Figure 23: NPAES Priority Areas ........................................................................................................................................................ 26 Figure 24: STEP Map for the BCMMA .............................................................................................................................................. 29 Figure 25: Terrestrial CBAs in the BCMMA (Eastern Cape Biodiversity Conservation Plan). ................................................. 31 Figure 26: Terrestrial CBAs in the BCMMA (Eastern Cape Biodiversity Conservation Plan). ................................................. 31 Figure 27: Rivers in the BCMMA ....................................................................................................................................................... 32 Figure 29: Land Capability Map......................................................................................................................................................... 34 Figure 28: River and Wetland Condition in the BCMMA (from the National Freshwater Ecosystem Priority Areas, SANBI). ................................................................................................................................................................................................... 48

5
Acronyms
BCMM Buffalo City Metropolitan Municipality BCMMA Buffalo City Metropolitan Municipal Area CZMP Coastal Zone Management Plan / Programme IEMP Integrated Environmental Management Plan SoER State of the Environment Report PSIR Pressure, State, Impact, Response NPAES National Protected Area Expansion Strategy NCMP National Coastal Management Programme NEMP National Estuarine Management Protocol ECCMP Eastern Cape Coastal Management Programme ECBCP Eastern Cape Biodiversity Conservation Plan STEP Subtropical Thicket Ecosystem Project IWMP Integrated Waste Management Plan CBA Critical Biodiversity Area BLMC Biodiversity Land Management Class ABLMC Aquatic Biodiversity Land Management Class IDP Integrated Development Plan SDF Spatial Development Framework SDP Spatial Development Plan LUMS Land Use Management System StatsSA Statistics South Africa AWSS Amatole Water Supply System DWA National Department of Water Affairs (formerly DWAF) DEA National Department of Environmental Affairs DWAF National Department of Water Affairs and Forestry (now DWA) IEM&SD Integrated Environmental Management and Sustainable Development Unit (BCMM) NEMA National Environmental Management Act NEM:ICMA National Environmental Management: Integrated Coastal Management Act NEM:AQA National Environmental Management: Air Quality Act NEM:PAA National Environmental Management: Protected Areas Act NEM:BA National Environmental Management: Biodiversity Act NEW:WA National Environmental Management: Waste Act CES Coastal and Environmental Services ELIDZ East London Industrial Development Zone DEDEAT Eastern Cape Department of Economic Development, Environmental Affairs and Tourism GDP Gross Domestic Product GVA Grass Value Added NBMM Nelson Mandela Bay Metropolitan Municipality

6
1. Introduction
1.1 Purpose of this Report
FutureWorks has been appointed by the Buffalo City Metropolitan Municipality (BCMM) to undertake a Review of the municipality’s Integrated Environmental Management Plan (IEMP) and Coastal Zone Management Plan (CZMP), both of which were prepared in 2005. The review process will involve updating the IEMP and CZMP to reflect priorities and approaches required in terms of national and provincial legislation and plans, as well as local issues, priorities and plans that have emerged since the previous versions of these documents were produced.
This report presents the findings of the first stage of the IEMP and CZMP review process: an assessment of the status quo of the environment and environmental management in the Buffalo City Metropolitan Municipal Area. The outcomes of this phase of work will provide the basis for the updating of the IEMP and CZMP.
In 2005 the Buffalo City Municipality commissioned Coastal and Environmental Services to prepare a State of the Environment Report. This was the first such report ever prepared for the Buffalo City Municipality. The 2005 State of the Environment Report (SoER) included a description of the environment of Buffalo City, and assessed the state of the environment using the ‘PSIR’ (Pressure, State, Impact, Response) framework that is commonly used in South Africa for SoE reporting.
This 2014 State of Environment Report provides an updated statement on the State of the Environment in Buffalo City Metropolitan Municipality using the same indicators and PSIR framework that was presented in the 2005 State of the Environment Report. Please note, that this report has been prepared on the basis of information available at a desktop level, and has not involved primary research or data gathering. In many cases the descriptions of the environment in Section 7 of this report have been extracted directly from the 2005 State of the Environment Report (and updated where possible).
1.2 What are IEMPs and CZMPs and why are they needed?
1.2.1 Integrated Environmental Management Plan
The Municipal Systems Act (32 of 2000) requires that all municipalities in South Africa develop Integrated Development Plans (IDP’s). In terms of this, municipalities are required to focus on development and service delivery which is financially, socially and environmentally sustainable. This focus on integrated and sustainable development is intended principally to improve quality of life for people, specifically in poor and other disadvantaged communities. However, to achieve this in a sustainable way, the priorities of social upliftment and justice, environmental protection and management, and economic growth and development need to be balanced.
While social, environmental and economic needs must be balanced to achieve a sustainable development path, there also needs to be a recognition that the natural environment provides fundamental life supporting services, without which people and the economy could not exist. This includes the use of the natural environment to produce food, water, building materials, medicinal products and energy, and to supply flood management services, fertile soils, climate protection, recreational opportunities, visual and cultural amenity. Every year, natural environments around the world provide US$ 33 trillion worth of goods

7
and services to humankind. All people and economies – no matter at what scale or where they are located - thus have a fundamental DEPENDENCE on the natural environment to be sustained, healthy and thriving.
According to the Municipal Systems Act, environmentally sustainable development and service delivery should be aimed at ensuring that —
(a) The risk of harm to the environment and to human health and safety is minimised to the extent reasonably possible under the circumstances;
(b) The potential benefits to the environment and to human health and safety are maximised to the extent reasonably possible under the circumstances; and
(c) Legislation intended to protect the environment and human health and safety is complied with.
In accordance with Section 24 of the South African Constitution, “Everyone has the right to an environment that is not harmful to their health or well-being; and to have the environment protected, for the benefit of present and future generations, through reasonable legislative and other measures that prevent pollution and ecological degradation; promote conservation; and secure ecologically sustainable development and use of natural resources while promoting justifiable economic and social development.”
The National Environmental Management Act (107 of 1998) also imposes a duty of care on all state entities to protect the environment and to adopt a precautionary approach to development.
The Buffalo City Metropolitan Municipality (BCMM) therefore has a key role to play in ensuring that all aspects of its operations respond to this context by addressing environmental management and protection as an integrated part of its service delivery, and economic and social development functions.
So, whilst the preparation of an Integrated Environmental Management Plan is not a specific statutory requirement for municipalities, IEMP’s are usually developed to provide municipalities with a coherent statement of the its environmental sustainability priorities and responsibilities, and strengthens the environmental sustainability input into the municipal IDP.
The Purpose of the BCMM Integrated Environmental Management Plan is therefore to:
1. Articulate the BCMM’s commitment to environmental protection and sustainability (through a set of aims and objectives).
2. Present the Environmental Management Policy Framework of the BCMM that needs to be integrated into all municipal sectors to support the municipality’s sustainable development aims.
3. Present a clear implementation plan for environmental sustainability projects, programmes and partnerships that need to be developed and implemented to achieve the stated environmental sustainability aims and objectives.
1.2.2 Coastal Zone Management Programme
The National Environmental Management: Integrated Coastal Management Act (NEM:ICMA) (Act 23 of 2008) prescribes that all spheres of government in South Africa develop Coastal Management Programmes (CMPs). A National CMP was first established, followed by provincial CMP’s that needed to be consistent with the National CMP, and then municipal CMPs need to be established to be consistent with both the provincial and National CMPs. This hierarchical relationship allows for the development of a strategic and overarching National CMP followed by CMPs that include increasing levels of local management detail.
This arrangement also accommodates management responses that are sensitive to the natural, social and economic differences along the South African coastline.

8
The purpose of the BCMM Coastal Zone Management Programme is therefore to:
1. Meet the statutory requirement in terms of the NEM:ICMA (Act 23 of 2008) for South African coastal municipalities to have a Coastal Zone Management Programme.
2. Articulate the BCMM’s commitment to coastal protection and management (through a clear vision, set of aims and objectives that are aligned to the local context, provincial and national Coastal Zone Management Programmes).
3. Present the Coastal Zone Protection and Management Policy Framework of the BCMM that needs to be adopted and integrated into the planning and operations of all municipal service sectors.
4. Present a clear implementation programme for coastal zone management activities and projects, as well as the partnerships that are needed for effective implementation.
1.3 How this report was developed
In order to prepare this Report, a review of available literature was undertaken in order to gather information on the current state of the environment; a field trip was undertaken around the municipal area; and a workshop was held with key municipal departments and environmental stakeholders in the municipal area on 25 April 2014. The workshop was used to evaluate the current state of implementation of the 2005 IEMP and CZMP, and to identify any new or emerging issues that needed to be addressed in the updated versions of these plans.
3. Relationship with other Policies and Plans
3.1 Overview
The Integrated Environmental Management Plan (IEMP) contains the Buffalo City Metropolitan Municipality’s environmental management policy and plan. It is a strategic document that translates national and regional environmental policy and plan directives and local environmental priorities into a plan of action to achieve environmental protection and management that supports the municipality’s sustainable development objectives.
The Coastal Zone Management Programme (CZMP) is developed in terms of the requirements of the IEMP and addresses specific coastal risks and protection / management priorities. The CZMP incorporates directives from the National and Provincial Coastal Management Plans, and addresses locally relevant risks and priorities.

9
3.2 National and Regional Environmental / Coastal Policies and Plans
The IEMP and CZMP need to be responsive to and reflective of the principles and requirements of national environmental and coastal legislation and plans, as well as associated provincial policies and plans. Specifically, the IEMP and CZMP need to include the environmental protection and management requirements stipulated in the following key national legislation, regional policies and plans:
Acts and Regulations:
• The South African Constitution (1996) • National Environmental Management Act (Act 107 of 1998) • National Environmental Management: Protected Areas Act (Act 57 of 2003) • National Environmental Management: Biodiversity Act (Act 34 of 2004) • National Environmental Management: Air Quality Act (Act 39 of 2004) • National Environmental Management: Integrated Coastal Management Act (Act 24 of 2008) • National Environmental Management: Waste Act (Act 59 of 2008) • National Forests Act (Act 84 of 1998) • National Water Act (Act 36 of 1998) • Conservation of Agricultural Resources Act (Act 43 of 1998) • All regulations published in terms of the above Acts. • National Climate Change Response White Paper (2011)
Municipal IDP
Spatial Development Framework
Sector Plans Sector Plans
Sector Plans Sector Plans
Sector Plans Sector Plans
Sector Plans
Waste Management
Plan
Coasta l Management Programme
Cl imate Response
Plan
Ai r Qual i ty Management
Plan
IEMP
Some of the plans / actions required by the IEMP may be implemented by other
sectors
Strategic Municipa l Plans di recting development and
service del ivery in the municipa l i ty
Sector and spatia l ly focused plans, detailing implementation of the IDP and SDF di rectives . These Plans must respond to
cross -cutting municipal pol icies such as fiscal and environmental
pol icies
IEMP as a sectora l
plan, a lso di rects
action in other
sectors
National and regional policies and plans
Figure 1: Simplified schematic diagram of the hierarchy of municipal plans

10
National / Regional Environmental Policies and Plans:
• National Protected Areas Expansion Strategy (NPAES) • National Coastal Management Programme (NCMP) • National Estuarine Management Protocol (NEMP) • Eastern Cape Coastal Management Programme (ECCMP) • Eastern Cape Biodiversity Conservation Plan (ECBCP) • Subtropical Thicket Ecosystem Project (STEP) • Draft Eastern Cape Climate Change Response Strategy
3.2 Local Policies and Plans
The 2013/2014 IDP (Review) states that the BCMM Strategic Objective 6 is: “To enhance and protect all environmental assets and natural resources within the BCMM by 2016.” A number of the other 5 objectives also make reference to “sustainability”, which infers environmental sustainability as well as financial, social and economic sustainability in the operations and capital developments of the municipality. The achievement of these objectives is deemed to support the city’s stated vision, which is: “A responsive, people-centered and developmental City”.
The IDP makes specific mention of the need for the municipality to comply with national legislative requirements in regards to environmental management, and specifies a number of related plans that have been compiled, including:
- Integrated Environmental Management Plan - Coastal Zone Management Plan - Integrated Waste Management Plan - Integrated Transport Plan - Municipal Open Spaces System - State of the Environment - State of the Coast - State of Sanitation - Water Services Plan - Public Transport Plan - Air Quality Management Plan
In addition to this, the BCMM has prepared a Climate Change Strategy.
The Integrated Environmental Management Plan (IEMP) is to act as a strategic “umbrella” policy and programme for environmental management in the Buffalo City Metropolitan Municipality. A number of other plans, which contain more detail for specific sectoral or spatially focused interventions, fall under or are developed in accordance with the requirements of the IEMP, including the municipality’s Coastal Zone Management Programme, Integrated Waste Management Plan and Air Quality Management Plan.
The IEMP and is intended to act both as an overarching policy and implementation framework at the local level. The IEMP is the primary responsibility of the BCMM Integrated Environmental Management Department.
The Coastal Zone Management Programme (CZMP) is the responsibility of both the Integrated Environmental Management Department and the Coastal Zone Management Unit.

11
Both plans need to be integrated into the municipal Integrated Development Plan (IDP), Spatial Development Framework (SDF), Spatial Development Plans (SDPs) and Land Use Management Systems (LUMS). The policy frameworks presented in these plans need to be integrated into the Sector Plans of all relevant municipal service sectors, particularly those whose activities play a key role in environmental protection or degradation, e.g. water services, sanitation, environmental health, waste, disaster management and roads / traffic.
Where necessary, municipal by-laws may need to be adjusted to support the implementation of the IEMP and CZMP.
4. Overview of the Buffalo City Metropolitan Municipality
4.1 Location
Buffalo City Metropolitan Municipality (BCMM) is located in the Eastern Cape Province and is one of 8 metropolitan municipalities in South Africa. It is surrounded by the Amathole District Municipality, and the Great Kei, Amahlathi, Nkonkobe and Ngqushwa Local Municipalities.
The metropolitan area is approximately 2,515km2 in size and includes some 82km of coastline (Buffalo City Metropolitan Municipality, 2011). It includes the towns of East London, Bhisho and King William's Town, as well as the large townships of Mdantsane and Zwelitsha.
The BCMM falls across seven river catchments: the Kwelera, Gqunube, Nahoon, Buffalo, Gxulu, Tylomnqa and Keiskamma River Catchments. The entire municipal area falls within the Mzimvubu to Keiskamma Water Management Area as defined by the National Department of Water Affairs.
Figure 2: Buffalo City Metropolitan Municipality Locality Map

12
Figure 3: Major River Catchments in the Buffalo City Metropolitan Area
4.2 Climate
The local climate comprises mild temperate conditions (8 to 39 0C) in the coastal areas and more extreme conditions (-2 to 42 0C) in the inland areas, with a mean annual temperature of 18 °C (CES, 2005).
Annual rainfall in the municipal area varies from 400mm to more than 1000 mm, with an annual average of around 700 mm. The highest precipitation occurs in the Amatole Mountains and in the coastal region of the Municipality. Most of the rainfall occurs during summer, except in the coastal area west of East London, where rainfall occurs year-round (CES, 2005).
4.3 Geology
The geological strata of the BCM area consist mainly of sandstones and mudstones, with intruding dolerite dykes and sills. The marine origin of these formations results in the high salinity of groundwater found in the Amatole catchments and Fish River basin (CES, 2005).
4.4 Patterns of Land Use
The Buffalo City Metropolitan Municipal Area is characterised by three distinct land use patterns namely urban areas, rural settlement areas and commercial farmland. There is a distinct east-west urban corridor running along the R102 from East London in the east, to King Williams Town and Dimbaza in the west.

13
According to the Land Cover mapping available for the area, some 61% of the municipal area is “natural” – or undeveloped. Nearly 20% of the municipal area is under agriculture and plantations; 14% is built up, and 8% is “degraded”.
Figure 4: Percentage Cover of Different Land use Types
East London is home to South Africa’s only river port and is the primary urban and economic node in the Municipal Area. King Williams Town is the secondary node. As the economic hub of the municipality, East London dominates the industrial sector and attracts people from surrounding local municipalities throughout the greater Amathole District, in search of employment and access to urban facilities.
Beyond the urban corridor lies a fringe of peri-urban and rural areas which are home to approximately one fifth of the municipal population. This area includes the Ncera and Newlands settlements and areas which previously comprised the former Ciskei Bantustans. Commercial farms are situated on the north-eastern and south-western coastal regions (Buffalo City Metropolitan Municipality, 2011).
The built environment varies from dense urban areas (such as the commercial, industrial and residential development in East London) to the relatively sparse rural settlements such as Newlands. The main industrial complexes are located in East London and surrounds. These include several heavy industrial complexes (e.g. West Bank and Wilsonia) and light industrial areas (e.g. Beacon Bay and SBDC). The East London Industrial Development Zone (ELIDZ) is located on the West Bank of East London. Other heavy industry areas include Berlin, Fort Jackson, Zwelitsha, Dimbaza and King William’s Town (CES, 2005).
East London is the main commercial area in BCM with King William’s Town and Bhisho also important commercial areas. Bhisho is also the seat of the Provincial Legislature with a number of Provincial agencies operating from this location.
BCMM has a wide variety of residential areas. Most upper and middle income housing is located in East London and suburbs (e.g. Beacon Bay and Gonubie) and to a lesser extent in King William’s Town and Bhisho. There are numerous informal settlements (or settlements in transition) throughout the municipal area. Again, some of the more important informal settlements are located in Duncan Village, Beacon Bay, Gonubie, King William’s Town, etc. There are numerous rural settlement areas and villages too numerous to list here. However, some of the more important areas include: Newlands, Needs Camp, etc. (CES, 2005).
BCM also contains a number of upper to middle class coastal villages, including: Sunrise-on-Sea, Cover Rock, Kidds Beach Kaysers Beach, Gulu, Winterstrand, Seavale, etc.
Natural, 61.1%
Cultivation, 14.8%
Degraded, 8.1%
Urban Built-up, 14.0%
Waterbodies, 1.4%
Plantations, 4.4% Mines, 0.1%

14
Figure 5: Land Cover Map
4.5 Population and Households
The municipal area reportedly contains 223,568 households (total population of 755,200 people), with an average household size of 3.2 persons per household (Statistics South Africa, 2011). This represents 11.5% of the total population of the Eastern Cape, contained within an area some 1.5% of the province. The average population density if 300 people per square kilometer.
The 2001 census revealed a municipal population of 701,890. The annual rate of population growth in the municipal area averaged 0.6% between 1996 and 2001, and 0.7% between 2001 and 2011. This is slightly higher than the provincial average annual population growth rate, reported as being 0.4% for these periods (Stats SA, 2011).

15
Figure 6: Distribution of Households in the Buffalo City Metropolitan Municipal Area
However, the increase in the number of households in the municipal area is disproportionately higher than the population growth rate. The increase in number of households averaged 3% per annum between 1996 and 2011, with the period 1996 to 2001 showing a 4.9% increase in the number of households per annum. This is likely to be reflective of the achievements of the housing delivery programme roll-out since 1994 where large households are split with the delivery of housing. The average household size declined from 4.2 persons per household in 1996, to 3.6 in 2001 and 3.2 in 2011. The average household size in the BCMM is reportedly the lowest in the province (Stats SA, 2011).
Figure 7: Population and total number of households in the Buffalo City Metropolitan Municipal Area as per 1996, 2001 and 2011 census results (Stats SA, 2011).
0
100000
200000
300000
400000
500000
600000
700000
800000
1996
1997
1998
1999
2000
2001
2002
2003
2004
2005
2006
2007
2008
2009
2010
2011
Total population
Households
2 per. Mov. Avg. (Totalpopulation)
2 per. Mov. Avg.(Households)

16
The 2011 Census provides evidence of the increasing proportion of formalised households over time relative to informal and traditional dwellings (usually rural). This not only provides an indication that housing delivery rollout has made an impact, but also that there is a trend towards increasing levels of urbanisation in the municipal area.
Figure 8: Trend in relative proportion of Formal, Informal and Traditional Households in the Buffalo City Metropolitan Municipal Area over time (Stats SA, 2011).
4.6 Socio-economic Status
The reported Gross Value Add of R29.7 Billion in the Buffalo City Metropolitan Municipality (BCMM) in 2009 made it the second largest economy in the Eastern Cape after Nelson Mandela Bay Metropolitan Municipality (NMBMM), which reported a Gross Value Add of R40 Billion. BCMM contributed 23% of the Eastern Cape provincial GDP in 2011, second only to NBMMM which contributed 43% (DEDEAT, 2013).
The key economic sectors in BCMM are depicted in Figure 9 below. Finance, is the dominant sector and represents 29% of the local GDP. This can be attributed to the regional head offices of the financial institutions located in East London. This is followed by the community services sector (28%), manufacturing (17%), trade (13%) and transport (8%). The mining and agricultural sectors contribute 0.4% and 1% respectively (Buffalo City Metropolitan Municipality, 2011).
0%10%20%30%40%50%60%70%80%90%
100%
1996 2001 2011
Traditional
Informal
Formal

17
Figure 9: Percentage contribution of key sectors to BCMM's economy (adapted from: Buffalo City Metropolitan Municipality, 2011).
Economic Growth in the municipal area has suffered over the past 5 years, in line with the rest of the province and the country. The Eastern Cape Department of Economic Development, Environmental Affairs and Tourism (DEDEAT, 2013) reports that the Buffalo City Metropolitan Municipality GDP saw a sharp decline in 2009 and 2010, but has been recovering steadily since.
Figure 10: GDP Growth Rate of Buffalo City Metropolitan Municipality (extracted from DEDEAT, 2013).
High levels of unemployment and poverty have been recognised as a key challenge in the Buffalo City Metropolitan Area (Buffalo City Metropolitan Municipality, 2011). The unemployment rate was officially quoted by Stats SA (2014) as 35.1%1. This is higher than the national average (29.8%) and lower than the provincial average (37.5%). Figure 11 shows the change in the official Rate of Unemployment in the BCMM between 1996 and 2011. This is compared to the average rate of unemployment in the Eastern Cape and South Africa. The graph shows that in each case, the BCMM reports a lower rate of unemployment than the provincial average, but a higher rate of unemployment than the national average.
1 35.1% of the 285 223 economically active individuals are unemployed (i.e. those of an employable age, and either employed or looking for work).
Agriculture1%
Community Services
28%
Finance29%
Transport8%
Trade 13%
Construction3%
Electricity1%
Manufacturing17% Mining
0%

18
Figure 11: Comparison of Rate of Unemployment in BCMM, Eastern Cape and South Africa in 1996, 2001 and 2011 (Stats SA, 2011)
The average annual household income in the BCMM was reported in 2011 as R97,554 (this is the second highest in the Eastern Cape, with NMBMM reporting the highest average annual household income). This is 51% higher than the provincial average of R64,550 (Stats SA, 2011). The BCMM average annual household income increased from R39,917 in 2001, representing a 144% increase over 10 years, or an average increase of 14.4% per annum. This is well above the average rate of inflation for this period (between 6 and 8% per annum), showing that households in the BCMM were better off economically in 2011 than in 2001.
However, 17% of households reported having no income (Stats SA, 2011) and more than one hundred thousand households reported earning less than R1,600 per month, indicating that poverty is an ongoing challenge in the BCMM. Figure 12 shows the percentage of households in the BCMM in 2011 falling within a range of different average monthly household income categories (Statistics South Africa, 2011).
Figure 12: Percentage distribution of average monthly household income in BCMM in 2011 (adapted from Stats SA, 2011).
0%
10%
20%
30%
40%
50%
60%
1996 2001 2011
BCMM
Eastern Cape
South Africa
17.0%5.2%
7.0%18.5%
17.0%11.1%
8.9%7.9%
4.9%1.5%
0.4%0.3%
0.0% 5.0% 10.0% 15.0% 20.0%
No IncomeR1 - R4,800
R4,801 - R9,600R9,601 - R19,600
R19601 - R38,200R38,201 - R76,400
R76,401 - R153, 800R153,801 - R307,600R307,601 - R614,400
R614,401 - 1,228,800R1,228,801 - R2,457,600
R2,457,601+

19
4.5 Levels of Servicing
Levels of servicing within the Buffalo City Metropolitan Municipal Area (BCMM) vary. Figure 13 below shows the energy and fuel sources used by households for cooking, heating and lighting. Electricity is the dominant form of energy used for cooking (74%), heating (41%), and lighting (81%). This is followed by paraffin, used by 18.5% of households for cooking, 34% for heating and 17% for lighting (Stats SA, 2011).
Figure 13: Percentage households using different types of energy for cooking, heating and lighting (adapted from Stats SA, 2011).
Some 52.6% of households were reported in the 2011 Census as having piped water within their dwelling, and 70.8% of households had piped water in their yard. Some 2.5% of households reported having no access to potable water, which was reduced from 8.9% reported in the 1996 Census and 6.2% in the 2001 Census.
Figure 14: Change in Types of Potable Water Access from 1996 to 2011 (StatsSA, 2011).
Figure 15 depicts the main sources of water reported in the 2011 Census as being utilised by households within the BCMM. The majority (92%) of households obtain water through a regional or local water
0.00%
10.00%
20.00%
30.00%
40.00%
50.00%
60.00%
70.00%
80.00%
90.00%
Cooking Heating Lighting
Electricity
Gas
Paraffin
Solar
Candles
Wood
Coal
Animal Dung
Other
None
0.0%
10.0%
20.0%
30.0%
40.0%
50.0%
60.0%
70.0%
80.0%
1996 2001 2011
Piped Water in Yard
Piped on CommunalStand
No Access

20
scheme, with other sources of water including water tankers (2%), rain water tank (1%), dam, pool or stagnant water (1%), borehole (1%), water vendor (0.5%), river or stream (0.3%) and spring (0.1%) (Stats SA, 2011).
Figure 15: Percentage of households in the Buffalo City Metropolitan Municipality using different sources of water as their main supply source (adapted from Stats SA, 2011).
Formalised sanitation servicing has increased steadily over the past 14 years in the BCMM. In 2011, 73% of households in the municipal area were serviced with flush or chemical toilets and some 6.4% reportedly had no sanitation services. This situation has improved as shown in Figure 16 below.
Figure 16: Percentage of households in 2011 in the Buffalo City Metropolitan Municipal Area with flush/chemical toilets and no sanitation services (Stats SA, 2011).
The 2011 Census reported that 6.4% of the BCMM had no toilet facilities while 70.4% had access to flush toilets, 68% of which were connected to a sewage system and 2.4% of which were connected to a septic tank. Other toilet facilities used include, bucket toilets (12%), pit toilets with ventilation (5.3%) and without ventilation (11%) and chemical toilets (1.6%). This is shown in Figure 17 (Stats SA, 2011).
91.6%
0.9%
0.1%
1.2%
1.1%
0.3%
0.5%
1.9%
2.4%
0.0% 20.0% 40.0% 60.0% 80.0% 100.0%
Regional/Local Water Scheme
Borehole
Spring
Rain Water Tank
Dam/Pool/Stagnant Water
River/Stream
Water Vendor
Water Tanker
Other
0.0%10.0%20.0%30.0%
40.0%50.0%60.0%70.0%80.0%
1996 2001 2011
Flush / ChemicalToilet
None

21
Figure 17: Percentage of households in 2011 in the Buffalo City Metropolitan Municipal Area reported to be using different types of sanitation facilities (adapted from Stats SA, 2011).
Solid waste management servicing in the BCMM also appears to have improved considerably over the past 14 years. Figure 18 shows the percentage of households in the municipal area with different levels of solid waste management servicing as reported in the 1996, 2001 and 2011 Census’s.
Figure 18: Percentage of households in the BCMM with different levels of Solid Waste Management Servicing in 1996, 2001 and 2011 (Stats SA, 2011).
According to the 2011 Census, 70.4% of households in the municipal area are serviced by weekly refuse removal services, have their own refuse dump, 3% utilise a communal dump and 3.2% have no rubbish disposal (Stats SA, 2011).
6.4%
68.0%
2.4%
1.6%
5.3%
11.0%
12.0%
3.2%
0.0% 10.0% 20.0% 30.0% 40.0% 50.0% 60.0% 70.0% 80.0%
None
Flush Toilet (sewage system)
Flush Toilet (septic tank)
Chemical Toilet
Pit Toilet with ventilation
Pit Toilet without ventilation
Bucket Toilet
Other
0.0%
10.0%
20.0%
30.0%
40.0%
50.0%
60.0%
70.0%
80.0%
1996 2001 2011
Removal by LocalAuthority
Communal/own Dump
None

22
Figure 19: Percentage of households in BCMM in 2011 using different types of refuse disposal (adapted from Stats SA, 2011).
4.6 Water, Wastewater and Solid Waste Infrastructure
4.6.1 Water Supply & Treatment
The Kubusie, Buffalo and Nahoon Rivers combine through a transfer scheme to form the Amatole Water Supply System (AWSS), which is the primary supply of water for the municipality. BCMM owns and operates Maden dam and Bridledrift dam. The municipality’s raw water supply is enhanced by other dams which form part of AWSS and are owned by the Department of Water Affairs and Forestry and operated by the Amatola Water Board. These include the Gubu, Wiggleswade, Rooikrantz, Laing and Nahoon dams. The Gubu and Wiggleswade dams are located on the Kubusi River, the Maden, Rooikrantz, Laing and Bridledrift dams on the Buffalo River and the Nahoon Dam on the Nahoon River (DWAF, 2012b).
A transfer scheme at Wriggleswade Dam supplements the supply of raw water to BCMM by permitting water to be conveyed into either the Buffalo or Nahoon river basins by means of a tunnel, canal and river linkage system. Such water transfer flexibility allows for better water resource management, especially in times of drought and flood, and also creates regional flexibilities allowing for the accommodation of new industrial water demand as well as growing water consumption linked to population growth and water services expansion (Buffalo City Metropolitan Municipality, 2003).
The full storage capacity of dams is shown below. The current levels and last year’s levels are shown as a percentage of the full storage capacity.
Table 1: Storage Capacity, Current Levels and 2013 Levels of Dams in BCMM (DWA, 2014).
Name of Dam Full Storage Capacity (mill ion cubic metres)
Current level Last year’s level
Bridledrift 98,0 98.1% 106.2% Gubu 8,6 100.5% 100.9% Wiggleswade 91,5 100.2% 100.7% Rooikrantz 4,8 98,4% 100.6% Laing 19 100.4% 101.2% Nahoon 19,3 83,1% 99.8%
70.4%
0.9%
3.0%
21.0%
3.2%
1.4%
0.0% 10.0% 20.0%30.0% 40.0%50.0% 60.0%70.0% 80.0%
Removed by local authority/private company atleast once a week
Removed by local authority/private companyless often
Communal refuse dump
Own refuse dump
No rubbish disposal
Other

23
The Blue Drop Report for 2012 reported that BCMM together with Amatola Water was the best performing water services provider in the Eastern Cape, achieving an Blue Drop score of 92.55% (DWAF, 2012a).
A number of the coastal villages in the BCMM utilise groundwater resources as their primary source of potable water. Water is treated locally and fed into the reticulation system.
4.6.2 Wastewater Treatment
The BCMM owns and operates 13 wastewater treatment works (WWTW), 7 of which currently discharge approximately 28.8 million m3 per annum of treated wastewater effluent directly into the sea or into rivers (DWAF, 2012b).
The BCMM’s plans to address water quality include the decommissioning of three smaller wastewater treatment works in the King Williams Town area. The BCMM plans to replace these facilities with the establishment if a regional wastewater treatment works in Zwelitsha, with an enhanced treatment capacity of 35 million litres per a day and advanced treatment processes including activated sludge with biological nutrient removal. This will address concerns of non-compliant discharges from these existing WWTWs in the Upper and Middle Buffalo River. The first phase of the WWTW upgrade has commenced and it is anticipated that all works will be complete within 3 to 5 years (DWAF, 2012b).
BCMM received a Green Drop Score of 86.7% in 2010, making the municipality the highest performer in the Eastern Cape. The Green Drop scoring system highlighted the municipality’s excellent monitoring programme and compliance with bylaws. The evaluation raised concern about wastewater quality compliance at two of its treatment facilities, namely Schornville (King William’s Town) and Mdantsane East. (Green Drop Report, 2010).
4.6.3 Solid Waste
The Buffalo City Metropolitan Municipality owns and operates two licensed landfill sites: one at King Williams Town, and Round Hill at Berlin. Both landfill sites have limited capacity and the municipality has embarked on pilot waste separation and recycling schemes that aim to reduce waste requiring landfilling.
The BCMM also operates 3 garden refuse transfer stations: IDZ, Beacon Bay and Stoney Drift in Amalinda. The majority of municipal residents cannot access these sites and as a result end up dumping their garden waste illegally.
4.7 Natural Environment
4.7.1 Biomes and Ecosystem Types
A diverse range of ecosystem types are represented in the Buffalo City Metropolitan Municipal Area (BCMMA), ranging from coastal dunes to forested hills in the hinterland. There are many sensitive and conservation worthy areas within the BCMMA, including coastal dunes, subtropical thicket, wetlands, river systems, cultural sites, and rare and endangered species. Of particular importance, both economically and biophysically, is the 82 km of coastline.
Many ecosystems within BCM are stressed and are in need of conservation and/or remedial attention. For example, many terrestrial habitats are becoming infested with invasive alien vegetation, while many water

24
systems (both fresh and marine) are subjected to pollution. In addition, development pressure is increasingly placing coastal areas under severe threat.
The size of the BCMMA is 2,515km2. Some 61% of this land area is “natural” or not developed, 1.4% is under water bodies, and nearly 20% is under plantation forestry and agriculture. This indicates that some 82.4% of the municipal land area is under a form of vegetative cover and so produces a range of ecosystem services that will benefit local residents and the municipal administration. Some 8% of the municipal area is classified as “degraded” and is likely to suffer reduced production of ecosystem services.
The majority (64.5%) of the municipal area falls within the Albany Thicket Biome, followed by the Savanna Biome (29.5%). The BCMMA also contains areas of indigenous forest, grasslands, wetlands and estuaries.
Table 2: Percentage Cover, South African Vegetation Biomes in BCMMA
BIOME Coverage % Albany Thicket Biome 64.5 Azonal Vegetation 1.2 Forests 3.1 Grassland Biome 1.5 Savanna Biome 29.5 Waterbodies 0.1 100
Figure 20: Coverage of Vegetation Biomes and Protected Areas in the BCMMA

25
Figure 21: Coverage of Vegetation Types in the BCMMA
4.7.2 Protected Areas in the BCMMA
Approximately 53 km2 of land (2.1% of the municipal area) in the BCMMA is formally protected for conservation purposes. More than half of this protected area is Provincial Nature Reserve managed by the Eastern Cape Parks Board. Some 819 hectares of private nature reserves are managed by the local authority (BCMM).
Figure 22: Coverage of Conservation Protected Areas by Management Agency in the BCMMA
Forest Act Protected Area Department of
Agriculture, Fisheries, and
Forestry, 1231 Ha
Local Nature Reserve Local
Protected Area, 819 Ha
Private Nature Reserve Private,
224 Ha
Provincial Nature Reserve Eastern
Cape Parks Board, 3043 Ha

26
The BCMMA is also home to two Marine Protected Areas (MPAs): the Nahoon Point to Gonubie Point MPA; and the Christmas Rock to Gxulu River Mount MPA. There is an almost continuous corridor of protected area along the length of the coastline in the BCMMA. Some 60km of the 82km length of coast contained within the municipal area (some 72%) is formally protected.
4.7.3 National Protected Area Expansion Strategy (NPAES) areas in the BCMMA
The National Protected Area Expansion Strategy (NPAES) was adopted in 2009. This strategy sets targets for protected area expansion, provides maps of the most important areas for protected area expansion, and makes recommendations on mechanisms for protected area expansion. The implication for local municipalities is that certain types of development proposed within priority areas will trigger the need for an Application for Environmental Authorisation subject to Environmental Impact Assessment (EIA) or Basic Assessment (BA). This is a requirement of the national Environmental Impact Assessment Regulations promulgated in terms of the National Environmental Management Act (NEMA). As shown the following Figure, the BCMMA contains a small portion of one priority area near Macleantown, namely the Bisho-Kei priority focus area.
Figure 23: NPAES Priority Areas
4.7.4 Subtropical Thicket Ecosystem Project (STEP) areas in the BCMMA
The Subtropical Thicket Ecosystem Project (STEP) is a bioregional conservation plan for South Africa's Thicket Biome, which stretches from the Gouritz River in the Western Cape to the Kei River in the Eastern Cape and inland as far as Graaff-Reinet. It includes the Buffalo City Metropolitan Municipal area. The STEP
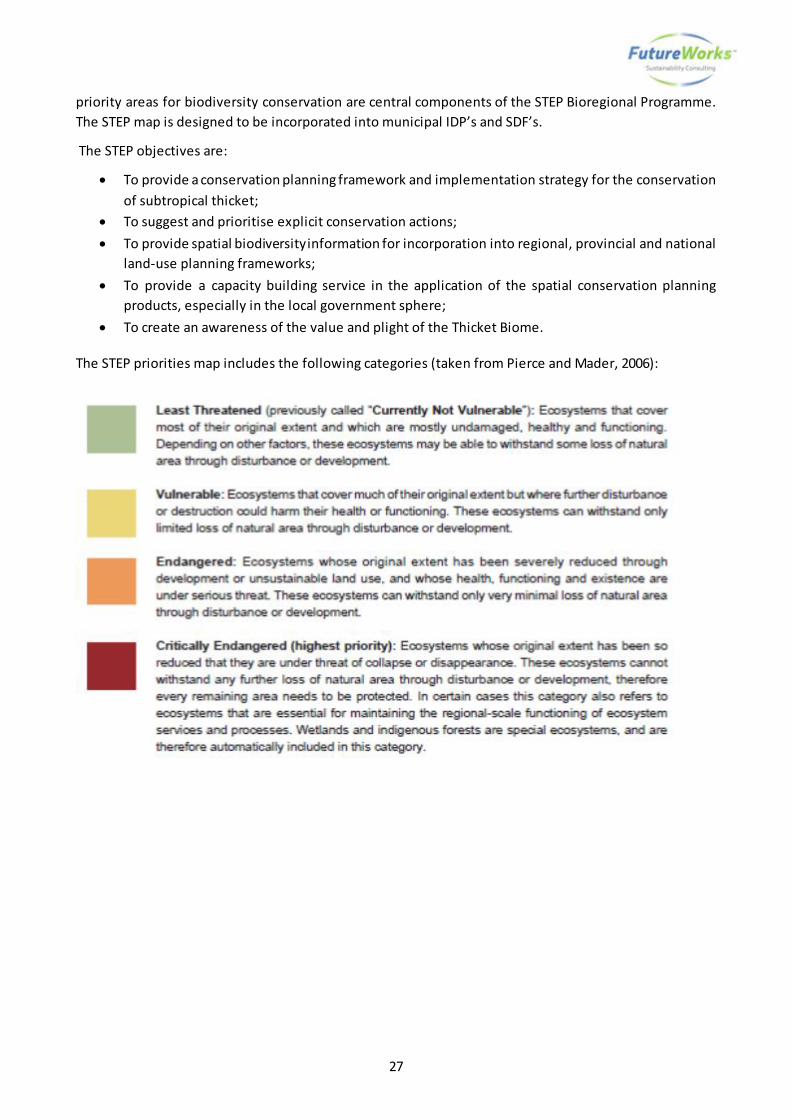
27
priority areas for biodiversity conservation are central components of the STEP Bioregional Programme. The STEP map is designed to be incorporated into municipal IDP’s and SDF’s.
The STEP objectives are:
• To provide a conservation planning framework and implementation strategy for the conservation of subtropical thicket;
• To suggest and prioritise explicit conservation actions; • To provide spatial biodiversity information for incorporation into regional, provincial and national
land-use planning frameworks; • To provide a capacity building service in the application of the spatial conservation planning
products, especially in the local government sphere; • To create an awareness of the value and plight of the Thicket Biome.
The STEP priorities map includes the following categories (taken from Pierce and Mader, 2006):

28
Where these STEP zones occur within the Buffalo City Metropolitan Municipal Area, cognisance will need to be taken of the need to retain key biodiversity habitats, corridors and buffers to protect the functionality of the sub-tropical thicket ecosystem in the region. Figure 24 presents the STEP priority conservation areas map for the Buffalo City Metropolitan Municipal Area. Areas inland of King Williams Town have been identified as critically endangered and this is likely to pose a constraint for future development. Similarly, areas of thicket in the Buffalo River valley have been identified as Vulnerable, and these should be protected from development.

29
Figure 24: STEP Map for the BCMMA
4.7.5 Eastern Cape Biodiversity Conservation Plan areas in the BCMMA
The Eastern Cape is globally recognised for its high biodiversity value and scenic beauty. It has the highest biome diversity of any province, with no less than seven biomes: Forest, Fynbos, Nama Karoo, Savanna, Succulent Karoo and Thicket. The Province contains three centres of biological endemism: the Albany Centre, the Drakensberg Centre and the Pondoland Centre.
Recognising the need to ensure that these important natural resources are conserved, the Department of Economic Development and Environment Affairs (DEDEA) together with the Department of Water Affairs and Forestry (DWAF) prepared the Eastern Cape Biodiversity Conservation Plan (ECBCP). The ECBCP identifies and maps critical biodiversity areas, and provides land use planning guidelines that recommend biodiversity-friendly activities in priority areas.
The ECBCP identifies Critical Biodiversity Areas (CBA) based on the systematic biodiversity planning analysis2 undertaken in 2007, as well as, biodiversity priority areas identified by other systematic biodiversity planning projects, such as the STEP Programme. The ECBCP developed two maps, one showing the terrestrial CBAs (see Figure 26) and the other, the aquatic CBAs (see Figure 25).
In order to facilitate the integration of these CBAs into spatial development planning, the ECBCP has identified Biodiversity Land Management Classes (BLMC) which relate to the terrestrial CBAs and Aquatic Biodiversity Land Management Classes (ABLMC) which relate to the aquatic CBAs. The terrestrial BLMCs set out the desired ecological state of a parcel of land, as well as, the allowable land use types that are 2 Systematic conservation planning is about setting clear targets for how much biodiversity needs to be protected and identifying representative samples of biodiversity that need to be maintained or conserved in order to meet those targets.

30
compatible with maintaining this desired state – see Table 3. The aquatic BLMCs set out suggested catchment transformation thresholds, as well as, a set of recommended permissible upper limits to the loss of natural vegetation cover in each sub-quaternary catchment – see Table 4.
Table 3: Terrestrial CBAs and BLMCs (ECBCP, 2007).
CBA BLMC Land use objective
Cons
erva
tion
Gam
e fa
rmin
g
Com
mun
al
lives
tock
Com
mer
cial
liv
esto
ck
Dry
land
cr
oppi
ng
Irrig
ated
cr
oppi
ng
Dairy
farm
ing
Tim
ber
Sett
lem
ent
Protected Areas
BLMC 1: Natura l landscapes
Maintain biodiversity in as natural s tate as possible. Manage for no biodiversity loss.
ü û û û û û û û û
Conservation Areas
Terrestrial CBA 1 (not degraded)
Terrestrial CBA 1 (degraded)
BLMC 2: Near natural landscape
Maintain biodiversity in as near natural s tate with minimal loss of ecosystem integrity. No transformation of natural habitat should be permitted.
ü ü ü û û û û û û
Terrestrial CBA 2
Other natural areas
BLMC 3: Functional
landscapes
Manage for sustainable development, keeping natural habitat intact in wetlands (including wetland buffers) and riparian zones. Environmental authorisations should support ecosystem integrity.
ü ü ü ü
Cond
ition
al
Cond
ition
al
Cond
ition
al
Cond
ition
al
Cond
ition
al
Transformed areas
BLMC 4: Transformed
landscapes
Manage for sustainable development.
ü ü ü ü ü ü ü ü ü
Table 4: Aquatic CBAs and ABLMCs (ECBCP, 2007).
CBA ABLMC Description of CBAs ABLMC Transformation Threshold
Aquatic CBA 1 ABLMC 1: Natural s tate Cri tica lly important river sub-catchments;
Priori ty primary catchments for E1 estuaries
Less than 10 % of total area of sub-quaternary catchment
Aquatic CBA 2 ABLMC 2a: Near natural s tate
Important sub-catchments;
Primary catchment management areas for E2 estuaries.
Less than 15 % of total area of sub-quaternary catchment
Aquatic CBA 3
Aquatic CBA 2 ABLMC 2b: Near natural s tate
Catchments of free flowing rivers important for fish migration.
Less than 20 % of total area of sub-quaternary catchment

31
Figure 25: Terrestrial CBAs in the BCMMA (Eastern Cape Biodiversity Conservation Plan).
Figure 26: Terrestrial CBAs in the BCMMA (Eastern Cape Biodiversity Conservation Plan).

32
4.7.6 Rivers and Estuaries
The BCMM falls across seven main river catchments: the Kwelera, Gqunube, Nahoon, Buffalo, Gxulu, Tylomnqa and Keiskamma River Catchments. Some of these “catchment areas” include a number of short rivers draining directly into the sea rather than one large river.
The entire municipal area falls within the Mzimvubu to Keiskamma Water Management Area as defined by the National Department of Water Affairs.
Figure 27: Rivers in the BCMMA
There are 22 estuaries within the boundaries of the BCMM area ranging from large open to small closed systems. This does not include Kwelera and Keiskamma estuaries that form the municipal boundaries with the Great Kei and Ngqushwa Municipalities respectively. The BCMM only has jurisdiction up to the high water marks on the western and eastern sides of each estuary and as a result only regulate activities occurring along the banks of these estuaries and are not responsible for the management of the actual estuarine systems (Buffalo City Metropolitan Municipality, 2005a).
The Nahoon Estuary is considered to have the highest conservation significance in the municipal area. It is the only estuary that has been afforded formal protection through the proclamation of the East London Coast Nature Reserve, which extends from the coast inland and incorporates most of the estuary. An Estuary Management Plan has been prepared for this Estuary. None of the other estuaries in the municipal area are protected, with the exception of the extreme coastal extents of some, which may fall within coastal Nature Reserves.

33
East London’s harbour, situated on the Buffalo Estuary offers a strategic competitive advantage to economic development within the municipality. The harbour area is severely polluted elevated levels of heavy metals, bacteria (faecal and total coliforms) and contaminated run-off. The Buffalo River is the primary source of contamination, other sources include residential and industrial wastewater, storm water runoff from the city centre, landfill leachate and pollution associated with port activities such as spillages, repairs and waste disposal (The River Health Programme, 2004)
Recreational activities along the coast are often centred on estuaries which are a main attraction for locals and visitors and therefore also have the potential to generate income through suitably managed tourism initiatives. Boating, fishing and canoeing, paddling and swimming are the main recreational uses of the coastal region. The BCMM has a comprehensive set of boating bylaws due to the threat the activity poses to the natural environment as well as public safety. Fishing and bait is also of concern and requires careful management to prevent over utilisation and maintain the biodiversity and natural functioning of systems (Buffalo City Metropolitan Municipality, 2005a). However, lack of enforcement of local by-laws, bag and catch limits as set by National Government have been reported to be a significant problem.
4.7.8 The Coast
The East London coast has, for the most part, been well protected from development and remains in good condition with a diversity of coastal habitat types and functional ecosystems. In the East London CBD the coastal zone is highly modified and has been fortified in places to protect infrastructure from coastal erosion. Key tourist nodes, such as Kidds Beach, Nahoon and Gonubie are also zones in which the coastal zone has been modified.
There is limited infrastructure in the coastal zone – except in the key nodes as mentioned above – that is at risk from coastal erosion. Most of the infrastructure at risk is municipal infrastructure that has been constructed to provide access to the coast for recreational purposes, such as parking lots and walkways.
The BCMM reports ongoing development pressure in the coastal zone as an existing and future threat.
4.8 Land Capability
Land Capability is determined by the collective effects of soil, terrain and climate features and recommends the most intensive long-term use of land for rain-fed agriculture and at the same time indicates the permanent limitations associated with the different land-use classes.

34
Table 5: Land capability classes and associated land use options (AGIS).
Order A: Arable land – high potential land with few limitations (Classes 1 and 2)
Order B: Arable land – moderate to severe limitations (Classes 3 and 4)
Order C: Grazing and forestry land (Classes 5, 6 and 7)
Order D: Land not suitable for agriculture (Class 8)
As shown in Table 5 and Figure 28, the Land Capability of the BCMM varies across the municipal area, with the majority of arable land (with limitations) being located in the west and south of the municipal area (classes 3 to 4). A small area of class 2 arable area is located in a section of the the Gonubie river valley in the north of the municipal area.
Figure 28: Land Capability Map
Land Capability Intensity of use for rain-fed agriculture
Orders Classes Wildlife Grazing & Forestry Crop Production
Forestry Veld Veld reinforcement
Pastures Limited Moderate Intensive Very Intensive
Arab
le
A 1 ü ü ü ü ü ü ü ü ü
2 ü ü ü ü ü ü ü ü
B 3 ü ü ü ü ü ü ü
4 ü ü ü ü ü ü
Non
ara
ble
C 5 ü ü ü ü ü
6 ü ü ü ü
7 ü ü ü
D 8 ü

35
4.9 Eco-tourism Tourism is one of the key economic growth sectors of Buffalo City Metropolitan Municipality’s (BCMM) economy (Buffalo City Metropolitan Municipality, 2011). East London’s domestic airport alone brings 346,000 people into the municipality annually with more than 11,000 visitors over the peak holiday season (Buffalo City Metropolitan Municipality, 2008). The BCMM IDP highlights the potential of tourism to create jobs and promote skills development and lists the delivery mechanism for tourism as one of the key challenges of the cluster.
Tourism in Buffalo City is centered on its beaches, its 82kms of coastline feature rocky shores as well as sandy beaches, and warm currents of the Indian Ocean make it ideal for swimming and fishing. There are a variety of other activities offered, including diving, whale watching, surfing, micro lighting, paragliding and canoeing. There are also many small resort accommodation facilities along the coast. Orient Beach is one of the most popular family holiday destinations. Eastern beach is also a popular site and is the main long beach fronting the Esplanade, it features high dunes and the Bat’s Cave area is open for visitors to explore. North of East London, Nahoon beach is a popular surf and diving spot with the reef being a main attraction (Buffalo City Metropolitan Municipality, 2008b).
Buffalo City offers tourists an opportunity to get in touch with nature and experience wildlife. East London’s Beachfront is home to South Africa’s oldest aquarium, built in 1931. The aquarium boasts a shark pool, seal show and whale watching deck. Situated on the Esplanade, the aquarium is a major tourist attraction, receiving 160,000 visitors per annum (Grant Thornton Kessel Feinstein, 2004).
Gonubie Nature Reserve is a main attraction for bird watchers. The small reserve is home to 130 species and has a wide variety of adventure activities on offer including eco-walks and hiking trails though coastal areas and indigenous forest (Buffalo City Metropolitan Municipality, 2008b).
East London Coast Nature Reserve spans 3,000 hectares of protected area, extending from the Tylomnga River in the south east to the Great Kei River in the north east. The reserve aims to preserve the biodiversity of the region and protect the natural vegetation. The area contains ten coastal reserves (Cape Morgan, Double Mouth, Cape Henderson, Cintsa West, Kwelera, Nahoon, Cove Rock / Gulu, Kidds Beach Nature Reserve, Kayser’s Beach and Chalumna) and two inland state forests which lie on the north bank of the Buffalo River. The main attractions are leopard, blue duiker, and a variety of bird species, the sardine run and frequent sightings of the Southern Right whale (SA Venues, 2014).
There are also a number of private game farms that protect many thousands of hectares of natural habitat and a number of important species, including Rhino.
History and heritage sites within BCMM are major tourism assets. Palaeontologists have discovered remains from early life forms in the areas such as the rock art in the Amatole and Maluti mountains and the country’s first dinosaur fossil being discovered near Grahamstown. Human fossilised footprints dating back 200 000 years were discovered in 1964 at Bat’s Cave in Nahoon (Buffalo City Metropolitan Municipality, 2008b).

36
5. IEMP and CZMP Implementation Status
Buffalo City has set up an Integrated Environmental & Sustainable Development Unit within the IDP, PMS, IEMP & SD Department in the City Manager’s office. This Unit has an overarching strategic responsibility for the protection and management of the natural environment in Buffalo City. At present the Department is staffed with one Manager and one Environmental Officer.
A Coastal Zone Management Unit has also been established that is responsible for a range of functions including coastal conservation and management of the East London Aquarium.
At the stakeholder workshop held on 25 April 2014 to inform the preparation of this report, a number of stakeholders raised a concern that the implementation of the 2005 IEMP and CZMP has not been adequate over the past few years. The key reasons cited included lack of capacity and vacancies in strategic positions. The group did, however, indicate that progress has been made in some areas, including air quality management, integrated waste management, water resources monitoring and management, and climate change.
Some of the main institutional issues that were cited included:
• Limited capacity within the IEM&SD Unit, there is no capacity to implement projects and there is poor integration of the IEMP and CZMP principles and strategies across sectors.
• Low priority given to environment as a result of limited capacity and leadership in the environmental sector in the municipality, and consequently low priority is given to environmental issues and implementation requirements.
• The BCMM is not compliant with environmental legislation as a result of the limited environmental management enforcement capacity and lack of integration of environmental management principles and strategies across sectors.
One of the key conclusions of the stakeholder workshop was that the single most important issue that needed to be addressed in the review of the IEMP and CZMP was the institutional capacity within the BCMM to champion, coordinate and drive environmental protection, compliance and management in the municipal area.
6. Key Environmental and Coastal Management Issues, Opportunities and Constraints
Environmental issues, opportunities and constraints have been identified through a process of engagement with municipal officials, key stakeholders and through the review of local, regional and provincial plans, policies and programmes. These issues, opportunities and constraints will be used to guide the development of environmental management principles, programmes and projects in the updated IEMP and CZMP in the next phase of work.

37
Table 6: Environmental Issues, Opportunities & Constraints
Issues Opportunities Constraints
Environmental Governance
- Capacity of IEM&SU is insufficient to drive integration of environmental management into all sectors, coordinate actions, inform development decisions on a day to day basis, and implement projects.
- Ins titutional location of the IEM&SU needs to be reviewed in l ight of the role that the unit needs to play in the municipality.
- Decentralised implementation of environmental management action with no coordination, monitoring and eva luation.
- Limited coordination / support from other spheres of government to help police compl iance with potentially pol luting activities in the municipal area.
- IEM&SU unit exists, as does a CZM unit, these are a sound basis to bui ld environmental governance capacity in the municipal structures.
- Environmental management capacity exis ts in many municipal departments already and progress has been made in implementing IEMP objectives – envi ronmental health, water and wastewater, sol id waste.
- Financial. - Loca l skills availability. - Pol i tical buy-in.
Urban Settlement Areas & Amenities
- Urban poverty in many loca lities.
- Air quality impacts from certa in industries.
- Air quality impacts from traffic and transportation systems.
- The BCMM has large areas of undeveloped land which is not constrained by biophysical or access l imitations.
- Urban greening could be undertaken in such a manner as to create green jobs, sustainable l ivelihoods, while improving local urban landscape quality, providing fruit trees etc.
- Loca l food security programmes could be established in key locations using permaculture and ra inwater harvesting approaches.
- Resource limitations such as water availability may constrain development and urban greening and food security programmes.
- Extens ive coverage of natural areas with biodiversity conservation va lue may constrain development / agricultural land uses.
Rural Settlement Areas & Agriculture, Forestry
- Limited extent of land with a high capability for agricultural production, limiting local food security and agricultural economy opportunities.
- Municipal commonage is associated with management i ssues, productivity may be
- Extens ive coverage of natural areas presents a key opportunity for a range of economic activi ties associated with game farming / nature based tourism.
- Soi l erosion
- Resource limitations such as water availability constrain agricultural options.
- Expansion of forestry areas l ikely to conflict with water resource requirements for the

38
decl ining and a number of environmental impacts are resulting.
rehabilitation programmes may pose an opportunity for job creation.
region.
Solid Waste Management
- I l legal dump sites posing a human health and environmental pollution ri sk.
- Some landfill / refuse sites not compl iant with l icense conditions, or unlicensed.
- Municipality has an Integrated Waste Management Plan.
- Potential for the establishment of green waste collection to supply biomass to biogas / electricity installation should be investigated to increase the financial feasibility of collection of garden refuse.
- Recycl ing / waste buy-back programmes rol lout for sustainable l ivelihoods.
- Waste re-use should be investigated for key waste types.
- Avai lability of suitable land for new landfill s i te(s) may be constrained by coverage of natural areas with conservation va lue.
Wastewater Management
- Old infrastructure with insufficient capacity, resulting in spills and ongoing pollution of receiving environment, and human health risks.
- Stormwater ingress into wastewater system compounds the problem.
- Limited facilities to treat trade effluent and lack of municipal capacity to police the management of trade effluent by private sector.
- BCMM has good capacity to manage wastewater infrastructure.
- New technologies that l imit wastewater flows from households should be implemented for a ll new developments.
- Financial constraints to fix wastewater infrastructure – the sca le of the problem is s ignificant. Prioritisation i s therefore required.
Water Resources - Few of the rivers and wetlands in the municipal area are in good / functional condition.
- Environmental Water Requirements are not being met.
- Serious water quality impacts as a result of non-point source pol lution, leaking and overflowing sewers and wastewater treatment plants – mainly the Buffalo and Nahoon Rivers – eutrophication and diminishing recreational va lue of water bodies, increasing treatment costs and human health risks.
- Increasing local household water security through ra inwater capture and s torage could be investigated.
- Water conservation awareness and demand management programme could reduce water demand, ri sks and pressure on wastewater infrastructure.
- Potential to recycle wastewater effluent for re-use being investigated.
- Streamflow
- Limited groundwater supplies.
- Lack of capacity to undertake pollution control enforcement at the scale i t may be needed.
- High cost of addressing s tormwater systems that are contributing to water resource impacts.

39
- Significant unaccounted for water loss in urban areas (non-revenue water i s 39.6%).
- Lack of awareness about water conservation.
- Free basic water – dis-incentivises water conservation.
- Al ien plants on dams and rivers , and in catchments – water loss and quality impacts.
- Threats to groundwater quality in coastal vi llages as a result of sea level ri se and coastal flooding (climate change risk)
enhancement projects could be implemented and create green jobs.
- Water conservation awareness raising.
- Block tariff system for water use to incentivise efficiency.
Energy - Use of unsafe fuels such as paraffin s till prevalent.
- Increasing cost of electricity drives ri sing energy poverty and increasing cost to run municipal infrastructure.
-
- Solar water heater rol lout.
- Solar home system rol lout / promotion.
- Fuel safety awareness campaigns (paraffin, LPG, wood).
- Poss ible opportunities for biomass to energy (garden waste and wastewater s ludge).
- Municipal energy demand management rol lout.
- Electricity prices regulated nationally.
Biodiversity / Natural Areas
- Loss of conservation areas to development (formal and informal).
- Al ien plant invasions in certain loca lities.
- Soi l erosion – often associated with road stormwater dra inage systems.
- I l legal sand and stone mining – municipality does not have capacity to police this.
- Loss of biodiversity due to cl imate change
- Lack of detail on biodiversity assets that need to be protected for inclusion in planning processes and development control.
- Fire management. - Poaching.
- 61% of the municipal area is under natural land cover, 2.1% of the municipal area contains formally and informally protected areas. Coverage of unique and important conservation areas presents good potential for game farming, nature based tourism land uses and development.
- Job creation through a l ien invasive plant clearing, donga restoration, community game parks are all opportunities.
- Natura l areas of conservation importance pose a constraint on certain types of development that may be envisaged.
Coastal Assets - Poor coordination between spheres of government on coastal management.
- Inadequate capacity to
- CZM unit in place with capacity to undertake some forms of management.
- Limited information on coastal ri sks and hazards, and detail on areas that require

40
regulate and police development in the coastal zone.
- Degradation of the marine environment as a result of urban pollution and marine outfa lls.
- Loss of coastal habitat to development, flood damage and recreational use.
- Degradation of the coastal environment as a result of over-use of resources and invasion of alien species.
- I l legal sand and stone mining – municipality does not have capacity to police this.
- Cl imate change.
- Job creation through coastal zone management and protection.
- Tourism (managed). - Protected areas along
the coast.
protection / modelling of development set-backs.
Climate Change - Increasing risk and vulnerability of people, settlements and infrastructure as a result of cl imate change effects in the BCMM
- Lack of detailed information about the likely change in cl imate and risk that will occur in the BCMMA as a result of global climate change, resulting in inappropriate or inadequate responses.
- National commitments to reducing greenhouse gas emissions trajectory
- Opportunities to generate jobs from green economy projects that contribute towards cl imate protection
- Cl imate Change Strategy under development
- Cl imate Mitigation Strategy complete
-
7. State of Environment
7.1 Air Quality
The industrial and transportation sectors are the primary producers of air pollution throughout BCM. Processing factories and motor vehicles generate large quantities of smog which is dispersed into the surrounding atmosphere. Industrial areas probably contribute the most to air quality problems. The emission of air pollutants from motor vehicles and other vehicle exhausts is becoming an increasingly important issue in BCM as the population and associated number of car owners increases. Poor air quality resulting from domestic fires in informal settlements and peri-urban areas is also a problem in BCM.
Poor air quality can have the following impacts:
- Human health issues, either acutely and chronically - Ecosystem health issues, including fauna and flora - Condition of buildings, monuments and cultural heritage sites.
The air quality issues that were identified in the 2005 SoER were:

41
1. Declining air quality 2. Legal compliance
No new issues were identified in 2014.
In terms of the National Environmental Management: Air Quality Act (39 of 2004), local governments are required to prepare an Air Quality Management Plan. The BCMM has prepared such a plan and institutional capacity has been created to undertake air quality monitoring in the municipal area. This response by the municipality is appropriate in light of the need to address the two issues listed above.
In 2011, Buffalo City Municipality attained Metropolitan Municipality status, increasing its responsibilities in regards to air quality management and making it responsible for performing an Air Emissions Licensing function. Its responsibilities in regards to air quality include:
• Preparation of an Air Quality Management Plan for incorporation into the IDP • Assessment and identification of priority pollutants, sources and areas • Monitoring of ambient air quality • Monitoring of emissions from sources and areas by the development and maintenance of an
emissions inventory • Establishment of local emissions standards, should this be necessary, to improve air quality in the
area • Appointment of an Air Quality Officer • Performance of the Air Emissions Licensing function
7.1.1 Pressures
Pressure (cause) Industrial smoke-stack emissions of nitrogen dioxide, sulfur dioxide and particulate matter due to inadequate treatment at source. There are a number of factories in BCMM that emit air pollutants (e.g. Dimbaza Foundry). Traffic related pollutants (e.g. lead) due to increasing vehicle ownership and usage. Smoke generated by domestic fires in informal areas that do not have access to cleaner energy. Lack of capacity in BCM to manage, monitor and enforce of air quality requirements. Burning of waste in landfills. BCMM needs to be compliant with the NEM:AQA.
7.1.2 State
Indicators State (2005) State (2014) Appointment of an air quality control officer in terms of the NEM:AQA
No appointment Air quality officer appointed – Chief Environmental Health Practitioner of the Environmental Pollution Unit, Health Department – May 2012.
Development and of an Air Quality Monitoring Plan
No air quality management plan
Air Quality Management Plan has been prepared and was approved by Council in July 2012.
% of licensed industries which do not comply with license conditions % of these for which there was
Not data Not data
No data No data

42
enforcement action by the authority % of key pollutants monitored according to the specification in the National Air Quality Framework
Not data Two ambient air quality monitoring stations established in 2007 (Beaconsfield Rd, East London and Zwelitsha), measuring a range of air pollutants and meteorological conditions. Air quality general complies with National Standards (2012 report).
Ambient concentrations of key pollutants
Not data Being monitored: SO2, NO2, particulate matter smaller than 10 microns, ozone, carbon monxide.
Degree of exceedence of national standards for ambient concentrations of key pollutants
Not data No exceedance, complies with national standards.
Number of air pollution related complaints received by local authority % of these for which there was enforcement action
Not data Not data
No data No data
Air Emissions Licensing function being performed
- No capacity within the municipality for this, the function is currently being performed by the Provincial Air Quality Officer.
Air Emissions Inventory prepared and regularly updated
- Air Emissions Inventory prepared in June 2012.
7.1.3 Impact
The specific environmental and health related impacts of air quality in the BCMM are not known.
7.1.4 Responses
The fact that the municipality has responded to Air Quality issues by developing an Air Quality Management Plan, has appointed an Air Quality Control Officer and is undertaking ambient air quality monitoring has addressed the municipality’s need for legal compliance. It has also created capacity to address air quality compliance by private emitters, and air quality issues in the municipality going forward.
The municipality has also developed an Integrated Transport Plan and a Public Transport Plan which may assist in responding to vehicle related air emissions.
7.2 Noise Pollution
Noise pollution can affect human health both physiologically and psychologically. In large urban agglomerations, the effect of noise is further aggravated by high concentrations of people living together. The noise pressure originates from road traffic, air traffic, railways and construction noise, etc.
In terms of Part B of Schedule 5 of the Constitution, noise pollution control is a core local government responsibility. Noise pollution is regulated in BCMM in terms of existing by-laws.
The main noise pollution issues identified in the 2005 SoER included:

43
1. Noise Pollution 2. Legal Obligation
No new issues were identified in 2014.
7.2.1 Pressures
The main pressures relevant to noise pollution in BCMM include:
Pressure (causes) Urbanization Increased traffic Increased industrial activity Air traffic Increased construction activities Loud music Legislation (Part B of Schedule 5) Constitution
7.2.2 State
Indicator State (2005) State (2014) Number of noise pollution related complaints received % of complaints for which there was enforcement action
Not known Not known
Not known Not known
7.2.3 Impacts
The specific impacts of noise in BCMM are not known. However, excessive noise can result in hearing problems and can affect quality of life.
7.2.4 Response
Although noise pollution is not specifically addressed in the IDP, a noise control capability does currently exist in the Environmental Health Department, where it is regulated in terms of existing by-laws.
Revised noise control by-laws for the Buffalo City Municipality were drafted and gazetted in October 2010.
7.3 Climate Change
Since the industrial revolution, carbon based fossil fuel products such as coal and oil have been consumed in massive quantities to drive economic development in the industrialised world. This has resulted in an accumulation of carbon dioxide and other greenhouse gases in the Earth’s atmosphere which is causing global warming.
Climate change is possibly the most serious environmental challenge currently facing the planet. It is a global problem that faces all nations.
In 2011 the Department of Environmental Affairs published the National Climate Change Response White Paper, which documents the vision and policy of the South African government to developing an effective response to climate change and moving towards a low carbon economy.

44
Both climate adaptation and mitigation responses are incorporated into the White Paper. The main objectives of the Paper are to manage climate change impacts through various interventions (adaptation response) and to reduce the emissions that South Africa produces (mitigation response).
The overall approach of the policy is the promotion of “climate change resilient development” and incorporates both mitigation and adaptation interventions. The definition given is as follows:
“Climate change resilient development refers to all interventions – mitigation, adaptation or both – that contribute to a fair and effective global solution to the climate change challenge while simultaneously building and maintaining
South Africa’s international competitiveness, its social, environmental and economic resilience to the adverse effects of global climate change, and any unintended consequences of global climate change response measures”.
National Climate Change Response White Paper (RSA, 2011:12)
Under the climate adaptation section, the policy identifies key adaptation sectors and sets out policy actions for each. The key sectors include water, agriculture and commercial forestry, health, biodiversity and ecosystems, human settlements- a distinction is made between urban, rural and coastal - disaster risk reduction and management. The policy asserts that adaptation responses have a stronger local context than mitigation responses and their benefits may appear faster and are often more tangible. The policy also states that adaptation responses can help to create green economy jobs and therefore adaptation responses can be included in sustainable development policies.
South Africa’s mitigation efforts are framed within two contexts by the White Paper. The first is to contribute to the reduction in global emissions and the second is to promote development and eradicate poverty. With support from the developed world, South Africa has set a goal of achieving a 34% reduction in Greenhouse Gas (GHG) emissions against business as usual by 2020, and 42% reduction in GHG emissions against business as usual by 2025. With this support, GHG emissions are expected to peak between the years 2020 and 2025, and thereafter plateau for about a decade, and then decline. These targets were informed by a long term scenario study compiled for South Africa.
Local governments are tasked with incorporating climate change considerations and constraints into municipal development tools including their Integrated Development Plans and service delivery programmes. The policy adds that local governments’ mandate regarding climate change issues is not always clear. The policy recommends the following:
• Department of Cooperative Governance and Traditional Affairs to lead a critical review of the policy and legislation relating to local government and climate change.
• National Treasury to lead a process to re-examine current fiscal measures and the incentives for adaptation and mitigation measures by local government.
• A climate change toolkit is prepared for provincial and local government practitioners. • Sharing of best practice across provinces and municipalities to be coordinated by the Department
of Environmental Affairs and Department of Cooperative Governance and Traditional Affairs. • The South African Local Government Association to ensure the integration of climate adaptation
and mitigation actions into local government plans and lobby for the measures and resources to support local government.
The BCMM Disaster Management Department reports that over the past years, rainfall events of 100mm or more are occurring at closer intervals than before, resulting in more frequent flooding. It also reports that there are many settlement areas in the BCMMA that are highly vulnerable to surface water flooding (flat

45
topography and poor drainage), and river-related flooding. Ward 10 and all informal settlement areas were noted as being the most vulnerable to increased flooding hazards.
The climate change issues identified in the 2005 SoER were:
1. Loss of coastal land 2. Loss of biodiversity due to climate change 3. International commitments 4. Financial opportunity 5. Legal compliance
Owing to the fact that much new knowledge has been generated on climate change and the issues it presents at the local level, this list of issues is suggested to be updated for 2014 as follows:
1. Increasing risk and vulnerability of people, settlements and infrastructure as a result of climate change effects in the BCMM
2. Lack of detailed information about the likely change in climate and risk that will occur in the BCMMA as a result of global climate change, resulting in inappropriate or inadequate responses.
3. Loss of biodiversity due to climate change 4. National commitments to reducing greenhouse gas emissions trajectory 5. Opportunities to generate jobs from green economy projects that contribute towards climate
protection
7.3.1 Pressures
The excessive global consumption of fossil fuels such as coal and oil based products (petrol) and depletion of forested areas is resulting in an accumulation of carbon dioxide and other greenhouse gases in the world’s atmosphere. The main activities in the BCMMA that contribute to global climate change include:
• Combustion of fossil fuels. • Consumption of coal generated electricity. • Release of methane from landfills.
Global climate change is a phenomenon (or driving force) that is taking place with or without the contribution of greenhouse gases from the BCMMA into the atmosphere. So, while the BCMM has a responsibility in terms of national directives to curb such emissions, it is equally important that the municipality focus on implementing locally appropriate responses to climate change risks that will assist in increasing its resilience to these risks.
Pressure (causes) – of climate impact and response locally
Failure to build a resilient city through planning decisions that are cognisant of climate change risks, resulting in increasingly vulnerable settlements and infrastructure, and rising costs. National directives that stipulate reduction in greenhouse gas emissions.

46
7.3.2 State
Indicators State (2005) State (2014) Number of electrified homes Not known N/A suggest this indicator should be
replaced with a GHG emissions inventory indicator that tracks the municipality’s contribution to climate change (see below)
Consumption of coal generated electricity Not known N/A suggest this indicator should be replaced with a GHG emissions inventory indicator that tracks the municipality’s contribution to climate change (see below)
Consumption of fossil fuels Not known N/A suggest this indicator should be replaced with a GHG emissions inventory indicator that tracks the municipality’s contribution to climate change (see below)
Appointment of climate change officer None None Identification of climate mitigation projects None Priority projects identified. Development of a climate mitigation and adaptation programme
None ELIDZ Green Economy Strategy; Biodigesters East London Zoo, composting projects implemented.
Preparation of a Climate Change Strategy - Sustainable Energy and Climate Change Mitigation Strategy completed in 2008 – Climate Change Strategy in 2014. Implementation is yet to begin.
Preparation and regular updating of a Greenhouse Gas Inventory
- Not completed to date
Number of people affected by flood related disasters in the BCMMA per annum
- No data
Municipal expenditure on coastal erosion / damage from storm surges and flooding per annum
- No data
Municipal expenditure on climate adaptation projects, including in the agricultural sector
- No data
IDP, SDF, SDP’s and LUMS incorporate climate resilience measures as specified in the Climate Change Strategy.
- Not completed to date
Trend in incidences of heat stress, waterborne disease, malaria
- No data
Trend in annual rainfall, number of flood events, average ambient temperatures, and daily temperature extremes.
- No data
Number of jobs created for the implementation of green economy projects that contribute towards climate protection
- No data

47
7.3.3 Impacts
The impacts of climate change on the BCMMs residents and municipal administration are uncertain, although data suggests that temperatures are rising and that climatic and weather conditions are changing. The impacts that are predicted to occur include:
• Sea level rise and increasing coastal erosion due to storm surges. • Increased temperatures cause change in ecosystems, extinctions of local biota and spread of alien
invasive species. • Increased temperatures cause human health impacts and spread of diseases that favour higher
temperatures. • Changing patterns of rainfall causes more severe flooding and droughts and impacts on local water
security. • Changing climate, impacting on local food security as traditional crop yields may decline.
7.3.3 Response
The BCMM has prepared a Sustainable Energy and Climate Change Mitigation Strategy that addresses climate protection insofar as mitigating greenhouse gas emissions is concerned. Climate adaptation response is a key gap in this strategy / plan. A Climate Change Strategy, that presumably addresses this gap, is currently in the course of preparation by the BCMM.
While climate change is an environmental threat, it also poses opportunities to attract and host climate mitigation projects. Such projects could result in energy efficient technological transfers to BCMM (which could result in energy cost savings and increased energy security for the BCMM).
The BCMM is only just embarking on its climate response process, and as such there is much still to be done in terms of this process towards building a more climate resilient city.
7.4 Freshwater Resources
7.4.1 Quality of Freshwater Ecosystems and Resources
The quality of surface water in the main BCMM catchments has been impacted by salinisation and industrial and domestic effluent contamination, with this being particularly prevalent in the Buffalo and Nahoon River catchments. Apart from the negative environmental impacts associated with poor water quality, this can result in higher water treatment costs related to eutrophication.
Poor water quality conditions of water resources in BCMM are the result of various contributing factors, such as:
• Poor sanitation in rural, informal and low income settlements. • Polluted storm water run-off • Industrial discharges • Dumping into rivers and streams • Proximity to waste sites • Discharges from sewage treatment facilities
According to the South African National Biodiversity Institute (SANBI), few of the major rivers running through the BCMMA are in an unmodified or natural condition, most are categorized either as “moderately

48
modified”, or “largely modified”. Similarly, the majority of the wetlands in the municipal area are classified as “heavily to critically modified”.
Figure 29: River and Wetland Condition in the BCMMA (from the National Freshwater Ecosystem Priority Areas, SANBI).
The Buffalo River, which is the largest river in the municipal area, is 126km long. From its source in the Amatole Mountains it flows eastwards across the coastal plateau before entering the Indian Ocean at East London Harbour. The catchment area spans 1287 km2, contains the Maden, Rooikrantz, Laing and Bridle Drift Dams, providing freshwater to hundreds of thousands of people in King William's Town, Zwelitsha, Mdantsane and East London. The river is also under high development pressure with run-off from dense urban, peri-urban and rural settlements impacting the middle and lower reaches (River Health Programme, 2004).
A key source of pollution that has been identified is sewage overflow from poorly functioning and overloaded wastewater treatment works (River Health Programme, 2004). River health is also affected by naturally high salinity levels derived from the catchment geology. In addition, river health is affected by the dams built along its course, which disrupt ecological functioning since they restrict fish movements and have no mechanism to release water in a pattern which simulates natural river flow. The dams do however offer some ecological benefit, Laing Dam has been noted to be an efficient silt trap and sink for nutrients, at the same time diluting saline effluent from upstream sources (River Health Programme, 2004).
Pollution of the Buffalo River has further reaching implications, affecting both coastal and marine water quality. Non-compliance with SA water quality guidelines for mariculture and bathing water quality standards has been reported in the adjacent coastal zone. Pollution is a major threat as it could render coastal waters unfit for recreational use which will in turn affect tourism (River Health Programme, 2004).

49
The major tributaries of the Buffalo River are the Mgqakwebe, Ngqokweni and Yellowwoods Rivers, and all three join the mainstream above Laing Dam. A large portion of the potential yield in the upper reaches of the Buffalo River is used for forestry and the environment.
The Nahoon and Gqunube rivers also flow through the industrial/urban centre of East London, having originated in the Amatole Mountains themselves. Nahoon Dam regulates the Nahoon River. The Gqunube River is not regulated and much of the potential yield of the river is unused.
The Da Gama Textile factory in Zwelitsha has holding dams where industrial effluent (dyes) are stored. Data on the quality of surrounding water resources is unknown, however, they are likely to be significant. On one occasion, the holding dams over-flowed during periods of intense rain resulting in significant pollution of the Buffalo River and widespread death of fish (River Health Programme, 2004).
The Buffalo and Nahoon Rivers are affected by a variety of point and non-point sources of pollution, including bacterial contamination, eutrophication and elevated salinities (WRC 1981, 1993 and others, cited in DWAF, 1999). The sewers of Mdantsane overflow directly into Bridle Drift Dam, which has experienced a number of algal blooms of toxic nature.
In the Amatole catchments, eutrophication poses a major problem. The excessively high levels of runoff in the region result in significant nutrient enrichment of the water bodies. In a report for the Department of Water Affairs and Forestry, Institute for Water Quality Studies, found that both Bridle and Laing Dams, on the Buffalo River, varied between eutrophic and hypertrophic conditions. In both dams, the report indicated that there was a chance of toxic cyanobacterial blooms developing. Rooikrantz Dam, on the Buffalo River, had lower concentrations of phosphorous, however, and could be classified as mesotrophic. The Yellowwoods River had very high levels of phosphorous, exhibiting hypertrophic conditions.
In addition to the Buffalo River, a number of other rivers and streams in BCM are also known to show poor water quality levels, particularly in the East London area (BCM Scientific Services data 2004).
The State of the Buffalo River Report was completed in 2004 (River Health Programme, 2004), where the following water quality issues were noted
• Forestry activities may be releasing herbicides and pesticides into the river. • Sewage discharges and overflowing sewerage systems that cannot cope with the load have a severe
impact on the water quality of the river. • Poorly functioning sanitation infrastructure results in unacceptably high chemical oxygen demand,
faecal coliform counts, nutrients and algal blooms (nutrients are mainly phosphorus and nitrogen compounds.)
• Algal blooms are a serious problem in Laing Dam as they prevent light penetration through the water, thereby preventing natural reduction of iron and manganese and causing treatment problems for the Amatola Water Board.
• The textile industry present in this section of the river contributes to the high salt concentrations in the Mlakalaka Stream, which enters the Buffalo River above Laing Dam.
In terms of aquatic biota, there is a considerable amount of biological information available on the Buffalo, Nahoon and Gonubie Rivers. From a preliminary survey of fish data at the Albany Museum, the following river catchments have been identified as sensitive, based on the distribution patterns of the endangered Eastern Cape Rocky, Sandelia bainsii:
- Buffalo River: the Yellowwoods and upper catchment in the Amatole mountains is a very important habitat area for the Eastern Cape Rocky, as well as the threatened Border barb, Barbus trevelyani.

50
- The Igoda and Gxulu rivers are very important areas for the conservation of the Eastern Cape Rocky.
- The upper catchment of the Nahoon River. The main freshwater quality issues identified in the 2005 SoER included:
1. Contaminated rivers and streams throughout BCM, but especially the Buffalo River 2. The Buffalo River is under high pollution pressure 3. Loss of biodiversity (e.g. Threatened East Cape Rocky) 4. Health and environmental risks associated with poor water quality 5. Eutrophication of water impoundments 6. Quality of ground water (little if any data is available on groundwater quality) 7. Potential loss of recreational use of fresh water resources due to poor water quality 8. Heavy metal or other pathogen content of sewage effluent is not determined 9. Heavy metal, other hazardous pathogens or pesticides content of rivers and streams is not
determined 10. Legal compliance
The revised list of freshwater quality issues for 2014 is as follows:
1. Pollution of rivers and streams as a result of non-point source pollution from settlement areas 2. Pollution of rivers from overflowing sewerage and wastewater treatment works 3. Loss of aquatic biodiversity (e.g. Threatened East Cape Rocky) 4. Health and environmental risks associated with poor water quality 5. Eutrophication of water impoundments 6. Potential loss of recreational use of fresh water resources due to poor water quality 7. Threats to groundwater quality in coastal villages as a result of sea level rise and coastal
flooding (climate change risk)
7.4.1.1 Pressures
The main pressures relevant to freshwater quality in BCM include:
Pressure (causes) Increased urbanization in river catchments Industrial development Inadequate, overloaded or defective sewage treatment infrastructure Stormwater disposal into municipal sewerage results in overflows Inappropriate or inadequate storm water management Inadequate sanitation and leaching of human waste from informal settlements into water catchment areas. Leaching of pollutants from landfills Increased sediment load and increased nutrient levels due to erosion from over-grazing, poor agricultural practices and vegetation clearing Cemeteries located close to water resources Lack of awareness Limited parameters monitored by Scientific Services due to limited capacity and monitoring programme Need to be compliant with the National Water Act and permit conditions

51
7.4.1.2 State
Indicator State (2005) State (2014) Water Quality – Surface Water % exceedance of DWAF Guidelines for selected surface water quality variables (total nitrogen, total phosphorus, conductivity, faecal coliforms)
Reports suggest that quality is poor. Data available from Scientific Services.
Reports suggest that quality is poor. However, monitoring is limited to certain rivers only.
Water Quality – Ground Water % exceedance of DWAF Guidelines for selected ground water quality variables (total nitrogen, total phosphorus, conductivity, faecal coliforms)
No data, but reports suggest that the quality is poor.
No data.
WWTW spill incidents
Records of spillage incidents are not currently recorded
No data
Discharges from industry
Not known, but monitoring and reporting conducted by Scientific Services Pollution Control
No data
Industry incidents
Not known, but reports maintained by Scientific Services Pollution Control
No data
Quality of effluent discharges from WWTW
Discharges frequently do not meet permit requirements. Data available from Scientific Services
Microbiological quality standards are frequently not met at the majority of the municipality’s WWTW, the municipality did however achieve the highest green drop score in Eastern Cape in 2010/11.
Environmental monitoring
Not known, but Scientific Services provide analyses of 20 streams and rivers in BCM
Monitoring of WWTW effluent takes place but not of rivers generally. Existing monitoring programme inadequate- to include river health monitoring, recreational quality monitoring going forward and groundwater quality monitoring where relevant
Increased capacity in trade effluent monitoring capacity
Existing trade effluent monitoring capacity is inadequate
Existing trade effluent monitoring capacity is inadequate
7.4.1.3 Impacts
On a weekly basis the BCM Scientific Services Laboratory monitors the bacterial content of 20 streams and rivers in BCMM. Parameters measured include heterotrophic plate count, total coliforms and E.coli. Unsatisfactory E.coli levels are regularly recorded in many of the streams and rivers in the East London area.

52
There is limited (if any) data on the quality of ground water in BCMM. The WSDP provides little information on the quality of BCM groundwater resources except that this water resource reflects high salinity levels.
7.4.1.4 Response
BCMM has recognized the need to address water quality issues in some of the major catchments in the municipal area – particularly those that supply freshwater resources such as the Nahoon and Buffalo Rivers.
It has been reported that the municipality intends to close three of the smaller wastewater treatment works in King Williams Town and establish one larger regional works in Zwelitsha. This would be a measure to address water quality concerns in the Buffalo River.
Further responses are required for the monitoring of water quality and freshwater ecosystem parameters such as river health, on a number of the municipality’s rivers. Groundwater quality monitoring is also a key response gap.
7.4.2 Freshwater Resource Quantities and Environmental Water
The demand for freshwater in BCMM is growing due to urbanisation and increased industrial, commercial and residential usage. The primary driver of increased demand is in the residential sector, with industrial demand a secondary driver. The main supplies of freshwater in BCMM are sourced from the various dams located on the Buffalo and Nahoon Rivers forming part of the Amatole Water Supply System (AWSS), which services some 81% of the municipal population (BCMM, 2012). Other freshwater resources are abstracted from the Keiskamma System, which services 14% of the municipal population via the Sandile and Peddie Regional Water Supply Schemes. The remaining municipal population is serviced by groundwater resources.
While the supply of freshwater from surface water resources forming part of the Amatole Water Supply System (AWSS) is relatively secure owing to the fact that water is sourced from a range of catchments and inter-basin transfer schemes are in place, the coastal villages and other settlements that are dependent on groundwater supplies are highly vulnerable as they often do not have alternatives should the aquifers become overdrawn or groundwater quality decline.
On the Buffalo River, major abstractions of water occur in the middle reaches between Rooikrantz and Bridle Drift Dams, while in the lower reaches, near East London, most of the potential yield is unused (DWAF, 1999). Apart from East London, King Williams Town and other settlements near the rivers, the main water users on the Buffalo River catchment are industries, including Da Gama Textiles, Dunlop Flooring, Mercedes Benz of SA, Sanachem and many more. In particular, Da Gama Textiles has had a widespread impact on the Buffalo River via the discharge and overflow of effluent from a holding dam into the Malakalaka Spruit, which flows directly into the Buffalo River.
According the Amatole Water Supply System Reconciliation Strategy Status Report (2012) which includes BCMM, based on the high growth water demand scenario, measures to reduce demand or increase the system yield would have to be implemented by:
2018- if dams are operated individually (94.9 million m3 per annum)
2021- if dams are operated in terms of the current AWSS Operating Rules (100.1 million m3 per annum)
2026- if all measures are applied to achieve maximum yield from the system (108.1 million m3 per annum)

53
Based on the low growth water requirement scenario, the System has adequate yield to meet the requirements indefinitely.
The water demand projections for the AWSS were to be reviewed in 2013 following the release of the 2011 Census results.
According to the WSDP, the groundwater potential in BCM is generally not good, resulting in low borehole yields (generally below 2 l/s) and high salinity waters. The north-western portion of the region has the greater groundwater potential (i.e. Peelton villages), with the potential reducing in a south-easterly direction towards the coast.
The Environmental Classifications and associated environmental water requirements (EWR’s) have been determined for all rivers in the AWSS except for the reach of the Buffalo River downstream of Bridledrift Dam. The impact of implementing the EWR’s on the yield from the AWSS could a reduction of as much as 25 million m3 per annum (or 25% of the system yield). Therefore they are not implemented at this point in time, but are considered as a scenario in the reconciliation planning. In effect, a new large dam would be required to provide the required water for consumption if the EWRs were to be met, and as such the potential for relaxation of the EWR’s is being considered by the Department of Water Affairs (DWA, 2012).
The fact that EWRs are not being met in these river catchments is an indication that the freshwater ecosystems are likely to have been significantly impacted. Similarly, non-compliance with the EWR’s also points to the fact that dilution of pollution inputs into these systems is likely to have been compromised as base flows have been reduced.
The issues identified in the 2005 SoER were:
1. Depletion of BCM water resources 2. Water wastage 3. Increased abstraction of water 4. Possible dam construction 5. Legal compliance
The updated 2014 list of issues is as follows:
1. High rates of abstractive use resulting in decline in base flows and natural flooding regimes resulting in negative impacts on freshwater ecosystem functioning, dilution and assimilation of pollutants
2. Alien plant invasions in catchments, resulting in streamflow reductions 3. Siltation of dams and loss of storage capacity 4. Construction of new dams to augment storage capacity and associated freshwater ecosystem
impacts 5. High rates of water loss in treatment and distribution systems 6. Lack of awareness and incentives for adoption of water use efficiency 7. Poor water quality affecting treatment costs and safety of use of freshwater resources for
consumption 8. Opportunities for re-use of water, water demand management and streamflow enhancement to
augment supplies 9. Risks to settlements dependent on local groundwater supplies with no alternatives

54
7.4.2.1 Pressures
The main environmental issues and pressures relevant to freshwater demand in BCMM include:
Pressure (causes) Increased urbanization and industrialization Free basic water – indigent policy Water infrastructure that does not address water use efficiency (e.g. standpipes) Aging infrastructure (water losses) Illegal water connections Lack of funds to implement water demand management and conservation Lack of awareness or stakeholder buy-in to water conservation and re-use Need to be compliant with the National Water Act and ecological flow requirements
Sea level rise, coastal flooding and possible salinization of groundwater resources in vulnerable localities
7.4.2.2 State
Indicator State (2005) State (2014)
Annual water consumption
Engineering Services have indicated that water consumption data is not very reliable.
Raw Water Purchases: 3,489Mm3/a; Potable water purchases: 27,057Mm3/a; DaGama Textiles – 1,316Mm3/a
Unaccounted for water losses
Engineering Services have indicated that water losses data is not very reliable.
39.4%
% annual water requirement in the BCMM supplied through water recycling processes
Limited recycling or re-use. No specific data
Being investigated to augment potable supplies.
Cost to supply 1 kilolitre of water for potable use
Data computation required – anticipate trend will increase over time with storage infrastructure costs and treatment costs due to declining water quality
Water conservation awareness programmes
Limited Limited
Water demand management programme
Limited Strategy developed and adopted in 2012
Environmental Water Requirements are met
- Not met
Dam siltation rates - Not currently recorded
Water losses per annum estimated from alien plant
- Not currently available

55
coverage in water supply catchments
Number of households using groundwater as primary water supply source
- Approximately 6,800 households in the BCMMA
7.4.2.3 Impacts
Direct impacts of the increasing demand for water are reflected by the existing dams on the Buffalo and Nahoon rivers which are limiting river flows and sediment build up in river mouths. The ongoing decline of freshwater ecosystem functionality can be anticipated if environmental water requirements are not met, with associated decline in ecosystem services such as pollutant and nutrient assimilation and dilution.
Future impacts will be associated with the cost of construction of new water storage facilities, and the associated ecosystem impacts on the receiving environment.
7.4.2.4 Response
BCMM has a strategy to achieve an estimated savings of 6.2 million m3 per annum. The strategy focuses on:
• Reducing non-revenue water (reported as 39.6%) • Increasing billed metered consumption • Reducing raw water treatment losses • Mains replacement (AC pipes) • Enhancing the institutional capacity to implement water conservation / water demand
management measures on a sustainable basis • Promoting water use efficiency
BCMM has prepared a Water Re-use Strategy that directs investigations into potential treated effluent re-use opportunities from the upgraded Reeston regional wastewater treatment works (DWA, 2012). Proposals are to upgrade this facility to a 36 megalitre per day facility, with potential to recover pre-treated effluent and direct it to the Umzonyana water treatment plant.
The Department of Environmental Affairs Working for Water Programme is active in the Kubusi catchment and in the catchment of the Rooikrantz Dam. This is important work in increasing streamflows.
7.5 Coastal Zone
The Buffalo City Metropolitan Municipality has a coastline of some 82km. The majority of this coastline falls within the Coastal Nature Reserve. For the most part, the municipal area is home to a highly functional coastal zone, although the municipality reports ongoing pressure for development in this area. Coastal amenities are managed by the municipality’s Coastal Zone Management Unit.
There are 22 estuaries in the municipal area, only one of which has any form of protection status, or an Estuary Management Plan.
Coastal erosion and flooding has been noted as an issue. In 2009 a major storm surge event caused significant damage to both municipal and private infrastructure in the coastal zone, some of which is still being repaired.

56
7.5.1 Issues and Pressures
The following table provides a summary of the most significant issues and pressures identified in the 2005 SoER, and updated in the 2014 SoER:
THEME A: GOVERNANCE AND CAPACITY BUILDING ISSUE 1: CAPACITY, COORDINATION & ACCOUNTABILITY General coastal pressures Lack of clarity and coordination between government departments & spheres on roles and responsibilities Estuarine pressures Inappropriate delegation of responsibilities without sufficient capacity and financial support Lack of accountability during decision making process Poor public awareness of existing regulations and laws Terrestrial pressures Capacity constraints for controlling and regulating development within coastal zone THEME B: OUR NATIONAL ASSET ISSUE 2: PUBLIC ACCESS, AMENTIES AND AWARENESS General coastal pressure General lack of public awareness of rules, regulations & legislation THEME C: COASTAL PLANNING AND DEVELOPMENT ISSUE 3: COASTAL SHORELINE DEVELOPMENT Marine pressures Increased development pressure (industrial, residential, tourism) leading to increased discharges of storm and waste water, cumulative impacts etc. Estuarine pressures Development pressure along estuary banks & within flood lines Sale of inappropriately zoned land to developers prior to rezoning applications Terrestrial pressures Increase in rezoning / subdivision applications for resort development Sale of inappropriately zoned land to developers prior to rezoning applications Change in resort /residential zoning status (unplanned) Encroaching onto public open space Provision of infrastructure (power, water etc.) THEME D: NATURAL RESOURCE MANAGEMENT ISSUE 4: HABITAT DEGRADATION Poor compliance and enforcement of legislation e.g. SSA Inappropriate/illegal developments within riparian zone and clearing riparian vegetation Sand mining in the coastal zone ISSUE 5: SPECIES DIVERSITY Terrestrial pressures Alien invasive species Hunting and snaring ISSUE 6: RESOURCE UTLISATION Marine pressures Illegal use of marine resources & over harvesting THEME E: POLLUTION CONTROL & WASTE MANAGEMENT ISSUE 7: POLLUTION & SANITATION Marine Increases in land based pollution and seepage, mainly from soak-aways and sewerage treatment works – WWTW’s

57
Marine outfalls - quality and quantity Non-point pollution sources of pollution affecting rivers and marine environments Historical lack of forward planning for WWTW’s resulting in over utilisation and inappropriate locations Estuarine Inadequate refuse disposal facilities and illegal dumping of refuse Lack of compliance & enforcement of legislation Terrestrial Illegal dumping of refuse
7.5.2 State
2005 Indicator Name Description State (2014) General Coastal Indicators
Alien invasive organisms Reports on the number of marine, estuarine and terrestrial alien invasive organisms present within the BCM area.
No data
Vulnerable and endangered coastal species
Reports on the population trends of IUCN Red Listed species
No data
Key coastal environments protected
Reports on the location and size of formally protected areas and the percentage of BCM coastline protected
Two Marine Protected Areas (MPAs. Data on protected areas available. 60km of the 82km length of coast contained within the municipal area (some 72%) is formally protected.
Tourism permits issued Reports on the number of coast dependent tourism operators in the BCM with tourism permits
No data
Land tenure Reports on areas of land owned by State, private & communities
No data
Access to coastal resources Reports on the number, location and type of access points to the coast
No data
Seasonal influx from tourism Reports on change in the population size of coastal settlements over peak holiday periods.
No data
Coastal heritage sites Reports on the number of existing known heritage sites which are formally protected
1 heritage site formally protected
Consideration of strategic, long term and cumulative impacts
Reports on the area of coast covered by SEA’s & ICZM
Being addressed in ICMP review 2014
Indicators of the Marine Environment Exploitation of intertidal resources
Reports on the exploitation levels of selected marine species
No data
Marine Protected areas Reports on the locality, size & status of MPAs
Locality information available, status not available
Pollutant loading entering the marine environment
Reports on the location, volumes and quality of land based pollution sources into the marine waters
No data
Concentration of heavy metals in sediments/biological tissue
Reports on the heavy metal concentrations in marine sediments within the BCM – Port of East London
No data
E. coli concentration in marine Reports on the water quality of popular No data

58
waters at recreational beaches beaches which will be compared to DWAF guidelines
Litter and debris collected per year
Reports on the quantity of l itter & debris collected per year from the beaches
No data
Ship Traffic Reports on the number, type & frequency of ships entering the East London Port per year
No data, possibly available from Ports Authority
Indicators of the Estuarine Environment Estuarine Health Index Reports on the status of estuaries within
the BCM as per Estuaries SOER No data
Estuarine reserves/Protection of important estuaries
Reports on the number of estuaries awarded protection within BCM
Nahoon Estuary is partially protected
Estuarine land use Reports on the level of development and impact along estuaries
No data
Effluent discharges into estuaries and water quality monitoring
Reports on the locality, volume and quality of discharges into the estuarine environment
No data
Change in fresh water flow into coastal environment
Reports on the MAR entering the marine environment
No data
Number artificial breaching of estuary mouths
Reports on the number of estuaries artificially breached and the frequency of breaching per year
No data
Estuarine monitoring Reports on the number of water quality monitoring programmes on estuaries.
Nahoon biomonitoring programme
Indicators of the terrestrial environment Coastal conservation areas Land use and change Reports on the different categories of land
use within the BCM No data
Blue flag beaches Reports on the number of beaches achieving Blue Flag Status each year
No data – none qualifying for 2014
Coastal mining operations Reports on the number of legal & il legal sand mining operations currently in use
No data
Institutional Representation on PCC & local coastal forums
Reports on the participation of managers from different organisations in regular coastal meetings
No data
Number of local forums established
Reports on the number of local forums and frequencies of meetings held on a local level.
No data
7.5.3 Response
The BCMM has responded to coastal issues and pressures through the preparation of a coastal zone management plan (2005). This plan is being updated in 2014. A Coastal Zone Management unit was also established, which performs the amenities management function in the coastal zone. Further responses are required to address monitoring and evaluation of coastal resources, assessment of coastal risks, management of coastal risks through appropriate planning policies and development controls. Better alignment between local and provincial coastal management agencies is required to ensure that BCMM is able to better understand coastal resource use pressures and issues.

59
7.6 Agricultural Land Uses
As the demand for housing increases, more and more areas of agricultural potential (such as dairy farming) are being threatened. Coastal areas offer better agricultural potential due to higher coastal rainfall while areas adjacent to estuaries and rivers often have alluvial deposits where agricultural potential is also higher.
A significant area of BCM comprises arable and commonage land. Right of access to the land can be achieved through a number of mechanisms, including: Freehold Title, Quitrent Tenure, Communal Tenure, Permission to Occupy or through a Tribal Trust. Much of the land is commonage land is controlled by BCMM. However, field observations indicate that there are large areas of commonage that are in a poor state due to overstocking and other inappropriate land use activities.
It is important to retain local areas of high agricultural potential in BCMM as this sector has historically been an important source of employment for many rural people. In addition, these agricultural resources can continue to be an important economic sector particularly for emerging farmers and other Local Economic Development initiatives, as well as contribute towards local food security priorities in the face of climate change.
An interesting trend in the BCMM and elsewhere in South Africa has been the conversion of extensive cattle farming operations to game farming. The thicket vegetation prevalent in much of the BCMM is highly suited to game farming / hunting facilities. This conversion is not necessarily good for agricultural outputs, but may have positive economic development impacts, as well as conservation gains.
The issues identified in the 2005 SoER include:
1. Loss of land with high agricultural potential 2. Loss of land with high agricultural potential can place future pressure on areas of conservation
importance 3. Legal compliance
Additional issues added in 2014 include:
4. Poor management practices in agriculture that affect yields and create negative environmental externalities
5. Promotion of small scale and subsistence agriculture to maximise food security
7.6.1 Pressures
Pressure (causes) Urbanization Coastal developments Poor management of commonages Poor agricultural practices resulting in environmental pollution, soil erosion and siltation of watercourses/dams Climate change Agricultural markets, resulting in pressure to transform agricultural lands to other productive uses Comply with Agricultural Resources Act

60
7.6.2 State
Indicator State (2005) State (2014) Percentage area (Ha) of high agricultural potential
The SDF has identified areas of high Prime and Unique Agricultural Potential, although the exact extent is not known
The Land Capability Map for the area shows limited coverage of arable areas. The extent of these areas that has been transformed or settled is not currently available.
Coverage of agricultural land uses - Cultivation – 14.8% of BCMMA Plantations – 4.4% of BCMMA
Number of sustainable community gardening / food security projects
- No data
Percentage contribution of the agricultural sector to the municipal GVA over time
- 2011 – 1%
Coverage of game farms in the municipal area
- No data
Commonage management programme in place
- No
7.6.3 Impacts The impacts of urbanization and sprawl on the extent of high potential agricultural land is not known. However, it is anecdotally well accepted that pressure for development is threatening the extent of agricultural land, particularly close to urban areas.
The impact of declining agricultural land uses and outputs will result in decreasing sovereignty in regards to food production. The dependency on other areas for food production and need to import food will have a local poverty impact, as the cost of imported foodstuffs is likely to be higher than locally grown produce.
Poor agricultural practices, including overgrazing and uncontrolled burning of commonage lands, have a significant number and range of impacts on the receiving environment, including pollution and siltation of watercourses. The loss of agricultural productivity due to poor management is also an impact.
7.6.4 Response Agricultural considerations have been taken into account in the BCMM Urban Edge Study, and has a functional urban agriculture programme to promote food gardening. Organic farming has been promoted through this programme.
7.7 Biodiversity and Ecosystems
The BCMMA has a rich floral biodiversity, particularly with respect to the thicket vegetation of the south-eastern Cape which is one of the eight distinct biomes seen in South Africa, and is internationally recognised as a unique and important vegetation type.
In terms of plants and many kinds of animals, the thicket vegetation of the south-eastern Cape has been acclaimed as unique and deserving of urgent conservation attention, especially because of its plant diversity, including many succulents and bulbs. Since much of the Thicket Biome falls within BCMM area, the municipality has a particularly important role to play in its conservation.

61
In additional issue of concern in BCMM is the conservation of the Albany Centre of Endemism which centres on the former Albany magisterial district of the Eastern Cape and stretches to East London in the East and Humansdorp in the west as well as inland to include the mountainous areas.
Much of the BCM natural environment in its present state can be measured in terms of its biodiversity, floristics and ecosystem richness and the general state of its biomes. In terms of the recently completed National Botanical Institute’s (NBI) vegetation distributions, BCM is represented by 10 different vegetation types (see Figure 21: Coverage of Vegetation Types in the BCMMA).
Bioregional Conservation Plan, including the STEP and ECBCP, have identified important biodiversity areas in the BCMM that should be protected from development, and actively managed for biodiversity conservation and ecosystem services generation.
The 2005 SoER identified the following issues:
1. Loss of thicket vegetation 2. Loss of biodiversity 3. Habitat change 4. Loss of Metropolitan Open Space 5. Loss of urban green areas and sensitive environments 6. Legal compliance
This list of issues is updated in the 2015 SoER to include:
1. Loss of biodiversity and habitats due to climate change 2. Uncontrolled harvesting of natural resources 3. Transformation of natural habitats for development 4. Decline in ecosystem services supply 5. Negative impacts on ecosystem functioning from urban and industrial pollution and stormwater
outputs 6. Lack of information on biodiversity assets to inform spatial planning and development decision-
making 7. Loss of biodiversity and habitats due to the spread of invasive alien plants 8. Lack of fire management
7.7.1 Pressures
The main pressures threatening floral biodiversity in BCMM include:
Pressure (causes) The spread of invasive alien species and displacement of indigenous species. Invasive species are widespread throughout BCM:
Black wattle – Acacia mearnsii Castor Oil Plant – Ricinus communis Lantana – Lantana camara Balloon Vine
Urbanization and development Low income housing developments Agriculture and forestry Hydroponic tunnels are becoming wide spread in the eastern parts of BCMM, often resulting in clearing of

62
large areas of land Encroachment into Public Open Space Removal of trees for fire fuel Illegal dumping Illegal and legal stone and sand mining Overgrazing Land use change Collection of medicinal plants Failure to rehabilitate disturbed areas
7.7.2 State
Indicator State (2005) State (2014) Protected Areas (PA) Area (Ha) of municipal area under local protected area status
Three nature reserves to be proclaimed:
- Potter’s Pass - Nahoon Point - Nahoon Estuary
Exact extent not known
5317 ha (2.1%) of the municipal area is protected in local and provincial nature reserves
% municipal area under local protected area status
Not known 5317 ha (2.1%) of the municipal area is protected in local and provincial nature reserves
% of land of conservation importance in the municipal area under local protected area status
Not known No data
% of local protected areas with current/adopted management plan and associated budget
Not known No data
Level of user satisfaction with access to and quality of local protected areas
Not known No data
Invasive alien species (IAS) Area (Ha) of municipal land currently invaded by alien species % of municipal land currently invaded by alien species
Invasive alien species are wide spread throughout BCM, however, there is no data on the exact extent of the infestation.
No data
Area (ha) of invasive species cleared from municipal land % of area of municipal land invaded by alien species, which has been cleared
Not known No data
Is there a current adopted Invasive Species Monitoring Control and Eradication Plan that is integrated and aligned with the IDP?
Not yet initiated No
Species and Ecosystem Management & Change (SEMC)
Threatened and extinct species per taxonomic group
Not known No data
Endemic species per taxonomic group Not known No data Population trends of selected species Not known No data

63
Area (Ha) of sensitive, vulnerable, highly dynamic and stressed ecosystems in the planning area – by ecosystem type (e.g. wetland, dunes, etc.)
Not known No data
% of each of the above which is degraded or transformed on an annual basis
Not known No data
Planning and management MOS is continually updated and responds to climate change pressures and risks
- No
MOS is incorporated into the SDF, SDP’s and LUMS
- SDF only, although there are discrepancies in the MOS data
MOS management framework is established
- No
7.7.3 Impacts
There is no quantified data on the extent of the impacts on thicket and other indigenous vegetation types in BCMM. However, visual observations suggest that there are areas that are under threat, particularly from agriculture, urbanization, coastal development and poor land use practices such as overgrazing.
The impact of the loss of ecosystems and habitats will relate to the loss of the ecosystem services generated by these areas. These ecosystem services are currently provided for free, and the loss thereof will generate costs of the residents of the municipal area, and for the municipal administration.
7.7.4 Response
There are a number of initiatives aimed at conservation of thicket and other indigenous vegetation types.
- Development of a Metropolitan Open Space System - WESSA project to develop a detailed map of vegetation distributions in BCMM - Existing nature reserves and conservation areas - Establishment of nature reserves at Nahoon Point and Estuary - Environmental guidelines included in Spatial Development Framework - Establishment of the Integrated Environmental Management and Sustainability Unit
7.7 Energy
Energy is an environmental issue insofar as:
- The use of grid energy is associated with greenhouse gas emissions, given that South Africa’s electricity supply is primarily generated from the burning of coal, which is associated with high releases of greenhouse gases;
- The use of certain energy carriers, e.g. firewood, may result in damage to the natural environment from which these forms of energy are harvested;
- Certain forms of energy pose a greater fire and / or human health risk than others.
Some 81% of households in the BCMMA have access to grid electricity. Those that do have access to electricity, use this primarily for lighting and cooking, and to a lesser extent heating. Paraffin, which is associated with a high fire risk and human health impacts (due to the emissions from this energy carrier when burnt) is extensively used to supplement energy needs – with over 30% of municipal households

64
reporting using paraffin for heating, 18.5% for cooking, and 17% for lighting. Wood is used in less than 5% of households for cooking and heating.
In addition to this, the development of renewable energy projects, such as wind and solar generation, is an increasingly important topic in South Africa. With the implementation of the National Department of Energy’s Renewable Energy Independent Power Producer Programme (REIPPP), a number of such projects are being implemented throughout South Africa. At this stage, no REIPPP projects have been approved for the BCMMA.
The issues associated with energy in the BCMMA include:
1. Energy poverty 2. High use of paraffin (unsafe fuel source) 3. Opportunity to support poor households with improving energy security through using solar power 4. Opportunity to develop energy generation programmes from biomass (waste) and improve
municipal energy security 5. Uncontrolled harvesting of firewood with associated ecosystem impacts 6. Rollout of solar water heaters 7. Municipal energy demand management
7.7.1 Pressures
Pressure (cause)
Increasing cost of electricity resulting in increasing energy poverty and use of unsafe fuel sources, and increasing costs to run municipal infrastructure Housing rollout – opportunity to install Solar Home Systems and solar water heaters Houses with no electricity connections – use unsafe fuel sources Municipal wastewater treatment plants, garden refuse sites offer opportunities for biomass to energy
7.7.2 State
Indicator State (2005) State (2014) Energy usage in BCM
Households 2001 % 1996 %
Electricity
120,332 63%
75,111 47%
Gas
883 0%
1,232 1%
Paraffin
65,741 34%
79,143 50%
Candles
3,493 2%
3,683 2%
Solar
195 0%
- 0% Other (e.g. wood)
401 0%
13 0%
191,045 100%
159,182 100%
Energy Source (2011) Cooking Heating Lighting
Electricity 74.40% 41.10% 80.90%
Gas 3.80% 2.20% 0.40%
Paraffin 18.50% 33.70% 16.70%
Solar 0.20% 0.40% 0.20%
Candles 0% 0% 1.50%
Wood 2.50% 4.80% 0%
Coal 0.10% 0.60% 0%
Animal Dung 0.10% 0.10% 0%
Other 0.20% 0% 0%
None 0.20% 17% 0.2%
Electricity consumption by households
No data, but possibly available from the Electricity Department
No data

65
% of households with solar water heaters
- No data
% of households with solar home systems
- No data
% of households using paraffin
- 33.7%
% of households using firewood
- 4.8%
Municipal energy consumption (for infrastructure)
- No data
Municipal energy demand management programme implemented
- No data
7.7.3 Impacts The impacts of lack of access to grid electricity include energy poverty and increased health risk due to the use of unsafe fuel alternatives such as paraffin and coal.
The impacts of lack of action on energy demand management include increasing costs to the municipality and to ratepayers in the municipal area, due to the increasing costs of running municipal infrastructure with increasing electricity prices.
The impacts of the rollout of renewable forms of energy at the household scale, and at the municipal scale, include decreased energy poverty and increased energy security.
7.7.4 Response BCMM produced an Energy Strategy and Climate Mitigation Strategy in 2008. This Strategy highlighted a set of goals and objectives for the achievement of a more sustainable energy path going forward and addresses many of the issues highlighted here.
Implementation progress of this strategy is not currently clear.

66
7.8 Integrated Waste Management
According to the IDP, solid waste generated in BCM can be divided into two types, general and hazardous waste.
The Buffalo City Metropolitan Municipality owns and operates two licensed landfill sites: one at King Williams Town, and Round Hill at Berlin. Both landfill sites have limited capacity and the municipality has embarked on pilot waste separation and recycling schemes that aim to reduce waste requiring landfilling.
The BCMM also operates 3 garden refuse transfer stations: IDZ, Beacon Bay and Stoney Drift in Amalinda. The majority of municipal residents cannot access these sites and as a result end up dumping their garden waste illegally.
A number of sites for general and garden waste disposal have been formally closed since the late 1980’s, including Zwelitsha, Phakamisa, Ilitha, Beacon Bay, West Bank, Ducats, NU 12 in Mdantsane, Highgate and James Pearce Park. The following sites for hazardous waste have also been formally closed: Dimbaza, Berlin, James Pearce Park and Old Everite Site. However, the majority of the former landfill sites have not been closed in terms of the DWAF Minimum Requirements for Landfills, although there are plans to close Ducats, Second Creek and NU2 in Mdantsane in accordance with the DWAF Minimum Requirements. There is no monitoring of closed sites being undertaken, although there is some monitoring of Second Creek and Ducats as part of the closure process. Most of the existing and closed landfill sites are the cause of significant land and water pollution in BCM.
The BCMM also operates a dump site in Chiselhurst, which is not permitted. There are also other illegal dump sites located at various locations throughout the BCMMA, such as Kayser’s Beach.
Illegal dumping and littering is widespread throughout BCMMA. While this can probably be attributed in part to the lack of waste services and locations (stations) for depositing waste, lack of awareness and enforcement of illegal dumping regulations also contribute to the problem.
The accumulation of waste due to lack of services and littering especially in the previously disadvantaged areas is a serious problem and has effects on infrastructure i.e. the blockage of storm-water drains and sewers, resulting in effluent flow on the surface. Blocked sewers can lead to pollution and health risks.
The issues identified in the 2005 SoER include:
1. Pollution of land and water, and health risks associated with poor waste management practices 2. Need to expand waste collection services 3. Limited recycling 4. Environmental degradation 5. Illegal dumping 6. Legal compliance

67
7.8.1 Pressures
Pressure (causes) Urbanization and population growth Poverty Limited capacity and resources of the Waste Department Un-permitted/illegal waste sites Limited monitoring of operating and closed landfill sites Limited screening for hazardous waste entering domestic waste sites No monitoring of medical waste Limited enforcement and public awareness Need to be compliant with NEMA, NWA etc.
7.8.2 State
Indicator State (2005) State (2014) Waste Generation (WG) General waste produced/capita/year
Kg/capita: 210 Kg/annum (based upon a population of 700,000) According to the draft waste management plan the amount of household waste that will be generated in 2002 is estimated to 146 000 tonnes.
Waste Service (WS) % households eligible for curbside refuse removal which receive this service on a weekly basis
Households 2001 % Munic Weekly
136,316
Waste Reduction/ Management (WRM)
Number of incidents of illegal dumping
Not known, but data should be obtainable if recorded
Not known, but data should be obtainable if recorded
% of incidents where enforcement action was taken
Not known, but data should be obtainable if recorded
Not known, but data should be obtainable if recorded
Amount (tonnes) of illegal dumping cleared by BCM
Not known, but data should be obtainable if recorded
Not known, but data should be obtainable if recorded
Recycling: % of waste recycled annually (glass, paper, metal and plastics)
2002 Waste type
Recycled Tons /year
Estimated tota l quanti ty
Per cent recycl
Metal 22 000 28 600 77 Plastic 3 300 18 300 18 Paper 16 100 42 800 38 Glass 1 500 11 760 13
Landfill sites: % of BCM landfill sites licensed in
Operating: 1 out of 6 Closed sites: None
Operating: 2
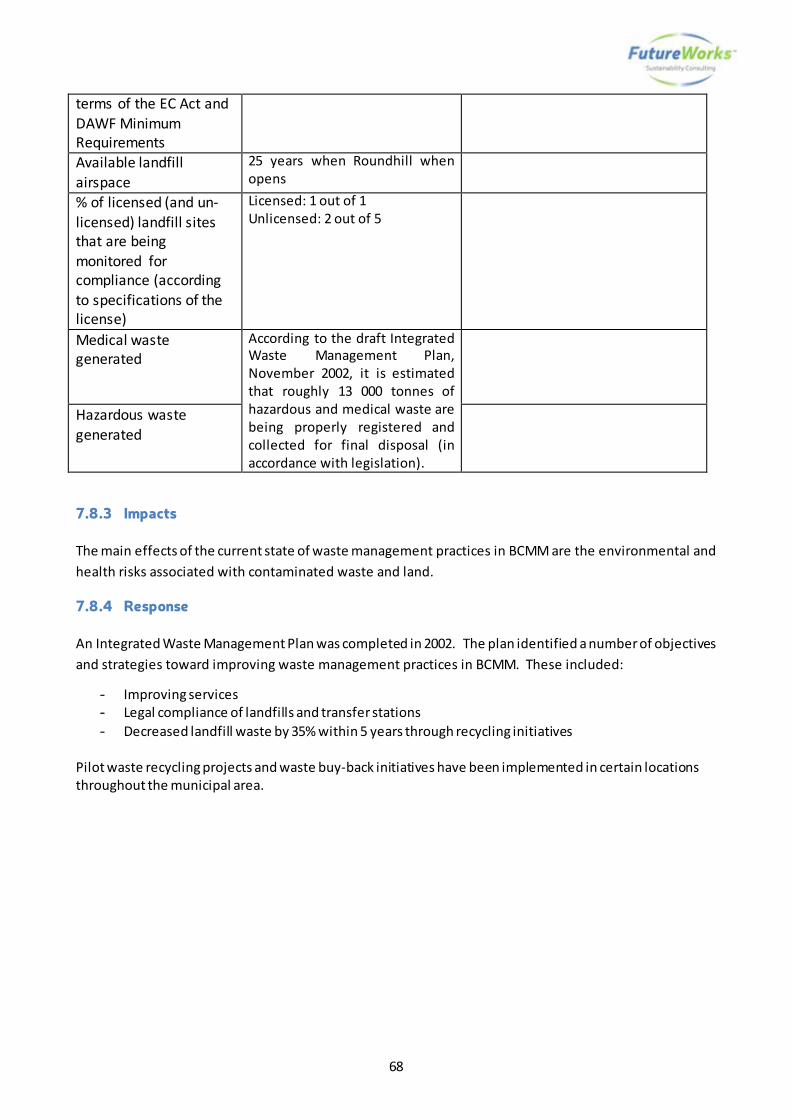
68
terms of the EC Act and DAWF Minimum Requirements Available landfill airspace
25 years when Roundhill when opens
% of licensed (and un-licensed) landfill sites that are being monitored for compliance (according to specifications of the license)
Licensed: 1 out of 1 Unlicensed: 2 out of 5
Medical waste generated
According to the draft Integrated Waste Management Plan, November 2002, it is estimated that roughly 13 000 tonnes of hazardous and medical waste are being properly registered and collected for final disposal (in accordance with legislation).
Hazardous waste generated
7.8.3 Impacts
The main effects of the current state of waste management practices in BCMM are the environmental and health risks associated with contaminated waste and land.
7.8.4 Response
An Integrated Waste Management Plan was completed in 2002. The plan identified a number of objectives and strategies toward improving waste management practices in BCMM. These included:
- Improving services - Legal compliance of landfills and transfer stations - Decreased landfill waste by 35% within 5 years through recycling initiatives
Pilot waste recycling projects and waste buy-back initiatives have been implemented in certain locations throughout the municipal area.

69
8. References
Buffalo City Metropolitan Municipality (2011). “Buffalo City Metropolitan Integrated Development Five Year Plan: 2011 to 2016”, Adopted by Council on 30th June 2011, Buffalo City Metropolitan Municipality.
Buffalo City Metropolitan Municipality (2011). “Buffalo City Metropolitan Integrated Development Five Year Plan, Situation Analysis: 2011 to 2016”, Adopted by Council on 30th June 2011, Buffalo City Metropolitan Municipality.
Buffalo City Metropolitan Municipality (2008a). “Buffalo City: the big city with a small town feel”. Available from: http://www.buffalocity.gov.za/visitors/general.stm [Accessed: 9 April, 2014].
Buffalo City Metropolitan Municipality (2008b). “Attractions and activities”. Available from: http://www.buffalocity.gov.za/visitors/activities.stm [Accessed 9 April, 2014]
Buffalo City Metropolitan Municipality (2005a). “Coastal Action Plan 2: Estuaries Management”, First Draft June 2005, Buffalo City Metropolitan Municipality.
Buffalo City Metropolitan Municipality (2005b). “Integrated Coastal Zone Management Plan 2005”, Buffalo City Metropolitan Municipality.
Buffalo City Metropolitan Municipality (2003). “Water Supply infrastructure”. Available from: www.buffalocity.gov.za/municipality/water_infrastructure.stm [Accessed on 10 April 2014].
Buffalo City Metropolitan Municipality (undated). Potential tourism sites of historical and cultural significance and with natural history interest. Available from: http://www.buffalocity.gov.za/visitors/heritagesite_050209.pdf [Accessed 14 April, 2014]
Buffalo City Tourism (undated). “Things to do in Buffalo City: Action and adventure”. Available from: http://www.bctourism.co.za/page.php?id=2 [Accessed 9 April, 2014]
Coastal and Environmental Services (2005). Buffalo City Municipality State of Environment Report. Buffalo City Metropolitan Municipality.
Department of Economic Development, Environmental Affairs and Tourism (DEDEAT) (2013). “2013-14 Policy Statement: Honourable MEC Mcebisi Jonas”, Eastern Cape Provincial Government. Available from: http://www.dedea.gov.za/Speeches/Policy%20Speech%202013%20-%20MEC%20Jonas.pdf [Accessed: 9 April, 2014].
Department of Water Affairs and Forestry (2014). “Eastern Cape Province State of Dams on 2014-04-07”. Available from: http://www.dwaf.gov.za/Hydrology/Weekly/ProvinceWeek.aspx?region=EC [Accessed on 10 April 2014].
Department of Water Affairs and Forestry (DWAF) (2012a). “Blue Drop Report 2012”. Available from www.dwaf.gov.za/Documents/BD2012/EC.pdf [Accessed 9 April 2014]
Department of Water Affairs and Forestry (DWAF) (2012b). “Amatole Water Supply System, Reconciliation Strategy, Status Report 2012”, Department of Water Affairs and Forestry. http://www.dwaf.gov.za/Projects/Amatole/documents/Status%20Report%202012%20Rev3%20FINAL%20Complete.pdf [Accessed on 1 May 2014].
Department of Water Affairs and Forestry (DWAF) (2011). “Green Drop Report 2011”. Available from www.dwaf.gov.za/Documents/GD/GDEC.pdf [Accessed on 10 April 2014].
Department of Water Affairs and Forestry (2008). “Biomonitoring of the Nahoon River System”. Available from: http://www.dwa.gov.za/iwqs/rhp/state_of_rivers/ecape_04/Nahoon%20Report%20R30E%20F.pdf [Accessed on 10 April 2014].
Department of Water Affairs and Forestry (2004). “Situation Assessment of the Lower Kei Sub- Area”. Available from: http://www.dwaf.gov.za/Documents/Other/WMA/12/AmatoleKeiISPAug04Sec1-7.pdf [Accessed on 10 April 2014].

70
East London Zoo (2012). “Attractions: Our animals” Available from: http://www.el-zoo.co.za/animals/ [Accessed 14 April 2014]
Gounden, 2004. “Buffalo City launches its tourism master plan”, http://www.buffalocity.gov.za/municipality/mediaroom/bcm-27-09-tourism_masterplan.doc
Grant Thornton Kessel Feinstein, 2004. “Buffalo City Tourism Masterplan – Phase 3: Section 3: Tourism Supply. Available from: http://www.buffalocity.gov.za/municipality/keydocs/tourism_masterplan/phase3/TourismSupply.PDF [Accessed 7 April 2014]
River Health Programme (2004). “State of Rivers Report: Buffalo River System”. Department of Water Affairs and Forestry, Pretoria.
SA Venues (2014).“East London Coast Nature Reserve, Eastern Cape” Available from: http://www.sa-venues.com/game-reserves/ec_east-london-coast.htm. [Accessed 14 April, 2014]
Siyabona Africa Travel (Pty) Ltd (undated). “Mpongo Private Game Reserve, Eastern Cape, South Africa”, Available from http://www.nature-reserve.co.za/mpongo-private-game-reserve.html [Accessed 14 April, 2014].
Statistics South Africa (2011). “Buffalo City Municipality” Census 2011. Available from http://beta2.statssa.gov.za/?page_id=1021&id=buffalo-city-municipality [Accessed on 7 April 2014].
Van Niekerk, L. and Turpie, J.K.(eds) 2012. South African National Biodiversity Assessment 2011: Technical Report. Volume 3: Estuary Component. CSIR Report Number CSIR/NRE/ECOS/ER/2011/0045/B. Council for Scientific and Industrial Research, Stellenbosch.