review of species selected on the basis of the analysis...
TRANSCRIPT
Review of species selected on the basis of the Analysis of the European Union and candidate
countries’ annual reports to CITES 2010
(Version edited for public release)
Prepared for the European Commission
Directorate General Environment ENV.E.2. – Environmental Agreements and Trade
by the
United Nations Environment Programme World Conservation Monitoring Centre
November, 2012
UNEP World Conservation Monitoring Centre
219 Huntingdon Road Cambridge CB3 0DL United Kingdom Tel: +44 (0) 1223 277314 Fax: +44 (0) 1223 277136 Email: [email protected] Website: www.unep-wcmc.org The United Nations Environment Programme
World Conservation Monitoring Centre
(UNEP-WCMC) is the specialist biodiversity
assessment centre of the United Nations
Environment Programme (UNEP), the world’s
foremost intergovernmental environmental
organisation. The Centre has been in operation
for over 30 years, combining scientific research
with practical policy advice. The Centre's
mission is to evaluate and highlight the many
values of biodiversity and put authoritative
biodiversity knowledge at the centre of decision-
making. Through the analysis and synthesis of
global biodiversity knowledge the Centre
provides authoritative, strategic and timely
information for conventions, countries and
organisations to use in the development and
implementation of their policies and decisions.
UNEP-WCMC provides objective and
scientifically rigorous procedures and services.
These include ecosystem assessments, support
for the implementation of environmental
agreements, global and regional biodiversity
information, research on threats and impacts,
and the development of future scenarios.
CITATION
UNEP-WCMC (2012). Review of species selected on
the basis of the Analysis of the European Union and
candidate countries’ annual reports to CITES 2010.
Prepared for the European Commission. UNEP-
WCMC, Cambridge.
PREPARED FOR
The European Commission, Brussels, Belgium
DISCLAIMER
The contents of this report do not necessarily
reflect the views or policies of UNEP or
contributory organisations. The designations
employed and the presentations do not imply
the expressions of any opinion whatsoever on
the part of UNEP, the European Commission or
contributory organisations concerning the legal
status of any country, territory, city or area or its
authority, or concerning the delimitation of its
frontiers or boundaries.
© Copyright: 2012, European Commission

1
Table of Contents
1. Introduction to the Analysis of the European Union Annual Reports to CITES ....................................... 2
2. Introduction to the species sheets ..................................................................................................................... 3
SPECIES: Lynx canadensis ..................................................................................................4
SPECIES: Naja kaouthia ....................................................................................................11
SPECIES: Python reticulatus .............................................................................................18
SPECIES: Mauremys sinensis ...........................................................................................33
Annex I: Detailed trade data tables for Python reticulatus ............................................................................... 39
Annex II: Key to purpose and source codes ...................................................................................................... 58
Introduction
2
1. Introduction to the Analysis of the European Union Annual Reports to CITES
UNEP-WCMC undertakes an annual Analysis of the European Union and candidate countries’ annual reports to CITES. This Analysis examines patterns of trade into the European Union and candidate countries, trade in groups of particular note, possible transgressions of suspensions and negative opinions, exports of native species, etc.
As part of the 2010 Analysis, imports reported by the EU (and candidate countries) as wild-sourced, ranched, source ‘unknown’ or source ‘blank’ were analysed to identify noteworthy patterns of trade according to five criteria. These criteria were designed to identify:
1. High volume trade in 2010
2. Globally threatened and near threatened species traded at relatively high volumes in 2010
3. Sharp increase in trade in 2010
4. General long term increases or decreases in trade between 2001 and 2010
5. Long term variability in trade between 2001 and 2010.
Imports were considered to be ‘high volume’ according to thresholds which were determined by taxonomic group and CITES Appendix (Table 2). In order to account for threat status, the Appendix I threshold was also applied to Appendix II and III species considered to be threatened or near threatened by the IUCN (Critically Endangered, Endangered, Vulnerable and Near Threatened in the IUCN Red List).
Table 2. Minimum number of wild, ranched, source ‘unknown’ and source ‘blank’ individuals imported in 2010 needed to qualify for selection on the basis of high trade volume.
Taxonomic group CITES Appendix
I II
CR, EN, VU, NT*
II III
CR, EN, VU, NT*
III
Mammals 50 50 5000 50 25000
Birds 50 50 5000 50 25000
Reptiles 50 50 25000 50 50000
Amphibians 50 50 25000 50 —
Fish 50 50 25000 50 —
Invertebrates (non-corals) 250 250 25000 250 50000
Corals — 10000 25000 10000 50000
Plants (non-tree) 250 250 25000 250 50000
Plants (trees) 250 m³ 250 m³ 500 m³ 250 m³ 2500 m³
* CR = Critically Endangered, EN = Endangered, VU = Vulnerable, NT = Near Threatened in 2010 IUCN Red List
The ‘sharp increase’ criterion was designed to determine if there was a sharp increase in importer-reported wild-sourced imports in 2010, compared with the average level of imports between 2005 and 2009. Species that, despite a sharp increase in trade in 2010, were still only traded in very low volumes (i.e. less than 5 per cent of the levels listed in Table 2) were omitted from the chapter.
The ‘overall increase’ criteria took into account more general trends over the period 2001-2010 by calculating the slope of a best-fit linear function to the trade data, with a large positive slope indicating a significant increase in trade levels over time.
To account for highly variable trade that may not be picked up by the other criteria, the coefficient of variation was calculated for imports over a ten-year period (2001-2010) and species showing high variation over this period were selected.

Introduction
3
2. Introduction to the species sheets
On the basis of the Analysis of the European Union and candidate countries’ annual report to CITES 2010, five Annex B taxa and one Annex C species were initially considered as candidates for review (SRG 61 document). Four species were selected by the SRG for in-depth review (Table 1).
Species were selected on the basis of particular patterns of trade to the European Union in 2010. Lynx canadensis and Python reticulatus were selected on the basis of high volume of trade in 2010. Naja kaouthia was selected on the basis of a sharp increase in trade in 2010 and a lack of scientific data to support Non Detriment Findings. Mauremys sinensis was selected on the basis of a sharp increase in trade and whilst SRG opinions are not applicable to Annex C species, a review was recommended to assess whether the species might merit listing in Annex B.
Lynx canadensis
4
REVIEW OF SPECIES SELECTED ON THE BASIS OF THE 2010 ANALYSIS OF EU ANNUAL REPORTS
CARNIVORA FELIDAE
SPECIES: Lynx canadensis
SYNONYMS: Felis canadensis, Lynx lynx canadensis
COMMON NAMES: Canadese lynx (Dutch), American Lynx, Canada Lynx (English), Lynx du Canada (French), Lince del Canadá (Spanish), Kanadensisk lo, Nordamerikansk lo (Swedish)
RANGE STATES: Canada, United States of America
RANGE STATE UNDER REVIEW: United States of America
IUCN RED LIST: Least Concern
PREVIOUS EC OPINIONS: Positive opinion for wild specimens from Canada and the United States of America first formed on 18/07/2001 and last confirmed on 27/03/2007.
TRADE PATTERNS:
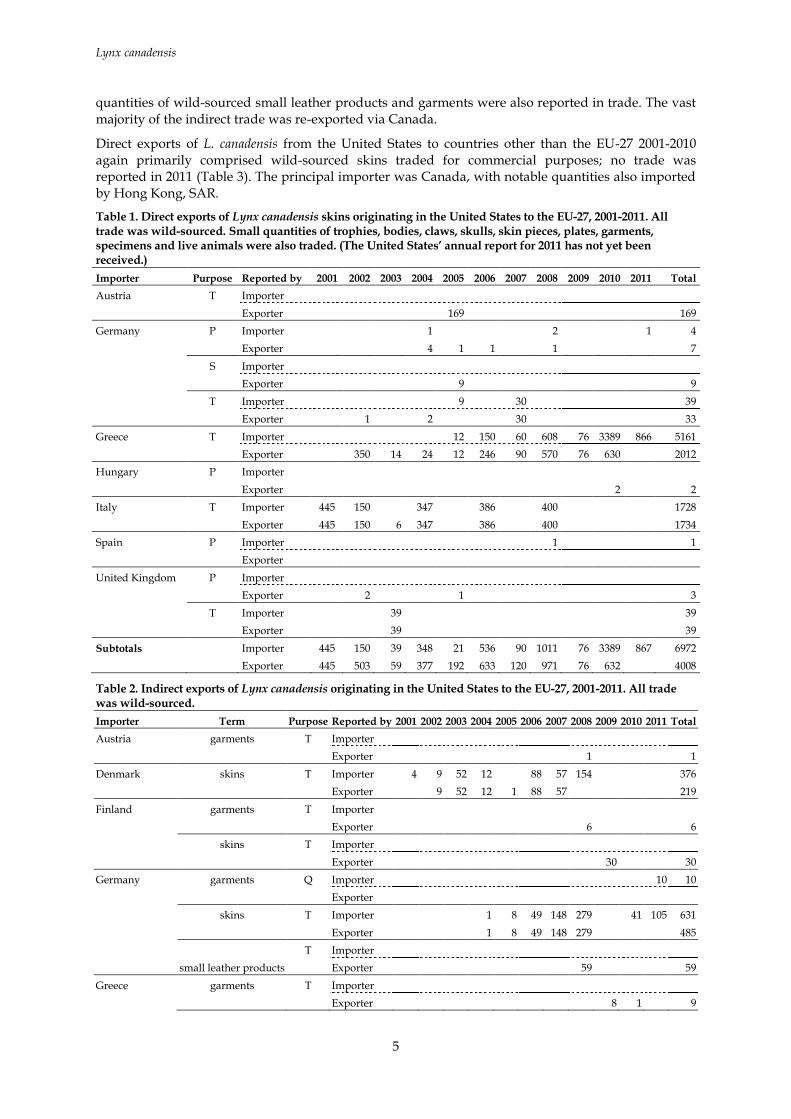
Lynx canadensis from the United States of America was selected on the basis of high volume of trade, with imports of wild-sourced skins to the EU-27 in 2010 reaching the highest levels of trade over the last ten years.
United States of America: The United States of America (hereafter referred to as the United States) has not published any export quotas for Lynx canadensis. According to the CITES Trade Database, imports of L. canadensis to the EU-27 directly from the United States over the period 2001-2011 primarily comprised skins, all of which were wild-sourced and the vast majority traded for commercial purposes (Table 1). Small quantities of wild-sourced trophies, bodies, claws, skulls, skin pieces, plates, garments and specimens were also traded, as well as a small number of captive-born live animals. EU-reported imports of L. canadensis skins increased over 40-fold between 2009 and 2010, with 3389 skins reported imported in 2010, all of which were reported by Greece. However, the United States reported the export of only 632 L. canadensis skins in that year. A cross-check of permit numbers reported by both trading partners revealed that of the 3389 skins reported by Greece, all but 59 were reported by the United States as being of the species Lynx rufus. An additional 411 and 160 skins reported by the United States as L. canadensis were reported by Greece as L. rufus and Lutra canadensis, respectively.
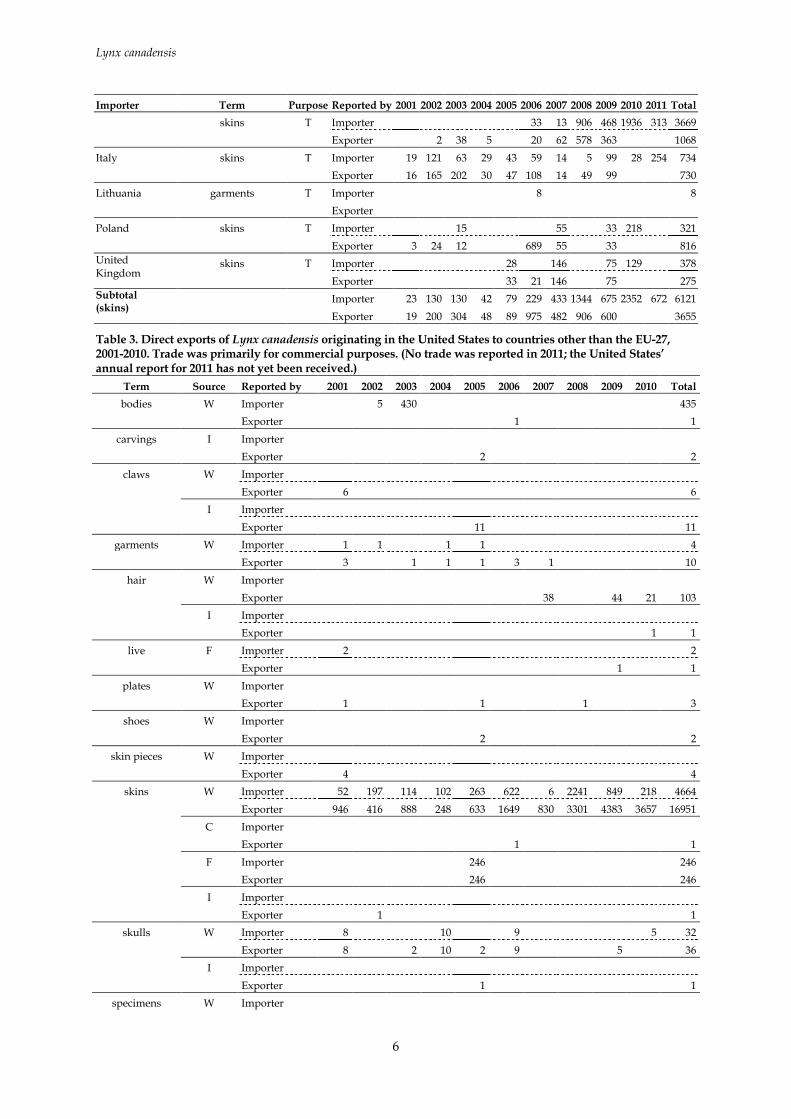
Indirect exports of L. canadensis to the EU-27 originating in the United States also consisted principally of skins, all of which were wild-sourced and traded for commercial purposes (Table 2). Small
Lynx canadensis
5
quantities of wild-sourced small leather products and garments were also reported in trade. The vast majority of the indirect trade was re-exported via Canada.
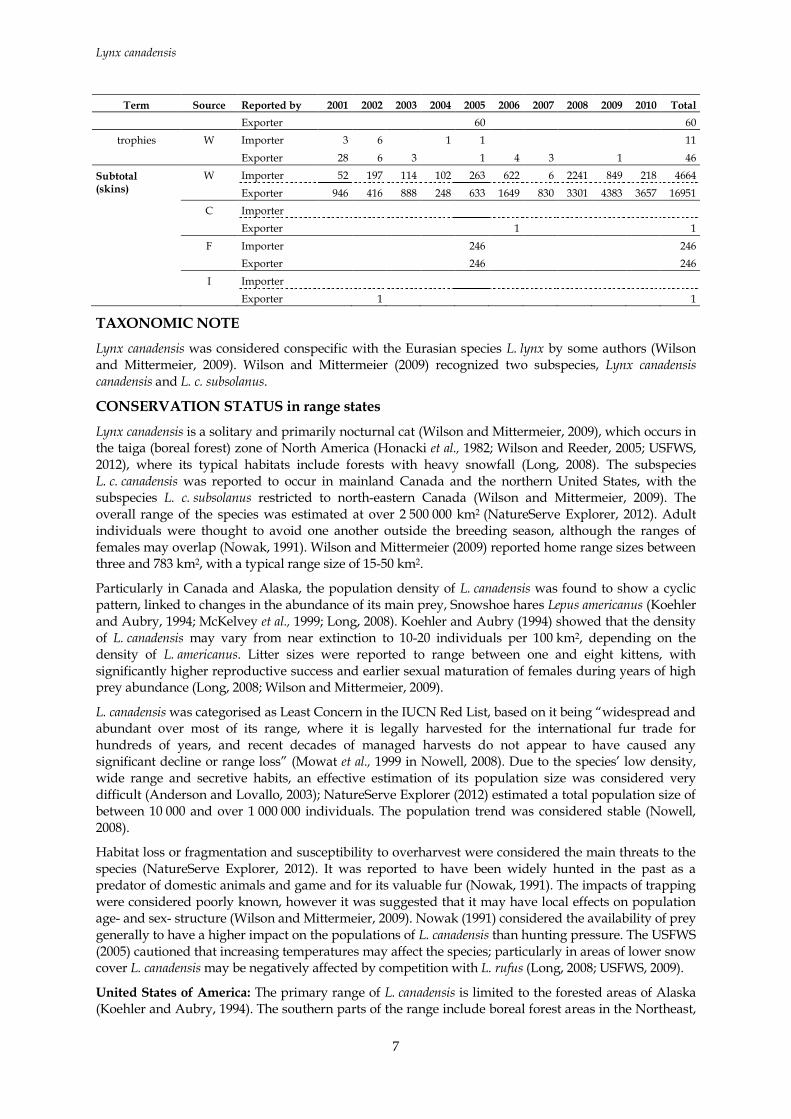
Direct exports of L. canadensis from the United States to countries other than the EU-27 2001-2010 again primarily comprised wild-sourced skins traded for commercial purposes; no trade was reported in 2011 (Table 3). The principal importer was Canada, with notable quantities also imported by Hong Kong, SAR.
Table 1. Direct exports of Lynx canadensis skins originating in the United States to the EU-27, 2001-2011. All trade was wild-sourced. Small quantities of trophies, bodies, claws, skulls, skin pieces, plates, garments, specimens and live animals were also traded. (The United States’ annual report for 2011 has not yet been received.)
Importer Purpose Reported by 2001 2002 2003 2004 2005 2006 2007 2008 2009 2010 2011 Total
Austria T Importer
Exporter
169
169
Germany P Importer
1
2
1 4
Exporter
4 1 1
1
7
S Importer
Exporter
9
9
T Importer
9
30
39
Exporter 1
2
30
33
Greece T Importer
12 150 60 608 76 3389 866 5161
Exporter 350 14 24 12 246 90 570 76 630
2012
Hungary P Importer
Exporter
2
2
Italy T Importer 445 150
347
386
400
1728
Exporter 445 150 6 347
386
400
1734
Spain P Importer
1
1
Exporter
United Kingdom P Importer
Exporter 2
1
3
T Importer
39
39
Exporter
39
39
Subtotals Importer 445 150 39 348 21 536 90 1011 76 3389 867 6972
Exporter 445 503 59 377 192 633 120 971 76 632
4008
Table 2. Indirect exports of Lynx canadensis originating in the United States to the EU-27, 2001-2011. All trade was wild-sourced.
Importer Term Purpose Reported by 2001 2002 2003 2004 2005 2006 2007 2008 2009 2010 2011 Total
Austria garments T Importer
Exporter
1
1
Denmark skins T Importer 4 9 52 12
88 57 154
376
Exporter
9 52 12 1 88 57
219
Finland garments T Importer
Exporter
6
6
skins T Importer
Exporter
30
30
Germany garments Q Importer
10 10
Exporter
skins T Importer
1 8 49 148 279
41 105 631
Exporter
1 8 49 148 279
485
small leather products
T Importer
Exporter
59
59
Greece garments T Importer
Exporter
8 1
9
Lynx canadensis
6
Importer Term Purpose Reported by 2001 2002 2003 2004 2005 2006 2007 2008 2009 2010 2011 Total
skins T Importer
33 13 906 468 1936 313 3669
Exporter
2 38 5
20 62 578 363
1068
Italy skins T Importer 19 121 63 29 43 59 14 5 99 28 254 734
Exporter 16 165 202 30 47 108 14 49 99
730
Lithuania garments T Importer
8
8
Exporter
Poland skins T Importer
15
55
33 218
321
Exporter 3 24 12
689 55
33
816
United Kingdom
skins T Importer
28
146
75 129
378
Exporter
33 21 146
75
275
Subtotal (skins)
Importer 23 130 130 42 79 229 433 1344 675 2352 672 6121
Exporter 19 200 304 48 89 975 482 906 600
3655
Table 3. Direct exports of Lynx canadensis originating in the United States to countries other than the EU-27, 2001-2010. Trade was primarily for commercial purposes. (No trade was reported in 2011; the United States’ annual report for 2011 has not yet been received.)
Term Source Reported by 2001 2002 2003 2004 2005 2006 2007 2008 2009 2010 Total
bodies W Importer 5 430
435
Exporter
1
1
carvings I Importer
Exporter
2
2
claws W Importer
Exporter 6
6
I Importer
Exporter
11
11
garments W Importer 1 1
1 1
4
Exporter 3
1 1 1 3 1
10
hair W Importer
Exporter
38
44 21 103
I Importer
Exporter
1 1
live F Importer 2
2
Exporter
1
1
plates W Importer
Exporter 1
1
1
3
shoes W Importer
Exporter
2
2
skin pieces W Importer
Exporter 4
4
skins W Importer 52 197 114 102 263 622 6 2241 849 218 4664
Exporter 946 416 888 248 633 1649 830 3301 4383 3657 16951
C Importer
Exporter
1
1
F Importer
246
246
Exporter
246
246
I Importer
Exporter 1
1
skulls W Importer 8
10
9
5 32
Exporter 8
2 10 2 9
5
36
I Importer
Exporter
1
1
specimens W Importer
Lynx canadensis
7
Term Source Reported by 2001 2002 2003 2004 2005 2006 2007 2008 2009 2010 Total
Exporter
60
60
trophies W Importer 3 6
1 1
11
Exporter 28 6 3
1 4 3
1
46
Subtotal (skins)
W Importer 52 197 114 102 263 622 6 2241 849 218 4664
Exporter 946 416 888 248 633 1649 830 3301 4383 3657 16951
C Importer
Exporter
1
1
F Importer
246
246
Exporter
246
246
I Importer
Exporter 1
1
TAXONOMIC NOTE
Lynx canadensis was considered conspecific with the Eurasian species L. lynx by some authors (Wilson and Mittermeier, 2009). Wilson and Mittermeier (2009) recognized two subspecies, Lynx canadensis canadensis and L. c. subsolanus.
CONSERVATION STATUS in range states
Lynx canadensis is a solitary and primarily nocturnal cat (Wilson and Mittermeier, 2009), which occurs in the taiga (boreal forest) zone of North America (Honacki et al., 1982; Wilson and Reeder, 2005; USFWS, 2012), where its typical habitats include forests with heavy snowfall (Long, 2008). The subspecies L. c. canadensis was reported to occur in mainland Canada and the northern United States, with the subspecies L. c. subsolanus restricted to north-eastern Canada (Wilson and Mittermeier, 2009). The overall range of the species was estimated at over 2 500 000 km2 (NatureServe Explorer, 2012). Adult individuals were thought to avoid one another outside the breeding season, although the ranges of females may overlap (Nowak, 1991). Wilson and Mittermeier (2009) reported home range sizes between three and 783 km2, with a typical range size of 15-50 km2.
Particularly in Canada and Alaska, the population density of L. canadensis was found to show a cyclic pattern, linked to changes in the abundance of its main prey, Snowshoe hares Lepus americanus (Koehler and Aubry, 1994; McKelvey et al., 1999; Long, 2008). Koehler and Aubry (1994) showed that the density of L. canadensis may vary from near extinction to 10-20 individuals per 100 km2, depending on the density of L. americanus. Litter sizes were reported to range between one and eight kittens, with significantly higher reproductive success and earlier sexual maturation of females during years of high prey abundance (Long, 2008; Wilson and Mittermeier, 2009).
L. canadensis was categorised as Least Concern in the IUCN Red List, based on it being “widespread and abundant over most of its range, where it is legally harvested for the international fur trade for hundreds of years, and recent decades of managed harvests do not appear to have caused any significant decline or range loss” (Mowat et al., 1999 in Nowell, 2008). Due to the species’ low density, wide range and secretive habits, an effective estimation of its population size was considered very difficult (Anderson and Lovallo, 2003); NatureServe Explorer (2012) estimated a total population size of between 10 000 and over 1 000 000 individuals. The population trend was considered stable (Nowell, 2008).
Habitat loss or fragmentation and susceptibility to overharvest were considered the main threats to the species (NatureServe Explorer, 2012). It was reported to have been widely hunted in the past as a predator of domestic animals and game and for its valuable fur (Nowak, 1991). The impacts of trapping were considered poorly known, however it was suggested that it may have local effects on population age- and sex- structure (Wilson and Mittermeier, 2009). Nowak (1991) considered the availability of prey generally to have a higher impact on the populations of L. canadensis than hunting pressure. The USFWS (2005) cautioned that increasing temperatures may affect the species; particularly in areas of lower snow cover L. canadensis may be negatively affected by competition with L. rufus (Long, 2008; USFWS, 2009).
United States of America: The primary range of L. canadensis is limited to the forested areas of Alaska (Koehler and Aubry, 1994). The southern parts of the range include boreal forest areas in the Northeast,

Lynx canadensis
8
Great Lakes area, Rocky Mountains and Cascade mountains (USFWS, 2005), with occurrences reported in Colorado, Idaho, Maine, Michigan, Minnesota, Montana, New Hampshire, New York, Oregon, Utah, Vermont, Washington, Wisconsin and Wyoming (USFWS, 2005 and 2012). These populations were thought to be dependent on the interconnected Canadian populations as a source of emigration (USFWS, 2005).
At CITES CoP13 in 2004, the United States submitted a proposal (CoP13 Prop. 5) to remove L. rufus from Appendix II, as its inclusion for look-alike purposes with other Lynx spp. was no longer considered warranted. However, concerns were expressed, particularly by the European Community, about problems in distinguishing other lookalike species, including L. canadensis (AC25 Doc.15.2.2). The proposal was withdrawn, but the United States agreed to lead a review of Lynx spp. under the Periodic Review of Felidae spp. at the 21st meeting of the Animals Committee (AC25 Doc.15.2.2).
As a part of this review they conducted: 1) a survey of all range states of Lynx spp., 2) a study analysing trade in Lynx spp. (Cooper and Shadbolt, 2007), 3) an analysis of Lynx spp. CITES trade data, 4) a meeting held in Brussels by the United States and the European Commission to discuss the degree of illegal trade in Lynx spp., and 5) a survey conducted by the Scientific Authority of the United States to estimate the population size, distribution and status of L. rufus (AC25 Doc.15.2.2.). A fur identification manual was also created by the United States Fish and Wildlife Service (USFWS) (www.wildfurid.com) to help in distinguishing the species from lookalikes, including L. canadensis (AC25 Doc. 15.2.2). According to the results of the range state questionnaire survey, the species was not negatively affected by trade (AC25 Doc. 15.2.2) and illegal trade was not considered to be of significance in the United States (AC25 Doc. 15.2.2 Annex).
The use of CITES tags on furs of L. canadensis exported from the country is required (CITES Notification No. 2012/029).
Alaska: L. canadensis was considered relatively common (Koehler and Aubry, 1994; Alaska Department of Fish and Game, 2012b) and abundant (Nowell, 2008) throughout its range in Alaska, and the Alaskan populations were considered to be stable or increasing (Koehler and Aubry, 1994; AC25 Doc.15.2.2.).
In Alaska, where L. canadensis was considered to be the most important furbearing species (Alaska Department of Fish and Game, 2012b), the species was reported to be managed for fur harvest (Nowell, 2008). According to the Alaska Department of Fish and Game (2012b), the average price paid for a pelt was USD 104 in 2008-2009, and the total value of L. canadensis fur trade was USD 745 650 during the same period.
The Alaskan hunting regulations stipulate that a licence is required for the trapping of L. canadensis and hunting is regulated through hunting seasons, bag limits and restrictions on hunting methods and means, as specified for each hunting unit (Alaska Department of Fish and Game, 2012a). At times of low productivity, hunting pressure is reduced in some parts of the state through restricted hunting seasons (Alaska Department of Fish and Game, 2012b). The harvesting system was reported to accommodate cyclic population fluctuations, by allowing increased harvest levels during population peaks and decreasing harvest levels during population declines (AC25 Doc. 15.2.2 Annex).
Contiguous United States: The species’ population density in the contiguous United States (the 48 continental states south of Canada) was considered to be low, due to limited habitat and prey availability (USFWS, 2005; Wilson and Mittermeier, 2009), and Nowell (2008) described these populations as “small and threatened”. The populations of Washington and Montana were considered to be the largest outside Alaska (Koehler and Aubry, 1994; McKelvey et al., 1999; Anderson and Lovallo, 2003). In the southernmost parts of its range, in Wyoming, Utah and Colorado, the species was found to be very rare and limited to disjunct and isolated populations or to occur as a short-term resident (Koehler and Aubry, 1994). The species was considered extirpated in New Mexico, although individuals from introduced populations in Colorado were recorded occasionally (Frey, 2006). McKelvey et al. (1999) reported population declines and range retractions in most areas of its historical range in the contiguous United States. The populations were thought not to have recovered from overexploitation through legal and illegal harvest in the 1970s and 1980s (NatureServe Explorer, 2012), although the populations were believed to be stable or increasing in some areas (AC25 Doc. 15.2.2). The total

Lynx canadensis
9
population size in the contiguous United States was estimated at less than 2000 individuals (NatureServe Explorer, 2012).
Nowell (2008) considered habitat fragmentation to be the main threat to the species within the contiguous United States, with accidental trapping and road accidents being additional threats. Long (2008) reported that in Wisconsin the species might be shot mistakenly or illegally and believed that “there is little hope for natural re-establishment”, however this threat was considered only potentially affecting small, local populations with no significant impact on the populations overall (USFWS, 2005).
The populations of the contiguous United States were categorised as ‘Threatened’ by the U.S. Fish and Wildlife Service in 2000, therefore requiring the development of a species recovery plan and the identification of critical habitats (USFWS, 2012). The populations of New Mexico were included in the informal list of species of concern (Frey, 2006) and categorised as a ‘Candidate’ for listing as ’Endangered’ or ‘Threatened’ (USFWS, 2012). The main justification for the listing was the lack of guidance on habitat conservation, allowing the “continued degradation of lynx [L. canadensis] habitat on Federal lands through timber management and other Federal activities” (USFWS, 2005). In the species recovery plan, the species was considered of relatively low priority for conservation action, with a score of 15 on a scale of one (highest) to 18 (lowest), due to “a low degree of threat, a high potential for recovery, and a taxonomic classification as a distinct population segment under the Endangered Species Act” (USFWS, 2005). The plan focussed on the maintenance of crucial habitat in the core areas, monitoring of populations and identification of factors limiting the populations (USFWS, 2005). In 2007, the U.S. Fish and Wildlife Service initiated a 5-year review of L. canadensis to ensure that the listing of the species remained accurate (U.S. Federal Register, 2007).
The designated critical habitat for the contiguous population under the Endangered Species Act of 1973 was revised to include 101 010 km2 in the states of Maine, Minnesota, Montana, Wyoming, Idaho, and Washington (USFWS, 2009). However, apart from some plans in the Washington state there were no management plans focussing on the conservation of L. canadensis (USFWS, 2005).
The USFWS (2005) reported that since the 1980s precautions had been taken in the contiguous United States to prevent overharvest of the species. Trapping for fur was reported to be banned in all contiguous states apart from Montana and Oregon (Ruediger et al., 2000). The export of wild-caught L. canadensis from the contiguous United States was reported to be restricted to purposes consistent with the Endangered Species Act, including scientific, enhancement, zoological or educational purposes (AC25 Doc. 15.2.2).
REFERENCES:
Alaska Department of Fish and Game. 2012a. 2011-2012 Alaska hunting regulations URL: http://www.adfg.alaska.gov/static/regulations/wildliferegulations/pdfs/smgame.pdf Accessed: 5-10-2012.
Alaska Department of Fish and Game. 2012b. Lynx (Lynx canadensis) species profile URL: http://www.adfg.alaska.gov/index.cfm?adfg=lynx.main Accessed: 5-10-2012.
Anderson, E. M. and Lovallo, M. J. 2003. Bobcat and Lynx - Lynx rufus and Lynx canadensis, in Feldhamer, G. A., Thompson, B. C., & Chapman, J. A., (eds.), Wild mammals of North America - biology, management, and conservation. The Johns Hopkins University Press, Baltimore, Maryland. 758-788.
Cooper, E. W. T. and Shadbolt, T. 2007. An analysis of the CITES-reported illegal trade in Lynx species and fur industry perceptions in North America and Europe in the context of supporting the CITES Review of Felidae based upon AC21 Doc 11.3 Phase I: AC21-22 Lynx complex and potential look-alikes. Technical report commissioned by the United States Fish and Wildlife Service, prepared by TRAFFIC North America.
Frey, J. K. 2006. Inferring species distributions in the absence of occurrence records: An example considering wolverine (Gulo gulo) and Canada lynx (Lynx canadensis) in New Mexico. Biological Conservation, 130: 16-24.
Honacki, J. H., Kinman, K. E., and Koeppl, J. W. 1982. Mammal species of the world - A taxonomic and geographic reference. Allen Press, Inc. and the Association of Systematics Collections, Lawrence, Kansas.

Lynx canadensis
10
Koehler, G. M. and Aubry, K. B. 1994. Chapter 4: Lynx, in Ruggiero, L. F. et al., (eds.), The scientific basis for conserving forest carnivores: American marten, fisher, lynx and wolverine in the western United States. U.S. Department of Agriculture, Forest Service, Rocky Mountain Forest and Range Experiment Station, Fort Collins. 74-98.
Long, C. A. 2008. Lynx canadensis Kerr - Canada lynx, in The wild mammals of Wisconsin. Pensoft Publishers, Sofia, Bulgaria. 428-434.
McKelvey, K. S., Aubry, K. B., and Ortega, Y. K. 1999. History and distribution of Lynx in the contiguous United States, in Ruggiero, L. F. et al., (eds.), Ecology and Conservation of Lynx in the United States. University Press of Colorado and the USDA, Rocky Mountains Research Station, 207-264.
Mowat, G., Poole, K. G., and O'Donoghue, M. 1999. Ecology of Lynx in Northern Canada and Alaska, in Ruggiero, L. F. et al., (eds.), Ecology and Conservation of Lynx in the United States. University Press of Colorado and the USDA, Rocky Mountains Research Station, 265-306.
NatureServe Explorer. 2012. Lynx canadensis - Kerr, 1792. NatureServe Explorer - An online encyclopedia of life URL: http://www.natureserve.org/explorer/ Accessed: 8-10-2012.
Nowak, R. M. 1991. Walker's mammals of the world. Volume II. 5th edn. The Johns Hopkins University Press, Baltimore.
Nowell, K. 2008. Lynx canadensis. In: IUCN 2012. IUCN Red List of Threatened Species. Version 2012.1 URL: www.iucnredlist.org Accessed: 5-10-2012.
Ruediger, B., Claar, J., Gniadek, S., Holt, B., Lewis, L., Mighton, S., Naney, B., Patton, G., Rinaldi, T., Trick, J., Vandehey, A., Wahl, F., Warren, N., Wenger, D., and Williamson, A. 2000. Canada lynx conservation assessment and strategy. USDA Forest Service, USDI Fish and Wildlife Service, USDI Bureau of Land Management and USDI National Park Service. Missoula, MT.
U.S.Federal Register. 4/18/2007. Federal Register Notices Vol. 72 No. 74 URL: http://www.gpo.gov/fdsys/pkg/FR-2007-04-18/pdf/E7-7342.pdf#page=1 Accessed: 5-10-2012.
USFWS. 2005. Recovery outline: Contiguous United States distinct population segment of the Canada Lynx. United States Fish and Wildlife Service.
USFWS. 2009. Endangered and Threatened wildlife and plants; Revised designation of critical habitat for the contiguous United States distinct population segment of the Canada Lynx., Federal Register, Vol.74, No.36, URL: http://www.gpo.gov/fdsys/pkg/FR-2009-02-25/pdf/E9-3512.pdf#page=1 Accessed: 5-10-2012.
USFWS. 2012. Canada Lynx (Lynx canadensis), U.S. Fish & Wildlife Service. Species Profiles., URL: http://ecos.fws.gov/speciesProfile/profile/speciesProfile.action?spcode=A073 Accessed: 4-10-2012.
Wilson, D. E. and Mittermeier, R. A. 2009. Handbook of the Mammals of the World. Vol. I. Carnivores. Lynx Edicions, Barcelona.
Wilson, D. E. and Reeder, D. M. 2005. Mammal species of the world - a taxonomic and geographic reference. 3rd edn. The Johns Hopkins University Press, Baltimore.
Naja kaouthia
11
REVIEW OF SPECIES SELECTED ON THE BASIS OF THE 2010 ANALYSIS OF EU ANNUAL REPORTS
REPTILIA ELAPIDAE
SPECIES: Naja kaouthia
SYNONYMS: Naja naja kaouthia
COMMON NAMES: Monocellate Cobra (English), Monocled Cobra (English)
RANGE STATES: Bangladesh, Bhutan (?), Cambodia, China, India, Lao People's Democratic Republic, Malaysia, Myanmar, Nepal (?), Thailand, Vietnam
RANGE STATE UNDER REVIEW: Thailand
IUCN RED LIST: Least Concern
PREVIOUS EC OPINIONS: Current Article 4.6 (b) import suspension for wild specimens from Lao People's Democratic Republic first applied on 18/02/2005 and last confirmed on 10/09/2012. Previous negative opinion for wild specimens from Lao People's Democratic Republic formed on 25/06/2004.
TRADE PATTERNS:
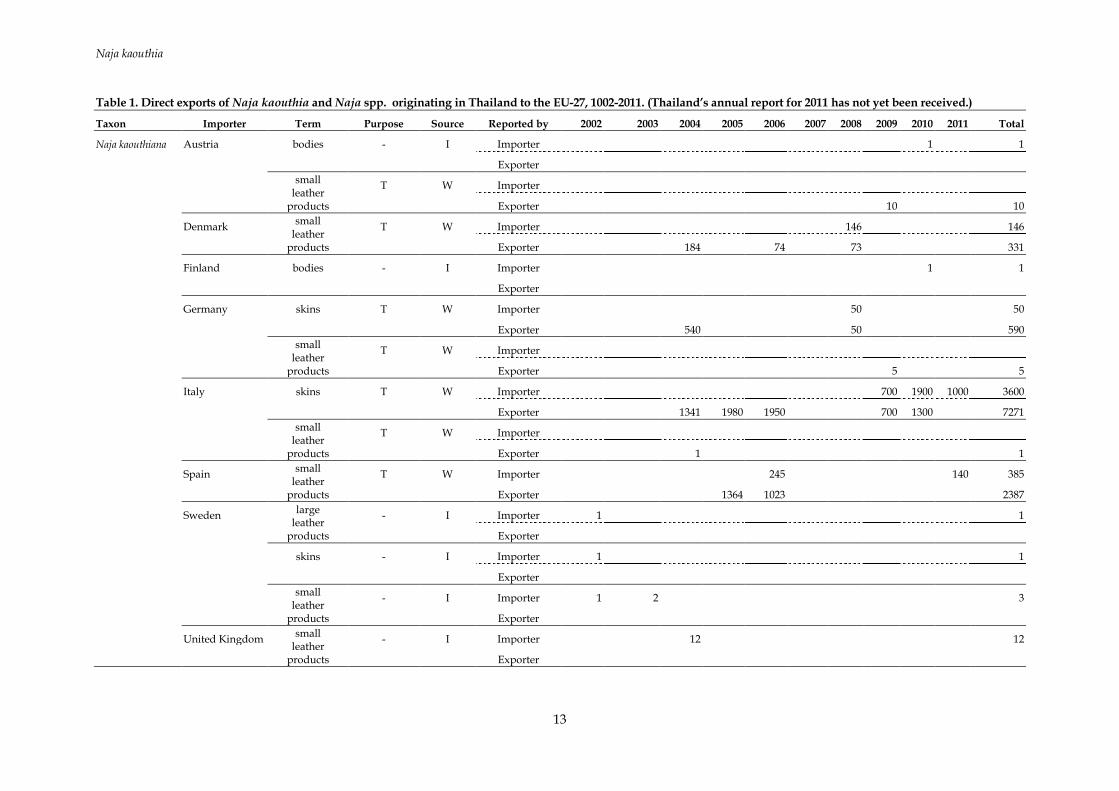
Naja kaouthia from Thailand was selected on the basis of a sharp increase of trade levels, with a lack of scientific data to support a Non Detriment Finding also noted (SC50 Inf. 8). Lack of consistency was noted in reporting trade in taxa included in the ‘N. naja species complex’ (AC16.7.3. Annex).
Thailand: Thailand published export quotas for 2000 wild-sourced skins and bodies and 1100 wild-sourced small leather products of Naja kaouthia in both 2011 and 2012. According to the data to date, this quota has not been exceeded, although Thailand’s 2011 annual report has not been received. Previously, since 2004, Thailand published the same quotas for Naja spp. (with the exception of 2006 and 2007, when no quota was published). Thailand’s annual report for 2011 has not yet been received; the direct export of 1000 wild-sourced skins and 140 wild-sourced small leather products was reported by importers in 2011, while no trade in bodies was reported. Trade data for 2012 are not yet available.
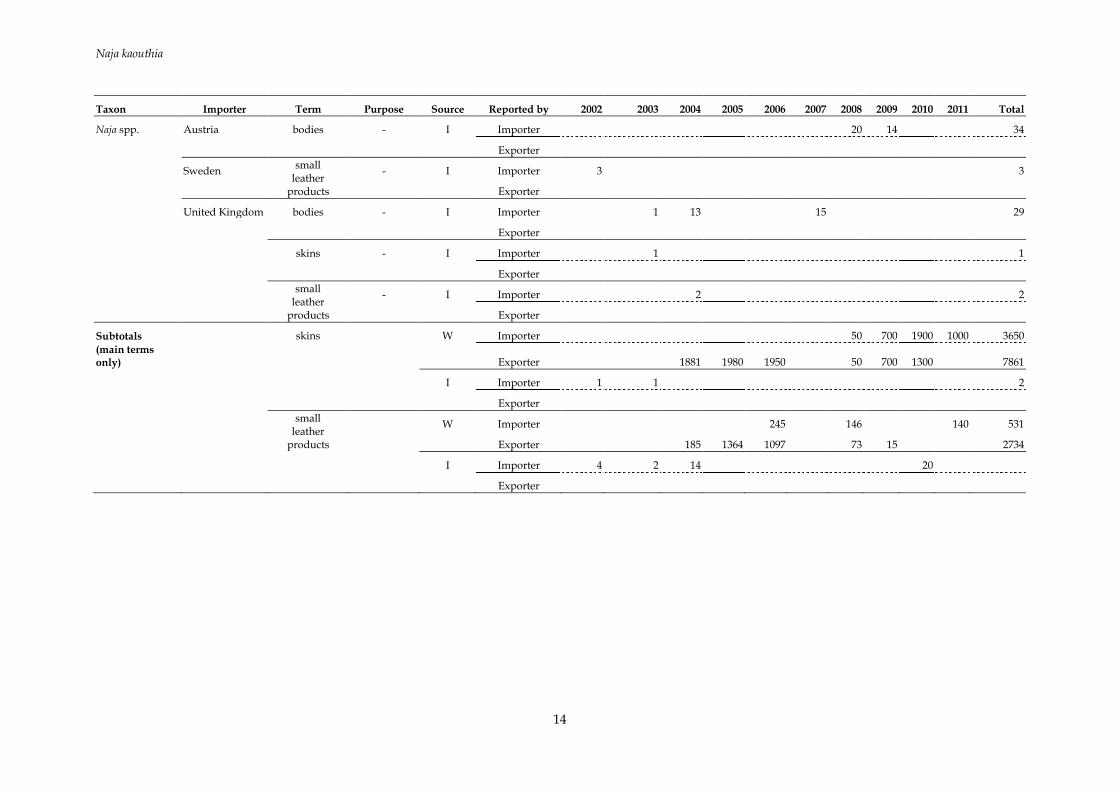
Direct exports of N. kaouthia and Naja spp. from Thailand to the EU-27 over the period 2001-2011 primarily comprised wild-sourced skins and small leather products traded for commercial purposes (Table 1).
Indirect trade in N. kaouthia to the EU-27 originating in Thailand 2001-2011 consisted of 46 skin pieces re-exported via the Philippines reported by the importer, Germany, in 2009. In 2010, very small numbers of small leather products were re-exported from the United States and China to Italy, from

Naja kaouthia
12
Japan to France and from Switzerland to Slovenia. All trade was wild-sourced and for commercial purposes. No indirect trade was reported in Naja spp.
Direct exports of N. kaouthia from Thailand to countries other than the EU-27 over the period 2001-2011 principally comprised wild-sourced small leather products and skins traded for commercial purposes (Table 2), the major importer being Japan. Trade in small leather products decreased over the period 2004-2010 overall. No trade in Naja spp. was reported to countries other than the EU-27 over the period 2001-2011.
Naja kaouthia
13
Table 1. Direct exports of Naja kaouthia and Naja spp. originating in Thailand to the EU-27, 1002-2011. (Thailand’s annual report for 2011 has not yet been received.)
Taxon Importer Term Purpose Source Reported by 2002 2003 2004 2005 2006 2007 2008 2009 2010 2011 Total
Naja kaouthiana Austria bodies - I Importer
1
1
Exporter
small leather
products
T W Importer
Exporter
10
10
Denmark small
leather products
T W Importer
146
146
Exporter
184
74
73
331
Finland bodies - I Importer
1
1
Exporter
Germany skins T W Importer
50
50
Exporter
540
50
590
small leather
products
T W Importer
Exporter
5
5
Italy skins T W Importer
700 1900 1000 3600
Exporter
1341 1980 1950
700 1300
7271
small leather
products
T W Importer
Exporter
1
1
Spain small
leather products
T W Importer
245
140 385
Exporter
1364 1023
2387
Sweden large
leather products
- I Importer 1
1
Exporter
skins - I Importer 1
1
Exporter
small leather
products
- I Importer 1 2
3
Exporter
United Kingdom small
leather products
- I Importer
12
12
Exporter
Naja kaouthia
14
Taxon Importer Term Purpose Source Reported by 2002 2003 2004 2005 2006 2007 2008 2009 2010 2011 Total
Naja spp. Austria bodies - I Importer
20 14
34
Exporter
Sweden small
leather products
- I Importer 3
3
Exporter
United Kingdom bodies - I Importer
1 13
15
29
Exporter
skins - I Importer
1
1
Exporter
small leather
products
- I Importer
2
2
Exporter
Subtotals
skins
W Importer
50 700 1900 1000 3650
(main terms only)
Exporter
1881 1980 1950
50 700 1300
7861
I Importer 1 1
2
Exporter
small leather
products
W Importer
245
146
140 531
Exporter
185 1364 1097
73 15
2734
I Importer 4 2 14
20
Exporter

Naja kaouthia
15
Table 2. Direct exports of Naja kaouthia originating in Thailand to countries other than the EU-27, 2004-2010. (No trade was reported 2001-2003 or in 2011; Thailand’s annual report for 2011 has not yet been received.)
Term Source Purpose Reported by 2004 2005 2006 2007 2008 2009 2010 Total
bodies I P Importer
1
1
Exporter
garments W T Importer
Exporter 15
15
C T Importer
Exporter
10
10
skins W T Importer
50
50
Exporter 118 50 50
103 30 351
small leather products W T Importer
246 73 82 171
30 602
Exporter 879 892 750 82 179 23 30 2835
C T Importer
Exporter 10 137
147
I P Importer
2
2
Exporter
T Importer
1 1 2
Exporter
- - Importer
2 2
Exporter
TAXONOMIC NOTE
Naja kaouthia was previously considered a subspecies of N. naja. It was elevated to species level following an analysis of morphometric characters (Wüster and Thorpe, 1992; see also Wüster et al., 1995 and Wüster, 1996).
CONSERVATION STATUS in range states
Naja kaouthia is a highly venomous snake (O'Shea and Halliday, 2002), reported to typically occur in agricultural environments and human settlements, as well as swamps, mangroves, grasslands, shrublands and forests (Stuart and Wogan, 2012). Its habitat preference leads to the species frequently living close to human habitation (Johnson, 2007) and the species was considered a major source of snakebite accidents and deaths (Wüster, 1998; O'Shea, 2008). O'Shea (2008) reported clutch sizes of 8-45 eggs, and Chaitae (2011) estimated that a female may breed on average every 2.8 years.
Range countries were reported to include Thailand, northern Peninsular Malaysia, north-eastern India, southern China, Myanmar, Lao People’s Democratic Republic, Cambodia and Vietnam (Golay et al., 1993; Cox et al., 1998; Sang et al., 2009; Stuart and Wogan, 2012). Nepal was listed as a range country by Golay et al. (1993), O’Shea (2008) and Stuart and Wogan (2012), whereas Sang et al. (2009) considered its occurrence to be unconfirmed in the country. Golay et al. (1993) and Stuart and Wogan (2012) reported Bangladesh a range country and Wüster (1998) considered its occurrence in Bhutan to be probable.
N. kaouthia was categorised as Least Concern in the IUCN Red List, due to its wide distribution, tolerance of modified habitats and high abundance (Stuart and Wogan, 2012). The species was considered to be common throughout most of its range (Daniel, 1983; O'Shea and Halliday, 2002; Stuart and Wogan, 2012), although its population trend was considered to be decreasing, with “at least” localized population declines in the eastern parts of the species’ range reported; a lack of available information to assess whether the populations were undergoing a significant decline was noted (Stuart and Wogan, 2012).
Whilst noting that the species was used extensively as food, for medicinal purposes and in the skin trade, Stuart and Wogan (2012) reported no major threats. Auliya (2011) considered the trade in the

Naja kaouthia
16
species “not well understood” and noted that “it remains unclear if it may pose a threat to the survival of local populations”.
Thailand: Nabhitabhata and Chan-ard (2005) and Chanhome et al. (2011) reported N. kaouthia to occur in all provinces, while Cox et al. (1998) and Wüster (1998) found the species to be absent from northern Thailand and O'Shea and Halliday (2002) reported that its range was limited to southern Thailand.
In a study conducted in rice fields in central Thailand, Chaitae (2011) measured population densities of 96±48 adult N. kaouthia and 768±168 juvenile individuals per square kilometre. In areas in central and southern Thailand (Sukhothai, Angthong and Ayutthaya provinces) where the species was regularly harvested, average densities of 2.1-3.6 individuals per square kilometre were reported, based on a sample of 64 individuals (Anon., 2009).
Humphrey and Bain (1990) did not consider N. kaouthia to be threatened in Thailand but the species was categorised as ‘Vulnerable’ in the Thailand Red Data book in 2005 (Nabhitabhata and Chan-ard, 2005).
The species was reported to be harvested particularly in rice fields and abandoned agricultural areas within central and southern areas of Thailand (Anon, 2009; Chaitae, 2011). Chaitae (2011) noted that as the period of most intensive harvesting overlapped with the reproductive season, egg-laying females may be particularly vulnerable to harvesting. However, due to its relatively high reproductive output, high adult growth rates, broad distribution and wide prey base, the species was considered “probably able to withstand harvesting with appropriate management” in Thailand (Chaitae, 2011).
The species was reported to be used for food and medicinal purposes, as well as in skin trade and snake shows in Thailand (Anon., 2009). It was being bred in captivity for the production of antivenom (Chanhome et al., 2001).
N. kaouthia was not listed as a protected species in Thailand; however, the export of live individuals was reported to be prohibited (Chaitae, 2011; Chaweepak et al., 2011; SC50 Inf. 8), although illegal exports of live individuals were reported to occur (Chaitae, 2011).
At the 19th meeting of the Animals Committee in 2003, Naja spp. from Thailand was assessed as Category 1 (urgent concern); no response had been received from the country (AC19 Summary Report). A report by Thailand on trade in Naja spp. (including N. kaouthia) presented at the 50th meeting of the Standing Committee in 2004 emphasized that the export of Naja spp. was regulated at border checkpoints and that steps had been taken to determine methods for quota-setting and non-detriment findings (SC50 Inf. 8). It was also suggested that a project would be undertaken by the CITES Management and Scientific Authorities to acquire scientific data on the status of populations of Naja spp. in the country (SC50 Inf. 8). On the basis of this information and agreeing to reduce their voluntary export quotas, Thailand was excluded from the Review of Significant Trade process at the 50th meeting of the Standing Committee in 2004 (AC21 Doc. 10.1.1 Rev.1).
The project report on the status of Naja spp. in Thailand in 2005-2006, as submitted to the CITES Secretariat in 2009, found that since the implementation of the ban on exports of live snakes and unprocessed skins in 1990, harvest volumes had decreased substantially, as had the number of people involved in snake harvest (Anon., 2009). Based on interviews with local traders, the levels of commercial domestic trade were estimated at 10 000-15 000 individuals of N. kaouthia per year (Anon., 2009). Results of a questionnaire survey showed that the majority of harvested Naja spp. (82 per cent) were used for local food consumption, with skins of the species commonly obtained from local restaurants, or, less frequently, from individuals used in snake shows (Anon., 2009). Anon. (2009) considered that the levels of harvest could be sustainable.
The country report presented at the CITES Asian Snake Trade Workshop in April 2011 suggested that ”a degree of sustainability may be accomplished” in the exploitation of N. kaouthia in Thailand (Chaweepak et al., 2011). Live snakes were found to achieve higher prices than skins, and the species was therefore not primarily harvested for its skin, with exported skins derived from domestic uses (Anon., 2009; Chaweepak et al., 2011). Individuals of more than 1 kg bodyweight were reported to achieve the highest prices (Anon., 2009).

Naja kaouthia
17
REFERENCES:
Anon. 2009. Field assessment of Cobra (Naja spp.) exploitation in Thailand. Report submitted to the CITES Secretariat.
Auliya, M. 2011. Biology and conservation of Asian snakes. CITES Asian Snake Trade Workshop, Guangzhou, China 11-14 April 2011. Background paper - Topic 1.
Chaitae, A. 2011, Demography of the Monocled cobra (Naja kaouthia) in the central region of Thailand, MSc thesis, Department of Biology, University of Louisville, Kentucky.
Chanhome, L., Cox, M. J., Vasaruchapong, T., Chaiyabutr, N., and Sitprija, V. 2011. Characterization of venomous snakes of Thailand. Asian Biomedicine, 5 (3): 311-328.
Chanhome, L., Jintakune, P., Wilde, H., and Cox, M. J. 2001. Venomous snake husbandry in Thailand. Wilderness and Environmental Medicine, 12: 17-23.
Chaweepak, S., La-ong, S., and Khanha, N. 2011. Country report of Thailand. CITES Asian snake trade workshop, Guangzhou (China), 11-14 April 2011.
Cox, M. J. 1991. The snakes of Thailand and their husbandry. Krieger Publishing Company, Florida, U.S.A. Cox, M. J., van Dijk, P. P., Nabhitabhata, J., and Thirakhupt, K. 1998. A photographic guide to snakes and
other reptiles of Peninsular Malaysia, Singapore and Thailand. New Holland, London, UK. 144 pp. Daniel, J. C. 1983. The book of Indian reptiles. Bombay Natural History Society, Oxford University Press. Golay, P., Smith, H. M., Broadley, D. G., Dixon, J. R., McCarthy, C., Rage, J. C., Schätti, B., and Toriba, M.
1993. Endoglyphs and other major venomous snakes of the world - a checklist. Azemiops S.A., Herpetological Data Center, Geneva, Switzerland.
Humphrey, S. R. and Bain, J. R. 1990. Endangered animals of Thailand. Sandhill Crane Pr. Johnson, S. A. 2007. Cobras. Lerner Publications Company, Minneapolis, U.S.A. Nabhitabhata, J. and Chan-ard, T. 2005. Thailand Red Data: mammals, reptiles and amphibians. Office of
Natural Resources and Environmental Policy and Planning, Bangkok, Thailand. 234 pp. O'Shea, M. 2008. Venomous snakes of the world. New Holland Publishers Ltd. O'Shea, M. and Halliday, T. 2002. Reptiles and amphibians. Dorling Kindersley Ltd, London. 256 pp. Sang, N. V., Cuc, H. T., and Truong, N. Q. 2009. Herpetofauna of Vietnam. Edition Chimaira, Frankfurt am
Main. Stuart, B. and Wogan, G. 2012. Naja kaouthia. In: IUCN 2012. IUCN Red List of Threatened Species.
Version 2012.1 URL: www.iucnredlist.org Accessed: 15-10-2012. Wüster, W. 1996. Taxonomic changes and toxicology: systematic revisions of the Asiatic cobras (Naja
naja species complex). Toxicon, 34 (4): 399-406. Wüster, W. 1998. The cobras of the genus Naja in India. Hamadryad, 23 (1): 15-32. Wüster, W. and Thorpe, R. S. 1992. Asiatic cobras: Population systematics of the Naja naja species
complex (Serpentes: Elapidae) in India and central Asia. Herpetologica, 48 (1): 69-85. Wüster, W., Thorpe, R. S., Cox, M. J., Jintakune, P., and Nabhitabhata, J. 1995. Population systematics of
the snake genus Naja (Reptilia, Serpentes, Elapidae) in Indo-China - multivariate morphometrics and comparative mitochondrial-DNA sequencing (Cytochrome-Oxidase-I). Journal of Evolutionary Biology, 8 (4): 493-510.

Python reticulatus
18
REVIEW OF SPECIES SELECTED ON THE BASIS OF THE 2010 ANALYSIS OF EU ANNUAL REPORTS
REPTILIA PYTHONIDAE
SPECIES: Python reticulatus
SYNONYMS: Boa phrygia, Boa reticulata, Boa rhombeata, Broghammerus reticulatus, Broghammerus reticulatus, Coluber javanicus, Morelia reticulatus, Python schneideri
COMMON NAMES: Netpython (Dutch), Java Rock Python (English), Regal Python (English), Reticulated Python (English), Python réticulé (French), Pitón reticulada (Spanish), Nätpyton (Swedish)
RANGE STATES: Bangladesh, Brunei Darussalam, Cambodia, India, Indonesia, Lao People's Democratic Republic, Malaysia, Myanmar, Philippines, Singapore, Thailand, Vietnam
RANGE STATE UNDER REVIEW: Indonesia, Vietnam
IUCN RED LIST: Not evaluated
PREVIOUS EC OPINIONS: Current positive opinion for wild specimens from Indonesia first formed on 07/11/2000 and last confirmed on 29/02/2008. Previous negative opinion for wild specimens from Indonesia formed on 22/02/2000.
Current Article 4.6 (b) import suspension for wild specimens from Peninsular Malaysia first applied on 30/04/2004 and last confirmed on 10/09/2012. Previous negative opinion for wild specimens from Peninsular Malaysia formed on 05/09/2002.
Previous Article 4.6 (b) import suspension for wild specimens from Bangladesh and Cambodia first applied on 22/12/1997 and removed on 24/09/2000.
Previous Article 4.6 (b) import suspension for wild specimens from India first applied on 22/12/1997 and removed on 07/09/2011.
Previous Article 4.6 (b) import suspension for wild specimens from Singapore first applied on 22/12/1997 and removed on 07/09/2011.

Python reticulatus
19
TRADE PATTERNS:
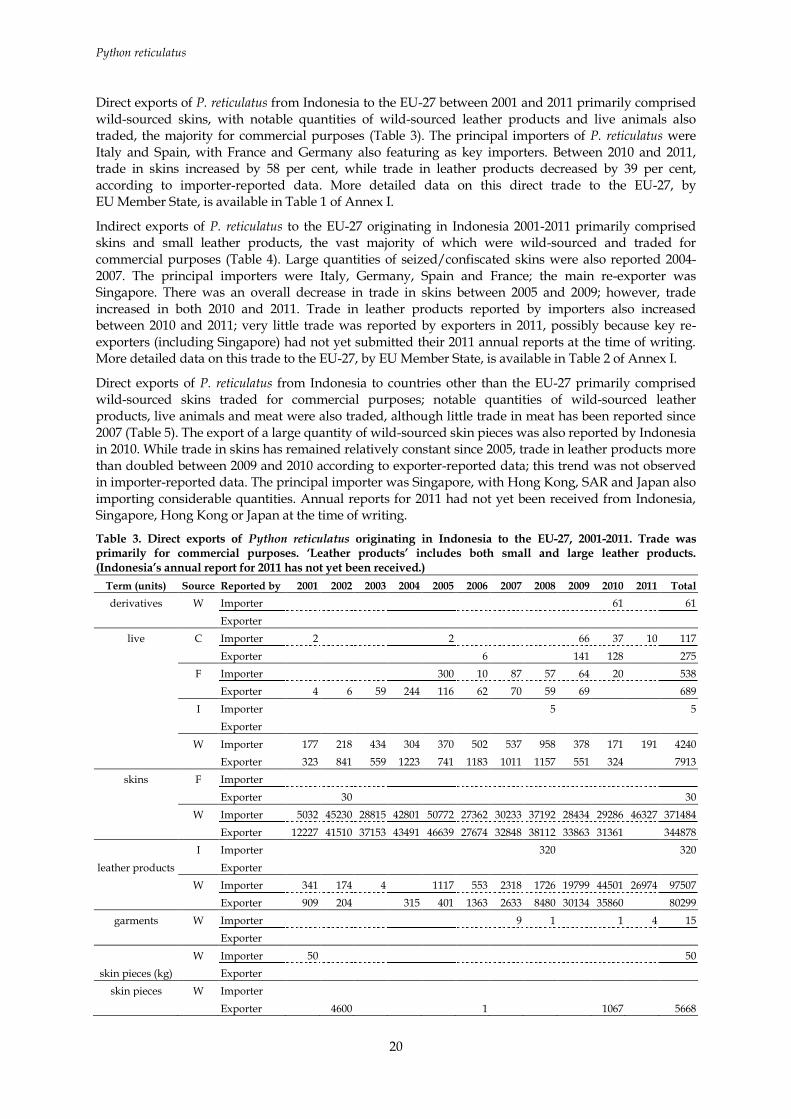
Python reticulatus from Indonesia and Vietnam was selected on the basis of high volume of trade, with trade levels increasing by 64 per cent between 2009 and 2010.
Indonesia: Indonesia published annual export quotas for wild-sourced Python reticulatus (live and skins) every year 2001-2011; the skin quotas published 2005-2011 also include skin products (Tables 1, 2). Indonesia has not published export quotas for 2012. According to trade data reported by Indonesia, Indonesia appears to have exceeded its quota for wild-sourced live animals in both 2004 and 2008, by 387 and 99 pythons, respectively (Table 1). The quotas were not exceeded according to importer-reported data. However, since Indonesia reports on actual trade, the discrepancy may reflect a lack of submission of annual reports from importers in those years. The format of the export permits recorded in Indonesia’s 2004 and 2008 annual reports suggest that the discrepancies are not due to year-end trade. Indonesia’s annual report for 2011 has not yet been received.
Table 1. CITES export quotas for live, wild-sourced Python reticulatus from Indonesia, and global direct exports as reported by the importers and exporter, 2001-2011. (Indonesia’s annual report for 2011 has not yet been received.)
2001 2002 2003 2004 2005 2006 2007 2008 2009 2010 2011
Quota 4500 4500 5000 4500 4500 4500 4500 4500 4500 4500 4500
Importer-reported 1430 2092 1778 1732 1988 2074 2111 1647 1246 540 191
Exporter-reported 3842 4425 3901 4887 4272 3869 4353 4599 3816 2912
According to exporter-reported data, the quota for wild-sourced skins (including skin products from 2005 onwards) appears to have been exceeded every year 2005-2010, and according to importer-reported data in 2005 and 2008-2011 (Table 2). However, in its annual reports, Indonesia reports leather products (and occasionally skin pieces) with two quantities: one quantity representing the number of leather products/skin pieces traded, which is the quantity that is entered into the CITES Trade Database; and one quantity representing the number of skins that the products/pieces were derived from. If the latter quantities are added together with the number of raw skins reported by Indonesia, the totals do not exceed the 2005-2009 quotas. The 2010 quota would still be exceeded by 400 units; however, in 2010 Indonesia recorded 400 skin pieces with a comment “waste from snake skin processing, no quota allocated”. If these 400 skin pieces are excluded, the 2010 quota would not be exceeded either.
Table 2. CITES export quotas for wild-sourced Python reticulatus skins and skin products from Indonesia, and global direct exports as reported by the importers and exporter, 2001-2011. Figures in brackets represent trade in terms not included in the quota; figures do not include skins and skin pieces reported by length or weight. (Indonesia’s annual report for 2011 has not yet been received.)
2001 2002 2003 2004 2005 2006 2007 2008 2009 2010 2011
Quota for skins 157500 157500 157000 157500 - - - - - - -
Quota for skins and skin products - - - - 157500 157500 157500 157500 157500 157500 157500
Term skins Importer 36054 71374 54271 77327 165924 147212 140523 156340 153753 137954 142074
Exporter 155330 161408 153062 151479 152180 151425 154703 154655 154955 152997
skin
pieces
Importer (34)
(115) (69)
142 25 151
Exporter
(4600)
1 2
80817
small leather
products
Importer (766) (1324) (647) (9448) 3131 7409 14365 2509 21678 50319 26808
Exporter (9492) (7159) (3641) (9256) 7588 10430 18531 14426 36649 52601
large leather
products
Importer (335)
(4) 139 432 627 100 84 200 166
Exporter
garments Importer
1
9 1
70 4
Exporter
Total skins Importer 36054 71374 54271 77327 - - - - - - -
Exporter 155330 161408 153062 151479 - - - - - -
skins and skin
products
Importer - - - - 169195 155053 155524 159092 175540 188694 169052
Exporter - - - - 159768 161856 173236 169081 191604 286415
Python reticulatus
20
Direct exports of P. reticulatus from Indonesia to the EU-27 between 2001 and 2011 primarily comprised wild-sourced skins, with notable quantities of wild-sourced leather products and live animals also traded, the majority for commercial purposes (Table 3). The principal importers of P. reticulatus were Italy and Spain, with France and Germany also featuring as key importers. Between 2010 and 2011, trade in skins increased by 58 per cent, while trade in leather products decreased by 39 per cent, according to importer-reported data. More detailed data on this direct trade to the EU-27, by EU Member State, is available in Table 1 of Annex I.
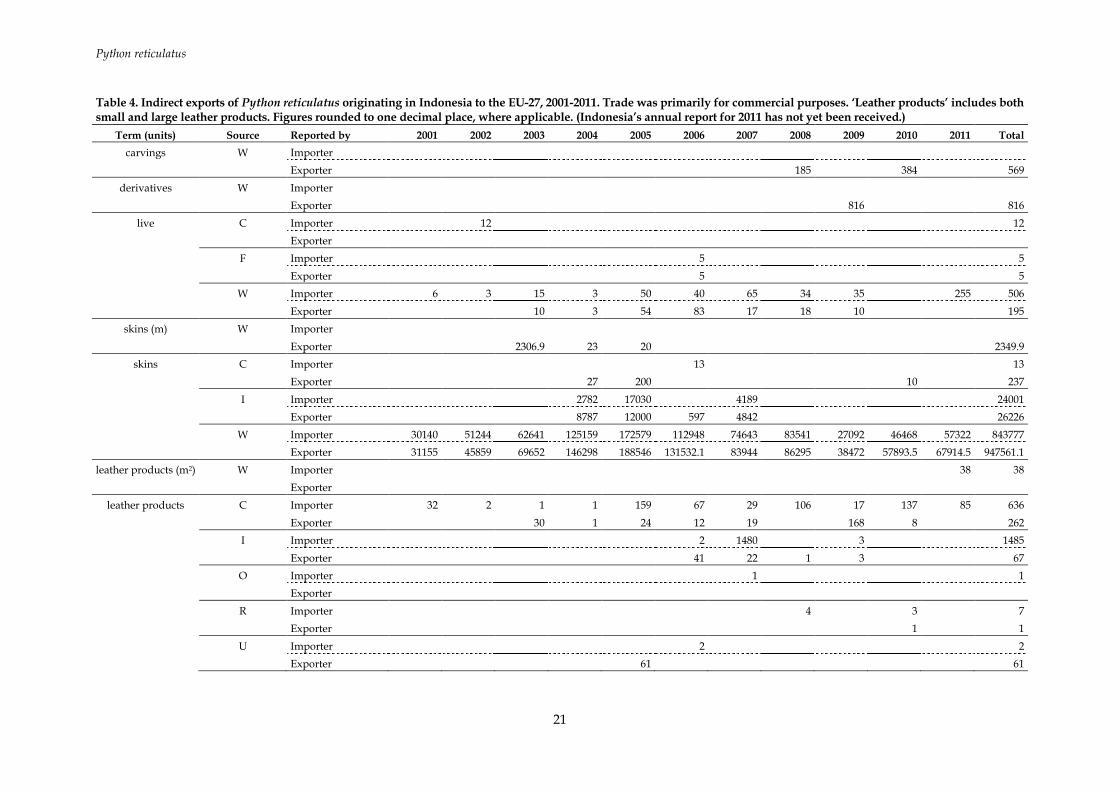
Indirect exports of P. reticulatus to the EU-27 originating in Indonesia 2001-2011 primarily comprised skins and small leather products, the vast majority of which were wild-sourced and traded for commercial purposes (Table 4). Large quantities of seized/confiscated skins were also reported 2004-2007. The principal importers were Italy, Germany, Spain and France; the main re-exporter was Singapore. There was an overall decrease in trade in skins between 2005 and 2009; however, trade increased in both 2010 and 2011. Trade in leather products reported by importers also increased between 2010 and 2011; very little trade was reported by exporters in 2011, possibly because key re-exporters (including Singapore) had not yet submitted their 2011 annual reports at the time of writing. More detailed data on this trade to the EU-27, by EU Member State, is available in Table 2 of Annex I.
Direct exports of P. reticulatus from Indonesia to countries other than the EU-27 primarily comprised wild-sourced skins traded for commercial purposes; notable quantities of wild-sourced leather products, live animals and meat were also traded, although little trade in meat has been reported since 2007 (Table 5). The export of a large quantity of wild-sourced skin pieces was also reported by Indonesia in 2010. While trade in skins has remained relatively constant since 2005, trade in leather products more than doubled between 2009 and 2010 according to exporter-reported data; this trend was not observed in importer-reported data. The principal importer was Singapore, with Hong Kong, SAR and Japan also importing considerable quantities. Annual reports for 2011 had not yet been received from Indonesia, Singapore, Hong Kong or Japan at the time of writing.
Table 3. Direct exports of Python reticulatus originating in Indonesia to the EU-27, 2001-2011. Trade was primarily for commercial purposes. ‘Leather products’ includes both small and large leather products. (Indonesia’s annual report for 2011 has not yet been received.)
Term (units) Source Reported by 2001 2002 2003 2004 2005 2006 2007 2008 2009 2010 2011 Total
derivatives W Importer
61
61
Exporter
live C Importer 2
2
66 37 10 117
Exporter
6
141 128
275
F Importer
300 10 87 57 64 20
538
Exporter 4 6 59 244 116 62 70 59 69
689
I Importer
5
5
Exporter
W Importer 177 218 434 304 370 502 537 958 378 171 191 4240
Exporter 323 841 559 1223 741 1183 1011 1157 551 324
7913
skins F Importer
Exporter
30
30
W Importer 5032 45230 28815 42801 50772 27362 30233 37192 28434 29286 46327 371484
Exporter 12227 41510 37153 43491 46639 27674 32848 38112 33863 31361
344878
leather products
I Importer
320
320
Exporter
W Importer 341 174 4
1117 553 2318 1726 19799 44501 26974 97507
Exporter 909 204
315 401 1363 2633 8480 30134 35860
80299
garments W Importer
9 1
1 4 15
Exporter
skin pieces (kg)
W Importer 50
50
Exporter
skin pieces W Importer
Exporter
4600
1
1067
5668
Python reticulatus
21
Table 4. Indirect exports of Python reticulatus originating in Indonesia to the EU-27, 2001-2011. Trade was primarily for commercial purposes. ‘Leather products’ includes both small and large leather products. Figures rounded to one decimal place, where applicable. (Indonesia’s annual report for 2011 has not yet been received.)
Term (units) Source Reported by 2001 2002 2003 2004 2005 2006 2007 2008 2009 2010 2011 Total
carvings W Importer
Exporter
185
384
569
derivatives W Importer
Exporter
816
816
live C Importer
12
12
Exporter
F Importer
5
5
Exporter
5
5
W Importer 6 3 15 3 50 40 65 34 35
255 506
Exporter
10 3 54 83 17 18 10
195
skins (m) W Importer
Exporter
2306.9 23 20
2349.9
skins C Importer
13
13
Exporter
27 200
10
237
I Importer
2782 17030
4189
24001
Exporter
8787 12000 597 4842
26226
W Importer 30140 51244 62641 125159 172579 112948 74643 83541 27092 46468 57322 843777
Exporter 31155 45859 69652 146298 188546 131532.1 83944 86295 38472 57893.5 67914.5 947561.1
leather products (m2) W Importer
38 38
Exporter
leather products C Importer 32 2 1 1 159 67 29 106 17 137 85 636
Exporter
30 1 24 12 19
168 8
262
I Importer
2 1480
3
1485
Exporter
41 22 1 3
67
O Importer
1
1
Exporter
R Importer
4
3
7
Exporter
1
1
U Importer
2
2
Exporter
61
61
Python reticulatus
22
Term (units) Source Reported by 2001 2002 2003 2004 2005 2006 2007 2008 2009 2010 2011 Total
W Importer 1925 4601 8302 5820 10631 7781 13348 16004 16177 11437 15274 111300
Exporter 3271 1364 9130 5741 10226 10557 17400 17183 13685 13352 98 102007
- Importer
46 3 4 1 6 3 2 3 198 118 384
Exporter
garments C Importer
1
1
Exporter
I Importer
11
11
Exporter
4
4
R Importer
Exporter
2
28
3
33
W Importer 23
13 10 33 840 273 52 18 57 21 1340
Exporter 14
61 86 87 111 374 89 94
916
skin pieces (kg) W Importer
2.5
2.5
Exporter
skin pieces C Importer
Exporter
2
2
W Importer 25
8 1200 1968 1 64 18 332 3616
Exporter
469 23
2000 43 150 100 6 2791
Subtotals skins Importer 30140 51244 62641 127941 189609 112961 78832 83541 27092 46468 57322 867791
Exporter 31155 45859 69652 155112 200746 132129.1 88786 86295 38472 57903.5 67914.5 974024.1
leather products Importer 1957 4649 8306 5825 10791 7858 14861 16116 16200 11775 15477 113815
Exporter 3271 1364 9160 5742 10311 10610 17441 17184 13856 13361 98 102398

Python reticulatus
23
Table 5. Direct exports of Python reticulatus originating in Indonesia to countries other than the EU-27, 2001-2011. Trade was primarily for commercial purposes. ‘Leather
products’ includes both small and large leather products. Figures rounded to one decimal place, where applicable. (Indonesia’s annual report for 2011 has not yet been
received.)
Term (units) Source Reported by 2001 2002 2003 2004 2005 2006 2007 2008 2009 2010 2011 Total
bodies W Importer
10
10
Exporter
derivatives (kg) W Importer
Exporter
160
160
gall (kg) W Importer
65
65
Exporter
90 150 100 109
449
gall W Importer
40
40
Exporter
30
30
gall bladders W Importer
150
150
Exporter
live C Importer 15
23 50
8 78 19
193
Exporter
27
275 128
430
F Importer
13
121 187 139
38 63
561
Exporter
71 70 702 772 278 133 577 70 159
2832
W Importer 1253 1874 1344 1428 1618 1572 1574 689 868 369
12589
Exporter 3519 3584 3342 3664 3531 2686 3342 3442 3265 2588
32963
skins (m) W Importer
1100
1100
Exporter
skins C Importer 30
30
Exporter
300
300
I Importer
4080
4080
Exporter
W Importer 31022 26144 25456 34526 115152 119850 110290 119148 125319 108668 95747 911322
Exporter 143103 119898 115909 107988 105541 123751 121855 116543 121092 121636
1197316
leather products C Importer
134 36 12
182
Exporter
F Importer
12 11
23
Exporter
I Importer 3
557
6 229 20 134
949
Exporter
R Importer
4
4
Exporter
W Importer 760 1150 643 9452 2153 7288 12674 882.5 1963 6018
42983.5
Python reticulatus
24
Term (units) Source Reported by 2001 2002 2003 2004 2005 2006 2007 2008 2009 2010 2011 Total
Exporter 8583 6955 3641 8941 7187 9067 15898 5946 6515 15595
88328
- Importer
1278
1278
Exporter
meat (kg) W Importer 3000 6000 13230 20240 28470 15327.2 16730
102997.2
Exporter
19500 26250 31000 15750 12150
4000
108650
meat W Importer
500
500
Exporter
5000
2000
7000
garments W Importer
1
69
70
Exporter
skin pieces (kg) W Importer
210
210
Exporter
skin pieces (m) W Importer
Exporter 250
250
skin pieces C Importer
8
8
Exporter
I Importer
52
52
Exporter
W Importer 34
115 69
142 25 151
536
Exporter
2
79350
79352
skin scraps W Importer
Exporter
400
400
skulls W Importer
13
13
Exporter
specimens (kg) W Importer
35
35
Exporter
specimens W Importer
Exporter
145
145
Python reticulatus
25
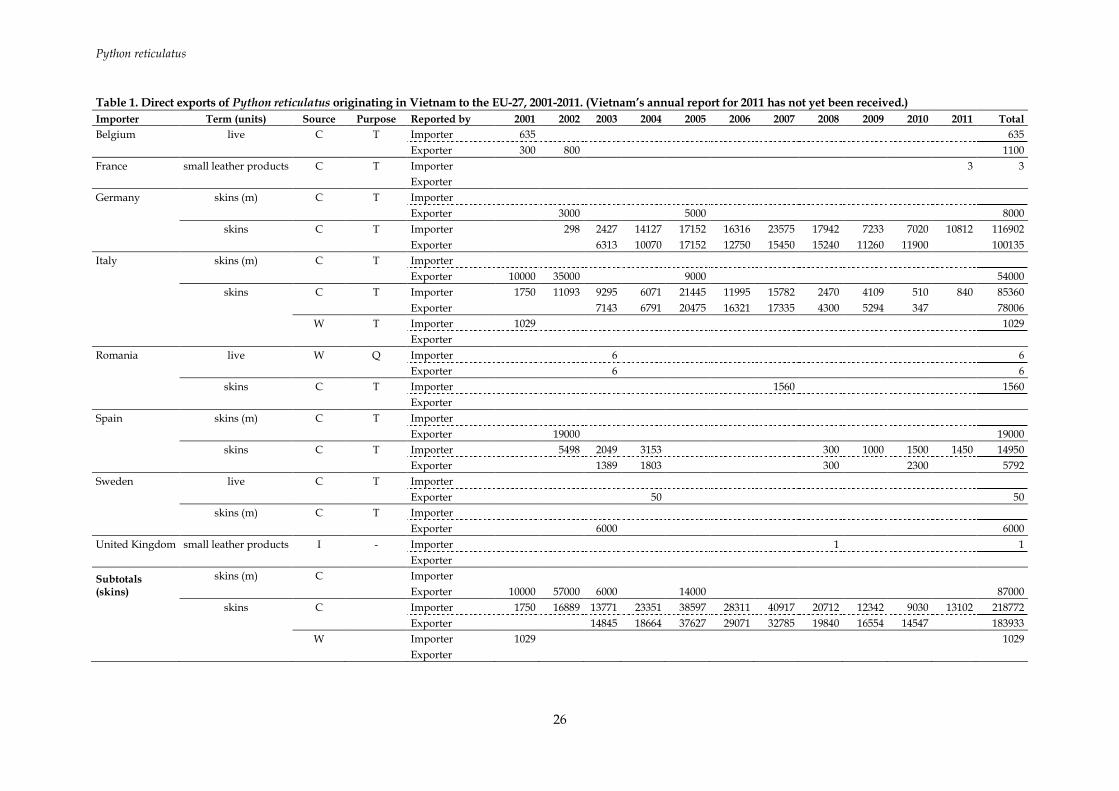
Vietnam: Vietnam has not published any export quotas for Python reticulatus. Direct exports of P. reticulatus from Vietnam to the EU-27 2001-2011 primarily comprised skins, the majority of which were captive-bred and traded for commercial purposes (Table 1). Trade in skins showed an overall decrease 2007-2010; however, importer-reported trade in skins increased by 45 per cent between 2010 and 2011. Vietnam had not yet submitted an annual report for 2011 at the time of writing.
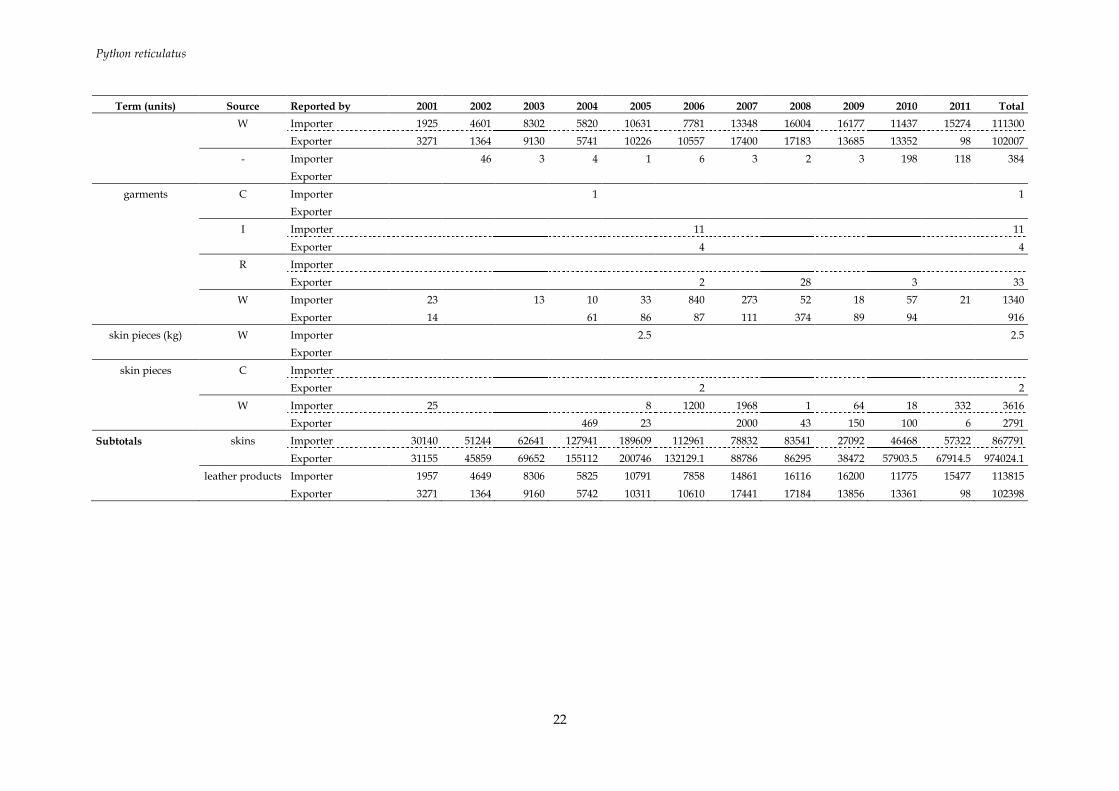
Indirect exports of P. reticulatus to the EU-27 originating in Vietnam 2001-2011 principally consisted of captive-bred leather products and skins, the majority of which were traded for commercial purposes (Table 2). Notable quantities of wild-sourced leather products and skins were also traded, although trade in wild-sourced skins decreased considerably from 2005 onwards. Small quantities of leather products and garments were reported as seizures/confiscations in 2008 and 2009. The principal importers were Germany, Italy, France and Spain; the major re-exporter was Singapore, with Malaysia and Switzerland also featuring as key re-exporters. Total trade in skins decreased between 2010 and 2011, while trade in leather products increased according to importer-reported data, following an overall increasing trend from 2004 onwards. The small quantity of exporter-reported trade in leather products in 2011 is likely to reflect lack of submission of annual reports by key re-exporters (including Singapore) at the time of writing. More detailed data on this indirect trade to the EU-27, by EU Member State, is available in Table 3 of Annex I.
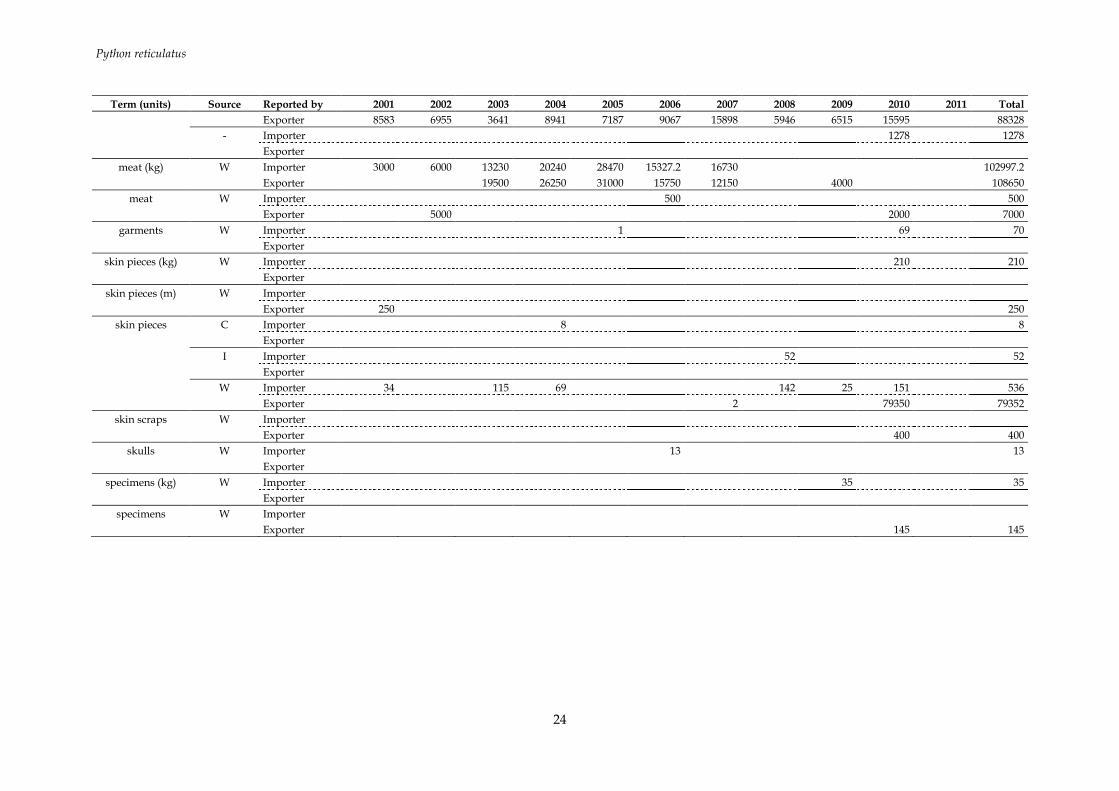
Direct exports of P. reticulatus from Vietnam to countries other than the EU-27 2001-2011 principally comprised captive-bred skins; notable quantities of leather products were also traded, the majority of which were captive-bred with smaller quantities wild-sourced (Table 3). Trade was primarily for commercial purposes. The principal importer was Singapore, with Japan and Malaysia also importing a large proportion of trade. There has been an overall increase in trade in skins from 2005 onwards, while trade in leather products has decreased from 2007 onwards.
Python reticulatus
26
Table 1. Direct exports of Python reticulatus originating in Vietnam to the EU-27, 2001-2011. (Vietnam’s annual report for 2011 has not yet been received.)
Importer Term (units) Source Purpose Reported by 2001 2002 2003 2004 2005 2006 2007 2008 2009 2010 2011 Total
Belgium live C T Importer 635
635
Exporter 300 800
1100
France small leather products C T Importer
3 3
Exporter
Germany skins (m) C T Importer
Exporter
3000
5000
8000
skins C T Importer
298 2427 14127 17152 16316 23575 17942 7233 7020 10812 116902
Exporter
6313 10070 17152 12750 15450 15240 11260 11900
100135
Italy skins (m) C T Importer
Exporter 10000 35000
9000
54000
skins C T Importer 1750 11093 9295 6071 21445 11995 15782 2470 4109 510 840 85360
Exporter
7143 6791 20475 16321 17335 4300 5294 347
78006
W T Importer 1029
1029
Exporter
Romania live W Q Importer
6
6
Exporter
6
6
skins C T Importer
1560
1560
Exporter
Spain skins (m) C T Importer
Exporter
19000
19000
skins C T Importer
5498 2049 3153
300 1000 1500 1450 14950
Exporter
1389 1803
300
2300
5792
Sweden live C T Importer
Exporter
50
50
skins (m) C T Importer
Exporter
6000
6000
United Kingdom small leather products I - Importer
1
1
Exporter
Subtotals (skins)
skins (m) C
Importer
Exporter 10000 57000 6000
14000
87000
skins C
Importer 1750 16889 13771 23351 38597 28311 40917 20712 12342 9030 13102 218772
Exporter
14845 18664 37627 29071 32785 19840 16554 14547
183933
W
Importer 1029
1029
Exporter
Python reticulatus
27
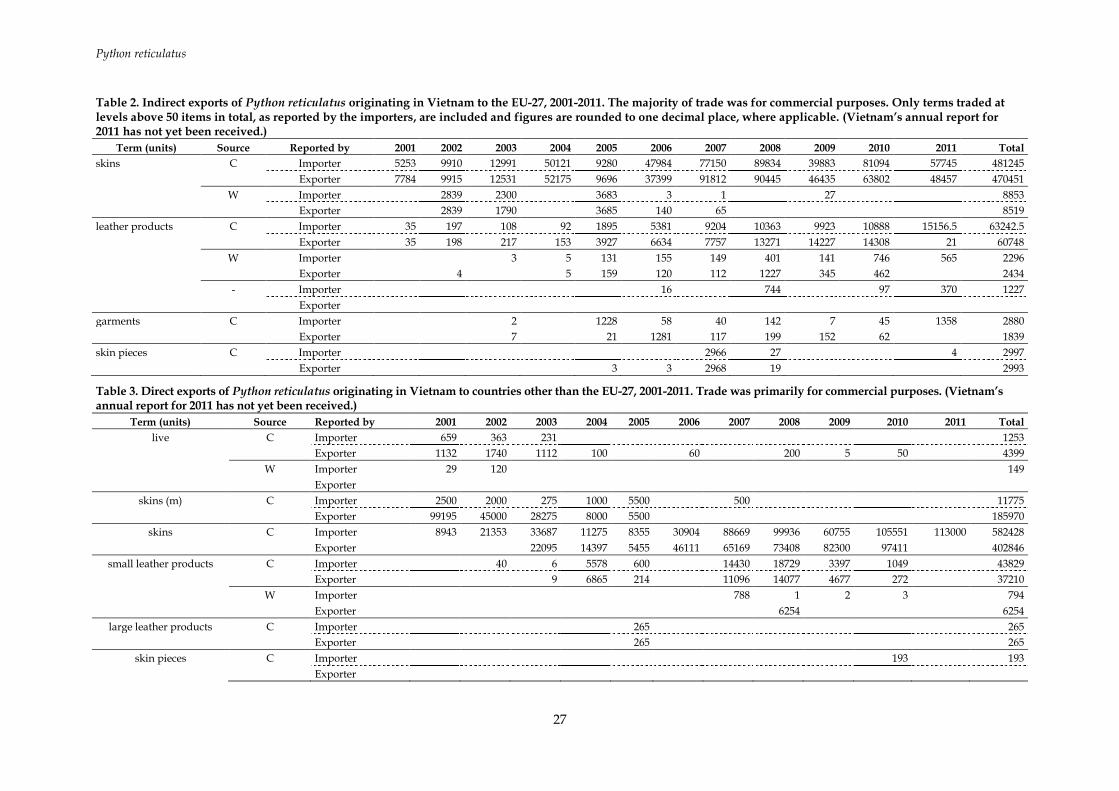
Table 2. Indirect exports of Python reticulatus originating in Vietnam to the EU-27, 2001-2011. The majority of trade was for commercial purposes. Only terms traded at levels above 50 items in total, as reported by the importers, are included and figures are rounded to one decimal place, where applicable. (Vietnam’s annual report for 2011 has not yet been received.)
Term (units) Source Reported by 2001 2002 2003 2004 2005 2006 2007 2008 2009 2010 2011 Total
skins C Importer 5253 9910 12991 50121 9280 47984 77150 89834 39883 81094 57745 481245
Exporter 7784 9915 12531 52175 9696 37399 91812 90445 46435 63802 48457 470451
W Importer
2839 2300
3683 3 1
27
8853
Exporter
2839 1790
3685 140 65
8519
leather products C Importer 35 197 108 92 1895 5381 9204 10363 9923 10888 15156.5 63242.5
Exporter 35 198 217 153 3927 6634 7757 13271 14227 14308 21 60748
W Importer
3 5 131 155 149 401 141 746 565 2296
Exporter
4
5 159 120 112 1227 345 462
2434
- Importer
16
744
97 370 1227
Exporter
garments C Importer
2
1228 58 40 142 7 45 1358 2880
Exporter
7
21 1281 117 199 152 62
1839
skin pieces C Importer
2966 27
4 2997
Exporter
3 3 2968 19
2993
Table 3. Direct exports of Python reticulatus originating in Vietnam to countries other than the EU-27, 2001-2011. Trade was primarily for commercial purposes. (Vietnam’s annual report for 2011 has not yet been received.)
Term (units) Source Reported by 2001 2002 2003 2004 2005 2006 2007 2008 2009 2010 2011 Total
live C Importer 659 363 231
1253
Exporter 1132 1740 1112 100
60
200 5 50
4399
W Importer 29 120
149
Exporter
skins (m) C Importer 2500 2000 275 1000 5500
500
11775
Exporter 99195 45000 28275 8000 5500
185970
skins C Importer 8943 21353 33687 11275 8355 30904 88669 99936 60755 105551 113000 582428
Exporter
22095 14397 5455 46111 65169 73408 82300 97411
402846
small leather products C Importer
40 6 5578 600
14430 18729 3397 1049
43829
Exporter
9 6865 214
11096 14077 4677 272
37210
W Importer
788 1 2 3
794
Exporter
6254
6254
large leather products C Importer
265
265
Exporter
265
265
skin pieces C Importer
193
193
Exporter
Python reticulatus
28
Term (units) Source Reported by 2001 2002 2003 2004 2005 2006 2007 2008 2009 2010 2011 Total
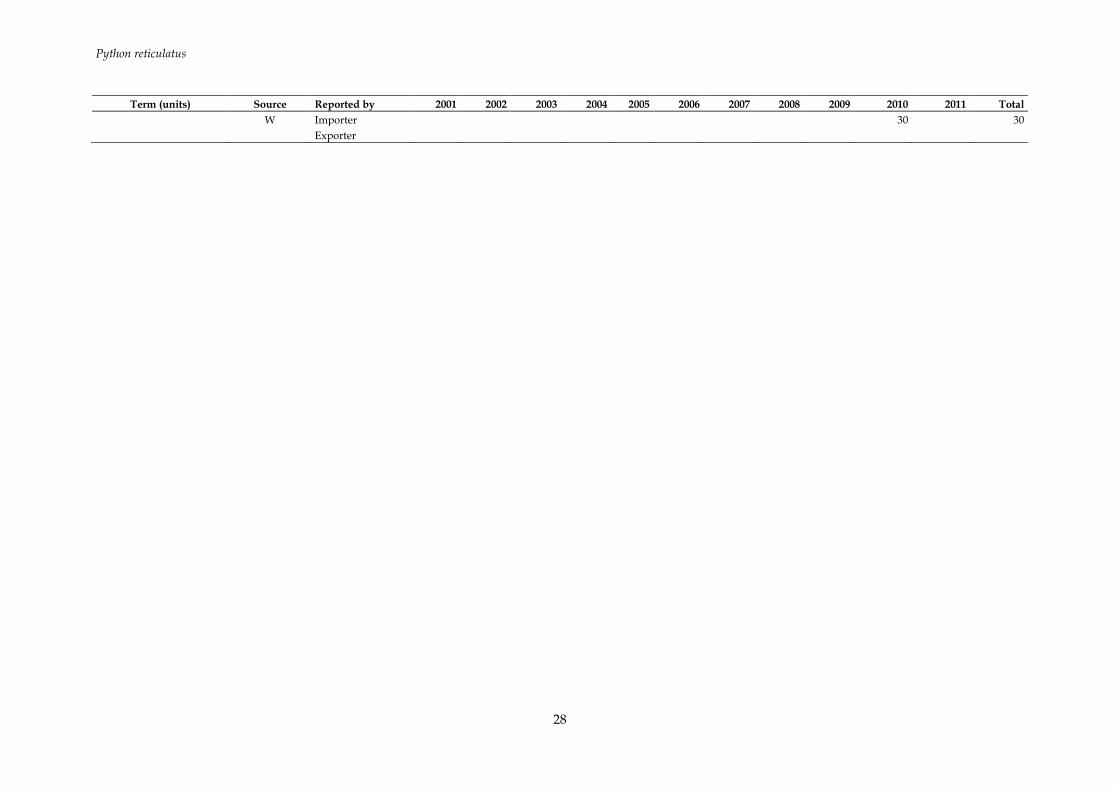
W Importer
30
30
Exporter
Python reticulatus
29
TAXONOMIC NOTE
Auliya et al. (2002) called for clarification of the taxonomic status of Python reticulatus and suggested that two morphologically and genetically distinct subspecies occurred in Indonesia, P. r. jampeanus and P. r. saputrai. Sang et al. (2009) reported three subspecies: P. r. jampeanus, P. r. reticulatus and P. r. supatrai.
CONSERVATION STATUS in range states
Python reticulatus is a Southeast Asian snake species, typically associated with humid forests, but also found in cultivated areas and near human habitation (Hvass, 1975; Cox et al., 1998). Clutch sizes of 10-100 eggs were reported by Stidworthy (1969), increasing with the size and age of the female (Groombridge and Luxmoore, 1991).
The species’ range was reported to reach from Assam (northeast India) to eastern parts of Indonesia and the Philippines (O'Shea, 2007), covering Nicobar Islands, Myanmar, Thailand, Laos, Cambodia, Vietnam, Malaysia, Indonesia and the Indo-Australian Archipelago (McDiarmid et al., 1999). Stidworthy (1969) considered the range to be narrower, from Thailand south to the Malay Archipelago and the Philippines, and Groombridge and Luxmoore (1991) regarded the occurrence in India as possible.
Groombridge and Luxmoore (1991) considered its population status poorly known, but noted that many populations may be locally depleted.
The main threats to P. reticulatus were reported to include habitat alteration and exploitation (Groombridge and Luxmoore, 1991). Based on surveys conducted in West Kalimantan, Auliya (2006) suggested that the species may be highly dependent on thickly vegetated fringe habitats associated with cultivated areas and that the conversion of land to monocultures may threaten populations. The skins of P. reticulatus were reported to be in high demand by the leather industry (Shine et al., 1999), but the species was considered relatively tolerant to high rates of exploitation due to its generalist habitat requirements, rapid growth, early maturation, high reproductive rates, nocturnal habits and remote distribution of populations (Shine et al., 1999; ITC, TRAFFIC and IUCN, 2012). However, a review of Southeast Asian trade in Python spp. raised concerns over the volume of illegal trade in pythons, suggesting that it may equal the volume in legal trade (ITC, TRAFFIC and IUCN, 2012). Skins of Python spp. were reported to be smuggled with other shipments, mixed with legally sourced skins through stockpiling, or exported with misreported quantity, origin or source (ITC, TRAFFIC and IUCN, 2012). Furthermore, laundering of wild-sourced P. reticulatus as captive-bred was also considered a potential problem (ITC, TRAFFIC and IUCN, 2012). The production of large snakes in captivity on a commercial scale was considered to be uneconomic (Webb et al. 2011) and the cost of rearing P. reticulatus to a suitable size for the skin market (breeding, feeding and maintaining skins) appeared to surpass prices achieved on the market (ITC, TRAFFIC and IUCN, 2012).
P. reticulatus was identified as a possible candidate for the CITES Review of Significant Trade at the 20th meeting of the Animals Committee in 2004 (TRAFFIC and IUCN/SSC Wildlife Trade Programme, 2004). A full review was however not considered necessary, as studies indicated that it was capable of tolerating the high levels of exploitation, and Indonesia had set quotas to control skin trade (TRAFFIC and IUCN/SSC Wildlife Trade Programme, 2004). The species was selected for the Review of Significant trade at the 25th meeting of the Animals Committee (AC26 Doc. 12.3) and it was retained in the process for a number of countries, including Indonesia and Vietnam at the 26th meeting of the Animals Committee (AC26 Summary Record).
Indonesia: Groombridge and Luxmoore (1991) considered P. reticulatus to be widespread in Indonesia, with the exception of New Guinea. Auliya (2006) reported occurrence in Sumatra and associated islands, Sulawesi and offshore islands, Lesser Sundas, West and east Kalimantan and offshore islands, Java (including Jakarta) and associated islands, Molucca islands, and Papua (unconfirmed records).
Indonesia was considered to be the most important supplier of Python spp. skins for the world market (Auliya, 2006; ITC, TRAFFIC and IUCN, 2012). The species is reportedly caught in rural areas, forests and near water for the skin trade (Groombridge and Luxmoore, 1991; Shine et al., 1999; Auliya, 2006). Shine et al. (1999) reported that even when not being caught for the skin trade, most P. reticulatus encountered by local people in Sumatra were killed for its meat or because they are considered nuisance
Python reticulatus
30
animals. Shepherd et al. (2004) found that in Sumatra small individuals were caught for the pet trade, but noted that the profit made from catching large individuals for the skin trade was much higher.
Groombridge and Luxmoore (1991) reported local population depletions caused by harvest. They noted that “in Indonesia, traders generally report little decrease in the availability of P. reticulatus skins, but to some extent this is because the area in which snakes are captured is continually expanding, and more people are involved in collecting” (Groombridge and Luxmoore, 1991). Shine et al. (1999) studied the harvest of P. reticulatus in northern and southern Sumatra and concluded that commercial skin trade was unlikely to significantly threaten the populations within the country, although local extirpations may occur. However, Luiselli et al. (2012) cautioned that the rapid increase in the quantity of P. reticulatus legally exported from Indonesia combined with the decrease in forest cover may indicate that current rates of harvest are not sustainable and need to be investigated. Harvesting was thought to potentially have significant impacts on populations in Indonesia, due to the large numbers killed before reaching sexual maturity (ITC, TRAFFIC and IUCN, 2012).
ITC, TRAFFIC and IUCN (2012) described the illegal trade in P. reticulatus in Indonesia as follows: “hunters, out of necessity for income, ignore quotas and continue to illegally harvest snakes throughout the year and sell them to slaughterhouses. In order to maintain good business relationships with slaughterhouses, traders continue to purchase skins even after the quota is met”. Shepherd et al. (2004) conducted monthly surveys of the wildlife markets in Medan (province of North Sumatra) between 1997 and 2001, noting that the P. reticulatus traded there were not included in the Indonesian quota system. It was recommended that Indonesia should monitor the stockpiling of skins, and possibly establish a tagging system to control the potential laundering of illegally sourced skins through stockpiling (ITC, TRAFFIC and IUCN 2012). There are reports of illegal trade in P. reticulatus skins from Indonesia via Singapore (TRAFFIC, 2011; ITC, TRAFFIC and IUCN, 2012). However, the Management Authority of Indonesia (2011) reported success in the monitoring of illegal snake trade between 2006 and 2010.
At the CITES Asian Snake Trade Workshop in 2011, the CITES Management Authority of Indonesia (2011) considered further research into the population status, control of habitat destruction and trade, and educational programmes to be important conservation needs of P. reticulatus in the country.
P. reticulatus is not protected in Indonesia (Government Regulation No. 7-1999 on the Preservation of Flora and Fauna), but harvesting within protected areas is prohibited (Management Authority of Indonesia, 2011). Annual quotas are set for the export of skins (Iskandar and Erdelen, 2006), which are set separately for each province and take into account the recommendations of the Scientific Authority and information on population size and trends, age and size class, where available (CITES Management Authority of Indonesia, 2011). Snake collectors and exporters need to be registered and licensed under the Directorate General of Forest Protection and Nature Conservation in order to apply for CITES export permits (Management Authority of Indonesia, 2011).
It was reported that P. reticulatus was not bred in captivity for the skin trade, due to high production costs (Management Authority of Indonesia, 2011).
Vietnam: Sang et al. (2009) recorded the species along the north central coast (provinces of Ha Tinh, Quang Binh and Thua Thien-Hue), south central coast (municipality of Da Nang city and provinces of Quang Nam, Binh Dinh and Kanh Hoa), central highlands (provinces of Kon Tum, Gia Lai and Dak Lak), southeastern Vietnam (provinces of Binh Phuoc, Ba Ria-Vung Tau and Dong Nai), south-western (province of Tay Ninh) and southern Vietnam (Ho Chi Minh City and the provinces of Long An, Kien Giang and Ca Mau).
The species was categorised as ‘Vulnerable’ in the Red Data Book of Vietnam in 1994 (Ministry of Science Technology and Environment, 1992), and it was reported to have been uplisted to ‘Critically Endangered’ in 2004 (WWF and TRAFFIC, 2012).
P. reticulatus was reported to be used as food and for medicinal purposes, as well as for its skin (Ministry of Science Technology and Environment, 1992; Venkataraman, 2007; Van and Tap, 2008). Thomson (2008) reported that the species was being bred for commercial purposes since the 1980s, possibly even before that. According to Van and Tap (2008), the species was successfully bred in captivity in several farms in southern Vietnam, with captive-bred specimens being traded for medicinal

Python reticulatus
31
purposes. Thomson (2008) reported that wild-sourced breeding animals were regularly obtained for local food markets. Captive breeding was reported to be mainly aimed at the skin trade market, primarily to Europe, although breeding stock, meat and derivatives were also marketed locally (Thomson, 2008). The price of captive-bred mature individuals was reported to have increased significantly in 2005 from USD 6.30 to USD 12.60 per kg due to the high demand of skins in the world market (Thomson, 2008).
However, concerns were raised over the high number of reportedly captive-bred individuals exported from Vietnam ITC, TRAFFIC and IUCN (2012), with operations breeding or ranching snakes in Vietnam requiring “thorough investigation” (Auliya, 2011). The authors pointed out that there was no evidence to prove that captive-breeding was economically viable, and noted that the CITES MA of Vietnam was unable to explain a discrepancy found between their export figures (40 000 individuals) and the figures reported to CITES (100 000 individuals). Illegally caught wild individuals were thought to potentially be exported from Indonesia and Malaysia, and re-exported from Singapore as captive-bred from Vietnam (ITC, TRAFFIC and IUCN 2012).
P. reticulatus is listed as a Group II species (valuable species which have small populations in the wild or which are at risk of extinction) under the Government Decree 32/2006/ND-CP (Government of Vietnam, 2006a). The Decree specifies that the species may only be exploited for scientific purposes or under licence in designated special use forests for projects approved by the Minister of Agriculture and Rural Development or the Provincial People’s Committee (Government of Vietnam, 2006a). All facilities breeding CITES-listed species must be registered and approved by the CITES Scientific Authority under Government Decree 82/2006/ND-CP, which implements CITES in the country (Government of Vietnam, 2006b).
REFERENCES:
Auliya, M., Mausfeld, P., Schmitz, A., and Böhme, W. 2002. Review of the reticulated python (Python reticulatus Schneider, 1801) with the description of new subspecies from Indonesia. Naturwissenschaften, 89: 201-213.
Auliya, M. A. 2006. Taxonomy, life history and conservation of giant reptiles in West Kalimantan (Indonesian Borneo). Natur und Tier - Verlag GmbH, Münster, Germany.
Auliya, M. 2011. Biology and conservation of Asian snakes. CITES Asian Snake Trade Workshop, Guangzhou, China 11-14 April 2011. Background paper - Topic 1.
Cox, M. J., van Dijk, P. P., Nabhitabhata, J., and Thirakhupt, K. 1998. A photographic guide to snakes and other reptiles of Peninsular Malaysia, Singapore and Thailand. New Holland, London, UK. 144 pp.
Daniel, J. C. 1983. The book of Indian reptiles. Bombay Natural History Society, Oxford University Press. Government of Vietnam. 2006a. Decree No. 32/2006/ND-CP of March 30, 2006, on Management of
Endangered, Precious and Rare Forest Plants and Animals. URL: http://faolex.fao.org/docs/pdf/vie64788.pdf .
Government of Vietnam. 2006b. Decree No. 82/2006/ND-CP of August 10, 2006, on management of export, import, re-export, introduction from the sea, transit, breeding, rearing and artificial propagation of endangered species of precious and rare wild fauna and flora URL: http://faolex.fao.org/docs/pdf/vie68031.pdf Accessed: 28-9-2010b.
Groombridge, B. and Luxmoore, R. 1991. Pythons in South-East Asia: A review of distribution, status and trade in three selected species, in CITES Secretariat, Lausanne, Switzerland.
Hvass, H. 1975. Reptiles and amphibians of the world. Methuen & Co Ltd. London. Iskandar, D. T. and Erdelen, W. R. 2006. Conservation of amphibians and reptiles in Indonesia: issues
and problems. Amphibian and Reptile Conservation, 4 (1): 60-87. ITC, TRAFFIC and IUCN. 2012. The trade in Southeast Asian Python skins. International Trade Centre,
TRAFFIC International and World Conservation Union. Geneva, Switzerland. Luiselli, L., Bonnet, X., Rocco, M., and Amori, G. 2012. Conservation implications of rapid shifts in the
trade of wild African and Asian pythons. Biotropica, 44: 569-573. Management Authority of Indonesia. 2011. Country Report of Indonesia. Snake trade and conservation.
CITES Asian Snake Trade Workshop, Guangzhou, China, April 11-14, 2011.
Python reticulatus
32
McDiarmid, R. W., Campbell, J. A., and T'Shaka, A. T. 1999. Snake species of the world: a taxonomic and geographic reference. Herpetologists' League, Washington, DC.
Ministry of Science Technology and Environment 1992. Red Data Book of Viet Nam. Volume 1. Animals. Science and Technology Publishing House, Hanoi.
O'Shea, M. 2007. Boas and pythons of the world. New Holland, London. Sang, N. V., Cuc, H. T., and Truong, N. Q. 2009. Herpetofauna of Vietnam. Edition Chimaira, Frankfurt am
Main. Shepherd, C. R., Sukumaran, J., and Wich, S. A. 2004. Open season: An analysis of the pet trade in Medan,
Sumatra 1997-2001. TRAFFIC Southeast Asia. Shine, R., Ambariyanto, Harlow, P. S., and Mumpuni 1999. Reticulated pythons in Sumatra: biology,
harvesting and sustainability. Biological Conservation, 87 (3): 349-357. Stidworthy, J. 1969. Snakes of the world. Hamlyn Publishing Group Ltd., Feltham, Middlesex. Thomson, J. 2008. Captive breeding of selected taxa in Cambodia and Viet Nam: A reference manual for farm
operators and CITES Authorities. TRAFFIC Southeast Asia, Greater Mekong Programme. Ha Noi, Viet Nam.
TRAFFIC. 2011. Singapore incinerates seized reptile skins from Indonesia URL: http://www.traffic.org/home/2011/8/31/singapore-incinerates-seized-reptile-skins-from-indonesia.html Accessed: 15-10-2012.
TRAFFIC and IUCN/SSC Wildlife Trade Programme. 2004. Taxa identified as possible candidates for inclusion in the Review of Significant Trade in specimens of Appendix-II species. Prepared by TRAFFIC and the IUCN/SSC Wildlife Trade Programme for the Twentieth Meeting of the CITES Animals Committee, Johannesburg (South Africa), 29 March-2 April 2004.
Van, N. D. N. and Tap, N. 2008. An overview of the use of plants and animals in traditional medicine systems in Viet Nam. TRAFFIC Southeast Asia, Greater Mekong Programme. Ha Noi, Viet Nam.
Venkataraman, B. 2007. A matter of attitude: The consumption of wild animal products in Ha Noi, Viet Nam. TRAFFIC Southeast Asia, Greater Mekong Programme. Ha Noi, Viet Nam.
Webb, G. J. W., Manolis, C. and Jenkins, R. W. G. 2011. Improving international systems for trade in reptile skins based on sustainable use. UNCTAD/DITC/TED/2011/7. United Nations Publications.
WWF and TRAFFIC. 2012. Most commonly traded protected animal species in Vietnam, WWF Greater Mekong and TRAFFIC Southeast Asia, URL: www.monre.gov.vn/MONRENET/Default.aspx?tabid=222&ItemID=10551 Accessed: 16-10-2012.
Mauremys sinensis
33
REVIEW OF SPECIES SELECTED ON THE BASIS OF THE 2010 ANALYSIS OF EU ANNUAL REPORTS
REPTILIA TESTUDINES
SPECIES: Mauremys sinensis
SYNONYMS: Emys bennettii, Emys sinensis, Ocadia sinensis
COMMON NAMES: Chinese Stripe-necked Turtle (English)
RANGE STATES: China, Lao People’s Democratic Republic, Taiwan, Province of China, Vietnam
RANGE STATE UNDER REVIEW: China, Lao People's Democratic Republic, Vietnam
IUCN RED LIST: Endangered
PREVIOUS EC OPINIONS: -
TRADE PATTERNS:
Mauremys sinensis, which is included in CITES Appendix III and EU Annex C, was selected for review from all range states on the basis of a sharp increase in trade. Whilst SRG opinions are not applicable to Annex C species, a review was recommended to assess whether the species might merit listing in Annex B; the species is specifically excluded from an uplisting proposal of species within the same genus, which is to be presented at the 16th Conference of the Parties to CITES (Proposals for amendment of Appendices I and II, updated 16 October 2012).
M. sinensis was included in CITES Appendix III and EU Annex C in 2005, therefore very little trade was reported prior to this date.
China (including Hong Kong, SAR and Taiwan, Province of China): China has not published any export quotas for Mauremys sinensis. Direct exports of M. sinensis from China to the EU-27 between 2005 and 2011 consisted entirely of live individuals, the majority of which were captive-bred and traded for commercial purposes (Table 1). While China’s annual report for 2011 had not been received at the time of writing, importer-reported trade in live individuals increased by 78 per cent between 2010 and 2011.
Indirect exports of M. sinensis to the EU-27 originating in China comprised 480 live, captive-bred individuals re-exported via Singapore to Italy in 2008 (reported by Singapore only), and 10 000 live, wild-sourced specimens re-exported via the United States to Portugal in 2010 (reported by Portugal only), all for commercial purposes.
Direct exports of M. sinensis from China to countries other than the EU-27 from 2005 onwards comprised live captive-bred and wild-sourced individuals traded for commercial purposes (Table 2). No trade was reported in either 2010 or 2011; China’s annual report for 2011 has not yet been received.
Mauremys sinensis
34
According to exporter-reported data, the principal importer was Japan; however, Japan did not confirm any of the trade. Imports were reported by Malaysia and the United States.
Table 1. Direct exports of Mauremys sinensis originating in China (including Hong Kong, SAR and Taiwan, Province of China) to the EU-27, 2005-2011. All trade was in live individuals. (No trade was reported prior to 2005; China’s annual report for 2011 has not yet been received.)
Importer Purpose Source Reported by 2005 2006 2007 2008 2009 2010 2011 Total
Belgium T C Importer
Exporter
3100 2650
1000
6750
Czech Republic T C Importer
300
300
Exporter
Denmark T C Importer
Exporter
500 500
1000
Germany T C Importer 6600 4550 8200 9112 7955 8360 44777
Exporter
3800 1800 2100 1650
9350
U Importer 201 10000
10201
Exporter
W Importer
2000
2000
Exporter
Hungary T C Importer
700
700
Exporter
Italy T C Importer
Exporter
1750 300 500
2550
Portugal T C Importer
7400 7400
Exporter
W Importer
10
10
Exporter
- - Importer 1100
1100
Exporter
Spain T C Importer 9895 4000 500
900
15295
Exporter
4000
4000
United Kingdom - - Importer
600
600
Exporter
Subtotals
C Importer 16495 8550 9000 9812 8855 15760 68472
Exporter
10900 6200 2900 3650
23650
U Importer 201 10000
10201
Exporter
W Importer
2000
10
2010
Exporter
- Importer 1100
600
1700
Exporter
Mauremys sinensis
35
Table 2. Direct exports of Mauremys sinensis originating in China (including Hong Kong, SAR and Taiwan, Province of China) to countries other than the EU-27, 2005-2009. All trade was in live individuals for commercial purposes. (No trade was reported 2001-2004 or 2010-2011; China’s annual report for 2011 has not yet been received.)
Source Reported by 2005 2007 2008 2009 Total
C Importer
100
402 502
Exporter
100 1000 400 1500
W Importer 292
292
Exporter
Lao People’s Democratic Republic: Lao People’s Democratic Republic (hereafter referred to as Lao PDR) has not published any export quotas for Mauremys sinensis. No direct or indirect trade originating in Lao PDR has been reported 2001-2011. Lao PDR acceded to CITES in 2004; annual reports have been received for the years 2006-2009 only.
Vietnam: Vietnam has not published any export quotas for Mauremys sinensis. No direct or indirect trade originating in Vietnam has been reported 2001-2011. Vietnam’s annual report for 2011 has not yet been received.
CONSERVATION STATUS in range states
Mauremys sinensis is a freshwater turtle that occurs in China, Taiwan, Province of China, Vietnam and Lao People’s Democratic Republic (Moll and Moll, 2004; Rhodin et al., 2010; van Dijk et al., 2011; Uetz, 2012). Chen et al. (2000) considered typical habitats to include still and slow-moving waters, including rivers, ponds, lakes and reservoirs. Using projected range maps, Buhlmann et al. (2009) estimated the range of the species to cover 559 352 km2.
Based on a study of the Taiwanese populations, the species was reported to lay one clutch of 7-17 eggs per year (Chen et al., 2000), however Bonin et al. (2006) reported a typical clutch size of three eggs.
M. sinensis was categorised as Endangered in the IUCN Red List (Asian Turtle Trade Working Group, 2000) and a updated assessments of its status was considered to be needed (Asian Turtle Trade Working Group, 2000). The Asian Turtle Program (2012) noted that the species had “suffered a dramatic decline throughout its historic range in China and Viet Nam”.
Generally, trade was considered the main threat to all Asian freshwater turtles, and it was noted that a significant portion of the trade was illegal (Altherr and Freyer, 2000). Chen and Lue (2010) considered habitat loss and commercial exploitation the main threats to M. sinensis, with the species also being subject to illegal trade across borders and Fong and Chen (2010) listed genetic pollution from released trade animals as an additional threat.
China and the United States propose a list of taxa of the family Geoemydidae to be included in Appendix II at the 16th Conference of the Parties to CITES. M. sinensis was specifically excluded from the proposal, as “Mauremys reevesii and M. sinensis are excluded because they are the subject of the mass farming to supply the trade. Given the extensive farming of these species, harvest of wild specimens to supply the trade or to supply parental stock for farms is believed to be low and not of conservation concern” (Proposals for amendment of Appendices I and II, updated 16 October 2012).
China: Southern mainland China was considered to form the main part of the range of M. sinensis (Asian Turtle Trade Working Group, 2000). The species was found in the provinces of Fujian in southeastern China and Guangdong, Guangxi and Hainan in the south (Zhao and Adler, 1993; Zhao, 1998; Rhodin et al., 2010; van Dijk et al., 2011), Jiangsu and Zhejiang in the east (Zhao and Adler, 1993; Zhao, 1998; Rhodin et al., 2010), Jiangxi in the southeast (van Dijk et al., 2011) and Hong Kong S.A.R. in the south (Zhao and Adler, 1993; Zhao, 1998). Pritchard (1979) considered it abundant on Hainan but rare on mainland China. It was considered to be widely distributed in Taiwan (Chen and Lue, 2008; Fong and Chen, 2010; Chen and Lue, 2010).
In trapping studies conducted across Taiwan during 2001-2007, Chen and Lue (2010) found M. sinensis to be the most abundant freshwater turtle species, accounting for 78.6 per cent of all turtle captures. However, it was noted that low numbers of the species were captured at most sites, suggesting that the
Mauremys sinensis
36
populations were considerably smaller compared to historic data (Chen and Lue, 2010). The species was most common in northern, central and southern parts of the country with only two individuals trapped in eastern Taiwan (Chen and Lue, 2010).
The species was categorised as Endangered in the China Red Data Book, and its status was considered to be ”much decreased mainly due to over collecting and destruction of habitats” (Zhao, 1998). The Taiwanese populations were categorised as Least Concern in the IUCN Red List (T. Chen, pers. comm. in Asian Turtle Trade Working Group, 2000). In a risk assessment of Chinese freshwater turtles by Zhou and Jiang (2008), M. sinensis was classified as Endangered based on its low annual reproduction rate and high value in trade.
China was considered to be the biggest consumer of turtles worldwide (Cheung and Dudgeon, 2006) with turtles commonly sold for food, medicine and as pets in the domestic market (Haitao et al., 2008; Gong et al., 2009; Chen and Lue, 2010). Concerns were raised over the heavy exploitation of all sources of wild turtles in an attempt to satisfy the unsustainable levels of trade (Cheung and Dudgeon, 2006). The high consumption in China was reported to have led to population declines in freshwater turtles (CITES CoP12 Inf. 8).
In a 35-month survey conducted in the markets of Hong Kong, Shenzhen and Guangzhou (southern China) during 2000-2003, Cheung and Dudgeon (2006) found that M. sinensis was one of the five most commonly traded pet turtle species in Shenzhen and Guangzhou (Cheung and Dudgeon, 2006). Surveys conducted in China’s largest pet market, the Yuehe Pet Market in Guangzhou in 2006-2008 confirmed these findings (Gong et al., 2009). The species was also reported to be sold in restaurants in China (Altherr and Freyer, 2000), and traded for its shell for traditional Chinese medicine (Chen et al., 2009). In Taiwan, M. sinensis was reported to be the most commonly used species in religious ceremonies, where turtles are bought for release in the wild - with associated issues including spread of disease and genetic pollution (Chen et al., 2000). Furthermore, turtles were reported to be rarely released in suitable habitats, with high mortality rates following release (Chen et al., 2000).
As a result of the high levels of demand and prices achieved, Haitao et al. (2008) reported that the number of freshwater turtle farms had increased rapidly in mainland China since the 1980s. Based on a survey of the officially recognized Chinese turtle farms in 2002, the size of the captive M. sinensis population was estimated at 1 487 400 individuals (Haitao et al., 2008). M. sinensis was also reported to be farmed in Taiwan to supply pet trade and religious ceremonies (Chen et al., 2000). Based on interviews conducted on Taiwanese turtle farms, Chen et al. (2000) reported that each of the at least five turtle farms in central and southern Taiwan could produce more than 30 000 hatchlings of the most commonly traded species per year (Chen et al., 2000). The farms on the mainland and in Taiwan were reported to be largely reliant on wild-caught breeding stock for the maintenance of reproductive capacity (Chen et al., 2000; Haitao et al., 2007), and Haitao et al. (2007) cautioned that the high intake of individuals from the wild indicated that the farming practices were not sustainable. They also reported that the turtle farming industry in China remained largely unregulated and that there was evidence of laundering of wild-caught turtles as captive-bred (Haitao et al., 2007). It was also noted that wild-caught individuals may fetch far higher prices in the Chinese market, maintaining natural populations under high pressure despite widespread turtle farming (Haitao et al., 2007). A further problem connected with turtle farming was considered to be genetic pollution (Haitao et al., 2008).
Habitat modification was considered another main threat to the species in Taiwan (Chen and Lue, 2008; Chen and Lue, 2010), particularly river management projects (Chen and Lue, 2008). Chen and Lue (2009) suggested that disturbance may restrict available habitat for the species, limiting population recruitment. Chen and Lue (2010) also noted that the male-biased sex ratio of M. sinensis was possibly a consequence of habitat modification and may lead to unstable populations.
Based on the high volumes of trade, Cheung and Dudgeon (2006) recommended that all Chinese turtles should be nationally protected species under the State Law for Protection of Wildlife (1988), which currently lists eight turtle species, but not M. sinensis (Cheung and Dudgeon, 2006). However, it was noted that Chinese enforcement actions failed to control trade in nationally protected species (Cheung and Dudgeon, 2006; Gong et al., 2009). M. sinensis is not listed in the Schedule of Protected Species under the Wildlife Conservation Act (Taiwan Forestry Bureau, 1989), and Chen and Lue (2010) noted that its use “has never been closely regulated in Taiwan”. Chen et al. (2000) reported that the release of pet
Mauremys sinensis
37
animals into the wild was banned under the Animal Protection Law in Taiwan, but that the legislation had never been enforced.
Lao People's Democratic Republic: Rhodin et al. (2010) and Uetz (2012) reported that M. sinensis occurred in Lao People’s Democratic Republic, and Jackson (2012) considered its occurrence in the country to be possible.
Stuart (1998) considered the collection of turtles for human consumption and unregulated export in the country as a significant threat.
M. sinensis was not listed as a protected species under the wildlife law (Lao PDR National Assembly, 2007).
No additional information on the conservation status of the species was found.
Vietnam: Pritchard (1979) and Bonin et al. (2006) reported occurrence in northern Vietnam, and Fritz and Havaš (2007) considered its range to reach westward from China to “at least” the Red River watershed in Vietnam.
In an eight-day trapping survey conducted in the lowlands of the Binh Son district in the Quang Ngai province of south central Vietnam in September 2011, the Asian Turtle Program (2012) recorded five individuals of the species. The surveyed habitats were considered to possibly be the “best remaining site for conservation” of the species, and it was set to be the focus of future conservation activities for the Asian Turtle Program (2012). Ziegler et al. (2006) recorded the species in the Phong Nha – Ke Bang National Park of the Quang Binh province in central Vietnam.
The Vietnamese populations of this species were described as modest, and classified as ‘Vulnerable’ (Asian Turtle Trade Working Group, 2000). The Asian Turtle Program (2012) noted that the species had “become increasingly rare in Viet Nam due to over collection”.
The species was reported to be offered for sale in local markets (Ziegler et al., 2006).
The species was not included in the list of endangered aquatic species under national protection (Viet Nam Ministry of Agriculture and Rural Development, 2008).
REFERENCES:
Altherr, S. and Freyer, D. 2000. The decline of Asian turtles: Food markets, habitat destruction and pet trade drive Asia's freshwater turtles and tortoises to extinction. Pro Wildlife. Munich, Germany.
Asian Turtle Program. 2012. Chinese stripe necked turtles found during a field survey in the lowlands of central Vietnam URL: http://www.asianturtleprogram.org/pages/map_project/binh-son-trapping-sep11/bin-son-trapping-sep11.html Accessed: 8-10-2012.
Asian Turtle Trade Working Group. 2000. Mauremys sinensis. In: IUCN 2012. IUCN Red List of Threatened Species. Version 2012.1 URL: www.iucnredlist.org Accessed: 5-10-2012.
Bonin, F., Devaux, B., and Dupré, A. 2006. Turtles of the world. A&C Black, London. 416 pp. Buhlmann, K. A., Akre, T. S. B., Iverson, J. B., Karapatakis, D., Mittermeier, R. A., Georges, A., Rhodin,
A. G. J., van Dijk, P. P., and Gibbons, W. 2009. A global analysis of tortoise and freshwater turtle distributions with identification of priority conservation areas. Chelonian Conservation and Biology, 8 (2): 116-149.
Chen, T.-H., Chang, H.-C., and Lue, K.-Y. 2009. Unregulated trade in turtle shells for Chinese traditional medicine in East and Southeast Asia: the case of Taiwan. Chelonian Conservation and Biology, 8 (1): 11-18.
Chen, T.-H., Lin, H.-C., and Chang, H.-C. 2000. Current status and utilization of Chelonians in Taiwan. Chelonian Research Monographs, 2: 45-51.
Chen, T.-H. and Lue, K.-Y. 2008. Home ranges and movements of the Chinese stripe-necked turtle (Ocadia sinensis) in the Keelung River, northern Taiwan. Amphibia-Reptilia, 29: 383-392.
Chen, T.-H. and Lue, K.-Y. 2009. Changes in the population structure and diet of the Chinese Stripe-Necked Turtle (Mauremys sinensis) inhabiting a disturbed river in Northern Taiwan. Zoological Studies, 48 (1): 95-105.

Mauremys sinensis
38
Chen, T.-H. and Lue, K.-Y. 2010. Population status and distribution of freshwater turtles in Taiwan. Oryx, 44 (2): 261-266.
Cheung, S. M. and Dudgeon, D. 2006. Quantifying the Asian turtle crisis: market surveys in southern China, 2000-2003. Aquatic Conservation: Marine and Freshwater Ecosystens, 16: 751-770.
Fong, J. J. and Chen, T.-H. 2010. DNA evidence for the hybridization of wild turtles in Taiwan: possible genetic pollution from trade animals. Conservation Genetics, 11: 2061-2066.
Fritz, U. and Havaš, P. 2007. Checklist of chelonians of the world. Vertebrate Zoology, 57 (2): 149-368. Gong, S. P., Chow, A. T., Fong, J. J., and Shi, H. T. 2009. The chelonian trade in the largest pet market in
China: scale, scope and impact on turtle conservation. Oryx, 43 (02): 213-216. Haitao, S., Parham, J. F., Lau, M., and Tien-Hsi, C. 2007. Farming endangered turtles to extinction in
China. Conservation Biology, 21 (1): 5-6. Haitao, S., Parham, J. F., Zhiyong, F., Meiling, H., and Feng, Y. 2008. Evidence for the massive scale of
turtle farming in China. Oryx, 42: 147-150. Jackson, D. R. 2012. The Chinese stripe-necked turtle (Mauremys sinensis [Gray, 1834]) (Geoemydidae),
another introduced turtle species in Florida. IRCF Reptiles & Amphibians, 19 (1): 67-68. Lao PDR National Assembly. 2007. Wildlife and aquatic law No 07/NA. Vientiane Capital, dated 24
December 2007. Moll, D. and Moll, E. O. 2004. The ecology, exploitation, and conservation of river turtles. Oxford University
Press, New York. 393 pp. Pritchard, P. C. H. 1979. Encyclopaedia of turtles. T.F.H. Publications, Inc. Ltd. Rhodin, A. G. J., van Dijk, P. P., Iverson, J. B., and Shaffer, H. B. 2010. Turtles of the world, 2010 update:
Annotated checklist of taxonomy, synonymy, distribution, and conservation status. Chelonian Research Foundation. Chelonian Research Monographs no 5.
Stuart, B. 1998. A survey of amphibians and reptiles in Phou Louey National Biodiversity Conservation Area, Houaphanh Province, Lao PDR. Wildlife Conservation Society. Vientiane.
Taiwan Forestry Bureau. 1989. Schedule of protected species, Article 4 under the Wildlife Conservation Law (enacted June 23, 1989).
Uetz, P. 2012. Mauremys sinensis (GRAY, 1834) in: The Reptile Database URL: http://reptile-database.reptarium.cz Accessed: 5-10-2012.
van Dijk, P. P., Iverson, J. B., Shaffer, H. B., Bour, R., and Rhodin, A. G. J. 2011. Turtles of the world, 2011 update: Annotated checklist of taxonomy, synonymy, distribution, and conservation status, in Rhodin, A. G. J. et al., (eds.), Conservation biology of freshwater turtles and tortoises: A compilation project of the IUCN/SSC tortoise and freshwater turtle specialist group.
Viet Nam Ministry of Agriculture and Rural Development. 2008. Decision No: 82/2008 regarding declaration of the list of endangered aquatic species in Vietnam which need protection, reproduction and development.
Zhao, E.-M. 1998. China Red Data Book of Endangered Animals - Amphibia and Reptilia. Science Press, Beijing.
Zhao, E.-M. and Adler, K. 1993. Herpetology of China. Society for the Study of Amphibians and Reptiles, Oxford, Ohio.
Zhou, Z. and Jiang, Z. 2008. Characteristics and risk assessment of international trade in tortoises and freshwater turtles in China. Chelonian Conservation and Biology, 7 (1): 28-36.
Ziegler, T., Ohler, A., Thanh, V. N., Quyet, L. K., Thuan, N. X., Tri, D. H., and Thanh, B. N. 2006. Review of the amphibian and reptile diversity of Phong Nha - Ke Bang National Park and adjacent areas, central Truong Son, Vietnam, Herpetologia Bonnensis II. Proceedings of the 13th Congress of the Societas Europaea Herpetologica, M. Vences et al., eds., pp. 247-262.

Annex I: Detailed trade data tables
39
Annex I: Detailed trade data tables for Python reticulatus
Table 1. Direct exports of Python reticulatus originating in Indonesia to the EU-27, 2001-2011 ‘Leather products’ includes both small and large leather products. Figures rounded to one decimal place, where applicable. (Indonesia’s annual report for 2011 has not yet been received.)
Importer Term (units) Purpose Source Reported by 2001 2002 2003 2004 2005 2006 2007 2008 2009 2010 2011 Total
Austria live T C Importer
10 10
Exporter
18
18
W Importer
20
10 30
Exporter
45
20 7
72
skin pieces T W Importer
Exporter
1
1
Belgium live T W Importer 10
10
Exporter 50
123
4
177
Cyprus leather products T W Importer 6
6
Exporter
Czech Republic live T C Importer
23 20
43
Exporter
52 30
82
W Importer
37 40 52 30
45 25 229
Exporter
6 50 69 80 30 30 30
295
leather products T W Importer
50 65 115
Exporter
150
150
Denmark leather products T W Importer
200 418 618
Exporter
200
200
France derivatives T W Importer
61
61
Exporter
live T C Importer
Exporter
6
6
F Importer
300
62 57 20 20
459
Exporter
46 158 116 52 45 39 69
525
W Importer 58 17 79 10
12 16 251 60
50 553
Exporter 58 17 29 35
12 56 131 50 25
413
skins T W Importer 25
291 316
Exporter 1
1
leather products P W Importer
4
4
Exporter
T W Importer
80
96 15848 38461 7673 62158
Exporter 1
4000 26029 24273
54303
skin pieces T W Importer
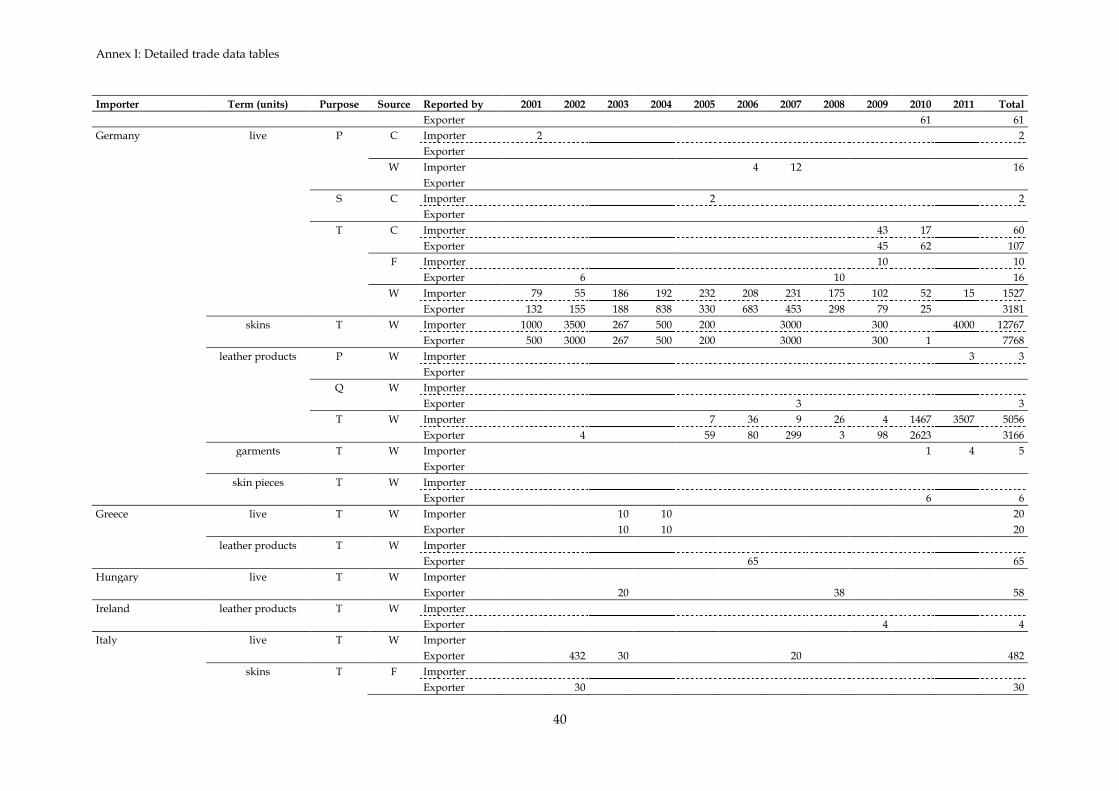
Annex I: Detailed trade data tables
40
Importer Term (units) Purpose Source Reported by 2001 2002 2003 2004 2005 2006 2007 2008 2009 2010 2011 Total
Exporter
61
61
Germany live P C Importer 2
2
Exporter
W Importer
4 12
16
Exporter
S C Importer
2
2
Exporter
T C Importer
43 17
60
Exporter
45 62
107
F Importer
10
10
Exporter
6
10
16
W Importer 79 55 186 192 232 208 231 175 102 52 15 1527
Exporter 132 155 188 838 330 683 453 298 79 25
3181
skins T W Importer 1000 3500 267 500 200
3000
300
4000 12767
Exporter 500 3000 267 500 200
3000
300 1
7768
leather products P W Importer
3 3
Exporter
Q W Importer
Exporter
3
3
T W Importer
7 36 9 26 4 1467 3507 5056
Exporter
4
59 80 299 3 98 2623
3166
garments T W Importer
1 4 5
Exporter
skin pieces T W Importer
Exporter
6
6
Greece live T W Importer
10 10
20
Exporter
10 10
20
leather products T W Importer
Exporter
65
65
Hungary live T W Importer
Exporter
20
38
58
Ireland leather products T W Importer
Exporter
4
4
Italy live T W Importer
Exporter
432 30
20
482
skins T F Importer
Exporter
30
30

Annex I: Detailed trade data tables
41
Importer Term (units) Purpose Source Reported by 2001 2002 2003 2004 2005 2006 2007 2008 2009 2010 2011 Total
W Importer 2391 34701 15400 29916 23750 10971 9993 11600 7210 9691 20307 175930
Exporter 8896 31034 20000 30016 22393 10001 11698 13000 10494 13110
170642
leather products T W Importer 335 94 4
1107 517 1842 1378 3434 2663 10066 21440
Exporter 908
253 340 1218 1744 2634 2811 4210
14118
skin pieces (kg) T W Importer 50
50
Exporter
skin pieces T W Importer
Exporter
4600
1000
5600
Malta leather products T W Importer
Exporter
9
9
Netherlands live T C Importer
Exporter
27 18
45
F Importer
17
17
Exporter
7
7
W Importer 4 16 75
22 14 54 91 276
Exporter 23 16 32 20
12 44
147
leather products T W Importer
140
4881 5021
Exporter
845 154 2959
3958
Poland leather products T W Importer
Exporter
380
380
Romania leather products T W Importer
20
20
Exporter
5 20
25
Spain live T C Importer
Exporter
10
10
F Importer
25
10
35
Exporter
25
25
W Importer
69 29 20
20 69 6 20
233
Exporter 34 124 30 96 3 4 60 72 34 20
477
skins T W Importer 1616 7029 13148 12385 26822 16391 17240 25592 20924 19595 21729 182471
Exporter 2830 7476 16860 12972 24046 17673 18150 25092 23069 18250
166418
leather products T W Importer
3
467 4 493 1656 361 2984
Exporter
200
2
467 530 1005 1396
3600
garments T W Importer
9 1
10
Exporter
Sweden live T W Importer
Exporter
104
104
leather products T W Importer
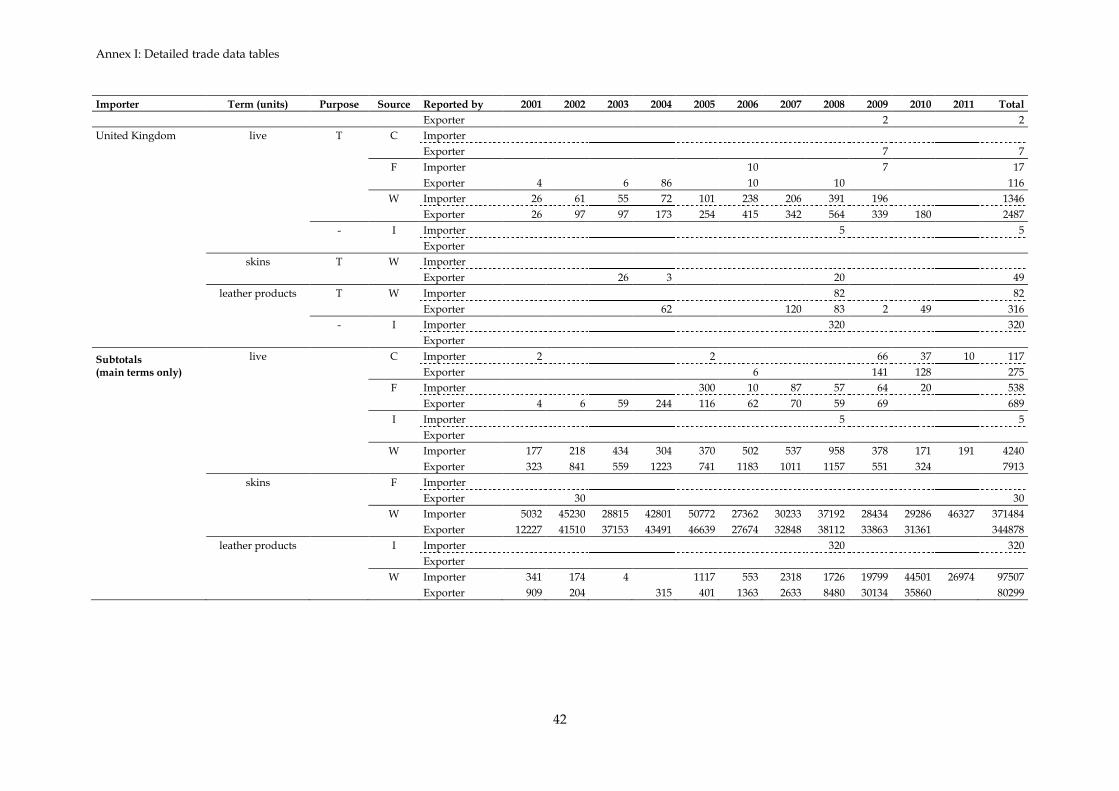
Annex I: Detailed trade data tables
42
Importer Term (units) Purpose Source Reported by 2001 2002 2003 2004 2005 2006 2007 2008 2009 2010 2011 Total
Exporter
2
2
United Kingdom live T C Importer
Exporter
7
7
F Importer
10
7
17
Exporter 4
6 86
10
10
116
W Importer 26 61 55 72 101 238 206 391 196
1346
Exporter 26 97 97 173 254 415 342 564 339 180
2487
- I Importer
5
5
Exporter
skins T W Importer
Exporter
26 3
20
49
leather products T W Importer
82
82
Exporter
62
120 83 2 49
316
- I Importer
320
320
Exporter
Subtotals (main terms only)
live
C Importer 2
2
66 37 10 117
Exporter
6
141 128
275
F Importer
300 10 87 57 64 20
538
Exporter 4 6 59 244 116 62 70 59 69
689
I Importer
5
5
Exporter
W Importer 177 218 434 304 370 502 537 958 378 171 191 4240
Exporter 323 841 559 1223 741 1183 1011 1157 551 324
7913
skins
F Importer
Exporter
30
30
W Importer 5032 45230 28815 42801 50772 27362 30233 37192 28434 29286 46327 371484
Exporter 12227 41510 37153 43491 46639 27674 32848 38112 33863 31361
344878
leather products
I Importer
320
320
Exporter
W Importer 341 174 4
1117 553 2318 1726 19799 44501 26974 97507
Exporter 909 204
315 401 1363 2633 8480 30134 35860
80299
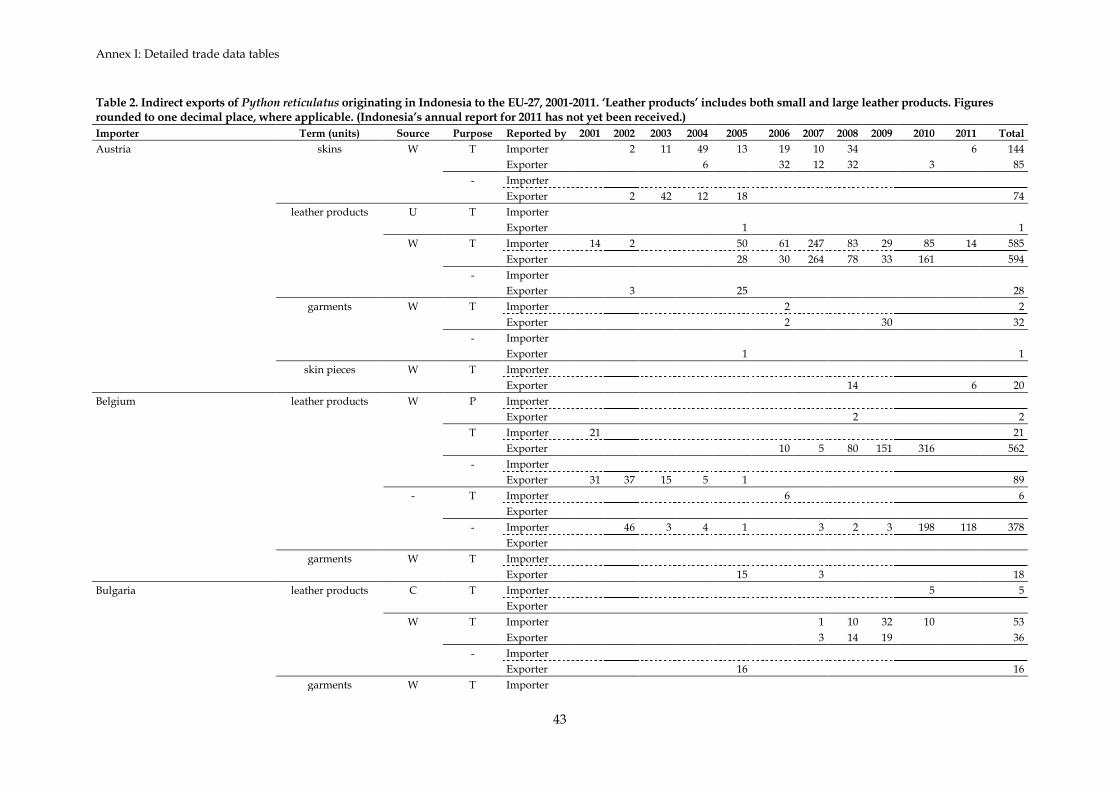
Annex I: Detailed trade data tables
43
Table 2. Indirect exports of Python reticulatus originating in Indonesia to the EU-27, 2001-2011. ‘Leather products’ includes both small and large leather products. Figures rounded to one decimal place, where applicable. (Indonesia’s annual report for 2011 has not yet been received.)
Importer Term (units) Source Purpose Reported by 2001 2002 2003 2004 2005 2006 2007 2008 2009 2010 2011 Total
Austria skins W T Importer
2 11 49 13 19 10 34
6 144
Exporter
6
32 12 32
3
85
- Importer
Exporter
2 42 12 18
74
leather products U T Importer
Exporter
1
1
W T Importer 14 2
50 61 247 83 29 85 14 585
Exporter
28 30 264 78 33 161
594
- Importer
Exporter
3
25
28
garments W T Importer
2
2
Exporter
2
30
32
- Importer
Exporter
1
1
skin pieces W T Importer
Exporter
14
6 20
Belgium leather products W P Importer
Exporter
2
2
T Importer 21
21
Exporter
10 5 80 151 316
562
- Importer
Exporter 31 37 15 5 1
89
- T Importer
6
6
Exporter
- Importer
46 3 4 1
3 2 3 198 118 378
Exporter
garments W T Importer
Exporter
15
3
18
Bulgaria leather products C T Importer
5
5
Exporter
W T Importer
1 10 32 10
53
Exporter
3 14 19
36
- Importer
Exporter
16
16
garments W T Importer
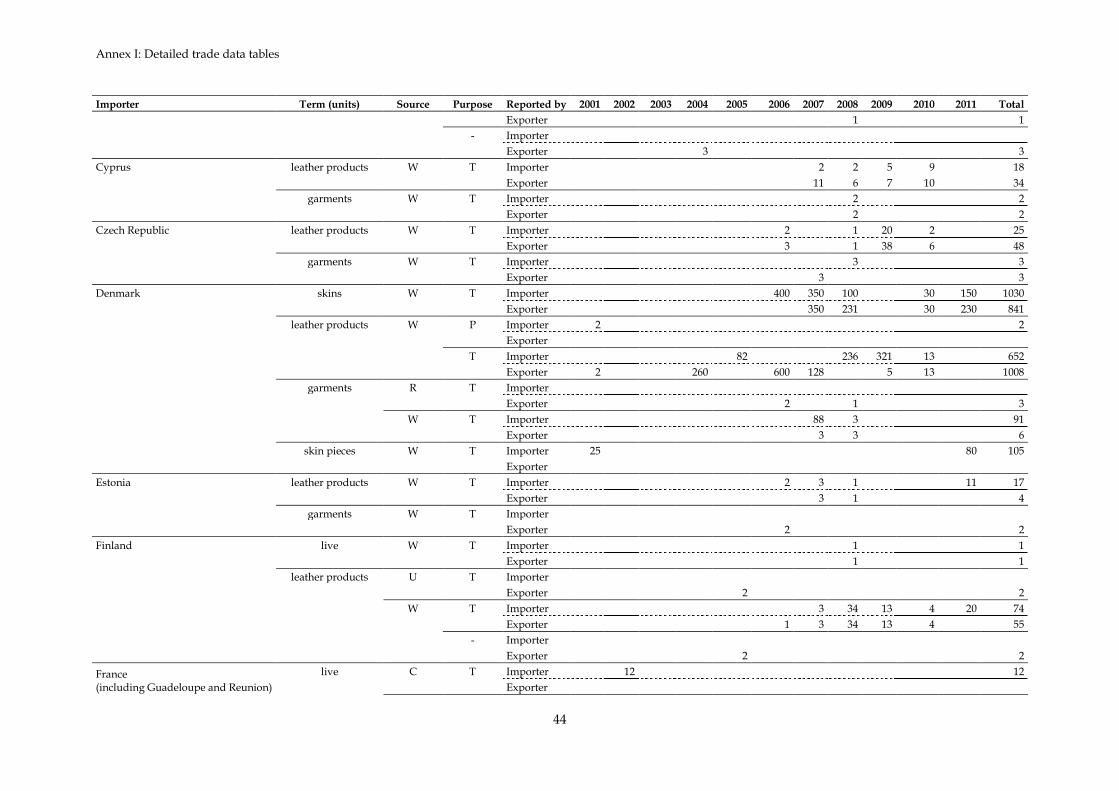
Annex I: Detailed trade data tables
44
Importer Term (units) Source Purpose Reported by 2001 2002 2003 2004 2005 2006 2007 2008 2009 2010 2011 Total
Exporter
1
1
- Importer
Exporter
3
3
Cyprus leather products W T Importer
2 2 5 9
18
Exporter
11 6 7 10
34
garments W T Importer
2
2
Exporter
2
2
Czech Republic leather products W T Importer
2
1 20 2
25
Exporter
3
1 38 6
48
garments W T Importer
3
3
Exporter
3
3
Denmark skins W T Importer
400 350 100
30 150 1030
Exporter
350 231
30 230 841
leather products W P Importer 2
2
Exporter
T Importer
82
236 321 13
652
Exporter 2
260
600 128
5 13
1008
garments R T Importer
Exporter
2
1
3
W T Importer
88 3
91
Exporter
3 3
6
skin pieces W T Importer 25
80 105
Exporter
Estonia leather products W T Importer
2 3 1
11 17
Exporter
3 1
4
garments W T Importer
Exporter
2
2
Finland live W T Importer
1
1
Exporter
1
1
leather products U T Importer
Exporter
2
2
W T Importer
3 34 13 4 20 74
Exporter
1 3 34 13 4
55
- Importer
Exporter
2
2
France (including Guadeloupe and Reunion)
live C T Importer
12
12
Exporter
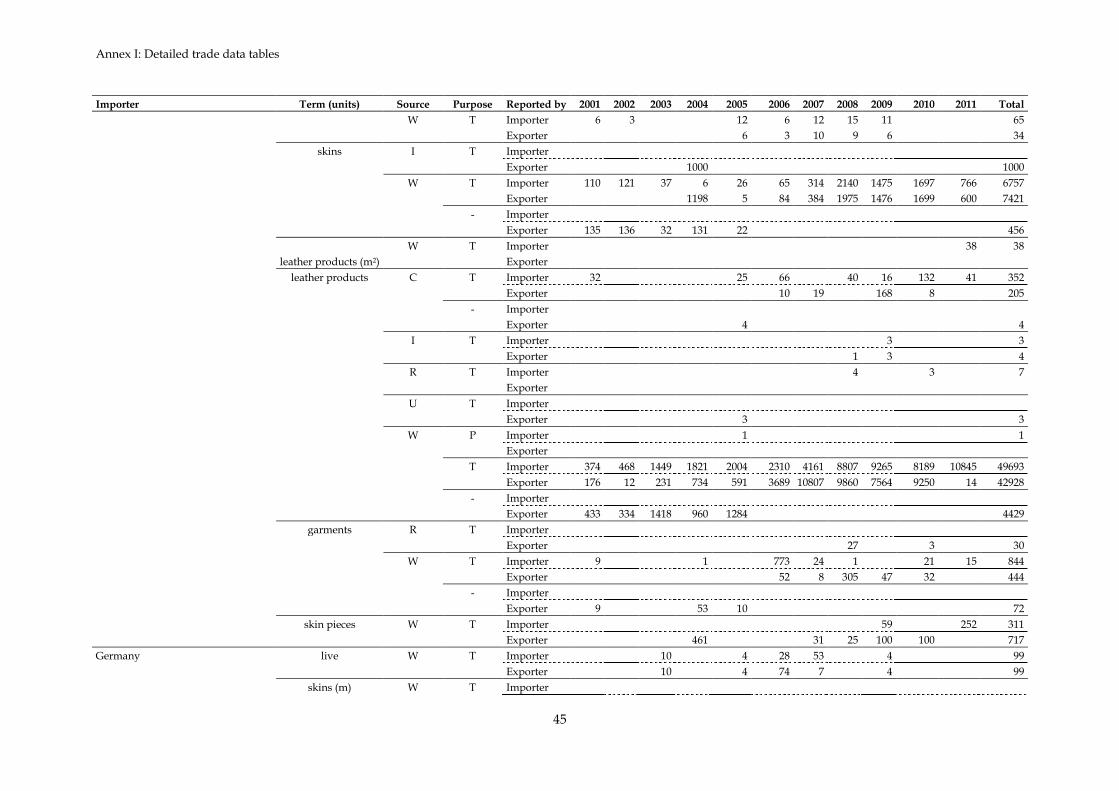
Annex I: Detailed trade data tables
45
Importer Term (units) Source Purpose Reported by 2001 2002 2003 2004 2005 2006 2007 2008 2009 2010 2011 Total
W T Importer 6 3
12 6 12 15 11
65
Exporter
6 3 10 9 6
34
skins I T Importer
Exporter
1000
1000
W T Importer 110 121 37 6 26 65 314 2140 1475 1697 766 6757
Exporter
1198 5 84 384 1975 1476 1699 600 7421
- Importer
Exporter 135 136 32 131 22
456
leather products (m2)
W T Importer
38 38
Exporter
leather products C T Importer 32
25 66
40 16 132 41 352
Exporter
10 19
168 8
205
- Importer
Exporter
4
4
I T Importer
3
3
Exporter
1 3
4
R T Importer
4
3
7
Exporter
U T Importer
Exporter
3
3
W P Importer
1
1
Exporter
T Importer 374 468 1449 1821 2004 2310 4161 8807 9265 8189 10845 49693
Exporter 176 12 231 734 591 3689 10807 9860 7564 9250 14 42928
- Importer
Exporter 433 334 1418 960 1284
4429
garments R T Importer
Exporter
27
3
30
W T Importer 9
1
773 24 1
21 15 844
Exporter
52 8 305 47 32
444
- Importer
Exporter 9
53 10
72
skin pieces W T Importer
59
252 311
Exporter
461
31 25 100 100
717
Germany live W T Importer
10
4 28 53
4
99
Exporter
10
4 74 7
4
99
skins (m) W T Importer
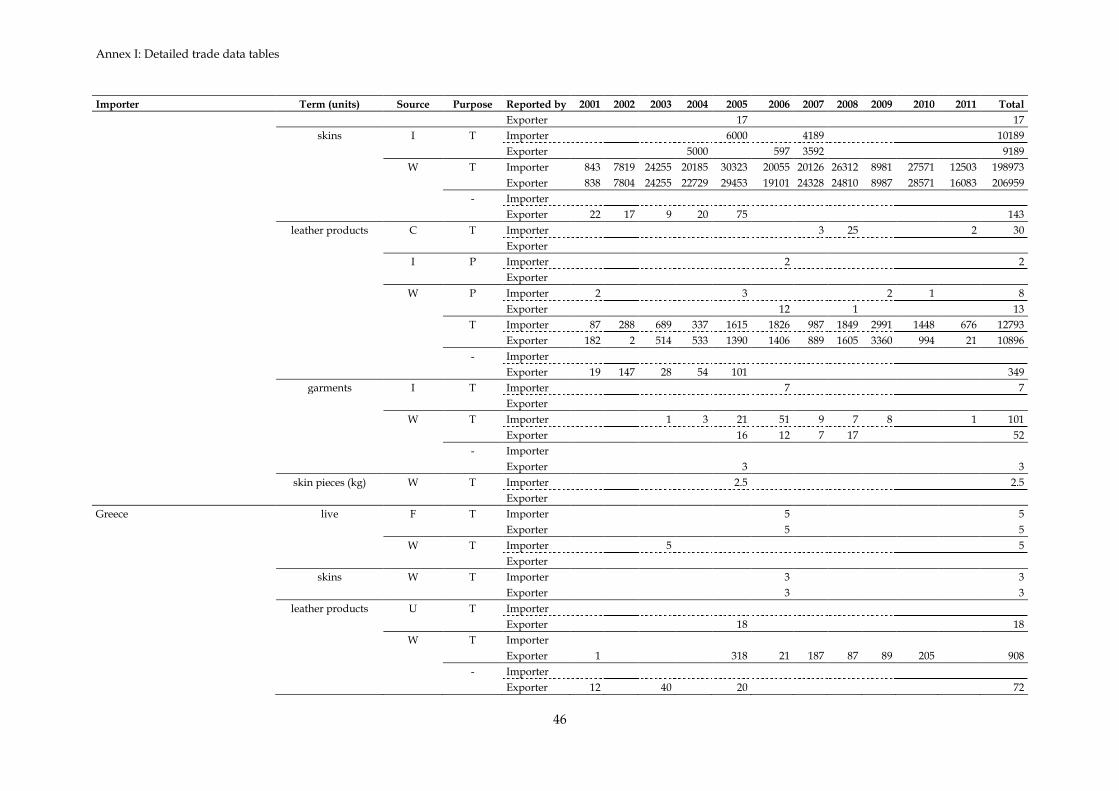
Annex I: Detailed trade data tables
46
Importer Term (units) Source Purpose Reported by 2001 2002 2003 2004 2005 2006 2007 2008 2009 2010 2011 Total
Exporter
17
17
skins I T Importer
6000
4189
10189
Exporter
5000
597 3592
9189
W T Importer 843 7819 24255 20185 30323 20055 20126 26312 8981 27571 12503 198973
Exporter 838 7804 24255 22729 29453 19101 24328 24810 8987 28571 16083 206959
- Importer
Exporter 22 17 9 20 75
143
leather products C T Importer
3 25
2 30
Exporter
I P Importer
2
2
Exporter
W P Importer 2
3
2 1
8
Exporter
12
1
13
T Importer 87 288 689 337 1615 1826 987 1849 2991 1448 676 12793
Exporter 182 2 514 533 1390 1406 889 1605 3360 994 21 10896
- Importer
Exporter 19 147 28 54 101
349
garments I T Importer
7
7
Exporter
W T Importer
1 3 21 51 9 7 8
1 101
Exporter
16 12 7 17
52
- Importer
Exporter
3
3
skin pieces (kg) W T Importer
2.5
2.5
Exporter
Greece live F T Importer
5
5
Exporter
5
5
W T Importer
5
5
Exporter
skins W T Importer
3
3
Exporter
3
3
leather products U T Importer
Exporter
18
18
W T Importer
Exporter 1
318 21 187 87 89 205
908
- Importer
Exporter 12
40
20
72
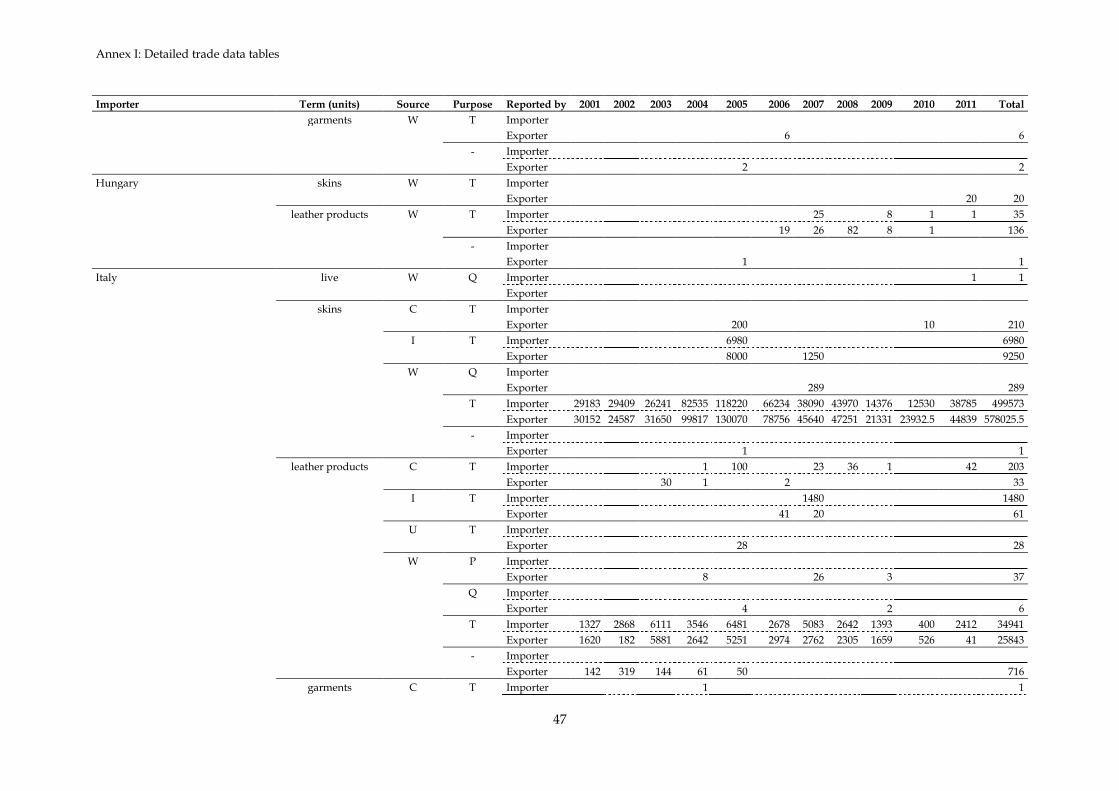
Annex I: Detailed trade data tables
47
Importer Term (units) Source Purpose Reported by 2001 2002 2003 2004 2005 2006 2007 2008 2009 2010 2011 Total
garments W T Importer
Exporter
6
6
- Importer
Exporter
2
2
Hungary skins W T Importer
Exporter
20 20
leather products W T Importer
25
8 1 1 35
Exporter
19 26 82 8 1
136
- Importer
Exporter
1
1
Italy live W Q Importer
1 1
Exporter
skins C T Importer
Exporter
200
10
210
I T Importer
6980
6980
Exporter
8000
1250
9250
W Q Importer
Exporter
289
289
T Importer 29183 29409 26241 82535 118220 66234 38090 43970 14376 12530 38785 499573
Exporter 30152 24587 31650 99817 130070 78756 45640 47251 21331 23932.5 44839 578025.5
- Importer
Exporter
1
1
leather products C T Importer
1 100
23 36 1
42 203
Exporter
30 1
2
33
I T Importer
1480
1480
Exporter
41 20
61
U T Importer
Exporter
28
28
W P Importer
Exporter
8
26
3
37
Q Importer
Exporter
4
2
6
T Importer 1327 2868 6111 3546 6481 2678 5083 2642 1393 400 2412 34941
Exporter 1620 182 5881 2642 5251 2974 2762 2305 1659 526 41 25843
- Importer
Exporter 142 319 144 61 50
716
garments C T Importer
1
1

Annex I: Detailed trade data tables
48
Importer Term (units) Source Purpose Reported by 2001 2002 2003 2004 2005 2006 2007 2008 2009 2010 2011 Total
Exporter
W S Importer
10
10
Exporter
T Importer 14
12 6 8 11 148 28 10 26 4 267
Exporter
1 28 2 66 5 12 49
163
- Importer
Exporter 5
4 4
13
skin pieces W T Importer
8
1968
5
1981
Exporter
8 23
1968 1 50
2050
Latvia leather products W T Importer
Exporter
2
1 5 2 4
14
garments W T Importer
Exporter
12
12
Lithuania leather products W T Importer
16 5 3
24
Exporter
2 36 12 5
55
Luxembourg leather products W T Importer
Exporter
2
1
3
Malta leather products W T Importer
2 1
3
Exporter
1 2
3
Netherlands live W T Importer
20
254 274
Exporter
skins (m) W T Importer
Exporter
18
18
skins W - Importer
Exporter
2
2
leather products C T Importer
14
1
15
Exporter
O Q Importer
1
1
Exporter
W T Importer
41 8 2
3 8 395 436 786 1679
Exporter
14
50 11 42 10 44 729
900
- Importer
Exporter
41 6 2 1
50
garments W T Importer
Exporter
6
6
Poland leather products W T Importer
7 156 230 197 7 42 639
Exporter
7 154 239 27 50
477
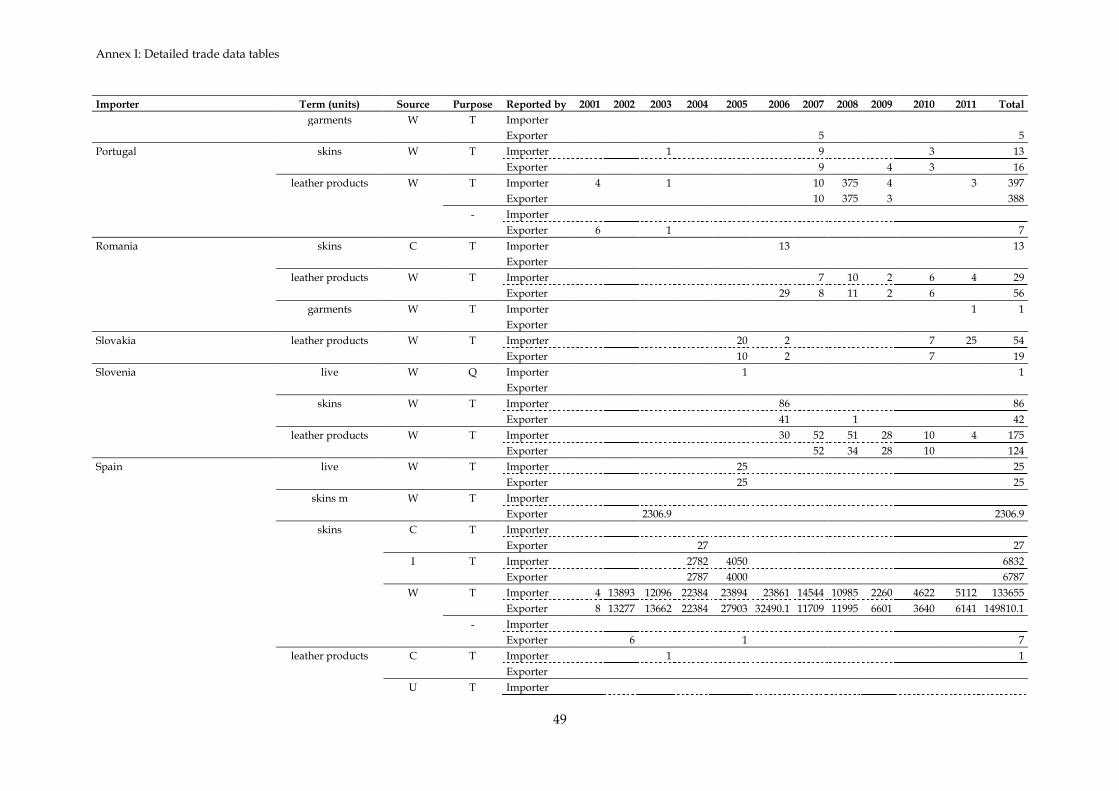
Annex I: Detailed trade data tables
49
Importer Term (units) Source Purpose Reported by 2001 2002 2003 2004 2005 2006 2007 2008 2009 2010 2011 Total
garments W T Importer
Exporter
5
5
Portugal skins W T Importer
1
9
3
13
Exporter
9
4 3
16
leather products W T Importer 4
1
10 375 4
3 397
Exporter
10 375 3
388
- Importer
Exporter 6
1
7
Romania skins C T Importer
13
13
Exporter
leather products W T Importer
7 10 2 6 4 29
Exporter
29 8 11 2 6
56
garments W T Importer
1 1
Exporter
Slovakia leather products W T Importer
20 2
7 25 54
Exporter
10 2
7
19
Slovenia live W Q Importer
1
1
Exporter
skins W T Importer
86
86
Exporter
41
1
42
leather products W T Importer
30 52 51 28 10 4 175
Exporter
52 34 28 10
124
Spain live W T Importer
25
25
Exporter
25
25
skins m W T Importer
Exporter
2306.9
2306.9
skins C T Importer
Exporter
27
27
I T Importer
2782 4050
6832
Exporter
2787 4000
6787
W T Importer 4 13893 12096 22384 23894 23861 14544 10985 2260 4622 5112 133655
Exporter 8 13277 13662 22384 27903 32490.1 11709 11995 6601 3640 6141 149810.1
- Importer
Exporter
6
1
7
leather products C T Importer
1
1
Exporter
U T Importer
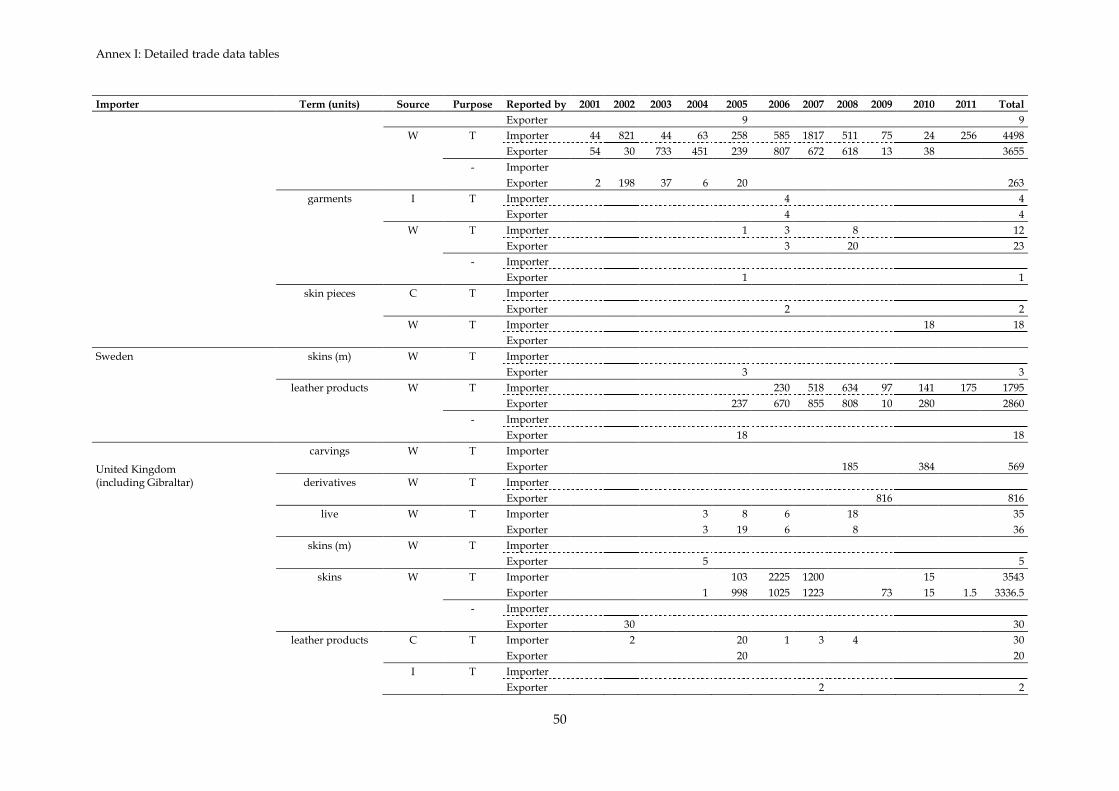
Annex I: Detailed trade data tables
50
Importer Term (units) Source Purpose Reported by 2001 2002 2003 2004 2005 2006 2007 2008 2009 2010 2011 Total
Exporter
9
9
W T Importer 44 821 44 63 258 585 1817 511 75 24 256 4498
Exporter 54 30 733 451 239 807 672 618 13 38
3655
- Importer
Exporter 2 198 37 6 20
263
garments I T Importer
4
4
Exporter
4
4
W T Importer
1 3
8
12
Exporter
3
20
23
- Importer
Exporter
1
1
skin pieces C T Importer
Exporter
2
2
W T Importer
18
18
Exporter
Sweden skins (m) W T Importer
Exporter
3
3
leather products W T Importer
230 518 634 97 141 175 1795
Exporter
237 670 855 808 10 280
2860
- Importer
Exporter
18
18
United Kingdom (including Gibraltar)
carvings W T Importer
Exporter
185
384
569
derivatives W T Importer
Exporter
816
816
live W T Importer
3 8 6
18
35
Exporter
3 19 6
8
36
skins (m) W T Importer
Exporter
5
5
skins W T Importer
103 2225 1200
15
3543
Exporter
1 998 1025 1223
73 15 1.5 3336.5
- Importer
Exporter
30
30
leather products C T Importer
2
20 1 3 4
30
Exporter
20
20
I T Importer
Exporter
2
2

Annex I: Detailed trade data tables
51
Importer Term (units) Source Purpose Reported by 2001 2002 2003 2004 2005 2006 2007 2008 2009 2010 2011 Total
R T Importer
Exporter
1
1
U T Importer
2
2
Exporter
W P Importer
1
1
Exporter
T Importer 50 112
51 117 48 255 514 1297 644
3088
Exporter 347 2 7 6 533 262 455 913 599 742 22 3888
- Importer
Exporter 244 57 61 19 34
415
garments W T Importer
3
4
7
Exporter
8 4 21
7
40
- Importer
Exporter
6
6
skin pieces W T Importer
1200
1
1201
Exporter
1 3
4
Subtotals (main terms only)
skins C
Importer
13
13
Exporter
27 200
10
237
I
Importer
2782 17030
4189
24001
Exporter
8787 12000 597 4842
26226
W
Importer 30140 51244 62641 1E+05 172579 112948 74643 83541 27092 46468 57322 843777
Exporter 31155 45859 69652 1E+05 188546 131532 83944 86295 38472 57893.5 67914.5 947561.1
leather products C
Importer 32 2 1 1 159 67 29 106 17 137 85 636
Exporter
30 1 24 12 19
168 8
262
I
Importer
2 1480
3
1485
Exporter
41 22 1 3
67
O
Importer
1
1
Exporter
R
Importer
4
3
7
Exporter
1
1
U
Importer
2
2
Exporter
61
61
W
Importer 1925 4601 8302 5820 10631 7781 13348 16004 16177 11437 15274 111300
Exporter 3271 1364 9130 5741 10226 10557 17400 17183 13685 13352 98 102007
-
Importer
46 3 4 1 6 3 2 3 198 118 384
Exporter

Annex I: Detailed trade data tables
52
Table 3. Indirect exports of Python reticulatus originating in Vietnam to the EU-27, 2001-2011. ‘Leather products’ includes both small and large leather products. Figures rounded to one decimal place, where applicable.
Importer Term (units) Source Purpose Reported by 2001 2002 2003 2004 2005 2006 2007 2008 2009 2010 2011 Total
Austria leather products C T Importer
39 200 65 71 87 9 31 502
Exporter
207 60 87 128 17
499
- Importer
Exporter
41
41
W T Importer
62 8 10
13 1 94
Exporter
62 10 37
16
125
Belgium leather products C T Importer
Exporter
24 1 292 207 302
826
W T Importer
Exporter
550 9 4
563
- T Importer
16
16
Exporter
- Importer
744
97 370 1211
Exporter
garments C T Importer
1
1
Exporter
5
5
Bulgaria leather products C T Importer
2
2
Exporter
2 3 30 2
37
garments C T Importer
Exporter
4
2
6
Cyprus leather products C T Importer
10 3 18 10 17 24 82
Exporter
29 10 25 32 18
114
garments C T Importer
5
5
Exporter
5
5
Czech Republic skins W T Importer
1
1
Exporter
1
1
leather products C T Importer
1
2
3
Exporter
1
3
4
W T Importer
17
17
Exporter
17
17
Denmark leather products C T Importer
2 1 979 421 53 1456
Exporter
10 1 4 22
37
garments C T Importer
Exporter
15
15
Estonia leather products C T Importer
1
1
2
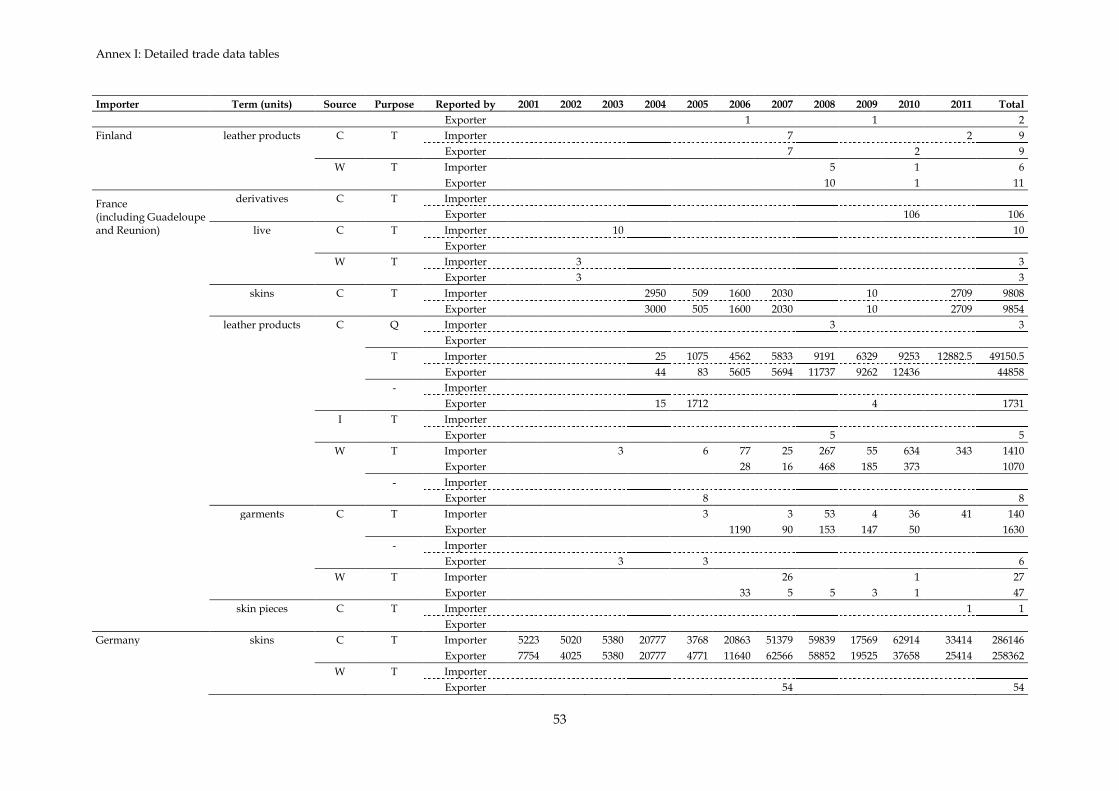
Annex I: Detailed trade data tables
53
Importer Term (units) Source Purpose Reported by 2001 2002 2003 2004 2005 2006 2007 2008 2009 2010 2011 Total
Exporter
1
1
2
Finland leather products C T Importer
7
2 9
Exporter
7
2
9
W T Importer
5
1
6
Exporter
10
1
11
France (including Guadeloupe and Reunion)
derivatives C T Importer
Exporter
106
106
live C T Importer
10
10
Exporter
W T Importer
3
3
Exporter
3
3
skins C T Importer
2950 509 1600 2030
10
2709 9808
Exporter
3000 505 1600 2030
10
2709 9854
leather products C Q Importer
3
3
Exporter
T Importer
25 1075 4562 5833 9191 6329 9253 12882.5 49150.5
Exporter
44 83 5605 5694 11737 9262 12436
44858
- Importer
Exporter
15 1712
4
1731
I T Importer
Exporter
5
5
W T Importer
3
6 77 25 267 55 634 343 1410
Exporter
28 16 468 185 373
1070
- Importer
Exporter
8
8
garments C T Importer
3
3 53 4 36 41 140
Exporter
1190 90 153 147 50
1630
- Importer
Exporter
3
3
6
W T Importer
26
1
27
Exporter
33 5 5 3 1
47
skin pieces C T Importer
1 1
Exporter
Germany skins C T Importer 5223 5020 5380 20777 3768 20863 51379 59839 17569 62914 33414 286146
Exporter 7754 4025 5380 20777 4771 11640 62566 58852 19525 37658 25414 258362
W T Importer
Exporter
54
54
Annex I: Detailed trade data tables
54
Importer Term (units) Source Purpose Reported by 2001 2002 2003 2004 2005 2006 2007 2008 2009 2010 2011 Total
leather products C P Importer
2 1
3
Exporter
1
9
10
T Importer
3 223 836 361 293 26 161 1903
Exporter
1216 200 831 342 383 37
3009
- Importer
Exporter
3
3
W T Importer
4
54 6 26 65 46 201
Exporter
4
17 48
69
garments C P Importer
1
1
Exporter
T Importer
1210 44 2 2
1313 2571
Exporter
51 4 5
60
Greece leather products C T Importer
Exporter
68 47 84 174 128
501
- Importer
Exporter
17
17
W T Importer
Exporter
3 48
51
- Importer
Exporter
2
2
garments C T Importer
Exporter
7
7
Hungary leather products C T Importer
10
32 6 2 50
Exporter
11 13 2 44
70
W T Importer
Exporter
7
2
9
Ireland leather products C T Importer
2
2
Exporter
2
2
Italy skins C T Importer 30 4390 4754 23733 4083 22439 22941 29995 9304 3120 13918 138707
Exporter 30 5390 4754 25733 3500 21395 24336 29953 10900 8105 14650 148746
W T Importer
2839 2000
3300 3
27
8169
Exporter
2839 1000
3302 140 10
7291
leather products C P Importer
Exporter
2
2
S Importer
6 2 8
Exporter
T Importer
197 108 67 656 277 2044 555 1275 602 1793 7574
Annex I: Detailed trade data tables
55
Importer Term (units) Source Purpose Reported by 2001 2002 2003 2004 2005 2006 2007 2008 2009 2010 2011 Total
Exporter
198 157 84 242 170 662 465 1282 723 20 4003
- Importer
Exporter
394
394
I T Importer
Exporter
1
1
W T Importer
1 100 15 10 51 20 30 151 378
Exporter
4
1 1 20 21 63 17 63
190
- Importer
Exporter
32
32
garments C T Importer
2
14 8 7 37 3 9 4 84
Exporter
2
3 7 22 2 12
48
- Importer
Exporter
2
18
20
skin pieces C T Importer
2966 27
3 2996
Exporter
3 3 2968 12
2986
Latvia leather products C T Importer
Exporter
26 30 22
78
garments C T Importer
Exporter
6 1
1
8
Lithuania leather products C T Importer
12 2 3
17
Exporter
23
3
26
garments C T Importer
Exporter
3
3
Malta leather products C T Importer
1
1
Exporter
6
1
7
W T Importer
Exporter
2
2
Netherlands live C T Importer
37 37
Exporter
leather products C P Importer
1 1
Exporter
T Importer
7
24 440 75 546
Exporter
2 7
1 441
451
W T Importer
4 1 4 9
Exporter
6 2 2
10
Poland leather products C T Importer
30 170 12 755 20 2 989
Exporter
61 163 12 756 20
1012
Annex I: Detailed trade data tables
56
Importer Term (units) Source Purpose Reported by 2001 2002 2003 2004 2005 2006 2007 2008 2009 2010 2011 Total
W T Importer
2 6 15
23
Exporter
2 7 15
24
garments C T Importer
Exporter
3
3
Portugal leather products C T Importer
2 1 16
2 21
Exporter
1 15
1742
1758
- Importer
Exporter
2
2
Romania skins C T Importer
1000 2000 3000
Exporter
1000
1000
leather products C T Importer
32 3 8 51 94
Exporter
27 1 35 3 10
76
- Importer
Exporter
3
3
W T Importer
24 39
63
Exporter
30 33
63
Slovakia leather products C T Importer
8 42 50
Exporter
8
8
Slovenia leather products C T Importer
6 1 3 5 15
Exporter
1 24
25
W T Importer
20 20
Exporter
2
2
Spain skins (m) C T Importer
Exporter
60
60
skins C T Importer
500 2857 2661 920 1832 800
13000 14060 5704 42334
Exporter
500 2397 2665 920 1514 2880 1640 16000 17039 5684 51239
W T Importer
300
383
683
Exporter
790
383
1173
leather products C T Importer 35
81 45 159 54 4 52 28 458
Exporter 35
51 10
46 94 43 30 79
388
- Importer
Exporter
4
75
79
W T Importer
1 9
10
Exporter
3 9
12
garments C T Importer
28 48
76
Exporter
skin pieces W T Importer

Annex I: Detailed trade data tables
57
Importer Term (units) Source Purpose Reported by 2001 2002 2003 2004 2005 2006 2007 2008 2009 2010 2011 Total
Exporter
21
21
Sweden leather products C T Importer
5 3
8
Exporter
29 9 12 2
52
- Importer
Exporter
21
21
W T Importer
Exporter
3
3
garments C T Importer
Exporter
4
4
United Kingdom (including Gibraltar)
skins (m) W T Importer
Exporter
29.9
29.9
skins C T Importer
1250
1250
Exporter
1250
1
1251
leather products C P Importer
Exporter
1
1
T Importer
39 32 39 52 116 15
293
Exporter
5
32 150 74 73 127 40 1 502
- Importer
Exporter
86
86
W T Importer
25
17 21 2
65
Exporter
4
5 28 19 3
59
- Importer
Exporter
112
112
garments C T Importer
2
2
Exporter
19
19
I - Importer
3
3
Exporter
skin pieces C T Importer
Exporter
7
7
Subtotals (main terms only)
skins (m)
Importer
Exporter
89.9
89.9
skins
Importer 5253 12749 15291 50121 12963 47987 77151 89834 39910 81094 57745 490098
Exporter 7784 12754 14321 52175 13381 37539 91877 90445 46435 63802 48457 478970
leather products
Importer 35 197 111 97 2026 5552 9353 11508 10064 11731 16091.5 66765.5
Exporter 35 202 217 158 4086 6754 7869 14503 14573 14770 21 63188
Annex II: Key to purpose and source codes
58
Annex II: Key to purpose and source codes
Purpose of trade
Code Description
T Commercial
Z Zoo
G Botanical garden
Q Circus or travelling exhibition
S Scientific
H Hunting trophy
P Personal
M Medical (including biomedical research)
E Educational
N Reintroduction or introduction into the wild
B Breeding in captivity or artificial propagation
L Law enforcement / judicial / forensic
Source of specimens
Code Description
W Specimens taken from the wild
R Ranched specimens: specimens of animals reared in a controlled environment, taken as eggs or juveniles from the wild, where they would otherwise have had a very low probability of surviving to adulthood
D Appendix-I animals bred in captivity for commercial purposes in operations included in the Secretariat's Register, in accordance with Resolution Conf. 12.10 (Rev. CoP15), and Appendix-I plants artificially propagated for commercial purposes, as well as parts and derivatives thereof, exported under the provisions of Article VII, paragraph 4, of the Convention
A Plants that are artificially propagated in accordance with Resolution Conf. 11.11 (Rev. CoP15), as well as parts and derivatives thereof, exported under the provisions of Article VII, paragraph 5 (specimens of species included in Appendix I that have been propagated artificially for non-commercial purposes and specimens of species included in Appendices II and III)
C Animals bred in captivity in accordance with Resolution Conf. 10.16 (Rev.), as well as parts and derivatives thereof, exported under the provisions of Article VII, paragraph 5
F Animals born in captivity (F1 or subsequent generations) that do not fulfil the definition of ‘bred in captivity’ in Resolution Conf. 10.16 (Rev.), as well as parts and derivatives thereof
U Source unknown (must be justified)
I Confiscated or seized specimens (may be used with another code)
O Pre-Convention specimens